economic history and economic theory - nordic journal of political
TRANSCRIPT

This article can be dowloaded from: http://www.nopecjournal.org/NOPEC_2008_a01.pdf Other articles from the Nordic Journal of Political Economy can be found at: http://www.nopecjournal.org
Nordic Journal of Political Economy
Volume 34 2008 Article 1
Innovation in Norway in a European Perspective
Fulvio Castellacci *
* Department of International Economics, Norwegian Institute of International Affairs (NUPI), POB 8159, Dep. 0033 Oslo, Norway. E-mail address: [email protected]

Innovation in Norway in a European Perspective 1
Fulvio Castellacci
Innovation in Norway in a European
Perspective1
Abstract
This paper investigates sectoral patterns of innovation in Norway in a European perspective. It puts forward a theoretical framework based on a new sectoral taxonomy that combines manufacturing and services within the same framework. It then analyses innovative activities in Norway and compare them to other European countries by making use of data from the Fourth Community Innovation Survey (CIS4). Finally, it studies the recent evolution and current characteristics of the industrial structure in Norway and points out its peculiarities vis-a-vis other European economies. The results of this work point to a contrasting pattern. On the one hand, Norwegian sectoral systems appear to be very innovative, often above the European average and, for some of the CIS4 indicators and some of the sectoral groups, they indeed emerge as the most innovative in Europe. On the other hand, these high-tech sectoral groups are relatively small in Norway, accounting for a much lower share of production than their European counterparts. The comparative analysis enables a reassessment of the so-called Norwegian paradox. The problem is not with innovative activities, as frequently asserted, but it has rather to do with the sectoral composition of the economy.
JEL classification: O30, O33, O57
1 The paper has been produced as part of the IPP-KUNI project funded by the Norwegian Research Council (2004-2007). A previous draft of the work was presented at the IPP Final Workshop in Oslo, March 2007, and at the Seminar Series in International Economics at NUPI, October 2007. I wish to thank Ådne Cappelen, Tommy Clausen, Ole Andreas Engen, Jan Fagerberg, Per Botolf Maurseth, David Mowery, Bart Verspagen and two referees of this Journal for helpful comments and suggestions. The usual disclaimers apply.

2 Fulvio Castellacci
1. Introduction
A common argument maintains that the Norwegian innovation system is a paradox or a
puzzle. The paradox argument highlights Norway‟s peculiar combination of low
innovation and high economic performance (e.g. Grønning et al., 2006; OECD, 2007).2
According to this view, the puzzling aspect is that innovation is commonly believed to be
one major factor explaining the economic performance of industrialized economies, and it
is therefore difficult to explain how Norway, a country with a relatively low level of
investments in innovative activities, can achieve the high income levels and economic
prosperity that it has experienced in recent years.
The crucial proposition upon which this argument is based is that innovation is low in
Norway. But is this really the case? How low is the level of innovative activities in Norway
compared to other industrialized countries? And how do the various industrial branches
of the Norwegian economy differ in terms of their ability to create advanced products,
processes and services? Motivated by these questions, the present paper intends to
reassess the Norwegian paradox by carrying out an analysis of sectoral patterns of
innovation in Norway in a European perspective.
The work is empirical in nature, and its main intention is to provide fresh
descriptive evidence and point out some major stylized facts on the recent evolution and
current state of the Norwegian industrial system. The paper has two distinctive features.
The first is that it focuses on sectoral analysis, and argues that such an industry-level
perspective can shed new light on the characteristics of manufacturing and service
innovation in Norway and achieve a more thorough assessment of the Norwegian puzzle.
The second is that the work analyses the Norwegian economy in a European perspective,
in the hope that such an explicit comparative perspective may lead to a balanced
reconsideration of this alleged paradox (Maurseth and Verspagen, 2002).
The paper is organized as follows. The second section introduces the literature on
sectoral patterns of innovation and the main concepts and terms that will be used
throughout the paper. The third section presents the theoretical framework that guides
the empirical analysis, which is based on a Schumpeterian taxonomic model of innovation,
growth and competitiveness. This framework proposes a stylized ideal model by using
which the Norwegian industrial system is analysed. The fourth and fifth sections analyse
sectoral patterns of innovation in Norway in the 2002-2004 period by presenting fresh
results from the Fourth Community Innovation Survey (CIS4)3, and compare sectoral
innovation in Norway with the corresponding patterns in a large sample of European
countries. The sixth section shifts the focus to the study of the industrial structure in
2 For a broader analysis of the Norwegian innovation system in historical perspective, see Fagerberg et al. (2008) and Wicken (2008). 3 For a brief presentation of data and indicators available in the Community Innovation Surveys (CIS), see Appendix 2.

Innovation in Norway in a European Perspective 3
Norway and the analysis of the major differences vis-a-vis other European economies.
Finally, the last section summarizes the main empirical results obtained by the paper and
discusses their policy implications.
2. The literature on sectoral patterns of innovation and industrial
dynamics
A common assumption and major proposition motivating the field of innovation studies
is that innovation matters for economic growth and competitiveness (Fagerberg et al.,
2005). The ability to create new technologies and to imitate foreign advanced technologies
is indeed a crucial factor to sustain the international competitiveness of industries and the
overall dynamics of a national system.
From a Norwegian perspective, this general proposition may however sound
somewhat reductive and lead to raise one major question. The Norwegian economy has in
recent decades grown rapidly, but its remarkable economic performance has arguably
more to do with the dynamics of resource-intensive industries, among which the energy
sector, than the development of high-technology branches. Indeed, it is difficult to argue
that technological innovation represents the main factor explaining the recent success
story of the Norwegian system. How is it possible, then, that an economy characterized by
a below-average level of R&D and innovation intensity has been able to achieve such a
good economic performance?
One common way to approach this question is to argue that the Norwegian
innovation system is a paradox, because of its peculiar combination of low innovation
intensity and rapid economic growth, which is hard to explain if we assume the existence
of a strong positive relationship between innovation and economic growth (e.g. Grønning
et al., 2006; OECD, 2007).4
This paper seeks to reassess the Norwegian paradox argument by using a different
theoretical perspective and empirical approach, and updated data sources. In particular,
we will question the commonly made statement that innovation is low in Norway, upon which
the paradox argument rests. Since we will focus on innovation patterns in Norway, before
our reassessment exercise can be carried out it is useful to start by briefly introducing
4 Both Grønning et al. (2006) and OECD (2007) derive such a statement based on an empirical analysis of different data sources. The former work makes use of data from the Third Community Innovation Survey (CIS3), whereas the latter analyses more traditional indicators such as R&D and patent statistics. The overall conclusion that innovation intensity is low in Norway, according to these papers, is based on the aggregate evidence for the whole industrial system, i.e. the average level of innovative activities in Norway as compared to other EU countries. The present paper differs from these previous studies in that it carries out a more disaggregated analysis that looks at sectoral patterns of innovation in different industrial branches rather than simply at the overall country averages.

4 Fulvio Castellacci
some key aspects of the innovation literature and by defining some of the main concepts
that will be used throughout the paper.
The theoretical perspective upon which a great part of the innovation-and-growth
literature is founded is rooted in the Schumpeterian approach. Joseph Schumpeter
provided important insights on the role of radical innovations and their pervasive effects
on the dynamics of the economic system (Schumpeter, 1934; 1939). Since the 1980s, his
original insights were refined and developed further by a strand of Schumpeterian scholars
(e.g. Freeman, Dosi, Pavitt, Nelson and Winter, among others), which basically shared
with Schumpeter the focus on the paradigmatic and sector-specific view of the process of
technological change and economic growth.5
The paradigmatic nature of technological change points to the importance of
technological paradigms to explain the growth and transformation of economic systems.
A technological paradigm is a set of interrelated and pervasive radical innovations, i.e. a
constellation of important technological innovations that are originally produced in a
given branch of the economy but may subsequently have pervasive effects on many other
sectors of the economic system for a prolonged period of time (Dosi, 1982; Freeman et al.,
1982).6
To illustrate, the „cracking‟ (the petrochemical technology to produce oil) and the
internal combustion engine represented two important radical innovations that found a
wide range of applications and had important economic effects in many industrial sectors
from the end of World War II onward. The technological paradigm that has been
dominant during the post-war decades is frequently refereed to by Schumpeterian scholars
as the Fordist paradigm, because of the contemporaneous importance of, e.g., technological
changes in the car industry, the fossil fuel energy source, and the related set of
organizational and institutional regularities sustaining the mass production system. More
recently, a set of interrelated radical innovations in the semiconductor, software and
telecommunications industries have opened up the way for the development of
information and communication technologies (so-called ICT paradigm), which now
constitutes, according to this perspective, the branch characterized by the highest and
most rapidly growing technological and economic opportunities (Freeman and Louça,
2001).
This paradigmatic perspective naturally leads to emphasize the sector-specific nature
of technological change, which is the second main pillar of this Schumpeterian view. Each
technological paradigm does in fact provide a distinct set of opportunities and constraints
5 For a survey of the Schumpeterian literature and a comparison with the mainstream and new growth theory approach, see Castellacci (2007). 6 A recent strand of modelling literature closer to the new growth theory tradition follows a similar approach and focuses on the role of general purpose technologies (GPTs) for inter-sectoral technology diffusion and economic growth (Bresnahan and Trajtenberg, 1995). The literatures on technological paradigms and GPTs, despite being rooted in distinct economic traditions, are however based on the same concept that is presented here and that traces back from Schumpeter‟s (1939) theory of long waves. We will therefore use the terms „technological paradigm‟ and „GPT‟ interchangeably throughout the paper.

Innovation in Norway in a European Perspective 5
for different industrial sectors. Industries that are closer to the core of a new technological
paradigm, i.e. because they produce or actively use the emerging GPTs, are likely to
experience higher technological opportunities and a more dynamic performance, whereas
sectors that are less directly related to it must still rely on previous technologies
characterized by lower technological (and economic) opportunities (Nelson and Winter,
1977; Dosi, 1988). The concept of technological trajectories aims at catching this idea. In any
given historical period, industries experience a distinct set of opportunities and constraints
and, for this reason, they adopt different innovative modes, strategies and are
characterized by well-distinct technological capabilities (or technological content). Sectoral
trajectories may therefore describe the industry-specific dynamics of the innovative
process followed by different industrial sectors for a prolonged period of time (e.g. several
decades), at least until a new technological paradigm will emerge leading to a radical
change in the distribution of technological opportunities across sectors.
A popular illustration of the sectoral trajectories metaphor is represented by
Pavitt‟s taxonomy (1984). This model, aimed at describing technological trajectories in the
post-war (or Fordist) period, pointed out the existence of a few major innovation modes
in different groups of sectors. Pavitt‟s taxonomy, in particular, provides a useful
illustration of sectoral differences in terms of technological capabilities (or content). Some
industries, because of the high technological opportunities they experience, are able to
devote a great amount of resources to R&D and innovative activities and therefore adopt
an active innovative strategy based on, e.g., the commercialisation of new products. By
contrast, sectors where opportunities are lower must necessarily rely upon a more
defensive technological strategy based on the introduction of new processes and the
acquisition of advanced knowledge (e.g. machineries and software) from other sectors
(hence the name supplier-dominated industries suggested by Pavitt).
This type of technology-based sectoral classifications (or taxonomies) have
attracted increasing attention in the innovation literature, because the focus on the sector-
specific nature of technological change makes it possible to point out the great variety of
sectoral patterns of innovation that characterizes different manufacturing and service
industries (Archibugi, 2001; Castellacci, 2008). This emphasis on sectoral heterogeneity
may be important not only within the context of innovation studies, but also for
economic growth research. The issue of cross-sectoral differences is in fact dealt with in a
rather simplified way in new growth theories, where industries are simply assumed to
differ according to the main function they assume in the economic system, i.e. what type of
goods they provide to other sectors (e.g. the R&D sector that produces blueprints and
new codified knowledge, the intermediate capital goods industry that produces
machineries and equipments, and the final goods sector). By drawing insights from the
two different perspectives, the theoretical model presented in the next section will try to
enrich the functional type of sectoral classification scheme provided by new growth
theory and combine it with the technological trajectories and sectoral taxonomies type of
studies that are popular in the innovation literature.

6 Fulvio Castellacci
The third relevant aspect of the Schumpeterian perspective is the focus on the
importance of structural change, i.e. the process of industrial transformation according to
which, in any given historical era, some industrial sectors tend to increase their share of
resources in the economic system over time, whereas others progressively shrink and
become less important drivers of the overall dynamics of a national system. Since the
Schumpeterian view mostly focuses on technological aspects (and neglects other possible
sources of structural change such as, e.g., changing consumption patterns), the process of
industrial transformation is explained in terms of the paradigmatic and sector-specific
nature of technological activities presented above. Simply put, the emergence and
diffusion of technological paradigms determine the distribution of technological
opportunities across sectors in any given historical age, and this distribution explains why
some industries expand whereas others decline over time.
In particular, the ICT-based technological paradigm that characterizes the present
age is closely related to the rise of a bunch of high-tech and knowledge-intensive service
sectors such as, among others, software, telecommunications and consultancy services.
These industries are currently characterized by a rapid pace of technological and
organizational changes that are closely related to (and fostered by) the active production
of new ICT-related services. The increasing importance of the service sectors and the
great technological dynamism that many of them have shown in recent years have of
course attracted the attention of innovation scholars, and the service innovation literature
now constitutes an emerging and important research strand in this field (Miozzo and
Soete, 2001).
One central claim in this recent literature is that there exist strong linkages and
knowledge flows between services and manufacturing industries, and that these close and
increasingly important ties call for a unified perspective combining the study of
innovation in manufacturing and in service industries (Gallouj and Weinstein, 1997). Thus,
instead of looking at manufacturing and services as two distinct and separate branches of
the economic system (as the innovation literature typically does), the theoretical model
presented in the next section will propose a sectoral taxonomy that combines them
together in a unified framework.

Innovation in Norway in a European Perspective 7
3. The theoretical framework: a new taxonomy of sectoral patterns
of innovation
Our theoretical model is based on a new taxonomy of sectoral patterns of innovation that
combines manufacturing and service industries in a single framework.7 The new taxonomy
builds upon and combines elements of sectoral classifications previously pointed out in
the economics and innovation studies literatures. Figure 1 presents a stylized
representation of this taxonomic model.
The typology is constructed by dividing industrial sectors along two main
dimensions. Drawing on the endogenous growth literature, the first dimension highlights
the function that each industry takes in the economic system as provider and/or recipient
of goods and services, i.e. its position in the vertical chain (e.g. Romer, 1990; Grossman
and Helpman, 1991). Industries that provide final (intermediate) goods and services to
other sectors are therefore positioned at a higher (lower) level on the Y-axis in the
diagram in figure 1.
The second dimension represents, in analogy with previous taxonomic exercises in
the innovation literature, the technological content of an industry, i.e. the overall level of
technological capabilities of innovative firms in the sectoral system (see previous section).
This second dimension is thus defined by the technological trajectories that characterize
sectoral systems, and the extent to which industrial sectors are able to create new
technologies internally or rather rely on the external acquisition of machinery, equipment
and knowledge from their suppliers. Technologically advanced sectors, which are able to
develop new technologies internally are positioned on the right-hand side of the X-axis in
figure 1, whereas industries that mostly acquire advanced knowledge from other sectors
rather than creating them internally are positioned on the left-hand side of the X-axis.
None of these dimensions is new and, as described in the previous section, they
actually represent well-established pillars in the economic growth and innovation
literatures respectively. What is new in this taxonomic exercise is the combination of the
two dimensions together. The typology is in fact built up by making use of these
dimensions in a two-step conceptual exercise.8 First, sectors are divided according to the
main function they take in the economic system (Y-axis). This leads to the identification
of four major sectoral groups. Secondly, each of these four blocks is subsequently divided into
two distinct sub-groups on the basis of the technological content that characterizes them
7 For a more extensive presentation and discussion of the theoretical model underlying this taxonomy, see Castellacci (2008). For an empirical analysis that investigates sectoral innovation and industrial dynamics in Norway by making use of firm-level data, see Castellacci et al. (2008). 8 The exercise is conceptual in the sense that the identification of the various sectoral groups presented in this section is based on our Schumpeterian theoretical model (and related assumptions) and not on the empirical analysis or measurement of the patterns that are effectively taken by these two dimensions. Appendix 1 presents however a list of industries (standard industrial classification, 2-digit level) that belong to each sectoral group of the taxonomy, and that will be used in the empirical analysis of the Norwegian case in the next sections of the paper.

8 Fulvio Castellacci
(X-axis). By using these two layers of analysis, the taxonomy does not only point out the
function of each sector as provider and/or recipient of goods, services and knowledge to
other industries, but it also acknowledges the presence of a great deal of heterogeneity
within each industrial block, in line with previous related exercises in the innovation
literature (Pavitt, 1984; Miozzo and Soete, 2001). On the whole, the manufacturing and
business services branches of the economy are thus represented as a system of vertically
integrated sectoral groups.
Advanced knowledge providers (AKP) are characterized by a great technological
capability and a significant ability to manage and create complex technological knowledge.
Two sub-groups of industries belong to this category: (1) within the manufacturing branch,
specialised suppliers of machineries, equipments and precision instruments; (2) within
services, providers of specialised knowledge and technical solutions such as software,
R&D, engineering and consultancy, so-called knowledge intensive business services. What
these industries have in common is that, in addition to being characterized by a high level
of technological capability, they perform the same function in the innovation system as
providers of advanced technological knowledge to other industrial sectors. They represent
the supporting knowledge base upon which innovative activities in all other sectors are built,
and they continuously upgrade and renew it. Firms in these industries are typically small,
and tend to develop their technological activities in close cooperation with their clients
and with the users of the new products and services they create. In the Fordist paradigm,
the typical example of this kind of user-producer interactions was Pavitt‟s (1984)
illustration of the close ties between specialised suppliers and car producers in the
automotive industry. In more recent times, the greater technological specialization and
deeper division of labour have increased the demand for complex innovative capabilities
and, consequently, have led to the emergence and rapid growth of knowledge intensive
business services, which now play the important role of providers of specialised
knowledge and technical solutions for the other advanced branches of the economic
system.
Supporting infrastructural services (SIS) may be located, similarly to the previous
category, at an early stage of the vertical chain, since they mostly produce intermediate
products and services rather than items for personal consumption. However, they differ
from advanced knowledge providers in terms of their technological capability, and
particularly in terms of their more limited ability to internally develop new knowledge.
Their innovative trajectory is in fact typically based on the acquisition of machineries,
equipments and other types of advanced technological knowledge created elsewhere in the
economic system. To be more precise, two sub-groups of sectors can be distinguished
here, each characterized by a different level of technological sophistication (Miozzo and
Soete, 2001): (1) providers of distributive and physical infrastructure services (e.g.
transport and wholesale trade); (2) providers of network infrastructure services (such as

Innovation in Norway in a European Perspective 9
finance and telecommunications). Firms in the latter group typically make heavy use of
ICTs developed by other advanced sectors in order to increase the efficiency of the
productive process and the quality of their services, whereas the former group of
industries has a significantly smaller capability in this respect. Regardless of these
differences, what these sectoral groups have in common is the function they assume in the
economic system, namely they represent the supporting infrastructure upon which business
and innovative activities carried out by firms in the whole economy are based. The more
advanced this infrastructure is, the easier the process of intersectoral knowledge diffusion
within the domestic economy, and the more efficient and productive the national system
will be.
Sectors producing mass production goods (MPG) constitute a key part of the
manufacturing branch. They may be located at an intermediate stage of the vertical chain,
since they produce both final goods and intermediate products that are used in other
stages of the production process. In terms of their technological content, they are
characterized by a great capability to internally develop new products and processes.
However, two distinct sub-groups may be distinguished (Pavitt, 1984): (1) scale-intensive
industries (e.g. motor vehicles and other transport equipments) frequently have their own
in-house R&D facilities, and their innovative activities also develop in close cooperation
with the specialised suppliers of precision instruments and machineries; (2) science-based
sectors (such as electronics) are characterized by a great ability to internally create new
technological knowledge, and their innovation process is close to the scientific advances
continuously achieved by Universities and other public research institutes. Different as
they may be, these sectoral groups have a great deal of common characteristics. Firms are
typically large, and their profitability depends to a great extent on the exploitation of scale
economies that the mass production of standardized goods makes it possible to obtain.
Further, they all assume a central position in the knowledge chain, because they receive
technological inputs from advanced knowledge providers and, in turn, they provide
technological outputs (new products) that are used by infrastructural services as well as by
producers of final goods. They are, in a nutshell, the carrier industries of a new technological
paradigm (Freeman and Louça, 2001). By producing technologically advanced products
on a large scale, by fostering the efficiency and quality of the production process of
infrastructural and final goods and services, and by increasing the demand for specialised
solutions from advanced knowledge providers, this group of industrial sectors thus plays a
pivotal role in the economic system.
The fourth sectoral block is represented by the producers of personal goods and
services (PGS). Located at the final stage of the vertical chain, these manufacturing and
service industries are characterized by a lower technological content and a more limited
ability to develop internally new products and processes. Their dominant innovation
strategy is in fact typically based on the acquisition of machineries, equipments and other

10 Fulvio Castellacci
types of external knowledge produced by their suppliers, while they commonly lack the
capability and resources to organize and maintain their own R&D labs. This explains the
term supplier-dominated industries that is frequently adopted in the innovation literature –
and that describes well both sub-groups of industries included in this category: (1) the
producers of personal goods and (2) the providers of personal services (Pavitt, 1984;
Miozzo and Soete, 2001). Firms in these manufacturing and service branches, typically
small enterprises, are thus mostly recipients of advanced knowledge and, to the extent that
they are able to implement new technologies created elsewhere in the economy, they may
use them to increase the efficiency of the production process as well as to improve the
quality of the final goods and services they commercialize. This type of strategy may lead
to lengthen the industry-life cycle of these mature industrial sectors and recreate new
technological opportunities (Von Tunzelmann and Acha, 2005).
In a nutshell, this sectoral typology presents a stylized view of some of the main
vertical linkages among manufacturing and business services within a national system of
innovation. It is important to acknowledge that, in addition to those considered here,
there are other sectoral branches of the economy that may possibly be important in terms
of the linkages they develop with manufacturing and business services. For instance, the
existence of a set of well-developed resource-intensive industries (e.g. oil and gas) or
agricultural activities may have important effects for the set of linkages and knowledge
flows in the industrial system. These branches are particularly important in the Norwegian
case, but they are much less relevant for most other European countries. For this reason,
since this paper seeks to compare Norway to other EU economies, the sectoral taxonomy
that has been adopted here only focuses on manufacturing and service industries, and
neglects other sectoral branches. A second reason is of course that the innovation
literature has so far almost exclusively focused on manufacturing and business services
because of their greater relevance in terms of technological activities. There is little prior
knowledge, both in the theoretical and empirical literature, regarding the process of
innovation and technology diffusion in resource-intensive industries and the primary
branch of the economy (Von Tunzelmann and Acha, 2005). For these reasons, our
taxonomy does not consider these sectors further, and focuses instead on the secondary
and tertiary branches of the economic system.
One relevant aspect of this Schumpeterian taxonomic model is the explanation it
provides of the mechanisms driving growth and structural change in national systems of
innovation. When a new general-purpose technology emerges and diffuses throughout the
economy, industrial sectors greatly differ in terms of the technological opportunities,
capabilities and constraints they face. High-opportunity technological regimes are those
that are in a better position to exploit the advantages of the new general-purpose
technologies, and have a greater growth potential. Some of these industries belong to our
mass production goods sectoral group and, by demanding new infrastructural services as well
as advanced specialised knowledge and technical solutions to their suppliers, they transmit
part of this growth potential to some of the other industrial groups. To illustrate, during

Innovation in Norway in a European Perspective 11
the Fordist paradigm the typical high-opportunity mass production sectors were, say,
chemical, plastics and the car industries (Freeman et al., 1982). In order to follow their
dynamic trajectories, these branches fostered the growth of specialised suppliers (e.g.
producers of precision instruments) and of infrastructural services (in particular physical
infrastructural services such as transport). It was the set of mutual interactions between
these vertically integrated branches of the economy that sustained the dynamics of
national systems in many advanced countries in the post-war era.
In a more recent period, due to the emergence and rapid diffusion of the ICT-
based paradigm, greater technological opportunities can instead be found in other sectors.
Electronics, hardware producers and pharmaceuticals may be considered as the high-
opportunity mass production manufacturers of the present age. In their dynamic
trajectory, these sectors have however also sustained the rise of advanced knowledge
providers (such as software and technical consultancy) and of network infrastructure
services (e.g. telecommunications). It is the exchange of advanced knowledge, goods and
services among these high-opportunity manufacturing and service sectors that accounts
for the bulk of the growth potential of the current era.
In short, the specific key industries differ in any given historical age, but the overall
causation mechanism that drives the dynamics of the system is, by and large, the same. A
new set of general-purpose technologies need, at the same time, to be produced on a large
scale, to be supported by an efficient infrastructure and to be sustained by the provision
of an advanced knowledge base. Our four-group typology provides a comprehensive and
general framework that accounts for the dynamics of a national system within each
paradigmatic phase, as well as for the transformations occurring when a regime shift
changes the locus of technological opportunities and of the related growth potential.
This theoretical view has one important implication for the competitiveness of
national systems. Given the existence of a web of vertical linkages among industries, a
specialization pattern in advanced manufacturing industries fosters the development of
new services, and the latter does in turn enhance the growth of the former. The key
mechanism of competitiveness of a national system is thus related to the ability of a
country to undertake a process of structural change from traditional to GPT-related high-
opportunity manufacturing and service industries. Since high technological opportunities
eventually lead to economic growth, countries that are specialized (or rapidly shift towards)
these rising industrial sectors are expected to experience a better economic performance
than economies focused on lower opportunities industries. The policy implication of this
perspective would thus be to emphasize the creation of new competitive advantages in the
most progressive industries of each sectoral group, instead of relying on the existing set of
comparative advantages, which will eventually turn out to be obsolete when a new set of
general-purpose technologies will change the locus of the growth potential.


Innovation in Norway in a European Perspective 13
4. Technological opportunities across countries in Europe
The taxonomic model presented in the previous section provides a stylized representation
of the process of growth and structural change, and argues that countries should make an
active effort to invest in the new GPT-related industrial groups. Countries do however
significantly differ in their ability to adapt to the new technological paradigm. What is the
extent of these differences in Europe, and how does Norway compare to other European
countries? This section and the following consider this question, and present the results of
the Fourth Community Innovation Survey (CIS4), which make it possible to analyse in greater
details various relevant characteristics of the innovative activities carried out in Norwegian
industrial sectors in the period 2002-2004, and to compare them with the corresponding
trends in the rest of the European economy (for a brief presentation of data and
indicators available in the Community Innovation Surveys, see Appendix 2).
This section analyses the extent of cross-country differences in terms of
technological opportunities, which is, as previously pointed out, one crucial aspect of the
process of innovation and paradigmatic change. Technological opportunities are measured
by the variable OPPORT, defined as the total innovation expenditures of industrial
sectors (expressed as a share of their total turnover). This indicator is more general than
the commonly used variable of R&D intensity, because it does not simply consider R&D
expenditures but also other types of innovative investments (e.g. acquisition of machinery,
equipments, software, etc.). It is therefore an appropriate indicator for measuring the
innovative intensity of a large variety of industrial sectors, including also low-tech
manufacturing and service industries, which typically do not spend much in R&D but
frequently carry out other types of innovative activities.
Table 1 shows our CIS4 indicator of technological opportunities for the various
sectoral groups of the taxonomy and for a sample of 17 European countries. The table
suggests that, for each sectoral group, countries largely differ in terms of their innovative
intensity. In particular, if we look at Norway and compare it to the EU average, we see
that Norwegian high-tech sectoral groups appear as much more innovative than their
European counterparts, and indeed among the most innovative in Europe. This is
particularly the case for the groups of advanced knowledge providers manufacturing
(6.7% versus 5.4%), advanced knowledge providers services (30.4% against 19.2%),
science-based manufacturing (7.8% vis-a-vis 5.3%) and network infrastructure services
(3.2% versus 2.6%). On the other hand, the lower-opportunities sectoral blocks of the
taxonomy (scale intensive manufacturing, physical infrastructure services, and personal
goods and services) are on average less innovative than their European counterparts. Such
a pattern contrasts sharply with the commonly made argument that Norway, because of
its specialization in traditional and resource-based industries, is a good example of
innovation in low-tech industries – the CIS4 evidence presented here does not support this
common argument.

14 Fulvio Castellacci
Table 1: Technological opportunities (OPPORT) for the various categories of the new sectoral taxonomy in European countries – Source: CIS4 data (2002-2004)
A
dva
nced
kn
ow
led
ge
pro
vid
ers
- M
an
ufa
ctu
rin
g
Ad
van
ced
kn
ow
led
ge
pro
vid
ers
- S
erv
ices
-
Mass
pro
du
cti
on
go
od
s
- S
cie
nce-b
ase
d -
Mass
pro
du
cti
on
go
od
s
- S
cale
in
ten
sive -
Su
pp
ort
ing
in
frast
ructu
re
serv
ices – N
etw
ork
Su
pp
ort
ing
in
frast
ructu
re
serv
ices – P
hysi
cal
Pers
on
al
go
od
s
Pers
on
al
serv
ices
Bulgaria
1.98
15.88
2.95
5.54
2.36
2.61
4.56
-
Czech Republic 6.75 18.55 3.01 4.16 4.55 1.40 2.79 1.44 Estonia 2.11 7.61 3.93 3.64 1.42 1.79 5.27 - France 5.79 28.65 5.68 4.79 2.74 1.60 2.81 0.89
Germany 7.19 7.09 7.95 5.56 1.27 2.62 2.74 - Greece 8.76 8.17 8.28 8.56 3.74 3.44 11.24 -
Hungary 2.54 16.01 4.88 3.78 1.33 2.11 3.83 - Italy 6.14 34.13 6.54 4.17 1.51 1.78 3.65 0.89
Lithuania 2.32 10.74 2.64 4.22 1.19 8.24 6.04 0.17 Netherlands 5.75 1.89 7.43 2.86 0.61 0.74 2.16 -
Norway 6.70 30.37 7.80 3.22 3.17 0.65 3.32 - Poland 4.83 47.70 2.99 3.43 3.12 2.16 4.32 -
Portugal 5.23 9.15 2.46 1.88 2.68 7.43 4.03 0.56 Romania 3.74 17.59 2.84 4.54 4.68 3.29 5.93 - Slovakia 4.57 12.16 2.90 4.88 5.35 2.32 8.22 -
Spain 4.24 41.26 3.37 3.45 0.89 1.69 2.82 0.54 Sweden 9.60 20.23 7.45 3.51 4.62 1.81 2.03 -
EU average
5.37
19.24
5.28
4.15
2.66
2.69
4.27
0.67
The extent of these large cross-country differences in Europe is represented in figure 2,
which reports a series of boxplot graphs that show the distribution of technological
opportunities across countries in Europe for each sectoral category of the taxonomy. The
boxplots indicate that, for each of the four sectoral blocks, the cross-country variability is
larger for the higher-opportunity groups, i.e. those whose productive activities are closer
to the production and use of the new GPTs – namely science-based manufacturing,
advanced knowledge providers services, and network infrastructure services. The
interpretation of this pattern is straightforward – countries differ, first and foremost, in
their ability to innovate and invest in the new GPT-related sectors, whereas the cross-

Innovation in Norway in a European Perspective 15
country variability of innovative efforts for sectors related to previous technological
paradigms is much more limited.
Figure 2: The cross-country distribution of technological opportunities – Boxplots for the various sectoral groups of the taxonomy
24
68
10
12
Technolo
gic
al opport
unitie
s (
%)
Mass production manufacturing
SB SI
0
10
20
30
40
50
Technolo
gic
al opport
unitie
s (
%)
Advanced knowledge providers
AKP_S AKP_M
02
46
8
Technolo
gic
al opport
unitie
s (
%)
Supporting infrastructure services
SIS_N SIS_P
05
10
Technolo
gic
al opport
unitie
s (
%)
Personal goods and services
PGS_M PGS_S
Legend. For a definition of the technological opportunity indicator, see Appendix 2. SB: mass production goods – science-based manufacturing SI: mass production goods – scale intensive manufacturing AKP-M: advanced knowledge providers – specialised suppliers manufacturing AKP-S: advanced knowledge providers – knowledge intensive business services SIS-N: supporting infrastructure services – network infrastructure SIS-P: supporting infrastructure services – physical infrastructure PGS-M: personal goods and services – supplier-dominated manufacturing PGS-S: personal goods and services – supplier-dominated services

16 Fulvio Castellacci
Let us therefore focus on these high-opportunity sectoral groups, and investigate how
European countries are adapting to the emergence and diffusion of the new GPTs and, in
particular, how Norway compares to other EU economies. Figure 3 presents the kernel
density estimates for these sectoral groups, which show the cross-country distribution of
technological opportunities and plot them vis-a-vis a standard normal density (the latter is
represented by the dotted curve in figure 3). For each of the three sectoral groups (i.e.
each of the three panels in figure 3), the kernel density curve shows an estimate of the
density function of the technological opportunity variable (which is reported on the X-
axis in standardized form). The kernel graphs indicate a similar pattern for the three
groups of sectors. Most European countries in the sample are concentrated on the left-
hand part of the distribution, characterized by a below-average level of technological
opportunities, while a restricted group of countries score well above the average, i.e. those
around the right-hand tail of the distribution (the twin-peaked shape of the technological
opportunity distribution is particularly evident for the group of network infrastructure
services, see the third panel of the figure). In other words, figure 3 suggests that different
groups of European countries do indeed differ in terms of their innovative intensity and
their ability to invest in the high-opportunity sectors of the present age.
Figure 3: The cross-country distribution of technological opportunities – Kernel density estimates for the high-opportunity sectoral groups of the taxonomy
0.1
.2.3
.4
Den
sity
-2 -1 0 1 2 3SB
Kernel density estimate
Normal density
Mass production manufacturing- Science based
Innovation in Norway in a European Perspective 17
0.1
.2.3
.4
Den
sity
-2 -1 0 1 2 3AKP_S
Kernel density estimate
Normal density
Advanced knowledge providers - Services
0.1
.2.3
.4
Den
sity
-2 -1 0 1 2SIS_N
Kernel density estimate
Normal density
Supporting infrastructure services - Network
Where does Norway stand in comparison to other European countries? In order to
analyse more thoroughly the grouped-structure of the data and point out the relative
position of the Norwegian economy, we have carried out a cluster analysis, whose
purpose is precisely to identify clusters of countries characterized by different levels of the
technological opportunity variable. The cluster analysis has made use of a so-called
hierarchical algorithm, which initially treats all cases (countries) as separate clusters and
progressively aggregate them together on the basis of their similarity on the OPPORT
indicator (which is the input variable in the cluster analysis).
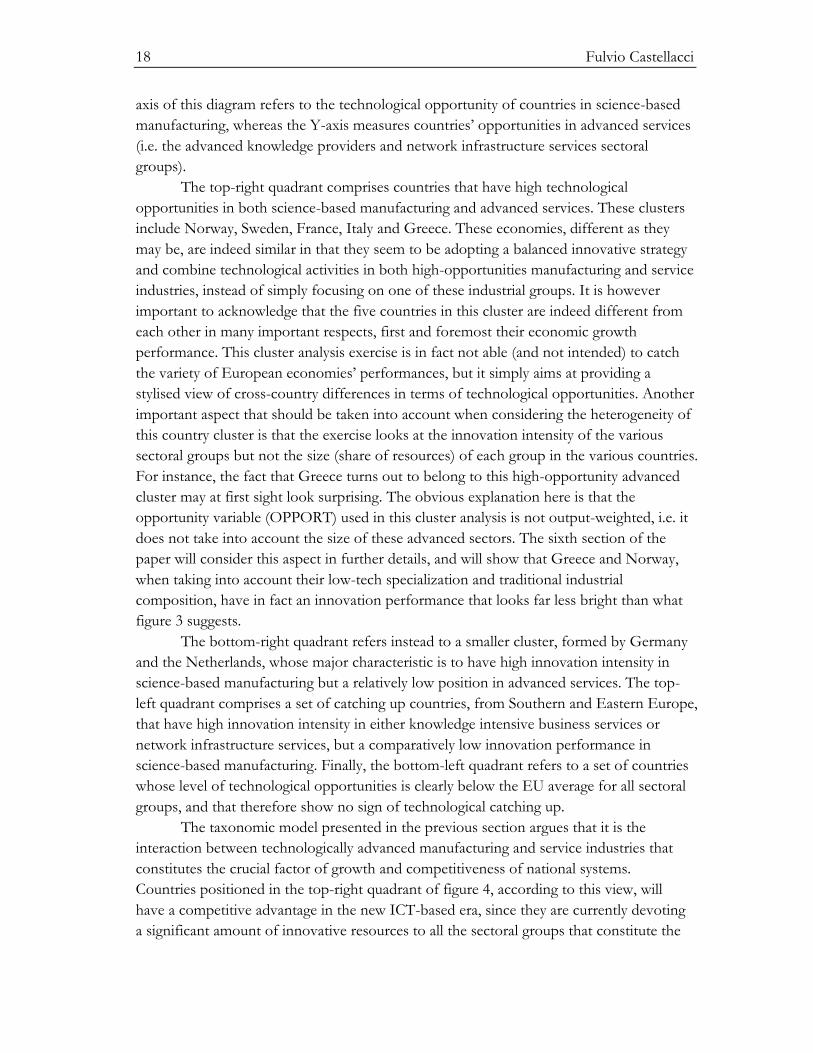
Figure 4 shows the results of the hierarchical cluster analysis. The upper panel of
the figure reports the dendogram, which shows all the steps of the iteration procedure,
where similar countries are progressively grouped together to form different clusters. The
lower panel of the figure presents a more simplified and more synthetic view of these
empirical results by representing the various resulting clusters in a two-way graph. The X-

18 Fulvio Castellacci
axis of this diagram refers to the technological opportunity of countries in science-based
manufacturing, whereas the Y-axis measures countries‟ opportunities in advanced services
(i.e. the advanced knowledge providers and network infrastructure services sectoral
groups).
The top-right quadrant comprises countries that have high technological
opportunities in both science-based manufacturing and advanced services. These clusters
include Norway, Sweden, France, Italy and Greece. These economies, different as they
may be, are indeed similar in that they seem to be adopting a balanced innovative strategy
and combine technological activities in both high-opportunities manufacturing and service
industries, instead of simply focusing on one of these industrial groups. It is however
important to acknowledge that the five countries in this cluster are indeed different from
each other in many important respects, first and foremost their economic growth
performance. This cluster analysis exercise is in fact not able (and not intended) to catch
the variety of European economies‟ performances, but it simply aims at providing a
stylised view of cross-country differences in terms of technological opportunities. Another
important aspect that should be taken into account when considering the heterogeneity of
this country cluster is that the exercise looks at the innovation intensity of the various
sectoral groups but not the size (share of resources) of each group in the various countries.
For instance, the fact that Greece turns out to belong to this high-opportunity advanced
cluster may at first sight look surprising. The obvious explanation here is that the
opportunity variable (OPPORT) used in this cluster analysis is not output-weighted, i.e. it
does not take into account the size of these advanced sectors. The sixth section of the
paper will consider this aspect in further details, and will show that Greece and Norway,
when taking into account their low-tech specialization and traditional industrial
composition, have in fact an innovation performance that looks far less bright than what
figure 3 suggests.
The bottom-right quadrant refers instead to a smaller cluster, formed by Germany
and the Netherlands, whose major characteristic is to have high innovation intensity in
science-based manufacturing but a relatively low position in advanced services. The top-
left quadrant comprises a set of catching up countries, from Southern and Eastern Europe,
that have high innovation intensity in either knowledge intensive business services or
network infrastructure services, but a comparatively low innovation performance in
science-based manufacturing. Finally, the bottom-left quadrant refers to a set of countries
whose level of technological opportunities is clearly below the EU average for all sectoral
groups, and that therefore show no sign of technological catching up.
The taxonomic model presented in the previous section argues that it is the
interaction between technologically advanced manufacturing and service industries that
constitutes the crucial factor of growth and competitiveness of national systems.
Countries positioned in the top-right quadrant of figure 4, according to this view, will
have a competitive advantage in the new ICT-based era, since they are currently devoting
a significant amount of innovative resources to all the sectoral groups that constitute the
Innovation in Norway in a European Perspective 19
bulk of the growth potential in the current age, instead of focusing on just one of them.
Among these countries, Norway emerges as one of the economies with the highest level
of innovative intensity in all the high-opportunity sectoral groups.
Figure 4: Results of cluster analysis – Dendogram from hierarchical cluster analysis (upper panel), and a stylised representation of the resulting clusters (lower panel)
01
23
4
Dis
sim
ilari
ty m
ea
su
re
BG PT EE LT HU CZ RO SK FR NO IT GR SE DE NL PL ES
Average linkage method - Absolute value distance
Advanced services
Science-based manufacturing
High opportunities in
manufacturing and services
Cluster 1: FR, NO, IT
Cluster 2: GR, SE
Science-based opportunities
Cluster 3: DE, NL
Service-based catching up
Cluster 4: PL, ES
Cluster 5: CZ, RO, SK
No technological catching up
Cluster 6: BG, PT, EE,
LT, HU

20 Fulvio Castellacci
5. Sectoral patterns of innovation: Norway in a European
perspective
Technological opportunities certainly represent one crucial aspect of the technological
activities of industrial sectors. However, innovation is a multifaceted phenomenon, and it
is therefore important to broaden up the scope of our cross-country analysis by looking at
a set of other dimensions of innovative activities. Tables 2 to 7 present other descriptive
results of the CIS4 Survey, comparing Norway to the EU average for a large set of
indicators that take into account different relevant aspects of the innovative process (for a
definition of the indicators, see Appendix 2). Each indicator is reported for the various
sectoral groups of the taxonomic model presented in the third section, so that it is
possible to analyse the innovative patterns in different branches of the Norwegian
economy in a European perspective.
Table 2 looks at the efforts and expenditures in innovative activities. It considers three
indicators. One of them measures the cumulativeness conditions of different sectoral
groups (CUMUL), i.e. the share of innovative firms that are continuously engaged in R&D
activities. The other two represent synthetic measures of the dominant innovation strategy
adopted by firms in different sectors. These are the R&D expenditures as a share of total
innovation costs9 (so-called disembodied innovation strategy, DISEMB) and the percentage of
innovative firms engaged in training activities directly linked to the introduction of
technological change (TRAIN).
The first two indicators show that Norwegian sectors invest on average a greater
amount of resources in innovative expenditures than their European counterparts. This is
particularly the case for the sectoral groups that our neo-Schumpeterian taxonomy has
pointed out as the most progressive industries of the ICT-based age, namely advanced
knowledge providers (particularly knowledge intensive business services), science-based
mass production manufacturers and network infrastructure services. The strong
propensity to invest in R&D activities, instead of adopting other types of embodied
technological change, is indicated by the variable DISEMB, according to which nearly all
sectoral groups in Norway score much above the EU average, as well as significantly
above other advanced countries such as Sweden and Denmark.
The third variable, TRAIN, suggests instead a different pattern, where Norwegian
industries always perform well below the EU average. Considering that training activities
directly linked to the introduction of technological change are more frequently undertaken
by large firms than by SMEs, a possible explanation of this pattern may simply be that
Norway has on average a larger number of small and medium enterprises than other
advanced European countries (Grønning et al., 2006; OECD, 2007).
9 Total innovation costs include, in addition to R&D expenditures, also investments for the acquisition of machinery and equipment, for the purchase of software and other types of external knowledge, and for training and marketing activities.

Innovation in Norway in a European Perspective 21
Table 3 focuses on the sectoral patterns of interactions in the innovative process, i.e.
the ability of firms to take advantage of external sources of opportunities by interacting
and cooperating with other actors in the sectoral system of innovation. Three commonly
used CIS indicators measure the interactions of innovative firms with their suppliers, the
users and the public science system respectively. The variable SUPPLIERS show that
most Norwegian industries are commonly characterized by a below-average intensity of
producers-suppliers interactions, with the exception of infrastructural services, which
score slightly above the European mean. The intensity of user-producer interactions is
instead strong for all sectoral groups, much above the EU average and well above the
other Nordic countries (particularly for the most technologically advanced groups). The
variable SCIENCE indicates that the propensity of innovative firms to collaborate with
the public science system is particularly strong (and much above other European countries)
for knowledge intensive business services and for science-based manufacturing industries.
In a nutshell, the main pattern emerging from table 3 is that the most
technologically advanced groups, the key ICT-related industries in our taxonomic model,
are those that are better connected to their users and to the University system, whereas
more traditional and low-tech sectors appear to be more closely linked to their suppliers –
which is precisely the ideal pattern that a Pavitt-like model would suggest (Pavitt, 1984).
Table 4 shifts the focus to the internationalization strategies, i.e. the ability of
Norwegian firms to exploit the opportunities provided by the increasing globalisation of
technological activities (Archibugi and Michie, 1995; Carlsson, 2006). This is a particularly
relevant aspect to consider, since Norway is a small open economy and it is thus extremely
important for Norwegian firms to exploit foreign markets and take advantage of
international cooperation in order to overcome the lack of a large domestic market. CIS4
data provide some limited information on this aspect. The first variable (COOP-OTHER)
measures the share of innovative firms that have cooperated with enterprises in countries
outside of the EU, and it thus refers to an important channel for the globalisation of
innovative activities (Archibugi and Iammarino, 2003).10 The second indicator (SELL-
OTHER) refers to a more traditional form of internationalization, namely the ability of
firms to sell their products and services in international markets (i.e. to countries outside
of Europe).
CIS4 data suggest that Norwegian firms have a higher propensity to collaborate
internationally than their European counterparts, and this pattern is particularly evident
for the most technologically advanced sectoral groups. Regarding the export propensity,
Norway scores well above the European average for advanced service industries, such as
10 According to Archibugi and Iammarino (2003), evidence suggests that this channel of the globalisation of innovation is progressively becoming more important over time. In addition to the variable used here, the CIS4 dataset also contains an indicator that measures intra-EU technological collaborations. We have not used this variable in our analysis because it appears to be much less effective in identifying cross-country differences, in the sense that most European countries, including Norway, score close to the EU average in terms of this indicator.

22 Fulvio Castellacci
knowledge intensive business services and network infrastructure service providers –
confirming the greater scope for internationalization that this type of activities has
recently experienced (Hoeckman and Primo Braga, 1997; Miozzo and Soete, 2001).
Table 5 looks at the policy support to innovative activities, and makes use of three
variables. The first (FUND) measures the share of innovative firms that have received
public support for their technological activities in the period 2002-2004. The indicator
shows a remarkable pattern: in nearly all sectoral groups (with the exception of
infrastructural services), a large percentage of Norwegian firms (between 45 and 65%)
have benefited from public support schemes. This share is strikingly higher than in the
corresponding sectoral groups in other EU countries, and if we rank European economies
after this indicator, Norway is number 1 in the list.
The other two variables measure the origin of this public support, i.e. the extent to
which it is part of national schemes of the Norwegian government (FUND-NAT) or
related to the EU policy framework (FUND-EU). These variables show quite evidently
that the bulk of the innovation policy support comes from the Norwegian central
government, which appears to play a much more active role than what done by national
authorities in other European countries (all Norwegian sectoral groups score in fact much
above the EU mean, and most of them are ranked first in the country list). By contrast,
Norwegian firms have been supported much less by EU sources.
The pattern emerging from table 5 is on the whole quite strong, and points to the
important role that public policies have played for the support of private innovative
activities in recent years in Norway. However, this also raises the question of the
effectiveness of this strong public support, which, according to some, may hamper the
efficiency of private innovative activities (David et al., 2000; OECD, 2007).11 While this
aspect has recently been analysed in more details by Clausen (2008), some preliminary
evidence on this question can also be obtained by simply looking at the performance of
innovation in Norwegian sectoral systems. If the technological performance is positive
and above the EU average, we would get at least a rough indication of the fact that
innovation policies constitute one of the important ingredients in this successful story (it
would indeed be difficult to argue otherwise). This is the aspect that tables 6 and 7 look at.
Table 6 focuses on the technological performance of Norwegian sectoral systems
in terms of the innovativeness of different industrial sectors, which is measured by the
number of firms that have introduced at least one technological innovation (INNOV), an
organisational innovation (ORGAN) or a marketing innovation (MARKET) in the period.
In terms of the first variable, only knowledge intensive business services and science-
based manufacturing industries show an above-average performance. The innovativeness
of Norwegian firms in a European perspective is more evident in relation to the indicator
measuring marketing innovations, where the advanced knowledge providers and the
11
See also Cappelen et al. (2007), which present an empirical study analysing the effects of the R&D tax
credit scheme recently introduced by the Norwegian government (SkatteFUNN).

Innovation in Norway in a European Perspective 23
science-based groups score much above the European average and are ranked as number
1 in this particular European contest.
By contrast, organisational innovation does not seem to be an aspect where
Norwegian firms do particularly well, and most of the sectoral groups actually perform
worse than their European counterparts. One possible factor explaining this could be that,
as mentioned above, the market structure in Norway is characterized by a relatively larger
number of SMEs than in other countries (Grønning et al., 2006; OECD, 2007), whereas
organisational innovations are more frequently introduced by large firms, since these need
to manage, organize and rationalise a greater amount of human resources. The lower
average size of Norwegian firms could therefore be one possible factor explaining the low
performance of the ORGAN variable.
Table 7 reports two different indicators of technological performance. One refers to the
patenting activity of firms (PATENT), while the other measures the turnover from the
commercialization of new products as a share of the total turnover of firms (TURNEW).
Both variables indicate that the technological performance of Norwegian industrial sectors
is positive, and for nearly all sectoral groups above the European average. For instance,
PATENT indicates that in science-based manufacturing and knowledge intensive business
services the percentage of Norwegian firms that have applied for at least a patent in the
period is around 10 points higher than in the rest of the EU. The variable TURNEW
instead suggests that Norwegian enterprises belonging to the science-based and network
infrastructural services groups have a share of turnover from the commercialization of
new products that is twice as high as the corresponding sectors in Europe, and that
Norway can be ranked as the European number 1 in terms of this indicator.
Summing up, the large set of CIS4 indicators presented in this section shows a
clear and quite remarkable pattern. Norwegian sectoral systems are on the whole very
innovative, often above the European average and, for some of the variables and some of
the sectoral groups, they indeed emerge as the most innovative in Europe. This pattern is
in fact more evident for those technologically advanced groups that the Schumpeterian
theory would point out as the most progressive industries of the ICT-based age, namely
advanced knowledge providers (especially services), science-based manufacturing and
network infrastructural services. In Norway, these industries are currently characterized by
a high commitment to innovative activities, close ties to external sources of technological
opportunities (including foreign sources), a very active public support and a positive
technological performance.

24 Fulvio Castellacci
Table 2: Efforts and expenditures in innovative activities
CUMUL
DISEMB TRAIN
Sectoral groups
Norway EU Norway EU Norway EU
Advanced knowledge providers manufacturing
56,7 48,5 80,1 60,5 33,3 58,1
Advanced knowledge providers services
61,1 51,5 84,0 59,5 47,0 70,0
Mass production goods – Science-based
76,7 57,2 74,7 67,5 37,7 64,1
Mass production goods – Scale-intensive
37,9 36,3 64,4 39,8 37,5 55,0
Personal goods (supplier-dominated manufacturing)
36,1 28,3 58,5 32,4 34,0 48,4
Supporting infrastructure services - Network
31,3 26,7 61,2 38,1 42,5 68,0
Supporting infrastructure services - Physical
19,7 18,6 49,9 24,0 29,6 55,3
Legend. All numbers are percentages. For a definition of the indicators, see Appendix 2.

Innovation in Norway in a European Perspective 25
Table 3: Interactions and external sources of opportunities
SUPPLIERS
USERS SCIENCE
Sectoral groups
Norway EU Norway EU Norway EU
Advanced knowledge providers manufacturing
14,4 19,5 50,4 31,4 5,5 5,6
Advanced knowledge providers services
11,7 19,9 49,9 28,1 13,1 9,5
Mass production goods – Science-based
21,2 22,3 54,1 31,7 12,5 7,3
Mass production goods – Scale-intensive
20,9 23,6 35,6 27,0 2,6 6,8
Personal goods (supplier-dominated manufacturing)
20,6 24,6 35,5 26,3 3,3 3,4
Supporting infrastructure services - Network
26,1 24,1 29,8 25,3 1,5 3,1
Supporting infrastructure services - Physical
26,7 26,4 25,7 22,7 6,2 3,0
Legend. All numbers are percentages. For a definition of the indicators, see Appendix 2.

26 Fulvio Castellacci
Table 4: Internationalization and global technological activities
COOP-OTHER
SELL-OTHER
Sectoral groups
Norway EU Norway EU
Advanced knowledge providers manufacturing
22,2 12,9 61,8 61,9
Advanced knowledge providers services
25,0 14,3 46,0 34,6
Mass production goods – Science-based
30,1 15,9 53,8 54,8
Mass production goods – Scale-intensive
10,5 6,8 32,6 41,5
Personal goods (supplier-dominated manufacturing)
11,6 4,7 32,4 36,5
Supporting infrastructure services - Network
5,9 5,4 17,3 11,4
Supporting infrastructure services - Physical
4,1 3,6 29,5 30,3
Legend. All numbers are percentages. For a definition of the indicators, see Appendix 2.

Innovation in Norway in a European Perspective 27
Table 5: Policy support to innovation
FUND
FUND-NAT FUND-EU
Sectoral groups
Norway EU Norway EU Norway EU
Advanced knowledge providers manufacturing
65,0 32,5 65,0 24,3 5,0 8,3
Advanced knowledge providers services
64,1 29,3 63,9 24,3 5,5 10,4
Mass production goods – Science-based
46,5 26,9 46,1 20,7 5,1 8,2
Mass production goods – Scale-intensive
53,1 28,2 52,5 19,3 1,4 8,7
Personal goods (supplier-dominated manufacturing)
48,6 23,9 48,2 17,4 0,3 5,5
Supporting infrastructure services - Network
8,3 8,4 8,3 6,9 1,6 2,2
Supporting infrastructure services - Physical
15,7 11,1 12,4 6,8 0,2 3,4
Legend. All numbers are percentages. For a definition of the indicators, see Appendix 2.

28 Fulvio Castellacci
Table 6: Innovativeness
INNOV
MARKET ORGAN
Sectoral groups
Norway EU Norway EU Norway EU
Advanced knowledge providers manufacturing
61,5 62,5 31,3 17,3 22,2 32,2
Advanced knowledge providers services
67,9 64,1 44,2 20,9 41,2 39,1
Mass production goods – Science-based
71,6 64,7 35,7 21,7 29,9 32,5
Mass production goods – Scale-intensive
48,3 49,3 18,3 11,7 18,0 25,9
Personal goods (supplier dominated manufacturing)
44,0 46,1 22,1 14,3 19,5 23,1
Supporting infrastructure services - Network
32,4 48,6 14,3 22,0 17,9 32,1
Supporting infrastructure services - Physical
21,2 37,4 10,2 10,7 11,6 23,6
Legend. All numbers are percentages. For a definition of the indicators, see Appendix 2.

Innovation in Norway in a European Perspective 29
Table 7: Performance of innovation
PATENT
TURNEW
Sectoral groups
Norway EU Norway EU
Advanced knowledge providers manufacturing
30,6 27,5 22,1 15,9
Advanced knowledge providers services
25,7 15,1 15,8 14,4
Mass production goods – Science-based
34,5 25,6 29,5 14,6
Mass production goods – Scale-intensive
22,8 19,2 16,1 10,9
Personal goods (supplier-dominated manufacturing)
36,1 28,3 10,3 11,0
Supporting infrastructure services - Network
31,3 26,7 17,6 9,7
Supporting infrastructure services - Physical
19,7 18,6 5,6 8,3
Legend. All numbers are percentages. For a definition of the indicators, see Appendix 2.

30 Fulvio Castellacci
6. The industrial structure in Norway in a European perspective
The fourth and fifth sections of this paper have depicted a rather positive picture of
sectoral patterns of innovation in Norway, and shown that Norwegian industries are much
more innovative than their European counterparts, and more clearly so for the set of
industrial blocks that constitute the bulk of the growth potential in the current era.
However, in order to get a thorough and more balanced assessment of the patterns and
potential of innovation in Norway, one important aspect needs to be additionally
considered, namely the characteristics of the industrial structure.
The composition of the economy, i.e. the share of resources that are employed in
the various industrial sectors of the economic system, is important because it contributes
to define the aggregate amount of resources that each country devotes to innovative
activities. In fact, the overall innovation intensity of a national system may be thought of
as the average of the innovation expenditures of the various industrial sectors weighted by
the sectors‟ size (e.g. their value added shares), as indicated by the following definition:
IIi = [ ∑j (IIij • Sij) ] / [ ∑j Sij) ] (1)
where II is the innovation intensity, S is the sector‟s size, and the indexes i and j denote
the country and the sector respectively. While the fourth and fifth sections have
empirically analysed the first term of the product between parentheses (IIij), the present
section shifts the focus to the analysis of the second term (Sij).12
Table 8 presents the value added shares of the various sectoral groups of the
taxonomy for a sample of 18 European countries (average of the period 2000-2003). The
last row of the table refers to the EU average, which indicates that the greatest shares of
resources in the European economy are employed by the groups of supporting
infrastructural services and personal goods and services (around 20% each), while
advanced knowledge providers and mass production manufacturing account for a much
smaller share of total production (around 9% and 8%, respectively).
However, the table also indicates the existence of substantial cross-country
differences in the industrial structure of European economies. Norway, in particular, is
characterized by a peculiar composition of the economic system, since a very high share
of value added is produced in the energy sector (oil and gas), whereas all manufacturing
and business services sectoral branches have a production share that is much below the
12 It should be observed that innovation may, in a long-run perspective, be a major factor driving structural change and industrial transformations. The sectoral composition of the economy should therefore be considered as an endogenous variable, because innovative activities and results determine changes in the industrial composition of a national economy. However, this problem of endogeneity may be neglected in the present context, since our analysis simply focuses on the static pattern in the period 2002-2004 rather than considering longer-term transformations.

Innovation in Norway in a European Perspective 31
EU average (with the only exception of physical infrastructure services, which score
slightly above the mean).
Table 8: Value added shares for the various categories of the new sectoral taxonomy
in European countries (average 2000-2003) – Source: OECD-STAN database
Ad
van
ced
kn
ow
led
ge p
rovi
ders
- M
an
ufa
ctu
rin
g -
Ad
van
ced
kn
ow
led
ge p
rovi
ders
- S
erv
ices
-
Mass
pro
du
cti
on
go
od
s
- S
cie
nce-
base
d -
Mass
pro
du
cti
on
go
od
s
- S
cale
in
ten
sive
-
Su
pp
ort
ing
in
frast
ructu
re
serv
ices –
Net
wo
rk
Su
pp
ort
ing
in
frast
ructu
re
serv
ices – P
hysi
cal
Pers
on
al
go
od
s
Pers
on
al
serv
ices
Austria
2.85
5.75
3.30
6.60
15.60
5.20
5.75
17.50
Belgium 1.40 9.70 5.10 6.15 18.70 4.20 5.00 13.50 Czech Republic 2.55 - 1.75 3.30 2.95 - 7.20 14.60
Denmark 2.90 5.60 3.10 3.65 18.30 5.80 5.10 13.65 Finland 3.15 4.15 6.85 5.00 17.65 7.25 8.25 11.55 France 1.90 9.20 3.60 6.20 19.20 4.15 4.90 12.60
Germany 4.20 9.30 4.60 7.90 18.70 3.60 4.70 11.75 Greece 0.45 2.65 1.00 3.00 20.80 5.60 5.70 20.60
Hungary 2.00 6.30 6.20 7.10 16.45 4.80 6.70 12.80 Italy 2.80 7.75 3.15 6.05 19.30 5.05 6.60 16.45
Netherlands 1.50 8.75 3.20 3.60 17.15 4.55 5.60 14.70 Norway 1.10 4.30 0.60 3.30 12.95 6.75 3.85 10.35 Poland 1.90 - 2.50 5.90 2.30 - 7.80 21.60
Portugal 0.55 - 1.80 4.60 15.40 3.80 9.35 17.10 Slovakia 1.50 - 1.80 2.50 4.60 - 8.30 15.55
Spain 1.40 4.70 2.60 6.70 15.70 5.60 5.80 19.15 Sweden 3.30 7.10 4.20 7.30 17.15 5.70 6.50 12.00
UK 1.85 9.10 3.05 4.75 18.55 4.75 5.25 15.05 EU average
2.07
6.74
3.24
5.20
15.08
5.12
6.24
15.03

32 Fulvio Castellacci
It is interesting to compare the peculiar industrial structure of the Norwegian economy
with its sectoral patterns of innovation, whose characteristics have been previously
pointed out in the fourth and fifth sections. Figure 5 combines the two aspects together,
and studies the relationships between technological opportunities and value added shares
of the sectoral groups of our taxonomy. In order to be directly comparable to the cross-
country analysis of technological opportunities undertaken in the fourth section, the figure
focuses on the high-opportunity groups of the taxonomy, which are those that have been
shown to have a larger cross-country variability.
The upper part of figure 5 represents a stylized typology of industrial sectors. In
industries that have both high innovation intensity and large size, the impact of innovative
activities is of course high (top-right quadrant of the figure). On the other hand, sectors in
the top-left (bottom-right) quadrant of the diagram are characterized by low innovation
intensity (small value added share), and should therefore make an active effort to increase
their innovative activities (transform their industrial structure). Finally, in sectors that have
both low innovation intensity and small size, the impact of innovative activities is
inevitably limited.
The empirical counterpart of this simple typology is considered in the lower part
of figure 5, which plots the levels of technological opportunities and the corresponding
value added shares for the sectoral groups of the taxonomy for a bunch of European
countries. The scatterplot reveals an interesting pattern, and should be compared to the
results of the cluster analysis previously presented (see figure 4, in the fourth section). The
cluster analysis identified in fact a restricted set of countries that have high innovation
intensity in both science-based manufacturing and advanced services, namely Norway,
Sweden, France, Italy and Greece. In the light of figure 5, we now observe that, among
these countries, Sweden, France and (to a less extent) Italy also appear to have a quite
advanced industrial structure, with above-average value added shares in the ICT-related
sectoral groups (see the top-right quadrant of the figure). In contrast, Norway and Greece
are characterized by a more traditional composition of the economy and a below-average
size of the high-opportunity sectoral groups. Norwegian industries, in particular, can all be
found in the bottom-right quadrant of figure 5, the one that combines high technological
opportunities with low size of the industry.

Innovation in Norway in a European Perspective 33
Figure 5: Technological opportunities and industrial structure in European high-tech industries
Value added share
Technological opportunities
CZ
FR
DE
GR
HU
IT NL
NO
PL
PTSK
ES
SW
FRDE
GR
HU
IT
NL
NOES
SW
CZ
FRDE
GR
HU
IT
NL
NO
PL
PT
SK
ES
SW
-2-1
01
2
Va
lue
ad
de
d s
ha
res (
sta
nd
ard
ize
d)
-1 0 1 2 3Technological opportunities (standardized)
MPG-SB AKP-S
SIS-N
Legend. For a definition of the indicators, see Appendix 2. MPG-SB: mass production goods – science-based manufacturing; AKP-S: advanced knowledge providers – knowledge intensive business services; SIS-N: supporting infrastructure services – network infrastructure.
High impact:
high opportunities
in large industries
Missing scale:
high opportunities
in small sectors
Missing innovation:
low opportunities
in large industries
Low impact:
low opportunities
in small sectors

34 Fulvio Castellacci
In a nutshell, this graphical analysis points to a contrasting pattern, which is indeed a crucial aspect of the Norwegian system. On the one hand, technological opportunities are high in Norway, and the bunch of new GPT-related sectoral groups has among the highest innovative intensity in Europe. This is the case, as pointed out above, for the industrial groups of advanced knowledge providers, science-based manufacturing and network infrastructure services. On the other hand, these sectoral groups are relatively small in Norway, accounting for a much lower share of production than their European counterparts. So, the commonly made statement that innovation intensity is low in Norway (e.g. Grønning et al., 2006; OECD, 2007) hides such a contrasting pattern.
The problem is not with innovative activities and innovation policies, as frequently
asserted, but it has rather to do with the sectoral composition of the economy. The
specialization in resource-based and traditional industries has in fact constituted a
stronghold of the Norwegian system for several decades. The industrial structure we
observe today is thus the result of the continuous policy support to this type of trajectory,
whereas new and more innovative industrial branches, that could potentially drive the
growth of the system in the post-oil era, have progressively decreased their value added
and employment shares in the Norwegian economy.
This is particularly evident when we look at the employment shares of various
branches of the economy and their evolution in the last three-decade period. The graphs
in figure 6 show in fact that most of the sectoral groups have experienced a decline in
their employment shares, while just a few branches have increased their importance in the
economy. In particular, the most rapidly expanding sectors have been advanced
knowledge providers services (see upper panel of figure 6) and, more strikingly, public
services (see bottom panel of the figure). The interesting fact is that these two expanding
sectors have increased their employment more rapidly than they have been able to
increase their production share – their labour productivity growth over time has for this
reason been lower than average. A third major expanding branch of the Norwegian
economy in recent decades has been, as well-known, the energy sector (this is included in
the “mining and quarrying” category, see bottom panel of figure 6). This branch, however,
has increased its employment share quite modestly (as evident in figure 6), whereas its
value added shares have grown at a remarkable rate (and this contrast explains the
spectacular productivity performance experienced by this sector in recent decades).
Overall, the interpretation of this pattern is that the explosion of the energy sector
has had two major consequences. On the one hand, it has increased the demand for
technical consultancy and specialised solutions that advanced knowledge providers have
the function to provide, thus fostering the expansion of this type of industries (Sogner,
2008). On the other, it has made available a large amount of public resources to the State.
The international pressures to restructure the welfare system have consequently been
mitigated by the healthy conditions of public finance in Norway, and the public sector has
thus visibly enlarged by absorbing employment, in contrast to what has happened in other
industrialized countries in the same period.

Innovation in Norway in a European Perspective 35
Figure 6: Expanding and contracting branches in the Norwegian economy – Dynamics of employment shares of GDP, 1970-2002
Manufacturing and business services
0
2
4
6
8
10
12
14
16
70-74 74-77 78-81 82-85 86-89 90-93 94-97 98-02
EM
PL
%
AKP-M AKP-S MPG-SB MPG-SI PGS-M PGS-S IS-N IS-P
Legend. AKP-M: advanced knowledge provider manufacturing; AKP-S: advanced knowledge provider services; MPG-SB: science-based manufacturing; MPG-SI: scale intensive manufacturing; PGS-M: supplier-dominated manufacturing; PGS-S: supplier-dominated services; IS-N: network infrastructure services; IS-P: physical infrastructure services
Other Branches
0
5
10
15
20
25
30
35
40
70-74 74-77 78-81 82-85 86-89 90-93 94-97 98-02
EM
PL
%
Agriculture Mining and quarrying Construction Community, Social and Personal services

36 Fulvio Castellacci
As a consequence of this trend, the composition of the Norwegian economy is
now more dependent on low productivity services. Public services currently employ more
than 35% of the working population, and if we add low productivity services such as
supplier-dominated and physical infrastructure services, the employment share gets to
around 60%.
In sum, the explosion of the energy sector has driven out productive resources
from high-opportunity manufacturing and business services, which are those that are
potentially able to drive the growth of the economy in the post-oil era. These high-
opportunity industries are indeed very innovative in Norway, but they still lack the
amount of resources and minimum scale that would be necessary to have a visible effect
on the aggregate performance of the Norwegian system. These sectoral blocks will
become more and more crucial in the years to come, and a transformation of the
industrial structure towards these advanced branches represents therefore a key challenge
for the Norwegian economy.
7. Conclusions and policy implications
The analysis carried out in this paper has investigated sectoral patterns of innovation in
Norway in a European perspective. The paper has first introduced the relevant literature
(second section) and hence put forward a theoretical framework based on a new sectoral
taxonomy that combines manufacturing and services within the same framework (third
section). It has then analysed innovative activities in Norway and compared them to other
European countries by making use of CIS4 data (fourth and fifth sections). Finally, it has
studied the recent evolution and current characteristics of the industrial structure in
Norway and pointed out its peculiarities vis-a-vis other European economies (sixth section).
The results of this work point to a contrasting pattern, which is indeed a
characterizing feature of the Norwegian system. On the one hand, Norwegian sectoral
systems appear to be very innovative, often above the European average and, for some of
the CIS4 indicators and some of the sectoral groups, they indeed emerge as the most
innovative in Europe. This pattern is in fact more evident for those technologically
advanced groups that our sectoral taxonomy points out as the most progressive industries
of the ICT-based age, i.e. advanced knowledge providers (especially services), science-
based manufacturing and network infrastructural services. In Norway, these industries are
currently characterized by a high commitment to innovative activities, close ties to
external sources of technological opportunities (including foreign sources), a very active
public support and a positive technological performance.

Innovation in Norway in a European Perspective 37
On the other hand, these sectoral groups are relatively small in Norway,
accounting for a much lower share of production than their European counterparts. The
impressive growth of the energy sector has in fact attracted a substantial amount of
investments towards this important branch of the economy and sustained the overall
performance of the system for the last few decades. However, this has led to a crowding
out process, since the rise of the energy sector has at the same time driven out productive
resources from high-opportunity manufacturing and business services, which are those
that are potentially able to drive the growth of the economy in the post-oil era. At present,
these high-opportunity industries still lack the amount of resources and minimum scale
that would be necessary to have a visible effect on the aggregate performance of the
Norwegian system.
In conclusion, by focusing on the sectoral characteristics of the Norwegian
economy and by analysing them in a European perspective, the paper sheds new light on
the so-called Norwegian paradox, according to which Norway is characterized by a peculiar
combination of low innovation and high economic performance. The commonly made
statement that innovation is low in Norway does in fact hide the contrasting pattern
outlined above. The problem is not with innovative activities, as frequently asserted, but it
has rather to do with the sectoral composition of the economy.
This interpretation leads to one major policy implication. The fact that the
Norwegian economy is currently robust and that it has experienced a positive economic
performance for the last decades should not lead to neglect the possible future risks it
faces. The great availability of financial resources currently saved in the Oil Fund does not
provide a strong enough insurance from these future risks. Quite on the contrary, these
resources constitute a good opportunity to start undertaking a new direction already in the
present, and to compensate for the costs associated with the development of a new path.
If the diagnosis presented in this paper is correct, the natural policy implication
would be to emphasize the building up of new competitive advantages in technologically
progressive industries rather than the strengthening of the current specialization patterns
based on the existing set of comparative advantages. The first and crucial step in this new
direction would be the development of a well-developed home market for the production
of technologically advanced products, processes and services, e.g. through an incentive
scheme to encourage private investments and the entry of firms in high-tech sectors.
When a critical mass of resources and innovative firms will be available in the high-tech
branch of the industrial system, dynamic economies of scale and inter-sectoral linkages
will be able to activate and sustain a cumulative growth mechanism. At that point, the
competition between the two technological paradigms might result in a different outcome,
and the dynamics of the Norwegian system will possibly take a different direction than the
one it is currently following.

38 Fulvio Castellacci
Appendix 1: List of industries in each sectoral group
Advanced knowledge providers – Specialised suppliers manufacturing (AKP-M):
Machinery and equipment; medical, precision and optical instruments
Advanced knowledge providers – Knowledge intensive business services (AKP-S):
Computer and related activities; research and development; other business activities
Mass production goods – Science-based manufacturing (MPG-SB):
Chemicals; office machinery and computers; electrical machinery and apparatus; radio, TV
and communication equipment
Mass production goods – Scale-intensive manufacturing (MPG-SI):
Rubber and plastic products; other non-metallic mineral products; basic metals; fabricated
metal products; motor vehicles; other transport equipment
Personal goods and services – Supplier-dominated goods (PGS-M):
Food and beverages; textiles; wearing; leather; wood and related; pulp and paper; printing
and publishing; furniture; recycling
Personal goods and services – Supplier-dominated services (PGS-S):
Sale, mantainance and repair of motor vehicles; retail trade and repair of personal and
household goods; hotels and restaurants
Supporting Infrastructure services – Network infrastructure (SIS-N):
Post and telecommunications; financial intermediation; insurance and pension funding;
activities auxiliary to financial intermediation
Supporting Infrastructure services – Physical infrastructure (SIS-P):
Wholesale trade and commission trade; land, water and air transport; supporting and
auxiliary transport activities

Innovation in Norway in a European Perspective 39
Appendix 2: Community Innovation Survey (CIS) data: source and
definition of the indicators used
Traditional indicators of innovative activity are based on R&D and patent statistics. These
data provide substantial information about the input and output of the innovative process
and constitute the most widely used sources of statistical information on innovation.
However, the innovation literature has pointed out that one major disadvantage with
R&D and patent data is that firms‟ propensity to engage in R&D expenditures and to
patent the results of their technological activities vary substantially among sectors. In
order to overcome this problem and provide a richer source of information on innovation
in firms and industrial sectors, innovation survey data is a relatively recent and increasingly
used statistical source in this field.
In Europe, in particular, the Community Innovation Survey (CIS) provides a rich set of
information on a variety of aspects such as firms‟ innovative activities, expenditures,
strategies, interactions with external actors, hampering factors, institutional and
framework conditions, and innovation policy support (i.e. more than 100 indicators
measuring these aspects). The survey is implemented at the firm-level, and thousands of
enterprises in manufacturing and service industries in all European countries have been
responding to the questionnaire. CIS data are available both at the firm-level (for
individual countries) and at the industry-level (for cross-country comparisons). The CIS
survey is undertaken by the national statistical institute of each country (in coordination
and accordance with Eurostat‟s harmonization guidelines) on a four-yearly basis. So far,
four surveys have been undertaken: CIS1 (1993), CIS2 (1996-1998), CIS3 (1998-2000) and
CIS4 (2002-2004). Eurostat website provides further methodological notes on this
increasingly important data source.
This paper has made use of the most recent wave of the survey (CIS4), and
particularly its industry-level version released by Eurostat that enables comparisons of
industrial sectors among European countries. The indicators we have constructed and
made use of are reported as follows.
OPPORT: total innovation expenditures, share of total turnover
CUMUL: firms engaged continuously in R&D, share of innovative firms
DISEMB: R&D expenditures, share of total innovation costs
TRAIN: firms engaged in training activities, share of innovative firms
SUPPLIERS: firms considering their suppliers as a very important source of information
for their technological activities, share of innovative firms
40 Fulvio Castellacci
USERS: firms considering their clients as a very important source of information for their
technological activities, share of innovative firms
SCIENCE: firms considering the Universities as a very important source of information
for their technological activities, share of innovative firms
COOP-OTHER: Enterprises engaged in innovative activities within United States and
other countries, share of innovative firms
SELL-OTHER: Enterprises selling their products to any other country outside the EU,
share of innovative firms
FUND: Enterprises that received any public funding, share of innovative firms
FUND-NAT: Enterprises that received public funding from the central government,
share of innovative firms
FUND-EU: Enterprises that received public funding from the European Union, share of
innovative firms
INNOV: innovative firms, share of total population of firms
MARKET: firms introducing marketing innovations, share of total population of firms
ORGAN: firms introducing organisational innovations, share of total population of firms
PATENT: firms that have applied for at least one patent, share of innovative firms
TURNEW: turnover of new products, share of total turnover
Innovation in Norway in a European Perspective 41
References:
Archibugi, D. 2001. “Pavitt‟s taxonomy sixteen years on: A review article”, Economics of
Innovation and New Technology, 10: 415-425.
Archibugi, D. and Michie, J. 1995. “The globalisation of technology: a new taxonomy”,
Cambridge Journal of Economics, 19: 121-140.
Archibugi, D., and Iammarino, S. 2003. “The policy implications of the globalisation of
innovation”, Research Policy, 28: 317-336.
Bresnahan, T. and Trajtenberg, M. 1995. “General purpose technologies: „engines of
growth‟?”, Journal of Econometrics 65: 83-108.
Cappelen, Å., Raknerud, A. and Rybalka, M. 2007. “Effekter av SkatteFUNN på
foretakenes produktivitet og lønnsomhet”, Rapporter 2007/22, Statistisk sentralbyrå, Oslo.
Carlsson, B. 2006. “Internationalization of innovation systems: A survey of the literature”,
Research Policy, 35 (1): 56-67.
Castellacci, F. 2007. “Evolutionary and new growth theories. Are they converging?”,
Journal of Economic Surveys, 21 (3): 585-627.
Castellacci, F. 2008. “Technological paradigm, regimes and trajectories: Manufacturing
and service industries in a new taxonomy of sectoral patterns of innovation”, Research
Policy, 37: 978-994.
Castellacci, F., Clausen, T., Nås, S.O. and Verspagen, B. 2008. “Historical fingertips? A
taxonomy of innovation in Norway”, in Fagerberg, J., Mowery, D. and Verspagen, B.
(Eds.), Innovation, Path-dependency and Policy: the Norwegian Case, Oxford University Press, in
press.
Clausen, T. 2008. “Do subsidies have positive impacts upon R&D and innovation
activities at the firm level?”, in Fagerberg, J., Mowery, D. and Verspagen, B. (Eds.),
Innovation, Path-dependency and Policy: the Norwegian Case, Oxford University Press, in press.
David, P., Hall, B. and Toole, A. 2000. “Is public R&D a complement or substitute for
private R&D? A review of the econometric evidence”, Research Policy, 29: 497-529.

42 Fulvio Castellacci
Dosi, G. 1982. “Technological paradigms and technological trajectories”, Research Policy, 11:
147-162.
Dosi, G. 1988. “Sources, procedures, and microeconomic effects of innovation”, Journal of
Economic Literature, XXVI: 1120-1171.
Fagerberg, J., Mowery, D.C. and Nelson, R.R. 2005. The Oxford Handbook of Innovation,
Oxford, Oxford University Press.
Fagerberg, J., D. Mowery and B. Verspagen 2008. Innovation, Path-dependency and Policy: The
Norwegian Case, Oxford University Press, in press.
Freeman, C., Clark, J., and Soete, L. 1982. Unemployment and Technical Innovation,
Pinter, London.
Freeman, C. and Louça F. 2001. As Time Goes by: From the Industrial Revolutions to the
Information Revolution, Oxford University Press, Oxford.
Gallouj, F., Weinstein, O. 1997. “Innovation in services”, Research Policy, 26: 537-556.
Grossman, G.M. and Helpman, E. 1991. Innovation and Growth in the Global Economy, MIT
Press, Cambridge, USA.
Grønning, T., Moen, S.E., Olsen, D.S. 2006. “Norway: low innovation intensity, high
growth and specialized trajectories”, in Edquist, C. and L. Hommen (Eds.), Small Country
Innovation Systems. Globalization, Change and Policy in Asia nd Europe, Aldershot, Edward Elgar.
Hoeckman, B. and Primo Braga, C. 1997. “Protection and trade in services: a survey”,
Open Economies Review, 8 (3): 285-308.
Maurseth, P.B. and Verspagen, B. 2002. “Knowledge spillovers in Europe. A patent
citation analysis”, Scandinavian Journal of Economics, 104: 531-545.
Miles, I. 2005. “Innovation in services”, in J. Fagerberg, D. C. Mowery and R. R. Nelson
(Eds.), The Oxford Handbook of Innovation, Oxford, Oxford University Press.
Miozzo, M. and Soete, L. 2001. “Internationalization of services: a technological
perspective”, Technological Forecasting and Social Change, 67: 159-185.
Nelson, R., Winter, S. 1977. “In search of a useful theory of innovation”, Research Policy, 6:
36-76.

Innovation in Norway in a European Perspective 43
OECD 2007. “Norway”, OECD Economic Surveys, Volume 2007/2, OECD.
Pavitt, K. 1984. “Sectoral patterns of technical change: towards a taxonomy and a theory”,
Research Policy, 13: 343-373.
Romer, P. 1990. “Endogenous technological change”, Journal of Political Economy, 98: 71-
102.
Schumpeter, J. 1934. The Theory of Economic Development, Harvard University Press,
Cambridge, USA.
Schumpeter, J. 1939. Business Cycles, Porcupine Press, Philadelphia.
Sogner, K. 2008. “Slow growth and revolutionary change. The Norwegian IT-industry
enters the global age, 1970-2005”, in Fagerberg, J., Mowery, D. and Verspagen, B. (Eds.),
Innovation, Path-dependency and Policy: the Norwegian Case, Oxford University Press, in press.
Von Tunzelmann, N. and V. Acha 2005. “Innovation in „low-tech‟ industries”, in J.
Fagerberg, D. C. Mowery and R. R. Nelson (Eds.): The Oxford Handbook of Innovation,
Oxford University Press, Oxford.
Wicken, O. 2008. “The layers of national innovation systems: The historical evolution of a
national innovation system in Norway”, in Fagerberg, J., Mowery, D. and Verspagen, B.
(Eds.), Innovation, Path-dependency and Policy: the Norwegian Case, Oxford University Press, in
press.