economic geology · ©2008 by economic geology, ... fluid inclusions that trapped fluids ... low...
TRANSCRIPT

0361-0128/08/3727/307-28 307
Fluid Inclusion Evidence for Magmatic-Hydrothermal Fluid Evolution in the Porphyry Copper-Molybdenum Deposit at Butte, Montana
BRIAN G. RUSK†,* MARK H. REED,Department of Geological Sciences, 1272 University of Oregon, Eugene, Oregon, 97403
AND JOHN H. DILLES
Department of Geosciences, 104 Wilkinson, Oregon State University, Corvallis, Oregon, 97331
AbstractThe porphyry Cu-Mo deposit in Butte, Montana, formed where magmatic hydrothermal fluids, introduced
with injections of porphyrytic dikes, fractured and permeated the Butte Quartz Monzonite. These fluidsformed a stockwork of quartz and quartz-sulfide veinlets with a variety of styles of potassic and sericitic alter-ation envelopes. The distribution of vein and alteration types and the distribution of fluid inclusions in theseveins record the progressive pressure, temperature, and compositional evolution of the hydrothermal fluidsthat formed this world-class deposit.
Deep drilling and 1,300 m of offset along the Continental fault provide a vertical view of almost 3 kmthrough the Butte deposit. Deep veins within and below the highest Mo grades are quartz dominated with thinK-feldspar or, less commonly, biotitic alteration rims. Fluid inclusions in deep veins trapped a single phaseaqueous fluid containing 2 to 5 wt percent NaCl equiv and 2 to 8 mol percent CO2 at temperatures between575° and 650°C and pressures between 200 and 250 MPa, corresponding to depths between 6 and 9 km. Al-though Cu grades are low in this region, abundant chalcopyrite daughter minerals in fluid inclusions indicatethat the fluids were Cu rich. Fluids that formed these veins transported Cu from the magma below, upwardinto the region of Cu mineralization with only minor Cu precipitation.
Over a kilometer above the bulk of deep quartz and quartz-molybdenite veins, the highest Cu grades are inand around chalcopyrite-bearing quartz-sulfide veins with biotitic alteration (early dark micaceous veins), andtheir upward, equivalent magnetite-chalcopyrite-pyrite-quartz veins with wide K-feldspar, green sericite, andchlorite alteration (pale-green sericitic veins). These veins contain more evidence for brine-vapor unmixingthan any other vein type. The upward progression of early dark micaceous veins to pale-green sericitic veinsformed where low salinity, CO2-bearing fluids, similar to those trapped in deep quartz veins, ascended, de-pressurized, sometimes unmixed, and cooled from ~650°C at 90 MPa to ~475°C at ~50 MPa.
As low salinity, CO2-bearing, aqueous fluids, similar in composition to fluids trapped in deep quartz veins,cooled at shallow depths, they formed late pyrite-quartz veins with sericitic alteration. These veins formed fromfluid cooling at temperatures between 370° and 450°C at transiently hydrostatic pressures between 40 and 70MPa, corresponding to depths of 4 to 7 km. Most pyrite-quartz veins formed at pressures and temperatures abovethe H2O-NaCl-CO2 solvus, but evidence for brine-vapor unmixing is also present. Pyrite-quartz veins formed atprogressively greater depths as the hydrothermal system cooled, overprinting much previous mineralization.
Late Cu-Pb-Zn-Ag-As-rich Main stage veins formed from dilute fluids containing <3 wt percent NaCl equivand <2 mol percent CO2. These fluids were trapped between 230° and 400°C under hydrostatic pressures be-tween 20 and 60 MPa and depths of 2 to 6 km. No evidence of boiling is observed in Main stage veins.
Fluid inclusion phase relationships indicate that the Butte porphyry Cu-Mo deposit formed at 5 to 9 kmdepth, greater than any other porphyry-type deposit. At Butte, the similarity in bulk composition of fluidstrapped in early quartz-rich veins with potassic alteration and late pyrite-quartz veins with sericitic alterationimplies that an underlying magma continually provided low salinity, CO2-bearing fluids of relatively constantcomposition during the entire life of the hydrothermal system. We hypothesize that rather than resulting fromchanges in fluid chemistry due to magma crystallization, the entire suite of vein and alteration types and theore metal distribution reflect the path of cooling, depressurization, and wall-rock interaction of a parental mag-matic-derived fluid of relatively constant initial composition.
† Corresponding author: e-mail, [email protected]*Present address: School of Earth and Environmental Sciences, James Cook University, Townsville, Queensland, 4810, Australia.
©2008 by Economic Geology, Vol. 103, pp. 307–334
Economic GeologyBULLETIN OF THE SOCIETY OF ECONOMIC GEOLOGISTS
VOL. 103 March–April 2008 NO. 2

IntroductionPORPHYRY Cu (Mo-Au) deposits form in the upper crust,where fluid overpressures generated in the cupola of a crys-tallizing magma hydrofracture the overlying rock (Burnham,1979), allowing magma and fluids to intrude, forming por-phyry dikes surrounded by stockwork fractures. Aqueous flu-ids permeate the fractured rock where the fluids depressur-ize, cool, and chemically react with wall rock, forming veinswith alteration envelopes. Magmatic volatiles enriched in in-compatible elements precipitate sulfides of Cu and Mo in ad-dition to quartz.
Porphyry Cu deposits from around the world and of all agesshow similar vein and alteration types and similar patterns ofvein and alteration distribution (Gustafson and Hunt, 1975;Beane and Bodnar, 1995; Seedorff et al., 2005). Alteration istypically zoned from an inner K-silicate assemblage outwardto propylitic alteration, with later sericitic alteration cuttingthe K-silicate zone or lying near the potassic-propylitic inter-face (Lowell and Guilbert, 1970; Gustafson and Hunt, 1975;Beane and Titley, 1981; Seedorff et al., 2005). Commonly,early Cu-bearing quartz veins with K-silicate alteration arecut by quartz-molybdenite veins, which are cut by pyrite veinswith sericitic alteration (cf. Gustafson and Hunt, 1975). Insome deposits, late veins with advanced argillic and sericiticalteration cut all of the above vein types (Meyer et al., 1968;Lowell and Guilbert, 1970; Corn, 1975; Arribas et al., 1995;Phillips et al., 1998; Ossandon et al., 2001; Manske and Paul,2002; Khashgerel et al., 2006).
Fluid inclusions in vein quartz from porphyry Cu depositstrap fluids with a wide range of compositions under a widerange of pressure and temperature conditions. In a single de-posit, hydrothermal fluids may originate from magmatic, sed-imentary, or meteoric water sources (Bowman et al., 1987;Dilles, 1987), and fluid salinities may range from 0 to 70 wtpercent NaCl equiv. CO2 has been identified in inclusionsfrom some deposits, but other gases such as H2S, N2, andCH4 are typically not detected. Temperatures of vein forma-tion range from ~300° to ~800°C, and pressures vary fromhydrostatic to lithostatic, typically ranging from <10 to ~150MPa, corresponding to depths between 1 and 5 km and fluiddensities from <0.1 to >1.3 g/cm3.
Owing to superposition of multiple mineralizing events,fluid inclusions that trapped fluids of different compositionsat different times are commonly juxtaposed within a singlevein. Such superposition complicates the interpretation offluid origin and evolution by obscuring temporal relationshipsbetween fluid inclusions, vein minerals, and alteration miner-als (cf. Rusk and Reed, 2002; Redmond et al., 2004; Seedorff
and Einaudi, 2004; Seedorff et al., 2005). Therefore, someambiguity remains as to the relationship between low salinityand high salinity fluid inclusions and the origin and evolutionof these fluids. For example, previous fluid inclusion studiesin many porphyry Cu deposits suggest that early K-silicate al-teration that accompanies Cu and Mo mineralization is pro-duced by high salinity, high-temperature magmatic fluids.However, low to moderate salinity fluids are implicated in K-silicate alteration in some deposits (Redmond et al., 2004; thisstudy). Later sericitic alteration has been interpreted to havebeen produced by low salinity, low-temperature meteoricfluids (Sheppard and Taylor, 1974; Beane and Titley, 1981;Beane and Bodnar, 1995; Taylor, 1997); however, a magmaticfluid origin of pyrite veins with sericitic alteration has been in-ferred more recently in many deposits (Hedenquist et al.,1998; Zhang et al., 1999; Watanabe and Hedenquist, 2001;Ulrich et al., 2001, Seedorff and Enaudi, 2004; this study) andhigh salinity, magmatic fluid inclusions have been identifiedin sericitic alteration at Henderson, Colorado (Seedorff andEinaudi, 2004); Endeavor 26 North, Australia (Harris andGolding, 2002); Gaby Sur, Chile (J. Dilles, unpub. data); andButte, Montana (this study).
Halite-saturated inclusions are ubiquitous in porphyry Cudeposits and low-density vapors are also extremely common.However, in most deposits, it is unclear whether these fluidsdirectly exsolved from a magma or whether they were gener-ated by fluid unmixing. Where brine and vapor are generatedby fluid unmixing, the composition of the parental hydrother-mal fluids is typically unknown. In the vast majority of por-phyry Cu deposits, it is therefore difficult to determine howthe compositions of hydrothermal fluids change with timeand how those changes affect ore mineral distribution and al-teration zonation. Models of the physical and chemicalprocesses that form porphyry Cu deposits based on fluid in-clusions are compromised in the absence of identification ofthe parental magmatic hydrothermal fluids from which un-mixed fluid inclusion populations are derived.
In previous fluid inclusion investigations at Butte, Roedder(1971) showed that some veins contain halite-bearing inclu-sions, but Roberts (1975) identified abundant low salinityfluid inclusions in deep, early veins trapped at high tempera-ture and pressure. The presence of chalcopyrite daughterminerals in these inclusions led him to infer that low salinity,Cu-rich fluids were responsible for most Cu mineralization.Our investigation was designed to determine whether theselow salinity fluids were the parental magmatic-hydrothermalfluids and to examine how fluid properties evolved spatiallyand temporally during the life of the hydrothermal system.We have reconstructed the physical and chemical evolution of
308 RUSK ET AL.
0361-0128/98/000/000-00 $6.00 308
Fluid inclusions, vein and alteration relations, and ore metal distribution indicate that Cu and Mo were in-troduced into the hydrothermal system by the same fluids, but that the mechanisms of precipitation of thesemetals were decoupled. Early dark micaceous and, to a greater extent, pale-green sericitic, veins have wide al-teration envelopes and contain more evidence for fluid unmixing than any other vein type, which suggests thatchalcopyrite precipitation was driven by a combination of fluid unmixing, fluid-rock reaction, and fluid coolingbetween 650° and 475°C. Most molybdenite mineralization, however, is in quartz-dominated veins with littleor no alteration that are dominated by low salinity inclusions. These veins formed in response to pressure de-crease rather than cooling. After chalcopyrite and molybdenite precipitation, low salinity fluids cooled, usuallyat temperatures and pressures above the H2O-NaCl-CO2 solvus, to produce significant acid and voluminoussericitic alteration accompanied by pyrite-quartz vein formation that overprints much of the deposit and con-tains anomalous but noneconomic Cu.

the hydrothermal system that formed the porphyry Cu-Modeposit in Butte on the basis of vein and alteration mineralcontent, vein cutting relations, and fluid inclusion distributionand analysis. These data are discussed in the context of theevolution of the pressure, temperature, and fluid composi-tions of the magmatic-hydrothermal system in space andtime. Our results provide constraints on the role of fluctua-tions in fluid pressure, temperature, and composition on veinformation, wall-rock alteration, and metal precipitation.
Methods Field mapping
Over 5,000 m of drill core was logged at a scale of 1:240,and about 1,000 core samples containing various vein and al-teration types from various depths were collected for labora-tory analyses. Most samples are from 10 deep drill holes thatpenetrate the Pittsmont dome and the adjacent zone of per-vasive gray sericitic alteration to depths between 1,200 and2,600 m below the surface. We also collected and analyzedsome samples from the Anaconda dome, including both coreand hand samples taken by mine geologists over the past 100years. A few samples were collected during several short ex-cursions into the Continental Pit, but detailed mapping ofbench faces in the active Continental Pit was not possible.
Fluid inclusion sampling
Over 200 samples were observed for inclusion type, abun-dance, spatial distribution, and size. Approximately 50 ofthese samples were further analyzed by microthermometry,SEM-EDS daughter-mineral analysis, and/or Raman spec-troscopy. Many of these samples were previously examinedusing scanning electron microscope cathodoluminescence(Rusk and Reed, 2002; Rusk et al., 2006), fluid inclusion traceelement analysis by laser ablation-inductively coupledplasma-mass spectrometry (LA-ICP-MS) (Rusk et al., 2004),and analyses of fluid inclusion solutes, gases, and noble gasisotopes (Rusk et al., 2005). Over 3,000 inclusions were ana-lyzed by microthermometry. The inclusions range from lessthan 1 to ~80 µm in diameter, with the vast majority of inclu-sions being less than 5 µm. Most inclusions analyzed by mi-crothermometry were between 5 and 20 µm in diameter.
Microthermometry
Microthermometry was carried out on Fluid Inc-adaptedU.S. Geological Society Gas-Flow Heating/Freezing Systemsat the University of Oregon and Oregon State University.Thermocouples were calibrated at –56.6°, 0.0°, and +374.1°Cusing synthetic fluid inclusions. The precision of temperaturemeasurements on cooling runs is about ±0.1°C. On heatingruns, the precision is ±2°C. Ice-melting temperatures wereobserved at a heating rate of no more than 0.1°C/s. Homoge-nization temperatures were observed at a heating rate of≤1°C/s. Homogenization of halite-bearing inclusions was ob-tained on only one assemblage of halite-bearing inclusionsper sample chip to avoid analyzing inclusions that stretcheddue to previous heating. Heating cycles of about 5°C wereused to determine the homogenization temperature of bub-ble and halite in halite-bearing inclusions. Heating cycles alsoconstrained the melting temperature of clathrate to within±0.2°C in most CO2-bearing inclusions.
Scanning electron microscope-energy dispersive spectrometry
Daughter minerals in fluid inclusions were identified byscanning electron microscope-energy dispersive spectrome-try (SEM-EDS) of opened fluid inclusions. SEM-EDS analy-ses and secondary electron (SEM-SE) images were acquiredon carbon-coated broken quartz fragments at beam currentsbetween 0.05 and 5 nAmps, and electron acceleration poten-tials of 5 to 20 kV. Opened fluid inclusions were identified onbroken quartz fragments (shattered with a hammer and chiselin liquid nitrogen to avoid ejection of daughter minerals) withsecondary electron imaging, and elemental compositions ofdaughter minerals were determined by SEM-EDS.
Raman spectroscopyCarbon dioxide contents of fluid inclusions were estimated
using Raman analysis and the technique of Azbej et al. (2007)at Virginia Polytechnic Institute. With this technique, inclu-sions are homogenized in a Chaixmeca heating stagemounted on a microscope attached to a Dilor XY Raman mi-croprobe. Excitation is provided by an Ar-ion laser, with alaser power of approximately 10 mW measured at the sample.The ratio of the area under the CO2 peak at 1,388 cm–1 to thearea under the H2O peak at about 3,500 cm–1 varies linearlywith CO2 content over the range from about 0 to 25 mol per-cent CO2. The precision and accuracy of the Raman tech-nique for determining the CO2 content of homogenized in-clusions is estimated to be better than ±1 mol percent overthe range of concentrations of inclusions in this study.
Fluid inclusion references Salinities, CO2 contents, and densities in liquid-vapor inclu-
sions that formed clathrate upon cooling were estimated usingthe computer program ICE (Bakker, 1997) and the data of Duanet al. (1992a, b). Salinities in CO2-bearing inclusions that didnot form clathrate upon cooling were estimated using the tech-nique of Hedenquist and Henley (1985). Salinities of inclusionscontaining halite, liquid, and vapor at room temperature wereestimated using the data and methodology of Bodnar and Vityk(1994). For inclusions that homogenize by halite dissolution,this method underestimates salinity by up to 3 wt percent NaClequiv (Bodnar and Vityk, 1994). Salinities in liquid plus vaporinclusions that are inferred to contain no CO2 were estimatedusing the data of Bodnar (1993). Isochores were calculated forCO2-bearing inclusions using the program MACFLINCOR(Brown, 1989) and the data of Bowers and Helgeson (1983),which are in close agreement with lines of constant homoge-nization temperature predicted by the equation of state ofDuan et al. (1995). For inclusions that contain neither CO2
nor halite, isochores were calculated with the programMACFLINCOR using the data of Bodnar and Vytik (1994).
Geologic BackgroundThe deposit at Butte provides an exceptional opportunity to
understand the physical and chemical evolution of a hy-drothermal system that formed a porphyry Cu deposit. Thedeposit geology has been studied for more than 100 years(Brown, 1894; Emmons and Tower, 1897; Weed, 1912; Sales,1914; Sales and Meyer, 1948; Meyer, 1965; Meyer et al., 1968;Miller, 1973; Roberts, 1975; Brimhall, 1977). The host rock is
MAGMATIC-HYDROTHERMAL FLUID EVOLUTION IN THE BUTTE PORPHYRY Cu-Mo DEPOSIT, MONTANA 309
0361-0128/98/000/000-00 $6.00 309

uniform throughout the deposit and provides a uniform back-drop for alteration and zoning such that variations in physio-chemical processes due to rock composition are absent. Tendeep drill holes, including one in the upthrown block east ofthe Continental fault, reach depths equivalent to ~2,600 mbelow the present surface. The unusually great depth atwhich the deposit formed (Roberts, 1975; this study) and thelarge horizontal and vertical distance over which sampleswere collected allow exceptional insights into the physical andchemical processes of this magmatic-hydrothermal system.
The porphyry Cu and base metal lode deposits at Butte arehosted by the Butte Quartz Monzonite at the southern end ofthe Boulder batholith (Meyer et al., 1968; Smedes, 1973; Till-ing, 1973) (Fig. 1). The ~76 m.y. old Butte Quartz Monzonite(Tilling et al., 1968; Martin et al., 1999; Lund et al. 2002) in-trudes Proterozoic sedimentary rocks of the Belt Supergroupand to the south of Butte, Archean crystalline basement. TheButte Quartz Monzonite is medium to coarse grained and isuniform in mineral content throughout the Butte district.Quartz and K-feldspar, in roughly equal amounts, comprise40 to 45 vol percent of the Butte Quartz Monzonite. Plagio-clase constitutes 35 to 40 vol percent, and biotite and horn-blende with accessory magnetite, titanite, ilmenite, and ap-atite make up the remaining 15 to 20 vol percent of the pluton(Meyer et al., 1968; Roberts, 1975). The oxide and titanite-bearing assemblages suggest an elevated magmatic oxygen fu-gacity (~NNO + 2: Field et al., 2005). Sheeted granoaplitedikes and local pegmatite dikes form subhorizontal sheetswithin the Butte Quartz Monzonite (Houston, 2002).
The Butte Quartz Monzonite, aplites, and pegmatites arecut by a swarm of east-west–striking, steeply south dipping
quartz porphyry dikes that contain phenocrysts of plagioclase,biotite, K-feldspar, and partially resorbed quartz. U/Pb zirconages of several dikes yield ages of ~66 ± 1 Ma (Lund et al.,2002). Chalcopyrite- and pyrite-bearing biotitic breccias em-anating from these dikes grade into biotitic veins, indicatingthat hydrothermal fluids were introduced with dike intrusionabout 10 m.y. after emplacement of the Butte Quartz Mon-zonite. Several biotitic breccias from the Continental andBerkeley Pits (Fig. 1) contain fragments of quartz veins, indi-cating that some deep veins formed before the intrusion ofsome dikes. The number of intrusive events at Butte and theirrelation to mineralization ore is not well constrained, nor isthe duration of dike intrusion. The source stock or cupolafrom which these dikes originated has not been identified, al-though the two deepest drill holes intersect a texturally dis-tinct rock that may be the uppermost portion of a cupola.
Two distinct stages of mineralization are identified atButte. “Pre-Main stage” porphyry Cu-Mo stockwork veinsare cut by “Main stage” veins, which are large, through-goingCordilleran-style base metal lodes containing Cu-, Zn-, Pb-,and Ag-sulfides (Meyer et al., 1968) (Fig. 2). The spatial over-lap of the pre-Main stage and Main stage mineralization sug-gests that the two events are related; however, Main stageveins always cut pre-Main stage veins, and the genetic rela-tionship between the two stages remains the subject of somedebate. This study concentrates on pre-Main stage veins; how-ever, a few Main stage veins were analyzed for completeness.
Mine exposures and deep drilling reveal that pre-Mainstage mineralization at Butte consists of two internally zoneddomes of Cu and Mo mineralization that are both about 2 kmin diameter (Reed, 1999; Reed and Rusk, 2001) (Fig. 3). The
310 RUSK ET AL.
0361-0128/98/000/000-00 $6.00 310
Tlcv
Tlci
Kbqm
Trdi
Qal
ATsMainStage Veins
BerkeleyPit 1995
ContinentalPit 1995
Tlcv
Tlci
a
a
a
a
Qal
Qal
Kbqm
Kbqm
BigButte
Con
tinen
tal F
ault
Kle
pper
Fau
lt
Kqp
United StatesCanada
AlbertaB.C.
Was
hing
ton
Ore
gon
Idaho
Montana
Butte
50°
45°
49°
48°
47°
46°
44°
118° 114° 110°
Kqp
Tlcri
Tlcri
Qal
Ts
Tlci
Tlcv
Trdi
Kqp
aKbqm
Alluvium
Clastic sedimentary rocks
Lowland Creek rhyolite dikes
Lowland Creek ignimbrite vent
Lowland Creek Volcanics
Rhyodacite dike
Main Stage veins
Quartz porphyry dikes
Butte Quartz Monzonite, aplite,granoaplite, and pegmatite (a)
1 mile1 kilometer
112° 35´ 112° 30´
46°
05´
46°
00´
112° 35´
112° 30´
FIG. 1. Location map and regional geologic setting of the Butte district, modified from Houston (2002), Proffett (1973),and unpublished reports of the Anaconda Company. The porphyry Cu deposit lies entirely within the Butte Quartz Mon-zonite and related aplites, granoaplites, and pegmatites.
MAGMATIC-HYDROTHERMAL FLUID EVOLUTION IN THE BUTTE PORPHYRY Cu-Mo DEPOSIT, MONTANA 311
0361-0128/98/000/000-00 $6.00 311
Co
nti
nen
tal F
ault
Big Butte
Berkeley Pit Continental Pit
Syndicate
StateState
Jessie
Skyrme
High Ore
Edith May
Black Rock
Rising Star
Gambrinus
OriginalAnaconda
Gannon South
Bonner Steward
Alice-Rainbow
AnacondaDome
PittsmontDome
2000 ft
N
1000m
Pervasivesericitic alteration
1, 1A
7
2
11
6
3
104
8
5
K
MCHO
B
S
L2
Be
P4P4
A
A’
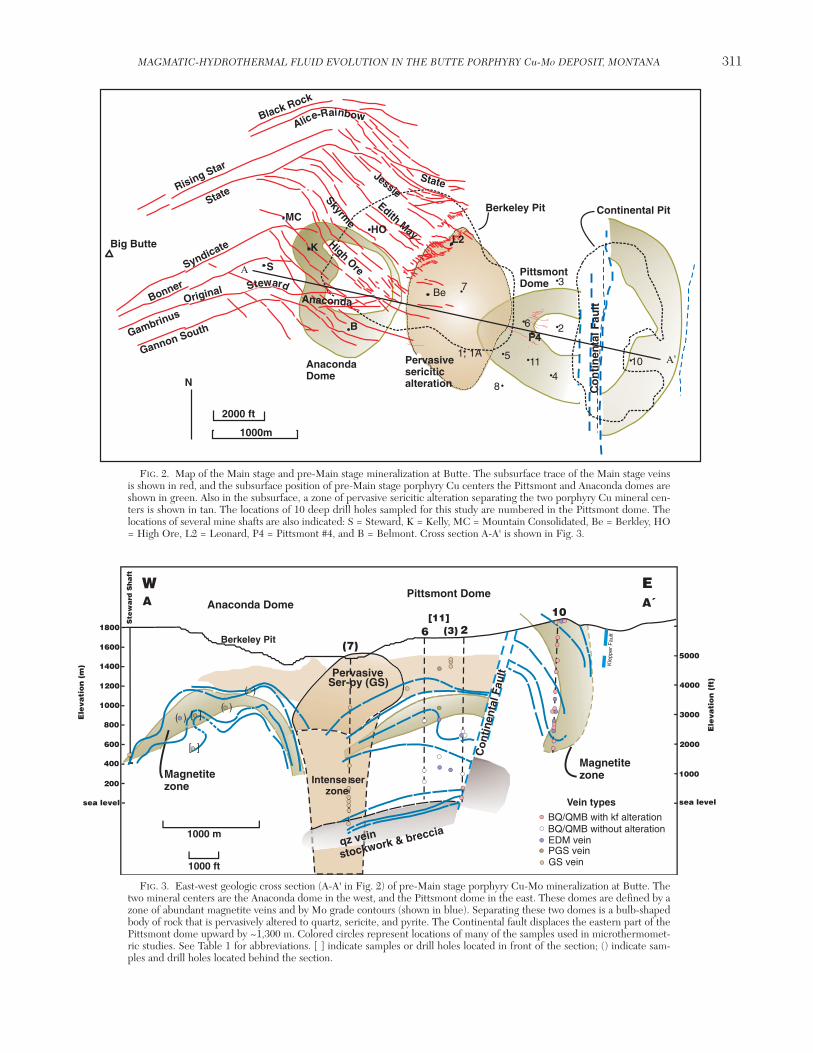
FIG. 2. Map of the Main stage and pre-Main stage mineralization at Butte. The subsurface trace of the Main stage veinsis shown in red, and the subsurface position of pre-Main stage porphyry Cu centers the Pittsmont and Anaconda domes areshown in green. Also in the subsurface, a zone of pervasive sericitic alteration separating the two porphyry Cu mineral cen-ters is shown in tan. The locations of 10 deep drill holes sampled for this study are numbered in the Pittsmont dome. Thelocations of several mine shafts are also indicated: S = Steward, K = Kelly, MC = Mountain Consolidated, Be = Berkley, HO= High Ore, L2 = Leonard, P4 = Pittsmont #4, and B = Belmont. Cross section A-A' is shown in Fig. 3.
Magnetite zone
Magnetitezone
PervasiveSer-py (GS)
Intense ser zone
qz vein
stockwork & breccia
sea level
Con
tinen
tal F
ault
1800
1000E
leva
tio
n (
ft)
1200
1400
1600
200
400
600
800
Kle
pper
Fau
lt
Ste
wa
rd S
ha
ft
1000 ft
1000 m
Berkeley Pit
W EAnaconda Dome
Pittsmont Dome
(7)6 2
10A A´
5000
4000
3000
2000
1000
sea level
Ele
vati
on
(m
)
(3)[11]
BQ/QMB with kf alterationBQ/QMB without alterationEDM veinPGS veinGS vein
[ ]
[ ]( )( )
( )
Vein types
FIG. 3. East-west geologic cross section (A-A' in Fig. 2) of pre-Main stage porphyry Cu-Mo mineralization at Butte. Thetwo mineral centers are the Anaconda dome in the west, and the Pittsmont dome in the east. These domes are defined by azone of abundant magnetite veins and by Mo grade contours (shown in blue). Separating these two domes is a bulb-shapedbody of rock that is pervasively altered to quartz, sericite, and pyrite. The Continental fault displaces the eastern part of thePittsmont dome upward by ~1,300 m. Colored circles represent locations of many of the samples used in microthermomet-ric studies. See Table 1 for abbreviations. [ ] indicate samples or drill holes located in front of the section; () indicate sam-ples and drill holes located behind the section.

two domes, the Anaconda in the west and the Pittsmont in theeast, are defined by a zone of abundant magnetite-bearingveins and by Mo grade contours. Separating these two domesis a bulb-shaped zone, up to 1.2 km wide, of intense pyriticveining and pervasive gray sericitic alteration. The zone ofpervasive gray sericitic alteration extends below the level ofdeepest drilling at a depth of more than 2 km below the bot-tom of the Berkeley Pit.
Both domes are concentrically zoned with widely overlap-ping shells of alteration bordering centimeter-scale stockworkveins. The same vein and alteration types and vein-cutting re-lationships are observed in both domes. The innermost con-centric zone of mineralization, which is observed only in thedeepest drilling of the Pittsmont dome, consists of a stockworkof barren quartz veins with minor molybdenite and thin K-feldspar alteration haloes. Also abundant in this zone are nu-merous centimeter-scale, discontinuous, irregular aggregatesand pods of quartz in intensely sericitized Butte Quartz Mon-zonite and quartz porphyry (Fig. 4K). This core of barrenquartz veins may be present in the Anaconda dome as well,but mine workings and drill holes do not penetrate deeplyenough to reveal it. Upward and outward from the barrenquartz vein stockwork, but below the bulk of chalcopyrite andmagnetite mineralization, molybdenite grades are highest.This region is characterized by quartz-dominated veins con-taining a few percent molybdenite and no alteration. Theseveins cut early dark micaceous veins (Meyer, 1965; Brimhall,1977), which consist of quartz-chalcopyrite-pyrite veins withbiotite-K-feldspar-sericite-quartz alteration veins from thenext outward zone. Early dark micaceous alteration yields up-ward to a 300-m-thick shell of abundant quartz-chalcopyrite-magnetite-pyrite veins with K-feldspar, chlorite, quartz, andpale-green sericitic alteration envelopes (Reed, 1999; Reed etal., 2005). Both early dark micaceous and pale-green sericiticveins are cut by barren quartz and quartz-molybdenite veinsin the two domes. Above the zone of abundant quartz-chal-copyrite-magnetite-pyrite veins is the sparse gray sericitezone where pyrite-quartz veins have alteration envelopesdominated by quartz, sericite, and pyrite (Reed, 1999; Geigeret al., 2002; Rusk and Reed, 2002). Pyrite-quartz veins withsericitic alteration cut all other pre-Main stage vein types inboth domes and in the central pervasively sericitized bulb(Fig. 3). In the outermost zone, veins contain pyrite, spha-lerite, galena, rhodochrosite, chalcopyrite, and epidote in K-feldspar–bearing propylitic alteration. The age relationshipsand distribution of propylitic veins and alteration are poorlystudied. Most Main stage veins are above and west of theAnaconda dome (Fig. 2).
In the eastern part of the deposit, the north-striking, 55°west-dipping, postore Continental fault normally offsets thePittsmont dome by approximately 1,250 m (Meyer et al., 1968;Ratcliff, 1973; Reed, 1999). One deep drill hole was collaredin the upthrown Continental block east of the fault (DDH 10,Fig. 3). Including the 1,250 m of throw on the fault, the bot-tom of this hole reaches an equivalent depth of ~2,600 mbelow the surface west of the Continental fault. Rocks fromthe drill hole east of the Continental fault were only locally af-fected by later, cooler fluids that overprinted much of the de-posit west of the Continental fault. Few pyrite-quartz or Mainstage veins exist in the lower 1,000 m of this drill hole.
Veins and Wall-Rock Alteration
Early dark micaceous veins
Early dark micaceous veins (Fig. 4F, G; Table 1) are quartz-sulfide veins with alteration envelopes containing biotite, K-feldspar, quartz, and sericite (Meyer, 1965; Roberts, 1975;Brimhall, 1977). Pyrite, chalcopyrite, and magnetite are pre-sent in these veins, but are more common in the alterationenvelopes. At moderate and shallow depths, early dark mica-ceous veins are the earliest vein type recognized. Here, thedistinction between early dark micaceous veins and barrenquartz and quartz-molybdenite veins is clear; early dark mi-caceous veins contain chalcopyrite and have wide alterationenvelopes, whereas barren quartz and quartz molybdeniteveins have little or no chalcopyrite or alteration envelopes.However, deep in the quartz-rich core of the deposit, the dis-tinction between the two vein types is vague. Here, early darkmicaceous veins are quartz dominated, chalcopyrite poor, andsome contain anhydrite, K-feldspar, and/or molybdenite. Likebarren quartz and quartz-molybdenite veins from this depth,alteration envelopes around these veins are less than a fewmillimeters in width and, in addition to the minerals men-tioned above, some contain anhydrite, corundum, andalusite,and plagioclase of two compositions (An22-An30 and An1-An7,possibly reflecting the peristerite gap). Some deep, early darkmicaceous veins cut some deep barren quartz and quartz-molybdenite veins, a relationship not observed at shallowerdepths.
In moderate and shallow early dark micaceous alterationenvelopes, alteration envelopes are typically a few centime-ters in width, sericite is more abundant, and anhydrite, corun-dum, and plagioclase are not observed. Shallower early darkmicaceous veins typically contain more pyrite, chalcopyrite,and magnetite, both in the vein and in the alteration enve-lope, than do deep, early dark micaceous veins.
Pale-green sericitic veins
Upward and outward from early dark micaceous-type veins,but also overlapping with them, are veins containing mag-netite, chalcopyrite, pyrite, and quartz, bordered by alterationenvelopes dominated by K-feldspar, quartz, green sericite,chlorite, and minor calcite (Fig. 4H). Such veins are referredto as “pale green sericitic” veins (Reed, 1999; Reed and Rusk,2001). Pale-green sericitic veins typically contain more than50 vol percent opaques; more than do early dark micaceous orquartz-molybdenite veins. Pale-green sericitic veins also havewider alteration envelopes than other vein types, commonlyextending more than 5 cm on each side of the vein. Pale-green sericitic veins are the upward extension of early darkmicaceous veins and the transition from early dark mica-ceous- to pale-green sericitic-type alteration envelopes hasbeen observed in underground mapping. Pale-green sericiticveins are abundant at moderate to shallow depths, and theyare rare in the deep quartz-rich core of the deposit. Earlydark micaceous and pale-green sericitic veins coincide withthe zone of highest pre-Main stage Cu grade.
Barren quartz and quartz-molybdenite veins
The majority of barren quartz veins are deeper than themajority of quartz-molybdenite veins, and the majority of
312 RUSK ET AL.
0361-0128/98/000/000-00 $6.00 312

MAGMATIC-HYDROTHERMAL FLUID EVOLUTION IN THE BUTTE PORPHYRY Cu-Mo DEPOSIT, MONTANA 313
0361-0128/98/000/000-00 $6.00 313
FIG. 4. Vein and alteration types from Butte (west of Continental fault, unless noted). A) Deep quartz vein with early darkmicaceous (EDM) alteration from east of the Continental fault. B) Deep, barren quartz vein with pink anhydrite and K-feldspar alteration from east of the Continental fault. C) Deep quartz-molybdenite vein with K-feldspar alteration from eastof the Continental fault. D) Deep quartz-molybdenite vein with minor early dark micaceous alteration (vertical vein) cut bya barren quartz vein with minor K-feldspar alteration (top of sample), but cutting another barren quartz vein with K-feldsparalteration (bottom of sample). E) Deep, barren quartz veins with minor K-feldspar alteration. F) Quartz-molybdenite veinwith no alteration from moderate depth cutting a quartz-rich early dark micaceous vein. G) Quartz-chalcopyrite vein withearly dark micaceous alteration from intermediate depth. H) Magnetite-chalcopyrite-pyrite vein with pale-green sericitic(PGS) alteration from intermediate to shallow depths. I) Pyrite-quartz vein with gray sericitic (GS) alteration from shallowdepth. J) Pyrite veins cutting a quartz-molybdenite vein in the zone of pervasive gray sericitic alteration. Gray sericitic alter-ation is destructive of original Butte Quartz Monzonite texture. K) Deep pyrite-quartz vein from the quartz stockwork deepin the zone of pervasive sericitic alteration. The original rock texture has been destroyed and hydrothermal quartz is abun-dant but not in well-defined veins. L) Peripheral Main stage vein containing galena, sphalerite, and rhodochrosite. M) Cen-tral zone Main stage vein containing covellite, pyrite, and enargite. All scale bars are 1 cm in length.

quartz-molybdenite veins are deeper than the majority ofearly dark micaceous veins. There is a continuous gradation inmolybdenite concentrations from veins termed “barrenquartz veins” to those termed “quartz-molybdenite veins.”Nearly all barren quartz veins contain minor amounts ofmolybdenite, and a barren quartz vein is defined as a quartz-dominated vein where molybdenite is not observable in handsample without a hand lens or microscope. In other respects,the two vein types are identical, and in some samples a bar-ren quartz vein may become a quartz-molybdenite veinwithin a few centimeters along the vein. We therefore refer tothem here as a single vein type, barren quartz–quartz-molyb-denite. Barren quartz and quartz-molybdenite veins cut eachother at all depths, and at moderate depths they cut pale-green sericitic and early dark micaceous veins. In deep sam-ples from the quartz-rich core of the deposit, a few early darkmicaceous veins cut barren quartz–quartz-molybdenite veins.At all depths, the latter type veins contain more than 95 volpercent quartz and less than 3 percent molybdenite. In addi-tion, veins of this type commonly contain purple anhydrite,K-feldspar, rutile hairs, and calcite, whereas these veins atmoderate depths contain only quartz, rutile hairs, and molyb-denite. Deep barren quartz–quartz-molybdenite and earlydark micaceous veins have a thin, K-feldspar lining separatingvein quartz from wall-rock minerals (Fig. 4A-C). The K-feldspar alteration is not apparent in shallower samples (Fig.4E, F).
Molybdenite in quartz-molybdenite veins commonly oc-curs in multiple bands within and parallel to bands of quartz,typically near the vein margins. In veins with the least amountof hydrothermal overprint, molybdenite grains touch anhy-drite, calcite, K-feldspar, or biotite. Pyrite and chalcopyrite,
where present, are commonly along discreet late fracturesdistinguished by cathodoluminescence. Several quartz-molybdenite veins have been identified with euhedral quartzprojecting into aplitic quartz and K-feldspar intergrowths inthe vein centers. Such vein dikes have been recognized inseveral porphyry-type deposits (White et al., 1981; Carten etal., 1988; Seedorff and Einaudi, 2004).
Gray sericitic veins
Pyrite-quartz veins (Fig. 4I, J) with gray sericitic alteration(gray sericitic veins) typically cut all of the above vein types.Most pyrite-quartz veins contain more than 80 vol percentsulfide; the highest percentage of all the pre-Main stageveins. Alteration envelopes contain muscovite, quartz, pyrite,and, in some samples, colorless (magnesian) chlorite.Cathodoluminescent images show that much of the quartz inthese veins is fractured and partially dissolved Butte QuartzMonzonite quartz and earlier vein quartz overgrown by eu-hedral quartz projecting into pyrite (Rusk and Reed, 2002).Gray sericitic veins are common above the magnetite zonewhere early dark micaceous and barren quartz–quartz-molyb-denite veins are rare. Gray sericitic veins also dominate thecentral “bulb” of pervasive quartz-sericite-pyrite alterationbetween the Pittsmont and Anaconda domes. In this region,gray sericitic envelopes on closely spaced pyrite veins coa-lesce so that the entire volume (1 km3) of Butte Quartz Mon-zonite is altered to quartz, sericite, and pyrite (Fig. 3).
Main stage veins
Main stage veins are several centimeters to several meterswide and cut all other vein types. Some are laterally continu-ous for over 7 km across the district and were mined to depths
314 RUSK ET AL.
0361-0128/98/000/000-00 $6.00 314
TABLE 1. Paragenetic Sequence of Vein Types and Alteration Minerals Based on Petrography and Crosscutting Relationships
Added alteration Relict igneousVein type Vein minerals1 minerals minerals2 Timing Location
Early dark qz, kf, cp, ± bi, ser, kf plag, kf, mt Cut by BQ/QMB, GS, and MS Most abundant at intermediate micaceous (anh, mb, py, mt, cp, py, ± at most depths. Cuts BQ/QMB depths above BQ/QMB (EDM) mt, ca, rut) (plag, and, cor, at great depth. Contemporaneous and below PGS
ca, anh) with dike intrusion A few deep EDM veins exist
Pale green mt, cp, py, plag, ser, chl, kf Cut by BQ/QMB, GS, and MS Upward and outward from sericitic qz, ca, ± py, ca, cp, kf EDM veins(PGS) (mb, kf, rut) Not common at depth
Below most GS veins
Barren quartz/ qz,±(anh, mb, kf, ca, anh, qz, kf, plag, Most cut EDM and PGS veins Dominant vein type at great depthQuartz- kf, ca, rut) bi, or none mt, bi Cut by a few deep EDM veins Less common at intermediate depthsmolybdenite Cut by GS and MS veins Not common at shallow depthsBQ/QMB
Gray sericitic py, qz, ±(rut) ser, py, chl, qz GS veins cut all above vein types Mostly shallow; upward and outward(GS) from PGS. Present at all depths in
the pervasively altered GS zone
Main stage cv, en, bn, sl, gn, ser, qz, kaol, py Always cut all other vein types Mostly shallow(MS) rc, py, cp, qz, complex, see
and many others Meyer et al., 1968
1 Mineral abbreviations are as follows: andalusite = and, anhydrite = anh, apatite = ap, biotite = bi, bornite = bn, calcite = ca, chalcopyrite = cp, chlorite =chl, covellite = cv, enargite = en, galena = gn, hornblende = hbl, K-feldspar = kf, kaolinite = kaol, magnetite = mt, molybdenite = mb, plagioclase = plag,pyrite = py, quartz = qz, rhodochrosite = rc, rutile = rut, sericite = ser, sphalerite = sl, zircon = zr
2 Relict zr, ap, and qz in all alteration types

of greater than 1.5 km (see Meyer at al., 1968, for descrip-tions). Butte Quartz Monzonite adjacent to these veins is al-tered to advanced argillic, sericitic, and intermediate argillicmineral assemblages (Sales and Meyer, 1948; Meyer andHemley, 1967). On a deposit scale, Main stage mineralizationis zoned from an interior Cu-rich zone, through an interme-diate Cu-Zn zone, to a peripheral Mn, Pb, Zn, and Ag zone(Meyer et al., 1968) (Fig. 4L, M).
Fluid Inclusion Petrography
Fluid inclusion assemblages
Interpretation of fluid inclusions in porphyry Cu deposits isdifficult because superposition of multiple stages of fractur-ing, fluid flow, and mineralization obscures timing relation-ships among vein minerals, alteration minerals, and fluid in-clusion populations, also obscuring the source and evolutionof hydrothermal fluids. Multiple hydrothermal stages juxta-pose fluid inclusions trapped from chemically, physically, andtemporally distinct fluids in a single vein. Petrographic stud-ies and SEM-cathodoluminescence imaging were employedto decipher the complex relationships between fluid inclu-sions and the minerals in which they are trapped (Rusk andReed, 2002; Rusk, 2003; Rusk et al., 2006).
Petrographic studies and inclusion analyses focused onfluid inclusion assemblages (Goldstein and Reynolds, 1994).A group of inclusions were trapped synchronously and there-fore represent a true fluid inclusion assemblage if the inclu-sions were trapped along the same primary growth zone inquartz, or along the same healed fracture. At Butte, as in mostporphyry Cu deposits, it is difficult to identify fluid inclusionsin vein quartz that meet the above criteria. In pre-Main stageveins, quartz with euhedral growth zones is rare and fluid in-clusions located along primary growth zones in euhedralquartz are extremely rare. The vast majority of fluid inclu-sions occur in scattered groups and clusters without unam-biguous evidence for contemporaneous trapping. Most inclu-sions measured in this study occur in groups or clusters ofinclusions containing similar liquid-to-vapor ratios in a singlegrain or in several nearby grains of quartz. Where groups orclusters of inclusions exhibit similar heating and freezing be-havior, we infer that they were trapped from similar fluidsunder similar conditions and so have a common origin.
Fluid inclusion types
On the basis of phases present at room temperature, wedistinguish six types of fluid inclusions at Butte, classified astypes B35, B60, B15H, B85, and B20. In this classificationsystem, the letter “B” denotes “bubble,” and the number in-dicates the average volume percent occupied by the bubble(vapor) in inclusions of that type. The letter “H” refers to thepresence of halite as a daughter mineral. B20 fluid inclusionsare divided into B20 and B20MS, which refers to whetherthese inclusions occur in pre-Main stage veins or Main stageveins, respectively. Further subdivision based on daughtermineral assemblages or vein types is possible using this clas-sification system, but such subdivisions are not necessaryhere.
B35 fluid inclusions contain liquid and a vapor bubble thatoccupies 30 to 50 vol percent of the inclusion and lacks halite
daughter minerals at room temperature (Fig. 5A, H, K).These inclusions are typically the shape of negative quartzcrystals or rounded rectangles. Approximately 20 percent ofB35 inclusions contain an opaque and/or a transparentdaughter mineral, and a few contain up to four daughterminerals. The most common daughter mineral is opaque andtriangular in cross section, identified by SEM-EDS in manyopened inclusions as Cu-Fe sulfide, most likely chalcopyrite(also identified by Roberts, 1975). Transparent daughterminerals (or possibly trapped solids) identified with EDS in-clude K-feldspar, anhydrite, and calcite. Rutile and ironoxide were also identified in B35 fluid inclusions; however,daughter minerals of molybdenite were never identified. NoB35 daughter minerals homogenized even when the inclu-sion was heated past its expected homogenization tempera-ture for several minutes. This suggests that H2 leaked fromthe inclusions after entrapment (Mavrogenes and Bodnar,1994). B35 inclusions were rarely identified as primary alongeuhedral growth zones of quartz or as secondary or pseu-dosecondary along healed fractures. Instead, most B35 inclu-sions are densely scattered across multiple quartz grains orare grouped in clusters in individual quartz grains.
B60 inclusions contain liquid and 50 to 75 vol percent vaporat room temperature and typically have negative crystalshapes or are equant (Fig. 5B). About 15 percent contain oneor two opaque daughter minerals, and a few contain one ortwo transparent daughter minerals. Daughter minerals iden-tified by SEM-EDS include Cu sulfides, Cu-iron sulfides,zinc sulfides, and muscovite. There is a continuous gradientin bubble size between B35 and B60 inclusions; therefore,distinguishing between B35 inclusions and B60 inclusions atroom temperature is sometimes difficult. Like B35 inclusions,B60 inclusions are clustered, scattered variably (Fig. 5I, L),and occur less commonly along secondary or pseudosec-ondary trails.
B15H inclusions contain liquid plus 10 to 20 vol percentvapor plus halite at room temperature (Fig. 5C, F). Rarely,B15H inclusions contain up to five daughter minerals besideshalite; however, in contrast to many porphyry Cu deposits(Alumbrera, Bingham, Santa Rita, Red Mountain, and others)most B15H inclusions from Butte contain no other daughterminerals in addition to halite. Also in contrast to other por-phyry Cu deposits, B15H inclusions from Butte rarely containsylvite or any other phase that dissolves upon heating to andbeyond the homogenization temperature of halite. Less than5 percent of B15H inclusions contain a red hexagonalhematite daughter mineral or a tetrahedral opaque chalcopy-rite crystal. B15H inclusions are nearly always in quartz thatalso contains B85 inclusions (Fig. 5C), and a few unambigu-ous trails of B15H and B85, trapped simultaneously, wererecognized. Nonetheless, most trails or clusters contain onlyone inclusion type or the other. Like the other inclusiontypes, B15H inclusions are commonly scattered variably invein and igneous quartz.
B85 inclusions contain more than 75 vol percent vapor atroom temperature (Fig. 5C). A few B85 inclusions contain anopaque or a transparent daughter mineral; however, daughterminerals could not be positively identified optically or withSEM-EDS. B85 inclusions are most abundant in quartz thatalso contains B15H inclusions; however, some are present
MAGMATIC-HYDROTHERMAL FLUID EVOLUTION IN THE BUTTE PORPHYRY Cu-Mo DEPOSIT, MONTANA 315
0361-0128/98/000/000-00 $6.00 315

316 RUSK ET AL.
0361-0128/98/000/000-00 $6.00 316
Fig. 5. Transmitted light photomicrographs of Butte fluid inclusions. A) B35 fluid inclusion containing ~35 vol percentbubble and a triangular opaque daughter mineral which is likely chalcopyrite (cp). B) B60 inclusion containing ~60 vol per-cent bubble and an unidentified opaque daughter mineral (op). C) Vapor-rich B85 fluid inclusions and halite-bearing B15Hfluid inclusions. Rarely, brine and vapor inclusions coexist on the same healed fracture, but more commonly the inclusionsappear scattered and healed fractures are not obvious. D) B20 fluid inclusions, many containing a single opaque daughtermineral. E) Primary B20MS inclusions trapped along quartz growth zones in a Main stage vein. F) A large B15H inclusiontrapped near several high salinity B20 inclusions. G) Primary fluid inclusions trapped along growth zones in euhedral quartzfrom a Main stage vein. H) Primary B35 fluid inclusions and small chalcopyrite crystals trapped in quartz projecting into chal-copyrite. I) Low-power image of a quartz crystal in a barren quartz vein from deep in the zone of pervasive sericitic alter-ation. B60 Fluid inclusions are very abundant and are not distributed along primary growth zones or along secondary trailsas is typical of inclusions from Butte and many other porphyry Cu deposits. J) Enlargement of G. K) Enlargement of H. L)Enlargement of I.

where B15H inclusions are lacking. B85 inclusions are typi-cally scattered or in clusters within quartz grains.
B20 inclusions contain liquid and 10 to 30 vol percent vaporat room temperature (Fig. 5D). About 10 percent of B20 in-clusions in pre-Main stage veins contain one opaque daugh-ter mineral; a few contain up to three opaque or transparentdaughter minerals. Equant and rectangular B20 inclusionsare commonly scattered thinly and randomly throughout avein. In deep veins, irregularly shaped B20 inclusions arecommon in planar trails. These lack daughter minerals andare secondary in origin.
B20MS inclusions are similar in appearance to B20 inclu-sions, but none was observed to contain opaque daughterminerals, and only a few contain transparent daughter miner-als. B20MS inclusions occur as both secondary inclusions alongplanar trails and primary inclusions trapped along quartzgrowth zones in Main stage veins (Fig. 5E, G, J).
Deposit-scale distribution of fluid inclusions
The distribution of inclusion types throughout the depositreflects the processes that led to mineral precipitation andwall-rock alteration. We examined the distribution of fluid in-clusion types to determine the relationships between trappedfluids and vein and alteration types, as well as the time andspace relationships among various fluids. The estimatedabundance of each type of inclusion in 38 samples is shown inTable 2, along with the vein and alteration type, sample loca-tion, and the Cu, Mo, and Ag grade of the interval from which
the sample came. The general pattern of fluid inclusion dis-tribution relative to alteration zones and vein types can be inferred from Table 2 and is illustrated in Figure 6. Fluid in-clusion distribution is similar in both the Pittsmont and Ana-conda domes. All stated depths refer to fault-correcteddepths beneath the present surface west of the Continentalfault. Fluid inclusion abundance estimates have relativelylarge uncertainties owing to the abundance of inclusions inmost samples and the difficulty of estimating bubble size insmall inclusions. B60 and B85 inclusions are typically largerthan B35 inclusions, and B15H and B20 inclusions are typi-cally smaller. Furthermore, a B35 or B20 inclusion, viewed onend, appears to be a B60 or B85 inclusion, but the reverse isnot likely.
B35 inclusions dominate in veins from the deepest samplesrecovered, from about 1,600 m below the present surface tothe bottom of the deepest drilling (~2,600 m), except in thepervasively altered sericitic zone, where B60 inclusions dom-inate at all drilled depths. At depths greater than 1,600 m,deep, early dark micaceous and barren quartz–quartz-molyb-denite veins dominate, and B35 inclusions constitute morethan 95 percent of all inclusions. B35 inclusions are far lesscommon in all vein types at depths less than ~1,000 m, whereB85 and B60 inclusions dominate and B15H inclusions arecommon (Fig. 6).
B60 inclusions are rare east of the Continental fault, al-though a few were identified in a sample where a graysericitic vein cuts a quartz-molybdenite vein. B60 inclusions
MAGMATIC-HYDROTHERMAL FLUID EVOLUTION IN THE BUTTE PORPHYRY Cu-Mo DEPOSIT, MONTANA 317
0361-0128/98/000/000-00 $6.00 317
? ? ?
Pervasive GS
Intense GS
Barren quartz vein stockwork and
breccia
5000
4000
3000
2000
1000
Sealevel
W E
magnetite zone
1000 ft
1000 m
GS veins
PGS veins
EDM veins
Quartz veins ( Mb) with Kf alteration±
Quartz veins ( Mb) with no alteration±
Current surfaceC
ontin
enta
l Fau
lt
Pyr
ite-d
omin
ated
vei
nsM
t, cp
, py,
qz
vein
sQ
uart
z-do
min
ated
vei
ns
Sparse GS
QMB
EDM
PGS
Lower limit of brine inclusions
Dee
pM
oder
ate
Sha
llow
AlterationB35
B60
B15H
B85
B20
EDM
Qz-Mb
Magnetite zone
Sparse GS
1800 mBerkeley Pit
1200 m
1400 m
1600 m
400 m
600 m
800 m
1000 m
Sealevel
200 m
elev
atio
n (
m)
elev
atio
n (
ft)
deepest drilling
FIG. 6. Deposit-scale distribution of fluid inclusions and vein and alteration types prior to displacement of the Continen-tal fault. Pie graphs show the abundance of each inclusion type estimated in individual samples with different alteration stylesfrom various depths. The lower limit of B15H inclusions is indicated by the thick black line. Below the line, B15H inclusionsare absent and B35 and/or B60 inclusions dominate all samples. The distribution of fluid inclusions is represented byschematic diagrams of fluid inclusion types.

dominate in gray sericitic veins from all locations in the de-posit. B60 inclusions are also abundant in early dark mica-ceous and barren quartz–quartz-molybdenite veins fromdepths between ~1,200 and 1,600 m. In many of these veins,most inclusions range from B35 to B60, and B15H and B85inclusions are present but rare. B60 inclusions are present butare not dominant in pale-green sericitic veins at depths lessthan 900 m (Fig. 6).
B15H inclusions are rare at depths greater than ~1,600 m,where B35 inclusions dominate. Conversely, B15H inclusionsare more common in veins from depths less than ~1,000 m,where B35 inclusions are rare. B15H inclusions are more
common in magnetite-chalcopyrite-pyrite-bearing veins withpale-green sericitic alteration envelopes, and in early darkmicaceous veins from depths shallower than ~1,200 m, thanin any other vein type or location (Fig. 6). The samples withthe largest proportions of B15H inclusions are magnetite-dominated pale-green sericitic veins. Even so, these mag-netite-dominated veins, from both the Anaconda and thePittsmont domes, contain only ~5 to 8 percent B15H inclu-sions, with the majority of the inclusions being B85s andB60s. B15H inclusions are present in all pre-Main stage veintypes shallower than ~1,400 m, but they are not present inany Main stage vein from any depth. Most B15H inclusions
318 RUSK ET AL.
0361-0128/98/000/000-00 $6.00 318
TABLE 2. Deposit Scale Distribution of Fluid Inclusion Types Showing the Relative Abundance of Inclusions in 38 Selected Samples
Vein/ Depth below Cu grade1 Mo grade1 Ag grade1
Location Sample no. alteration type surface (m) wt% wt% oz/ton B35 B60 B15H B85 B20
East of CFPittsmont 11172-2756 qz/EDM 2148 0.15 0.047 NA 96 1 0 1 2Pittsmont bu96mr15 qz/EDM 1300 NA2 NA NA 90 5 0 3 2Pittsmont 8741-270 bi veinlets 1383 NA NA NA 90 5 0 3 2
Pittsmont 11172-3186 qz-mb/kf 2280 0.21 0.055 NA 97 tr 0 tr 3Pittsmont 11172-4187 qz-mb/kf 2588 0.09 0.030 NA 94 2 0 1 3Pittsmont 11172-513 qz-mb/kf 1458 0.13 0.041 0.058 97 tr 0 tr 3
West of CFPittsmont 11185-4842 qz/EDM 0 0.34 0.063 0.116 80 10 tr 5 5Pittsmont 11135-3618 qz/EDM 0 0.52 0.040 0.052 7 45 3 35 10Pittsmont 11185-3448 qz/EDM 0 0.29 0.040 0.095 9 40 1 45 5Anaconda 10772-5 mt-qz/EDM 741 (0.30)3 (0.005) NA tr tr 2 90 8
Pittsmont 11185-1797 qz-mt/PGS 0 0.27 0.008 0.052 5 10 2 80 3Anaconda 10961-766 mt-qz/PGS 621 0.26 0.007 0.092 3 23 7 60 7Anaconda 10530-407 mt-cp-py/PGS 682 0.36 (0.01) NA 2 35 5 53 5Pittsmont 11185-2091 mt-cp-qz/PGS 0 0.35 0.007 0.073 2 3 6 85 4Anaconda 10893-34 mt-cp-py/PGS 447 0.30 0.006 0.041 3 6 6 80 5
Pittsmont 11169-5286 qz/kf 0 0.25 0.035 0.180 97 tr 0 tr 3Pittsmont 11169-5061 qz-mb/kf 0 0.13 0.060 0.079 50 40 1 3 6Pittsmont 11169-4909 qz/kf 0 0.12 0.047 0.065 40 60 0 tr trPittsmont 11135-5149 qz/kf 0 0.11 0.041 0.017 32 60 tr 5 3Pittsmont 11135-4947 qz/kf 0 0.09 0.065 0.003 12 80 tr 5 3Pittsmont 11135-4326 qz/kf 0 0.32 0.045 0.024 15 80 tr 1 4Pittsmont 11135-3872 qz-mb/kf 0 0.55 0.026 0.662 17 50 3 10 20Pittsmont 11135-3618 qz-mb/kf 0 0.52 0.040 0.052 15 78 2 1 4Pittsmont 11166-5862 qz-mb/kf 0 0.18 0.031 0.092 70 25 tr tr 5Pittsmont 11185-4386 qz-mb/kf 0 0.26 0.064 0.070 20 75 1 1 3
Pervasive GS zoneCentral GS zone 10969-1849 py-qz/pervasive GS 0 0.16 0.002 0.031 13 40 2 25 20Central GS zone 11052-5705 py-qz/pervasive GS 0 0.17 0.041 0.013 30 30 tr 10 30Central GS zone 11052-6769 py-qz/pervasive GS 0 0.03 0.009 0.001 20 50 tr 10 10Central GS zone 11052-7023 qz/pervasive GS 0 0.02 0.007 0.000 5 85 0 5 5
Shallow GSPittsmont 11148-1141 py-qz/GS 0 0.11 <.001 0.036 1 40 1 40 18Pittsmont 11148-1302 py-qz/GS 0 0.12 <.001 0.035 1 50 1 35 13Pittsmont 11169-1306 py-qz/GS 0 0.15 <.001 0.018 5 50 1 35 9Anaconda 9201 py-qz/GS 1022 NA NA NA 20 30 tr 25 25Anaconda 10835-10 py-qz/GS 1113 NA (0.01) NA 10 50 5 20 15
Main stageCentral zone CZ-1 en-py-cv NA NA NA NA 0 0 0 0 100Central zone 10555-1 en-py-cv 115 NA NA NA 0 0 0 0 100Periphery 4927 rc-qz 120 NA NA NA 0 0 0 0 100Periphery 11172-3658 rc-py-qz 1126 0.29 0.061 0.029 0 0 0 0 100
Abbreviations as in Table 11 Average Cu, Mo, and Ag grade for the 20-m interval in which the sample lies 2 NA indicates that the data is not available3 Numbers in parentheses indicate approximate grades

occur in close proximity to B85 inclusions, and in a few sam-ples, vapor-rich and brine inclusions occupy the same healedfracture.
B85 inclusions are most abundant in veins from less than~900 m in both the Anaconda and Pittsmont domes and theyare rare in veins from depths greater than 1,200 m. They arethe dominant inclusion type in most pale-green sericitic veinsand are common in gray sericitic veins. Most occur in thesame veins as B15H inclusions, and assemblages containingonly B85 or only B15H inclusions were identified.
B20 inclusions occur in all vein types from all depths in thedeposit but do not dominate in any pre-Main stage vein type.East of the Continental fault, they occur only along secondarytrails, whereas west of the Continental fault, they are moreabundant in clusters and scattered throughout the sample.They are most abundant in gray sericitic veins but are subor-dinate in abundance to B60 and B85 inclusions. Cathodolu-minescence textures indicate that many B20 inclusions onsecondary trails in pre-Main stage veins are trapped alonghealed fractures of apparent Main stage origin (Rusk et al.,2006).
B20MS inclusions are both primary and secondary in quartz,fluorite, sphalerite, and rhodochrosite in Main stage veins. Noother inclusion type was observed in Main stage veins. Owingto the similar phase proportions of B20 and B20MS inclusions,it is impossible to determine at room temperature whetherB20 inclusions in pre-Main stage veins are from pre-Mainstage or Main stage mineralization.
Physical and Chemical Properties of Inclusions
CO2 content of fluid inclusions
We have identified substantial amounts of CO2 in B35,B60, B85, and B20MS inclusions, but none in B20 or B15H in-clusions. Liquid CO2 at room temperature was optically iden-tified in only two B35 inclusions from deep in the deposit.Measured melting temperatures of –56.6° ± 0.1°C in thesetwo inclusions and in three others in which a solid phaseformed upon cooling indicate that CO2 is the predominantgas. In inclusions with no visible CO2, cooling to –30° to–35°C formed clathrate in most B35, B60, and B85 inclu-sions. The presence of CO2 in B20MS inclusions also was indi-cated by the expansion of bubbles upon crushing in oil (Roed-der, 1984). Raman spectroscopy confirmed the presence ofCO2 in both B35 and B60 inclusions (the only types analyzed)in seven samples and that dissolved gases other than CO2 areminor in these inclusions. The 19 inclusions analyzed byRaman spectroscopy contain 3.1 to 7.8 mol percent CO2 (Fig.7), with no significant difference in CO2 content between B35and B60 inclusions.
Because the clathrate structure includes H2O but excludesNaCl, ice-melting temperature in the presence of clathrateresults in an overestimation of salinity by a factor of up tothree (Collins, 1979). Accurate estimates of salinity can be de-termined based on clathrate melting temperatures if the in-clusion contains CO2 liquid, CO2 vapor, and aqueous fluid ofunknown salinity at the temperature of clathrate melting(TmClathrate) (Larson, 1955; Takenouchi and Kennedy, 1965;Chen, 1972; Bozzo et al., 1975; and Collins, 1979). If no CO2
liquid is present at room temperature, but it condenses upon
cooling of the inclusion, then the homogenization tempera-ture of CO2 in the metastable absence of clathrate constrainsthe internal pressure of the fluid inclusion, so that the salinitycan be constrained (Diamond, 1992). With few exceptions,inclusions from Butte do not contain liquid CO2 at room tem-perature, nor do they condense liquid CO2 upon cooling.Such behavior complicates the determination of salinitybased on microthermometric measurements.
Dubussey et al. (1992) developed a technique to determinethe bulk properties of fluid inclusions that form clathrateupon cooling but contain no liquid CO2. The method of De-bussey et al. (1992) was modified slightly by Bakker et al.(1996) and incorporated into the computer program ICE(Bakker, 1997), which calculates salinity, density, and CO2
content of inclusions based on ice-melting temperatures,clathrate-dissolution temperatures, and an estimate of bubblevolume. Precise estimates of bubble volume are difficult be-cause of the variability of inclusion shape and orientation(Parry, 1986; Diamond, 1994; Bakker et al., 1996). Errors inestimating the bubble volume have a large effect on calcu-lated density (and therefore isochore slopes), and muchsmaller effects on CO2 content and salinity (compare Fig. 8A-C). Salinities, densities, and CO2 contents were calculatedusing ICE for B35, B60, and B85 inclusions.
Estimates of the bulk properties of fluid inclusions are pos-sible only where both TmICE and TmClathrate are measured inthe same inclusion, which accounts for only about 10 percentof all clathrate-bearing inclusions measured. Melting temper-atures of ice and clathrate were similar among all inclusions,whether both or just one of the phase changes—were ob-served. We infer, therefore, that bulk properties of inclusionsin which only one of the phase changes was observed are sim-ilar to the bulk properties of inclusions in which both phasechanges were observed.
For 98 of the 106 inclusions in which both phase changeswere observed, the CO2 contents calculated by ICE fallwithin the range measured with the Raman microprobe. MostCO2 contents predicted by ICE are within 1 mol percent ofthe values measured by Raman on the same inclusion (Fig. 9).
MAGMATIC-HYDROTHERMAL FLUID EVOLUTION IN THE BUTTE PORPHYRY Cu-Mo DEPOSIT, MONTANA 319
0361-0128/98/000/000-00 $6.00 319
0
1
2
3
4
5
6
7
Mol % CO2
B35 inclusions
B60 inclusions
1 2 3 4 5 6 7 8 9 10
Nu
mb
er o
f in
clu
sio
ns
FIG. 7. Histogram showing CO2 content of 19 B35 and B60 inclusionsanalyzed by Raman spectroscopy.

Microthermometry
B35 inclusions: Among B35 inclusions, 63 percent wereobserved to form clathrate upon cooling. Calculated CO2
contents of clathrate-bearing inclusions are 3 to 7 mol per-cent CO2 (Fig. 8).We assume that nonclathrate-bearing B35inclusions contain ~3 mol percent CO2. Clathrate in B35 in-clusions melts between 3° and 9°C (Fig. 10). In these sameinclusions, ice melts in the presence of clathrate between –2°and –8°C, corresponding to salinities in the range of 1 to 8 wtpercent NaCl equiv, with 75 percent having salinities be-tween 2 and 5 wt percent NaCl equiv (Figs. 10–12; Table 3).Salinities are between 0 and 6 wt percent NaCl equiv for
nonclathrate-forming B35 inclusions, assuming 3 mol per-cent CO2. Salinities calculated in the H2O-CO2-NaCl systemby the program ICE are about half of what is predicted in theH2O-NaCl system based only on melting temperatures ofice, which indicates that the recognition of clathrate in B35inclusions is important for accurate salinity determinations.Densities of B35 fluid inclusions in which both TmICE andTmClathrate were measured are between 0.67 and 0.72 g/cm3,with an average of 0.69 g/cm3 (Fig. 8). However, because thecalculated densities depend on estimated bubble size, whichvaries among inclusions categorized as B35 inclusions, densi-ties from 0.63 to 0.73 g/cm3 are likely.
All B35 inclusions homogenize to liquid between 300° and400°C, with a mean of 349°C; 88 percent homogenize be-tween 330° and 370°C (Fig. 10). Inclusions within individualclusters typically homogenize within 5° to 10° of one another.
B60 inclusions: Most B60 inclusions form clathrate uponcooling. Clathrate melting temperatures range from 2° to8°C. TmICE in the same inclusions ranges from –2° to –8°C(Fig. 10), corresponding to salinities of 1 to 8 wt percent NaClequiv with 74 percent having salinities between 1 and 5 wtpercent NaCl equiv (Figs. 10–12; Table 3). Calculated CO2
contents range from 4 to 9 mol percent CO2, and calculateddensities range from 0.43 to 0.49 g/cm3 (Fig. 8). Actual den-sities of B60 inclusions range from near 0.4 to 0.55g/cm3 forinclusions with bubbles slightly more or less than 60 vol per-cent (compare Fig. 8A-C).
B60 inclusions homogenize to liquid, to vapor, and by crit-ical behavior between 356° and 452°C (avg of 384°C: Fig.10 and Table 3). An entire cluster of B60 inclusions may
320 RUSK ET AL.
0361-0128/98/000/000-00 $6.00 320
35 volume % bubble
0
2
4
6
8
10
-10 -8 -6 -4 -2 0
85 volume % bubble
0
2
4
6
8
10
-10 -8 -6 -4 -2 0
60 volume % bubble
0
2
4
6
8
10
-10 -8 -6 -4 -2 0
.
10 mol% CO2
9
87
6
5
0.43
0.450.47 g/cm3
1 wt% NaCl23456
6 mol % CO2
5
4 3
0.67g/cm3
0.68
0.690.710.72
1 wt %NaCl
234567
0.70
17 mol% CO2
1615141312
11 10
0.19
0.20
0.21 g/cm3
1 wt% NaCl234
B
A
C
Tm (°C)ICE
Tm
(°C
)C
LA
Tm
(°C
)C
LA
Tm
(°C
)C
LA
Wt % NaClDensity (g/cm )3Mol % CO2
FIG. 8. Temperatures of ice melting (TmICE) and clathrate melting (Tm-Clathrate) for A) B35 inclusions, B) B60 inclusions, and C) B85 inclusions.Based on measured melting temperatures of ice and clathrate, and visual es-timation of bubble volume in the inclusion, bulk inclusion properties werecalculated using the program ICE (Bakker, 1997). Filled diamonds representall inclusions in which both ice and clathrate were observed to melt (exceptin B85 inclusions; see text). Diagrams are contoured for salinity, CO2 content,and bulk density, assuming 35, 60, and 85 vol percent bubble (see text for iso-pleth source). Comparison of the three graphs shows the effect of fluid in-clusion bubble volume on calculation of bulk properties.
0
1
2
3
4
5
6
7
8
0 2 4 6 8Mol % CO2 (measured by Raman)
Mol
% C
O (
Cal
cula
ted
with
ICE
)2
FIG. 9. Comparison of CO2 content calculated from microthermometricdata using the program ICE, and CO2 content measured by Raman spec-trometry in the same inclusion (see text). The diagonal shows a 1:1 correla-tion. Most calculated CO2 contents fall within 1 mol percent of measuredCO2 contents.

MAGMATIC-HYDROTHERMAL FLUID EVOLUTION IN THE BUTTE PORPHYRY Cu-Mo DEPOSIT, MONTANA 321
0361-0128/98/000/000-00 $6.00 321
B60 inclusions
0
50
100
150
200
250liquid
vapor
critical
n=813
B85 inclusions
05
101520253035
vaporn=138
B35 inclusions
0100
200300400500
600700
liquid
n=1970
B35 inclusions
0
20
40
60
80
100
120
-8 -6 -4 -2 0 2 4 6 8 10
n=574
IceClathrate
B60 inclusions
0
5
10
15
20
25
30
-8 -6 -4 -2 0 2 4 6 8 10
n=147IceClathrate
B85 inclusions
0
1
2
3
4
5
6
-8 -6 -4 -2 0 2 4 6 8 10
n=10 IceClathrate
B20 inclusions
02468
1012141618
deepsecondariesothers
n=152
02
468
10
1214
Homogenization Temperature (°C)
n=55
liquid
B20 inclusionsMS
0
5
10
15
20
25
-5 -4 -3 -2 -1 0
Melting Temperature (°C)
n=25
B20 inclusions
02468
101214161820
deepsecondariesothers
n=90
Nu
mb
er o
f in
clu
sio
ns
Nu
mb
er o
f in
clu
sio
ns
Nu
mb
er o
f in
clu
sio
ns
Nu
mb
er o
f in
clu
sio
ns
Nu
mb
er o
f in
clu
sio
ns
B20 inclusionsMS
200
250
300
350
400
450
500
550
600
200
250
300
350
400
450
500
550
600
200
250
300
350
400
450
500
550
600
200
250
300
350
400
450
500
550
600
200
250
300
350
400
450
500
550
600
-30
-26
-22
-18
-14
-10 -6 -2
FIG. 10. Histograms showing melting temperatures of ice and clathrate in ~700 B35, B60, B85, B20, and B20MS inclu-sions and homogenization temperatures to liquid, vapor, or by critical behavior of over 3,000 B35, B60, B85, B20, and B20MS
inclusions. These results are compiled from microthermometric measurements of approximately 50 samples.

homogenize to liquid, to vapor, or by near-critical behavior, butmore commonly, all three behaviors of homogenization areobserved in a single cluster of inclusions. In inclusions that ho-mogenize by critical behavior, the bubble maintains a constantsize upon heating, until the meniscus that separates the vaporfrom the liquid fades away over a range of about 5°C. ManyB60 inclusions homogenize with near-critical behavior, eitherto liquid or to vapor. In each case, little change is observedin bubble size until within 5° to 15°C of homogenization, at
322 RUSK ET AL.
0361-0128/98/000/000-00 $6.00 322
B15H inclusions
0
10
20
30
40
50
Wt % NaCl equiv
B60 inclusions
0
2
4
6
8
10
0 1 2 3 4 5 6 7 8 9 10
B35 inclusions
0
5
10
15
20
25
0 1 2 3 4 5 6 7 8 9 10
B85 inclusions
0
1
2
3
4
5
0 1 2 3 4 5 6 7 8 9 10Wt % NaCl equiv
B20 inclusionsMS
0
5
10
15
20
1 2 3 4 5 6 7 8 9 10
B20 inclusions
0
5
10
15
20
deepsecondariesothers
Nu
mb
er o
f in
clu
sio
ns
Nu
mb
er o
f in
clu
sio
ns
Nu
mb
er o
f in
clu
sio
ns
0 4 8 12 16 20 24 28
26 30 34 38 42 46 50
FIG. 11. Histograms showing calculated salinity of all inclusion types. ForB35 and B60 inclusions, salinities are only shown for inclusions where bothclathrate- and ice-melting temperatures were observed in single fluid inclu-sions, which accounts for only about 10 percent of all inclusions measured.The narrow range of ice- and clathrate-melting temperatures measured indi-cates that salinities are likely similar for inclusions where only one of thesephase changes was observed.
0
5
10
15
20
25
30
35
40
45
50
200 250 300 350 400 450 500 550
Homogenization Temperature (°C)
B35B6015HB85B20B20MS
Sal
init
y (w
t %
NaC
l eq
uiv
)
FIG. 12. Homogenization temperature versus salinity of individual inclu-sions from all inclusion types in which both measurements were made.Boxed, shaded regions show the entire range of salinities and homogeniza-tion temperatures measured for each inclusion type. Unlike many studies ofporphyry deposits, there are no significant gaps in salinity or homogenizationtemperature where no inclusions were measured.
TABLE 3. Microthermometric Properties of Fluid Inclusions
Average Inclusion Homogenization homogenization Salinity (wt % Density Deposit-scale type range (°C) temperature (°C) NaCl equiv) 1 Mol % CO2 2 g/cm3 distribution
B35 300-400 Liquid = 349 1-8 3–8 0.63–0.72 Most abundant in deep BQ/QMB n = 2544 88% between avg = 4 and deep EDM veins
330-370
B60 356-452 Liquid = 377 1-7 3–9 0.42–0.55 In all vein types at moderate ton = 960 86% between Critical = 388 avg = 4 shallow depths; most abundant
360-400 Vapor = 396 in and around GS veins
B15H 175-412 Liquid = 238 30-48 0 1.1–1.2 Few deeper than ~1400 m; in alln = 187 72% homogenize Halite = 278 avg = 38 vein types at moderate to shallow
by halite depths; commonly near B85dissolution inclusions
B85 370-520 Vapor = 413 0-3 10–20 <0.1–0.21 In all types at moderate to shallown = 148 avg = 1.5 depths; few deeper than ~1400 m;
present in some veins where B15Hinclusions are lacking
B20 195-400 Liquid = 285 1-28 0 variable Most abundant in GS veins;n = 242 avg = variable not dominant in any pre-Main
multiple origins stage vein type
B20(MS) 140-340 Liquid = 277 1.0- 3.5 <2 0.9 Primary and secondary in Mainn = 90 avg = 2.6 stage veins
1 Salinities are given in wt percent NaCl equivalent on a H2O-NaCl-only basis2 CO2 contents are in mol percent on CO2-H2O-only basis3 Abbreviations: n = number of inclusions analyzed, avg = average, other abbreviations as in Table 1

which point the bubble fades and shrinks or expands rapidlyat the temperature of near-critical homogenization. In theseinclusions, little undercooling is necessary to renucleate thebubble after homogenization. Most inclusions homogenize tovapor at a higher temperature than nearby inclusions that ho-mogenize to liquid or by critical behavior; however, theranges of all three homogenization behaviors overlap (Fig.10). Like B35 inclusions, inclusions within clusters typicallyhomogenize within 10° of one another.
B15H inclusions: Halite dissolution temperatures rangefrom 175° to 412° (Table 3). Of all B15H inclusions, 72 per-cent homogenize by halite dissolution above the temperatureof L-V homogenization, whereas the rest homogenize by L-Vhomogenization after halite dissolution (Fig. 13). Halite dis-solution occurs at temperatures up to 172°C higher than bub-ble homogenization in some groups of inclusions.
In recent studies of several porphyry Cu deposits, several dis-tinct types of halite-saturated fluid inclusions have been distin-guished based on daughter minerals (cf. Alumbrera: Ulrich etal., 2001) or homogenization behavior and distribution withinindividual veins (Bingham: Redmond et al., 2004; Landtwing etal., 2005). At Butte, however, no distinct populations of halite-bearing inclusions were identified. In different assemblages ofB15H inclusions within a single sample, halite dissolution tem-peratures range over 160°C, equivalent to a range of about 16wt percent NaCl equiv. This range is only slightly less than thesalinity range of all halite-bearing fluids measured in all sam-ples. Within some clusters of B15H inclusions, homogenizationtemperatures of bubble or halite differ by as much as 40°Camong inclusions. This may result from post-trapping modifica-tions or entrapment of heterogeneous fluids (see below).
B85 inclusions: Melting temperatures of ice and clathratein B85 inclusions are difficult to observe because of the largebubble size, and they were only observed in a few inclusions.
The formation of clathrate upon cooling in some B85 inclu-sions indicates the presence of CO2, but both ice- andclathrate-melting temperatures were never observed in a sin-gle inclusion. If we assume for B85 inclusions that the rangeof melting temperatures of ice and clathrate is limited asshown for B35 and B60 inclusions, then salinities can be esti-mated based on the TmICE and TmClathrate from different B85inclusions. Figure 8C shows the range of salinities, densities,and CO2 contents calculated with ICE for inclusions contain-ing 85 vol percent vapor. Salinities of B85 inclusions are esti-mated between 0 and 3 wt percent NaCl equiv (Figs. 10-12;Table 3) and calculated CO2 contents are as high as 18 molpercent. The CO2 content of B85 inclusions containing morethan 85 vol percent bubble is more than 18 mol percent.
All B85 inclusions homogenize to vapor between 370° and520°C (Fig. 10). Homogenization temperature in B85 inclu-sions cannot be precisely determined and is likely to be un-derestimated by as much as 100°C (Bodnar et al., 1985;Sterner, 1992), owing to the difficulty in observing the disap-pearance of the last bit of aqueous fluid. True homogeniza-tion temperatures are inferred to be between 400° and 600°Cfor most B85 inclusions.
B20 inclusions: B20 inclusions occur both as scattered clus-ters of inclusions and as secondary inclusions on planar trailsin pre-Main stage veins. Salinities in scattered B20 inclusionsrange widely between 6 and 28 wt percent NaCl equiv (Figs.10–12; Table 3) and first-melting temperatures range be-tween –23° and –48°C, indicating a presence of dissolvedsalts besides NaCl and KCl (Sterner and Bodnar, 1984). Ho-mogenization temperatures of scattered B20 inclusions alsorange widely between 195° and 420°C (Fig. 10). Individualgroups of B20 inclusions typically have a wide range of salin-ities and homogenization temperatures. The common occur-rence of high salinity B20 inclusions near B15H inclusionssuggests that in some cases the two types are related but thatB20 samples are slightly less saline as a result of postentrap-ment modifications such as necking or leaking.
Secondary B20 inclusions located in planar trails in deepveins contain less than 10 wt percent NaCl equiv and nodaughter minerals. Compared to the scattered B20 samples,these inclusions homogenize over a more narrow range of200° to 330°C, and inclusions along a single trail homogenizewithin ~20° of each other. The differences in distribution,daughter minerals, salinity, and homogenization behavior in-dicate that B20 inclusions trapped on planar trails are of a dif-ferent origin than scattered B20 inclusions.
B20MS inclusions: Ice-melting temperatures in B20MS inclu-sions range from –0.4° to –3.3°C (Fig. 10). Roedder (1971) re-ports similar results for similar inclusions in sphalerite andquartz in a Main stage sample from Butte. In the pure H2O-NaCl system, such melting temperatures correspond to salin-ities of 0.7 to 6 wt percent NaCl equiv. Emission of bubblesfrom several samples crushed in oil indicates that a noncon-densable gas is present, likely CO2. Clathrate was never ob-served in B20MS inclusions, indicating that these inclusionscontain less than about 2 mol percent CO2 (Rosso and Bodnar,1995). Salinities are estimated to be <0.5 to 3.5 wt percentNaCl equiv, based on the estimated presence of 1 mol percentCO2 (Figs. 11, 12; Table 3). B20MS inclusions homogenize toliquid between 230° and 340°C (Fig. 10), with all inclusions
MAGMATIC-HYDROTHERMAL FLUID EVOLUTION IN THE BUTTE PORPHYRY Cu-Mo DEPOSIT, MONTANA 323
0361-0128/98/000/000-00 $6.00 323
100
150
200
250
300
350
400
100 150 200 250 300 350 400
Th L (°C)
Tm
hal
ite (
°C)
BQ PGS
EDM
QMBGS
FIG. 13. Temperature of bubble homogenization versus temperature ofhalite dissolution in 187 B15H inclusions. The diagonal line is the line alongwhich both halite and bubble homogenize at the same temperature. Of theB15H inclusions, 72 percent plot above this line, indicating that halite dis-solves after bubble homogenization. Such homogenization behavior indicatesthat these inclusions were not trapped on the L-V curve, but must have beentrapped at some greater pressure.

within a fluid inclusion assemblage homogenizing within 10°Cof each other. These results agree with those of Miller (2004),who reports fluid salinities between 0 and 6 wt percent NaClequiv and homogenization temperatures between 220° and350°C in fluid inclusions from 12 Main stage veins.
Interpretation of Fluid Inclusions
Magmatic origin of low salinity fluids
Low salinity B35 inclusions occur primarily in barrenquartz–quartz-molybdenite and early dark micaceous veinsfrom the deepest samples recovered (1,400–2,600 m belowpresent surface), where K-silicate alteration dominates. Oxy-gen and hydrogen isotopes in micas (Zhang, 2000) suggestthat K-silicate alteration in this region was produced by mag-matic fluids. The presence of anhydrite and plagioclase inthese deep veins and in their alteration envelopes indicatesthat overprinting from later, cooler hydrothermal fluids,which would dissolve anhydrite and convert plagioclase tosericite or clays, was minimal. In these deep, quartz-richveins, B35 inclusions account for 95 percent of inclusions inboth vein and Butte Quartz Monzonite quartz. Where over-printing by later pyrite veins occurs in deep samples, B35 in-clusions are stretched and modified, indicating that they pre-date such overprinting. Based on these observations, we inferthat B35 inclusions trapped the magmatic fluids responsiblefor the formation of deep, quartz-rich veins (± molybdenite,±chalcopyrite) with K-feldspar and biotitic alteration.
B35 inclusions dominate in deep, quartz-rich veins but arefar less common at shallower levels in the deposit. In fivedeep drill holes, we identified a transition zone below whichB35 inclusions dominate and no B15H inclusions are presentand above which B60 and B85 inclusions dominate and B15Hinclusions are present (Fig. 6). Based on the distribution ofthese inclusions and the evidence indicating that the veins inwhich these inclusions were trapped from magmatic fluids athigh temperatures with little overprinting from later, coolerfluids, we conclude that B35 inclusions trapped a single-phase aqueous fluid of magmatic origin at pressures and tem-peratures above the solvus of the fluid. These interpretationsare consistent with those of Roberts (1975).
Salinity and CO2 content in B35 and B60 fluid inclusionsare similar; however, B60 inclusions occur mostly at shallowerdepths than B35 inclusions. The main difference between thetwo inclusion types is that B60 inclusions have larger vaporbubbles and homogenize at higher temperatures, indicatingthat B60 inclusions are of lower density than B35 inclusions.The similarity in salinity and CO2 content of the two and thedominance of B35 and B60 inclusions in samples with min-eral oxygen and hydrogen isotope compositions, indicatingmagmatic fluid-derived alteration (Zhang et al., 1999, Zhang,2000), suggest that fluids trapped in B60 inclusions are alsoderived from magmatic fluids. B60 inclusions trapped fluidssimilar in origin and bulk composition to B35 inclusions butB60 inclusions were trapped at lower pressure and, in somecases, lower temperature (see below) than B35 inclusions.
Fluid immiscibility
Unmixing of supercritical H2O-NaCl fluids into a high-density brine and a low salinity, low-density vapor has been
recognized in many geologic environments (Pichavant et al.,1982, and references therein; Bischoff and Pitzer, 1985) andthe position of the solvus, defining the region of immiscibilityin the H2O-NaCl system has been determined experimentally(Sourirajan and Kennedy, 1962; Urusova, 1975; Bodnar et al.,1985; Bischoff and Pitzer, 1989). Fluid inclusion evidence forfluid immiscibility is characteristic of porphyry Cu deposits(Roedder, 1971; Nash, 1976; Roedder, 1984; Bodnar, 1995),and metal and sulfide zoning patterns in these deposits maybe a result of the partitioning of metals and other species be-tween vapor and hypersaline liquid (cf. Heinrich et al., 1999;Audétat et al., 2000). Density and compositional differencesbetween the hypersaline and low-density fluids would affectthe physical and chemical behavior of these fluids in frac-tures, in turn affecting the distribution of the precipitatedminerals.
Although the deposit-scale distribution of B15H inclusionsdescribed above strongly suggests that B15H fluids were gen-erated by unmixing of a parental low salinity magmatic fluidsimilar to fluids trapped in B35 inclusions, homogenizationoccurs by halite dissolution after bubble disappearance in 72percent of B15H inclusions measured. Such homogenizationbehavior is relatively common in B15H inclusions in mag-matic-hydrothermal ore deposits (Dilles and Einaudi, 1992;Cline and Bodnar, 1994; Wang et al., 1999; Brathwaite et al.,2001; Ulrich et al., 2001; Wanhainen et al., 2003; Goldfarb etal., 2004; Bouzari and Clark, 2006) and may result from hightrapping pressures (Becker et al., in review). However, atButte, halite homogenization at temperatures well abovehomogenization of the bubble in B15H inclusions yields un-reasonably high trapping temperatures, suggesting that pos-tentrapment modification occurred.
Bodnar (1994) experimentally determined the liquidus andthe isochore slopes for a 40 wt percent NaCl-H2O solution.We have applied these data to the 36 halite-saturated inclu-sions from Butte with calculated salinities between 38 and 40wt percent NaCl equiv (Fig. 14). Using the minimum slope ofisochores in the liquid + halite field for a 40 wt percent NaCl
324 RUSK ET AL.
0361-0128/98/000/000-00 $6.00 324
0
100200300400500600700800
200 300 400 500 600
Temperature (°C)
LL+
H
LV
40 wt%
NaC
l
Pre
ssur
e (M
pa)
FIG. 14. Isochores of B15H inclusions containing nearly 40 wt percentNaCl. Slopes of these isochores are the experimentally derived minima (Bod-nar, 1994). Isochores show that the minimum pressures at which the B15Hinclusions were trapped, at the temperature of halite dissolution, is between70 and 240 MPa. At geologically reasonable temperatures of 500° to 600°C,isochores predict trapping pressures between 450 and 600 MPa. Such pres-sures are unlikely in this environment and are interpreted to result from post-trapping modification (see text).

solution (2 MPa/°C: Bodnar, 1994), the homogenization be-havior of these inclusions corresponds to minimum trappingpressures of 74 to 260 MPa at the temperature of halite dis-solution of about 310°C (Fig. 11). Geologic, thermodynamic,and fluid inclusion evidence suggests that these fluids un-mixed at temperatures between 400° and 600°C (Reed andRusk, 2001; Field et al., 2005; this study, see below). Pressurecorrections in the liquid field along a minimum estimated iso-chore slope of 1.4 MPa/°C (Bodnar, 1994) indicate trappingpressures between 200 and 400 MPa at 400°C for these in-clusions and pressures greater than 600 MPa at 600°C (Fig.14). Such pressure-temperature combinations are unlikely inthis geologic environment. We therefore conclude that themicrothermometry for a majority of measured B15H inclu-sions yields unreasonable conditions of trapping.
These results suggest that either B15H inclusions trappedan inhomogeneous mixture of multiple fluids or the inclu-sions have been modified significantly since the time of trap-ping. Petrographic evidence for inhomogeneous trapping,leaking, or necking was identified in a few samples, but theseinclusions were avoided during microthermometry. Modifica-tions of B15H inclusions may have occurred by necking of thevapor phase away from the rest of the fluid or by inclusion mi-gration and water loss as discussed by Audétat and Günther(1999). It is also possible that inclusion stretching during mi-crothermometric heating caused spurious results. To mini-mize this effect, only one assemblage of B15H inclusions wasanalyzed by microthermometry in each fluid inclusion chip.
Regardless of the cause for the microthermometric behav-ior, the deposit-scale distribution of B35, B85, and B15H in-clusions indicates that B15H and B85 inclusions were gener-ated by unmixing of B35 fluids and that both brine and vaporwere involved, to some extent, in the formation of all pre-Main stage vein types at depths shallower than ~1,400 m (cf.Rusk et al., 2004).
Pressure and temperature of vein formation
Deep, early dark micaceous and barren quartz–quartz-molybdenite veins: The deepest veins studied are quartz-dominated early dark micaceous and barren quartz–quartz-molybdenite veins from the upthrown Continental block. Inthis area, the three vein types are similar petrographically,and fluid inclusion populations and microthermometric be-havior among the vein types are indistinguishable.
Brimhall (1977) estimated early dark micaceous vein for-mation temperatures between 550° and 700°C, based on Kand Na partitioning between K-feldspar and muscovite invein envelopes. Roberts (1973) estimated the temperature ofearly dark micaceous vein formation between 550° and700°C, based on the composition of coexisting ilmenite andhematite in alteration envelopes. Field et al. (2005) estimatedtemperatures between 550° and 650°C for the formation ofquartz-molybdenite veins, based on sulfur isotope geother-mometry on adjacent molybdenite and anhydrite grains. Rusket al. (2006) estimated temperatures of formation of theseveins between 550° and 650°C, based on the titanium inquartz geothermometer of Wark and Watson (2006).
The vast majority of B35 inclusions in deep, early dark mi-caceous and barren quartz–quartz-molybdenite veins homog-enize between 330° and 370°C. An isochoric adjustment of
several hundred degrees is therefore necessary to determinepressure of trapping. In the temperature range of 550° to650°C, isochores for a 4 wt percent NaCl fluid containing 5mol percent CO2 with a density between 0.63 and 0.68 g/cm3
(corresponding to homogenization temperatures between340° and 360°C) indicate pressures between 170 and 270MPa, with the majority of inclusions indicating between 200and 250 MPa (Fig. 15). The presence of a few deep, quartz-molybdenite veins with aplitic centers (aplitic vein dikes) sup-ports the suggestion that some of these veins formed at near-magmatic pressures and temperatures.
Early dark micaceous and pale-green sericitic veins frommoderate and shallow depths: As noted by Roberts (1975),fluid inclusions in early dark micaceous and pale-greensericitic veins from moderate and shallow depths west of theContinental fault are more abundant and more variable com-pared to other vein types at Butte. Many early dark micaceousveins west of the Continental fault are overprinted by latermineralization, which has modified vein and alteration min-erals complicating fluid inclusion petrography. Anhydrite, an-dalusite, and plagioclase, which are present in early dark mi-caceous alteration east of the Continental fault, are notpresent in the alteration envelopes of early dark micaceous orpale-green sericitic veins from west of the Continental fault.
Temperatures of formation of early dark micaceous veinsare inferred to have been ~550° to 650°C, based on the esti-mates noted above and on the close temporal relationship be-tween early dark micaceous veins and porphyry dike intrusion(Reed, 1999). Approximate pressures of fluid unmixing canbe estimated based on the salinity of B15H inclusions. In apure H2O-NaCl system, the solvus for a 4 wt percent NaClfluid (such as is trapped in B35 inclusions) at 600°C lies atabout 84 MPa (Bodnar et al., 1985), and decompression to~80 MPa would generate a fluid with 38 wt percent NaClequiv (avg salinity of B15H inclusions) (Fig. 16). However,the addition of 5 mol percent CO2 to a 4 wt percent NaClequiv fluid would increase the pressure of unmixing by about10 MPa at this temperature (extrapolated from Gehrig et al.,1986). The range of salinities in B15H inclusions suggests thatunmixing occurred over a range of pressures between about80 and 94 MPa at 600°C in early dark micaceous veins. Pre-cise conditions of unmixing cannot be determined, however,owing to postentrapment modification of many B15H inclu-sions and the lack of data for the position of the solvus in theH2O-NaCl-CO2 system.
Reed and Rusk (2001) and Reed et al. (2005) inferred thatpale-green sericitic veins are the upward extensions of earlydark micaceous veins, based on their deposit-scale distribu-tion and the observed change from early dark micaceous topale-green sericitic alteration along strike of individual veins.Thermodynamic modeling and these geologic observationssuggest that pale-green sericitic veins formed at cooler tem-peratures and lower pressures than early dark micaceousveins, but from the same fluids (Reed, 1999). Based on ther-modynamic modeling, homogenization of vapor-rich inclu-sions at temperatures of up to 520°C and well-constrainedtemperatures of early dark micaceous vein formation, mostpale-green sericitic veins probably formed between 475° and550°C (Fig. 15). Fluid inclusion populations in pale-greensericitic veins are similar to those in moderate and shallow
MAGMATIC-HYDROTHERMAL FLUID EVOLUTION IN THE BUTTE PORPHYRY Cu-Mo DEPOSIT, MONTANA 325
0361-0128/98/000/000-00 $6.00 325

early dark micaceous veins; however, B15H and B85 inclu-sions are more abundant in pale-green sericitic veins. Similarto early dark micaceous veins, the abundance of B60, B15H,and B85 inclusions and the lack of B35 inclusions suggeststhat B35 fluids decompressed, forming B60 fluids which fur-ther decompressed and unmixed during ascent in fracturesfeeding pale-green sericitic veins. The absence of fluid inclu-sions with greater than 48 wt percent NaCl equiv in pale-green sericitic veins suggests that pressure dropped to nomore than about 10 to 20 MPa below the estimated solvus ofthe fluid (Fig. 16). At 500°C, pressures of unmixing in pale-green sericitic veins are estimated to be between 50 and 70MPa (Fig. 16); however, as with early dark micaceous veins,precise conditions cannot be determined. B60 inclusions inearly dark micaceous and pale-green sericitic veins weretrapped at slightly higher pressures, just above the solvus.The presence of inclusion clusters containing only B15H oronly B85 inclusions in early dark micaceous and pale-greensericitic veins indicates that local physical separation of vaporand brine occurred.
Barren quartz/quartz-molybdenite veins from moderatedepth: No independent estimations of temperature of for-mation of barren quartz–quartz-molybdenite veins frommoderate depth are available because they contain onlyquartz and are accompanied by little or no alteration. Weinfer, based on sulfur isotope data from deeper quartz-molybdenite veins (Field et al., 2005), that these veinsformed at temperatures similar to or slightly less thandeeper, quartz-dominated veins.
Barren quartz–quartz-molybdenite veins from moderatedepths are dominated by B35 and B60 inclusions; however,the distinction between B35 and B60 inclusions is not alwaysclear. Many inclusions in these veins contain 40 to 60 vol per-cent vapor bubble, implying that their densities are betweenideal B35 and ideal B60 inclusions, consistent with formationat slightly lower pressure than B35 inclusions in deeper bar-ren quartz–quartz-molybdenite veins. The dominance of B35,B60, and inclusions with densities between B35 and B60inclusions in quartz-molybdenite veins from moderate depthssuggests that pressure fluctuated between 80 and 200 MPa attemperatures between 500° and 600°C, generating fluidsranging in density from about 0.40 to 0.65 g/cm3. The pres-ence of subordinate amounts of B15H, B85, and B20 inclu-sions record occasional unmixing at slightly lower pressuresbelow the solvus (Fig 15).
Gray sericitic veins: Gray sericitic veins exist at shallow lev-els in the deposit, upward and outward from early dark mica-ceous and pale-green sericitic veins, and they dominate thecentral zone of pervasive sericitic alteration from the surfaceto depths greater than the deepest drilling. In shallow pyrite-quartz veins, euhedral quartz crystals contain few fluid inclu-sions. Vein quartz appears to have similar ratios of fluid in-clusions as that of wall-rock quartz, but they are significantlyfewer in quantity. Vein quartz and nearby igneous quartz aredominated by B60 and B85 inclusions. B15H inclusions arealso present in some gray sericitic veins, and B20 inclusionsare more abundant than in any other vein type. B35 inclu-sions are rare.
326 RUSK ET AL.
0361-0128/98/000/000-00 $6.00 326
0
50
100
150
200
250
300
350
300 400 500 600 700Temperature (°C)
Granite solidus
EDM
PGSGS
0.75 g/cm3
0.70
0.65 0.60 0.55
0.450.40
MS
Pre
ssur
e (M
pa) Deep qz ± mb
potassic alt
Qz ± m
b
no
alt
0.50
Ear
ly fl
uids
Late
flu
ids
FIG. 15. Pressure-temperature diagram with isochores for a fluid containing 4 wt percent NaCl, and 5 mol percent CO2
showing the inferred formation conditions of veins from Butte. Most deep, quartz-rich veins with early dark micaceous(EDM) or K-feldspar alteration formed between 200 and 250 MPa at temperatures between 575° and 650°C. Early dark mi-caceous veins formed where some depressurized fluids unmixed into vapor and brine and cooled in the range of 575° to650°C and pressures of about 70 to 90 MPa. Pale-green sericitic (PGS) veins formed from continued cooling and reaction ofthese fluids in the range of 475° to 575°C and 50 to 80 MPa. Unmixing was less common in pyrite-quartz veins, producedfrom continued cooling of the magmatic fluid to temperatures near 400°C. Gray sericitic (GS) veins formed at pressures be-tween 40 and 70 MPa. Main stage veins formed later from fluids between 230° and 400° degrees at pressures between 20and 60 MPa. The dashed curve represents the limits of the miscibility gap in the system H2O-CO2-NaCl.

Homogenization of B60 inclusions at minimum tempera-tures of ~370°C places lower limits on the temperature ofgray sericitic vein formation. Thermodynamic modeling sug-gests that temperatures less than 450°C are necessary to forma fluid of sufficient acidity to generate sericitic alteration(Meyer and Hemley, 1967; Reed and Rusk, 2001; Reed et al.,2005). The low salinity, CO2-bearing fluids trapped in B60 in-clusions in and adjacent to gray sericitic veins were trappedbetween about 40 MPa at 370°C (estimated pressure of thesolvus at 370°C ) and about 70 MPa at 450°C (Fig. 15). Thesepressure and temperature conditions are slightly below, at,and above the approximate location of the critical point fortrapped B60 fluids, which is ~390°C and 41 MPa, based oncritical homogenization of B60 fluid inclusions. This estimateof the critical point of B60 fluids from Butte agrees with esti-mates of the critical point from Gehrig et al. (1986) andSchmidt and Bodnar (2000) for fluids of similar bulk compo-sition. The presence of B15H, B85, and B20 inclusions inthese veins suggests that pressures occasionally droppedslightly below the solvus and led to fluid unmixing. In graysericitic veins, the wide variation of salinity in B20 inclusionsresults from the broadness of the solvus at low temperatureand pressure (Fig. 16).
Main stage veins: The complexity of the Main stage hydro-thermal system warrants a fluid inclusion study of its own;however, several samples were analyzed in this study for
completeness. We examined about 20 Main stage veins andhave analyzed 5. Only low salinity B20MS inclusions, some ofwhich contain a small amount of dissolved CO2, were identi-fied. No halite-bearing or vapor-rich inclusions are present,indicating that boiling did not occur.
Assemblages of fluid inclusions in quartz from veins in thecentral Cu-rich, high-sulfur zone, and in quartz, rhodochrosite,and sphalerite from peripheral Pb-, Zn-, Mn-dominated veinscontain low salinity fluid inclusions that homogenize between230° and 340°C. There is no apparent difference in inclusionpopulations or microthermometric behavior between the twozones. We estimate a minimum pressure of 20 MPa based onlack of evidence for boiling, and a maximum of 60 MPa basedon pressures estimated for gray sericitic veins, which areearlier and deeper than MS veins. Between 20 and 60 MPa,the range of trapping temperatures of B20MS fluids is from230° to 400°C (Fig. 15).
Implications for Porphyry Cu Deposit Formation
Unusually great depth of the Butte hydrothermal system
The depth of formation of porphyry Cu-Mo deposits is typ-ically difficult to determine and in many deposits it is poorlyknown (cf. Bodnar and Beane, 1980; Seedorff at al., 2005). Insome cases depth can be reliably inferred from geologic rela-tionships. Fluid inclusions may provide estimates of trappingpressure, but the resultant depth estimates are not straight-forward because pressures may be either lithostatic or hydro-static or somewhere in between. Most porphyry-type depositsapparently deposit ores at ~1 to 5 km depth, but the Butte de-posit appears to be deeper.
At Butte, besides fluid inclusions, we have only indirect ge-ologic estimates of depth. The Butte Quartz Monzonite is em-placed into folded and fault-thickened rocks of the Laramidefold and thrust belt (Tilling, 1973). The carapace of cogeneticlate Cretaceous Elkhorn Mountains Volcanics is missing overthe Butte Quartz Monzonite in the Butte district, supportingdeep erosion. Applying the Al in Hornblende geobarometer(Anderson and Smith, 1995) to 10 samples of Butte QuartzMonzonite, Dilles et al. (1999) estimated that the ButteQuartz Monzonite crystallized at ~9.5 km depth near the Con-tinental Pit and ~7.5 km depth near the Berkeley Pit, consis-tent with >1 km of normal displacement along the Continen-tal fault. The error of calibration of this method is ±60 MPa or± 2 km, but the Butte Quartz Monzonite hornblende is ho-mogeneous, and sample variation yielded smaller errors of±0.4 to ±0.7 km (1 std dev error based on 10–20 grains ana-lyzed). The Butte Quartz Monzonite was, however, emplaced~10 m.y. prior to porphyry Cu-Mo mineralization at Butte, sothis estimate does not directly yield mineralization depths.
If B35 inclusions in deep, quartz-rich veins were trapped attemperatures of about 600°C, then pressures of vein forma-tion were in the range of 200 to 250 MPa. Under lithostaticpressures, where rock density is 2.85 gm/cm3, deep quartzveins within and beneath the zone of abundant molybdenitebut below the zone of abundant chalcopyrite formed atdepths of 6 to 9 km. This depth estimate coincides with thatfor the crystallization of the host Butte Quartz Monzonite;however, this is a greater depth than is inferred for any otherporphyry Cu (Mo) deposit.
MAGMATIC-HYDROTHERMAL FLUID EVOLUTION IN THE BUTTE PORPHYRY Cu-Mo DEPOSIT, MONTANA 327
0361-0128/98/000/000-00 $6.00 327
Pre
ssu
re (
bar
s)
Wt% NaCl equiv.
4 10 20 50 100
20
30
40
50
60
70
80
90
100
110
120
130
1401
0
10
App
rox.
dep
th (
km)
hydr
osta
tic p
ress
ure
App
rox.
dep
th (
km)
litho
stat
ic p
ress
ure
400°
600°500°
LiquidVapor
Critical curve 1
2
3
4
5
3
6
9
12
log scale linear scale
Input fluid
Estimatedlocation of solviwith 5 mol % CO2
Actual locationof solvi
Vapor + NaCl
EDM
PGS
GS
FIG. 16. Phase diagram showing the positions of the solvi in the systemH2O-NaCl (Sourirajan and Kennedy, 1962; Urusova, 1975; Bodnar et al.,1985). The positions of the solvi in the system CO2-H2O-NaCl have not beenexperimentally determined; however, we extrapolate the possible position ofthe solvi based on the work of Gehrig et al. (1986). The presence of 5 molpercent CO2 increases the pressure of the solvus by about 15 MPa at 400°and ~10 MPa at 600°. The approximate pressures of unmixing of a 4 wt per-cent NaCl, 5 mol percent CO2 fluid at 400°, 500°, and 600° are shown. Theshaded regions correspond to approximate pressure-temperature conditionsof unmixing in gray sericitic (GS), pale-green sericitic (PGS), and early darkmicaceous (EDM) veins, respectively. The shapes of the solvi in the systemCO2-H2O-NaCl have not been determined, so the positions and shapes areonly estimates and precise pressures of unmixing cannot be made based onthese solvi. Schematic diagrams of fluid inclusions show the fluid inclusiontype generated at different pressures and temperatures.

If this depth of formation is correct, then pressures inferredfrom fluid inclusion data suggest that most Cu mineralizationoccurred in early dark micaceous and pale-green sericiticveins at depths between 5 and 9 km. The depth of formationof deep barren quartz–quartz-molybdenite veins may be over-estimated if temperature of vein formation is overestimated, ifthe densities of B35 fluids are overestimated, if the fluidcooled slightly before trapping, or if the magma-hydrothermalsystem was overpressured. Overpressurization may resultfrom an interconnected fracture network reaching the magmabelow, which would translate pressure upward into the fluid inthe sealed fracture network above (Carrigan et al., 1992).
Fluid inclusion petrography strongly supports the sugges-tion that Butte formed at greater depths than has been inter-preted for other porphyry Cu deposits. That the Butte depositformed at greater depth than the 1 to 5 km typical of mostother porphyry Cu deposits is supported by several observa-tions: (1) Butte deep veins lack B15H inclusions and are dom-inated instead by CO2-rich B35 inclusions, veins containingonly B35 inclusions have not been identified in any other de-posit; (2) B15H inclusions are far less common at Butte thanin most other deposits, which indicates that at Butte the pres-sure was commonly greater than that required to generatefluid unmixing; (3) B15H inclusions are less saline (average of38 wt % NaCl equiv) than is typical in many other porphyryCu deposits (35–70 wt % NaCl equiv) and these salinities in-dicate pressures only slightly less than the solvus generatingimmiscibility; (4) B60 inclusions, present in all vein typesbelow, within, and above the main Cu-ore zone imply pres-sures intermittently in the one-phase field, above the fluidsolvus during vein formation throughout the evolution of thehydrothermal system.
Butte may be rare among porphyry Cu deposits for its greatdepth of formation. Sufficient uplift, erosion, and explorationhave taken place to reveal abundant, CO2-bearing, low salin-ity fluid inclusions that are samples of a single-phase parentalmagma-derived aqueous fluid. In many porphyry Cu depositsthe exposure is not deep enough to reveal the deepest partsof the system where a single-phase hydrothermal fluid is pre-dicted. Similar low salinity fluids have been recognized anddescribed in deep veins from the Alta Stock, Utah (John,1989); Bingham Canyon, Utah (Redmond et al., 2004); andQuesta, New Mexico (Cline and Bodnar, 1994). Rusk et al.(2007) also identified similar inclusions, typically in the pres-ence of multiple inclusion populations, in deep veins fromnumerous porphyry deposits (Henderson and Climax, Col-orado; Copper Creek and Mineral Park, Arizona; and El Sal-vador, El Teniente, Los Pelambres, and Chuquicamata,Chile). These occurrences suggest that parental low salinityinclusions are more common than previously recognized andfuture studies of deeper parts of porphyry ore systems willlikely reveal similar fluid inclusions.
Evolution of a single parental hydrothermal fluid formed the Butte deposit
To account for the variation in vein and alteration types insome porphyry Cu deposits, previous studies suggested amagmatic origin of fluids that form early potassic alterationand a meteoric fluid origin for later sericitic alteration basedon oxygen and hydrogen isotope studies (Sheppard and
Taylor, 1974; Sheppard and Gustafson, 1976; Taylor, 1997).This interpretation was reinforced by the presence of lowsalinity aqueous inclusions, common in sericitically alteredpyrite-quartz veins from porphyry Cu deposits, which wereinterpreted to have trapped dilute meteoric fluids during latequartz-sericite-pyrite mineralization (Gustafson and Hunt,1975; Nash, 1976; Eastoe, 1978; Preece and Beane, 1982;Reynolds and Beane, 1985; Beane and Bodnar, 1995). Morerecently, however, magmatic fluids have been implicated inthe formation of pyritic veins with sericitic alteration at FarSoutheast (Hedenquist et al., 1998), Butte (Zhang, 2000;Rusk et al., 2004), Alumbrera (Harris et al., 2005), Refugiodistrict (Muntean and Einaudi, 2001), the Endeavor 26 Northdeposit (Harris and Golding, 2002), and Henderson (Seedorffand Enauidi, 2004). Whereas Hedenquist et al. (1998) andMuntean and Einaudi (2001) call upon influx of multiplemagmatic fluids of varying composition to form early potassicand later sericitic alteration, Seedorff and Einaudi (2004)conclude that the transition from potassic to sericitic alter-ation at the Henderson porphyry Mo deposit was promotedby a change in temperature rather than a change in fluid com-position. At Butte, we infer that the entire suite of vein andalteration types was produced by various reaction paths of asingle parental magma-derived hydrothermal fluid. Thisparental fluid apparently maintained relatively constant initialcomposition throughout the life of the hydrothermal system.
The bulk chemical compositions of low salinity inclusions inearly potassically altered veins and late pyrite veins withsericitic alteration are similar and indicate little compositionalchange of the hydrothermal fluid extracted from the magmaover the life of the magmatic-hydrothermal system. We there-fore conclude that variations in ore mineral and alterationmineral assemblages derive from chemical changes in thefluid resulting from the various cooling and depressurizationpaths of the parental B35 fluid and the reaction history of therock through which the fluid flowed rather than from pulsesof magmatic fluids of varying initial compositions. For exam-ple, we infer that quartz-rich veins (±molybdenite) with littlealteration form from fluid depressurization at high tempera-tures where the solubility of quartz is very high (Fournier,1999, Rusk and Reed, 2002). When this fluid cooled undertransiently hydrostatic conditions, occasional unmixing oc-curred and chalcopyrite-rich, magnetite-bearing, early darkmicaceous and subsequent pale-green sericitic veins formed.Later, as the same parental fluid cooled further at lower pres-sures, it became progressively more acidic and formed pyrite-dominated veins with abundant sericitc alteration (Fig. 15).This interpretation agrees with thermodynamic modeling,which shows that the entire range of alteration types at Buttecan be derived from the interaction of the Butte Quartz Mon-zonite with a cooling fluid similar in composition to B35 in-clusions (Reed et al., 2005).
Nearly constant salinity and CO2 concentration in early andlate veins is not consistent with models of “closed system”magma crystallization, which predict that as crystallizationprogresses both the Cl/H2O and the CO2/H2O ratios shouldchange (Candela and Holland, 1986, Cline and Bodnar,1991). Therefore, the compositional similarity implies eitherdegassing of only a small percent of a large volume of magmaor input of volatiles from external sources at depth.
328 RUSK ET AL.
0361-0128/98/000/000-00 $6.00 328

It is likely that a significant volume of magma crystallizedduring the several-million-year span of the Butte hydrother-mal system (Martin et al., 1999; Snee et al., 1999; Dilles et al.2004). Evidence of progressively cooler mineralizing eventsin a given space indicates the loss of heat in the hydrothermalsystem and cooling and crystallization of the underlyingmagma. Our results imply that rather than being the productof a single magma crystallizing in a closed system, the hy-drothermal system at Butte was repeatedly or continuouslyrecharged by external magmatic volatile sources and/or byconvection within a large magma chamber. Underplating ofsilicic magma chambers by mafic magmas is common in theroots of arc batholiths (DeBari and Coleman, 1989; Wiebe,1996) and is also recognized in active volcanic systems such asPinatubo (de Hoog et al., 2004). Comingling of mafic and sili-cic magmas in porphyry intrusions and volcanic rocks relatedto porphyry Cu deposits has been recognized by Halter et al.(2004) and Hattori and Keith (2001). Nearly constant parentalfluid compositions throughout the span of pre-Main stagemineralization imply that the source of magmatic volatiles atButte behaved as an open system and was recharged withvolatiles derived from external sources.
Time and space evolution of hydrothermal fluids
An interpretation of the evolution of the hydrothermal sys-tem is illustrated in Figure 17, which shows the time andspace relationships observed among vein and fluid inclusiontypes. During the evolution of the hydrothermal system, amagma at depth continuously supplied low salinity, CO2-bear-ing, Cu-rich aqueous fluids. These fluids evolved by localvapor-brine immiscibility and by compositional change result-ing from pressure and temperature variations, wall-rock reac-tion, and vein precipitation to form quartz-dominated (±molybdenite) veins, chalcopyrite and magnetite-bearing earlydark micaceous and pale-green sericitic veins, as well as pos-tore gray sericitic veins. Deep in the hydrothermal system,under lithostatic pressure, at depths of 6 to 9 km and tem-peratures near 600°C, low salinity fluids precipitated quartz-rich, molybdenite-bearing veins with little chalcopyrite andwith minor potassic alteration envelopes. These veins formedlargely in response to fluid depressurization. Upon dike in-trusion and thereafter, this fluid ascended and cooled undertransiently hydrostatic conditions to form early dark mica-ceous veins at moderate depths, pressures between 60 and 90MPa, and temperatures of about 600°C. At slightly shallowerdepths, pale-green sericitic veins formed as this same fluidcontinued to ascend, cooled to about 475°C at pressures be-tween 50 and 70 MPa, frequently unmixed, and continued toreact with wall rock. Later in the evolution of the deposit, asthe hydrothermal system cooled, low salinity magmatic fluidsdepressurized and cooled at temperatures and pressures usu-ally above the brine-vapor solvus, forming barren quartz–quartz-molybdenite veins with no alteration at moderatedepths and gray sericitic veins and alteration at shallowerdepths as the fluid cooled to about 370°C (Fig. 15). As the hy-drothermal system waned and continued to cool, gray sericiticveins advanced downward, overprinting much of the previousmineralization. Main stage veins formed at shallower depthsthan gray sericitic veins, where magma-derived acidic aque-ous fluids rich in metals cooled, decompressed, and mixed
with meteoric waters at hydrostatic pressures (Garlick andEpstein, 1967; Sheppard and Taylor, 1974; Brimhall, 1979;Zhang, 2000; Rusk et al., 2004; Field et al., 2005).
Origin and precipitation of chalcopyrite and molybdenite
Recent fluid inclusion microthermometry and LA-ICP-MSstudies have suggested that cooling of Cu-rich brines to tem-peratures below 400°C is responsible for chalcopyrite precip-itation at Bingham Canyon (Landtwing et al., 2005) andAlumbrera (Ulrich et al., 2001). On the other hand, Dillesand Einaudi (1992) concluded that at Yerington, chalcopyriteprecipitation took place at high temperatures during potassicalteration. Their arguments are based on the observation thatchalcopyrite-bearing veins with potassic alteration are cut byporphyry dikes, which were then later cut by pyrite veins withsericitic veins at temperatures near 400°C, indicating thatfluid cooling to temperatures below 400°C occurred afterchalcopyrite precipitation.
At Butte, chalcopyrite is most abundant in and aroundpale-green sericitic and early dark micaceous veins which weinfer to have formed from a fluid cooling from ~650° to~475°C. Cooling of the hydrothermal system to tempera-tures in the range of 400°C led to sericitic alteration, whichcontains subeconomic Cu grades and clearly postdates earlydark micaceous and pale-green sericitic vein formation. It ishighly unlikely that a late fluid, at temperatures less than400°, could selectively infiltrate early dark micaceous andpale-green sericitic veins and precipitate chalcopyrite, leavingno wall-rock alteration to suggest its presence. We thereforeconclude that chalcopyrite precipitation at Butte occurred atthe elevated temperatures and pressures implied for the for-mation of early dark micaceous and pale-green sericitic veins.
Both brine and vapor-rich inclusions are ubiquitous in por-phyry Cu deposits, and the presence of chalcopyrite daughterminerals in either inclusion type in various deposits impli-cates both fluid phases as efficient Cu-transporting mediums(Ulrich et al., 2001; Bouzari and Clark, 2006). B35 inclusions,many with chalcopyrite daughter minerals, contain up to 1 wtpercent Cu (avg ~4,000 ppm Cu: Rusk et al., 2004) and arethe dominant inclusion type in the Continental block (Cugrades from ~0.2 to 0.4%), which indicates that these fluidswere also efficient transporters of Cu. Textures such as thosein Figure 5H, where primary (?) chalcopyrite-bearing fluidinclusions are trapped in euhedral quartz crystals containingsmall chalcopyrite crystals and projecting into chalcopyrite,also suggest that B35 fluids precipitated chalcopyrite atdepth. Low salinity B35 fluids with high Cu concentrationsimply that high salinity fluids are not necessary to form a largeporphyry deposit (cf. Candela and Holland, 1986) and areconsistent with experiments of Simon et al. (2006) that showthat sulfur species are likely important ligands transportingCu in the hydrothermal fluid.
Whereas it is apparent that some chalcopyrite precipitateddirectly from the single-phase fluid in deep, quartz-rich veins,higher Cu grades (0.6-0.9 wt % Cu) are at shallower levels inthe deposit, coincident with the zone of abundant early darkmicaceous and pale-green sericitic veins (magnetite zone:Fig. 2). These veins contain more vapor and brine inclusionsthan any other vein type. Hence, fluid inclusion relationshipsindicate that unmixing of B35 fluids to form B15H and B85
MAGMATIC-HYDROTHERMAL FLUID EVOLUTION IN THE BUTTE PORPHYRY Cu-Mo DEPOSIT, MONTANA 329
0361-0128/98/000/000-00 $6.00 329

fluids enhanced chalcopyrite (and magnetite) precipitation.In addition to brine-vapor immiscibility, fluid cooling andfluid-rock reactions are implicated in chalcopyrite precipita-tion by wide early dark micaceous and pale-green sericitic al-teration envelopes containing chalcopyrite in mafic sites.
We infer that B35 fluids were also the source of Mo miner-alization, based on the dominance of these inclusions inquartz-molybdenite veins that contain the preponderance of
Mo at Butte. The dominance of B35 inclusions and the lack ofevidence for fluid unmixing in many quartz-molybdenite veinssuggest that Mo was both transported by and precipitatedfrom these fluids. Cathodoluminescence images suggest thatquartz and molybdenite precipitated simultaneously, with noevidence for the introduction of molybdenite by later hy-drothermal fluids (Rusk, 2003). Fluid inclusions, the presenceof molybdenite only in veins with >90 percent quartz, and lack
330 RUSK ET AL.
0361-0128/98/000/000-00 $6.00 330
Time 3
Time 2
Time 4
+
++
+++
+
+
+++
+
+
+
+
+++
300
400
Hydrostatic pressure
+++++
++
B35
+
++
+++
+
+
+++
+
+
+
+
+++
300
Lithostaticpressure
Early MS veins? Hydrostatic pressure
Transient fluctuationsto hydrostatic pressure
+++++
++
B60, B85, B15H, B20
+
++
+++
+
+
+++
+
+
+
+
+++
300
400 B60
Hydrostatic pressure
+++++
++
B20MS
meteoric water influx
downward progressing GS and MS veins
Time 1
lithostatic pressureDeepest drilling
dep
th (
km)Present
surface
Plutonic complex at depth
developing cupola
volatile-enrichedcupola
500
600 50
0
Volatile input
BQ/QMB veins withminor kf and EDM alt
+++
+
+
+
+
+++
EDM veins progressingupward to PGS veins
Porphyritic dikes withbiotite breccias at apophyses
pyrite-quartz veinswith sericitic alteration
Main Stage veins
BQ/QMB veinswith no alteration
600
500
400
300
200
200
200
1
2
3
4
5
6
7
8
9
dep
th (
km)
Hydrostatic pressure
Propylitic
downward-crystallizing
magma
EDM
Fracture stockworkabove the cupola
Transient fluctuationsto hydrostatic pressure
A B
C D
dep
th (
km)
1
2
3
4
5
6
7
8
9
1
2
3
4
5
6
7
8
9
1
2
3
4
5
6
7
8
9
dep
th (
km)
Lithostaticpressure
Deep BQ/QMB/EDM
B15H + B85
Volatile input
B60
Volatile input
40050
0
PGS
600
Transient fluctuationsto hydrostatic pressure
B60 and B15H
B35
GS
BQ/QMB
Main Stage veins
FIG. 17. Schematic diagram depicting the evolution of the hydrothermal system at Butte. A) In this model, a large plu-ton at depth develops a volatile-charged cupola at its top. B) Quartz-porphyry dikes intrude the Butte Quartz Monzonite, ini-tiating the hydrothermal system. At depth, where the country rock is hottest, little cooling of fluid occurs and lithostatic pres-sure dominates. B35 fluid inclusions are trapped in quartz-rich veins under these conditions. As single-phase fluids (B35)ascend, they unmix to B15H and B85 fluids as a result of transient fluctuations in hydrostatic pressure. Rates of fluid cool-ing are slow relative to depressurization due to the depth and high temperature of the hydrothermal system. Early dark mi-caceous (EDM), pale-green sericitic (PGS), and propylitic veins and alteration form as fluids at magmatic temperatures pro-gressively ascend, cool, and react with Butte Quartz Monzonite (BQM). C) Barren quartz (BQ) and quartz-molybdenite(QMB) veins prograde upward forming from fluids cooling and depressurizing mostly above the fluid solvus. At shallowerdepths, above most early dark micaceous, pale-green sericitic, and barren quartz–quartz-molybdenite veins, gray sericitic(GS) veins form where fluids cool to ~400°C, which causes the fluid to become highly acidic, leading to sericitic alteration.Rates of fluid cooling relative to depressurization were greater than in earlier, deeper mineralization. D) As the magmaticsystem continues to crystallize and cool, isotherms retreat downward. Gray sericitic veins form at progressively greaterdepths, cutting all earlier vein types. Main stage veins form at shallow levels where magmatic and meteoric fluids mix.

of alteration around these veins suggest that molybdenite andquartz precipitated upon pressure drop from near-lithostaticto near-hydrostatic conditions (Rusk and Reed, 2002).
Precipitation of Cu by a different mechanism than Mo atButte is consistent with experimental and thermodynamicconsiderations of Cu and Mo solubility. Both Cl and S com-plexes have been implicated in Cu transport in aqueous fluids(Candela and Holland, 1984; Simon et al., 2006), whereasCandela and Holland (1984) and Zotov et al. (1995) suggestinstead that Mo is transported as MoO2 or HMoO4
–. Liu andMcPhail (2005) and Hemley et al. (1992) show that Cu solu-bility increases slightly in hydrothermal fluids with decreasingpressure. Temperature decrease is therefore far more likelythan pressure decrease to drive Cu precipitation, as we inferat Butte. The effects of pressure and temperature on molyb-denite solubility at the pressure and temperature range of in-terest are not well known.
ConclusionsOur results, along with those of Roberts (1975), suggest
that Butte is one of the deepest porphyry Cu deposits known.The great depth of formation of the Butte deposit is recordedby the predominance of fluids trapped above the solvus in theH2O-NaCl-CO2 system in deep, quartz-dominated veins.Fluid inclusion distribution, compositions, and homogeniza-tion behavior combined with LA-ICP-MS data on metal con-tents (Rusk et al., 2004) document that B35 fluids are samplesof magma-derived aqueous fluids characterized by low salin-ity, moderate CO2 contents, and up to 1 wt percent Cu. Suchparental fluids scavenged Cu and Mo from the melt belowand transported them to the hydrothermal system above.Given that a low salinity fluid provided the bulk of Cu, Mo,and S at Butte, we conclude that NaCl-rich brines are not es-sential for the extraction or transport of Cu or Mo from a crys-tallizing melt to generate a large porphyry Cu-Mo deposit.The increased abundance of B15H and B85 inclusions coin-ciding with the highest grade pre-Main stage (porphyry Cu)mineralization at Butte suggests that brine-vapor unmixingplays an important role in Cu-ore precipitation and deposit-wide metal and alteration zonation. In addition to unmixing,cooling and water-rock reaction also played an important rolein chalcopyrite precipitation at Butte. Fluid inclusion evi-dence and vein-cutting relationships indicate that chalcopy-rite mineralization occurred at high temperatures coincidingwith potassic alteration, rather than from later, lower temper-ature fluids. Fluid immiscibility does not appear to have beenan important factor in the precipitation of molybdenite,which is most abundant in the region dominated by B35 in-clusions. Compositions, deposit-scale distribution, and trap-ping conditions of fluid inclusions can be explained by thecontinued influx of a parental low salinity magmatic hy-drothermal fluid, with no significant change in the bulk com-position of the input fluid over the integrated lifetime of oremetal precipitation and vein formation. Variations in thetemperature-pressure–wall-rock reaction path account forthe sequence of vein formation from early quartz-dominatedveins with potassic alteration to late pyrite-dominated veinswith sericitic alteration. Early fluids decompressed rapidlyrelative to cooling, forming quartz-rich veins with potassic al-teration at depth and chalcopyrite-magnetite-bearing early
dark micaceous and pale-green sericitic veins at shallowerlevels in the deposit. Later, as the hydrothermal systemwaned, the rate of decompression relative to fluid coolingslowed, causing the fluid to remain above its solvus, formingpyrite veins with sericitic alteration which overprint much ofthe deposit.
AcknowledgmentsThis research was funded by National Science Foundation
grants EAR 0001272 and EAR 0440198. The U.S. GeologicalSociety Mendenhall postdoctoral fellowship program also pro-vided material support. We thank Steve Czehura, Dick Berg,George Burns, Cyrus Field, Lihua Zhang, Bob Houston,Sebastian Geiger, and Jim Reynolds for discussions, assis-tance, and comments which aided in the completion of thisstudy. The original manuscript was improved by thoughtfuland insightful reviews from Adam Simon and Bob Bodnar.
June 26, December 10, 2007
REFERENCESAnderson, J.L., and Smith, D.R., 1995, The effects of temperature and fO2
on the Al-in-hornblende barometer: American Mineralogist, v. 80, p.549–559.
Arribas, A, Jr., Hedenquist, J.W., Itaya, T., Okada, T., Concepcion, R.A., andGarcia, J.S., Jr., 1995, Contemporaneous formation of adjacent porphyryand epithermal Cu-Au deposits over 300 ka in Northern Luzon, Philip-pines: Geology, v. 23, p. 337–340.
Audétat, A., and Günther, D., 1999, Mobility and H2O loss from fluid inclu-sions in natural quartz crystals: Contributions to Mineralogy and Petrology,v. 137, p. 1–14.
Audétat, A., Günther, D., and Heinrich, C.A., 2000, Magmatic-hydrothermalevolution in a fractionating granite: A microchemical study of the Sn-W-F-mineralized Mole Granite, Australia: Geochimica et Cosmochimica Acta, v.64, p. 3373–3393.
Azbej, T., Severs, M.J., Rusk, B.G., and Bodnar, R.J., 2007, In situ quantita-tive analysis of individual H2O-CO2 fluid inclusions by laser Raman spec-troscopy: Chemical Geology, v. 237, p. 255–263.
Bakker, R.J., 1997, Clathrates: Computer programs to calculate fluid inclu-sion V-X properties using clathrate melting temperatures: Computers andGeosciences, v. 23, p. 1–18.
Bakker, R.J., Dubessy, J., and Cathelineau, M., 1996, Improvements in mod-elling: I. The H2O-CO2 system with various salts: Geochimica et Cos-mochimica Acta, v. 60, p. 1657–1681.
Beane, R.E., and Bodnar, R.J., 1995, Hydrothermal fluids and hydrothermalalteration in porphyry copper deposits, in Pierce, F.W., and Bohm, J.G.eds., Porphyry copper deposits of the American Cordillera: Tucson, AZ,Arizona Geological Society Digest 20, p. 83–93.
Beane, R.E., and Titley, S.R., 1981, Porphyry copper deposits. Part II. Hy-drothermal alteration and mineralization: ECONOMIC GEOLOGY 75TH AN-NIVERSARY VOLUME, p. 235–269.
Becker, S.P., Fall, A., and Bodnar, R.J., 2008, PVTX properties of high salin-ity H2O-NaCl Solutions (>30 wt % NaCl equiv): Application to fluid inclu-sions that homogenize by halite disappearance from porphyry copper andother hydrothermal ore deposits: ECONOMIC GEOLOGY, in press.
Bischoff, J.L., and Pitzer, K.S., 1985, Phase relations and adiabats in boilingseafloor geothermal systems: Earth and Planetary Science Letters, v. 75, p.327–338.
Bodnar, R.J., 1993, Revised equation and table for determining the freezingpoint depression of H2O-NaCl solutions: Geochimica et CosmochimicaActa, v. 57, p. 683–684.
——1994, Synthetic fluid inclusions: XII. The system H2O-NaCl. Experi-mental determination of the halite liquidus and isochores for a 40 weightpercent NaCl solution: Geochimica et Cosmochimica Acta, v. 58, p.1053–1063.
——1995, Fluid inclusion evidence for a magmatic source for metals in por-phyry copper deposits, in Thompson, J. ed., Magmas, fluids, and ore de-posits: Mineralogical Association of Canada Short Course, v. 23, p.139–152.
MAGMATIC-HYDROTHERMAL FLUID EVOLUTION IN THE BUTTE PORPHYRY Cu-Mo DEPOSIT, MONTANA 331
0361-0128/98/000/000-00 $6.00 331
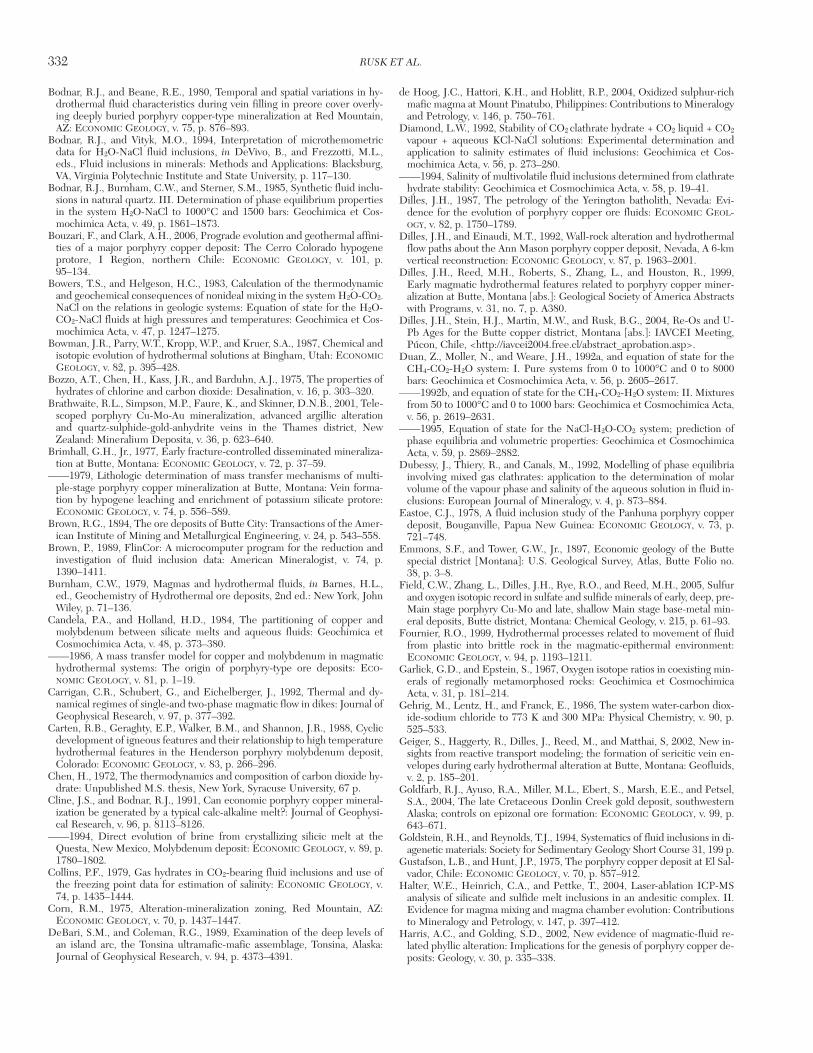
Bodnar, R.J., and Beane, R.E., 1980, Temporal and spatial variations in hy-drothermal fluid characteristics during vein filling in preore cover overly-ing deeply buried porphyry copper-type mineralization at Red Mountain,AZ: ECONOMIC GEOLOGY, v. 75, p. 876–893.
Bodnar, R.J., and Vityk, M.O., 1994, Interpretation of microthemometricdata for H2O-NaCl fluid inclusions, in DeVivo, B., and Frezzotti, M.L.,eds., Fluid inclusions in minerals: Methods and Applications: Blacksburg,VA, Virginia Polytechnic Institute and State University, p. 117–130.
Bodnar, R.J., Burnham, C.W., and Sterner, S.M., 1985, Synthetic fluid inclu-sions in natural quartz. III. Determination of phase equilibrium propertiesin the system H2O-NaCl to 1000°C and 1500 bars: Geochimica et Cos-mochimica Acta, v. 49, p. 1861–1873.
Bouzari, F., and Clark, A.H., 2006, Prograde evolution and geothermal affini-ties of a major porphyry copper deposit: The Cerro Colorado hypogeneprotore, I Region, northern Chile: ECONOMIC GEOLOGY, v. 101, p.95–134.
Bowers, T.S., and Helgeson, H.C., 1983, Calculation of the thermodynamicand geochemical consequences of nonideal mixing in the system H2O-CO2-
NaCl on the relations in geologic systems: Equation of state for the H2O-CO2-NaCl fluids at high pressures and temperatures: Geochimica et Cos-mochimica Acta, v. 47, p. 1247–1275.
Bowman, J.R., Parry, W.T., Kropp, W.P., and Kruer, S.A., 1987, Chemical andisotopic evolution of hydrothermal solutions at Bingham, Utah: ECONOMICGEOLOGY, v. 82, p. 395–428.
Bozzo, A.T., Chen, H., Kass, J.R., and Barduhn, A.J., 1975, The properties ofhydrates of chlorine and carbon dioxide: Desalination, v. 16, p. 303–320.
Brathwaite, R.L., Simpson, M.P., Faure, K., and Skinner, D.N.B., 2001, Tele-scoped porphyry Cu-Mo-Au mineralization, advanced argillic alterationand quartz-sulphide-gold-anhydrite veins in the Thames district, NewZealand: Mineralium Deposita, v. 36, p. 623–640.
Brimhall, G.H., Jr., 1977, Early fracture-controlled disseminated mineraliza-tion at Butte, Montana: ECONOMIC GEOLOGY, v. 72, p. 37–59.
——1979, Lithologic determination of mass transfer mechanisms of multi-ple-stage porphyry copper mineralization at Butte, Montana: Vein forma-tion by hypogene leaching and enrichment of potassium silicate protore:ECONOMIC GEOLOGY, v. 74, p. 556–589.
Brown, R.G., 1894, The ore deposits of Butte City: Transactions of the Amer-ican Institute of Mining and Metallurgical Engineering, v. 24, p. 543–558.
Brown, P., 1989, FlinCor: A microcomputer program for the reduction andinvestigation of fluid inclusion data: American Mineralogist, v. 74, p.1390–1411.
Burnham, C.W., 1979, Magmas and hydrothermal fluids, in Barnes, H.L.,ed., Geochemistry of Hydrothermal ore deposits, 2nd ed.: New York, JohnWiley, p. 71–136.
Candela, P.A., and Holland, H.D., 1984, The partitioning of copper andmolybdenum between silicate melts and aqueous fluids: Geochimica etCosmochimica Acta, v. 48, p. 373–380.
——1986, A mass transfer model for copper and molybdenum in magmatichydrothermal systems: The origin of porphyry-type ore deposits: ECO-NOMIC GEOLOGY, v. 81, p. 1–19.
Carrigan, C.R., Schubert, G., and Eichelberger, J., 1992, Thermal and dy-namical regimes of single-and two-phase magmatic flow in dikes: Journal ofGeophysical Research, v. 97, p. 377–392.
Carten, R.B., Geraghty, E.P., Walker, B.M., and Shannon, J.R., 1988, Cyclicdevelopment of igneous features and their relationship to high temperaturehydrothermal features in the Henderson porphyry molybdenum deposit,Colorado: ECONOMIC GEOLOGY, v. 83, p. 266–296.
Chen, H., 1972, The thermodynamics and composition of carbon dioxide hy-drate: Unpublished M.S. thesis, New York, Syracuse University, 67 p.
Cline, J.S., and Bodnar, R.J., 1991, Can economic porphyry copper mineral-ization be generated by a typical calc-alkaline melt?: Journal of Geophysi-cal Research, v. 96, p. 8113–8126.
——1994, Direct evolution of brine from crystallizing silicic melt at theQuesta, New Mexico, Molybdenum deposit: ECONOMIC GEOLOGY, v. 89, p.1780–1802.
Collins, P.F., 1979, Gas hydrates in CO2-bearing fluid inclusions and use ofthe freezing point data for estimation of salinity: ECONOMIC GEOLOGY, v.74, p. 1435–1444.
Corn, R.M., 1975, Alteration-mineralization zoning, Red Mountain, AZ:ECONOMIC GEOLOGY, v. 70, p. 1437–1447.
DeBari, S.M., and Coleman, R.G., 1989, Examination of the deep levels ofan island arc, the Tonsina ultramafic-mafic assemblage, Tonsina, Alaska:Journal of Geophysical Research, v. 94, p. 4373–4391.
de Hoog, J.C., Hattori, K.H., and Hoblitt, R.P., 2004, Oxidized sulphur-richmafic magma at Mount Pinatubo, Philippines: Contributions to Mineralogyand Petrology, v. 146, p. 750–761.
Diamond, L.W., 1992, Stability of CO2 clathrate hydrate + CO2 liquid + CO2
vapour + aqueous KCl-NaCl solutions: Experimental determination andapplication to salinity estimates of fluid inclusions: Geochimica et Cos-mochimica Acta, v. 56, p. 273–280.
——1994, Salinity of multivolatile fluid inclusions determined from clathratehydrate stability: Geochimica et Cosmochimica Acta, v. 58, p. 19–41.
Dilles, J.H., 1987, The petrology of the Yerington batholith, Nevada: Evi-dence for the evolution of porphyry copper ore fluids: ECONOMIC GEOL-OGY, v. 82, p. 1750–1789.
Dilles, J.H., and Einaudi, M.T., 1992, Wall-rock alteration and hydrothermalflow paths about the Ann Mason porphyry copper deposit, Nevada, A 6-kmvertical reconstruction: ECONOMIC GEOLOGY, v. 87, p. 1963–2001.
Dilles, J.H., Reed, M.H., Roberts, S., Zhang, L., and Houston, R., 1999,Early magmatic hydrothermal features related to porphyry copper miner-alization at Butte, Montana [abs.]: Geological Society of America Abstractswith Programs, v. 31, no. 7, p. A380.
Dilles, J.H., Stein, H.J., Martin, M.W., and Rusk, B.G., 2004, Re-Os and U-Pb Ages for the Butte copper district, Montana [abs.]: IAVCEI Meeting,Púcon, Chile, <http://iavcei2004.free.cl/abstract_aprobation.asp>.
Duan, Z., Moller, N., and Weare, J.H., 1992a, and equation of state for theCH4-CO2-H2O system: I. Pure systems from 0 to 1000°C and 0 to 8000bars: Geochimica et Cosmochimica Acta, v. 56, p. 2605–2617.
——1992b, and equation of state for the CH4-CO2-H2O system: II. Mixturesfrom 50 to 1000°C and 0 to 1000 bars: Geochimica et Cosmochimica Acta,v. 56, p. 2619–2631.
——1995, Equation of state for the NaCl-H2O-CO2 system; prediction ofphase equilibria and volumetric properties: Geochimica et CosmochimicaActa, v. 59, p. 2869–2882.
Dubessy, J., Thiery, R., and Canals, M., 1992, Modelling of phase equilibriainvolving mixed gas clathrates: application to the determination of molarvolume of the vapour phase and salinity of the aqueous solution in fluid in-clusions: European Journal of Mineralogy, v. 4, p. 873–884.
Eastoe, C.J., 1978, A fluid inclusion study of the Panhuna porphyry copperdeposit, Bouganville, Papua New Guinea: ECONOMIC GEOLOGY, v. 73, p.721–748.
Emmons, S.F., and Tower, G.W., Jr., 1897, Economic geology of the Buttespecial district [Montana]: U.S. Geological Survey, Atlas, Butte Folio no.38, p. 3–8.
Field, C.W., Zhang, L., Dilles, J.H., Rye, R.O., and Reed, M.H., 2005, Sulfurand oxygen isotopic record in sulfate and sulfide minerals of early, deep, pre-Main stage porphyry Cu-Mo and late, shallow Main stage base-metal min-eral deposits, Butte district, Montana: Chemical Geology, v. 215, p. 61–93.
Fournier, R.O., 1999, Hydrothermal processes related to movement of fluidfrom plastic into brittle rock in the magmatic-epithermal environment:ECONOMIC GEOLOGY, v. 94, p. 1193–1211.
Garlick, G.D., and Epstein, S., 1967, Oxygen isotope ratios in coexisting min-erals of regionally metamorphosed rocks: Geochimica et CosmochimicaActa, v. 31, p. 181–214.
Gehrig, M., Lentz, H., and Franck, E., 1986, The system water-carbon diox-ide-sodium chloride to 773 K and 300 MPa: Physical Chemistry, v. 90, p.525–533.
Geiger, S., Haggerty, R., Dilles, J., Reed, M., and Matthai, S, 2002, New in-sights from reactive transport modeling; the formation of sericitic vein en-velopes during early hydrothermal alteration at Butte, Montana: Geofluids,v. 2, p. 185–201.
Goldfarb, R.J., Ayuso, R.A., Miller, M.L., Ebert, S., Marsh, E.E., and Petsel,S.A., 2004, The late Cretaceous Donlin Creek gold deposit, southwesternAlaska; controls on epizonal ore formation: ECONOMIC GEOLOGY, v. 99, p.643–671.
Goldstein, R.H., and Reynolds, T.J., 1994, Systematics of fluid inclusions in di-agenetic materials: Society for Sedimentary Geology Short Course 31, 199 p.
Gustafson, L.B., and Hunt, J.P., 1975, The porphyry copper deposit at El Sal-vador, Chile: ECONOMIC GEOLOGY, v. 70, p. 857–912.
Halter, W.E., Heinrich, C.A., and Pettke, T., 2004, Laser-ablation ICP-MSanalysis of silicate and sulfide melt inclusions in an andesitic complex. II.Evidence for magma mixing and magma chamber evolution: Contributionsto Mineralogy and Petrology, v. 147, p. 397–412.
Harris, A.C., and Golding, S.D., 2002, New evidence of magmatic-fluid re-lated phyllic alteration: Implications for the genesis of porphyry copper de-posits: Geology, v. 30, p. 335–338.
332 RUSK ET AL.
0361-0128/98/000/000-00 $6.00 332

Harris, A.C., Golding, S.D., and White, N.C, 2005, Bajo de la Alumbreracopper-gold deposit: Stable isotope evidence for a porphyry-related hy-drothermal system dominated by magmatic aqueous fluids: ECONOMIC GE-OLOGY, v. 100, p. 63–86.
Hattori, K.H., and Keith, J.D., 2001, Contribution of mafic melt to porphyrycopper mineralization: evidence from Mount Pinatubo, Philippines, andBingham Canyon, Utah, USA: Mineralium Deposita, v. 36, p. 799–806.
Hedenquist, J., and Henley, R., 1985, The importance of CO2 on freezingpoint measurements of fluid inclusions: Evidence from active geothermalsystems and implications for epithermal ore deposition: ECONOMIC GEOL-OGY, v. 80, p. 1379–1406.
Hedenquist, J., Arribas, A., and Reynolds, J., 1998, Evolution of an intrusion-centered hydrothermal system: Far Southeast-Lepanto porphyry and epi-thermal Cu-Au deposits, Philippines: ECONOMIC GEOLOGY, v. 93, p. 373–404.
Heinrich, C.A., Günther, D., Audétat, A., Ulrich, T., and Frischknecht, R.,1999, Metal fractionation between magmatic brine and vapor, determinedby micro-analysis of fluid inclusions: Geology, v. 27, p. 755–758.
Hemley, J.J., Cygan, G.L., Fein, J.B., Robinson, G.R., and d’Angelo, W.M.,1992, Hydrothermal ore-forming processes in the light of studies in rock-buffered systems: I. Iron-copper-zinc-lead sulfide solubility relations: ECO-NOMIC GEOLOGY, v. 87, p. 1–22.
Houston, R.A., 2002, Geology and structural history of the Butte district,Montana: Unpublished M.S. thesis, Corvallis, Oregon, Oregon State Uni-versity, 45 p.
John, D., 1989, Geologic setting, depths of emplacement, and regional dis-tribution of fluid inclusions in intrusions of the central Wasatch Mountains,Utah: ECONOMIC GEOLOGY, v. 84, p. 386–409.
Khashgerel, B., Rye, R.O., Hedenquist, J.W., and Imants, K., 2006, Geol-ogy and Reconnaissance stable isotope study of the Oyu Tolgoi porphyryCu-Au system, South Gobi, Mongolia: ECONOMIC GEOLOGY, v. 101, p.503–522.
Landtwing, M.R., Pettke, T., Halter, W.E., Heinrich, C.A., Redmond, P.B.,Einaudi, M.T., and Kunze, K., 2005, Copper deposition during quartz dis-solution by cooling magmatic-hydrothermal fluids: The Bingham porphyry:Earth and Planetary Science Letters, v. 235, 229–243.
Larson, S.D., 1955, Phase studies of the two-component carbon dioxide-water system involving the carbon dioxide hydrate: Unpublished Ph.D. dis-sertation, Ann Arbor, University of Michigan, 301 p.
Liu, W., and McPhail, D.C., 2005, Thermodynamic properties of copperchloride complexes and copper transport in magmatic-hydrothermal solu-tions: Chemical Geology, v. 221, p. 21–39.
Lowell, J.D., and Guilbert, J.M., 1970, Lateral and vertical alteration-miner-alization zoning in porphyry ore deposits: ECONOMIC GEOLOGY, v. 65, p.373–408.
Lund, K., Aleinkoff, J., Kunk, M., Unruh, D., Zeihen, G., Hodges, W., DuBray, E., and O’Neill, J., 2002, Shrimp U-Pb and 40Ar/39Ar age constraintsfor relating plutonism and mineralization in the Boulder batholith region,Montana: ECONOMIC GEOLOGY, v. 97, p. 241–267.
Manske, S.L., and Paul, A.H., 2002, Geology of a major new porphyry cop-per center in the Superior (Pioneer) district, Arizona: ECONOMIC GEOLOGY,v. 97, p. 197–220.
Martin, M.W., Dilles, J.H., and Proffett, J.M., 1999, U-Pb geochronilogicconstraints for the Butte porphyry system [abs.]: Geological Society ofAmerica Abstracts with Programs, v. 31, no. 7, p. A380.
Mavrogenes, J.A., and Bodnar, R.J., 1994, Hydrogen movement into and outof fluid inclusions in quartz: Experimental evidence and geologic implica-tions: Geochimica et Cosmochimica Acta, v. 58, p. 141–148.
Meyer, C., 1965, An early potassic type of wall rock alteration at Butte, Mon-tana: American Mineralogist, v. 50, p. 1717–1722.
Meyer, C., and Hemley, J.J., 1967, Wall rock alteration, in Barnes, H.L. ed.,Geochemistry of hydrothermal ore deposits: New York, Holt, Rinehart andWinston, Inc., p. 166–232.
Meyer, C., Shea, E., Goddard, C., and staff, 1968, Ore deposits at Butte,Montana, in Ridge, J.D. ed., Ore deposits of the United States 1933–1967[Graton-Sales volume]: New York, American Institute of Mining, Metallur-gical, and Petroleum Engineers, v. 2, p. 1363–1416.
Miller, B.J., 2004, Aqueous fluid inclusions in the Butte, Montana, Mainstage vein system: Unpublished master’s thesis, Eugene, Oregon, Univer-sity of Oregon, 101 p.
Miller, R.N., ed., 1973, A field meeting held August 18–21, 1973, Butte,Montana, sponsored by the Society of Economic Geologists, U.S. Geologi-cal Survey, and Anaconda Company, Geological Department <http://books-geology.com/montana.htm>.
Muntean, J.L., and Einaudi, M.T., 2001, Porphyry-epithermal transition:Maracunga belt, northern Chile: ECONOMIC GEOLOGY, v. 96, p. 743–772.
Nash, T.J., 1976, Fluid inclusion petrology data from porphyry copper de-posits and applications to exploration: U.S. Geological Survey ProfessionalPaper 907-D, 16 p.
Nash, T.J., and Cunningham, C.G., Jr., 1974, Fluid inclusion studies of theporphyry copper deposit at Bagdad, AZ: U.S. Geological Survey Journal ofResearch, v. 2, no. 1, p. 31–34.
Ossandon, C.G., Freraut, C.R., and Gustafson, L.B., 2001, Geology of theChuquicamata mine; a progress report: ECONOMIC GEOLOGY, v. 96, p.249–270.
Parry, W.T., 1986, Estimation of XCO2, Pressure and fluid inclusion volumefrom fluid inclusion temperature measurements in the system NaCl-CO2-H2O: ECONOMIC GEOLOGY, v. 81, p. 1009–1013.
Phillips, C.H., Smith, T.W., and Harrison, E.D., 1998, Alteration metal zon-ing and ore controls in the Bingham Canyon porphyry copper deposits,Utah: Society of Economic Geologists Guidebook Series v. 29, p. 133–145.
Pichavant, M., Ramboz, C., and Weisbrod, A., 1982, Fluid immiscibility innatural processes: Use and misuse of fluid inclusion data; I. Phase equilib-ria analysis—a theoretical and geometrical approach: Chemical Geology, v.37, p. 1–27.
Preece, R.K., and Beane, R.E., 1982, Constrasting evolutions of hydrother-mal alteration in quartz monzonite and quartz diorite wall rocks at the Sier-rita porphyry copper deposit, AZ: ECONOMIC GEOLOGY, v. 77, p.1621–1641.
Proffett, J.M., 1973, Structure of the Butte district, Montana, in Miller, R.N.,ed., A field meeting held August 18–21, 1973, Butte, Montana: Sponsoredby the Society of Economic Geologists, U.S. Geological Survey, and Ana-conda Company, Geological Department, p. G1–12.
Ratcliff, M.W., 1973, Copper and molybdenum mineralization in the conti-nental deposit, East Butte district, Montana: in Miller, R.N., ed., A FieldMeeting held August 18–21, 1973, Butte, Montana: Sponsored by the So-ciety of Economic Geologists, U.S. Geological Survey, and Anaconda Com-pany, Geological Department, p. I1–I8.
Redmond, P.B., Einaudi, M.T., Inan, E.E., Landtwing, M.R., and Heinrich,C.A., 2004, Copper deposition by fluid cooling in intrusion-centered sys-tems: New insights from the Bingham porphyry ore deposit, Utah: Geology,v. 32, p. 217–220.
Reed, M.H., 1999, Zoning of metals and early potassic and sericitic hy-drothermal alteration in the Butte, Montana, porphyry Cu–Mo deposit[abs.]: Geological Society of America Abstracts with Programs, v. 31, no. 7,p. A381.
Reed, M., and Rusk, B., 2001, Insights into supercritical hydrothermalprocesses from numerical models of potassic hydrothermal alteration, andSEM-CL imaging of vein quartz at Butte, Montana, in Toshiyuki, H., ed.,Proceedings from the Workshop on Potential Thermal Extraction fromDeep-seated Rock Masses: Sendai, Japan, Tohoku University, p. 37–53.
Reed, M.H., Rusk, B., Palandri, J., and Dilles, J., 2005, The Butte hy-drothermal system: One magmatic fluid yielded all vein types [abs.]: Geo-logical Society of America Abstracts with Programs, v. 37, no. 7, p. A315.
Reynolds, J.T., and Beane, R.E., 1985, Evolution of hydrothermal fluid char-acteristics at the Santa Rita, New Mexico, porphyry copper deposit: ECO-NOMIC GEOLOGY, v. 80, p. 1328–1347.
Roberts, S.A., 1973, Pervasive early alteration in the Butte district, Mon-tana, in Miller, R.N. ed., A Field Meeting held August 18–21, 1973, Butte,Montana: Sponsored by the Society of Economic Geologists, U.S. Geo-logical Survey, and Anaconda Company, Geological Department, p.HH1–HH8.
——1975, Early hydrothermal alteration and mineralization in the Butte dis-trict, Montana: Unpublished Ph.D. dissertation, Harvard University, 157 p.
Roedder, E., 1971, Fluid inclusion studies on the porphyry-type ore depositsat Bingham, Utah, Butte, Montana, and Climax, Colorado: ECONOMIC GE-OLOGY, v. 66, p. 98–120.
——1984, Fluid inclusions: Reviews in Mineralogy, v. 12, 646 p.Rosso, K.M., and Bodnar, R.J., 1995, Microthermometric and Raman spec-
troscopic detection limits of CO2 in fluid inclusions and the Raman spec-troscopic characterization of CO2: Geochimica et Cosmochimica Acta, v. 59,p. 3961–3975.
Rusk, B.G., 2003, Cathodoluminescent quartz textures and fluid inclusions inveins of the porphyry copper-molybdenum deposit in Butte, Montana:Constraints on the physical and chemical evolution of the hydrothermalsystem, Unpublished Ph.D. dissertation, Eugene, Oregon, University ofOregon, 285 p.
MAGMATIC-HYDROTHERMAL FLUID EVOLUTION IN THE BUTTE PORPHYRY Cu-Mo DEPOSIT, MONTANA 333
0361-0128/98/000/000-00 $6.00 333

Rusk, B.G., and Reed, M.H., 2002, Scanning electron microscope-cathodo-luminescence of quartz reveals complex growth histories in veins from theButte porphyry copper deposit, Montana: Geology, v. 30, p. 727–730.
Rusk, B., Reed, M., Dilles, J.H., Klemm, L., and Heinrich, C.A., 2004, Com-positions of magmatic hydrothermal fluids determined by LA-ICP-MS offluid inclusions from the porphyry copper-molybdenum deposit at Butte,Montana: Chemical Geology, v. 210, p. 173–199.
Rusk, B.G., Landis, G., Hunt, A.G., Hofstra, A., Reed, M.H., Dilles, J.H.,and Rye, R.O., 2005, Origin and evolution of hydrothermal fluids thatformed the porphyry Cu-Mo deposit in Butte, Montana: A multi-facetedfluid inclusion study [abs.]: Geological Society of America Abstracts withPrograms, v. 37, no. 7, p. A315.
Rusk, B., Reed, M., Dilles, J., and Kent, A., 2006, Intensity of quartzcathodoluminescence and trace element content of quartz from the por-phyry copper deposit in Butte, Montana: American Mineralogist, v. 91, p.1300–1312.
Rusk, B.G., Hofstra, A.H., Emsbo, P., Hunt, A.G., Landis, G.P., and Rye,R.O., 2007, Origin and compositions of fluids that form porphyry copper(Au-Mo) deposits [abs.]: Geological Society of America Abstracts with Pro-grams, v. 39, no. 6, p. 608.
Sales, R.H., 1914, Ore deposits at Butte, Montana: American Institute ofMining and Metallurgical Engineers, Transactions, v. 46, p. 3–109.
Sales, R., and Meyer, C., 1948, Wall rock alteration at Butte: American Insti-tute of Mining and Metallurgical Engineers, Transactions, v. 46, p. 4–106.
Schmidt, C., and Bodnar, R.J., 2000, Synthetic fluid inclusions: XVI. PVTXproperties in the system H2O-NaCl-CO2 at elevated temperatures, pres-sures, and salinities: Geochimica et Cosmochimica Acta, v. 64, p.3853–3869.
Seedorff, E., and Einaudi, M.T., 2004, Henderson porphyry molybdenumsystem, Colorado: II Decoupling of introduction and deposition of metalsduring geochemical evolution of hydrothermal fluids: ECONOMIC GEOL-OGY, v. 99, p. 39–72.
Seedorff, E., Dilles, J.H., Proffett, J.M., Einaudi, M.T., Zurcher, L., Stavast,W.J.A., Johnson, D.A., and Barton, M.D., 2005, Porphyry deposits: Char-acteristics and origin of hypogene features: ECONOMIC GEOLOGY 100THANNIVERSARY VOLUME, p. 251–298.
Sheppard, S.M.F., and Gustafson, L.B., 1976, Oxygen and hydrogen isotopesin the porphyry copper deposit at El Salvador, Chile: ECONOMIC GEOLOGY,v. 71, p. 1549–1559.
Sheppard, S.M.F., and Taylor, J.P., 1974, Hydrogen and oxygen isotope evi-dence for the origins of water in the Boulder batholith and the Butte oredeposits, Montana: ECONOMIC GEOLOGY, v. 69, p. 926–946.
Simon, A.C., Pettke, T., Candela, P.A., Piccoli, P.M., Heinrich, C., 2006, Cop-per partitioning in a melt-vapor-brine-magnetite-pyrrhotite assemblage:Geochimica et Cosmochimica Acta, v. 70, p. 5583–5600.
Smedes, H.W., 1973, Regional geologic setting of the Boulder batholith,Montana, in Miller, R.N. ed., A Field Meeting held August 18-21, 1973,Butte, Montana: Sponsored by the Society of Economic Geologists, U.S.Geological Survey, and Anaconda Company, Geological Department, sec.A.
Snee, L., Miggins, D., Geissman, J., Reed, M., Dilles, J., and Zhang, L., 1999,Thermal history of the Butte porphyry system, Montana [abs.]: GeologicalSociety of America Abstracts with Program, v. 31, p. 380.
Sourirajan, S., and Kennedy, G.C., 1962, The system H2O-NaCl at elevatedtemperatures and pressures: American Journal of Science, v. 260, p.115–141.
Sterner, M., 1992, Homogenization of fluid inclusions to the vapor phase:The apparent homogenization phenomenon: ECONOMIC GEOLOGY, v. 87, p.1616–1623.
Sterner, S.M., and Bodnar, R.J., 1984, Synthetic fluid inclusions in naturalquartz. I. Compositional types synthesized and applications to experimen-tal geochemistry: Geochimica et Cosmochimica Acta, v. 48, p. 2659–2668.
Takenouchi, S., and Kennedy, G.C., 1965, The solubility of carbon dioxide inNaCl solutions at high temperatures and pressures: American Journal ofScience, v. 263, p. 445–454.
Taylor, H.P., 1997, Oxygen and hydrogen isotope relationships in hydrother-mal mineral deposits, in Barnes, H.L. ed., Geochemistry of hydrothermalore deposits, 3rd ed: New York, John Wiley and sons, p. 229–302.
Tilling, R.I., 1973, The Boulder batholith, Montana: Product of two contem-poraneous, but chemically and isotopically distinct magma series: in Miller,R.N. ed., A Field Meeting held August 18-21, 1973, Butte, Montana: Spon-sored by the Society of Economic Geologists, U.S. Geological Survey, andAnaconda Company, Geological Department, sec. C.
Tilling, R.I., Klepper, M.R., Obradovich, J.D., 1968, K-Ar ages and time spanof emplacement of the Boulder batholith, Montana: American Journal ofScience, v. 266, p. 671–689.
Ulrich, T., Günther, D, and Heinrich, C.A., 2001, The evolution of a por-phyry Cu-Au deposit based on LA-ICP-MS analyses of fluid inclusions:Bajo de la Alumbrera, Argentina: ECONOMIC GEOLOGY, v. 96, p. 1743-1774.
Urusova, M.A., 1975 Volume properties of aqueous solutions of sodium chlo-ride at elevated temperatures and pressures: Russian Journal of InorganicChemistry, v. 20, p. 1717–1721.
Wang, Y., Sasaki, M., Sasada, M., and Chen, C., 1999, Fluid inclusion studiesof the Chinkuashih high-sulfidation gold-copper deposits in Taiwan; Pan-American conference on research on fluid inclusions: Chemical Geology, v.154, p. 155–167.
Wanhainen, C., Broman, C., and Martinsson, O., 2003, The Aitik Cu-Au-Agdeposit in northern Sweden; A product of high salinity fluids: MineraliumDeposita, v. 38, p. 715–726.
Wark, D.A., and Watson, E.B., 2006, TitaniQ: A titanium-in-quartz geother-mometer: Contributions to Mineralogy and Petrology, v. 152, p. 743–754.
Watanabe, Y., and Hedenquist, J.W., 2001, Mineralogic and stable isotopezonation at the surface over El Salvador porphyry copper deposit, Chile:ECONOMIC GEOLOGY, v. 96, p. 1775–1797.
Weed, W.H., 1912, Geology and ore depositions of the Butte district, Mon-tana: U.S. Geological Survey Professional Paper 74, 262 p.
White, W.H., Bookstrom, A.A., Kamilli, R.J., Ganster, M.W., Smith, R.P.,Ranta, D.E., and Steininger, R.C., 1981, Character and origin of Climax-type porphyry molybdenum deposits: ECONOMIC GEOLOGY 75TH ANNIVER-SARY VOLUME, p. 270–316.
Wiebe, R.A., 1996, Mafic-silicic layered intrusions: The role of basaltic injec-tions on magmatic processes and the evolution of silicic magma chambers:Transactions of the Royal Society of Edinburgh: Earth Sciences, v. 87, p.233–242.
Zhang, L., 2000, Stable isotope investigation of a hydrothermal alteration sys-tem; Butte porphyry copper deposit: Unpublished Ph.D. dissertation, Cor-vallis, Oregon, Oregon State University, 182 p.
Zhang, L., Dilles, J.H., Field, C.W., and Reed, M.H., 1999, Oxygen and hy-drogen isotope geochemistry of pre-Main stage porphyry Cu-Mo mineral-ization at Butte, Montana [abs.]: Geological Society of America Abstractswith Programs, v. 31, no. 7. p. A381.
Zotov, A.V., Kudrin, A.V., Levin, K.A., Shikina, N.D., and Varyash, L.N.,1995, Experimental studies of the solubility and complexing of selected oreelements (Au, Ag, Cu, Mo, As, Sb, Hg) in aqueous solutions, inShmulovich, K.I., Yardley, B.W.D., and Gonchar, G.A., eds, Fluids in thecrust: Equilibrium and transport properties: London, Chapman and Hall,p. 95–138.
334 RUSK ET AL.
0361-0128/98/000/000-00 $6.00 334