economic evaluation of the small-scale marine …
TRANSCRIPT

ECONOMIC EVALUATION OF THE SMALL-SCALE MARINE FISHERIES
USING THE S-C-P APPROACH AT SELECTED LANDING SITES ALONG
THE KENYAN COAST
PATRICK KIMANI MANG’URIU
A thesis submitted in partial fulfilment of the requirements for the Degree of
Doctor of Philosophy in Fisheries of Pwani University
JANUARY, 2020

ii
DECLARATION

iii
DEDICATION
This has been a long journey that robbed my family quality time. I dedicate this achievement to
the Kimanis and my parents for their support.

iv
ACKNOWLEDEGMENT
I wish to thank my Supervisors; Prof. Mlewa, Chrisestom Mwatete, Prof. Julius Manyala and
Dr. Andrew Wamukota for their dedicated guidance throughout the period of this study. Their
insight and advice have made all the difference. I also thank Dr. Bernerd Fulanda for his initial
participation in developing the study.
I would like to sincerely thank Western Indian Ocean Marine Science Association (WIOMSA)
for providing Marine Research Grant (MARG 1) to support this study in the study sites of
Shimoni and Vanga. I also wish to thank the National Commission of Science, Technology and
Innovation (NACOSTI) for providing a partial grant to undertake part of the study in Malindi
and Mayungu study sites.
Sincere gratitude goes to my field assistants; Salim Ali and Jane Mwikali for their dedication
in data collection and organizing meetings with respondents. Lastly all respondents are duly
acknowledged for providing their valuable time to answer our questions.
v
ABSTRACT
Small-scale marine fisheries in Kenya lack adequate data and information to help in decision-
making concerning required interventions. These inadequacies include data and information on
actors’ behaviour, financial and economic outcomes in context of structure, conduct and
performance (S-C-P) paradigm, constraints and opportunities and level of government support.
Earlier studies have addressed some aspects, but gaps still exist and this thesis contributes to
bridging them. This study was conducted at selected sites along Kenya’s coast, namely;
Malindi, Mayungu, Shimoni, Vanga and Mombasa. A total of 403 respondents (fishers,
middlemen and small-scale processors) were interviewed from November 2014 through
September 2016. In addition, 114 respondents participated in 12 Focus Group Discussions
(FGD) meetings. Key findings showed that structure did not significantly influence
respondents’ conduct in most cases. There was no statistical significant influence of structure
in context of percent ownership and value of equipment on conduct factors amongst fishers,
middlemen and processors. Similarly, structure and conduct did not significantly influence
profitability amongst middlemen (p=0.462) and processors (p=0.538), but had significant
influence on fishers’ profitability (p=0.008). Therefore, S-C-P factors were less important in
influencing profitability. Instead other variables were more important. Fish sale was
significantly influencing profitability amongst all actors; fishers (p=<0.005), middlemen
(p=<0.005) and processors (p=<0.005), while variable costs influenced profitability amongst
fishers (p=<0.005) and processors (p=<0.005). Financial profits were above opportunity cost of
labour for unskilled alternative employment (KES 54-7,481), indicating importance of the
fishery to livelihoods. Findings on constraints and opportunities showed that lack of access to
capital was the most severe constraint. Erratic supply of fish also affected pricing and access to
fish at different times, where prices increased during scarcity periods and declined during
oversupply periods. Results also showed that majority of respondents had negative perception
regarding performance of county and national government in promoting fish marketing, value

vi
addition and provision of equipment, but rated promotion of cooperation and support to
functioning of Beach Management Units (BMUs) positively. Demographic and socio-economic
factors had minimal effect on actors’ perception and lacked strong clear patterns. Therefore,
respondent characteristics were not reliable predictors of actors’ perception of government
performance in implementation of value chain development objectives. This study provides new
insight on marine small-scale fisheries useful for management and development of small-scale
fisheries at national, regional and global scales.

vii
TABLE OF CONTENTS PAGE
DECLARATION .................................................................................................................. ii
DEDICATION ..................................................................................................................... iii
ACKNOWLEDEGMENT .................................................................................................. iv
ABSTRACT ........................................................................................................................... v
CHAPTER 1: BACKGROUND OF THE STUDY ................................................................ 1
General introduction ..................................................................................................... 1
Statement of the problem .............................................................................................. 8
Goal of the study ............................................................................................................ 9
Specific objectives .......................................................................................................... 9
Research questions ...................................................................................................... 10
Study hypotheses ......................................................................................................... 10
Justification of the study ............................................................................................. 11
Significance of the study ............................................................................................. 11
Scope of the Study ....................................................................................................... 13
Conceptual model ....................................................................................................... 14
Kenya’s small-scale marine fisheries ........................................................................ 15
General review of literature ...................................................................................... 18
1.12.1 Description of small-scale fisheries ....................................................................... 18
1.12.2 Global overview and significance of small-scale fisheries .................................... 19
1.12.3 Overview of Kenya’s small-scale fisheries ............................................................. 21
1.12.4 Data challenges and perceived low contribution of small-scale fisheries ............. 23
1.12.5 The value chain approach in data collection ......................................................... 24
1.12.6 The Structure-Conduct-Performance approach ..................................................... 26
1.12.7 Institutional and regulatory environment ............................................................... 34
1.12.8 Constraints and opportunities ................................................................................ 38
Description of the study area ..................................................................................... 40

viii
Research design and sampling .................................................................................. 47
1.14.1 Study design ............................................................................................................ 48
1.14.2 Sampling ................................................................................................................. 49
CHAPTER 2: STRUCTURE, CONDUCT AND PERFORMANCE IN SMALL-SCALE
FISHERIES VALUE CHAIN ................................................................................................ 52
Introduction ................................................................................................................. 52
Materials and methods ................................................................................................ 53
2.2.1 Data collection on structure ..................................................................................... 53
2.2.2 Data collection on conduct ....................................................................................... 54
2.2.3 Data collection on performance ............................................................................... 55
2.2.4 Data analysis of structure based on actor capitalization ......................................... 56
2.2.5 Data analysis of structure in context of market concentration ................................ 57
2.2.6 Data analysis of conduct in context of fish grading and actor choices ................... 58
2.2.7 Data analysis on performance ................................................................................. 59
2.2.8 Statistical analysis of relationship between structure, conduct and performance ... 60
Results ........................................................................................................................... 65
2.3.1 Demographic and socio-economic characteristics of small-scale fisheries ............ 65
2.3.2 Structure in context of actor capitalization .............................................................. 66
2.3.3 Structure in context of market concentration ........................................................... 69
2.3.4 Conduct in context of fish grading, pricing and actors’ choice ............................... 69
2.3.5 Results of diagnostic tests on models for influence of structure on conduct ............ 72
2.3.6 Influence of structure on fishers’ conduct ................................................................ 73
2.3.7 Influence of structure on middlemen’s conduct ....................................................... 75
2.3.8 Influence of structure on processors’ conduct ......................................................... 81
2.3.9 Actors’ performance in context of fish quantities, purchases and sales .................. 85
2.3.10 Actors’ performance in context of costs ................................................................. 87
2.3.11 Actors’ performance in context of financial profit ................................................. 88

ix
2.3.12 Comparison of time spent, workforce, opportunity cost of labour and
profitability ........................................................................................................... 89
2.3.13 Factors influencing fishers’ financial performance ............................................... 91
2.3.14 Factor influencing middlemen’s financial performance ........................................ 94
2.3.15 Factors influencing processors’ financial performance ........................................ 97
Discussion ................................................................................................................... 100
Conclusion .................................................................................................................. 108
CHAPTER 3: ANALYSIS OF CONSTRAINTS AND OPPORTUNITIES IN SMALL-
SCALE FISHERIES VALUE CHAIN ................................................................................ 110
Introduction ............................................................................................................... 110
Materials and methods .............................................................................................. 111
3.2.1 The Analytical Hierarchical Process (AHP) .......................................................... 111
3.2.2 Data collection ....................................................................................................... 112
Data analysis .............................................................................................................. 114
Results ......................................................................................................................... 116
3.4.1 Fishers’ constraints ................................................................................................ 116
3.4.2 Fishers’ opportunities ............................................................................................ 119
3.4.3 Middlemen’s constraints ........................................................................................ 121
3.4.4 Middlemen’s opportunities ..................................................................................... 124
3.4.5 Processors’ constraints .......................................................................................... 127
3.4.6 Processors’ opportunities....................................................................................... 130
3.4.7 Actor’s loan uptake, training, ownership of equipment and support received ...... 132
Discussion ................................................................................................................... 134
Conclusion .................................................................................................................. 139
CHAPTER 4: ANALYSIS OF POLICY, REGULATORY AND INSTITUTIONAL
FRAMEWORKS IN SMALL-SCALE FISHERIES VALUE CHAIN ............................ 141

x
Introduction ............................................................................................................... 141
4.1.1 Policy and legal provisions in support of Kenya’s small-scale fisheries value chain
development ........................................................................................................ 142
Materials and methods .............................................................................................. 145
4.2.1 Data collection ....................................................................................................... 145
4.2.2 Data analysis .......................................................................................................... 146
Results ......................................................................................................................... 149
4.3.1 Actors’ perceptions of government performance ................................................... 149
4.3.2 Factors influencing actors’ perception of government performance on policy and
legal objectives ................................................................................................... 153
Discussion ................................................................................................................... 157
Conclusion .................................................................................................................. 162
CHAPTER 5: GENERAL DISCUSSION ........................................................................... 164
CHAPTER 6: GENERAL CONCLUSIONS AND RECOMMENDATIONS ................ 173
Conclusions ................................................................................................................ 173
New scholarly contributions from the study ........................................................... 174
Recommendations ..................................................................................................... 175
REFERENCES ...................................................................................................................... 177
APPENDICES ....................................................................................................................... 205
Appendix 1: Individual survey questionnaire................................................................. 205
Appendix 2: Focus group discussions questionnaire...................................................... 219

xi
LIST OF TABLES
Table 1.1. Sampling frame of respondents interviewed by actor group and site ...................... 51
Table 2.1. The description of variables used in Generalized Additive Model regression models
to analyze performance ........................................................................................ 64
Table 2.2. Summary of respondent’s demographic and socio-economic characteristics .......... 66
Table 2.3: Actor categorization based on capitalization, listed in decreasing order of value of
equipment ............................................................................................................. 68
Table 2.4. Herfindahl-Hirschman Index scores by site ............................................................. 69
Table 2.5. Percentage of fish grades targeted by respondents ................................................... 69
Table 2.6. Multinomial logistic regression results showing influence of percent ownership of
equipment on fish price determinants amongst fishers ........................................ 73
Table 2.7. Logistic regression results showing influence of percent ownership of equipment on
selling collusion amongst fishers ......................................................................... 74
Table 2.8. Logistic regression results showing influence of percent ownership of equipment on
access to selling price information amongst fishers ............................................. 75
Table 2.9. Multinomial logistic regression results showing influence of value of equipment on
fish buying price determinants amongst middlemen ............................................ 76
Table 2.10. Multinomial logistic regression results showing influence of value of equipment on
fish selling price determinants amongst middlemen ............................................ 77
Table 2.11. Logistic regression results showing influence of value of equipment on buying
collusion amongst middlemen .............................................................................. 78
Table 2.12. Logistic regression results showing influence of value of equipment on selling
collusion amongst middlemen .............................................................................. 78
Table 2.13. Logistic regression results showing influence of value of equipment on access to
buying price information amongst middlemen .................................................... 78

xii
Table 2.14. Logistic regression results showing influence of value of equipment on access to
selling price information amongst middlemen ..................................................... 80
Table 2.15. Multinomial logistic regression results showing influence of value of equipment on
choice of fish grade amongst middlemen ............................................................. 81
Table 2.16. Multinomial logistic regression results showing influence of value of equipment on
fish buying price determinants amongst processors ............................................. 82
Table 2.17. Logistic regression results showing influence of value of equipment on buying
collusion amongst processors ............................................................................... 83
Table 2.18. Logistic regression results showing influence of value of equipment on selling
collusion amongst processors ............................................................................... 83
Table 2.19. Logistic regression results showing influence of value of equipment on access to
buying price information amongst processors ...................................................... 84
Table 2.20. Logistic regression results showing influence of value of equipment on access to
selling price information amongst processors ...................................................... 84
Table 2.21. Multinomial logistic regression results showing influence of value of equipment on
choice of fish grade amongst processors .............................................................. 85
Table 2.22. Averages for variables on workforce, time spent, opportunity cost of labour and
financial profit per type of enterprise or fishing unit ........................................... 91
Table 2.23. Generalized Additive Model results of factors influencing fisher’s profitability .. 93
Table 2.24. Generalized Additive Model results of factors influencing middlemen’s financial
profitability ........................................................................................................... 95
Table 2.25. Generalized Additive Model results of factors influencing processors’ financial
profitability ........................................................................................................... 99
Table 3.1. Number of respondents involved in focus group discussions by site .................... 112
Table 4.1. Identified policy and legal objectives of Fisheries Acts and policy in support of SSFs
value chain development in Kenya .................................................................... 144
Table 4.2. Contextualization and description of statements used in Likert scale ................... 146

xiii
Table 4.3. Description of factor variables used in ordinal logistic regression models to analyze
governments’ performance of policy and legal objectives ................................. 148
Table 4.4. Actors’ perceptions of performance (in %) of national and county governments in
implementation of fisheries policy and legal objectives .................................... 150
Table 4.5. Coefficent estimates of factors influencing actors’ perceptions of performance of
national and county governments in implementation of fisheries policy and legal
objectives. Significant results are in bold ........................................................... 156

xiv
LIST OF FIGURES
Figure 1.1. Conceptual model for the study. Adopted from GTZ (2008) ................................. 15
Figure 1.2. A map of the Kenyan coastline showing study sites. Source Kimani, (2020) ........ 42
Figure 2.1. Detrended Correspondence Analysis plot showing association between fish type and
grade ..................................................................................................................... 70
Figure 2.2. Detrended Correspondence Analysis plot showing association between fish grade
and actor node ...................................................................................................... 70
Figure 2.3. Plot of median ex-vessel price of fish by grade. ..................................................... 71
Figure 2.4. (a.) Mean fish amounts that fishers, middlemen and processors deal in (b.) purchases
and sales amount per day in local currency (KES). Error bars represent mean
standard errors. All variables are expressed as per day units. .............................. 86
Figure 2.5. (a.) Mean variable and fixed costs amongst fishers and buyers, (b.) financial profit
per person. All variables are expressed as per day units. ..................................... 89
Figure 2.6. Estimated smooth terms of three variables on fishers’ profitability. Y-axes are the
dependent variable’s partial effects and the grey shadow bands show standard-
error confidence intervals. .................................................................................... 94
Figure 2.7. Estimated smooth terms of sales on middlemen’s profitability. Y-axis is the
dependent variable’s partial effects and the grey shadow bands show standard-
error confidence intervals ..................................................................................... 97
Figure 2.8. Estimated smooth terms of four variables on processors’ profitability. Y-axes are
the dependent variable’s partial effects and the grey shadow bands show standard-
error confidence intervals. .................................................................................. 100
Figure 3.1. Fishers’ constraints a) by combined sites, b) by each site. ................................... 118
Figure 3.2. Fishers’ opportunities a) by combined sites, b) by each site ................................ 121
Figure 3.3. Middlemen’s constraints a) by combined sites, b) by each site ............................ 123
Figure 3.4. Middlemen’s opportunities a) by combined sites, b) by each site ........................ 126

xv
Figure 3.5. Processors’ constraints a) by combined sites, b) by each site ............................... 129
Figure 3.6. Processors’ opportunities a) by combined sites, b) by each site ........................... 131
Figure 3.7. Percent of actors with a), access to bank loans b), ownership of equipment c),
equipment support and d) training support ......................................................... 133

1
CHAPTER 1: BACKGROUND OF THE STUDY
General introduction
Contribution of Small-Scale Fisheries (SSFs) to the economy, employment, food security and
nutrition is of significance to riparian countries and populations (Mills et al., 2011; Barnes-
Mauthe et al., 2013; Government of Kenya, 2016a). Key fisheries statistics show that 54% of
fish traded globally in 2014 originated from SSFs in developing countries (FAO, 2016). SSFs
also employ about 88% of the estimated 107 million global fish workers (Mills et al., 2011).
Fish and fisheries provide nutrition and food security to many dependent communities, with
30% of the global population drawing their daily protein intake from fish (Andrew et al., 2007;
Smith et al., 2010; McClanahan et al., 2015; FAO, 2016). Despite this contribution of fisheries
to global food security, SSFs are still not fully appreciated due to inadequacy of data and
information at national and individual scales (Pauly, 1997; FAO and World Fish Centre, 2008;
Jacquet & Pauly, 2008; Cunningham et al., 2009). Inadequacy in fine-scale resolution data has
led to perennial marginalization of SSFs in government policies and interventions, hence
leading to limited private sector investment.
There are several reasons why SSFs are not fully appreciated in their contribution to national
economies. First, much of the focus on contribution of fisheries to national economies has been
in terms of national level indicators e.g. tax revenues, GDP, employment, export volumes and
foreign exchange (FAO and World Fish Centre, 2008; Béné et al., 2016). SSFs do not often
feature much at such macro-economic levels since they are largely informal, and lack requisite
data with higher level indicators (Pauly, 1997; Jacquet et al., 2008). Secondly, Systems of
National Accounting (SNA) place fisheries data at the primary production level under
agricultural sector, while post-harvest data is captured by other government agencies or not
captured at all (UN, 2003; de Graaf & Garibaldi, 2014). Thirdly, SSFs receive less funding and

2
support for data collection since there is insufficient understanding amongst policy makers on
how they plug into national economies, and what their potential contribution is (Simon et al.,
2007; Cunningham et al., 2009). Other factors such as highly geographically dispersed landing
sites, remoteness and lack of political voice to influence policy, partly exacerbates this apathy
(Colloca et al., 2004; Jacquet et al., 2008).
Drawing of the macro-economic picture of SSFs, requires microeconomic indicators at
individual actor’s level (Rodrigo, 2012; Barnes-Mauthe et al., 2013; de Graaf et al., 2014).
However, data collection on these microeconomic indicators (such as income level and its
distribution, supply and demand, costs, capital levels and employment) in SSFs is largely
ignored in many countries (Mills et al., 2011; Barnes-Mauthe et al., 2013; Béné et al., 2016).
Besides understanding micro-economic indicators, knowledge about the operational
environment of SSFs is critical for policy formulation and fisheries management. Several key
questions arise concerning the operational environment, such as; who are the actors in the
fishery? what do they do? who controls what and how? who benefits?, and how are benefits
distributed? who wins and who loses? how are actors affected by external factors?
Consequently, there is need for a systematic and comprehensive approach in an attempt to
answer these key questions.
The operational environment of fisheries activities can be internal or external. The internal
operational environment relates to the structure of the value chain or how actors are organized.
Conceptually, structure includes the level of capital invested, barriers to access capital,
infrastructure and the resource base (Kaplinsky & Morris, 2001; Fews Net, 2008). For
example, lack of capital endowments such as physical and financial capital, acts as steep
barriers to new and less endowed market entrants (Fews Net, 2008). Actors’ positioning based
on structure, also determines their functions, where higher capital-endowed actors coordinate

3
and control operations in the value chain (Kaplinsky et al., 2001; Fews Net, 2008).
Market governance characteristics such as vertical integration are also elements of structure,
which instils disproportionate power and control to some actors and not others (Viaene &
Gellynck, 1995; Kaplinsky et al., 2001; Jordaan et al., 2014). In fisheries for example, high-
capitalized middlemen facilitate fishers and coordinate distribution and marketing of fish,
while low-capitalized small-scale middlemen and fish processors retail and process fish for
sale, respectively (Crona et al., 2010b; Matsue et al., 2014).
Structure also influences price setting mechanisms as well as products in the market, and hence
control of the market and profitability (Banson et al., 2016). It also influences distribution of
benefits due to actor’s positioning in the value chain (Kaplinsky et al., 2001). Markets with
few economically powerful actors, leads to monopolistic or oligopolistic tendencies, where
decision-making and prices are decided by a few individuals (Kaplinsky et al., 2001; Fews
Net, 2008). Impact of capital-based positioning of actors, in processes such as decision-
making, is still poorly understood in Kenya’s SSFs.
Configuration in terms of the value chain structure has significant implications on actor
behaviour termed “conduct” (Bain, 1959). These are the strategies employed by actors based
on their capital-based positioning structural positioning in order to stay competitive in the
market. For instance, more powerful actors often control pricing of goods to their advantage
(Fews Net, 2008; Crona et al., 2010b). Conceptually, conduct relates to marketing practices
such as price information flow (Banson et al., 2016), competitive strategy of firms (Harre &
Pirscher, 2009), choice of fish grades targeted (Lee, 2014; Asche et al., 2015; Sjöberg, 2015),
and price setting mechanisms such as actors colluding to set prices (Pomeroy & Trinidad, 1995;
Fews Net, 2008; Banson et al., 2016).
Extent of market collusion for example amongst powerful middlemen impacts negatively on

4
vulnerable fishers who quickly sell their catch to avoid loss due to perishability (Pomeroy et
al., 1995). Some middlemen also offer lower prices to fishers, in return for guaranteed
purchases (Kulindwa & Lokina, 2013). Information flow about prices is important in value
chains, since it either contributes to open competitiveness or collusion (Fews Net, 2008).
Conduct is considered important due to its key role in informing strategic and competitive
measures taken by actors in the market. Whereas conduct aspects in a market should be
informed by structural factors, studies of this causal-effect relationship in SSFs are scanty.
In turn both structure and conduct influence financial and economic outcomes, termed
“performance” (Bain, 1959). Performance can be described as the desirable financial and
economic outcome that meets social and business expectations of actors (Fews Net, 2008).
Key questions relating to performance include; what quantities are produced? What are the
costs involved? What are the returns on investment? What is the contribution to the economy?
Performance includes analysis of indicators such as costs levels (Pascoe et al., 2015),
profitability (Pascoe et al., 1996b; Brinson et al., 2006), income inequalities (Kulindwa et al.,
2013), contribution to the economy in terms of value added and employment (Kaplinsky et al.,
2001).
Performance indicators in SSFs are widely reported in literature e.g. on profitability of fishing
units in different contexts (Brinson et al., 2009; Maynou et al., 2013; Ba et al., 2017), and costs
by gear and vessel type (Daurès et al., 2013; Guillen & Maynou, 2016). Other authors have
reported on revenue and income under varied contexts, type of value chain and purpose
(McClanahan, 2010; Kulindwa et al., 2013; Wamukota et al., 2014), rate of return on capital
(Boncoeur et al., 2000; Garza-Gil & Amigo-Dobaño, 2008) and employment at local and
global scales (Teh & Sumaila, 2011a; Barnes-Mauthe et al., 2013).
The cause-and-effect relationship between structure, conduct and performance was formally

5
described by Bain (1959) in the Structure-Conduct-Performance (S-C-P) paradigm. The
paradigm postulated that structure influences conduct, which ultimately influences
performance. In SSFs where there is pervasive control by middlemen, the S-C-P approach has
been suggested as a suitable tool for analysis due to its ability to relate performance to conduct
and structure aspects of the market (Pomeroy et al., 1995). However, despite early advocacy
for use of the S-C-P paradigm in fisheries (Pomeroy et al., 1995), not many studies have
adequately employed this approach. This makes it difficult to holistically compare different
SSFs value chains to benchmark with established norms in S-C-P.
The external environment is the second type of operational environment under which value
chains operate. It constitutes the institutional, policy and regulatory environment (Kaplinsky
et al., 2001; Mills et al., 2011; Béné et al., 2016). Fisheries policies and regulations play a
critical role in influencing actors’ operations and performance. For example, they may limit
number of entrants into a fishery, impose minimum allowable fish sizes, impose seasonal and
permanent closures, restrict certain gears, outline fiscal measures, stipulate standards for fish
quality and set prices. However, badly designed policies and regulations can also create new
problems such as disenfranchisement of some actors or increase inequalities (Isaacs et al.,
2007). On the other hand, when policies succeed, they can lead to resource sustainability and
open new opportunities.
Institutional support from state and non-state institutions is also important in building capacity
of players through training and financing (Government of Kenya, 2016b; Melo et al., 2016).
Government financing schemes in particular can have significant implications in employment,
income generation and contribute to rapid value chain development (Loizou et al., 2014; Ngoc
et al., 2015). Although such beneficial interventions to SSFs exists in government policy

6
papers, their implementation towards value chain development remains poorly understood
(Mondaca-Schachermayer et al., 2011).
Governments, remain as chief value chain development agents due to their mandate and larger
implementation capacity, even as non-state actors complement their efforts by performing
other crucial functions (Melo et al., 2016). Collaboration between non-state actors,
government, scientists and industry, for example in studying resource use patterns, eco-
certification schemes, fair trade among other incentivized sustainability measures, can increase
resource sustainability and open new market niches (Field et al., 2013).
Evaluation of government performance in implementation of its value chain development
mandate is important in shaping required reforms (Yeeting et al., 2016). Participation of value
chain actors in such evaluations is useful in gauging their views (Turyahabwe et al., 2017).
Different actors often have varied views on performance of government, depending on their
social, demographic and economic characteristics (Muatha et al., 2017; Olorunfemi et al.,
2017; Turyahabwe et al., 2017). Such studies on complementary roles by different fisheries
management institutions in Kenya’s SSFs are rare. Furthermore, specific studies in Kenya on
impact of policies and regulations on the whole value chain are scarce.
Constraints facing the value chain also form part of the operational environment encountered
by actors. Constraints can be categorized as: i) intrinsic and operational (Olsson, 2009, 2010;
Emdad et al., 2015) and ii) extrinsic and environmental (Salmi, 2015; Pedroza-Gutiérrez &
López-Rocha, 2016). Intrinsic and operational constraints relate to economic and governance
challenges. These include weak governance, poor infrastructure, high costs of operations, poor
access to capital, scarcity of fish and low market demand or prices, economic and political
marginalization (Olsson, 2009, 2010; Andalecio, 2010; Emdad et al., 2015). Extrinsic and
environmental constraints relates to external environment and resource challenges such as

7
overfishing, habitat degradation, resource decline, illegal and destructive fishing practices,
resource use conflicts, siltation and pollution (Andalecio, 2010; Salmi, 2015; Pedroza-
Gutiérrez et al., 2016). While these constraints limit performance of SSFs, resolving them can
turn them into opportunities. There are several studies on constraints and opportunities in SSFs,
for example those by (Olsson, 2009; Emdad Haque et al., 2015 and Pedroza-Gutiérrez et al.,
2016). However, studies analyzing constraints and opportunities in the whole value chain are
scarce. Furthermore, studies that incorporate stakeholder perspectives of constraints and
opportunities in SSF value chains are equally rare.
Robust analysis tools are required to bring comprehensive understanding of SSFs under
complex, varied contexts and across the whole value chain. Value Chain Analysis (VCA) has
been advocated as one of the suitable tools for such analysis (Jacinto & Pomeroy, 2011;
Rosales et al., 2017). The value chain itself is defined as the “whole range of activities required
to bring a product or a service from conception through production to consumption and waste
disposal” (Kaplinsky et al., 2001). Thus VCA in a fisheries context, involves assessment of
economic activities taking place at different nodes such as services and input supplies, fishing,
processing, trading and consumption (Macfadyen et al., 2012). It also includes analysis of
constraints, legal, institutional and policy environment around the value chain (Gereffi &
Kaplinsky, 2001; Kaplinsky et al., 2001; GTZ, 2008).
The S-C-P paradigm approach is also considered to be suitable for analysis of SSFs in order to
bring understanding of how actors operate (Pomeroy et al., 1995). It is recommended that S-
C-P is integrated with VCA in order to systematize and comprehensively analyze value chains
(de Figueirêdo et al., 2014). This integration implies taking a cross-sectional view of value
chain activities at each node with an S-C-P lens. While integration of S-C-P with VCA is
advocated as an important approach to analyze value chains, there is no such study in Kenya,
addressing marine SSFs.

8
However, there are several VCA studies in Kenya addressing SSFs, for example CDA (2007),
USAID (2008), Wamukota et al. (2014), Manyala (2011) and Mwirigi & Theuri (2012) . These
studies are broad in their approach and focus, with some analyzing both fresh water and marine
fisheries at a broad scale but limited on details about marine SSFs, for example USAID (2008).
Others have analyzed specific species and thematic aspects but limited in coverage of the
complexity of SSF value chains for example Wamukota et al. (2014). There is only one study
by Abila (1995) addressing S-C-P in SSFs and only focused on trading nodes in freshwater
fisheries. The present study targets at filling gaps in knowledge and contributes to the growing
literature on SSFs nationally, regionally and internationally.
Statement of the problem
A clear understanding of micro-economic indicators such as revenue, costs, prices of
differentiated products and income inequality amongst others, is useful in building a
macroeconomic picture and higher-level interventions. However, SSFs lack such crucial
information at national and global scales. Kenya is not an exception to this problem despite the
several studies on marine fish value chain. To date, there is still poor understanding of key
microeconomic indicators, across all nodes of the value chain. Analysis of S-C-P in context of
the value chain has also not been adequately addressed in marine SSFs in Kenya, despite the
usefulness of this approach in linking performance to other processes of the value chain.

9
There is also inadequacy of information on the impact of institutional support, policy and
regulatory framework on actors’ performance. Information on the role of institutions
particularly concerning service provision and building capacity of actors, is also poorly
documented. Constraints affecting each node in the value chain and existing opportunities in
SSFs have also not been adequately studied.
With these gaps, it is difficult to build an overall understanding of the economy of marine SSFs
and their contribution to the national economy. This situation also hinders identification of
required interventions to improve income of actors, upgrading of required technologies,
investments in the sub-sector and support to governance. This study integrated S-C-P with
VCA to comprehensively address these information gaps and contribute ideas for improvement
of the sub-sector.
Goal of the study
The goal of the study was to characterize and analyze Kenya’s marine small-scale fisheries
along the value chain so as to generate knowledge useful for value chain improvements and
management.
Specific objectives
Specifically, the study aimed to achieve the following five objectives: -
1. To evaluate the structure of marine small-scale fisheries value chain and implications for
actors
2. To investigate how actors’ conduct is influenced by structure
3. To analyze actors’ market performance along the value chain
4. To examine constraints and opportunities along the value chain
10
5. To analyze actors’ perception of government performance in implementation of value
chain development related policy and regulatory frameworks
Research questions
The study aimed to answer five key questions: -
1. What is the structure and characteristics of small-scale marine fisheries value chain in
Kenya and implications for actors?
2. How does structure influence conduct of different actor groups and the impact to the
value chain?
3. How is market performance of different actors along the value chain?
4. What are the constraining factors and opportunities for improvement in the value chain?
5. What is actors’ perception of government performance in implementation of value chain
development related policy and regulatory frameworks?
Study hypotheses
Study hypotheses were set following objectives as stated below:
1. Objective two; Structure of the value chain based on actor-capitalization has a significant
influence on actors’ conduct
2. Objective three; Structure and conduct have a significant influence on actors’
performance in the context of profitability.
3. Objective five; Actors’ structural factors (value of equipment owned and actor category),
social factors (livelihood rank, education and experience), economic factors
(profitability) and site have a significant influence on their perception about government
performance in implementation of its policy and legal objectives.

11
Justification of the study
Kenya’s small-scale marine fisheries have faced myriad challenges that affect actors’ optimal
financial and economic performance. However, the extent of these challenges is not fully
understood empirically, due to lack of data and information. There is need to understand
constraints facing actors and also document their proposed solutions in order to come up with
the best suited interventions.
There is also need to understand the fisheries internal and external environments that influence
their operations in order to develop required interventions. Internal environment includes
actors’ competitive behavior, their characteristics and how these interact to influence their
financial and economic performance. External environment revolves around how the policy,
regulatory and institutional framework supports or impedes actors’ financial and economic
performance. Empirical understanding of how the internal and external environment impacts
on Kenya’s marine small-scale fisheries is still scanty. Therefore, the present study empirically
contributes to this understanding to inform policy, regulatory and institutional reforms and
value chain governance interventions.
Significance of the study
This study provides key value chain information addressing S-C-P, constraints and
opportunities, institutional, policy and regulatory environment of SSFs. The study sheds light
on processes and impact of actors’ conduct and performance at different nodes. Understanding
these business processes and actors’ actions in SSFs has the potential to improve the whole
12
value chain, including the identification of areas of value chain upgrading, reduction of
constraints and policy reforms.
The present study has analyzed constraints facing actors in SSFs and possible solutions from
the actors’ perspective. Information generated by this study is useful in informing donors and
the private sector regarding value chain development and aspects that need more attention.
Results from the study provide useful information for further development of SSFs value
chains at national and regional levels.
Globally, there are efforts to elevate contribution of SSFs to livelihoods and national
economies by intensifying value chain development interventions (Mills et al., 2011; FAO,
2016; Rosales et al., 2017). FAO Sub-Committee on Fish Trade in its 14th session in 2014,
highlighted the importance of SSF value chain development and proposed strategic
programmes towards achieving this objective (FAO, 2014). This milestone signifies a shift in
global focus towards interventions that support SSFs value chains. This study provides
information that may be useful to this global agenda.
In terms of scholarly purposes, the study integrates VCA and S-C-P in the same study in marine
SSFs in Kenya, for the first time. This approach does not only provide comprehensive analysis
of SSFs, but also capitalizes on integrating existing methodologies. The combination of these
two approaches advances research by looking at the contextual environment under which SSFs
operate such as policy, regulatory and institutional frameworks. The marine SSF sub-sector
value chains have received little research attention in Kenya in the past, this study helps to
close this knowledge gap.

13
Scope of the Study
The current study investigated marine SSFs with respect to S-C-P, policy and regulatory
contextual environments, constraints facing actors and existing opportunities. The study
considers the classical definition of value chains as defined by Kaplinsky & Morris (2001).
The study therefore does not address non-value chain concerns that could be pertinent to SSFs
such as resource-use conflicts, resource sustainability, resource health etc. It is confined within
the term “activities” and only focuses on direct or indirect actions that are associated with
moving the product from fishers to consumers.
Required data and information was obtained from value chain actors starting with fishers,
middlemen and small-scale fish processors. The study did not address value chain input
suppliers due to limitations of getting the few respondents from such a diverse group with
diverse services and incomparable data between themselves and other actor groups. The study
did not also address large-scale fish processors due to the differentiated nature of their business,
in terms of high capital requirements and types of constraints faced, and thus incomparable to
the other value chain actors.
The study was conducted from November to March 2014, June to September 2015, and again
in June and September 2016. Thus, the study covered both North East Monsoon (NEM) which
occur from November to April and South East Monsoon (SEM) seasons from May to October
(UNEP, 1998), where a lot of changes in the fishery occur. These include; changes in number
of actors, movement of migrant fishers, amounts of catches, gears used and fish types caught
and traded (Fulanda et al., 2009; Wanyonyi et al., 2016a).
14
Conceptual model
While the S-C-P paradigm postulates that performance is influenced by structure and conduct
of actors, the study conceptualizes that internal operational and external operational
environment also play a critical role in shaping actors’ performance (Figure 1.1). External
operational environment relates to the regulatory, policy and institutional framework in place
and constraints facing actors. Laws and regulations regulate the operational environment, while
policies set the institutional framework to guide functions as well as coordinate provision of
services. When regulatory, policy and institutional frameworks work optimally, constraints
decrease, and better performance can be realized.
The internal operational environment relates to actors’ characteristics such as demographic and
socio-economic factors. It also includes operational variables such as costs, volumes and sales
handled. Actors who increase volumes traded, while reducing costs can realize higher
performance. The study analyzes how these relationships affect financial performance. The
study tests the role of structure and conduct as well as internal operational factors in influencing
financial performance. The study also analyzes actors’ perception of government performance
concerning its mandate and functions.

15
Figure 1.1. Conceptual model for the study. Adopted from GTZ (2008)
Kenya’s small-scale marine fisheries
Fishing in Kenya’s marine waters is dominated by SSFs with approximately 13,000 fishers
operating about 3,000 vessels (Government of Kenya, 2014a, 2016c). About 73.4% of the
vessels are canoes, 22.1% large wooden boats (Mashua) and only 3.1% are reinforced plastic
boats (Government of Kenya, 2014b). The fishery is largely non-mechanized with only 20%
of vessels using engines and the rest using sails, poles and paddles. The fishery is multispecies
where most commonly used gears are basket trap, gill net, hand line, spear gun and beach seine
(Samoilys et al., 2017). Kenya’s marine fisheries production is estimated at 9,000 Mt/year
(Government of Kenya, 2012, 2014a). However, with the recent revision of the marine fishery
appraising methodology in 2016 by Kenya Fisheries Service, production is now estimated at
24,709 Mt/year, valued at KES 4.612 Billion or 10% of national total production (Government
of Kenya, 2016a). Most fishing is concentrated in the inshore waters, around creeks and the
coral reef lagoons or outer reefs, but mostly still within 12 nm, with little offshore activity
(Samoilys et al., 2017).

16
The fishery has a significant presence of seasonal local and foreign migrants from Tanzania,
who are often facilitated with operational cash and equipment by middlemen. They arrive just
before the onset of North East Monsoon (NEM) season and exit just before the onset of South
East Monsoon (SEM) (Fulanda et al., 2009; Wanyonyi et al., 2016a, 2016b). Mayungu and
Vanga are frequented by migrants (Fulanda et al., 2009) as wells as Malindi, compared to the
low frequency in Shimoni.
Trading of fresh fish is undertaken by middlemen who also act as facilitators in the value chain
by financing fishers and seeking markets (Wamukota, 2009; Crona et al., 2010b). Some
middlemen operate at the primary level where they buy fish directly from fishers, while others
buy from other middlemen at the secondary level (Wamukota, 2009). Fish processing in
Kenya’s SSFs is largely localized, with small-scale fish processors locally known as Mama
Karanga, buying fish from either fishers or middlemen and frying it for sale to consumers
(Karuga et al., 2007; Wamukota, 2009; Matsue et al., 2014). A smaller number of restaurant
operators also fry fresh fish for sale.
Most landing sites in coastal Kenya are poorly developed, lacking critical infrastructure such
as fish depots, cold rooms, jetties/pontoons, potable water facilities, electricity supply, toilet
facilities, equipment repair facilities and roads (Karuga et al., 2007; Government of Kenya,
2016c). By 2016, seven out of nine cold rooms along the whole coastline were functional. Only
11% of landing sites had electricity, 15% with potable water, 10% with engine repair facilities
and 41% with all-weather roads (Government of Kenya, 2016c).
In the study area, Malindi and Mombasa are relatively well served with facilities, though they
still have several deficiencies. For example, despite Malindi having a government-installed
cold room, it had never been operational due to management challenges. Similarly, Vanga also
has a cold room and ice making machine, but due to constant breakdowns, they are hardly in

17
operation. Shimoni and Mayungu by the time of this study had no such facilities. Mayungu
also lacked portable water, electricity, toilets and a fish depot. Mayungu, Shimoni and Vanga
by the time of this study did not have tarmacked roads, thereby posing a great challenge with
road transportation during heavy rains.
Fisheries management is vested in Kenya Fisheries Service under State Department of
Fisheries Aquaculture and the Blue Economy to address policy issues (Government of Kenya,
2016b). Some functions of fisheries management have also been devolved to counties as
outlined in the Kenya Constitution of 2010 (Government of Kenya, 2010). Management
structures also include community level management under Beach Management Units (BMUs)
at landing sites (Government of Kenya, 2007).

18
General review of literature
1.12.1 Description of small-scale fisheries
A significant portion of global fisheries are SSFs (FAO, 2016). While SSFs appear a lot in
literature, their definition is varied depending on the geographical context, technical
specifications, management measures and regulations (Mills et al., 2011; García-de-la-Fuente
et al., 2016). The source of variation is based on description metrics used, primarily; length,
weight capacity and engine power of vessels. There is variation even within continents, for
example in Europe, vessels in Spain falling within a length of 8.8 m - 9.5 m are classified as
SSF (Garza-Gil et al., 2008; García-de-la-Fuente et al., 2013; Maynou et al., 2013), while in
Italy SSFs vessels range from 4.5-15.8 m (Battaglia et al., 2010). In South America, for
example in Peru, vessels with a maximum length of 15m are classified as SSF (Alfaro-Shigueto
et al., 2010). SSFs are further described as fishing units that fish near coastal areas and use
diverse gear to catch multiple species (Colloca et al., 2004; García-de-la-Fuente et al., 2013).
In Kenya, according to the Kenya Fisheries Management and Development Act of 2016
(Government of Kenya, 2016b), SSFs are defined as “small-scale traditional fisheries that may
be carried out for subsistence or commercial purposes in which the owner is directly involved
in the day-to-day running of the enterprise and relatively small amounts of capital is invested
in the fishing operations”. An artisanal fishing vessel is defined as “any local fishing vessel,
canoe or undecked vessel with a length overall of not more than ten meters, which is not
motorized or motorized by an outboard or inboard engine not exceeding forty horsepower, or
powered by sails or paddles, but does not include decked or undecked semi-industrial fishing
vessels or vessels used for recreational fishing”. These definitions of both the fishery and
vessels mirror the internationally agreed definitions.

19
In terms of size of the fishing fleet, there are an estimated 46 million fishing vessels globally
(FAO, 2016). More than 85% of these are below 12 m in length, suggesting that a bulk of
fishing vessels are in SSFs and are small in size (FAO, 2016). Out of these, 6.8 million vessels
are in Africa, where over 75% are <12m in length and <65% un-motorized. In Europe, Maynou
et al (2013) indicates that 81-87% of the vessels are SSFs and range between 12-15 m in length.
While description of SSFs internationally tends to concentrate on the fishing node, other nodes
such as trading and small-scale processing are also part of SSFs. Although fish trading may
transcend beyond the small-scale level, majority of the players operate at the landing site level
thus forming an integral part of SSFs. At this level, traders handle only low volumes of fish
and mostly sell to direct consumers or other small outlets or factory agents and rarely sell
directly to processing factories or large establishments. Small-scale fish processing is also done
in low volumes through simple methods of processing such as smoking, frying and salting.
The small-scale processing node is mainly dominated by women processors (Fröcklin et al.,
2013; Matsue et al., 2014).
1.12.2 Global overview and significance of small-scale fisheries
In 2014, global total fisheries production estimates stood at 167 million tonnes. The Western
Indian Ocean contributed only about 4.7 million tonnes or 5.8% of the marine capture fisheries
production (FAO, 2016). Thirty six percent of the global total production (or 60 million tonnes)
was traded at a value of USD 148 billion, making fish the most traded food commodity globally
(FAO, 2016). From these amounts, 54% came from SSFs (FAO, 2016), thus highlighting
importance of SSFs.
SSFs also provide other benefits such as employment to millions of people dependent on them.
A global review by Mills et al. (2011), estimated that 107 million people are employed by

20
SSFs, or 88% of global fish workers. This excluded workers and fishers spending less than
30% of their time in fisheries activities and also workers in ancillary services such as engine
and boat repairers, equipment manufacturers, ice makers etc. Mills et al (2011b) also estimated
up to 33.1 million fishers in SSFs of developing countries or 97% of global fishers.
A recent estimate by FAO (2016) indicates a higher figure of 37.9 million fishers but also lacks
to give a breakdown of actors in ancillary industries. In a different study of African fisheries,
an estimated 12.3 million people are employed by fisheries, where 50% are fishers, 42.4% are
processors and 7.5% work in aquaculture (de Graaf et al., 2014). Africa scores comparatively
low in employment of women in fisheries where only 27.3% were involved in fish related
activities, compared to the global figure of 47% (Mills et al., 2011; de Graaf et al., 2014).
Fish is important as a source of food with consumption trending upwards despite economic
downturns in many countries over the years (FAO, 2016). Fish production for human
consumption has been growing at a rate of 3.2%, above that of global population growth at
1.6%. This explains the continued growth in per capita consumption to the current 20 kg
person-1 year-1. However, Africa still lags behind with countries like Kenya only recording 4.3
kg person-1 year-1 (Government of Kenya, 2014a).
Fish is today recognized and advocated as an important source of nutrition for humans
especially for children, convalescing adults and mothers (FAO, 2016; Thilsted et al., 2016). It
contains high quality proteins, essential amino acids, essential fats (e.g. long chain omega-3
fatty acids), vitamins (D, A and B) and minerals (including calcium, iodine, zinc, iron and
selenium) (Thilsted et al., 2016). Fish now contributes 15-20% of animal protein intake to at
least 30% of the global population and up to 50% in some Islands and West African states
(Smith et al., 2010; FAO, 2016). It also forms 6.7% of all consumed proteins. This success is
due to transformation of SSFs from subsistence to commercial exploitation and is attributed to

21
consistently rising global demand, liberalized trade, globalization, improved marketing,
transportation, communications and technology (FAO, 2016).
SSFs are also an important component of food security that is sometimes the only source of
protein for a majority of the world’s poor who only undertake simple processing (Andrew et
al., 2007; Smith et al., 2010; Mcclanahan et al., 2015). Small-sized fish, especially pelagics —
a common feature of SSFs, provide food and rich nutrition that benefits the poor. Thus any
negative dynamics such as price increases and scarcity in these fish may have negative
nutritional and food security consequences to the poor (FAO, 2016). However, SSFs also face
challenges of post-harvest losses which is common in developing countries (Thilsted et al.,
2016). This results to loss in nutritional value and jeopardizes food security.
Contribution of fisheries to national and regional economies in Africa is low and typically
contributes between 0.5–2.5% to GDP, with exceptions such as Senegal and Seychelles where
it is higher (FAO, 2005). A more recent study by de Graaf & Garibaldi (2014) reveals that
fisheries contributes an average of 1.26% to the overall GDP with 0.43% coming from marine
SSFs, 0.36% from marine industrial fisheries, 0.33% from inland fisheries and 0.15% from
aquaculture. Post-harvest sub-sector injects about 0.33% directly into the GDP representing
26.19% of Africa’s total GDP from fisheries. Out of this, small-scale fish processing accounts
for 52% of the post-harvest value. Notably these results are from data calibrations and
extrapolations, highlighting the lack of readily utilizable statistics amongst countries and
undervaluing of fisheries contribution to national economies.
1.12.3 Overview of Kenya’s small-scale fisheries
Kenya’s national fisheries production and trade data indicates continuing growth in value but
with recent declines in production (Government of Kenya, 2016a). National total production

22
from aquaculture and capture fisheries (freshwater and marine) dropped to 147,726 metric
tonnes in 2016 from 168,413 in 2014. The ex-vessel value of marine capture fisheries was
KES. 4.6 billion (Government of Kenya, 2016a). Inland waters accounted for 73.2% of
national production, with Lake Victoria accounting for 90.8% of inland production and 66%
of national production.
Kenya’s marine production has been increasing over past decades, with a corresponding steady
increase in value throughout this period, with exception of a few slight drops in value.
However, after revision of the data appraisal methodology in 2016 by the Kenya Fisheries
Service, marine capture production shot to 24,709 Mt from a range of 7,000-9,000 Mt in the
last decade (Government of Kenya, 2016a). Contribution of Kenya’s fisheries to the national
GDP has been small at about 0.54% (de Graaf et al., 2014). The post-harvest sub-sector
contributes only 0.1% to the national GDP with small-scale fish processing accounting for only
10% of the post-harvest value.
In terms of employment, in 2016 it was estimated that 1.2 million people earned their
livelihood from fisheries directly or indirectly (Government of Kenya, 2016a). These
livelihoods are in fishing, trading, farming, processing, direct employment, supplies and
fisheries business-related activities. However, except for fishing and aquaculture, estimates for
other nodes are unavailable. Fishers were estimated at 65,250 and farmers 59,095 (Government
of Kenya, 2016a). Of the national fishers population, marine SSFs accounted for 21% (or
13,417) fishers (Government of Kenya, 2016a, 2016c). The number of fishers in marine SSFs
increased steadily over the last ten years. Fishing vessels in marine SSFs have also been
increasing steadily in the last ten years to 2,974 in 2016.The ratio of craft to fishers has been
oscillating at one craft for every 4-5 fishers on average over the last decade.
Kenya’s marine SSFs show signs of steady mechanization, especially using outboard engines

23
over the last ten years, as use of sails and paddles declined from 2012, while engines increased
by 37% in the period 2014-2016 (Government of Kenya, 2016c). In terms of supportive
infrastructure and services, there has been a steady increase of landings sites and all-weather
roads leading there. The rate of growth of other supportive infrastructure and services such as
fish receiving sheds, cold rooms, portable water sources and toilets has either been very
minimal or stagnated.
1.12.4 Data challenges and perceived low contribution of small-scale fisheries
SSFs are often not fully appreciated despite their significant contributions to food security,
nutrition, employment and GDP to many communities and countries (Pauly, 1997; FAO and
World Fish Centre, 2008; Jacquet et al., 2008; Cunningham et al., 2009). This stems from
incomplete understanding, since many statistics on SSFs are underestimates. For example due
to difficulties of capturing data on ancillary and post-harvest activities in SSFs, the total global
employment figures are believed to be underestimated (Smith, 1979; Morand et al., 2005; Mills
et al., 2011). Lack of disaggregation of employment data in fisheries at different nodes has also
been a challenge in most SSFs and therefore difficult to know contribution of each node to
employment (FAO, 2016). Diversified product portfolio in SSFs’ post-harvest sub-sector also
contributes to problems faced in data collection due to difficulties in standardization and
generalization of data (Mills et al., 2011; de Graaf et al., 2014).
In some instances data from developing countries where a majority of fisheries are SSFs is
totally unavailable or under-reported (Salas et al., 2007; Teh et al., 2011b; de Graaf et al.,
2014). This problem is well illustrated by de Graaf & Garibaldi (2014), who extrapolated data
from 23 countries to infer for the rest of Africa due to unavailability of economic data.
Inadequacy of economic data on SSFs is persistent even in developed nations where data
collection is mandatory (Daurès et al., 2013). Even when data is available, there have been
24
reliability concerns. For example there are questions from researchers concerning reliability of
FAO bi-annual statistics (Pauly & Zeller, 2017a, 2017b) and counter-arguments from FAO
(Ye et al., 2017). This has led to calls for data reconstructions especially from data poor
regions, where most SSFs fall (Pauly et al., 2017a, 2017b).
There has also been concerns about too much focus on macro-economic level indicators e.g.
on tax revenues, GDP, employment, export volumes and foreign exchange, while ignoring
micro-economic-indicators at individual levels (FAO and World Fish Centre, 2008; Béné et
al., 2016). While the focus on macro-economic-indicators as discussed above are important in
giving the global and national overview (Mills et al., 2011; Béné et al., 2016), micro-economic
indicators at individuals’ level are also important in order to build the macro-economic picture
(Mills et al., 2011; de Graaf et al., 2014).
These problems concerning underestimations and lack of data have in effect led to economic
and political marginalization of SSFs in government policies and interventions (Pauly, 1997;
Salas et al., 2007). SSFs have also not been widely promoted amongst the private sector as
areas of investment due to their perceived meagre contribution and low returns. They have also
often been ignored in most food security and nutrition policy debates, partly due to
insufficiency of data (HLPE, 2014; Thilsted et al., 2016).
1.12.5 The value chain approach in data collection
To overcome challenges of inadequacy in data and understanding of SSFs, a value chain
approach is ideal for systematic data collection to improve information for management and
fisheries development interventions. Typically three levels of information are required in order
to attain these goals (M4P, 2008); i) micro-level information on costs of inputs, processing,
logistics and marketing, ii) meso-level information on cost of support services such as training,

25
ice provision, permits and licenses and iii) and macro-level information on analysis of existing
institutional, legal and policy frameworks relevant to SSFs.
These levels of information corresponds to the three value chain levels; value chain players
(micro level), value chain supporters (meso-level) and value chain influencers (macro level)
(Junior et al., 2016). A value chain in the context of fisheries has three main characteristics; i)
sequenced business activities that include input supplies, fishing, processing and
transformation, marketing and consumption, ii) a set of actors that performs these functions
such as fishers, processors, traders and distributors of fish products and iii) a business model
with specific technologies and coordinating mechanisms (GTZ, 2008; M4P, 2008; Macfadyen
et al., 2012).
There has been debate about value chain elements and terminology. However, there is a general
consensus amongst key value chain practitioners (Schmitz, 2005; GTZ, 2008; M4P, 2008) on
adoption of the definition by Kaplinsky and Morris (2001). Prior to Kaplinsky and Morris’
definition, there was considerable work done on value chains, albeit under different
terminologies. For instance, Porter (1985) described the value chain in terms of increasing
firms’ competitiveness through distinct functions in their niche market. The concept supposes
that, to increase a firm’s competitiveness, the firm must seek ways to improve its position by
performing distinct activities at each function and hence creating value for its customers
(Porter, 1985). Although the original conceptualization was hinged on commercial and
industrial firms, the concept is now increasingly used in other enterprises including agriculture
and fisheries.
From the foregoing, Value Chain Analysis (VCA) can therefore be defined as “the process of
documentation of a wide range of variables relating to the value chain such as; structure,
processes, performance, constraints and regulatory aspects among others” (Gereffi et al.,

26
2001; Kaplinsky et al., 2001; GTZ, 2008). In practice VCA involves mapping and analysis of
functions, analysis of the economy and constraints, as well as the regulatory environment
(GTZ, 2008). In fisheries, variables of interest may include input costs; labour and equipment,
costs of services and transformation; gutting, filleting, preservation, transportation; constraints
in accessing capital and markets and regulatory aspects; resource access and quality
maintenance among others. VCAs are also important in documenting baselines useful in
tracking down changes of value chain interventions and evaluating impacts of interventions
(Bolwig et al., 2010; Macfadyen et al., 2012).
1.12.6 The Structure-Conduct-Performance approach
The core of the S-C-P paradigm is its causal links to performance. The paradigm, posits that
structure influences conduct choices of actors, which in turn influence performance outcomes
(Bain, 1959; Fews Net, 2008). S-C-P paradigm originates from Industrial Organization (IO)
economic theory of the firm and was initially used for anti-trust purposes. Primarily it was
concerned with how conduct of firms created monopolistic and oligopolistic, anti-competitive
behaviour that negatively affected performance of smaller firms (Bain, 1959). It has since
been adopted widely in other areas of study other than competitiveness of firms and sectors
(Harre et al., 2009). Its applications today include other areas of study such as strategic network
analysis of supply chains (Klint & Sjöberg, 2003) and food industries and food security
(Viaene et al., 1995; Fews Net, 2008; Harre et al., 2009). One of the strengths of the S-C-P
paradigm is its ability to go beyond market access and price analysis to looking at structural
and actor behaviour to predict performance (Fews Net, 2008).
Whereas the S-C-P paradigm has been in use for many years and across disciplines, there is no
consensus on use of specific indicators that fit all sectors (Harre et al., 2009). Instead,
individual disciplines have highlighted common indicators applicable to them (Viaene et al.,

27
1995; Klint et al., 2003; de Figueirêdo et al., 2014). In fisheries, key elements and indicators
proposed for analysis have been suggested for example by Pomeroy and Trinidad (1995) and
are discussed below.
1.12.6.1. Structure
Structure is important in determination of actor market participation (Kaplinsky et al., 2001;
Fews Net, 2008). Structure in terms of size of the market looks at number of actors, market
share of firms or segments, number people employed per enterprise and average turnover of
firms (Harre et al., 2009). It also includes characteristics and organizational features of a
market (Viaene et al., 1995; Jordaan et al., 2014). Structure is also about market concentration
in terms of the number of players in the market, nature of goods produced and market demand
(Harre et al., 2009; Banson et al., 2016).
Various entry barriers also constitute structure and can be categorized as; endogenous (created
by actors) or exogenous (created by external forces such as policy) (Kaplinsky et al., 2001).
Common entry barriers include; high license and permits fees, lack of access to critical assets
and capital and high tax regimes. Entry barriers are also about advantages held by some firms
over others, which implies potential prohibitive costs to be borne by new entrants but not by
existing ones (Pomeroy et al., 1995). In fisheries, the most studied indicators of structure and
perhaps the most important include barriers to entry in perspective of actor capitalization and
market concentration (Pomeroy et al., 1995).
Capital is an important barrier that determines actors’ entry into value chains (Pomeroy et al.,
1995; Fews Net, 2008). It plays a key role in distribution of power, where higher capitalized
actors functionally wield more power over decisions in the value chain (Platteau, 1984). Such
steep entry barriers lock out smaller players, drives down competition and benefits only few

28
operators (Fabinyi et al., 2016). High entry barriers also disadvantage less endowed actors in
negotiations. For example fishers dependent on middlemen for equipment get
disproportionally low catch share, even when the catch is high (Fabinyi et al., 2016), and low
prices even when demand is high due to fisher-middleman tying-in arrangements (Kulindwa
et al., 2013).
1.12.6.2. Conduct
Conduct entails actors’ behaviour in the market and has a direct bearing on performance in
terms of profitability, growth in revenues, price stability and productivity (Viaene et al., 1995;
Harre et al., 2009; Banson et al., 2016). Conduct can be viewed in two broad forms; production
conduct and market conduct (Jordaan et al., 2014). Production conduct entails production
processes employed during production of goods. Product development and innovation to create
differentiated goods is an example of production conduct and can be used as a measure of
industry competitiveness (Viaene et al., 1995). It is common in high capitalized food industries
and can be observed in the differentiated processed fish products in the West (Roheim et al.,
2007; Bronnmann & Asche, 2016). The level of product development and innovation in SSFs
is low and this may have implications on value addition strategies employed. However, this
topic is not well addressed in SSFs.
Market conduct entails behaviour employed in marketing such as contracting arrangements,
marketing strategies, market information flow and pricing practices such as collusion to set
market prices (Pomeroy et al., 1995; Fews Net, 2008; Jordaan et al., 2014). Actors’ conduct
stems from market’s structural factors such as market concentration which determines
competitive pricing or collusion (Fews Net, 2008). Collusion which is associated with skewed
capitalization, is sustained under high entry barriers (Pomeroy et al., 1995). Such actor
behaviour, also commonly results to high consumer and low producer prices, especially where

29
middlemen are involved (Fews Net, 2008).
Such practices are common in SSFs where fishers receive highly disproportionate low prices
in comparison to final selling prices (Kulindwa et al., 2013). Extent of collusion practices in
SSFs is not extensively discussed. Powerful sellers also commonly practice price
discrimination depending on perceived status. Weaker producers receive a lower price, and
weaker buyers buy at a higher price (Fews Net, 2008). Small-scale fish processors in Kenya
often face this problem from middlemen. They buy fish at high prices, and are overlooked in
favour of hotels that pay higher prices (Matsue et al., 2014).
Apart from price collusion, there are other forms of conduct exhibited in SSFs such as access
to market information, choice of products dealt with and exercise of power to determine prices.
Collusion is worsened by lack of transparency in price information. Thus facilitation of access
to information limits collusion and allows price transparency (Jensen, 2007; Fews Net, 2008;
Courtois & Subervie, 2014; Ranjan, 2017). For example, Sambuo & Kirama (2018) found that
availability of market information to fishers across landing sites in Lake Victoria, enabled them
to negotiate for better fish prices. Patterns and extent of collusion, and access to market
information in capital-differentiated value chains have been scantily addressed in SSFs.
Exercise of power to determine prices is also another form of conduct, and is embedded in
level of actor-capitalization, where less endowed actors are unable to determine or negotiate
prices (Platteau, 1984; Pomeroy et al., 1995; Fews Net, 2008). For example, fishers dependent
on middlemen for facilitation are forced to sell to single buyers, under labour-tying
arrangements (Platteau, 1984; Abraham & Platteau, 1987). Such arrangements often stifle
price negotiations and fair catch shares (Mangi et al., 2007; Fabinyi et al., 2016). Poorly
capitalized middlemen and small-scale processors also face challenges to access fish and
usually buy at higher prices (Matsue et al., 2014). They also depend on sellers goodwill to

30
access fish and are sometimes by-passed in favour of high-end buyers (Matsue et al., 2014).
Such capital asymmetries and price setting mechanisms are well documented in the fishing
node (Crona & Bodin, 2010a; Ferrol-Schulte et al., 2014; Miñarro et al., 2016). However,
studies addressing processing and trading nodes are scarce. Although, capital linked disparities
are still explored poorly, empirically in East Africa, despite being a concern in SSFs (Smith,
1979; Wamukota et al., 2014; Pomeroy, 2016).
Choice of fish type purchased as a form of conduct in fisheries is linked to buyer’s
capitalization and fish grading attributes. It is also a function of types of goods in a market,
innovation and market demand. Common fish grading attributes include; species, size and
quality for fresh fish (Lee, 2014; Asche et al., 2015; Sjöberg, 2015), while species, branding,
origin, package size are considered in processed fish (Roheim et al., 2007; Bronnmann et al.,
2016). These attributes play a key role in pricing, where unclassified fresh fish, low quality
processed products and small-sized fish, attract lower prices than higher graded fish products
(Fröcklin et al., 2013; Matsue et al., 2014; Sjöberg, 2015). These products are likely to end up
at lower end markets dominated by small-scale fish processors and low-income consumers. It
has also been established that targeting of premium quality fish in some fisheries, is dependent
on the level of investment in technology to catch specific fish types (Ferse et al., 2014;
Grydehøj & Nurdin, 2016).
Most studies on fish grade attributes have been conducted in industrial and commercial
fisheries, where auction and scanner data from supermarkets is readily available (Roheim et
al., 2011; Bronnmann et al., 2016). Only a few studies in East Africa exist, for example
Thyresson et al., (2013) analyzing fish marketing in perspective of functional groups and
maturity stages of coral reef fish in Zanzibar. Mbaru and McClanahan (2013) looked at size-
dependent fish prices from gated basket traps in Kenya.
31
1.12.6.3. Performance
Analysis of financial performance has been considered critical in building overall
understanding of SSFs (Pascoe et al., 1996a; Barnes-Mauthe et al., 2013). It plays a pivotal
role in actors’ decisions-making in many ways. For example the choice of gear, fishing
grounds, species caught or bought, and markets targeted are determined by costs incurred and
the expected revenue (Pascoe, 2006). Performance outcomes are also useful in evaluating
impact of management regimes, such as gear restrictions and closed areas on fishers income
(McClanahan, 2010). It can also be used to evaluate impact of value chain development
interventions such as subsidies on incomes (Mondaca-Schachermayer et al., 2011; Ngoc et al.,
2015). Performance in S-C-P perspective is described through several indicators such as
revenue, income and inequality, costs, value added and rate of return on investment or labour.
Revenue is the product of price of a commodity and its quantity. It can also be described as the
accrued returns from sales before subtracting any costs (Brinson et al., 2006). Many actors in
fishing confuse revenue to be income, by not considering costs (Kulindwa et al., 2013). It is
possible to attain high revenue but accrue low income due to high level of costs. For example
high costs of fishing and the disproportionate catch shares between fishers and middlemen,
leaves fishers with lower income (Kulindwa et al., 2013). Indeed several studies have found
that vessel owners get >60% of the net income compared to fishers, although revenues are high
(Maynou et al., 2013; Ba et al., 2017). This problem is perverse and results from client-patron
arrangements that allow fishers to use middlemen’s equipment in return of assured fish
supplies (Kulindwa et al., 2013). These arrangements require fishers to shore up most costs,
but share income with middlemen for their gear, boat and engine separately.
Costs are an important component of performance since profits are linked to costs and reducing
them ensures firms’ competitiveness (Viaene et al., 1995; Klint et al., 2003). In fisheries costs

32
are captured as either variable (those that vary with fishing effort), or fixed (those that don’t
vary with effort) (Brinson et al., 2009; Pascoe et al., 2015). Fixed costs generally include longer
term costs incurred while operating boat, engine, fishing gear and accessories (Brinson et al.,
2006, 2009; Maynou et al., 2013). Variable costs also commonly referred to as running costs
are short term expenses such as fuel, labour, ice, bait, food, landing costs, transport,
communication, maintenance and repairs and miscellaneous costs. There is however a grey
area on cost allocation, for example whether to treat maintenance and repair costs as fixed, or
variable costs (Pascoe et al., 2015). In the present study, these costs have been captured as
variable since they occur frequently in the fisheries studied.
The cost structure is also important in identifying type of activities or segments that have the
highest cost contribution and therefore devise control strategies. The cost structure is varied in
different SSFs, with labour, repairs and maintenance accounting for the highest costs in non-
motorized fishing units (Kamphorst, 1995; Inoni & Oyaide, 2007). In motorized fishing units,
fuel costs have been found to be highest, (>50%) of variable costs (Brinson et al., 2009;
Maynou et al., 2013; Ba et al., 2017). Larger fishing vessels with higher effort and active gear
have also been found to cost more in fuel and maintenance (Daurès et al., 2013; Pascoe et al.,
2015). Generally, variable costs are usually higher than fixed costs (Kamphorst, 1995),
although considerable variations in costs by gear type have been noted elsewhere (Turay &
Verstralen, 1997; Maynou et al., 2013). There is a general lack of information on costs and
cost structure in SSFs, and where the information is available, it has focused on the fishing
node and very little on trading and processing nodes.
Income as the core element of performance is one of the most discussed indicators in fisheries
literature, yet the most confusing as a terminology. Some authors refer to it as net margins,
gross operating income, gross cash flow or financial profit (Whitmarsh et al., 2000; Ba et al.,
2017). However, most studies generally agree on calculation of income as a function of

33
turnover, less operating costs (Brinson et al., 2009; Maynou et al., 2013; Pascoe et al., 2015).
In the present study, income, financial profit or profitability are used interchangeably and are
distinguished from economic profit. Financial profit refers to returns made by an individual
after subtracting all costs and interests, while economic profit refers to returns made after
subtracting all costs, interests and opportunity costs of capital and labour (Whitmarsh et al.,
2000; Brinson et al., 2009). This important distinction implies that it is possible to accrue a
positive financial profit, but a negative economic profit (Brinson et al., 2009).
Economic analysis goes beyond profitability and considers opportunity cost of actors pursuing
one economic alternative against another (Boncoeur et al., 2000; Cinner et al., 2009).
Opportunity cost of labour is considered to be equivalent wages from manufacturing or
minimum rural wage, while opportunity cost of capital is considered as the possible rental
income from equipment, or central bank interest rate (Brinson et al., 2006; Maynou et al.,
2013). Opportunity costs in fisheries highly determine decisions such as choice to stay or exit
the fishery. For example, some studies argue that fishers are unlikely to exit from fisheries with
low opportunity costs of labour, where alternatives are low paying (Boncoeur et al., 2000;
Cinner et al., 2009). In such cases calculation of opportunity cost of labour may be irrelevant
(Boncoeur et al., 2000). This argument resonates with findings of Cinner et al., (2009), who
noted that Kenyan fishers were unlikely to exit the fishery even when incomes are projected to
fall, due to scarcity of alternative livelihoods.
Similarly, concerning opportunity cost on capital, it has been argued that some fishing units
are unlikely to exit the fishery for alternative investments, even when incomes fall due to
limited investment alternatives (Ramírez-Rodríguez, 2017). Fisheries also often face the
problem of capital malleability, where it is difficult to transform capital held in equipment to
other income activities, and thus actors are unable to exit (Duy et al., 2012; Ngoc et al., 2015).
There is only limited information concerning dynamics around opportunity cost of both labour

34
and capital in SSFs and how this compares to earned incomes in the fishery.
Numerous factors influence profitability in fisheries value chains. In fishing, profitability is
influenced by number of days fished, distance to fishing grounds, capital invested, vessel type
and crew size (Long et al., 2008; Maynou et al., 2013). In trading and processing, it is
influenced by marketing experience, level of capitalization and education (Obayelu et al.,
2016), among other factors e.g. location of the market.
Profitability is also influenced by structural factors, where for example, fishers with lower
capitalization are often disadvantaged in un-equitable catch shares due to dependence on
middlemen (Kulindwa et al., 2013; Wamukota et al., 2014). Studies addressing variation in
profitability and influencing factors in SSFs are scanty. Furthermore, studies addressing these
variations in downstream nodes are rare. There has however been recent global interest in
analysis of financial performance to address such gaps (Brinson et al., 2006; García-de-la-
Fuente et al., 2013). In Kenya, several studies have also been undertaken e.g Wamukota
(2009), Wamukota et al., (2014) and Wamukota & McClanahan (2017) addressing some
aspects of financial performance.
1.12.7 Institutional and regulatory environment
Contextual factors within and outside the fishery such as policy, institutional and regulatory
environment are important in determining outcomes in the fishery. For example, value chain
development functions such as provision of infrastructure and equipment, training of actors,
provision of extension services, organizing of actors, support to marketing and value addition,
and promotion of research and development are highly dependent on the policy, institutional
and regulatory framework (Lin et al., 2014; Donovan et al., 2015; Even & Donovan, 2017).

35
The regulatory framework also plays a critical role in determining costs of operations, licensing
regime, price of fish products and hence income. Some policy-related interventions, for
example provision of subsidies on fuel and fishing equipment can have long term positive
impacts on fishers’ income (Horemans et al., 1994; Turay et al., 1997). Fisheries development
and management are also imbedded in policy and regulatory framework, which also outlines
future strategies (Parris, 2010; Sunoko & Huang, 2014; Yeeting et al., 2016). The policy and
regulatory frameworks also shape other aspects, such as resources access, equitable benefit
sharing, level of investments and incentives for fisheries development (Sowman et al., 2014).
A robust institutional framework to implement policies, laws and regulations is required for
guidance and fostering sound management of the resource base (Dang et al., 2017). A weak
institutional framework may lead to haphazard implementation and ineffective measures that
could affect the whole value chain negatively (Pedroza-Gutiérrez et al., 2016). Institutions also
play different roles such as improving performance of the value chain and creating an enabling
policy environment (Loc et al., 2010; Lin et al., 2014; Yeeting et al., 2016).
The extent to which value chain development measures, policy, institutional and legal
provisions address needs of the value chain can be varied and requires constant evaluation.
Such evaluation is necessary in order to identify weaknesses and implement reforms that meet
needs of both actors and the resource base (Yeeting et al., 2016). The institutional framework,
which provides feedback to political and legislative levels of governance should also be
regularly reviewed to conform to policies and laws (Yeeting et al., 2016).
In fisheries, there are numerous studies analyzing policy and legal frameworks related to
management and conservation (Wever et al., 2012; Muawanah et al., 2018; Shamsuzzaman &
Islam, 2018). There is also considerable work on policy and legal frameworks in industrial
fisheries (Lin et al., 2014; Yeeting et al., 2016). There are however inadequate studies focusing

36
on analysis of value chain development related policies and laws targeting SSFs. Furthermore,
analysis has rarely been along the whole value chain and from actors’ perspectives.
Consultations with value chain actors concerning policy and legal frameworks, has added value
since it considers their views, gauges adequacy of the frameworks and determines required
reforms (Turyahabwe et al., 2017). It is also crucial to bring actors’ views in evaluations, in
order to voice concerns of the marginalized (Sowman et al., 2014).
Actors’ awareness and perception of government performance in policies and laws is
influenced by myriad factors such as education, age, livelihood options, and income.
Awareness is known to improve as level of education and income increases (Turyahabwe et
al., 2017). On the contrary, actor awareness and perception diminishes amongst actors
dependent on multiple livelihoods, due to lack of focus on any particular livelihood
(Turyahabwe et al., 2017). Other studies have found that factors such as income, education and
age influence access to services outlined in polices and laws e.g. extension services and
training (Muatha et al., 2017; Olorunfemi et al., 2017). Information on influence of such factors
on actors’ perception of government performance in value chain development policies and
laws is scanty in SSFs.
Kenya’s fisheries institutional and regulatory framework dates to the colonial era. Under the
colonial government, fisheries were managed through the fisheries protection ordinance of
1908. After independence in 1963, a host of amendments to the colonial law were undertaken,
giving rise to the Fisheries Act Cap (378) of 1989, later amended in 1991, 2007 and 2012
(Government of Kenya, 1991). More recently, the fisheries law was revised to conform to
provisions of Kenya’s new constitution of 2010, giving rise to the Fisheries Management and
Development Act (FMDA) No. 35 of 2016 (Government of Kenya, 2016b). In addition,
Kenya’s fisheries management has since 2008 been guided by the National Oceans and
Fisheries Policy (2008) (Government of Kenya, 2008).

37
Kenya’s 2010 constitution (Government of Kenya, 2010), provides for every treaty entered by
the country, to be part of its laws. Thus, international treaties, conventions and agreements
signed and assented to are deemed to be part of Kenyan fisheries management laws. The key
international instruments include; United Nations Convention on the Law of the Sea
(UNCLOS) of 1982, FAO Compliance Agreement of 1993 to Promote Compliance with
International Conservation and Management Measures by Fishing Vessels on the High Seas,
United Nations Fish Stock Agreements (UNFSA) of 1995, Code of Conduct for Responsible
Fisheries (CCRF) of 1995, International Plan of Action to Prevent, Deter and Eliminate Illegal,
Unreported and Unregulated Fishing (IPOA-IUU) of 1999 and Port State Measures Agreement
(PSMA) of 2009.
Institutional framework to manage fisheries has changed from time to time in tandem with
changes in government structure, leading to the de facto management body being a department,
ministry or parastatal. For example between 2008 and 2012, fisheries were managed by a fully-
fledged Ministry of Fisheries. From 2012 to 2015 they were managed under a department in
the Ministry of Agriculture, Livestock and Fisheries. Since 2017, as per provisions of FMDA
(2016), fisheries management is under transition to be managed by the Kenya Fisheries
Service; a parastatal with semi-autonomous status in the Ministry of Agriculture, Livestock,
Fisheries and Irrigation. Fish marketing is also under transition and will be coordinated by the
Kenya Fisheries Marketing Authority (KFMA). FMDA (2016) also establishes the Kenya
Fisheries Advisory Council to advice the government on fisheries issues and priorities.
There are other institutions such as the Kenya Wildlife Service and Kenya Maritime Authority
that have jurisdictions in some aspects of fisheries management such as managing marine parks
and reserves and regulation of water vessels respectively. Under the new constitution and
FMDA, counties, which form the second level of administration in Kenya, are also mandated
to perform some devolved functions related to fisheries management and development.

38
Kenya’s new constitution advocates for inclusiveness and thus communities, civil society and
the private sector have a recognized role in fisheries management as part of public
participation.
Despite Kenya’s historical and elaborate institutional and regulatory frameworks on fisheries,
only limited literature on their impacts in Kenya exists (Karuga et al., 2007; Kamau et al.,
2009; Manyala, 2011). These authors cite challenges facing fisheries institutional and
regulatory frameworks as; fractured institutional framework, inadequate and un-harmonized
laws, overlapping or contradicting mandates, unimplemented statutes, and unsupportive
policies. Weaknesses in organizational capacity of community groups involved in fisheries
management are still evident, and this hampers progress in SSFs development (Karuga et al.,
2007; USAID, 2008). This is despite adoption of the fisheries co-management framework
under the Beach Management Unit (BMU) gazette notice of 2007 (Government of Kenya,
2007). Specific empirical analysis of the impact of institutional, policy and regulatory
frameworks on value chain development of Kenya’s SSFs is still scanty.
Kenya’s first National Oceans Fisheries Policy (Government of Kenya, 2008) attempted to
address some of these challenges, but information on the effect of this policy to small-scale
fisheries to date is unavailable. Linkages between economic performance of SSF actors, and
institutional and regulatory framework in Kenya have also not been adequately addressed in
studies. With the reformed fisheries law, FMDA (2016), it is expected that most of these
challenges will be addressed.
1.12.8 Constraints and opportunities
SSFs face myriad constraints that hamper their full potential to attain economic goals. A vast
majority of constraints facing SSFs actors are extensively documented in literature, and mostly

39
address extrinsic environmental, resource or governance issues. These include; economic and
political marginalization, perennial underfunding, lack of political voice, poor infrastructure,
overfishing, habitat degradation, resource decline, poverty, threats from commercial vessels
fishing inshore, illegal and destructive fishing practices, resource use conflicts, siltation and
pollution and weak governance (Salas et al., 2007; Andalecio, 2010; Salmi, 2015; Pedroza-
Gutiérrez et al., 2016). SSFs also face value chain intrinsic operational constraints, such as;
lack of infrastructure and equipment, poor transportation, high costs of operations, poor access
to capital, scarcity of fish, low market demand and low prices (Olsson, 2009; Emdad et al.,
2015; Pedroza-Gutiérrez et al., 2016).
In Kenya’s marine small-scale fisheries, only few studies analyzing value chain related
constraints and opportunities exist. Karuga et al. (2007) identified constraints facing marine
fisheries value chain as; inaccessibility and high cost of inputs, low capacity to access offshore
fisheries, declining stocks and catch rates, inadequate policy support, weak actor
organizational capacity, inadequate cold chain facilities, lack of business management skills,
lack of appropriate markets, lack of market information, poor roads and landing site
infrastructure, low value addition, lack of banking services and actor’s saving culture and
inadequate training on various areas.
Wamukota (2009) identified fish marketing constraints as; lack of ownership of equipment by
fishers, lack of cold chain facilities and poor means of transport. Karuga et al. (2007) also
identified opportunities as; facilitation of training in organizational, managerial and business
skills, facilitation to acquire modern fishing equipment, improvement of the cold chain, full
implementation of the fisheries policy, promotion of aquaculture and support to formation of
producer and trading groups. Despite these analyses, there is still lack of studies that
empirically rank importance of constraints and opportunities in fisheries in Kenya. Impact of
interventions to resolve constraints has also not been adequately addressed in Kenyan SSFs.

40
Although SSFs actors often face similar constraints, there are certain distinctions at different
value chain nodes. For example, fishers often face constraints related to lack of ownership of
equipment, low fish prices, lack of access to capital, lack of bargaining power, environmental
degradation, overfishing and lack of safety and security at sea (Emdad et al., 2015; Salmi,
2015; Pedroza-Gutiérrez et al., 2016). Some of the constraints facing fish traders have been
noted as high transportation costs, high start-up capital, fish scarcity, lack of marketing
premises and high levies (Obayelu et al., 2016). Small-scale processors face a different set of
constraints such as lack of capital, lack of access to fish supplies, price discrimination and sex
for fish transactions (Béné & Merten, 2008; Fröcklin et al., 2013; Matsue et al., 2014).
Presence of persistent constraints often masks opportunities existing in a fishery. As such,
many opportunities are not well analyzed or documented due to perceived low returns and
general marginalization of SSFs (Salas et al., 2007; Mills et al., 2011; Pedroza-Gutiérrez et al.,
2016). Therefore, analysis of constraints facing SSFs actors, can help to realize their full
potential by identifying existing opportunities. Involvement of all nodes of the value chain in
the analysis is also crucial, since it allows wider consultations and incorporation of local
concerns (Pita et al., 2010; Verweij et al., 2010). Local participation also allows incorporation
of Local Ecological Knowledge (LEK) in analyzing situations and making decisions
(Andalecio, 2010).
Description of the study area
The study was conducted along the Kenya coastline at five sites namely; Malindi-Shella and
Mayungu landing sites in the North, and Shimoni and Vanga landing sites in the South (Figure
1.2). Malindi and Shimoni landing sites are adjacent to Malindi Marine Protected Area and
Kisite Mpunguti Marine Protected Area respectively. Mayungu and Vanga landing sites are
farther from Marine Protected Areas (MPAs). Mombasa study site included fish markets at

41
Majengo, Gulshan and Tononoka. They are centrally located and represent a convergence
market for fish from other coastal locations. Their inclusion was to capture secondary
destination markets and dynamics around them.
This geographical spread represents diversity of activities and actors, which allowed
comprehensive study of value chains and actors’ competitive behaviour. Malindi and
Mombasa are urban areas, with Mombasa being the largest city along the coast and Kenya’s
second largest city. Mayungu is rural and closer to Malindi, but with relatively poor access,
while Shimoni and Vanga are rural and farther away from urbanized Mombasa.
Administratively, Malindi-Shella and Mayungu respectively fall within Shella and Watamu
sub-locations within Malindi sub-county of Kilifi County. Shimoni and Vanga respectively fall
within the Pongwe Kikoneni and Lunga lunga sub-locations, Lunga lunga sub-county of Kwale
County. The fish markets at Majengo, Gurshan and Tononoka Mombasa fall within Mvita sub-
county of Mombasa County.
Malindi has the highest population (54,556) among the study sites with 14,488 households
(Government of Kenya, 2019a). Shimoni has a population of 6,520 with 1,618 households.
Vanga has a population of 5,888 with 1,190 households. Mayungu’s landing site population is
not disaggregated, but the wider Watamu sub-location has a population of 12,286 with 3,575
households. Two major religions dominate the study sites. About 61% of the population in
Kwale county professes Islam, while 36% professes Christianity. In Kilifi county, 18% of the
population professes Islam, while 68% professes Christianity.

42
Figure 1.2. A map of the Kenyan coastline showing study sites. Source Kimani, (2020)

43
Education, which determines many aspects of the economy such as access to opportunities and
skills, is varied in the study sites. In Lunga lunga sub-county, at least 31% of the population is
illiterate, compared to the national average of 16.3% or 19.6% of national rural population and
8.8% of national urban population (Government of Kenya, 2019b). In Malindi sub-county at
least 15.6 % of the population is illiterate. However, 42.6% of the population is currently
enrolled for learning in Lunga lunga sub-county compared to 43.9% in Malindi. This suggests
that current efforts by Kwale county to promote education are narrowing the literacy gap
between itself and other coastal counties. About 26% of the total labour force in Kwale county
aged (15-64) is either unemployed or underemployed, compared to a national average of 30%,
while that of Kilifi is 32% (Government of Kenya, 2019b).
In terms of technology, mobile penetration which is useful in communication, access to
information and mobile money transfers and lending, is lower in the study sites compared to
the national average penetration of 47% (Government of Kenya, 2019b). In Lunga lunga sub-
county, mobile penetration is 27.7%, but higher in Malindi sub-county at 41.9%. Electricity,
which is important in various operations at the household level including fish preservation,
charging phones and lighting has varied penetration at the study sites. At Lunga lunga sub-
county it is about 14.9%, compared to the national average of 50.4%, while Malindi has the
same penetration as the national average (Government of Kenya, 2019b).
Economic activity within the study area is varied. Agriculture is widely practised in the study
area, where subsistence farming dominates compared to commercial farming. In Lunga lunga
sub-county, 96% of households practise subsistence farming, while only 4% practise
commercial farming (Government of Kenya, 2019b). In Malindi sub-county, 98% of
households practise subsistence farming, while only 2% practise commercial farming. Key
crops grown in the sites include; maize, sorghum, rice, beans, cassava, sweet potatoes, green
grams, bananas, tomatoes, onions, ground nuts, millet, watermelons, kales, sugarcane and

44
cotton (Government of Kenya, 2019b).
Tourism is also an important economic activity within the study sites. For example, Kwale
county has 11 tourist class hotels with a bed capacity of 3,053, and has plans for development
of the Diani resort city as a vision 2030 flagship project (County Government of Kwale, 2018).
Kilifi county has eight classified hotels with a bed capacity of 1,026 (County Government of
Kilifi, 2018). Industrial investments that contribute to Kwale county economy include; Coast
Calcium Limited mining calcium, Base Titanium mining titanium ore, Bixa Limited farming
and processing bixa and Kwale International Sugar Company farming and processing sugar.
Kilifi county has about 22 key industrial investments that include; three cement factories,
several sand and salt mining and processing industries and several Export Processing Zones
(EPZ) and other industrial parks (County Government of Kilifi, 2018).
In terms of fisheries, the study sites are dominated by SSFs, just like Kenya’s marine fisheries,
where SSFs account for 98% of landings (Government of Kenya, 2016a). Like the rest of the
coast, the fishery is multi-gear, multispecies with basket trap, gill net, hand line, spear gun and
beach seine as the major gears in use (Okemwa et al., 2017; Samoilys et al., 2017). Key fish
species landed include; snappers, rabbitfishes, emperors, sweetlips, unicornfishes,
surgeonfishes, tuna, mackerels, jacks and trevallys, molluscs, sharks, rays and crustaceans
(Government of Kenya, 2016a; Okemwa et al., 2017).
Catch rates at the study sites are varied by gear, where at Shimoni and Vanga, small-scale purse
seines land 15.1 Kg fisher-1day-1, large mesh gillnets 8.25 Kg fisher-1day-1 reef seines 4.16 Kg
fisher-1day-1, small mesh gillnets 7.23 Kg fisher-1day-1, beach seines 2.77 Kg fisher-1day-1 and
handlines 4.5 Kg fisher-1day-1 (Okemwa et al., 2017). A study by Munga et al., (2014) in
Malindi found that the highest catch rates was amongst canoe-gillnet and mashua-gillnet
combinations, and the lowest was amongst foot-handline and foot-seine net combinations.

45
There were also no significant differences observed between propulsion and gear categories.
In terms of biophysical characteristics, Malindi, Mayungu, Shimoni and Vanga fall within
Eastern African Marine Ecoregion (EAME), which is one of the ten global marine ecoregions
with high biodiversity of importance (EAME, 2004). Within the larger EAME, lies
Msambweni-Tanga seascape where Shimoni and Vanga fall and Mida Creek-Malindi
seascape, where Malindi and Mayungu fall. These seascapes possess key marine habitats that
include; coral reefs, seagrass beds, mangrove forests and open waters.
Fringing coral reefs are a common feature of the study sites, just like the rest of the Kenyan
coast. The coral reefs are dominated by coral families Portidae (Porites and Goniopora spp.)
and Faviidae (Meandrina and Favia species) (UNEP, 1998). Some of the common fish species
found in coral reefs include; parrot fishes, surgeonfishes, unicornfishes, moray eels,
damselfishes, wrasses, angelfish and scorpion fish. In Malindi around the Malindi Marine Park
(MMP), about 55 coral genera were recorded before the 1998 coral bleaching event associated
with the El Niño Southern Oscillation warming anomalies (Lambo & Ormond, 2006).
However, after the bleaching event, diversity was reduced to 23 genera with a coral cover of
5.1% within MMP and 2.1% within the Malindi marine reserve (Lambo et al., 2006). In
Southern Kenya after the 1998 bleaching, coral cover was reduced to 19.5% in protected reefs
and 14.4% in unprotected reefs (Obura et al., 2002).
Like the rest of the Kenyan coast, the study sites have seagrasses beds commonly encountered
in back-reef lagoons, where up to 12 seagrass species have been encountered in Kenya
(Ochieng & Erftemeijer, 2003). Seagrasses support up to 100 species of fish such as
parrotfishes, goatfishes and rabbitfishes. They also support the endangered green turtle
(Chelonia mydas), hawksbill turtle (Eretmochelys imbricata) and the dugong (Dugong dugon)
(UNEP, 1998; Ochieng et al., 2003). Macroalgae are also an important feature of the seagrass
habitats where up to 50 species have been recorded (Ochieng et al., 2003).

46
Mangroves are an important resource and habitat in Kenya’s coast, where nine species have
been recorded. They play a critical role as a habitat for many fish species and invertebrates that
spend up to 90% of their lifetime within mangroves e.g. prawns (Penaeus indicus, Penaeus
monodon, Penaeus semisulcatus, Metapenaeus monoceros); crabs (Scylla serrata, Uca spp.,
Sesarma spp. and Birgus latro); molluscs (oysters such as Brachydontes spp. and Crassostrea
cucullata) (UNEP, 1998). They also form an important sediment trap from inland runoff
before it flows onto seagrass and coral habitats, hence offering protection against sediment
plumes that leads to death of corals and seagrasses. In the study sites, Vanga has the highest
mangrove coverage with 4,265 ha, while Funzi Bay has 2,715 ha (UNEP, 1998).
The study sites share similar climatic characteristics as the rest of the Kenyan coast. They
experience a modified equatorial type of climate with two rainfall peaks influenced by the
Inter-Tropical Convergence Zone (ITCZ) low-pressure belt. This results to a short rainy season
between March and May and a long rainy season between October and December with an
annual rainfall range of 1000 to 1200 mm (ASCLME, 2012). However, Southern coast receives
more rainfall than the Northern coast. Mean daily temperature is approximately 27°C while
humidity averages about 80% (ASCLME, 2012).
Increasing climatic changes and variability are continually influencing precipitation and river
flow patterns along the coast. Affected rivers within the study sites include; Rivers Sabaki in
Malindi, Ramisi in Funzi Bay and Shimoni and Umba in Vanga (ASCLME, 2012). They are
usually loaded with sediments, especially during the rainy seasons which significantly impacts
on floodplains, deltas and coastal ecosystems. The sediments are rich in nutrients that
profoundly increases primary productivity. The highest phytoplankton production and
zooplankton abundance occurs between March and May, and November and December when
there is highest sediment load from heavy rains (ASCLME, 2012). The highest productivity
has been recorded around estuaries of Rivers Sabaki, Ramisi and Umba, (ASCLME, 2012;

47
Kiteresi et al., 2012). Upto 88 taxa of phytoplankton were recorded in estuaries of Rivers
Ramisi and Umba (Kiteresi et al., 2012). Fish eggs and fish fry also increase in abundance
during these periods where they feed on the abundant phytoplankton and zooplankton (Kiteresi
et al., 2012).
Although sediment load increases primary productivity around river mouths, it is also
detrimental to marine habitats. For example, River Sabaki discharges a sediment load of
between 30 tonnes day-1 during low river runoff and 133,000 tonnes day-1 during high river
runoff, and upto 2 million tonnes year-1. This has had a profound smothering effect on the
corals in Malindi Marine Park and surrounding reserve (UNEP, 1998; Kitheka, 2013; Kitheka
et al., 2014). Sediment deposition by River Sabaki around Malindi also explains the low coral
cover and patchiness of the reefs there (Obura et al., 2002).
Research design and sampling
The study employed individual surveys as the primary data collection tool to gather key value
chain related information as well as Focus Group Discussions (FGDs) to identify and rank
constraints and opportunities. Actors targeted included fishers by gear, middlemen and
processors (small-scale processors and small-scale restaurant operators). Interviews data was
collected in a period of nine months every month between November to December 2014,
January to March and June to September in 2015. Data on FGDs was collected in September
2016. Therefore, responses covered both North East Monsoon (NEM) and South East
Monsoon (SEM) seasons. The study design and sampling are described below.

48
1.14.1 Study design
The study was based on the mixed methods design. The mixed methods design is grounded on
the pragmatic paradigm that seeks a middle ground to address complex research problems
requiring both quantitative and qualitative approaches (Creswell, 2013). The pragmatic
paradigm is a compromise between the positivist and the interpretivist paradigms, also known
as relativist or constructivist paradigms (Denzin et al., 1994; Creswell, 2013).The positivist
paradigm supposes that the truth is singular and is inclined to quantitative techniques of
research, which uses measurable data to infer conclusions. Positivism is built around analyzing
problems from a cause and effect perspective (Denzin et al., 1994; Creswell, 2013). On the
other hand, interpretivist paradigm supposes that there is no one truth but rather multiple
viewpoints about phenomena. It seeks participants’ perspectives and constructs meaning out
of their experiences to infer conclusions (Creswell, 2013). It uses qualitative techniques that
employ inductive approaches to theorize and make conclusions.
In the present study, data with both quantitative and qualitative elements were collected. Thus
the mixed methods design was used as outlined below, based on the respective objectives;
1. In objectives one, two and three, quantitative elements included structure and
performance variables where data on cost of equipment, fish catches, prices and
incomes was collected. Qualitative aspects included conduct variables, where further
probing of respondents was conducted to obtain information on collusion practices,
power to set prices, access to information prior to transactions and fish grade targeted.
Data for the three objectives was obtained through field interviews using structured
questionnaires.
2. In objective four, quantitative aspects included respondents’ ranking of constraints and
opportunities using the Analytical Hierarchical Process method. Data was obtained
through focus group discussions. Data on extent of support services was obtained

49
through field interviews using structured questionnaires together with that of objectives
one, two and three. Qualitative aspects included further probing of respondents’
rankings, in order to gain more insight about their choices.
3. In objective five, quantitative aspects included respondents’ views on government
performance in implementation of value chain development objectives outlined in
Kenya’s fisheries policy and legal framework. Their responses were based on the Likert
scale. Data was obtained through field interviews using structured questionnaires
together with that of objectives one, two and three.
1.14.2 Sampling
Sample size of interview respondents was determined using the Slovin’s formula (Yamane,
1967; Tejada et al., 2012) as below;
𝑛 =𝑁
1 + 𝑁(𝑒)2
Where n is the sample size, N is the estimated population size and e is the level of precision at
95% degree of confidence.
The selection of respondents followed procedures described in Cochran (1977), Loc et al.,
(2010) and Wamukota et al., (2014, 2015). This involved systematic sampling, where every kth
respondent by actor category was interviewed. For fishers, boat captains were purposively
sampled in order to capture fishing unit variables. Respondents were interviewed by the author
and one trained data collector at landing sites and markets. The sampling frame of respondents
by actor group and site is shown below, where vessels were the target unit for fishers (Table
1.1).

50
A total of 403 respondents were interviewed comprising of 73 middlemen, 108 processors and
222 boat captains (representing fishing vessels) out of an estimated population of 601
respondents (109 middlemen, 157 processors and 335 vessels) (Table 1.1). Challenges
encountered included actors decline to be interviewed and seasonal migrations. This resulted
to a reduced total sample size of interviewed respondents.

51
Table 1.1. Sampling frame of respondents interviewed by actor group and site
Malindi Mayungu Shimoni Vanga
Mombas
a Total
Actor group Pop
ula
tion
Sam
ple
d
Pop
ula
tion
Sam
ple
d
Pop
ula
tion
Sam
ple
d
Pop
ula
tion
Sam
ple
d
Pop
ula
tion
Sam
ple
d
Pop
ula
tion
Sam
ple
d
Fishers
Basket trap 17 11 18 12 28 27 38 28 - - 101 78
Cast net 8 5 5 1 4 1 5 - - 22 7
Drifting gillnet 20 4 4 7 5 8 3 - - 39 12
Reef seine net 2 5 3 3 1 14 7 - - 24 11
set net 13 8 3 1 13 8 12 9 - - 41 26
Handline 40 34 15 10 23 20 30 24 - - 108 88
Sub-total fishers 100 62 50 27 78 62 107 71 - - 335 222
Middlemen and processors
Middlemen 27 23 19 12 17 11 31 20 15 7 109 73
Fish processors 43 22 55 47 15 12 44 27 - - 157 108
Sub-total Middlemen and
processors 70 45 74 59 32 23 75 47 15 7 266 181
Total 170
10
7 124 86 110 85 182 118 15 7 601 403
Note; The study focused on trading at the secondary level in Mombasa to follow trading of fish from the other sites. Therefore,
fishers in Mombasa are not included in the study. Processors were also not part of the study in Mombasa since they target fish
from primary middlemen and not secondary middlemen due to the high prices at this level.
51

52
CHAPTER 2: STRUCTURE, CONDUCT AND PERFORMANCE IN
SMALL-SCALE FISHERIES VALUE CHAIN
Introduction
This chapter analyzed how structure in Small-Scale Fisheries (SSFs) influenced actors’
conduct and how structure, conduct and other factors influenced their financial profitability at
selected sites in Kenya’s coast. Structure was based on level of actors’ capitalization, where
present value of equipment for middlemen and processors was used, while percent ownership
of equipment for fishers was used. This was also used in further analysis of influence on actors’
profitability. Structure was also analyzed based on actor grouping by type of fishing (offshore
or inshore) and trading (primary or secondary). It was also analyzed in context of market
concentration based on number of actors by market share of fish purchases amongst
middlemen.
Conduct was considered in context of actions taken by actors to remain competitive in the
market. Conduct variables considered included choice of products dealt with, in context of fish
grade, where grades 1+, 1, 2 and 3 in order of decreasing price were used. It also included
analysis of power held by individuals to determine buying and selling prices. It also included
actors’ tendency to jointly collude in setting buying and selling prices. Conduct also included
actors’ access to information on buying and selling market prices prior to transactions.
Influence of structure on conduct factors was tested, and was based on value of equipment
amongst middlemen and processors and percent ownership of equipment amongst fishers.
Performance was examined in perspective of financial profitability. First, important variables
used to derive profitability were analyzed before its computation. These include; fish
quantities, purchases, sales, fixed costs and variable costs. Factors influence of influencing

53
profitability were also tested and included conduct factors as well as other factors including;
age, experience, education, cost, sales, access to credit, actor category and site.
The study hypothesized that capital influenced conduct of actors in terms of fish grades
targeted, price collusion, access to price information and power to set prices. Conversely the
study also hypothesized that actor capitalization and conduct influenced profitability. The
study had the following objectives; 1) analyze actors’ performance in marine small-scale
fisheries in Kenya on key indicators; purchases, sales, costs and financial profitability, 2)
analyze factors driving financial profitability, including demographic, socio-economic,
structure and conduct factors. Results of the study are applicable in policy and value chain
development interventions.
Materials and methods
Data was collected through field interviews targeting fishers (vessel captains), middlemen and
processors as described in section 1.14, and included indicators described below.
2.2.1 Data collection on structure
Indicators used to derive structure included cost of equipment in local currency (KES), its
ownership and age. These were used to categorize actors by level of capital. Middlemen’s
source of fish was also recorded as; primary middlemen (sourcing fish directly from fishers)
or secondary middlemen (sourcing from other middlemen). Fishers’ primary gear was also
recorded. Fish sales data was also recorded for calculation of market concentration.

54
2.2.2 Data collection on conduct
Respondents were asked to state if they participated in market behaviour such as collusion and
power in setting fish prices. To infer collusion, respondents were asked if they consulted other
actors to set prices. To infer power to determine fish prices, respondents were asked if they
were involved in price-setting through dictation, negotiation or took prevailing market prices.
Respondents were also asked to indicate if they had access to fish buying or selling price
information, prior to transactions.
Choice of fish grade targeted was also recorded. It was based on a three-point local fish grading
system that is dependent on size and species, and it is used to determine prices. Each respondent
was asked to list five most targeted fish types in local nomenclature, grade and price. Fish price
was recorded as; lowest, average and highest, thus capturing lower and upper bound limits.
The four common fish grades recorded were grades 1+, 1, 2 and 3 in decreasing order of market
value. Grade 1+ consists of high-end fish products such as lobsters, prawns, kingfish, tuna and
squid, with exceptionally high prices. Grade 1 fish, locally referred to as “Laji”, “Mix A” or
“Portion fish”, consists of specific, large-sized fish such as snappers, rabbitfish, emperors and
goatfishes. Grade 2 fish, locally referred to as “Mix B” or “Whole fish” consists of specific
large or medium-sized fish such as parrotfish, groupers, barracuda and fusiliers. Grade 3 fish,
locally referred to as “Smalli or Karanga”, consists of small-sized fish from grades 1 and 2
families, or large-sized fish of low consumer preference such as surgeonfishes, unicornfishes,
Indian mackerels and sting rays. In most cases, they are not weighed, and numbers of fishes or
weight estimates are used in pricing.

55
2.2.3 Data collection on performance
Performance indicators recorded included; costs incurred, purchases and sales. Costs were
categorized as variable (those increasing with increase in activity) or fixed costs (those constant
regardless of increase in activity) (Boncoeur et al., 2000). Fishers’ variable costs included;
fuel, food on long trips, bait, hooks, weights, transport and porter costs. Fixed costs included;
equipment repair, service and maintenance, house rent and anchorage fees for migrant fishers.
Middlemen’s variable costs included; transport, ice and labour, while fixed costs included;
equipment repair, service and maintenance, premises rent, electricity, water and licenses.
Processors’ variable costs included; frying oil, energy, condiments and packaging material.
Processors’ fixed costs were only equipment repair and licenses.
Fish quantities, purchases and sales were based on most recent estimates on a typical day in
SEM and NEM seasons. Prices and fish quantities were stated as lowest, average and highest
in order to derive accurate average estimates within lower and upper bound limits. Fishers
additionally indicated their catch share formula, for individual profit calculation. Respondents’
demographic and socio-economic data was also recorded

56
2.2.4 Data analysis of structure based on actor capitalization
First, in order to obtain capitalization level of each actor, the present value of equipment was
calculated using the straight line depreciation method following Greene (1963). Useful lifetime
of equipment was assumed to be that of the oldest similar equipment from the collected data.
Since equipment was used for long before retirement, a salvage value of 50% of original
purchase price was considered reasonable and used as follows:
𝑆𝑎𝑙𝑣𝑎𝑔𝑒 𝑣𝑎𝑙𝑢𝑒 = 𝑐𝑜𝑠𝑡 𝑜𝑓 𝑒𝑞𝑢𝑖𝑝𝑚𝑒𝑛𝑡 ∗ 50%……………………………… .… .…… . . (i)
𝐴𝑛𝑛𝑢𝑎𝑙 𝑑𝑒𝑝𝑟𝑒𝑐𝑖𝑎𝑡𝑖𝑜𝑛 =𝐶𝑜𝑠𝑡 𝑜𝑓 𝑒𝑞𝑢𝑖𝑝𝑚𝑒𝑛𝑡 − 𝑆𝑎𝑙𝑣𝑎𝑔𝑒 𝑣𝑎𝑙𝑢𝑒
𝑈𝑠𝑒𝑓𝑢𝑙 𝑙𝑖𝑓𝑒𝑡𝑖𝑚𝑒………………… . (𝑖𝑖)
𝑇𝑜𝑡𝑎𝑙 𝑑𝑒𝑝𝑟𝑒𝑐𝑖𝑎𝑡𝑖𝑜𝑛 = 𝐴𝑛𝑛𝑢𝑎𝑙 𝑑𝑒𝑝𝑟𝑒𝑐𝑖𝑎𝑡𝑖𝑜𝑛 ∗ 𝑇𝑜𝑡𝑎𝑙 𝑛𝑢𝑚𝑏𝑒𝑟 𝑜𝑓 𝑦𝑒𝑎𝑟𝑠 𝑖𝑛 𝑢𝑠𝑒. (𝑖𝑖𝑖)
𝑃𝑟𝑒𝑠𝑒𝑛𝑡 𝑣𝑎𝑙𝑢𝑒 = 𝐶𝑜𝑠𝑡 𝑜𝑓 𝑒𝑞𝑢𝑖𝑝𝑚𝑒𝑛𝑡 − 𝑇𝑜𝑡𝑎𝑙 𝑑𝑒𝑝𝑟𝑒𝑐𝑖𝑎𝑡𝑖𝑜𝑛……………… .…… (𝑖𝑣)
In the second step, capitalization level and specialization were used to categorize actors.
Fishers’ classification was primarily based on gear used. Further classification was based on
capitalization, where higher invested units fishing in offshore waters were categorized as high-
capitalized offshore fishers, and the low-capitalized units fishing in nearshore waters were
categorized as low-capitalized, inshore fishers. Middlemen, were classified using locally
applicable criteria, where large-scale middlemen (locally known as “Matajiri”), had the
following characteristics; 1) ownership of “critical equipment” such as fishing gear, boats,
engines and storage equipment, that allowed higher chances of accessing fish and storing it, 2)
ownership of at least two types of “critical equipment” (for example fishing gear and boats) in
combination, with a value of at least KES 200,000, which was the typical investment by large-
scale middlemen, 3) operated from own premises. Traders not meeting these criteria were
classified as small-scale middlemen. Middlemen were further categorized based on
specialization as primary middlemen or secondary middlemen.

57
Fishers were categorized based on their primary fishing gear. Handline fishers had large
variations in value of equipment and hence categorized further. Those using reinforced plastic
boats and wooden boats propelled by engine were categorized as high-capitalized handline
units. Un-mechanized wooden boats and canoes were categorized as low-capitalized handline
units. Small-scale fish processors and restaurant operators who primarily fried fresh fish, were
broadly categorized as processors.
2.2.5 Data analysis of structure in context of market concentration
Market concentration for each site was determined by computing Herfindahl-Hirschman Index
(HHI) based on buyers’ sales volumes following Villasante et al., (2013). This was done by
taking percentage share of sales for each buyer, then squaring and summing for all buyers as
expressed below:
………………………………………………………………. (v)
Where n is the total number of buyers per site and SS is the percentage share of sales for buyer
i. The HHI index ranges from 1-10,000 where an index of 1-1,000 indicates a lowly
concentrated, competitive market; 1,000-1,800 indicates moderate concentration, while 1800-
10,000 indicates highly concentrated, uncompetitive market (Rhoades, 1993; US Department
of Justice, 2017). Only sales by primary buyers were considered in the HHI index calculation
in order to capture competitiveness at the primary level. Thus, Mombasa which had secondary
buyers only, was omitted.
HHI = (𝑆𝑆)2
𝑛
𝑖=1
𝑖

58
2.2.6 Data analysis of conduct in context of fish grading and actor choices
Fish grading and actor choices were complex and required detailed analysis than other conduct
variables. In order to determine actors’ choice of fish grade, the 48 fish types recorded in local
Swahili nomenclature, were grouped into respective fish families using a fish guide (Anam &
Mostarda, 2012). A cumulative frequency curve using elbow method (Ketchen & Shook, 1996),
was used to identify most targeted fish families by actor group. This resulted in 19 fish types
within 16 fish families that were analyzed further (or 84% of the 48 fish types listed).
To determine an actor’s most targeted grade, a 65% cut-off was set to enable clear delineation
of grades. If an actor targeted >65% of grades 1+ and 1, that was considered as high-grade with
a high value, while grades 2 and 3 as low-grade with a low value. If an actor targeted <65% of
both high and low grades, this was considered as mixed grades. Delineation of fish types by
grades and actors was done by plotting DCA plots in CANOCO (Version 4.5), based on
respondent frequencies. Fish grades corresponding to fish types and actor were plotted closer
to each other and vice versa.

59
2.2.7 Data analysis on performance
Performance entailed analysis of fish quantities, purchases, sales, costs, financial profit and
opportunity cost of labour and capital. Average fish quantities, purchases and sales were
obtained by averaging those stated for SEM and NEM seasons by actor group. Costs were
averaged by actor group for each type of cost and a daily cost computed. Financial profit was
calculated following Pascoe et al., (1996b), Long et al., (2008) and Ngoc et al., (2015) as below.
𝐹𝑖𝑛𝑎𝑛𝑐𝑖𝑎𝑙 𝑝𝑟𝑜𝑓𝑖𝑡 = 𝐺𝑅 − 𝑉𝐶 − 𝐹𝐶 − 𝐿𝐶…………………………………………(vi)
Where; GR is gross revenue, VC is variable costs, FC is fixed costs and LC is labour costs. In
actual profit calculation, all costs were amalgamated into a total daily cost. Descriptive statistics
were used to present data.
Opportunity cost of labour was considered as the gazetted hourly government minimum wage
for unskilled workers, set at KES 54.7 hr-1 for year 2015 (Government of Kenya, 2015). This
was multiplied by the total number of hours spent per boat crew or business unit per day.
Opportunity cost of capital was calculated by multiplying invested capital by average annual
interest rate on savings (7%) for year 2015, as averaged by the Central Bank of Kenya
.

60
2.2.8 Statistical analysis of relationship between structure, conduct and performance
Analysis of relationships between structure, conduct, performance and other variables was
done through statistical methods. Regressions were run to determine if structure indicators
(value of equipment and percent ownership) as the predictor variables, influenced actors’
conduct (collusion, price determinants, choice of fish grade targeted and access to market
information). Two types of regressions (binomial and multinomial) were run separately for
each predictor variable. The binomial logistic regressions were done for two levels of response,
while multinomial regressions were done for more than two levels of response.
The general logistic regression analysis following Hosmer & Lemeshow (2000) was expressed
in the following general equation:
𝐏(𝐘) =𝟏
𝟏+ⅇ−(𝛃𝟎+𝛃𝟏𝒊𝐱𝟏𝒊+⋯𝛃𝒋𝒊𝐱𝒋𝒊)
……………………………… .…………………(vii)
Where P is the probability of predicting Y dependent variable, e is the base of natural logarithm,
while Xs are the independent regressors for i respondent. The R statistical software (Version
3.5.3) (R Development Core Team 3.0.1., 2013) was used in the analysis as follows:
For binomial regression the glm function in R software was used, while for multinomial logistic
regression, the logitof function from the mlogit package in R was used. Assumption of linear
relationship between the log odds of the dependent variable and the continuous independent
variables was tested using visual plots in ggplot2 package in R and all were linearly related.
Test for goodness of fit of the models was also done using the Hosmer-Lemeshow test in
generalhoslem package in R, where models with p-value >0.05 should be rejected. The
Breusch-Pagan Test for homoscedacity was done using bptest function in R, and all models
held (p>0.05). Multicollinearity was inspected through Variance Inflation Factors (VIF) and

61
all models were satisfactory with values <10. Odds ratio which indicates how many times the
independent variable increases for every unit increase in dependent variable was also obtained
to help with interpretation of results (UCLA, n.d.). It was obtained by exponentiating
coefficients of the models. The coefficient sign was used to deduce direction of the odds ratio,
where a positive sign indicates increase in odds ratio and vice-versa for a negative sign.
The Hausman-McFadden test of Independent Irrelevant Alternatives using hmftest package in
R was done to assess if the full model was different from reduced model in multinomial logistic
regressions. Models with p-value > 0.05 indicate no differences in the two models and hence
the reduced model is better.
Financial performance tests included Kruskal Wallis test for significant differences in financial
profit between actor groups, where results with a p-value <0.05 at 95% CI were considered
significant. The kruskal.test function in R was used, while post-hoc Dunn’s tests using the
dunnTest function in FSA package in R were conducted to detect significant differences in
pairs. Similar tests were conducted to detect significant differences in fish prices by grades and
actor groups.
Key factors influencing financial profitability were tested using Generalized Additive Models
(GAM) due to non-linearity of some continuous variables where splines were used as
smoothers following Hastie et al. (2009) and Ruppert et al. (2018). These non-linear variables
included; sales, fixed and variable costs for fishers, sales for middlemen and processors’ sales,
variable costs and experience. The semi-parametric GAMs are an extension of GLMs and are
considered suitable for non-linear relationships between the response and explanatory
variables, by letting data determine this relationship instead of prescribing parametric solutions
a priori (Guisan et al., 2002). The general equation form is stated as:

62
𝑔(µ) = β𝜃 + 𝑠(β𝑗1𝑥𝑗1) + β𝑗2𝑥𝑗2 + (β𝑗3𝑥𝑗3
𝑘𝑗−1
𝑖=𝑗
………………… . . +β𝑗𝑝𝑥𝑗𝑝) + 𝜀 ……………(𝑣𝑖𝑖𝑖)
Where 𝜇 is the model predictor and s is the semi-parametric spline function for a range of X
covariates and ε is the error term.
The gam function in mgcv package was used in analysis. Scatter plots were used to determine
variables requiring use of splines. The default cubic spline basis (s) was chosen as the smooth
term for the non-parametric part of the model. Before undertaking GAM statistical analysis,
diagnostic tests were done. To assess normality, the Shapiro-Wilks test in R was run. In this
test, variables with p-values < 0.05 are considered to violate assumptions of normality. The
dependent variable (financial profit) violated this assumption and hence transformed using the
box-cox transformation.
Assumptions of homogeneity of variance, linearity and normality in the distribution of
residuals were checked using residual plots. Models with spline functions for different actor
groups are stated below:
1). 𝐹𝑖𝑠ℎ𝑒𝑟𝑠 = β𝜃 + s(β𝑗1𝑠𝑙𝑗1) + s(β𝑗2𝑓𝑐𝑗2) + s(β𝑗3𝑣𝑐𝑗3) + β𝑗4𝑤ℎ𝑗4 + β𝑗5𝑒𝑥𝑗5 + β𝑗6𝑝𝑜𝑗6 + β𝑗7𝑎𝑐𝑗7
+ (β𝑗8𝑠𝑡𝑗8 + β𝑗9𝑎𝑡𝑗9 + β𝑗10𝑠𝑑𝑗10
𝑘𝑗−1
𝑖=𝑗
+ β𝑗11𝑠𝑖𝑗11 + β𝑗12𝑒𝑑𝑗12 + β𝑗13𝑛𝑏𝑗13 + β𝑗14𝑡𝑟𝑗14
+ β𝑗15𝑠𝑐𝑗15) + 𝜀 …………………………………………………………………… . . … (𝑖𝑥)
2).𝑀𝑖𝑑𝑑𝑙𝑒𝑚𝑒𝑛 = β𝜃 + s(β𝑗1𝑠𝑙𝑗1) + β𝑗2𝑓𝑐𝑗2 + β𝑗3𝑣𝑐𝑗3 + β𝑗4𝑤ℎ𝑗4 + β𝑗5𝑒𝑥𝑗5 + β𝑗6𝑒𝑣𝑗6 + β𝑗7𝑎𝑐𝑗7
+ (β𝑗8𝑠𝑡𝑗8 + β𝑗9𝑎𝑡𝑗9 + β𝑗10𝑏𝑑𝑗10 + β𝑗11𝑠𝑑𝑗11
𝑘𝑗−1
𝑖=𝑗
+ β𝑗12𝑏𝑖𝑗12 + β𝑗13𝑠𝑖𝑗13 + β𝑗14𝑒𝑑𝑗14
+ β𝑗15𝑛𝑏𝑗15 + β𝑗16𝑡𝑟𝑗16 + β𝑗17𝑏𝑐𝑗17 + β𝑗18𝑠𝑐𝑗18 + β𝑗19𝑓𝑔𝑗19) + 𝜀 ………………… (𝑥)
3). 𝑃𝑟𝑜𝑐𝑒𝑠𝑠𝑜𝑟𝑠 = β𝜃 + s(β𝑗1𝑠𝑙𝑗1) + β𝑗2𝑓𝑐𝑗2 + 𝑠(β𝑗3𝑣𝑐𝑗3) + β𝑗4𝑤ℎ𝑗4 + s(β𝑗5𝑒𝑥𝑗5) + β𝑗6𝑒𝑣𝑗6 + β𝑗7𝑎𝑐𝑗7
+ (β𝑗8𝑠𝑡𝑗8 + β𝑗9𝑎𝑡𝑗9 + β𝑗10𝑏𝑑𝑗10 + β𝑗11𝑠𝑑𝑗11
𝑘𝑗−1
𝑖=𝑗
+ β𝑗12𝑏𝑖𝑗12 + β𝑗13𝑠𝑖𝑗13 + β𝑗14𝑒𝑑𝑗14
+ β𝑗15𝑛𝑏𝑗15 + β𝑗16𝑡𝑟𝑗16 + β𝑗17𝑏𝑐𝑗17 + β𝑗18𝑠𝑐𝑗18 + β𝑗19𝑓𝑔𝑗19) + 𝜀 ……………… (𝑥𝑖)

63
Description of variables used in the models is presented below (Table 2.1).

64
Table 2.1. The description of variables used in Generalized Additive Model regression models to analyze performance
Variable symbol Description of variable Type of variable Variable levels
Fishers Fishers’ financial profit person-1day-1 Continuous NA
Middlemen Middlemen’s Financial profit person-1day-1 Continuous NA
Processors Processors’ Financial profit person-1day-1 Continuous NA
sl Sales Continuous NA
fc Fixed costs Continuous NA
vc Variable costs Continuous NA
wh Working hours Continuous NA
ex Experience in years Continuous NA
po Percent ownership Continuous NA
ev Equipment value Continuous NA
ac Access to credit Continuous NA
st Site Categorical Malindi, Mayungu, Mombasa, Shimoni, Vanga
at Actor type – fishers by gear Categorical High capitalized handline, Reef seine net, Drifting
gillnet, Basket trap
Set net, Low capitalized handline, Cast net
at Actor type – fish buyers Categorical Company agent, Large-scale primary middlemen,
Large-scale secondary middlemen, Small-scale primary
middlemen, Small-scale secondary middlemen,
Processors
bd Buying price determinant Categorical Seller, Self, Negotiated
sd Selling price determinant Categorical Buyer, Self, Negotiated
bi Accesses buying price information Categorical Yes, No
si Accesses selling price information Categorical Yes, No
ed Education level Categorical Not schooled, Primary, Secondary, Tertiary
nb No. of buyers selling to Categorical Single, Multiple
tr Training Categorical Yes, No
bc Buying collusion Categorical Yes, No
sc Selling collusion Categorical Yes, No
fg Fish grade Categorical High grade, Mixed grade, Low grade
64
65
Results
2.3.1 Demographic and socio-economic characteristics of small-scale fisheries
Actors in the fishery had youthful demographic characteristics, with an average of 34, 39 and
43 years for processors, middlemen and fishers respectively (Table 2.2). Actors above 60 years
were below 13%, with majority being fishers. Over 60% of processors and middlemen were
new entrants with less than 10 years’ experience, while fishers were only 16%. Education level
across all groups was low with over 90% of fishers and processors and 67% of middlemen
having only attained primary education.
Fishers and processors spent more days in fish related activities in NEM at an average of 6
days week-1, compared to 5 days week-1 in SEM, while middlemen spent 6 days week-1 in both
seasons. On average, all actor groups engaged in alternative livelihoods. Over 49% of
processors and fishers had alternative livelihoods, but only 37% for middlemen. Despite
having alternatives, over 94% of actors still ranked fishery related livelihoods as most
important.
The fishery was largely gender imbalanced, where all fishers and 95% of middlemen were
male, while 97% of processors were female. Overall, 73% of respondents were male and 27%
female. Middlemen had the highest number of dependents (8) followed by fishers (7) and
processors with at least 4 dependents. On marital status, most actors were married (> 59%).
However, 41% of processors were unmarried.

66
Table 2.2. Summary of respondent’s demographic and socio-economic characteristics
Variable Levels
Fish
processors Fishers Middlemen
Age Average age 34 43 39
% in age group (20-40 yrs) 80 47 61
% in age group (41-60 yrs) 19 40 34
% in age group (60-80 yrs) 1 13 6
Experience % experience (1-10yrs) 79 16 60
% experience (11-20yrs) 16 36 30
% experience (21-30yrs) 6 23 5
% experience >30yrs - 24 4
Education % none 1 0 0
% with primary education 96 93 67
% with secondary education 2 6 28
% with tertiary education 1 1 5
Days spent Days worked per week in SEM 5 5 6
Days worked per week in NEM 6 6 6
Average annual days worked 288 274 314
Alternative
livelihood
% with other occupation 58 49 37
% with no other occupation 42 51 63 % ranking fishery activity as
primary 94 96 96
% ranking fishery activity as
secondary 6 4 4
Gender % Female (27% of all actors) 97 0 5
% Male (73% of all actors) 3 100 95
Dependents Number of dependents 4 7 8
Marital
status
% married 59 94 84
% divorced 20 1 7
% single 10 5 8
% widowed 11 0 1
2.3.2 Structure in context of actor capitalization
Classification of high-capitalized fishers fishing offshore included; reef seine, high-capitalized
handline and drifting net fishers. Low-capitalized fishers fishing inshore included; basket trap,
low-capitalized handline, set net and cast net fishers (Table 2.3).
Classification of middlemen by capitalization and specialization resulted in the large-scaled
(high-capitalized) category that included; company agents, large-scale primary and secondary
middlemen. Small-scaled (low-capitalized) category included; small-scale primary and

67
secondary middlemen. Small-scale processors and restaurant operators were also classified as
low-capitalized, and jointly classified as processors.
In terms of boat crew, reef seine net had the highest number of crews with an average of 18
fishers boat-1, while basket traps had the least, with an average of 2 fishers boat-1 (Table 2.3).
In terms of proportional ownership of equipment, large-scale middlemen dominated with
cumulative investments of KES 29,278,468 (44%) of total. Fishers, collectively held KES
33,918,822 (51%) of total investments, but only owned 27 -77% of it, with the rest belonging
to middlemen. Observably, two of the high-capitalized fishing units categories had the least
ownership among all fishers.

68
Table 2.3: Actor categorization based on capitalization, listed in decreasing order of value of equipment
Broad
category
Actors’ specific category by
activity/operation
Actor
abbreviation n
Average
crew size
Total value of
equipment in
KES
Average
value of
equipment
in KES.
%
equipment
ownership
Offshore
fishers
High capitalized handline HCH 38 4 15,535,795 408,837 27
Drifting gillnet DG 11 4 4,064,729 369,521 27
Reef seine net RSN 11 18 3,349,036 334,904 73
Inshore
fishers
Set net SN 26 4 2,917,125 116,685 62
Basket trap BT 78 2 6,368,584 81,649 58
Low capitalized handline LCH 50 3 1,533,839 30,677 45
Cast net CN 8 4 149,714 21,388 77
Fishers’ total 222 33,918,822
Large-scale
middlemen
Company agent CA 3 13,210,390 4,403,463 91
Large-scale secondary middlemen LSSM 4 3,426,860 856,715 100
Large-scale primary middlemen LSPM 15 12,641,218 842,748 100
Large-scale middlemen’s total 22 29,278,468
Small-scale
middlemen
Small-scale primary middlemen SSPM 34 1,478,422 80,766 98
Small-scale secondary middlemen SSSM 17 1,211,720 71,278 90
Small-scale middlemen’s total 51 2,690,142
All middlemen’s total 73 31,968,610
Processors Restaurant operators RO 7 70,782 10,112 100
Small-scale fish processors SSFP 101 248,977 2,465 100
Processors’ total 108 319,759
All actors’ total 403 66,207,191
Note: ‘n’ is the total number sampled actors by actor group
68

69
2.3.3 Structure in context of market concentration
Results of Herfindahl-Hirschman Index (HHI) showed that scores for the four sites were
below 1,800 (Table 2.4), thus indicating low market concentration and high market
competitiveness across the four sites (Rhoades, 1993; US Department of Justice, 2017).
Table 2.4. Herfindahl-Hirschman Index scores by site
Site HHI score
Mayungu 607
Shimoni 920
Vanga 988
Malindi 1,053
2.3.4 Conduct in context of fish grading, pricing and actors’ choice
There was strong association of kingfish, tuna and squid with grade 1+, while the rest
overlapped between grades (1, 2 and 3) (Figure 2.1). Actors’ choices of fish grade also
overlapped with fish grades targeted (Figure 2.2). However, some actors had strong
preference for specific grades based on their capital and consumer needs. For example,
30% of middlemen targeted high-grade fish and only 12% targeted low-grade (Table 2.5).
In contrast, only 5% of processors targeted high-grade fish and 72% targeted low-grade.
Table 2.5. Percentage of fish grades targeted by respondents
Actor category High-grade Mixed-grade Low-grade
Middlemen 30% 58% 12%
Processors 5% 23% 72%

70
Figure 2.1. Detrended Correspondence Analysis plot showing association between
fish type and grade
Figure 2.2. Detrended Correspondence Analysis plot showing association between
fish grade and actor node
Note: Abbreviations; CA=Company agent, LSSM= Large-scale secondary middlemen,
SSPM=Small-scale primary middlemen, SSSM=Small-scale secondary middlemen,
RO=Restaurant

71
Results also indicated that fish ex-vessel prices correlated with grading. There was a
negative ex-vessel price gradient from high-grade fish (1+ and 1) to low-grade fish (2 and
3) (Figure 2.3). These differences were also confirmed by Kruskal Wallis test results
showing highly significant differences of prices by grades (H=255.07, df=3, p<0.001).
Dunn’s post-hoc test for prices between grades revealed that all comparisons were highly
significant (p<0.001), except for between grades 2 and 3 (p=0.934). Analysis of fish price
by actor type also showed highly significant differences (H=52.125, df=3, p<0.001).
Dunn’s post-hoc test for prices between actors revealed significant differences for all
actors, except between company agents and small-scale primary middlemen (p<0.152)
and between large-scale primary middlemen and small-scale primary middlemen
(p<0.125).
Figure 2.3. Plot of median ex-vessel price of fish by grade.
Note: Grades are in decreasing order of prices where, grade 1+ attracts highest prices
and includes for example lobsters and prawns, grade 1 includes squid, kingfish and
tuna, grade 2 includes parrotfishes, small-sized rabbitfishes and emperors, while grade
3 includes surgeonfishes and unicornfishes.

72
2.3.5 Results of diagnostic tests on models for influence of structure on conduct
Results of the test on assumption of linear relationship between the log odds of the
dependent variable and the continuous independent variables tested using visual plots
indicated that they were all linearly related. Results of Hosmer-Lemeshow test for
goodness of fit of binomial and multinomial logistic regression models showed that all the
models fitted well, with p-values > 0.05, except for the test of middlemen's selling price
determinant that failed the test as shown on tables (Table 2.6-Table 2.21).
Results of the Hausman-McFadden test of Independent Irrelevant Alternatives showed
that all the reduced models were not different from full models and hence the reduced
models were preferred based on p-values > 0.05 as shown on tables (Table 2.6, Table 2.9,
Table 2.10, Table 2.15 and Table 2.16)
For the GAM models, assumptions of homogeneity of variance, linearity and normality
in the distribution of residuals, showed that all models fitted well based on residual plots.
Profitability (dependent variable), which violated assumptions of normality and
transformed using box-cox transformation was corrected to normality, where p-values
obtained after transformation were (0.064, 0.278 and 0.549) for fishers, middlemen and
processors respectively.
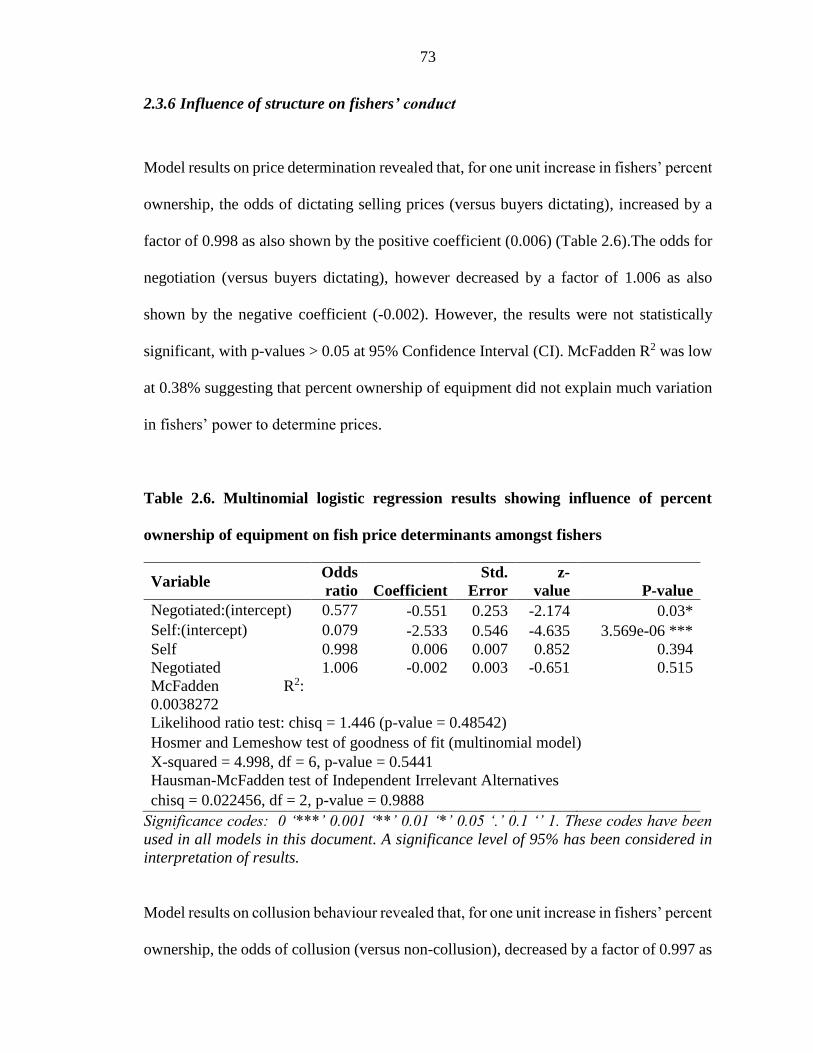
73
2.3.6 Influence of structure on fishers’ conduct
Model results on price determination revealed that, for one unit increase in fishers’ percent
ownership, the odds of dictating selling prices (versus buyers dictating), increased by a
factor of 0.998 as also shown by the positive coefficient (0.006) (Table 2.6).The odds for
negotiation (versus buyers dictating), however decreased by a factor of 1.006 as also
shown by the negative coefficient (-0.002). However, the results were not statistically
significant, with p-values > 0.05 at 95% Confidence Interval (CI). McFadden R2 was low
at 0.38% suggesting that percent ownership of equipment did not explain much variation
in fishers’ power to determine prices.
Table 2.6. Multinomial logistic regression results showing influence of percent
ownership of equipment on fish price determinants amongst fishers
Variable Odds
ratio Coefficient
Std.
Error
z-
value P-value
Negotiated:(intercept) 0.577 -0.551 0.253 -2.174 0.03*
Self:(intercept) 0.079 -2.533 0.546 -4.635 3.569e-06 ***
Self 0.998 0.006 0.007 0.852 0.394
Negotiated 1.006 -0.002 0.003 -0.651 0.515
McFadden R2:
0.0038272
Likelihood ratio test: chisq = 1.446 (p-value = 0.48542)
Hosmer and Lemeshow test of goodness of fit (multinomial model)
X-squared = 4.998, df = 6, p-value = 0.5441
Hausman-McFadden test of Independent Irrelevant Alternatives
chisq = 0.022456, df = 2, p-value = 0.9888
Significance codes: 0 ‘***’ 0.001 ‘**’ 0.01 ‘*’ 0.05 ‘.’ 0.1 ‘’ 1. These codes have been
used in all models in this document. A significance level of 95% has been considered in
interpretation of results.
Model results on collusion behaviour revealed that, for one unit increase in fishers’ percent
ownership, the odds of collusion (versus non-collusion), decreased by a factor of 0.997 as

74
also shown by the negative coefficient (-0.003) (Table 2.7). However, the results were not
statistically significant, with p-value > 0.05 at 95% CI.
Table 2.7. Logistic regression results showing influence of percent ownership of
equipment on selling collusion amongst fishers
Variable Odds
ratio Coefficient
Std.
Error
z
value P-value
(Intercept) 11.025
2.400 0.424 5.66
1.51e-08
***
Colludes when selling 0.997 -0.003 0.005 -0.554 0.579
Model significance: 0.243
Hosmer and Lemeshow test of goodness of fit (binary model)
X-squared = 1.2617, df = 3, p-value = 0.7382
Model results on market information revealed that, for one unit increase in fishers’ percent
ownership, the odds of accessing selling price information (versus non- access), decreased
by a factor of 0.999 as also shown by the negative coefficient (-0.001) (Table 2.8).
However, the results were not statistically significant, with p-values > 0.05.
The non-significant results of influence of percent ownership on price determination,
collusion and access to market information, suggests weak influence of structure on
conduct variables amongst fishers.

75
Table 2.8. Logistic regression results showing influence of percent ownership of
equipment on access to selling price information amongst fishers
Variable Odds
ratio Coefficient
Std.
Error z value P-value
(Intercept) 0.439 -0.822 0.258 -3.190 0.001 **
Accesses selling price information 0.999 -0.001 0.003 -0.280 0.779
Model significance: 0.777
Hosmer and Lemeshow test of goodness of fit (binary model)
X-squared = 4.272, df = 3, p-value = 0.234
2.3.7 Influence of structure on middlemen’s conduct
Model results on buying price determination revealed that, for one unit increase in
middlemen’s value of equipment, their odds of dictating or sellers dictating buying prices
(versus negotiation), decreased by a factor of one as also shown by the negative
coefficients (-0.000) in both cases (Table 2.9). However, the results were not statistically
significant, with p-values > 0.05 at 95% CI. McFadden R2 was low at 1.6 %, suggesting

76
that value of equipment did not explain much variation in middlemen’s power to
determine prices.
Table 2.9. Multinomial logistic regression results showing influence of value of
equipment on fish buying price determinants amongst middlemen
Variable Odds
ratio Coefficient Std. Error z-value P-value
Self:(intercept) 0.557 -0.586 0.300 -1.955 0.051. Seller:(intercept) 0.510 -0.674 0.347 -1.942 0.052. Self 1.000 -0.000 0.000 -0.452 0.651
Seller 1.000 -0.000 0.000 -1.124 0.261
McFadden R2: 0.016
Likelihood ratio test: chisq = 2.417 (p.value = 0.299)
Hosmer and Lemeshow test of goodness of fit (multinomial model)
X-squared = 17.602, df = 16, p-value = 0.348
Hausman-McFadden test of Independent Irrelevant Alternatives
chisq = 0.001, df = 2, p-value = 0.999
Model results on selling price determination revealed that, for one unit increase in
middlemen’s value of equipment, the odds of middlemen or buyers dictating selling prices
(versus negotiation) increased by a factor of one as also shown by the positive coefficients
(0.000) in both cases (Table 2.10). However, the results were not statistically significant,

77
with p-values > 0.05 at 95% CI. McFadden R2 was low at 6 %, suggesting that value of
equipment did not explain much variation in middlemen’s power to determine prices.
Table 2.10. Multinomial logistic regression results showing influence of value of
equipment on fish selling price determinants amongst middlemen
Variable Odds
ratio Coefficient Std. Error z-value P-value
Self:(intercept) 1.6335 0.491 0.524 0.937 1.6335
Buyer:(intercept) 6.7957 1.916 0.454 4.219 6.796***
Self 1.000 0.000 0.000 0.870 1.000
Buyer 1.000 0.000 0.000 0.222 1.000
McFadden R2: 0.059
Likelihood ratio test: chisq = 4.314 (p.value = 0.038)
Hosmer and Lemeshow test of goodness of fit (multinomial model)
X-squared = 183.26, df = 10, p-value < 2.2e-16
Hausman-McFadden test of Independent Irrelevant Alternatives
chisq = 0.022, df = 2, p-value = 0.989
Model results on collusion behaviour revealed that, for one unit increase in middlemen’s
value of equipment, the odds of collusion to set buying and selling prices (versus non-
collusion), increased by a factor of one as also shown by the positive coefficients (0.000)
in both cases (Table 2.11 and Table 2.12). However, the results were not statistically
significant, with p-values > 0.05 at 95% CI.

78
Table 2.11. Logistic regression results showing influence of value of equipment on
buying collusion amongst middlemen
Variable Odds ratio
Coefficient
Std.
Error
z
value P-value
(Intercept) 4.527
1.510 0.328 4.601
4.2e-06
***
Colludes when buying 1.000 0.000 0.000 0.157 0.876
Model significance: 0.006
Hosmer and Lemeshow test of goodness of fit (binary model)
X-squared = 9.4214, df = 8, p-value = 0.308
Table 2.12. Logistic regression results showing influence of value of equipment on
selling collusion amongst middlemen
Variable Odds
ratio Coefficient Std. Error z value P-value
(Intercept) 6.406 1.857 0.424 4.383 1.17e-05 ***
Colludes when selling 1.000 0.000 0.000 0.815 0.415
Model significance: 0.234
Hosmer and Lemeshow test of goodness of fit (binary model)
X-squared = 6.510, df = 8, p-value = 0.590
Model results on market information revealed that, for one unit increase in middlemen’s
value of equipment, the odds of access to buying and selling price information (versus
non-access), increased by a factor of one as also shown by the positive coefficients (0.000)
in both cases (Table 2.13 and Table 2.14). However, the results were not statistically
significant, with p-values > 0.05 at 95% CI.
Table 2.13. Logistic regression results showing influence of value of equipment on
access to buying price information amongst middlemen
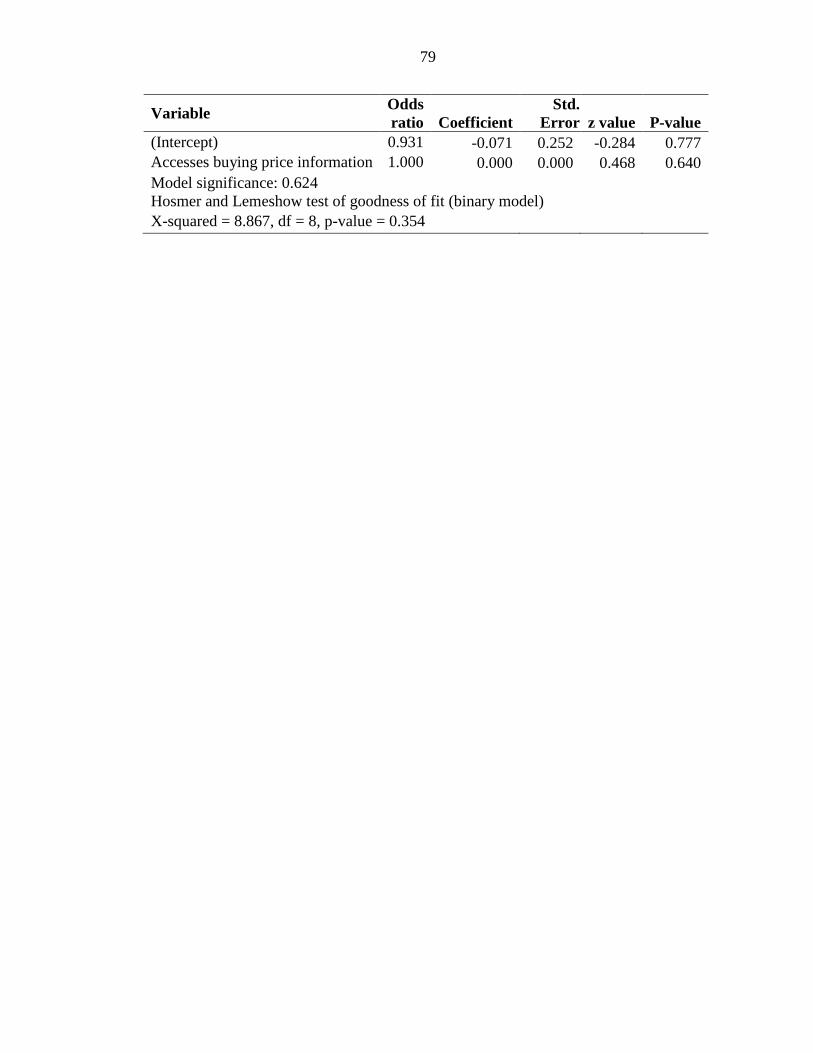
79
Variable Odds
ratio Coefficient
Std.
Error z value P-value
(Intercept) 0.931 -0.071 0.252 -0.284 0.777
Accesses buying price information 1.000 0.000 0.000 0.468 0.640
Model significance: 0.624
Hosmer and Lemeshow test of goodness of fit (binary model)
X-squared = 8.867, df = 8, p-value = 0.354

80
Table 2.14. Logistic regression results showing influence of value of equipment on
access to selling price information amongst middlemen
Variable Odds
ratio Coefficient
Std.
Error
z
value P-value
(Intercept) 0.397 -0.923 0.276 -3.348 0.000 ***
Accesses selling price
information 1.000
0.000 0.000 0.822 0.411
Model significance: 0.401
Hosmer and Lemeshow test of goodness of fit (binary model)
X-squared = 6.849, df = 8, p-value = 0.553
Model results on middlemen’s tendencies to target certain fish grades revealed that, for
one unit increase in value of equipment, the odds of targeting high and mixed fish grades
(versus low fish grade) increased by a factor of one as also shown by the positive
coefficients (0.000) in both cases (Table 2.15). However, the results were not statistically
significant, with p-values > 0.05 at 95% CI. McFadden R2 was low at 8 %, suggesting that
value of equipment did not explain much variation in middlemen’s targeting of fish
grades. It is possible that many middlemen lacked specialization in the fish grades they
targeted.

81
Table 2.15. Multinomial logistic regression results showing influence of value of
equipment on choice of fish grade amongst middlemen
Variable Odds
ratio Coefficient Std. Error z-value P-value
High:(intercept) 0.882 -0.126 0.532 -0.237 0.813
Mixed:(intercept) 2.283 0.826 0.488 1.692 0.091. High fish grade 1.000 0.000 0.000 1.412 0.158
Mixed fish grades 1.000 0.000 0.000 1.311 0.190
McFadden R^2: 0.0843
Likelihood ratio test: chisq = 11.539 (p.value = 0.003)
Hosmer and Lemeshow test of goodness of fit (multinomial model)
X-squared = 18.415, df = 16, p-value = 0.300
Hausman-McFadden test of Independent Irrelevant Alternatives
chisq = 1.560, df = 2, p-value = 0.459
The non-significant results of influence of value of equipment on price determination,
collusion, access to market information and targeting of fish grades, suggests weak
influence of structure on conduct variables amongst middlemen.
2.3.8 Influence of structure on processors’ conduct
Model results on buying price determination revealed that, for a one unit increase in
processors’ value of equipment, their odds of dictating buying prices (versus negotiation)
decreased by a factor of one as also shown by the negative coefficient (-0.000). However,
the odds increased by a factor of one for sellers dictating buying prices (versus
negotiation) as also shown by the positive coefficient (0.000) (Table 2.16). However, the
results were not statistically significant, with p-values > 0.05 at 95% CI. McFadden R2
was low at 0.2 %, suggesting that value of equipment did not explain much variation in
processors’ power to determine prices.

82
Table 2.16. Multinomial logistic regression results showing influence of value of
equipment on fish buying price determinants amongst processors
Variable Odds
ratio Coefficient
Std.
Error
z-
value P-value
Self:(intercept) 0.331 -1.103 0.983 -1.122 0.262
Seller:(intercept) 8.159 2.110 0.365 5.784 7.286e-09 ***
Self 1.000 -0.000 0.000 -0.241 0.810
Seller 1.000 0.000 0.000 0.189 0.850
McFadden R2:
0.0023127
Likelihood ratio test: chisq = 0.22566 (p.value = 0.8933)
Hosmer and Lemeshow test of goodness of fit (multinomial model)
X-squared = 20.934, df = 16, p-value = 0.1811
Hausman-McFadden test of Independent Irrelevant Alternatives
chisq = 1.5396, df = 2, p-value = 0.4631
Model results on collusion behaviour revealed that, for one unit increase in processors’
value of equipment, the odds of collusion to set buying prices (versus non-collusion),
increased by a factor of one as also shown by the positive coefficient (0.000) (Table 2.17).
However, the odds of collusion to set selling prices (versus non-collusion), decreased by
a factor of 1 as also shown by the negative coefficient (-0.000) (Table 2.18). However,
the results were not statistically significant in both cases, with p-values > 0.05 at 95% CI.

83
Table 2.17. Logistic regression results showing influence of value of equipment on
buying collusion amongst processors
Variable
Odds
ratio Coefficient Std. Error z value P-value
(Intercept) 6.284 1.838 0.706 2.603 0.009 **
Colludes when buying 1.000 0.000 0.000 0.783 0.434
Model significance: 0.256
Hosmer and Lemeshow test of goodness of fit (binary model)
X-squared = 2.8561, df = 8, p-value = 0.9431
Table 2.18. Logistic regression results showing influence of value of equipment on
selling collusion amongst processors
Variable
Odds
ratio Coefficient Std. Error z value P-value
(Intercept) 12.282 2.508 0.391 6.410 1.45e-10 ***
Colludes when selling 1.000 -0.000 0.000 -0.806 0.420
Model significance: 0.467
Hosmer and Lemeshow test of goodness of fit (binary model)
X-squared = 3.6813, df = 8, p-value = 0.8847
Model results on market information revealed that, for one unit increase in processors’
value of equipment, the odds of access to buying and selling price information (versus
non-access), increased by a factor of one as also shown by the positive coefficients (0.000)
in both cases (Table 2.19 and Table 2.20). However, the results were not statistically
significant, with p-values > 0.05 at 95% CI.

84
Table 2.19. Logistic regression results showing influence of value of equipment on
access to buying price information amongst processors
Variable Odds
ratio Coefficient
Std.
Error
z
value P-value
(Intercept) 0.371 -0.991 0.246 -4.033 5.51e-05 ***
Accesses buying price
information 1.000 0.000 0.000 0.009 0.993
Model significance: 1.000
Hosmer and Lemeshow test of goodness of fit (binary model)
X-squared = 13.103, df = 8, p-value = 0.1084
Table 2.20. Logistic regression results showing influence of value of equipment on
access to selling price information amongst processors
Variable Odds
ratio Coefficient
Std.
Error z value P-value
(Intercept) 0.094 -2.365 0.372 -6.353 2.11e-10 ***
Accesses selling price
information 1.000
0.000 0.000 0.632 0.528
Model significance: 0.562
Hosmer and Lemeshow test of goodness of fit (binary model)
X-squared = 4.871, df = 8, p-value = 0.771
Model results on processors’ tendencies to target certain fish grades revealed that, for one
unit increase in their value of equipment, the odds of targeting low fish grades (versus
high fish grade) decreased by a factor of one as also shown by the negative coefficient (-
0.000) (Table 2.21). However, the odds of targeting mixed fish grades (versus high fish
grade) increased by a factor of 1 as also shown by the positive coefficient (0.000). In both
cases the results were not statistically significant, with p-values > 0.05 at 95% CI.
McFadden R2 was low at 19 %, suggesting that value of equipment did not explain much
variation in processors targeting of fish grades.
The non-significant results of influence of value of equipment on price determination,

85
collusion, access to market information and targeting of fish grades, suggests weak
influence of structure on conduct variables amongst processors.
Table 2.21. Multinomial logistic regression results showing influence of value of
equipment on choice of fish grade amongst processors
Variable
Odds
ratio Coefficient Std. Error z-value P-value
Low:(intercept) 0.003 4.469 1.404 3.182 0.001**
Mixed:(intercept) 0.026 0.614 1.491 0.412 0.680
Low fish grade 1.001 -0.001 0.001 -1.137 0.255
Mixed fish grade 1.001 0.001 0.001 0.888 0.374
McFadden R2: 0.19157
Likelihood ratio test: chisq = 24.837 (p.value = 4.0422e-06)
Hosmer and Lemeshow test of goodness of fit (multinomial model)
X-squared = 21.047, df = 16, p-value = 0.177
Hausman-McFadden test of Independent Irrelevant Alternatives
chisq = 5.761, df = 2, p-value = 0.056
2.3.9 Actors’ performance in context of fish quantities, purchases and sales
Fishers’ catch was varied by gear. Cast net fishers caught the lowest catch of 6 ± 1 kg
fisher-1 day-1 and high-capitalized handline the highest catch of 23 ± 3.1 kg fisher-1 day-1
(Figure 2.4a). Although reef seine boats caught the highest fish amounts (134 ± 25 kg
boat-1 day-1), individual share of catch was low (7 ± 1.4 kg fisher-1 day-1) due to the large
number of fishers, on average 18 fishers boat-1 (Table 2.3). Fish amounts purchased by
middlemen and processors also varied. Processors purchased the lowest amount (7 ± 0.6
kg day-1), while company agents purchased the highest amount (232 ± 134.2 kg day-1)
(Figure 2.4a).

86
Figure 2.4. (a.) Mean fish amounts that fishers, middlemen and processors deal in
(b.) purchases and sales amount per day in local currency (KES). Error bars
represent mean standard errors. All variables are expressed as per day units.
Note: Actors are arranged in decreasing order of capitalization as is throughout this
study; HCH to CN refers to fishers and CA to SSFP refers to middlemen and processors.
Abbreviations; HCH = High-capitalized handline, DG = Drifting gillnet, RSN = Reef-
seine net, SN = Set net, BT = Basket trap, LCH = Low-capitalized handline, CN = Cast
net, CA = Company agent, LSSM = Large-scale secondary middlemen, LSPM = Large-
scale primary middlemen, SSPM = Small-scale primary middlemen, SSSM = Small-scale
secondary middlemen and SSFP = Small-scale fish processor

87
Fishers’ sales varied by gear, with reef seine fishers attaining lowest sales revenue (KES
786 ± 136 fisher-1 day-1) and high-capitalized handline the highest (KES 3,327 ± 381
fisher-1 day-1) (Figure 2.4b). Middlemen and processors’ sales also varied, with small-
scale processors attaining lowest sales revenue (KES 2,005 ± 144 person-1 day-1) and
company agents the highest (KES 54,528 ± 11,416 person-1 day-1) (Figure 2.4b). Notably,
although small-scale secondary middlemen purchased lower fish amounts, their purchases
and sales value was higher than for small-scale primary middlemen, due to higher
secondary prices.
2.3.10 Actors’ performance in context of costs
Costs were considerably varied between and within actor groups, except amongst fishers.
There was also variation between fixed and variable costs. Amongst fishers, high-
capitalized handline fishers had highest variable costs (KES 1,158 ± 118 person-1day-1)
and cast net fishers lowest (KES 18 ± 18 person-1day-1) (Figure 2.5a). For fixed costs,
drifting gillnet fishers incurred the highest cost (KES 128 ± 37 person-1day-1), while cast
net fishers incurred the lowest cost (KES 16 ± 6 person-1day-1). Variable costs were
subtracted first, before sharing proceeds with boats owned by middlemen, based on share
arrangements.
The cost structure amongst middlemen and processors showed mixed patterns between
variable costs and fixed costs (Figure 2.5a). Generally, high-capitalized middlemen
incurred higher fixed costs than other actors, which is associated with maintenance of their
boats and equipment. For fixed costs, company agents incurred the highest cost (KES

88
2,527 ± 1,026 person-1day-1), while processors incurred the lowest (KES 7 ± 3 person-
1day-1). For variable costs, large-scale primary middlemen incurred the highest cost (KES
2,762 ± 1,320 person-1day-1), while processors incurred the lowest (KES 347 ± 22 person-
1 day-1).
2.3.11 Actors’ performance in context of financial profit
In terms of financial profitability amongst fishers, high-capitalized handline fishers earned
the highest amount (KES 1,436 ± 248 person-1 day-1), while reef seine net fishers earned
the lowest amount (KES 452 ± 114 person-1 day-1) (Figure 2.5b). However, Kruskal Wallis
test results showed no significant differences in profitability between gears (H=8.605, df=
6, p=0.233), possibly due to variations within gears.
Amongst middlemen and processors, company agents earned the highest profits (KES
7,839 ± 2,065 person-1 day-1), while processors earned the lowest profits (KES 599 ± 108
person-1 day-1) (Figure 2.5b). Kruskal Wallis test results showed significant differences in
profitability between middlemen (H=12.286, df = 4, p=0.02). However, Dunn’s post-hoc
test for profitability between different groups of middlemen revealed that none of the
comparisons was significant, possibly due to large individual variations within groups.

89
Figure 2.5. (a.) Mean variable and fixed costs amongst fishers and buyers, (b.)
financial profit per person. All variables are expressed as per day units.
Note: HCH = High-capitalized handline, DG = Drifting gillnet, RSN = Reef-seine net,
SN = Set net, BT = Basket trap, LCH = Low-capitalized handline, CN = Cast net, CA =
Company agent, LSSM = Large-scale secondary middlemen, LSPM = Large-scale
primary middlemen, SSPM = Small-scale primary middlemen, SSSM = Small-scale
secondary middlemen and SSFP = Small-scale fish processor
2.3.12 Comparison of time spent, workforce, opportunity cost of labour and profitability
Offshore fishing units (high capitalized handline, drifting gillnet and reef seine net) spent
on average of 7-13 hours fishing, compared to 5-10 hours fishing for inshore units (set
net, basket trap, low capitalized handline and cast net). The high number of hours spent

90
by high-capitalized handline fishers arise due to distances travelled during long fishing
trips lasting 1-3 days (Table 2.22). Large-scale middlemen also spent more time in the
business (10 hours) compared to small-scale middlemen who spent nine hours. Processors
spent most time (12 hours), compared other actor groups.
Offshore fishing units had the highest number of crew (4-18 fishers boat-1) compared to
(2-4 fishers boat-1) for inshore fishing units. Small-scale and large-scale middlemen
employed on average 2-3 workers, mostly on casual basis. Processors had a workforce of
up to three workers.
On average, opportunity cost of labour calculated from number of hours spent showed
that offshore fishing units ranged between KES 398 and KES 708, while inshore units
ranged between KES 246 and KES 525 (Table 2.22). Opportunity cost for large-scale
middlemen was lower at between KES 160 and 381 compared to small-scale middlemen
at between KES 363 and 423 and KES 371 for processors.
Although all actor groups performed financially better than their rate of opportunity cost,
some groups such as fish processors, reef seine and drifting gillnet fishers performed
poorly. Their income was close to opportunity cost as observed in the difference between
the two. This suggests that except for these few, majority earned higher returns than casual
employees in other sectors such as agriculture, manufacturing and commerce based on
government minimum wage for unskilled workers in 2015 that ranged between KES 228
to 527 (Government of Kenya, 2015).

91
Table 2.22. Averages for variables on workforce, time spent, opportunity cost of
labour and financial profit per type of enterprise or fishing unit
Actor type
Average
Workin
g hours
Average
Workforc
e
Opportunit
y cost of
wages
(OCL)
/person
Financial
profit
(FP)
/Person
Difference
(FP-OCL)
High capitalized handline 13 4 708 1,436 728
Drifting gillnet 9 4 511 617 107
Reef seine net 7 18 398 452 54
Set net 7 4 370 987 617
Basket trap 6 2 340 946 606
Low capitalized handline 10 3 525 1,159 634
Cast net 5 4 246 850 604
Company agent 12 3 358 7,839 7,481
Large-scale secondary
middlemen 9 3 160 3,675 3,515
Large-scale primary
middlemen 11 2 381 5,110 4,729
Small-scale primary
middlemen 8 2 363 2,362 1,999
Small-scale secondary
middlemen 10 2 423 1,754 1,330
Fish processors 12 3 371 639 268
2.3.13 Factors influencing fishers’ financial performance
The GAM model testing influence of structure and conduct on fishers’ performance,
revealed no significant effect. Similar results were obtained in middlemen and processors’
models. Therefore, apart from the S-C-P variables, additional variables were included in
the full model to investigate their effect on performance of all actor groups. These
included demographic variables (age, education), operational (cost, sales) and site
(Malindi, Mayungu, Shimoni and Vanga).
In the full model, parametric results showed that fishers’ profitability increased

92
significantly, as percent ownership of equipment increased (Table 2.23). Fishers at
Mayungu, Shimoni and Vanga attained significantly higher profitability than fishers in
Malindi. Fishers using other gears attained significantly higher profits compared to those
using reef seine net. Fishers, who also had accessed credit before, attained significantly
higher profits than those who hadn’t. All non-parametric results showed significant effect
on fishers’ profitability (Table 2.23).
Profitability increased as sales increased, with a sharp rise upto sales of KES 20,000, then
a slight deep, before rising again (Figure 2.6.a). On the converse, profitability decreased
gently as fixed and variable costs rose (Figure 2.6.b and c). All conduct variables in the
full model showed no significant influence on profitability. Variables in the full model
explained 76% of the deviance and 71% of the variation.
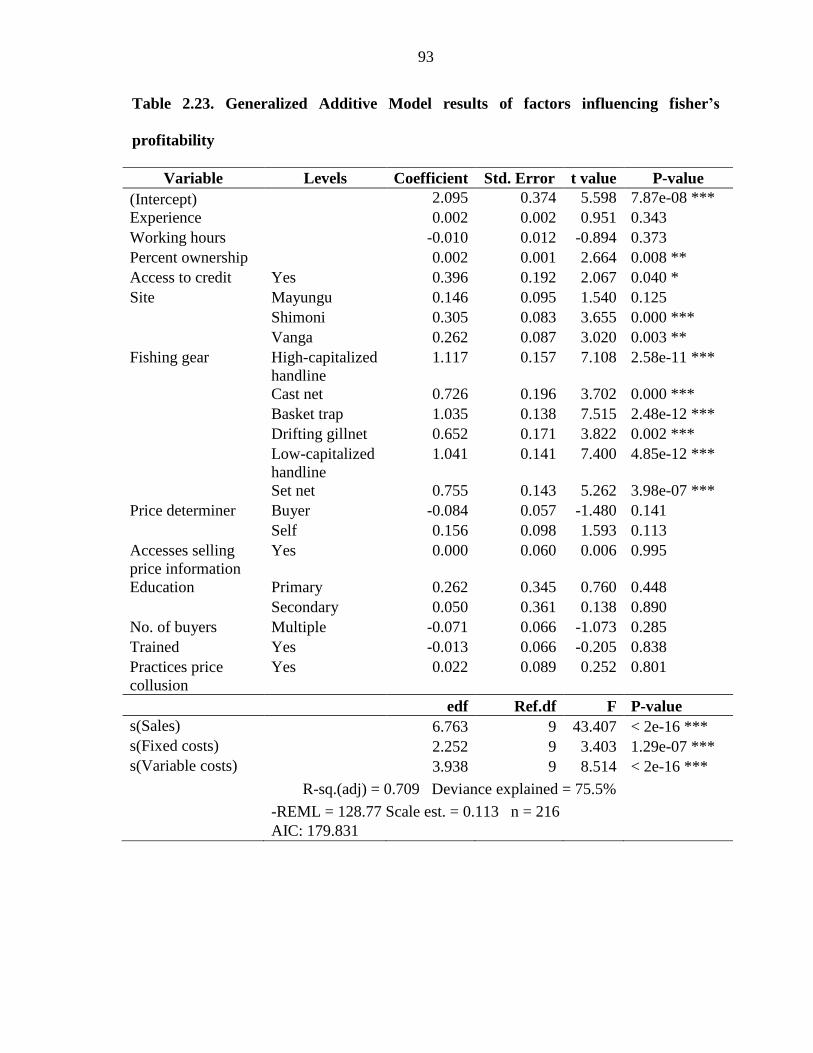
93
Table 2.23. Generalized Additive Model results of factors influencing fisher’s
profitability
Variable Levels Coefficient Std. Error t value P-value
(Intercept) 2.095 0.374 5.598 7.87e-08 ***
Experience 0.002 0.002 0.951 0.343
Working hours -0.010 0.012 -0.894 0.373
Percent ownership 0.002 0.001 2.664 0.008 **
Access to credit Yes 0.396 0.192 2.067 0.040 *
Site Mayungu 0.146 0.095 1.540 0.125
Shimoni 0.305 0.083 3.655 0.000 ***
Vanga 0.262 0.087 3.020 0.003 **
Fishing gear High-capitalized
handline
1.117 0.157 7.108 2.58e-11 ***
Cast net 0.726 0.196 3.702 0.000 ***
Basket trap 1.035 0.138 7.515 2.48e-12 ***
Drifting gillnet 0.652 0.171 3.822 0.002 ***
Low-capitalized
handline
1.041 0.141 7.400 4.85e-12 ***
Set net 0.755 0.143 5.262 3.98e-07 ***
Price determiner Buyer -0.084 0.057 -1.480 0.141
Self 0.156 0.098 1.593 0.113
Accesses selling
price information
Yes 0.000 0.060 0.006 0.995
Education Primary 0.262 0.345 0.760 0.448
Secondary 0.050 0.361 0.138 0.890
No. of buyers Multiple -0.071 0.066 -1.073 0.285
Trained Yes -0.013 0.066 -0.205 0.838
Practices price
collusion
Yes 0.022 0.089 0.252 0.801
edf Ref.df F P-value
s(Sales) 6.763 9 43.407 < 2e-16 ***
s(Fixed costs) 2.252 9 3.403 1.29e-07 ***
s(Variable costs) 3.938 9 8.514 < 2e-16 ***
R-sq.(adj) = 0.709 Deviance explained = 75.5%
-REML = 128.77 Scale est. = 0.113 n = 216
AIC: 179.831

94
Figure 2.6. Estimated smooth terms of three variables on fishers’ profitability. Y-axes
are the dependent variable’s partial effects and the grey shadow bands show standard-
error confidence intervals.
2.3.14 Factor influencing middlemen’s financial performance
Parametric results of the GAM model testing influence of structure, conduct, demographic,
operational and site variables on profitability showed that none of the variables significantly
influenced middlemen’s profitability (Table 2.24).

95
Table 2.24. Generalized Additive Model results of factors influencing middlemen’s financial profitability
Variable Levels Coefficient Std. Error t value P-value
(Intercept) 6.790 1.548 4.386 0.000 ***
Equipment value 0.000 0.000 0.745 0.462
Fixed costs 0.000 0.000 0.713 0.481
Variable costs 0.000 0.000 -1.031 0.310
Experience -0.001 0.012 -0.047 0.963
Working hours 0.027 0.040 0.692 0.494
Fish grade Mixed 0.460 0.393 1.173 0.249
High -0.071 0.491 -0.146 0.885
Owns critical equipment Yes 0.116 0.255 0.457 0.651
Buying price determinant Self 0.243 0.293 0.830 0.413
Seller -0.023 0.286 -0.080 0.937
Selling price determinant Buyer 0.213 0.427 0.499 0.621
Self -0.151 0.268 -0.566 0.575
Practices buying price collusion Yes -0.203 0.344 -0.590 0.559
Practices selling price collusion Yes 0.588 0.482 1.219 0.231
Site Mayungu -0.381 0.315 -1.211 0.234
Mombasa -0.504 0.469 -1.075 0.290
Shimoni -0.605 0.436 -1.388 0.174
Vanga -0.396 0.338 -1.172 0.249
Accesses selling price
information Yes -0.094 0.320 -0.295 0.770
Accesses buying price
information Yes -0.164 0.249 -0.656 0.516
Education Primary 0.828 1.208 0.686 0.498
Secondary 0.761 1.161 0.655 0.517
No. of buyers Multiple -0.318 0.488 -0.651 0.519
Trained Yes -0.239 0.337 -0.709 0.483
94
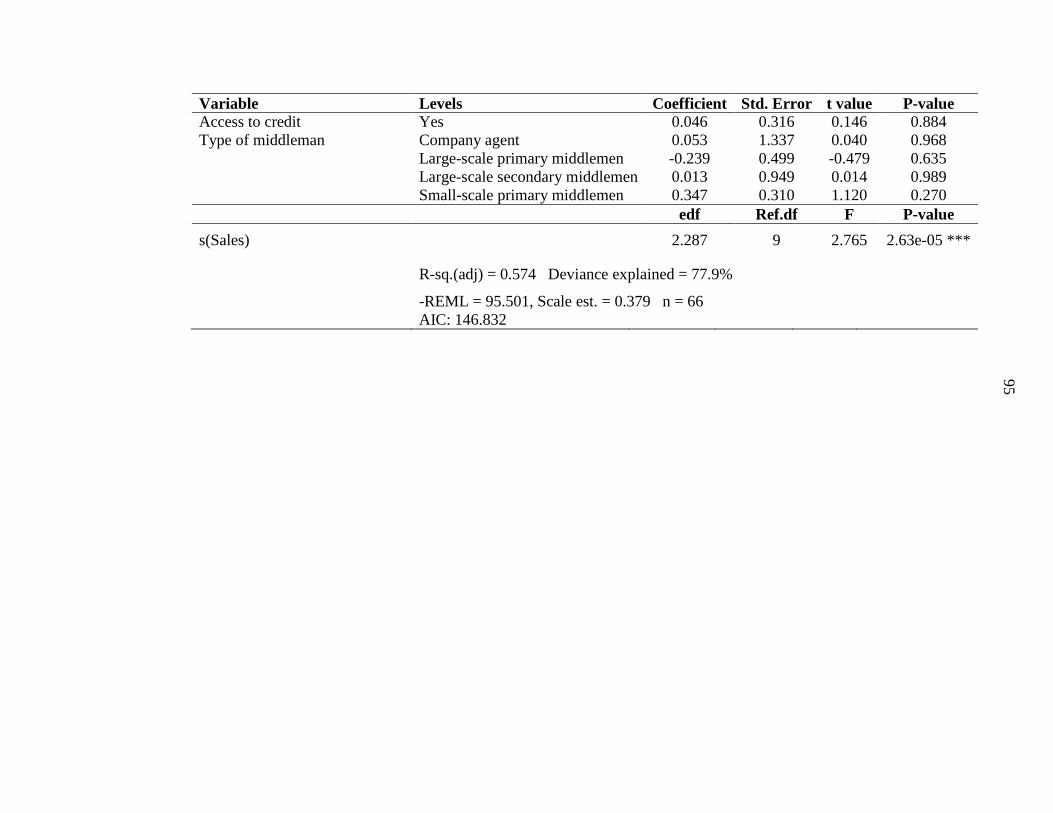
96
Variable Levels Coefficient Std. Error t value P-value
Access to credit Yes 0.046 0.316 0.146 0.884
Type of middleman Company agent 0.053 1.337 0.040 0.968
Large-scale primary middlemen -0.239 0.499 -0.479 0.635
Large-scale secondary middlemen 0.013 0.949 0.014 0.989
Small-scale primary middlemen 0.347 0.310 1.120 0.270
edf Ref.df F P-value
s(Sales) 2.287 9 2.765 2.63e-05 ***
R-sq.(adj) = 0.574 Deviance explained = 77.9%
-REML = 95.501, Scale est. = 0.379 n = 66
AIC: 146.832
95

97
For non-parametric results, sales showed significant effect on profitability, with a steady
rise upto about KES 40,000, before levelling-off (Figure 2.7). Structure and conduct
variables in the full model showed no significant influence on profitability. Variables in
the full model explained 78% of the deviance and 57% of the variation.
Figure 2.7. Estimated smooth terms of sales on middlemen’s profitability. Y-axis is
the dependent variable’s partial effects and the grey shadow bands show standard-
error confidence intervals
2.3.15 Factors influencing processors’ financial performance
Parametric results of the GAM model testing influence of structure, conduct,
demographic, operational and site model variables on profitability showed that only
working hours, fish grade and site significantly influenced processors’ profitability (Table
2.25).
Except for fish grades, all other conduct variables showed no significant influence on

98
profitability. Processors targeting low-grade fish attained significantly higher profitability
compared to those targeting high and mixed grades. Processors at Shimoni attained
significantly higher profitability compared to other sites.
Non-parametric results showed that all variables had significant effect on profitability
(Table 2.25). Profitability steadily rose with increase in sales upto around KES 4,000,
before levelling-off (Figure 2.8.a). As variable costs increased, they resulted in steady
profit declines, before levelling-off at around KES 600 (Figure 2.8.b). As experience
increased, it resulted to profit declines, but only slightly (Figure 2.8.c). Variables in the
full model explained 83% of the deviance and 77% of the variation.

99
Table 2.25. Generalized Additive Model results of factors influencing processors’
financial profitability
Variable Levels Estimate Std.
Error t value P-value
(Intercept) 6.724 0.474 14.172 <2e-16 ***
Fixed costs 0.004 0.005 0.745 0.459
Working hours -0.043 0.021 -2.099 0.039 *
Grade High -0.314 0.387 -0.811 0.420
Low 0.245 0.114 2.153 0.0347 *
Site Mayungu -0.103 0.118 -0.872 0.386
Shimoni -0.428 0.180 -2.376 0.020 *
Vanga -0.240 0.139 -1.727 0.089. Trained Yes 0.325 0.211 1.539 0.128
Buying price
determinant Self -0.115 0.320 -0.358 0.722
Seller -0.123 0.170 -0.724 0.471
Practices selling
price collusion
Yes 0.236 0.175 1.348 0.182
Practices selling
price collusion
Yes -0.082 0.175 -0.465 0.643
Accesses selling
price information
Yes -0.132 0.202 -0.653 0.516
Accesses buying
price information
Yes -0.052 0.094 -0.556 0.580
Education Primary -0.255 0.374 -0.683 0.497
Secondary -0.174 0.515 -0.338 0.737
Has access to credit Yes 0.002 0.106 0.016 0.987
Equipment value 0.000 0.000 -0.619 0.538
edf Ref.df F P-value
s(Sales) 3.903 9 18.377 < 2e-16 ***
s(Variable costs) 2.691 9 3.266 1.31e-06 ***
s(Experience) 1.726 9 1.006 0.005 **
R-sq.(adj) = 0.769 Deviance explained = 83.2%
-REML = 3.824 Scale est. = 0.127 n = 98
AIC: 103.868

100
Figure 2.8. Estimated smooth terms of four variables on processors’ profitability. Y-
axes are the dependent variable’s partial effects and the grey shadow bands show
standard-error confidence intervals.
Discussion
Results from the analysis of structure of the value chain in the present study, showed that
capital asymmetries were evident. This is typical of most producer-based value chains that
have asymmetrical, pyramidal structures, with most low-capitalized actors at the bottom
and few high-capitalized ones at the apex (Kaplinsky et al., 2001). Such capital-based
differentiation in fisheries is known to influence actors’ functions, where capital-endowed
actors control and coordinate facilitation of fishing operations, collection, distribution and

101
marketing (Platteau, 1984; Fabinyi et al., 2016; Miñarro et al., 2016).
The role of high-capitalized middlemen is further evidenced by support provided to fishers
in terms of equipment. Such concentration of capital amongst few high capitalized actors
suggests market dominance by the few and significant entry barriers for many low-
capitalized ones (Bailey et al., 2015). This may also breed monopolistic or oligopolistic
tendencies rendering the value chain uncompetitive and raising possibilities of price
collusion (Bain, 1959; Rhoades, 1993; US Department of Justice, 2017). However, in the
present study, despite high-capitalized middlemen controlling most of the fishery, the
chain was competitive with relatively low HHI indices. While HHI was based on percent
volume of fish bought by actors, it does not capture other dynamics for example cultural
ties that may affect the total amount of fish purchased and hence shift the power dynamics.
In terms of output, higher capital-endowed actors such as offshore fishers and large-scale
middlemen dealt with higher fish quantities and sales. This is typical of capital-skewed
value chains, often characterized by higher outputs realized by high-capitalized actors
compared to low-capitalized ones (Long et al., 2008; Adeogun et al., 2009). However,
higher catches and sales realized by offshore fishers—dependent on middlemen’s
facilitation, did not translate to higher individual profitability. Their profitability was also
not significantly different from that of inshore fishers. These findings are also reinforced
by model results showing that capital was not an influencing factor of profitability. This
can be attributed to profit sharing amongst large crews and unfavourable catch share
arrangements with middlemen, as is common with middlemen-controlled fisheries
(Platteau, 1984; Fabinyi et al., 2016). This is also due to high operational costs and low

102
fish prices as reported by fishers. For middlemen, all categories attained higher financial
profitability compared to fishers and processors.
Influence of structure on actors’ conduct such as choice of products dealt with, price
collusion, access to market information and power to determine prices had no significant
effect. For example, middlemen’s and processors’ tendency to target high and mixed fish
grades compared to low-grade fish, increased as their capital outlay increased, but this
influence was not statistically significant. Literature shows that buyers’ choice of fish and
fish products is not only determined by attribute factors such as type of fish, grade and
gear used, but also purchasing power and capital outlay (Guillen & Maynou, 2014; Lee,
2014; Asche et al., 2015; Sjöberg, 2015). However, results of the present study contrast
these findings, due to differences within actor groups.
Although evidence from the present study does not strongly link level of capital outlay to
choice of fish grade, there were tendencies for some groups to target specific fish grades.
For instance, processors showed tendency to target low-grade fish compared to high-grade
fish. For example at Mayungu landing site—frequented by migrant fishers in NEM season
(Fulanda et al., 2009), many processors congregated to access cheap, low-grade fish. This
tendency by processors is consistent with other findings in East Africa (Fröcklin et al.,
2013; Thyresson et al., 2013; Matsue et al., 2014).
Choice of products dealt with, had a significant influence in influencing profitability for
some actor groups but not others. Processors who targeted low-grade fish and added value
realized higher profitability. This demonstrates that promoting value addition

103
interventions for low-valued fish, could further boost processors’ incomes. This is
especially important given that majority of processors were women and 41% were
household heads. Targeting of low-grade fish has also other important fisheries policy
implications. First, processors are a market for low-value fish and are a link to poor
consumers. Secondly, measures that could eliminate cheap fish supply would thus
negatively impact on small-scale processors and threaten livelihoods, for example banning
of foreign migrant fishers.
In contrast, targeting of high-grade fish by middlemen did not significantly influence their
profitability. Therefore, evidence from the present study did not link profitability to
premium grades which often attracts premium prices and leads to higher investments in
fishing (Ferse et al., 2014; Bailey et al., 2015). Thus middlemen’s facilitation of migrant
fishers targeting high-valued fish in NEM season (Wanyonyi, et al., 2016a; Wanyonyi, et
al., 2016b), may not necessarily lead to higher profitability.
Fishers’ power to determine selling prices increased as percent ownership of fishing
equipment increased. Similarly, middlemen and small-scale fish processors’ power to
determine buying and selling prices increased as value of equipment increased. However,
these results were not statistically significant in all cases. Studies have shown that, often
powerful high-capitalized actors determine prices and render weaker actors such as fishers
as price-takers (Ferse et al., 2014; Grydehøj et al., 2016). Small-scale processors in Kenya
(Matsue et al., 2014) and Zanzibar (Fröcklin et al., 2013) have also been known to be price
takers from both fishers and middlemen. However, results of the present study did not
strongly show the role of capital in price determination.

104
Performance model results also indicated that actors’ power to determine buying and
selling prices did not improve profitability. Thus, evidence from the present study does
not strongly link actors’ power to determine fish prices to profitability. Although literature
on price setting mechanisms amongst fishers and small-scale-processors’ exists (Fröcklin
et al., 2013; Ferse et al., 2014; Matsue et al., 2014; Grydehøj et al., 2016), it is scanty
about middlemen, and does not show how power influences their profitability.
Price collusion tendencies amongst fishers decreased as their percent ownership increased.
The opposite was true for middlemen and processors, whose tendency to collude increased
as capitalization increased. However, these tendencies were not statistically significant,
suggesting that capital was not a significant determinant of collusion. The HHI scores
were also below thresholds considered uncompetitive (Rhoades, 1993), and thus collusion
was unimportant. This is further emphasized by model results showing that collusion did
not significantly influence profitability for all actors. Price collusion in monopolistic and
oligopolistic markets is widely addressed in other industries (Bain, 1959; Rhoades, 1993;
US Department of Justice, 2017), but it is scantily addressed in SSFs (Pomeroy et al.,
1995).
In relation to role of market information in the value chain, fishers’ access to market
information decreased as percent ownership of equipment increased. For middlemen and
processors, the opposite was true. Their access to buying and selling price information
increased as value of equipment owned increased. However, in all cases the results were
not statistically significant, suggesting weak influence of capital on access to information.
It has also been suggested that collusion is worsened by lack of transparency in market

105
price information and can be linked to power distribution in the value chain (Fews Net,
2008). In comparing results on collusion and access to information, there was no strong
evidence to suggest that higher capitalized actors had higher access to market information.
Access to information was therefore unlikely to fuel collusion due to intense competition.
Access to information had no significant effect on profitability for all actor groups. Thus,
although availability of market information has been argued as beneficial to actors by
enabling them to negotiate prices and improve profitability (Jensen, 2007; Courtois et al.,
2014; Ranjan, 2017), this was not supported in the present study. However, there has also
been findings suggesting that availability of information may not necessarily translate to
higher prices and income, since it may depend on other factors and how actors use the
information (Mitchell, 2017). Thus availing more information to actors may not
necessarily lead to higher profitability but may help in better market access (Fews Net,
2008).
As shown by the present study, structure and conduct variables did not significantly
influence profitability, except for fishers’ percent ownership of equipment and low-grade
fish targeted by processors. Instead, other additional non-S-C-P variables influenced
profitability. Increased sales had a positive influence on profitability amongst all actor
groups as would be expected. Costs had a significant influence on some actors but not
others. For example, variable costs negatively influenced fishers’ and processors’
profitability, but not middlemen. However, fixed costs were only important to fishers’
outcomes, where they decreased profitability.

106
Offshore fishers incurred comparatively higher variable costs, often associated with
increased running costs by large vessels and whose costs rise with increasing vessel size
(Pascoe et al., 1996b; Daurès et al., 2013). Fishers facilitated by middlemen, widely
complained that their income was lowered by disproportional shouldering of variable
costs compared to middlemen. Such concerns, have been highlighted elsewhere in many
client-patron relationships (Kulindwa et al., 2013; Digal et al., 2017b). They are deemed
exploitative and impede attainment of equitable fishers’ incomes (Guillen et al., 2015).
They also put pressure on fishers, to continually catch more fish to pay back, and thus
deepening reliance on middlemen in a vicious circle (Miñarro et al., 2016; Prescott et al.,
2017). It is also detrimental to fisheries resources, and fishers’ livelihood, as they fish
more to account for low earnings (Mangi et al., 2007).
The number of working hours were only important on processors outcomes where they
negatively influenced their profitability. Working hours in the context of the present study
could be interpreted as a proxy for long distances travelled, which resulted to high cost of
transport and decreased profitability. This contrasts with other studies indicating that more
time spent working, resulted in higher income (Maynou et al., 2013). Increasing
experience amongst processors was associated with decreased profitability and this could
be interpreted as a proxy for aging. In turn this could be associated with low education
levels and lack of business management skills, and hence unable to run profitable
businesses.
In examining adequacy of fisheries studied to sustain livelihoods, actors in the present
study fared well. Results suggest that financial profits were higher than opportunity cost

107
of wages in unskilled employment, for the same number of hours spent. These findings
are consistent with similar studies (Long et al., 2008; Duy et al., 2012; Maynou et al.,
2013) that showed SSFs actors attained higher financial profit than opportunity cost of
labour. This reinforces role of SSFs in supporting livelihoods comparable to, or better than
surrounding alternatives for unskilled labourers such as domestic, commercial,
agricultural and manufacturing sectors earning between KES 228 and 452 per day
(Government of Kenya, 2015).
Importance of Kenya’s marine SSFs in supporting livelihoods is further emphasized by
majority of actors that ranked fishery activities as their foremost livelihood. The fishery
also recorded a high number of new entrants, suggesting that it had good returns, which
was a pulling factor. However, this conclusion should be treated with caution since fishing
is often a livelihood of last resort amidst limited alternatives (Béné, 2003). Actors in
fishing also often lack skills to transit to other livelihoods in most SSFs, partly explaining
why they persist, even when returns are low (Boncoeur et al., 2000; Cinner et al., 2009;
Prescott et al., 2017). Furthermore, findings from a study in Kenya’s coast concluded that
many fishers were unwilling to exit the fishery, even on hypothetical declines due to lack
of alternatives (Cinner et al., 2009). In the present study, most actors had low education,
with 98% lacking formal skilled training and thus low prospects for career transitioning
(Cinner et al., 2009).
Although profitability among majority of actors was positive, low incomes near or equal
to opportunity cost of labour, for example amongst processors, may not be enough to get
actors out of poverty (Brinson et al., 2009; Teh et al., 2011b). This is a concern,

108
particularly that 97% of processors were female and sole breadwinners in 41% of the
households. Findings of the present study indicate negative and positive economic
outcomes, and thus regular assessment of the fisheries should be done to detect any signs
of declines and identify most affected actors (Brinson et al., 2009).
Conclusion
Findings of the study showed that some actor groups performed better than others.
Offshore fishing units and large-scale middlemen dealt with higher fish and quantities
sales. However, for offshore fishers, the higher sales did not translate to higher
profitability since they divided proceeds amongst many crew and middlemen. Hence per
capita share of income was low. Generally, middlemen of all categories attained higher
financial profitability compared to fishers and processors.
Structure in based on actor capitalization had no significant influence on conduct amongst
all actors. It also did not significantly influence actors’ performance, except amongst
fishers where higher percent ownership of equipment influenced their profitability
positively.
Similarly, conduct had no significant influence on performance, except amongst fish
processors, where targeting of low-grade fish significantly influenced their profitability
positively. Market information and actors’ power to determine prices, which are
commonly proposed interventions to uplift economic outcomes of SSFs, did not
significantly influence profitability. It emerged that other non-S-C-P factors, specifically
sales and costs, were more important in influencing profitability. Thus, Kenya’s marine

109
small-scale fisheries largely do not conform to the S-C-P paradigm.
The HHI was originally used in analysis of market concentration in formal business
entities, to check market competitiveness. However, there are limitations to its usage in
small-scale fisheries that are largely informal. Further research to understand effect and
extent of informal nature of small-scale fisheries on competitiveness is needed. Access to
market information was studied in context of its influence on profitability, but not its
influence on setting prices. Given the importance placed on availing market information
to actors to expand their market reach, this gap is worthy further exploration.

110
CHAPTER 3: ANALYSIS OF CONSTRAINTS AND
OPPORTUNITIES IN SMALL-SCALE FISHERIES VALUE CHAIN
Introduction
This chapter presents findings of empirical analysis on critical constraints facing SSFs
actors in Kenya, and identification of their proposed solutions. It also presents findings on
documentation of support services provided to SSF actors in support of the value chain.
The objectives of the study were thus to i) identify and rank constraints and opportunities
based on actors’ perspective; ii) to analyze support services provided to actors in the value
chain. The study used a value chain approach where all key stages and activities performed
by actors are considered (Kaplinsky et al., 2001). Therefore, the three key SSFs value
chain nodes; fishers, middlemen and processors were studied.
The study employed focus group discussions as the primary data collection method, where
the Analytical Hierarchical Process (AHP) tool was used. AHP is a Multi-Criterion
Decision Analysis (MCDA) tool used to rank subjects of interests such as severity of
constraints and prioritization of opportunities (Saaty, 1977). Such tools suitably employ
different criteria and associated sub-criteria to elicit actors’ viewpoints (Andalecio, 2010).
They also balance conflicting viewpoints by ranking participant choices in a transparent
and structured way, and thereby improving acceptance of decisions arrived at (Leung et
al., 1998; Andalecio, 2010). The study was undertaken at Malindi, Mayungu, Shimoni and
Vanga fish landing sites.

111
Materials and methods
3.2.1 The Analytical Hierarchical Process (AHP)
The AHP method used in the present study utilizes pairwise comparison matrices to
compare two choices at a time. This reduces chances of overwhelming participants in
decision-making. The method developed by Saaty (1977) is widely used and described by
many researchers (Soma, 2003; Jennings et al., 2009; Baio, 2010; Tuda et al., 2014). It
was chosen in the present study due to its usability characteristics such as; 1) transparency,
2) simplicity in use and, 3) understandable to persons of low literacy. In the actual
mechanism of comparisons, the subjective assessment of attributes being compared,
assigns a weighted score based on importance placed on each item at a time. A nine-point
scale that infers respondents’ preferences is employed during comparisons (Saaty, 1977).
A choice score of one on the scale indicates equal preference or importance for the two
items in comparison, while a choice of nine indicates the highest preference. During
comparisons, a reciprocal matrix is used in scoring. For example, when comparing X and
Y, if a score of two for X is given, then Y is assigned a reciprocal score (1/2) when
comparing Y against X.
The process of assignment of preference scores in AHP is deemed subjective, hence
yielding inconsistent responses (Andalecio, 2010; Pascoe et al., 2014). Inconsistences
should be checked through calculation of Consistency Ratio (CR) and inconsistent
responses eliminated. Examination of inconsistencies follows basic AHP principles, that
if a>b, and b > c, then a > c (Soma, 2003). CR is obtained by dividing individual weighted

112
scores by the geometric mean as follows;
CR =CI
RI……………………………………………… . . ………………………………… . . (𝑖)
Where RI is the (Random Indicator); a randomly generated value already obtained by
Saaty (1990), depending on number of items being compared and CI is the Consistency
Index obtained as follows;.
CI =𝜆𝑚𝑎𝑥 − 𝑛
𝑛 − 1…………………………………………………………………… . . … (𝑖𝑖)
Where n is the dimension of the matrix and λ is the largest eigenvalue of the matrix. A CR
<0.1 is considered inconsistent and the results should be rejected.
3.2.2 Data collection
Focus Group Discussions (FGDs) were used to identify constraints and opportunities and
ranked using the AHP tool. Data on value chain support services was collected as
described in (section 1.14). During FGDs, to avoid domineering of weaker groups by
powerful ones (Andalecio, 2010), actor groups participated separately, in groups of 6-12
on separate days (Table 3.1). Thus, a total of 12 FGDs were held at Malindi, Mayungu,
Shimoni and Vanga. Participant selection was based on advice from local leaders in
addition to experience and expertise identified during individual interviews.
Table 3.1. Number of respondents involved in focus group discussions by site
Site Fishers Middlemen Processors Total
Malindi 11 11 9 31
Mayungu 10 9 12 31
Shimoni 9 8 6 23
Vanga 10 7 12 29
Total 40 35 39 114

113
In the first step of the FGD exercise, the purpose of the study was explained to participants
and became the first hierarchical objective. It was stated as identification and analysis of
value chain constraints preventing optimal financial performance. The second step was to
list success factors needed to attain optimal financial performance, and thus became the
second hierarchical objective. It was stated as measures needed to overcome constraints
to achieve optimal financial performance. These measures were interpreted as solutions
(opportunities) in the fishery. Listed constraints and opportunities were considered as the
measurement criteria. The third step was to rank the constraints and opportunities in order
of severity and prioritization respectively.
During ranking, the nine-point scoring scale was explained to participants. The local
Swahili language was used throughout the exercise. Analogy of fish weights was used to
elicit importance along the weighted scale. Actors were asked how many Kgs they would
place on a constraint against the other. A weight of 9 kg would mean a score of nine which
is the highest score on AHP scale (Saaty, 1977). This made it easier for participants to
relate with the problem and provide an appropriate score. The constraint with the highest
score meant the most limiting challenge and vice versa. There were discussions by
participants to build consensus around their choices. As ranking proceeded, a research
assistant entered the agreed score on a pre-prepared excel matrix with automatic
calculations. The same exercise was repeated for opportunities and took about 2-21/2
hours.
Data on extent of support services was undertaken through field interviews as described

114
in (section 1.14). Respondents were interviewed at landing sites and markets. Key
variables targeted included; access to loans, support in training and provision of
equipment and ownership.
Data analysis
AHP scores for constraints and opportunities obtained as described above (sections 3.2.1
and 3.2.2) were further analyzed in a series of steps. This was done using an excel
spreadsheet with inputted formulas to calculate weightings as the FGD exercise
proceeded. In the first step, scores were normalized by dividing each cell value with the
sum of the column. In the second step a geometric mean was obtained along the
normalized row scores. In the third step a weighted matrix product was calculated from
the geometric mean array of scores and array of original row scores. In the fourth step, the
Consistency Ratio was calculated as described in section 3.2.1. Participants were asked if
they were satisfied with the overall scores or wished to revisit their answers. In some
cases, they revisited and changed them. This also helped to improve Consistency Ratio
(CR) in some instances.
Many constraints and opportunities were thematically similar. To enhance clarity, they
were grouped into coherent categories that reflect broad value chain themes. These themes
are referred to as “value chain dimensions” in this study. They included; capital, costs,
equipment and infrastructure, governance, labour, markets, resource, training and trust.
The dimensions, together with the weighted scores of constraints and opportunities were
then graphed using polar plots in R statistical software (Version 3.5.3) (R Development

115
Core Team 3.0.1., 2013). The plots were based on mean scores for sites and actor group.

116
Results
A total of 23 constraints and 18 opportunities were listed, analyzed and ranked within
nine broad value chain dimensions. Results of constraints are presented first and then
opportunities. The results are also presented by actor group, site only and sites combined.
In all the polar plots, the radial diagrams show scores for each constraint as shown in
letter labels and as described on the side table. The coloured radial plots represent value
chain dimension that a constraint or opportunity belongs to, as also shown on the
coloured legend.
3.4.1 Fishers’ constraints
Fishers ranked value chain dimensions in the following order of decreasing severity of
constraints; capital, markets, costs, equipment and infrastructure and training (Figure
3.1a). They identified inadequacy of capital and un-affordable credit as key capital
constraints (Figure 3.1a). Capital was ranked highly due to its usefulness in purchasing
equipment and covering operational costs. Fishers reported that lack of capital forced
them to rely on middlemen and hence lost power to determine fish prices. Although
unaffordable credit was not ranked as a severe constraint across all sites, fishers still faced
access problems (Figure 3.1b). They were discouraged from obtaining loans due to
conditional requirements such as collateral, guarantors, high interest, fear of losing
investments if they fail to pay and erratic income from seasonal fishing.
In the markets dimension, they identified fluctuating prices and low fish demand as key

117
constraints (Figure 3.1a). This occurred especially during fish gluts driven by seasonal
fluctuations and influx of local and foreign migrant fishers who arrived at the onset of
NEM and left at the beginning of SEM season (Wanyonyi, et al., 2016a). Thus, supply
was high, but demand was low. As regards costs, high operational costs were identified
as a key constraint. For example, in Malindi prohibitive cost of bait, food, fuel and ice
were ranked as severe (Figure 3.1b), especially by offshore fishers who fished for several
days before landing.
In terms of equipment and infrastructure, fishers ranked lack of rescue equipment and
enough fish preservation facilities equally. They reported that capsize accidents occurred
every year and there were still no designated boats and organized rescue strategies at
landing sites. This problem was particularly severe in Shimoni (Figure 3.1b).
They also considered lack of ice making machines, cold rooms and ice boxes as severe,
since this equipment was crucial in facilitating fishing for several days. This problem was
severe, particularly in Mayungu (Figure 3.1b). Although the government had installed
cold rooms at Malindi and Vanga and an ice making machine at Vanga, they were non-
operational due to constant breakdowns. Fishers instead sourced ice from company
agents who recovered its cost by lowering fish prices. As regards training, inadequate
fishing skills was the only key constraint amongst fishers. This was surprisingly coming
from a fishing community. However, on further probing, fishers pointed out that
reference to fishing skills was in relation to use of multiple gears and technology such as
fish finders and GPS.

118
Figure 3.1. Fishers’ constraints a) by combined sites, b) by each site.

119
3.4.2 Fishers’ opportunities
In terms of opportunities, fishers ranked value chain dimensions in the following
decreasing order of priority; capital, equipment and infrastructure, training, markets and
governance (Figure 3.2 a). This contrasts the order of constraints. Nevertheless, capital
was still ranked high, where facilitation of affordable financing was proposed as a
solution to inadequacy of capital and un-affordable credit. During the focus group
discussions, fishers noted that although bank loans were available, loaning conditions
were not conducive to their fluctuating incomes, lack of assets and religious beliefs. They
proposed interest-free loaning, cognizant of the seasonal nature of fishing and low asset
base.
Fishers in Malindi and Mayungu highly prioritized facilitation of affordable financing
compared to other sites (Figure 3.2b). This can be associated with needs of their capital-
intensive offshore fishing. Fishers also proposed subsidizing cost of fishing equipment,
development of sea rescue strategies and development of the cold chain to solve
equipment and infrastructure constraints. They suggested this would make equipment
affordable and thus gradually wean off dependence on middlemen. The cold chain was
suggested as a solution that could provide ice for fishing and storage during gluts, until
prices improve.
Training on fish quality was proposed as a solution to lack of skills in fish handling and
hygiene. Very few fishers <5% had been trained in this area (Figure 3.7d). In the
governance dimension, fishers requested for government’s assistance in negotiations

120
with middlemen for higher fish prices. In Malindi, where fishers caught premium fish for
export markets, complained about low prices and considered such negotiations as critical.
In the markets dimension, fishers proposed expansion of geographical reach beyond
coastal regions as a solution to low fish demand and oversupply, especially during
migrant fishers’ season. However, market expansion interventions were among the least
prioritized solutions and not considered in some sites at all (Figure 3.2b).
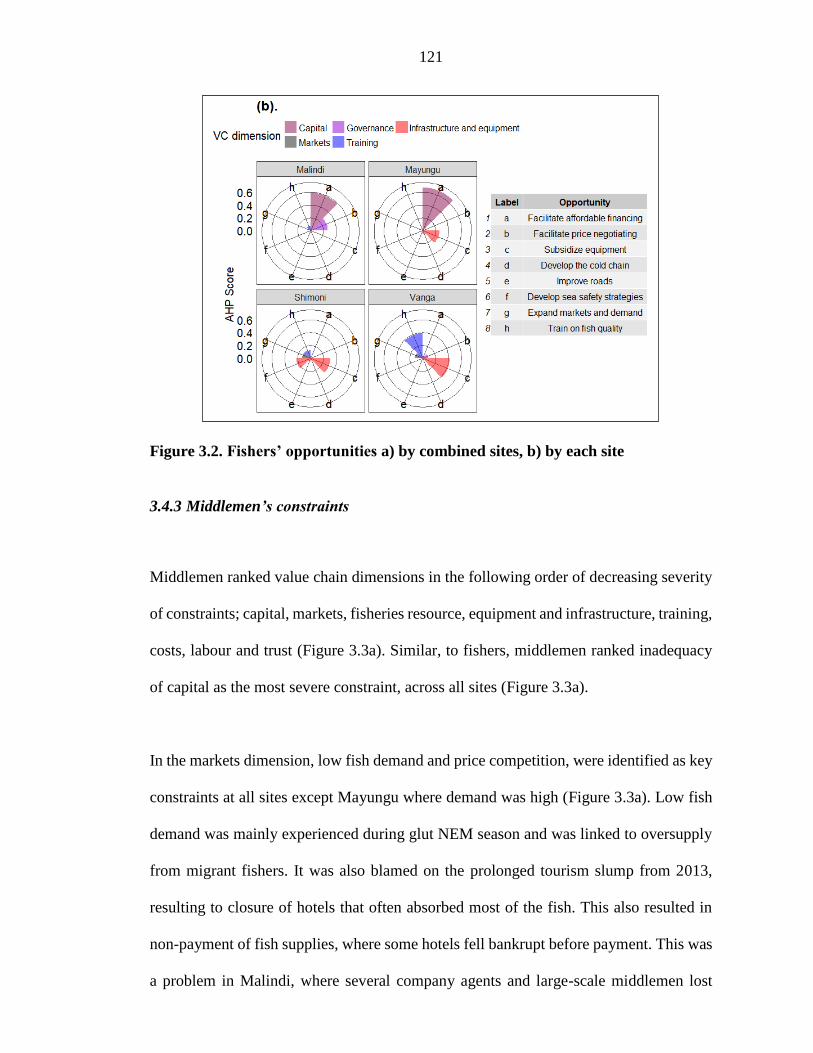
121
Figure 3.2. Fishers’ opportunities a) by combined sites, b) by each site
3.4.3 Middlemen’s constraints
Middlemen ranked value chain dimensions in the following order of decreasing severity
of constraints; capital, markets, fisheries resource, equipment and infrastructure, training,
costs, labour and trust (Figure 3.3a). Similar, to fishers, middlemen ranked inadequacy
of capital as the most severe constraint, across all sites (Figure 3.3a).
In the markets dimension, low fish demand and price competition, were identified as key
constraints at all sites except Mayungu where demand was high (Figure 3.3a). Low fish
demand was mainly experienced during glut NEM season and was linked to oversupply
from migrant fishers. It was also blamed on the prolonged tourism slump from 2013,
resulting to closure of hotels that often absorbed most of the fish. This also resulted in
non-payment of fish supplies, where some hotels fell bankrupt before payment. This was
a problem in Malindi, where several company agents and large-scale middlemen lost

122
huge sums of money. Price competition was also seen as a constraint triggered by fish
scarcity, where some middlemen offered higher prices to win independent fishers.
Fish scarcity was identified as the key constraint in the resource dimension (Figure 3.3a).
This contradicts the claim of low fish demand. However, respondents explained that fish
scarcity occurred during the SEM season and sometimes in brief periods in NEM season
in the month of February due to strong winds and was considered more severe in Malindi
(Figure 3.3b).
In the equipment and infrastructure dimension, key constraints were inadequacy of
preservation facilities, lack of ownership of equipment and poor fishing technology.
Middlemen, like fishers also identified lack of enough preservation facilities as a
constraint experienced at the individual and landing site level. Ownership of equipment
was considered vital, since it allowed regular access to fish, while, lack of access to
modern fishing technology such as GPS and fish finders limited upgrading of fishing
operations in their boats.
In the training dimension, inadequacy of business management and fish handling skills
were cited as key constraints. Most middlemen had no formal training and thus
inadequately trained on business skills. Other constraints were ranked low, indicating
lower severity. These included expensive transport and rental premises, fishers’ labour
insufficiency and low levels of trust. Notably, fisher labour insufficiency was in context
of lack of superior fishing skills compared to foreign migrant fishers. Middlemen claimed
that local fishers were insufficiently skilled and could not persevere in rough waters.

123
Figure 3.3. Middlemen’s constraints a) by combined sites, b) by each site

124
3.4.4 Middlemen’s opportunities
In terms of opportunities, middlemen ranked value chain dimensions in the following
decreasing order of priority; capital, markets, training, equipment and infrastructure and
governance (Figure 3.4a). In the capital dimension, they proposed facilitation of
affordable financing as a key solution to inadequacy of capital. Like fishers, they
proposed establishment of interest-free loans cognizant of the seasonal nature of fishing
and erratic incomes. Facilitation of affordable financing was given highest priority except
in Shimoni, where they preferred grants, citing difficulties of loan repayment (Figure
3.4b).
In the markets dimension, middlemen highly prioritized expansion of markets and
demand. Like fishers, they suggested expansion of geographical reach could improve
demand. This was considered important across all sites but was highly prioritized in
Shimoni and Vanga that were far from key urban markets (Figure 3.4b). In the training
dimension, capacity building in business management and fish handling, quality and
hygiene skills were considered priority. Very few middlemen <5% had been trained on
these areas (Figure 3.7d), although considered important in all sites except Vanga (Figure
3.4b).
In the equipment and infrastructure dimension, prioritized solutions included;
development of the cold chain, improvement of roads and fishing technology through
modernization of equipment. The cold chain was considered important in provision of
ice to fishing vessels and for storage during glut periods. Improvement of roads was

125
proposed to facilitate quicker transportation to markets and to avoid post-harvest losses.
Except Malindi, all the other sites had impassable roads during rainy seasons at the time
of the study. However, recently roads to Shimoni and Vanga have been tarmacked to
bitumen standards.
In the governance dimension, easing migrant fishers’ entry was considered as a solution
to fish scarcity. Middlemen in Malindi who depended on migrant fishers, complained
that their fishers were frustrated when entering Kenya by immigration officials, yet the
East African market protocol allowed free entry. However, member states restrict some
categories of jobs they deem to have sufficient local labour. Middlemen also asked for
government assistance in debt recovery from hotels and other creditors. During the focus
group discussions, middlemen requested for government assistance in recovery of money
owed by especially hotels and formalization of supply contracts since most had only
verbal contracts.

126
Figure 3.4. Middlemen’s opportunities a) by combined sites, b) by each site

127
3.4.5 Processors’ constraints
Fish processors ranked value chain dimensions in the following order of decreasing
severity of constraints; capital, fisheries resource, markets, training, infrastructure and
equipment and costs in decreasing order of severity (Figure 3.5a). Un-affordable credit
in the capital dimension was ranked as the most severe constraint in all sites except
Mayungu (Figure 3.5a). Although most processors participated in local rotating savings
and credit groups popularly known as “merry-go-rounds”, they were keen to get loans
from formal financial institutions. However, like fishers and middlemen, they faced
conditional bottlenecks such as lack of collateral and high interest.
Fish scarcity in the resource dimension was ranked as the second most severe constraint
and was prevalent in SEM season and occasionally in NEM season. Processors also faced
problems of accessing fish, since fishers preferred middlemen who bought bulk quantities
with less price bargaining. On the contrary, most processors bought small quantities,
bargained and bought fish on credit. Due to fish scarcity, processors occasionally
returned home without fish and thereby eroding their capital due to transport costs.
In the markets dimension, fluctuating fish prices and low fish demand were identified as
key constraints (Figure 3.5a). Processors reported experiencing low demand for
processed fish, especially during NEM season when fish was abundant. They also cited
harsh economic times leading to low uptake of processed fish. On price fluctuations, they
reported that prices highly varied even within the same day. For example, at Mayungu
where they frequented, they were price-discriminated by fishers, while middlemen got

128
lower prices for the same fish. Fishers admitted about the discrimination. They explained
that processors purposely purchased small fish quantities repeatedly, which resulted to
losses due to repeated weighing on improperly calibrated weighing balances, thus
increasing prices for them.
In the training dimension, inadequacy of business management and processing skills
were identified as key constraints. Similarly, to middlemen, most processors lacked
formal business training and had difficulties in calculating profitability. Most didn’t
account for some costs, for example own-labour. Lack of skills in processing was seen
in context of lack of other innovative ways of value addition beyond conventional frying
that they practised.
In the infrastructure and equipment dimension, lack of business premises and lack of
preservation facilities were identified as key constraints. Most processors de-scaled,
gutted and cleaned their fish at landing sites in the open, before frying and selling at home
or roadsides. This exposed them and the fish to harsh weather conditions and increased
chances of fish spoilage and contamination. Lack of ice during transportation of fish, also
often resulted to fish spoilage. High operational costs and expensive fish were scored as
the least severe constraints. This is surprising since conventionally, costs have profound
effects on financial performance. This may however suggest that processors had ways of
tackling costs or they didn’t fully comprehend significance of costs.

129
Figure 3.5. Processors’ constraints a) by combined sites, b) by each site
130
3.4.6 Processors’ opportunities
In terms of opportunities, processors ranked value chain dimensions in the following
decreasing order of priority; resource, capital, governance, equipment and infrastructure
and training in decreasing order of priority (Figure 3.6a). They highly prioritized resource
(availability of fish supply), in contrast to fishers and middlemen who prioritized capital
highly. They suggested that provision of boats would allow easier access to fish at
affordable prices and regulate supply (Figure 3.6b). Capital was the second highest
prioritized opportunity, where like fishers and middlemen, they proposed establishment
of interest-free loans, cognizant of the seasonal nature of fishing and erratic incomes.
This solution was highly prioritized in Malindi compared to other sites, suggesting its
severity there (Figure 3.6b).
In the governance dimension, processors like middlemen also proposed easing migrant
fishers’ entry as an additional solution to fish scarcity. They argued that local fishers
could not match the skill and tenacity of foreign migrant fishers. Processors in Mayungu
particularly gave this solution a high priority and feared that if migrant fishers were
completely stopped from fishing, they would be run out of business.

131
Figure 3.6. Processors’ opportunities a) by combined sites, b) by each site
Often, processors bought fish from different boats arriving at varied times, hence leading
to spoilage of first batches. Thus, proposals for development of the cold chain and

132
provision of fish preservation and handling equipment were considered as solutions to
this problem. They also suggested that construction of sheds at central markets would
provide protection and reduce exposure to harsh weather and post-harvest losses.
Training on fish handling, maintenance of quality, fish processing and business
management were also considered as solutions to lack of skills (Figure 3.6a). However,
training was only considered important in Shimoni and Mayungu (Figure 3.6b).
3.4.7 Actor’s loan uptake, training, ownership of equipment and support received
Analysis of loan uptake showed that very few actors had taken business loans, with only
2% of fishers, 19% of middlemen and 36% of processors having taken loans (Figure
3.7a). This further illustrates constraints faced in accessing capital. The higher loan
uptake by processors is linked to loans taken under informal merry-go-round finance
schemes, and loans from quasi-financial institutions dedicated to financing women.
In terms of ownership of equipment, most fishers (90%) owned their fishing gear (Figure
3.7b). However, only few owned vessels, where 35% owned canoes, 5% owned wooden
boats, 4% owned reinforced plastic boats, while only 9% owned engines. Middlemen’s
ownership of larger vessels (reinforced plastic boats and wooden boats) was slightly
higher than fishers, 7% and 16% respectively. A higher percentage (15%) of middlemen
also owned engines compared to fishers. Most middlemen also owned fish preservation
equipment (cold rooms, freezers and ice boxes) compared to other actor groups.

133
Figure 3.7. Percent of actors with a), access to bank loans b), ownership of
equipment c), equipment support and d) training support
In terms of equipment support, less than 15% of actors in each actor group had received
support (Figure 3.7c). However, fishers had received more fishing gear and ice boxes
support than other actors. No individuals from sampled respondents had received boat or
engine support. The low levels of equipment support also corroborate results on
constraints that indicated actors faced challenges in accessing capital and acquiring
equipment. In terms of training, several actors had been trained on; leadership (with
emphasis on BMU management), boat making, business and entrepreneurship, fish
handling, quality and hygiene, fishing and gear repair, marine conservation, navigation
and rescue, value addition, processing and credit access (Figure 3.7d). However, only
134
less than 5% of actors interviewed had been trained, which confirms results on constraints
that indicated low levels of training.
Discussion
Actors in the study identified 23 constraints and 18 opportunities, categorized in nine
broad value chain dimensions. Low access to capital emerged as the top constraint across
all sites and actor groups. This is consistent with other studies singling capital as a major
value chain bottleneck in fisheries and coastal livelihoods (Fowowe, 2017; Kashangaki,
2017). Actors believed that if capital is availed, it can solve many problems faced, for
example, cover cost of operations and purchase equipment.
Challenges of access to financial capital were partly linked to poor access to loans.
However, some actors were apprehensive about getting loans and preferred direct grant
and equipment support. They argued that loans will still have to be repaid under
unpredictable business environments. However, only few actors had received equipment
support in the past, indicating that dependence on external support for equipment was
unreliable. The unpredictable nature of incomes in fishing, remained a top barrier of
access to credit. Actors feared defaulting on monthly loan repayments due to erratic
catches and cashflows. Such unpredictability in SSFs hinders savings, financial planning
and consistent loan repayments (Platteau, 1984).
Many actors were unable to obtain loans due to lack of ownership of land or equipment
acceptable to banks as collateral. This is consistent with other studies showing that

135
fisheries actors often lack ownership of assets that can act as collateral to access credit
(Emdad et al., 2015; Kashangaki, 2017). Many actors being Muslims, also faced religious
restrictions that prohibit paying interest on loans. This limited their credit access in non-
religious financial institutions. Distance from financial institutions also excluded most
actors from accessing financial services, a factor also cited elsewhere (Iqbal & Sami,
2017). These kind of barriers of access to credit, often discourages actors even when
interest rates are low (Emdad et al., 2015). Although Kenya has a vibrant financial sector,
where over 75% of Kenyans have access to financial services (Kashangaki, 2017; Ouma
et al., 2017), it falls short of addressing the above financial needs in the fisheries sector.
It is often assumed that financial instruments designed for the agricultural small-holder
sector would work well for the fisheries sector (Platteau, 1984; Emdad et al., 2015), but
this has not succeeded.
In the context of market demand and supply, there was a contradiction of fish scarcity
and oversupply constraints at different times of the year. Oversupply was associated with
influx of migrant fishers who were considered better equipped and possessed superior
skills (Wanyonyi, et al., 2016a; Wanyonyi, et al., 2016b). The tourism sector, which was
previously a major market for fish, especially in Malindi, has faced a major slump since
2013 (Gari, 2019) and could no longer absorb bumper harvests due to low demand.
Fish scarcity was linked to meagre landings due to lack of skilled fishers and equipment
to access deeper waters. Fish processors experienced discrimination in fish access and
pricing during scarcity periods, and thus highly prioritized measures to improve fish
catches. Because their capital was also low, they were only able to buy small quantities

136
of fish. Previous research in Kenya has also shown that purchase of larger fish quantities
gave actors leverage in prices and access (Matsue et al., 2014; Wamukota et al., 2015).
Nevertheless, such price discrimination against low-capitalized female processors, raises
gender dimensions and illustrates difficulties also faced by women in fish trade elsewhere
(Fröcklin et al., 2013; Matsue et al., 2014).
Problems of scarcity and oversupply were also linked to price fluctuations. Local fishers
complained about low prices especially when migrant fishers arrive, and requested
government assistance to negotiate prices with middlemen. In Malindi for example,
middlemen had raised prices after such negotiations but quickly overturned them, citing
market difficulties of maintaining high prices. On the other hand, processors and
middlemen advocated for easing entry of migrant fishers, to maintain fish supplies and
low prices.
Actors proposed several equipment and infrastructure solutions. They proposed
improvement of the cold chain, which helps in storage, regulation of supplies and
stabilization of prices (Platteau, 1984). Management of the cold chain infrastructure in
Kenya’s coast, has however been challenging. Government-installed cold rooms at
Malindi and Vanga had barely worked for more than one year, more than five years after
installation. Ice-making machines at Shimoni and Vanga have faced similar fate.
Problems such as lack of spare parts, poor technical and management capacity and lack
of stewardship amongst the BMUs were blamed for this stalling.
Information at the Fisheries office in Vanga indicates that provision of boats through

137
donations to different groups has also not worked very well in the past. Ice boxes donated
by various donors in Shimoni and Vanga had also not been used due to insufficiency of
ice (Fisheries officer, Vanga). On the contrary, cold rooms and boats owned and run by
private operators for example in Malindi, seemed to work well. This puts effectiveness
of public-run facilities into doubt.
Actors also suggested that market expansion to new geographical locations, for example
Kenya’s major cities could create more fish demand and reduce oversaturation. They
suggested that this could only take place with improvement of infrastructure such as
roads and provision of preservation and fishing equipment to enable more fishing.
Actors’ proposed solutions, illustrates divergence in opinion between conservationist,
managers and scientists. The latter advocate for sustainability through conservation
measures (Verweij et al., 2010; Samoilys et al., 2017), while resource users are in favour
of market expansion and further exploitation.
Several studies show evidence that, improvement of infrastructure and expansion of
market demand to new areas drives exploitation further, and eventually leads to stock
declines (Stevens et al., 2014; Rodríguez-Garcia & Villasante, 2016; Jaini et al., 2017).
Moreover, Kenya’s inshore fisheries have showed signs of decline in the last two decades
(Samoilys et al., 2017). While resource users may understand resource changes taking
place, they may not always agree that their actions are a contributing factor (Rochet et
al., 2008). Thus, resource users’ solutions to resolve scarcity problems should be treated
with caution to avoid overexploitation of resources.

138
Despite shortcomings of measures that drive overexploitation such as equipment support
and infrastructural developments, they can also be beneficial if well targeted. Such
improvements can lead to faster transportation, rise in producer prices and incomes,
maintenance of fish quality and low post-harvest losses (Olsson, 2009; Schmitt &
Kramer, 2009; Rodríguez-Garcia et al., 2016). Furthermore, infrastructural development
and support in equipment can open exploitation of relatively unexploited stocks. For
example, as outlined in the draft tuna strategy, Kenya seeks to build capacity for offshore
tuna fishing, currently undertaken by distant water fishing nations (Government of
Kenya, 2013).
Previous estimates indicate that stocks of the major commercial tuna species are stable
(Government of Kenya, 2013; Gordon & Hussain, 2015). A recent hydro acoustic survey
by the Kenya Fisheries and Marine Research Institute (KMFRI) indicated a biomass level
that is worth USD 1.34 billion, under conservative exploitation rate of 20% (Kimani et
al., 2019). This indicates development potential for tuna fishing capacity amongst small-
scale actors, for low level exploitation, similar to Asia (Gordon et al., 2015; Duggan &
Kochen, 2016; Digal & Placencia, 2017a; Digal et al., 2017b). This goal is captured in
Kenya’s draft tuna strategy (Government of Kenya, 2013), which seeks to improve tuna
fishing through development of the local fleet, infrastructure and service provision,
creation of incentives and favourable market access regime. This strategy aligns with
actor’s proposals in the present study—to diversify to offshore fishing to relieve pressure
in overexploited inshore stocks and reduce fish scarcity.
Apart from hardware solutions, actors also proposed soft measures such as various

139
trainings. They suggested business management training to help identify inefficient
processes in their businesses and cost-reduction strategies. Training on fish handling and
hygiene was proposed to improve quality and customer trust to enable penetration to
better-paying markets. Actors believed training in value addition and marketing can help
access new lucrative markets. Kenya could be a good market for such value added fish
products since it has a relatively large expatriate presence and an upcoming middle class
in major cities (Spronk, 2014). Actors also believed that training fishers in modern
fishing technologies such as use of fish finders and GPS units could effectively lead to
cost-reduction by improving fish targeting and save on fuel.
Such capacity building of soft skills has potential to transform traditional fisheries to
modern commercial ones (Platteau, 1984). Involvement of government, donor agencies
and the private sector in up-scaling technology is key to such transformation (Platteau,
1984; Jensen, 2007; Jaini et al., 2017). Although training is critical in modernization of
the fishery, only few actors had been trained on any of the nine areas assessed. Besides,
most trainings were ad-hoc and not systematic.
Conclusion
Lack of access to capital emerged as the most severe constraint amongst all actor groups
as is also confirmed by the low level of loan uptake. Suggested solutions included
designing loaning conditions that conform to erratic fishing and income cycles. This can
be resolved through incentivizing the financial sector to accommodate spread out
payments consistent with erratic incomes in fisheries.

140
Fish scarcity and oversupply constraints were also highly ranked and were linked to other
dimensions such as equipment and infrastructure, where only few actors and sites had
received support respectively. Provision of fishing equipment and cold chain facilities
can reduce scarcity and regulate supply respectively. This can help stabilize fish supply
and prices.
Some of the actors’ proposed solutions, for example enhancement of fishing capacity
through provision of equipment and easing migrant fishers’ entry, may go contrary to
managers and conservationists’ expectations. Balancing these solutions needs careful
thought. There is also need to institute systematic training interventions that support
value chain development, since most trainings were ad-hoc and uncoordinated.
While the present study identified and ranked constraints and opportunities, it did not
empirically analyze impact of constraints on profitability. This is a research gap that
requires further studies. This would require assessing individual profitability compared
against individual constraints, rather than using a group approach to identify constraints.

141
CHAPTER 4: ANALYSIS OF POLICY, REGULATORY AND
INSTITUTIONAL FRAMEWORKS IN SMALL-SCALE
FISHERIES VALUE CHAIN
Introduction
This chapter presents findings from analysis of actors’ perception of government
performance in implementing value chain development related objectives outlined in
Kenya’s fisheries policy and law. Actors’ social and economic conditions were also
examined to determine if this contributed to their perceptions. The study therefore had
the following objectives; i) to identify key policy and legal objectives relating to value
chain development, ii) to gauge actors’ perception of performance of national and county
governments in attaining value chain development related policy and legal objectives,
iii) to analyze if actor perception was shaped by demographic, economic and social
factors. The study hypothesized that these factors significantly influenced respondents’
perceptions.
The study adopted a value chain approach where the three marine SSFs value chain
nodes; fishers, middlemen and processors were analyzed. The study used individual
interviews as the primary data collection method targeting actors in the three nodes. The
study was conducted at Malindi, Mayungu, Shimoni and Vanga fish landing sites and
Mombasa city fish markets. The study provides important empirical information that
serves as a useful evaluation of the current situation and may guide institutional, policy
and legal reforms in Kenya’s marine SSFs.

142
4.1.1 Policy and legal provisions in support of Kenya’s small-scale fisheries value
chain development
Kenya’s National Oceans and Fisheries Policy of 2008 (Government of Kenya,
2008)—henceforth the policy, outlines several policy objectives that support fisheries
development and by extension SSFs. It outlines measures such as support to research,
trade and commerce, infrastructure development, human resources development and
value addition. The Fisheries Act Cap (378) of 1989 (Government of Kenya, 1991)—
henceforth the old Fisheries Act, also sets forth several value chain development
support measures that align to the policy including; promotion of research,
infrastructure development, financial assistance to actors through loans, cooperation
amongst actors, fish marketing and extension services.
In 2016, Kenya repealed the old Fisheries Act and promulgated a new fisheries law;
the Fisheries Management and Development Act no.35 of 2016 (Government of Kenya,
2016b)—henceforth FMDA 2016. The Act outlines specific fisheries development
measures that seek to guide Kenya Fisheries Service (KeFS) and Kenya Fisheries
Marketing Authority (KFMA) towards development of fisheries in Kenya. Value chain
development measures outlined in FMDA (2016) are more comprehensive. They
include provisions from the policy and old Fisheries Act, while introducing new
measures.
Data collection was based on the policy and old Fisheries Act since it was conducted
before promulgation of FMDA (2016). However, perspectives and implications of the
new Act were also analyzed. Value chain development related policy statements

143
outlined in the policy, and legal objectives in the old and new Fisheries Acts, are stated
below (Table 4.1).

144
Table 4.1. Identified policy and legal objectives of Fisheries Acts and policy in
support of SSFs value chain development in Kenya
Objective
Fisheries
Act Cap
(378) of
1989
National
Oceans and
Fisheries
Policy
(2008)
Fisheries
Management
and
Development
Act (2016)
1. Conduct research and surveys contributing
towards better understanding of the
resource and exploitation potential
√ √ √
2. Promote infrastructure development
including; improvement of roads, fish
markets and jetties that can improve
landing and marketing of fish
√ √ √
3. Promote trade, commerce, orderly
marketing and develop comprehensive fish
marketing, system, including fish auction,
through strengthening linkages of market
value chain.
√ √ √
4. Promoting value addition and utilization of
fish by-products and bycatch
- √ √
5. Improve and co-ordinate fish quality
assurance and operations
- √ √
6. Promote co-operation among fishers. √ - √
7. Provide a national framework of extension
and training services
√ - √
8. Promote human resources development - √ -
9. Provide for the establishment of accredited
fish safety and quality control laboratories
- √ -
10. Promote adoption of alternative livelihood
amongst fishers
- - √
11. Provide for financial assistance by way of
loans to fishermen
√ - -
12. Encourage persons in the private sector to
organize into associations and form a
national coordinating mechanism to ensure
efficient marketing systems
- - √
13. Provide for the establishment of investor
friendly licensing and approval systems
- - √
14. Facilitate participation in national,
regional and international trade
negotiations and meetings
- - √
15. Promote development of other sustainable
methods of in-situ and ex-situ fishing
- - √

145
Materials and methods
4.2.1 Data collection
Data was collected as described in (section 1.14). A structured questionnaire with a
five-point Likert scale (strongly disagree to strongly agree) was used to record
respondents’ perception of statements posed. The statements were drawn from policy
statements of the Kenya’s National Oceans and Fisheries Policy (2008) and objectives
of the Fisheries Act Cap (378) of 1989 listed above (Table 4.1).
Statement questions are listed and contextualized as shown below (Table 4.2). A brief
explanation of each statement was given to respondents before the question was posed.
The questions focused on weighing performance of national and county governments.
The questionnaire used is shown in appendices.

146
Table 4.2. Contextualization and description of statements used in Likert scale
Statement questions Description of contextualized statements
1. Government promotes
cooperation
This referred to governments’ active engagement of
actors and their leadership, consideration of their
views, facilitation to establish new linkages and
enhance internal understanding
2. Government supports
Beach Management Units
(BMU) functioning
This referred to regular funding of BMU operations,
equipment support and training of its leaders
3. Government promotes fish
marketing
This referred to governments’ active involvement in
identification and facilitation to access lucrative fish
markets outside actors’ localities to attain better
prices
4. Government promotes
value addition
This referred to facilitation towards value addition
activities such as icing, packaging and processing
(filleting, frying, salting and drying)
5. Government provides
equipment
This referred to support in acquiring equipment such
as boats, engines, fishing gear, ice boxes and freezers
6. Government promotes fish
handling
This referred to governments’ support in conducting
trainings on fish handling, hygiene and quality and
also facilitating development of the cold chain
7. Government promotes
extension services
This referred to regular visits by government
officials to discuss or advice actors concerning
fishing, maintenance of fish quality, marketing and
business management
8. Government conducts
impactful research
This referred to benefits that had been accrued from
either participating in research or positive
contribution to actors’ profitability or well-being
4.2.2 Data analysis
In descriptive analysis, percentages of raw Likert scores of actors’ perceptions were
computed for each of level of the five-point Likert scale. Further statistical analysis

147
involved first condensing the five-point scale to a three-point scale for better clarity on
actors’ agreement (either agreeing or disagreeing). Thus, strongly disagree and disagree
were lumped together as disagree. Similarly, strongly agree and agree were lumped as
agree. Undecided scores were unaffected. Test of differences of Likert score responses
within objectives was done using chi-test goodness of fit in R statistical software
(Version 3.5.3) (R Development Core Team 3.0.1., 2013). Test of differences in Likert
scores between objectives was done using one-way ordinal permutation test in coin
package in R (Mangiafico, 2016). Statistical test of factors influencing actors’
perception was conducted using the new three-point scale as the dependent variables.
The test was done using ordered logistic regressions following Hosmer et al., (2000) as
expressed below:
𝑃(𝑌 ≤ 𝑗) =exp[𝛼𝑗 − (𝐵1𝑋1 +⋯+ 𝛽𝑘𝑋𝑘)]
1 + exp[𝛼�̇� − (𝐵1𝑋1 +⋯+𝛽𝑘𝑋𝑘)]………………………… . . (𝑖)
Where P is the probability of predicting Y dependent variable with j ordered levels, X
are the independent influencing covariates and factors described below (Table 4.3). The
dependent variable levels were specified as ordered; agree, undecided and disagree.
Independent variables included; demographic factors (education), structural factors
(value of equipment owned and actor category), social factors (livelihood rank and
experience), economic factors (profitability) and site. Diagnostic tests were done to
check assumptions of ordered logistic regressions. Multi-collinearity was checked by
examining Variance Inflation Factors (VIF) of independent variables using the VIF
function in R statistical software (R Development Core Team 3.0.1., 2013), where
values were below 6 and thus indicating non-multi-collinearity (O’Brien, 2007). Non-

148
conforming variables were omitted from models. Assumption of proportional odds was
also tested and upheld in all models using Brants test function in R software (Benjamin
Schlegel, 2018).
Table 4.3. Description of factor variables used in ordinal logistic regression
models to analyze governments’ performance of policy and legal objectives
Variable
symbol Description of variable Type of variable Variable levels
fpp Financial profit person-1day-1 Continuous NA
ex Experience in years Continuous NA
ev Equipment value Continuous NA
as Agreement scale (for each of
the eight statement objectives
tested)
Ordinal - Agree
- Undecided
- Disagree
lr Livelihood rank Categorical - Primary
- Secondary
st Site Categorical - Malindi
- Mayungu
- Mombasa
- Shimoni
- Vanga
ac Actor category Categorical - Fishers
- Middlemen
- Processors
ed Education level Categorical - Not schooled
- Primary
- Secondary
- Tertiary

149
Results
4.3.1 Actors’ perceptions of government performance
Results of Chi-test showed significant differences (p<0.005) in respondents’
perceptions about performance of national and county governments within each value
chain objective tested. The one-way ordinal permutation tests for respondents’
perceptions across objectives also showed significant differences (p<0.005). Generally,
most respondents avoided extreme choices; either strongly agreeing or disagreeing,
while only few were undecided. Majority of the respondents (60%) were in agreement
that the national government had promoted cooperation, while only 37% agreed the
same about county governments (Table 4.4). None of the respondents strongly agreed
that the national and county governments, had promoted cooperation, while 5% and
9% disagreed respectively. Generally, the national government was rated highly in
promotion of cooperation, compared to county governments.
About 51% of the respondents agreed that the national government had provided
support to functioning of BMUs, while a lower percentage (29%) agreed the same
about county governments (Table 4.4). Twenty-six percent of respondents were
undecided if the national government had supported BMUs and about 40% about the
same for county governments. The relatively higher percentage of the undecided was
due to large numbers of processors who reported engaging rarely on BMU matters, and
thus likely unfamiliar with government interventions.

150
Table 4.4. Actors’ perceptions of performance (in %) of national and county governments in implementation of fisheries
policy and legal objectives
Indicator Strongly disagree Disagree Undecided Agree Strongly agree
National County National County National County National County National County
Promotes
cooperation 5 9 26 28 9 26 60 37 0 0
Supports BMU
functioning 1 1 18 23 26 40 51 29 4 7
Promotes fish
marketing 8 12 65 61 14 18 13 10 0 0
Promotes value
addition 9 12 69 66 11 15 11 6 0 0
Provides
equipment 17 17 76 72 1 2 6 8 0 0
Promotes fish
handling 10 12 44 46 13 21 32 20 0 0
Promotes
extension
services
5 11 46 49 4 20 44 19 0 0
Conducts impact
research 4 - 47 - 44 - 5 - 0 -
149

151
Patterns in perceptions concerning promotion of cooperation and support to functioning
of BMUs showed similarities. One-way ordinal permutation post-hoc tests for respondent
choices between the two VCD objectives showed no statistical differences (p=0.058) for
national government, and (p=0.736) for county governments. These results suggest that
the two objectives were not rated differently.
About 65% of the respondents disagreed that the national government had promoted fish
marketing, while 61% disagreed the same about county governments (Table 4.4). Only
13% and 10% of respondents agreed that the national and county governments
respectively had promoted fish marketing, while none strongly agreed. Percentage of the
undecided was also comparatively low.
About 69% of the respondents disagreed that the national government had promoted value
addition, while 66% disagreed the same about county governments (Table 4.4). Only 11%
and 6% of respondents agreed that the national and county governments respectively, had
promoted value addition, while none strongly agreed. Percentage of the undecided was
also low. One-way ordinal permutation post-hoc tests showed no statistical differences
between actor choices concerning promotion of fish marketing and value addition
(p=0.155) for national government, and (p=0.072) for county governments. These results
suggest that the two objectives were not rated differently.
About 76% of the respondents disagreed that the national government had provided
equipment such as boats, engines, fishing gear, ice boxes, cold rooms and freezers, while
72% disagreed the same about county governments (Table 4.4). Only 6% and 8% of
respondents agreed that the national and county governments respectively had provided

152
equipment, while none strongly agreed. Percentage of the undecided was also
comparatively low. Although majority of respondents had not received any equipment
support, a few fishers in Shimoni and Vanga had received fishing nets from the county
government and ice boxes from other donors. The BMU in Shimoni had also received two
boats with engines from the county government. While Malindi, Mombasa and Vanga
landing sites had cold rooms installed by the national government, only the one in
Mombasa was functional.
About 44% of the respondents disagreed that the national government had promoted fish
handling, while 46% disagreed the same about county governments (Table 4.4). Only 32%
and 20% of respondents agreed that the national and county governments respectively,
had promoted fish handling, while none strongly agreed. Percentage of the undecided was
13% and 21% for national and county governments respectively. Notably, several fish
handling, hygiene and quality trainings had been conducted at Shimoni and Vanga by a
donor funded project. However, none were recorded in Malindi, Mayungu and Mombasa.
About 46% of the respondents disagreed that the national government had promoted
extension services, while 49% disagreed the same about county governments (Table 4.4).
Only 44% and 19% of respondents agreed that the national and county governments
respectively had promoted extension services, while none strongly agreed. Percentage of
the undecided was 4% and 20% for national and county governments respectively.
Results on perception concerning conduct of impactful research were in context of
national institutions only. In Kenya, the nationally mandated research institutions on
fisheries are mainly Kenya Marine and Fisheries Research Institute (KMFRI) and

153
Universities. Private entities and NGOs also conduct research. About 47% of respondents
disagreed that they had benefitted from research, while 4% strongly disagreed. Only 5%
of actors agreed that they had benefitted, with none strongly agreeing. About 44% of
actors were undecided. This is partly because most respondents did not know of any
research being conducted and by whom. This suggests that up to 95% of actors could not
pinpoint benefits from research. They reported that even when aware about research
studies, many were not involved.
4.3.2 Factors influencing actors’ perception of government performance on policy and
legal objectives
Results for factors influencing actor perceptions were mixed and without strong patterns
across the tested objectives (Table 4.5). Only statistically significant results are described.
Influence of structural factors (value of equipment owned and actor category) on actors’
perception was minimal across several objectives. Value of equipment owned, only
significantly influenced perception about impact of research. As value of equipment
owned increased, respondents tended to agree that research conducted was impactful.
Actor category, influenced respondents’ perception about promotion of cooperation,
extension services, impactful research, fish handling and marketing (Table 4.5). Fishers
and middlemen tended to disagree that county governments had promoted cooperation
and that the national government had conducted impactful research. They however agreed
that the national government had promoted extension services. Middlemen disagreed that
both national and county governments had promoted fish marketing but agreed that the
national government had promoted fish handling.
154
Social factors (alternative livelihoods rank and experience) and demographic factors
(education) also had minimal significant influence on respondents’ perception about
performance of governments on various objectives. Respondents undertaking fisheries
activities as a secondary livelihood, perceived the national government as having
conducted impactful research, but disagreed on its performance in promoting fish
handling. Education only significantly influenced respondents’ perception towards
promotion of fish handling. Respondents with secondary education, tended to agree that
the national government had promoted fish handling. However, influence of tertiary
education showed no statistical significance on any objective, perhaps due to
comparatively low numbers of respondents with tertiary education.
Experience had significant influence on respondents’ perception concerning promotion of
value addition, equipment support and impactful research. Respondents with longer
experience tended to agree that the national government had promoted value addition and
that both national and county governments had provided equipment. However, they
disagreed that the national government had conducted impactful research.
Economic factors (financial profitability) only significantly influenced respondents’
perception concerning promotion of value addition and extension services. As
respondents’ profitability increased, they tended to disagree that national and county
governments had promoted value addition. They also tended to disagree that the national
government had promoted extension services, as profitability increased. Financial
profitability did not significantly influence any other objective.
Site showed more profound effect on respondents’ perception than other variables.

155
However, it was omitted in several models due to multicollinearity. Respondents in
Malindi and Mombasa tended to disagree that both national and county governments had
promoted cooperation, while the national government had supported BMUs. Similarly,
actors in Mayungu disagreed that the national and county governments had supported
BMUs. In Malindi and Mayungu respondents also disagreed that both national and county
governments had promoted fish marketing, fish handling and extension services.
However, in Vanga, respondents agreed that both national and county governments had
promoted fish handling. This is not surprising since trainings on fish handling had taken
place in Shimoni and Vanga.

156
Table 4.5. Coefficent estimates of factors influencing actors’ perceptions of performance of national and county
governments in implementation of fisheries policy and legal objectives. Significant results are in bold
Indicator
Ty
pe
of
go
ver
nm
ent
Structural Factors Demographic
Factors Social Factors
Economic
Factors Site
Va
lue
of
equ
ipm
ent
ow
ned
Fis
her
s
Mid
dle
men
Sec
on
da
ry
edu
cati
on
Ter
tia
ry
edu
cati
on
Sec
on
da
ry
liv
elih
oo
d r
an
k
Ex
per
ien
ce
Fin
an
cia
l p
rofi
t
Ma
lin
di
Ma
yu
ng
u
Mo
mb
asa
Va
ng
a
Promotes
cooperation National 0.10 0.05 0.44 -0.32 -0.44 -0.56 -0.01 0.03 -0.72* 0.02 -2.05* 0.59
County 0.17 -1.02** -0.84* 0.41 0.13 -0.78 0.00 0.1 -1.47** -0.57 -2.05* 0.26
Supports BMU
functioning National -0.10 0.73* -0.17 -0.39 -0.73 -0.66 0.01 0.06 -1.20** -2.21**
-
2.33** -0.14
County -0.19 0.53 0.00 0.21 -1.52 -0.78 0.00 -0.15 -0.29 -1.13** -1.07 0.48
Promotes fish
marketing
National 0.17 -0.16 -1.00* 0.65 -0.27 -0.15 -0.01 -0.14 -1.10** -1.04* 0.02 0.41
County 0.13 -0.2 -0.92* 0.40 -0.23 -0.16 -0.02 0.00 -1.27** -1.02* -0.02 0.32
Promotes value
addition
National -0.19 0.00 -0.04 0.04 1.83 -0.29 0.01** -0.44** - - - -
County -0.12 0.03 0.00 -0.17 0.53 -0.51 0.00 -0.42* - - - -
Provides equipment National 0.02 0.50 0.37 -0.63 2.25 - 0.05** -0.06 - - - -
County 0.03 0.72 0.68 0.74 2.11 -0.57 0.07** -0.14 - - - -
Promotes fish
handling National -0.04 -0.58 -1.35* 0.87* 1.61
-
1.33* 0.00 -0.06 -0.73* -1.24** -0.12 3.30**
County -0.10 -0.45 -0.6 -0.23 -0.01 -0.79 0.00 0.04 -0.50 -0.82* 0.71 2.74**
Promotes extension
services
National -0.10 1.10** 1.26** 0.07 -1.15 -0.60 0.01 -0.29* -0.77* 0.21 0.36 0.39
County 0.05 -0.65* -0.28 - - 0.22 0.00 0.03 -0.97** -0.80* 0.90 0.47
Conducts impact
research
National
research
institutions 0.29* -0.69* -1.69** -0.59 -0.27 0.99* -0.02* -0.08 -0.18 -0.3 1.05 -0.1
155

157
Discussion
The present study shows that respondents seemed to agree that the national government
had performed relatively well in promotion of cooperation and support to BMU
functioning, while county governments performed relatively poorly on the two objectives.
National and county governments’ ratings by actors were not statistically different for the
two objectives, hence suggesting similarities. However, a sizeable percentage of
respondents was undecided due to lack of information. Notably, county governments were
still rolling out their functions after coming into place in 2013, and hence most respondents
were unsure about their performance.
Respondents also felt that both national and county governments performed dismally in
promoting fish marketing, value addition and provision of equipment. National and county
governments’ ratings by actors were not statistically different for the two objectives, hence
suggesting similarities. By the time of the present study, Kenya did not have an established
programme for promoting marketing and value addition, either by government, private
sector or civil society. However, there have been efforts by NGOs and the Kenya Marine
and Fisheries Research Institute (KMFRI) to promote value addition through provision of
equipment and training.
Provision of fishing and preservation equipment by national and county governments,
private sector and donors, had also been undertaken, but was minimal and ad-hoc since
there was no systematic programme. For example, Kilifi and Kwale county governments
had provided a few boats, engines, fishing gear and ice boxes to a few landing sites. This
equipment was insufficient, considering the large number of landing sites and actors that

158
needed support. Thus, while programmed government support in equipment and
infrastructure is vital in promoting value chain development (Webber & Labaste, 2010; Lin
et al., 2014; Chu et al., 2017), national and county governments performed sub-optimally.
National and county governments also performed poorly in provision of extension services
and capacity building in fish handling. Extension services are crucial in building actors’
skills in fish handling, marketing, business management and value addition (Olorunfemi et
al., 2017). Although Kenya has a long history of promoting extension services in
agriculture (Muatha et al., 2017), only minimal effort seems to have gone into fisheries.
This is corroborated by results of the frame survey of 2016, where out of 197 landing sites,
only 10% were served daily by extension officers, 34% on weekly basis, 26% on monthly
basis and 18% on quarterly basis (Government of Kenya, 2016c). Therefore, poor delivery
of extension services is limiting upgrading of skills in many aspects of value chain
development as corroborated by the low level of training in fish handling.
Most respondents could not enumerate benefits of research, either due to lack of perceived
benefits or lack of information concerning ongoing research. Most respondents felt
alienated from research and commonly repeated this statement; “we just see people getting
into the water and do not know what they go to do”. Such lack of involvement of resource
users in scientific studies is likely to lead to apprehension, disputation or disregard of study
recommendations (Daw & Gray, 2005). However, when research results are well
communicated, they can have immediate use in local resource management and
development of policies to improve resource management and the value chain (Daw et al.,
2005; Field et al., 2013; Lin et al., 2014).

159
Generally, factors influencing respondents’ perceptions lacked clear patterns and only few
had significant influence. Structural factors only influenced respondents’ perception
concerning promotion of extension services and impact of research. Better equipped
respondents had negative perceptions over government performance towards provision of
extension services and impactful research. This may suggest that they had less contact with
extension officials and researchers.
Social factors were only influential on a few objectives. Respondents with alternative
livelihoods agreed that the national government had conducted impactful research. This
suggests they had more access to information on research. They however disagreed that
the national government had promoted fish handling. This suggests that they may have
missed out on trainings on fish handling. This is not surprising since actors with
multiplicity of livelihoods have less focus on primary livelihoods and are often left out of
capacity building interventions targeting mainstream livelihoods (Turyahabwe et al.,
2017).
Level of education also showed no obvious patterns. However, respondents with
secondary education agreed that the national government had promoted fish handling,
suggesting that trainings may have mostly reached educated actors. This is consistent with
other findings in East Africa suggesting that, a higher level of education enables actors to
engage in actions targeting them (Muatha et al., 2017; Turyahabwe et al., 2017).
However, most respondents had low levels of education with majority only attained
primary education. This may have implications on fish quality of the whole value chain,
since majority of respondents had lower education and may not have been targeted in fish

160
handling trainings. Respondents with longer experience tended to agree that the national
and county governments had provided equipment. This may suggest that the less
experienced persons forming more that 60% of respondents with less than ten years’
experience, had neither received assistance nor aware about such assistance.
Economic factor (financial profitability), was only significant in influencing respondents’
perception about extension services and value addition. As profitability increased,
respondents tended to disagree that the national and county governments had promoted
extension services and value addition. This contrasts other findings in Kenya by Muatha et
al., (2017), that suggested that farmers with higher incomes had more access to extension
services. However, this may be largely due to absence of extension services in capture
fisheries in Kenya (Government of Kenya, 2016c). In terms of geographical influence,
most respondents at all sites had negative perception concerning BMU functioning, fish
marketing, fish handling and extension services. However, perceptions were positive about
fish handling support at Shimoni and Vanga, where donor projects had been collaboratively
undertaken with government.
Findings from the study suggests that most objectives relating to support of value chain
development in the policy and old Fisheries Act had not been fully realized due to lack of
implementation or ineffectiveness. Kenya for a long time lacked a long-term systematic
programme of action to implement such objectives. A longer-term dedicated value chain
development programme can be effective in upgrading SSFs, as has been shown in East
Asia, for example in Indonesia and Taiwan (Lin et al., 2014; Sunoko et al., 2014). Longer-
term measures such as training, fishing fleet development, financing, research and
development, policy and legal reforms, and infrastructural development in the two

161
countries, contributed to their ranking as globally significant fisheries producers (Lin et al.,
2014; Sunoko et al., 2014; FAO, 2016). Kenya’s new fisheries legal reforms captured in
FMDA (2016) contain similar interventions.
The new law addresses fisheries development and management mandates separately. For
example, it establishes the Kenya Fisheries Marketing Board charged with addressing
marketing of fish, separately from management functions undertaken by Kenya Fisheries
Service. The Act also establishes the Fisheries Advisory Council to guide fisheries
management, research and development. It also establishes the Fisheries Research and
Development Fund for supplementary funding of fisheries research, and the Fish Levy
Trust Fund to finance development, management and capacity building.
There have also been other reforms targeted at transforming fisheries. In 2016, the
Government of Kenya through the Executive Order No. 1/2016 (Government of Kenya,
2016d), outlined its commitment towards the blue economy including fisheries
development. This created the State Department for Fisheries, Aquaculture and the Blue
Economy and later the Presidential Blue Economy Standing Committee, consisting of
relevant blue economy related agencies. Kenya in 2018 also hosted the first global blue
economy conference, cementing its commitment to the blue economy agenda.
All these initiatives, legal provisions and institutions will be instrumental in playing a key
role in value chain development functions such as provision of infrastructure and
equipment, training of actors, provision of extension services, organizing of actors, support
to marketing and value addition, and promotion of research. These reforms seem to address
gaps highlighted in the present study.

162
However, even with the legal and institutional reforms in place, there is danger of lack of
adherence to the principle of subsidiarity between the county and national government.
There has often been confusion on roles between national and county government, for
example on licensing and enforcement functions. Lack of clarity on such issues may lead
to inaction and lack of support to value chain actors (Dang et al., 2017). Implementation
also requires measures in place, to forestall the perennial problem of insufficient funding
for SSFs, as is common in most developing countries (Mills et al., 2011).
Conclusion
Findings showed that government rating at both national and county levels was varied and
without clear-cut patterns. However, actors’ perceptions showed low rating on most
objectives concerning government performance. Generally, county governments’
performance was rated lower than national government. This rating could be expected,
given that county governments were still at their infancy.
Actor characteristics (structural, social, economic, demographic and geographical factors),
largely did not influence respondents’ perceptions. Based on respondents’ perceptions,
most objectives of the policy and old Fisheries Act were ineffectively achieved. However,
the new law is more comprehensive in addressing SSFs value chain development needs
and may cure previous shortcomings and perceptions. Regular evaluation of actor
perception concerning implementation of the new law should be done to gauge government
performance.

163
The present study only looked at respondents’ perceptions concerning performance of
government in implementation of policy and legal objectives. However, it did not look at
how the different ratings of government performance amongst individuals and different
sites influenced profitability. This can be useful in formulating policy and legal reforms
that directly impact on actors’ incomes.

164
CHAPTER 5: GENERAL DISCUSSION
This chapter provides a general summary discussion of key findings of the present study.
The study used the S-C-P paradigm to analyze the structure and conduct of actors in the
marine SSFs value chain and their implications to performance in context of profitability.
The study also analyzed constraints in marine SSFs in Kenya, as well as the corresponding
opportunities from actors’ perspective. Actor perception of government performance in
implementing value chain development related objectives as outlined in fisheries policy,
institutional and regulatory instruments was also analyzed. These included; Kenya’s
National Oceans and Fisheries Policy of 2008 and the Fisheries Act Cap (378) of 1989.
Perspectives were also drawn from the new fisheries law; Fisheries Management and
Development Act of 2016. The goal of the study was to characterize and analyze Kenya’s
marine small-scale fisheries along the value chain, to generate knowledge useful for value
chain improvements and fisheries management.
In addressing structure, findings showed that, although high-capitalized actors dominated
functions in the value chain, the fisheries studied were competitive with relatively low HHI
indices. Thus, expected monopolistic or oligopolistic tendencies common with capital
skewed value chains, were not present in the fisheries studied. This is can be attributed to
intense competition amongst high-capitalized actors. This is a significant finding
suggesting that skewed capital in fisheries value chains, does not always lead to
monopolistic or oligopolistic tendencies. Therefore, creation of competitive market
conditions for middlemen with similar market power, may level-off the playing field.
However, the levelled playing field did not seem to favour all actors. For example, fishers

165
did not receive equitable profitability compared to middlemen, despite existence of a
competitive market. This was especially profound among categories that shouldered most
of the variable costs such as the high-capitalized handline and drifting gillnet. This further
suggests that equitable returns cannot be achieved by enhancing market competition alone.
However, fishers’ increasing percent ownership of fishing equipment significantly
improved their profitability. This suggests that improving fishers’ ownership of equipment
is beneficial and resonates with their proposed solution to assist them acquire own
equipment. Although government policy and regulatory framework seeks to assist actors
to acquire equipment, findings showed that only few had benefitted.
Findings of the study also showed that structure had limited role in influencing actors’
conduct within the context of S-C-P paradigm. Choice of fish grade was not significantly
influenced by level of capitalization within individual nodes. However, high-capitalized
middlemen tended to target high-priced grades, while processors targeted low-priced
grades. Such targeting of high-priced grades fuels more capitalization by middlemen who
also support migrant fishers with equipment in order to fish for them (Ferrol-Schulte et al.,
2014; Bailey et al., 2015). However, in the present study, targeting of high-priced grades
did not lead to significantly higher profitability.
Fish grading also has implications to processors who primarily target low-grade fish for
further value addition (Matsue et al., 2014). Targeting of low-grade fish by processors
increased their profitability significantly. They also provide a ready market for fish that
would otherwise be discarded, particularly for small pelagics and other low-grade fish.
Processors also form a complex market relationship with migrant fishers who provide
reliable fish supplies to them. Thus policy recommendations restricting migrant fishers’

166
movement would negatively affect processors’ fish supplies and affordability.
Collusion to set prices, access to market information and actors’ power to determine fish
prices, which are important in markets with skewed capitalization, were not significantly
influenced by capitalization across all nodes. Similarly, these conduct variables had no
significant influence on actors’ profitability. Lack of influence of collusion on profitability
corroborates findings on market concentration showing low HHI indices. Therefore,
collusion and un-competitiveness were not serious problems in Kenya’s marine SSFs.
Improving market information empowers actors’ to negotiate prices, and is commonly
proposed to improve economic outcomes of small-scale holders (Courtois et al., 2014;
Ranjan, 2017). However, access to information did not significantly influence profitability.
Therefore, measures to improve access to market information may not yield benefits in
terms of improved profitability. However, market information may help actors to access
supplies and new markets (Fews Net, 2008).
As shown in the study, S-C-P factors showed only minimal significant influence on
profitability. However other factors such as variable costs and sales emerged as the most
important across all actor groups. Profitability increased as sales increased, but declined as
variable costs increased. Although sales significantly influenced profitability, this did not
translate to higher profitability for offshore fishers who landed more fish. Their
profitability was not significantly different from inshore fishers who had lower catches, but
higher ownership of equipment. This can be attributed to unequal shouldering of variable
costs by offshore fishers mostly dependent on middlemen. Such unequitable share of
variable costs is detrimental to their economic welfare and pressurizes them to continually
catch more fish to pay back debts, while deepening reliance on middlemen (Miñarro et al.,

167
2016; Prescott et al., 2017). This is also detrimental to resource sustainability (Mangi et
al., 2007).
Therefore, strategies that can reduce reliance on middlemen, reduce costs and increase
sales are most likely to improve profitability amongst fishers (Rodrigues et al., 2019).
Improvements in the cold chain and fish landing markets can also stimulate fish trade and
boost sales (Schmitt et al., 2009), while eliminating fishers’ desperate need for quick sales
at low prices (Jimenez et al., 2020). Reduction of license fees and permits through review
of the fish trade policy environment, can help reduce costs and improve sales amongst
middlemen and processors.
Modernizing the fishery for example use of Global Positioning Systems (GPS), fish finders
and nearshore Fish Aggregating Devices (FADs) can help fishers locate fish efficiently and
reduce fuel costs to improve profitability (Sharp, 2011; Olivier et al., 2013). This can be
done through support to acquire equipment, from favourable government loaning schemes
as suggested and promoted elsewhere (Emdad et al., 2015; Jueseah et al., 2020; Kimani et
al., 2020). This kind of support is crucial for fishers, since higher percent ownership of
equipment was linked to higher profitability. However, modernizing the fishery should
incorporate sustainability measures to prevent stock collapse from higher fishing effort
(Stevens et al., 2014; Jaini et al., 2017). Other measures that can improve actors’
profitability include formation and revival of collapsed cooperatives for aggregation of
produce to improve prices and marketing.
The fishery was viable and attractive, based on the positive financial profitability for
majority of actors and the high number of new entrants, as is common with well
performing fisheries (Prescott et al., 2017). Financial profits were also higher than

168
opportunity cost of wages in unskilled employment, which suggests better returns than
surrounding opportunities in commercial, domestic and agricultural sectors (Government
of Kenya, 2015). However, despite the overall positive performance among most
respondents, some attained low incomes which may not be sufficient. Nevertheless, many
Kenyan fishers are unwilling to exit the fishery even with low incomes, due to lack of
alternatives (Cinner et al., 2009). Thus, conclusions about viability of the fishery should be
treated with caution since fishing is often the livelihood of last resort amidst limited
alternatives (Béné, 2003).
Analysis of constraints and opportunities facing Kenya’s marine SSF actors, showed that
they face a large number of constraints within the value chain. However, others were
ranked as more severe than others. Lack of access to capital, which is common in coastal
enterprises (Fowowe, 2017; Kashangaki, 2017), emerged as the most severe constraint
amongst all actor groups. This is also corroborated by the study’s findings, indicating low
uptake of loans and is associated with several access challenges. Most actors feared taking
loans due to their erratic incomes, which reflects their proposed solution for development
of flexible government loaning schemes.
Other reasons leading to poor access to loans, and commonly cited in other small-holder
enterprises (Emdad et al., 2015; Iqbal et al., 2017; Kashangaki, 2017) included; lack of
collateral, religious restrictions amongst Muslims and distance from financial institutions.
Majority of respondents opted to borrowing from relatives and friends, which is a common
adaptation strategy in SSFs (Emdad et al., 2015). Although Kenya’s financial sector is
advanced (Kashangaki, 2017; Ouma et al., 2017), it fails to adequately meet needs of SSFs,
which hampers individual longer-term investments in SSFs.

169
Other key constraints faced by actors included market challenges revolving around fish
supply and demand. A once vibrant, but poorly performing tourism industry was blamed
for low fish demand. Oversupply occurred in the NEM season and was associated with
influx of migrant fishers who land more fish (Wanyonyi, et al., 2016a; Wanyonyi, et al.,
2016b). However, scarcity was experienced in the months of May to August in SEM
season. Middlemen and processors blamed the scarcity on lack of skilled fishers,
equipment and training in use of technology for offshore fishing. This is also corroborated
by the low level of equipment support and training to fishers. Findings also showed that
only a few fishers had access to equipment such as GPS and eco-sounders. Thus, provision
of equipment should be prioritized, while improving ownership, particularly amongst
fishers. Furthermore, study findings also showed that percent ownership of equipment
amongst fishers improved their profitability. Improved technology such as GPS and eco-
sounders can reduce fishers’ variable costs and improve on profitability.
Fish scarcity was also noted as a severe problem in the SEM season when fishing is limited
due to bad weather. This was a big concern especially amongst processors. This is because
of discrimination faced in accessing fish due to their low purchasing power and over-
pricing during such periods (Matsue et al., 2014; Wamukota et al., 2015). This highlights
the gendered problems faced by women in fish trade especially during scarcity periods
(Fröcklin et al., 2013; Matsue et al., 2014). They therefore highly prioritized measures to
improve fish catches. This included proposals to ease entry of migrant fishers. However,
local fishers are opposed to this and blame migrant fishers for triggering low fish prices.
Respondents proposed improvement of the cold chain for fish storage, regulation of supply
and stabilization of prices, which are commonly suggested interventions to oversupply

170
(Platteau, 1984). However, Kenya’s coast has historically faced challenges of managing
cold chain infrastructure with examples of stalled projects in Malindi, Lamu, Shimoni and
Vanga. On the contrary privately-owned facilities and equipment, for example in Malindi,
seemed to work well and lessons can be learnt by public managed facilities. In addition,
respondents also proposed improvement of roads and expansion of markets to new
geographical locations to overcome oversupply. Road improvement as suggested by actors
can also reduce cost of doing business. Furthermore, study findings also showed that high
variable costs were a critical determinant of profitability amongst all actor groups.
Findings concerning respondent’s perceptions of the national and county governments in
implementing value chain development objectives were varied. Respondents seemed to
agree that the national government had performed relatively well in promotion of
cooperation amongst actors and support to BMU functioning, compared to county
governments. They were also in consensus that both national and county governments
performed poorly in promoting fish marketing, value addition and provision of equipment.
These findings also corroborate those on analysis of constraints, which indicated that
respondents lacked adequate and appropriate equipment, as well as skills in fish handling
and value addition. They also faced many challenges in fish marketing.
Respondents also reported that both national and county governments had inadequately
provided extension services, despite Kenya’s long history of promoting agricultural
extension services (Muatha et al., 2017). Fish handling trainings which are typically
conducted through extension services were also poorly rated, and explains the low numbers
of respondents trained. These findings also corroborate those of analysis of constraints,
where lack of training was listed as a constraint. Many respondents also reported not having

171
received any benefits from research, or lacked information about it. Such negative actor
perceptions are likely to lead to disputation or disregard of study recommendations (Daw
et al., 2005; Field et al., 2013; Lin et al., 2014). Therefore, research needs to be
participatory and findings shared widely for community level actors to find them useful.
Findings concerning influence of respondents’ characteristics on rating of national and
county governments were weak and lacked clear patterns. Therefore, respondents’
characteristics were not a good predictor of their perception of government performance.
Nevertheless, as respondents’ capitalization increased, their rating of national and county
government performance declined, suggesting that well-endowed respondents had less
contact with extension services and research. Similarly, as respondents’ financial
profitability increased, they tended to disagree that national and county governments had
promoted extension services and value addition. This suggests that respondents with higher
capital and earnings, were either independent or had higher expectations from government.
Respondents with alternative livelihoods agreed that the national government had
conducted impactful research but disagreed that it had promoted fish handling. Level of
education, which was low, also showed no obvious patterns, but actors with secondary
education tended to agree that the national government had promoted fish handling.
Respondents with longer experience also tended to agree that the national and county
governments had provided support in equipment. In terms of geographical characteristics,
respondents across all sites had negative perceptions of national and county governments
in performance of most policy and legal objectives. However, respondents at Shimoni and
Vanga study sites had positive perception about training in fish handling, where it had been
collaboratively undertaken with donor projects.

172
Findings from the study suggest that most policy and legal objectives in support of value
chain development had not been fully realized due to poor delivery or ineffectiveness. This
seems to correlate with constraints listed by respondents, and perhaps fueled their severity.
Literature shows that a well-designed and implemented fisheries policy, institutional and
regulatory framework can overcome constraints and transform fisheries, as happened in
Indonesia and Taiwan (Lin et al., 2014; Sunoko et al., 2014). These countries put long term
measures in training, fishing fleet development, financing, research and development,
policy and legal reforms and infrastructural development. This possibly contributed to their
global positioning as significant fish producers (Lin et al., 2014; Sunoko et al., 2014; FAO,
2016).
Kenya has taken steps towards fisheries development similar to the East Asian countries,
through legal reforms contained in FMDA (2016). It takes a new approach to fisheries
management and development, by establishing the Kenya Fisheries Service to manage
fisheries and Kenya Fisheries Marketing Board to address fish marketing. The Act also
establishes the Fisheries Advisory Council to advice on fisheries management and
development. It also establishes the Fish Levy Trust Fund to provide supplementary
funding for management, development and capacity building in fisheries. These provisions
and institutions will be instrumental in playing a key role in roll out of value chain
development functions. Thus, the new legal and institutional reforms may answer to
previous shortcomings. However, funding for fisheries has to be secured in government
annual fiscal planning and budgeting. This will forestall the perennial insufficient funding,
common in developing countries (Mills et al., 2011).

173
CHAPTER 6: GENERAL CONCLUSIONS AND
RECOMMENDATIONS
Conclusions
Findings from objective 1 to 3 (in context of S-C-P) showed that:
1. The marine small-scale fisheries value chain in Kenya was competitive as revealed by
the low HHI indices, despite being dominated by high capitalized actors. Therefore,
there was no evidence of monopolistic or oligopolistic tendencies expected in high-
capitalized value chains.
2. The market performance was not influenced by structure and conduct of actors in the
value chain. However, non-S-C-P factors, specifically sales and costs were important
in influencing profitability.
Findings from objective 4 on analysis of constraints and opportunities showed that:
3. Constraints related to capital, resource and markets were most severe in the marine
small-scale fisheries value chain in Kenya.
4. To mitigate capital constraints, actors proposed design of loaning schemes that
conform to their unpredictable income flows. For constraints related to resource
dimension, they proposed easing entry of migrant fishers and provision of equipment.
For market constraints they proposed expansion of markets to other geographical areas
Findings from objective 5 on analysis of institutional, policy and regulatory frameworks
in the value chain, showed that:
5. Based on rating by actors in the marine small-scale fisheries in Kenya, the national

174
government performed better in promotion of cooperation and support to BMU
functioning, while county governments performed poorly on the two objectives.
However, both national and county governments performed poorly in promoting fish
marketing, value addition, promotion of extension services, fish handling and
provision of equipment.
6. Actors perceptions concerning performance of government on policy and legal
objectives was not significantly influenced by structural, social, economic,
demographic and geographical factors.
New scholarly contributions from the study
1. The present study is the first empirical study on marine SSFs in Kenya that has used
the S-C-P paradigm to explain structure of the value chain, actor behavior and how
both impact on performance in terms of profitability
2. Combination of the value chain approach with the S-C-P paradigm has added value to
scholarship by addressing varied actor groups in the same study
3. This is the first study to empirically rank value chain constraints and opportunities in
marine SSFs in Kenya
4. The present study is the first empirical study on marine SSFs in Kenya to analyze
actors’ views of government performance in implementing policy and legal objectives
that support value chain development. It is also the first study that draws perspectives
of the old and the new fisheries Acts in context of value chain development

175
Recommendations
Considering findings from the present study the following recommendations to improve
marine small-scale-fisheries value chain development in Kenya are proposed;
a. Data collection on fisheries by national and county governments should comprise
fisheries indicators such as fish grading and economic indicators such as pricing,
costs and income among others
b. Government should provide support to fishers to acquire fishing and preservation
equipment to address constraints experienced, given that higher ownership of
equipment influenced profitability positively
c. Government should enhance infrastructure development to mitigate market
constraints and improve actor performance. Improved infrastructure also helps in
cost-reduction which is a significant contributor to actors’ profitability
d. Training in business management, value addition, fish handling among other relevant
areas should be organized in a systematic way and inclusive of all actors. This will
mitigate against the current trainings organized on ad-hoc basis. It will also mitigate
against post-harvest losses
e. Government should enhance service delivery to actors in marine small-scale fisheries
in Kenya to improve their business environment and perceptions.
f. Actors should form cooperatives to aggregate their produce to enable negotiations for
prices and seek new markets
g. Actors should develop mechanisms through cooperatives to pool financial resources
for inward lending to members at affordable rates, with appropriate repayment
periods cognizant of their erratic incomes

176
h. Actors should consider improving fish handling and value addition practices in order
to open new market niches and attract better prices

177
REFERENCES
Abila, R. O. (1995). Structure, Conduct and Performance of Kisumu fish marketing
system. University of Nairobi.
Abraham, A., Platteau, J. P. (1987). An inquiry into quasi-credit contracts: the role of
reciprocal credit and interlinked deals in small-scale fishing communities. The
Journal of Development Studies, 23(4), 461–490.
https://doi.org/10.1080/00220388708422044
Adeogun, O. A., Abohweyere, P. O., Ogunbadejo, H. K., Tanko, A., Jim-Saiki, L.
(2009). Economic viability of small-scale marine capture fisheries in the Bonny
area, Rivers State, Nigeria. Marine Resource Economics, 24(2), 195–203.
Alfaro-Shigueto, J., Mangel, J. C., Pajuelo, M., Dutton, P. H., Seminoff, J. A., Godley,
B. J. (2010). Where small can have a large impact: Structure and characterization of
small-scale fisheries in Peru. Fisheries Research, 106(1), 8–17.
https://doi.org/10.1016/j.fishres.2010.06.004
Anam, R., Mostarda, E. (2012). Field identification guide to the living marine resources
of Kenya. FAO species identification guide for fishery purposes. Rome: FAO.
Andalecio, M. (2010). Multi-criteria decision models for management of tropical coastal
fisheries. A review. Agronomy for Sustainable Development, Springer Verlag/EDP
Sciences/INRA, 30(2), 557–580. https://doi.org/10.1051/agro/2009051
Andrew, N. L., Bene, C., Hall, S. J., Allison, E. H., Heck, S., Ratner, B. D. (2007).
Diagnosis and management of small-scale fisheries in developing countries. Fish
and Fisheries, 8, 227–240. Retrieved from http://www.blackwell-
synergy.com/doi/abs/10.1111/j.1467-2679.2007.00252.x
Asche, F., Chen, Y., Smith, M. D. (2015). Economic incentives to target species and

178
fish size: Prices and fine-scale product attributes in Norwegian fisheries. ICES
Journal of Marine Science, 72(3), 733–740. https://doi.org/10.1093/icesjms/fsu208
ASCLME. (2012). National marine ecosystem diagnostic analysis, Kenya. Contribution
to the Agulhas and Somali Current Large Marine Ecosystems Project (supported
by UNDP with GEF grant financing).
Ba, A., Schmidt, J., Dème, M., Lancker, K., Chaboud, C., Cury, P., … Brehmer, P.
(2017). Profitability and economic drivers of small pelagic fisheries in West Africa:
A twenty year perspective. Marine Policy, 76, 152–158.
https://doi.org/10.1016/j.marpol.2016.11.008
Bailey, M., Bush, S., Oosterveer, P., Larastiti, L. (2015). Fishers, fair trade, and finding
middle ground. Fisheries Research, 182, 59–68.
Bain, J. S. (1959). Industrial Organization. New York: John Wiley and Sons.
Baio, A. (2010). Show me the way: Inclination towards governance attributes in the
artisanal fisheries of Sierra Leone. Fisheries Research, 102, 311–322.
https://doi.org/10.1016/j.fishres.2010.01.003
Banson, K. E., Nguyen, N. C., Bosch, O. J. H. (2016). A Systems thinking approach to
the structure, conduct and performance of the agricultural sector in Ghana. Systems
Research and Behavioral Science. https://doi.org/10.1002/sres.2437
Barnes-Mauthe, M., Oleson, K. L. L., Zafindrasilivonona, B. (2013). The total
economic value of small-scale fisheries with a characterization of post-landing
trends: An application in Madagascar with global relevance. Fisheries Research,
147, 175–185. https://doi.org/10.1016/j.fishres.2013.05.011
Battaglia, P., Romeo, T., Consoli, P., Scotti, G., Andaloro, F. (2010). Characterization
of the artisanal fishery and its socio-economic aspects in the central Mediterranean
Sea (Aeolian Islands , Italy). Fisheries Research, 102(1–2), 87–97.
179
https://doi.org/10.1016/j.fishres.2009.10.013
Béné, C. (2003). When fishery rhymes with poverty: A first step beyond the old
paradigm on poverty. World Development, 31(6), 949–975.
https://doi.org/10.1016/S0305-750X(03)00045-7
Béné, C., Arthur, R., Norbury, H., Allison, E. H., Beveridge, M., Bush, S., … Williams,
M. (2016). Contribution of fisheries and aquaculture to food security and poverty
reduction: assessing the current evidence. World Development, 79, 177–196.
https://doi.org/https://doi.org/10.1016/j.worlddev.2015.11.007
Béné, C., Merten, S. (2008). Women and fish-for-sex: transactional sex, HIV/AIDS and
gender in African fisheries. World Development, 36(5), 875–899.
https://doi.org/10.1016/j.worlddev.2007.05.010
Benjamin Schlegel. (2018). CRAN - Package brant. Retrieved July 11, 2018, from
https://cran.r-project.org/web/packages/brant/index.html
Bolwig, S., Ponte, S., Toit, A., Halberg, N. (2010). Integrating poverty and
environmental concerns into value-chain analysis: A conceptual framework.
Development Policy Review, 28(2), 173–194.
Boncoeur, J., Coglan, L., Gallic, B. Le, Pascoe, S. (2000). On the (ir)relevance of rates
of return measures of economic performance to small boats. Fisheries Research,
49(2), 105–115. https://doi.org/10.1016/S0165-7836(00)00209-5
Brinson, A. A., Alcalá, A., Die, D. J., Shivlani, M. (2006). Contrasting socioeconomic
indicators for two fisheries that target Atlantic billfish: Southeast Florida
recreational charter boats and Venezuelan artisanal gill-netters. Bulletin of Marine
Science, 79(3), 635–645. Retrieved from
https://www.ingentaconnect.com/content/umrsmas/bullmar/2006/00000079/000000
03/art00016

180
Brinson, A. A., Die, D. J., Bannerman, P. O., Diatta, Y. (2009). Socioeconomic
performance of West African fleets that target Atlantic billfish. Fisheries Research,
99, 55–62. https://doi.org/10.1016/j.fishres.2009.04.010
Bronnmann, J., Asche, F. (2016). The value of product attributes, brands and private
labels: An analysis of frozen seafood in Germany. Journal of Agricultural
Economics, 67(1), 231–244.
Chu, J., Garlock, T. M., Sayon, P., Asche, F., Anderson, J. L. (2017). Impact evaluation
of a fisheries development project. Marine Policy, 85, 141–149.
https://doi.org/10.1016/j.marpol.2017.08.024
Cinner, J. E., Daw, T., McClanahan, T. R. (2009). Socioeconomic factors that affect
artisanal fishers’ readiness to exit a declining fishery. Conservation Biology, 23(1),
124–130. https://doi.org/10.1111/j.1523-1739.2008.01041.x
Cochran, G. W. (1977). Sampling Techniques (Third ed). New York: John Wiley and
Sons, Ltd.
Colloca, F., Crespi, V., Cerasi, S., Coppola, S. R. (2004). Structure and evolution of the
artisanal fishery in a southern Italian coastal area. Fisheries Research, 69(3), 359–
369. https://doi.org/10.1016/j.fishres.2004.06.014
County Government of Kilifi. (2018). Kilifi county integrated development plan, 2018-
2022 (Vol. I).
County Government of Kwale. (2018). Kwale county integrated development plan,
2018-2022. Kwale.
Courtois, P., Subervie, J. (2014). Farmer bargaining power and market information
services. American Journal of Agricultural Economics, 97(3), 953–977.
https://doi.org/10.1093/ajae/aau051
Creswell, J. W. (2013). Research design : qualitative, quantitative, and mixed methods

181
approache. SAGE (4th ed.). Thousand Oaks, California: SAGE Publications.
Crona, B., Bodin, Ö. (2010a). Power asymmetries in small-scale fisheries: A barrier to
governance transformability? Ecology and Society, 15(4). https://doi.org/32
Crona, B., Nystrom, M., Folke, C., Jiddawi, N. (2010b). Middlemen, a critical social-
ecological link in coastal communities of Kenya and Zanzibar. Marine Policy,
34(4), 761–771.
Cunningham, S., Arthur, E. N., Michael, A., Tim, B., Neiland, A. E., Arbuckle, M., …
Tim, B. (2009). Wealth-based fisheries management: Using fisheries wealth to
orchestrate sound fisheries policy in practice. Marine Resource Economics, 24(3),
271–287. https://doi.org/10.5950/0738-1360-24.3.271
Dang, N. B., Momtaz, S., Zimmerman, K., Thi, P., Nhung, H. (2017). Effectiveness of
formal institutions in managing marine fisheries for sustainable fisheries
development: A case study of a coastal commune in Vietnam. Ocean and Coastal
Management, 137, 175–184. https://doi.org/10.1016/j.ocecoaman.2016.12.021
Daurès, F., Trenkel, V. M., Guyader, O. (2013). Modelling the fishing costs of French
commercial vessels in the Bay of Biscay. Fisheries Research, 146, 74–85.
https://doi.org/10.1016/j.fishres.2013.03.022
Daw, T., Gray, T. (2005). Fisheries science and sustainability in international policy: a
study of failure in the European Union’s Common Fisheries Policy. Marine Policy,
29, 189–197. https://doi.org/10.1016/j.marpol.2004.03.003
de Figueirêdo, J. H. S., Meuwissen, M. P. M., Oude Lansink, A. G. J. M. (2014).
Integrating structure, conduct and performance into value chain analysis. Journal
on Chain and Network Science, 14(1), 21–30.
de Graaf, G., Garibaldi, L. (2014). The value of african fisheries (Vol. 1093). Rome:
FAO.

182
Denzin, N. K., Lincoln, Y. S., Guba, E. G. (1994). Paradigmatic controversies,
contradictions, and emerging confluences. Handbook of Qualitative Research, 643.
https://doi.org/10.1111/j.1365-2648.2005.03538_2.x
Digal, L. N., Placencia, S. G. P. (2017a). Factors affecting the adoption of sustainable
tuna fishing practices: The case of municipal fishers in Maasim, Sarangani
Province, Region 12, Philippines. Marine Policy, 77, 30–36.
https://doi.org/10.1016/j.marpol.2016.12.010
Digal, L. N., Placencia, S. G. P., Balgos, C. Q. (2017b). Market assessment on the
incentives and disincentives for the adoption of sustainable practices along the tuna
value chain in Region 12, Philippines. Marine Policy, 86, 39–46.
https://doi.org/10.1016/j.marpol.2017.09.008
Donovan, J., Franzel, S., Cunha, M., Gyau, A., Mithöfer, D. (2015). Guides for value
chain development: a comparative review. Journal of Agribusiness in Developing
and Emerging Economies, 5(1), 2–23. https://doi.org/10.1108/JADEE-07-2013-
0025
Duggan, D. E., Kochen, M. (2016). Small in scale but big in potential: Opportunities
and challenges for fisheries certification of Indonesian small-scale tuna fisheries.
Marine Policy, 67, 30–39. https://doi.org/10.1016/j.marpol.2016.01.008
Duy, N. N., Flaaten, O., Anh, N. T. K., Ngoc, Q. T. K. (2012). Open-access fishing rent
and efficiency — The case of gillnet vessels in Nha Trang, Vietnam. Fisheries
Research, 127–128, 98–108. https://doi.org/10.1016/j.fishres.2012.04.008
EAME. (2004). The Eastern African Marine Ecoregion Biodiversity Conservation
Strategic Framework 2005 - 2025. Dar es Salaam.
Emdad, H., Julián Idrobo, Berkes, F., Giesbrecht, D. (2015). Small-scale fishers’
adaptations to change: The role of formal and informal credit in Paraty, Brazil.

183
Marine Policy, 51, 401–407. https://doi.org/10.1016/j.marpol.2014.10.002
Even, B., Donovan, J. (2017). Value chain development in Vietnam: a look at
approaches used and options for improved impact. Enterprise Development and
Microfinance, 28(1–2), 28–44. https://doi.org/10.3362/1755-1986.16-00034
Fabinyi, M., Dressler, W., Pido, M. (2016). Do fish scales matter? Diversification and
differentiation in seafood commodity chains. Ocean and Coastal Management,
134, 103–111.
FAO. (2005). Increasing the contribution of small-scale fisheries to poverty alleviation
and food security. FAO Technical Guidelines for Responsible Fisheries. No. 10.
Rome, FAO. 79pp. https://doi.org/10.1017/CBO9781107415324.004
FAO. (2014). The small-scale fisheries sector in relation to international trade and
sustainable livelihoods. COFI:FT/XIV/2014/9. Rome.
FAO. (2016). The State of World Fisheries and Aquaculture 2016. Contributing to food
security and nutrition for all. Rome.
FAO and World Fish Centre. (2008). Small-scale capture fisheries: A global overview
with emphasis on developing countries. Washington D.C.
Ferrol-Schulte, D., Ferse, S. C. A., Glaser, M. (2014). Patron-client relationships,
livelihoods and natural resource management in tropical coastal communities.
Ocean and Coastal Management, 100, 63–73.
Ferse, S. C. A., Glaser, M., Neil, M., Schwerdtner Máñez, K. (2014). To cope or to
sustain? Eroding long-term sustainability in an Indonesian coral reef fishery.
Regional Environmental Change, 14(6), 2053–2065.
Fews Net. (2008). Structure-Conduct-Performance and food security. Fews Net Market
Guidance, (2), 18.
Field, J. G., Attwood, C. G., Jarre, A., Sink, K., Atkinson, L. J. (2013). Cooperation

184
between scientists, NGOs and industry in support of sustainable fisheries: the South
African hake Merluccius spp. trawl fishery experience. Fish Biology, 1–16.
https://doi.org/10.1111/jfb.12118
Fowowe, B. (2017). Access to finance and firm performance: Evidence from African
countries. Review of Development Finance, 7(1), 6–17.
https://doi.org/10.1016/j.rdf.2017.01.006
Fröcklin, S., De La Torre-Castro, M., Lindström, L., Jiddawi, N. S. (2013). Fish traders
as key actors in fisheries: Gender and adaptive management. Ambio, 42(8), 951–
962. https://doi.org/10.1007/s13280-013-0451-1
Fulanda, B., Munga, C., Ohtomi, J., Osore, M., Mugo, R., Hossain, M. Y. (2009). The
structure and evolution of the coastal migrant fishery of Kenya. Ocean and Coastal
Management, 52(9), 459–466. https://doi.org/10.1016/j.ocecoaman.2009.07.001
García-de-la-Fuente, L., Fernández-Vázquez, E., Ramos-Carvajal, C. (2016). A
methodology for analyzing the impact of the artisanal fishing fleets on regional
economies: An application for the case of Asturias (Spain). Marine Policy, 74(26),
165–176. https://doi.org/10.1016/j.marpol.2016.09.002
García-de-la-Fuente, L., González-Álvarez, J., García-Flórez, L., Fernández-Rueda, P.,
Alcázar-Álvarez, J. (2013). Relevance of socioeconomic information for the
sustainable management of artisanal fisheries in South Europe. A characterization
study of the Asturian artisanal fleet (northern Spain). Ocean and Coastal
Management, 86, 61–71. https://doi.org/10.1016/j.ocecoaman.2013.05.007
Gari, A. (2019, May 18). Future of Malindi tourism at stake as investors flee over
massive losses. Star Newspaper. Retrieved from https://www.the-
star.co.ke/counties/coast/2019-05-18-future-of-malindi-tourism-at-stake-as-
investors-flee-over-massive-losses/
185
Garza-Gil, M. D., Amigo-Dobaño, L. (2008). The profitability of the artisanal galician
fleet. Marine Policy, 32(1), 74–78. https://doi.org/10.1016/j.marpol.2007.04.008
Gereffi, G., Kaplinsky, R. (2001). Introduction: Globalisation, value chains and
development. IDS Bulletin, 32(3). https://doi.org/10.1111/j.1759-
5436.2001.mp32003001.x
Gordon, D. V., Hussain, S. (2015). Price determination and demand flexibilities in the
ex-vessel market for tuna in the republic of Maldives. Aquaculture Economics and
Management, 19(1), 8–28. https://doi.org/10.1080/13657305.2015.994234
Government of Kenya. (1991). Kenya Fisheries Act Cap 378. Nairobi.
Government of Kenya. Fisheries (Beach Management Unit) Regulations (2007).
Nairobi, Kenya.
Government of Kenya. (2008). Kenya National Oceans and Fisheries Policy. Nairobi.
Government of Kenya. (2010). Constitution of Kenya. Kenya Law Reports. Nairobi,
Kenya.
Government of Kenya. (2012). Kenya fisheries annual statistical bulletin. Nairobi.
Government of Kenya. (2013). Kenya tuna fisheries development and management
strategy. Nairobi.
Government of Kenya. (2014a). Kenya fisheries annual statistical bulletin. Nairobi.
Government of Kenya. (2014b). Marine artisanal fisheries frame survey report. Nairobi.
Government of Kenya. Kenya Gazette Supplement No.91, Pub. L. No. 116, 587 (2015).
Kenya. Retrieved from
http://kenyalaw.org/kl/fileadmin/pdfdownloads/LegalNotices/LN_No.116__117_of
_2015_1_.pdf
Government of Kenya. (2016a). Fisheries annual statistical bulletin. Nairobi.
Government of Kenya. (2016b). Fisheries Management and Development Act No. 35.

186
Nairobi.
Government of Kenya. (2016c). Marine artisanal fisheries frame survey report. Nairobi.
Government of Kenya. (2016d). Organization of the government of the Republic of
Kenya. Nairobi.
Government of Kenya. (2019a). Kenya Population and Housing Census: Volume II:
Distribution of population by administrative units (Vol. II). Nairobi.
Government of Kenya. (2019b). Kenya Population and Housing Census: Volume IV:
Distribution of population by socio-economic characteristics. Nairobi.
Greene, E. D. (1963). Changing from declining balance to straight-line depreciation.
Source: The Accounting Review, 38(2), 355–362. Retrieved from
http://www.jstor.org/stable/242926%5Cnhttp://www.jstor.org/stable/242926
Grydehøj, A., Nurdin, N. (2016). Politics of technology in the informal governance of
destructive fishing in Spermonde, Indonesia. GeoJournal, 81(2), 281–292.
GTZ. (2008). ValueLinks Manual: The Methodology of Value Chain Promotion.
Eschborn: GTZ.
Guillen, J., Macher, C., Merzéréaud, M., Boncoeur, J., Guyader, O. (2015). Effects of
the share remuneration system on fisheries management targets and rent
distribution. Marine Resource Economics, 30(2), 123–138.
https://doi.org/10.1086/679970
Guillen, J., Maynou, F. (2014). Importance of temporal and spatial factors in the ex-
vessel price formation for red shrimp and management implications. Marine Policy,
47, 66–70.
Guillen, J., Maynou, F. (2016). Increasing fuel prices, decreasing fish prices and low
productivity lead to poor economic performance and capacity reduction in the
fishing sector: evidence from the Spanish Mediterranean. Turkish Journal of

187
Fisheries and Aquatic Sciences, 16, 659–668.
Guisan, A., Edwards, T., Hastie, T. (2002). Generalized linear and generalized additive
models in studies of species distributions: setting the scene. Ecological Modelling,
157, 89–100.
Harre, H., Pirscher, F. (2009). The food industry in the new EU member states; A
comparative view on structure , conduct and performance. Outlook on Agriculture,
38(1), 23–29.
Hastie, T., Tibshirani, R., Friedman, J. (2009). The elements of statistical learning:
Data mining, inference, and prediction (Second Edi). Carlifornia: Springer.
https://doi.org/10.1007/978-0-387-84858-7
HLPE. (2014). Sustainable fisheries and aquaculture for food security and nutrition: A
report by the High Level Panel of Experts on Food Security and Nutrition of the
Committee on World Food Security. Rome.
Horemans, B., Kébé, M., Odoi-Akersie, W. (1994). Working group on capital needs
and availability in artisanal fisheries: Methodology and lessons learned from case
studies. IDAF Project, IDAF/WP/65. Cotonou.
Hosmer, D. W., Lemeshow, S. (2000). Applied logistic regression. (A. C. N. Cressie, N.
I. Fisher, I. M. Johnstone, J. B. Kadane, D. W. Scott, B. W. Silverman, … D. G.
Kendall, Eds.) (Second Edi). New York: John Wiley and Sons, Ltd.
Inoni, O. E., Oyaide, W. J. (2007). Socio-economic analysis of artisanal fishing in the
South agro-ecological zone of Delta State, Nigeria. Agricultura Tropica et
Subtropica, 40(4), 135–149.
Iqbal, B. A., Sami, S. (2017). Role of banks in financial inclusion in India. Contaduria y
Administracion, 62, 644–656. https://doi.org/10.1016/j.cya.2017.01.007
Isaacs, M., Hara, M., Raakjær, J. (2007). Has reforming South African fisheries

188
contributed to wealth redistribution and poverty alleviation? Ocean and Coastal
Management, 50(5–6), 301–313. https://doi.org/10.1016/j.ocecoaman.2006.11.002
Jacinto, E. R., Pomeroy, R. S. (2011). Developing markets for small-scale fisheries:
utilizing the value chain approach. In R. S. Pomeroy N. L. Andrew (Eds.), Small-
scale fisheries management: frameworks and approaches for the developing world
(pp. 160–177). Cambridge, UK: CAB International.
https://doi.org/10.1079/9781845936075.0160
Jacquet, J., Pauly, D. (2008). Funding priorities: Big barriers to small-scale fisheries.
Conservation Biology, 22(4), 832–835. https://doi.org/10.1111/j.1523-
1739.2008.00978.x
Jaini, M., AdvaniI, S., Shanker, K., Oommen, M., Namboothri, N. (2017). History,
culture, infrastructure and export markets shape fisheries and reef accessibility in
India’s contrasting oceanic islands. Environmental Conservation, 1–8.
https://doi.org/10.1017/S037689291700042X
Jennings, S., Pascoe, S., Norman-lopez, A., Bouhellec, B. Le, Hall-Aspland, S.,
Sullivan, A., Pecl, G. (2009). Identifying management objectives hierarchies and
weightings for four key fisheries in South Eastern Australia. FRDC Project No
2009/073.
Jensen, R. (2007). The digital provide: information (technology), market performance,
and welfare in the South Indian fisheries sector. Quarterly Journal of Economics,
CXXII(3). https://doi.org/10.1093/qje/qjt005.Advance
Jimenez, É. A., Amaral, M. T., Souza, P. L. de, Ferreira Costa, M. de N., Lira, A. S.,
Frédou, F. L. (2020). Value chain dynamics and the socioeconomic drivers of
small-scale fisheries on the amazon coast: A case study in the state of Amapá,
Brazil. Marine Policy, 115(February 2018).

189
https://doi.org/10.1016/j.marpol.2020.103856
Jordaan, H., Grové, B., Gerhard, R. B., Backeberg, G. R. (2014). Conceptual
framework for value chain analysis for poverty alleviation among smallholder
farmers. Agrekon: Agriculture Economics Research, Policy and Practice in
Southern Africa, 53(1), 1–25.
Jueseah, A. S., Knutsson, O., Kristofersson, D. M., Tomasson, T. (2020). Seasonal
flows of economic benefits in small-scale fisheries in Liberia : A value chain
analysis. Marine Policy, 119. https://doi.org/10.1016/j.marpol.2020.104042
Junior, H. S. de F., Meuwissen, M. P. M., Filho, J. do A., Lansink, A. G. J. M. O.
(2016). Evaluating strategies for honey value chains in brazil using a value chain
structure-conduct-performance (SCP) framework. International Food and
Agribusiness Management Review, 19(3), 225–250.
Kamau, E. C., Wamukota, A., Muthiga, N. A. (2009). Promotion and management of
marine fisheries in Kenya. In W. Gerd (Ed.), Towards sustainable fisheries law. A
comparative analysis (p. 340). Gland, Switzerland: IUCN.
Kamphorst, B. (1995). A cost and earnings study at Cotonou harbour, Benin, for
Cotonou, Programme for the Integrated Development of Artisanal Fisheries in
West Africa. idaf programme. Cotonou.
Kaplinsky, R., Morris, M. (2001). A Handbook for value chain research. Report
prepared for IDRC. IDRC, Canada: IDRC-International Development Research
Center.
Karuga, S., Abila, R. (2007). Value chain market assessment for marine fish sub-sector
in Kenya’s coast region. Mombasa, Kenya.
Kashangaki, J. (2017). Options for enhancing access to credit for micro & small
enterprises in coastal Kenya. Mombasa.

190
Ketchen, D., Shook, C. (1996). The application of cluster analysis in strategic
management research: An analysis and critique. Strategic Management Journal,
17(6), 441–458.
Kimani, E., Okemwa, G., Abubakar, A., Ontomwa, M., Omukoto, J. (2019). An
overview of the industrial tuna fishery in Kenya. Mombasa, Kenya.
Kimani, P., Wamukota, A., Manyala, J. O., Mlewa, C. M. (2020). Analysis of
constraints and opportunities in marine small-scale fisheries value chain: A multi-
criteria decision approach. Ocean and Coastal Management, 189.
https://doi.org/10.1016/j.ocecoaman.2020.105151
Kiteresi, L. I., Okuku, E. O., Mwangi, S. N., Ohowa, B., Wanjeri, V. O., Okumu, S.,
Mkono, M. (2012). The influence of land based activities on the phytoplankton
communities of Shimoni-Vanga system, Kenya. Int. J. Environ. Res, 6(1), 151–162.
Kitheka, J. U. (2013). River sediment supply, sedimentation and transport of the highly
turbid sediment plume in Malindi Bay, Kenya. Journal of Geographical Sciences,
23(3), 465–489. https://doi.org/10.1007/s11442-013-1022-x
Kitheka, J. U., Mavuti, K. M., Nthenge, P., Obiero, M. (2014). The dynamics of the
turbidity maximum zone in a tropical Sabaki estuary in Kenya. Journal of
Environmental Science and Water Resources, 3(4), 86–103.
Klint, M. B., Sjöberg, U. (2003). Towards a comprehensive SCP-model for analysing
strategic networks / alliances. International Journal of Physical Distribution &
Logistics Management, 33(5), 408–426.
https://doi.org/10.1108/09600030310481988
Kulindwa, K., Lokina, R. (2013). The winners and losers in finfish trade in Mafia
island: A value chain analysis. Western Indian Ocean Journal of Marine Science,
12(2), 151–168. Retrieved from
191
https://www.ajol.info/index.php/wiojms/article/view/78595
Lambo, A. L., Ormond, R. F. G. (2006). Continued post-bleaching decline and changed
benthic community of a Kenyan coral reef. Marine Pollution Bulletin, 52, 1617–
1624. https://doi.org/10.1016/j.marpolbul.2006.05.028
Lee, M. (2014). Hedonic pricing of Atlantic cod: Effects of size, freshness and gear.
Marine Resource Economics, 29(3), 259–277.
Leung, P., Muraoka, J., Nakamoto, S. T., Pooley, S. (1998). Evaluating fisheries
management options in Hawaii using analytic hierarchy process (AHP). Fisheries
Research, 36(2–3), 171–183. https://doi.org/10.1016/S0165-7836(98)00097-6
Lin, K. L., Jhan, H. T., Ting, K. H., Lin, C. L., Liu, W. H. (2014). Using indicators to
evaluate the Taiwanese distant-water fishery-policy performance. Ocean and
Coastal Management, 96, 29–41. https://doi.org/10.1016/j.ocecoaman.2014.04.028
Loc, V. T. T., Bush, S. R., Sinh, L. X., Khiem, N. T. (2010). High and low value fish
chains in the Mekong Delta: Challenges for livelihoods and governance.
Environment, Development and Sustainability, 12(6), 889–908.
https://doi.org/10.1007/s10668-010-9230-3
Loizou, E., Chatzitheodoridis, F., Polymeros, K. (2014). Sustainable development of
rural coastal areas: Impacts of a new fisheries policy. Land Use Policy, 38, 41–47.
https://doi.org/10.1016/j.landusepol.2013.10.017
Long, L. K., Flaaten, O., Thi, N., Anh, K. (2008). Economic performance of open-
access offshore fisheries — The case of Vietnamese longliners in the South China
Sea. Fisheries Research, 93, 296–304. https://doi.org/10.1016/j.fishres.2008.05.013
M4P. (2008). Making value chains work better for the poor: A tool book for
practitioners of Value Chain Analysis, Version 3. UK Department for International
Development (DFID), Agricultural Development Internationa:Phnom Penh,

192
Cambodia. https://doi.org/10.1684/agr.2014.0708
Macfadyen, G., Nasr-Alla, A. M., Al-Kenawy, D., Fathi, M., Hebicha, H., Diab, A. M.,
… El-Naggar, G. (2012). Value-chain analysis - An assessment methodology to
estimate Egyptian aquaculture sector performance. Aquaculture, 362–363, 18–27.
https://doi.org/10.1016/j.aquaculture.2012.05.042
Mangi, S. C., Roberts, C. M., Rodwell, L. D. (2007). Financial comparisons of fishing
gear used in Kenya’s coral reef lagoons. Source: AMBIO: A Journal of the Human
Environment, 36(8), 671–676. https://doi.org/10.1579/0044-
7447(2007)36[671:FCOFGU]2.0.CO;2
Mangiafico, S. S. (2016). An R Companion for the Handbook of Biological Statistics.
Retrieved May 20, 2020, from https://rcompanion.org/handbook/F_02.html
Manyala, J. O. (2011). Fishery value chain analysis: background report – Kenya.
FAO,Rome. Retrieved from http://www.fao.org/search/en/
Matsue, N., Daw, T., Garrett, L. (2014). Women fish traders on the Kenyan coast:
Livelihoods, bargaining power, and participation in management. Coastal
Management, 42(6), 531–554. https://doi.org/10.1080/08920753.2014.964819
Maynou, F., Morales-Nin, B., Cabanellas-Reboredo, M., Palmer, M., García, E., Grau,
A. M. (2013). Small-scale fishery in the Balearic Islands (W Mediterranean): A
socio-economic approach. Fisheries Research, 139, 11–17.
https://doi.org/10.1016/j.fishres.2012.11.006
Mbaru, E. K., McClanahan, T. R. (2013). Escape gaps in African basket traps reduce
bycatch while increasing body sizes and incomes in a heavily fished reef lagoon.
Fisheries Research, 148, 90–99.
Mcclanahan, T., Allison, E. H., Cinner, J. E. (2015). Managing fisheries for human and
food security. Fish and Fisheries, 16(1), 78–103. https://doi.org/10.1111/faf.12045

193
McClanahan, T. R. (2010). Effects of fisheries closures and gear restrictions on fishing
income in a Kenyan Coral Reef. Conservation Biology, 24(6), 1519–1528.
https://doi.org/10.1111/j.1523-1739.2010.01530.x
Melo, L. De, Damasio, A., Fabiana, P., Lopes, M., Pennino, M. G., Carvalho, R.,
Sumaila, U. R. (2016). Size matters: fishing less and yielding more in smaller-scale
fisheries. ICES Journal of Marine Science, 2–9.
Mills, D., Westlund, L., De Graaf, G., Kura, Y., Willman, R., Kelleher, K. (2011).
Under-reported and undervalued: Small-scale fisheries in the developing world. In
R. S. Pomeroy N. Andrew (Eds.), Small-scale fisheries management: Frameworks
and approaches for the developing world (pp. 1–15). Cambridge, UK: CAB
International. https://doi.org/10.1079/9781845936075.0001
Miñarro, S., Navarrete Forero, G., Reuter, H., van Putten, I. E. (2016). The role of
patron-client relations on the fishing behaviour of artisanal fishermen in the
Spermonde Archipelago (Indonesia). Marine Policy, 69, 73–83.
Mitchell, T. (2017). Is knowledge power? information and switching costs in
agricultural markets. American Journal of Agricultural Economics, 99(5), 1307–
1326. https://doi.org/10.1093/ajae/aax035
Mondaca-Schachermayer, C. I., Aburto, J., Cundill, G., Lancellotti, D., Tapia, C., Stotz,
W. (2011). An empirical analysis of the social and ecological outcomes of state
subsidies for small-scale fisheries: A case study from chile. Ecology and Society,
16(3), 14. https://doi.org/10.5751/ES-04239-160317
Morand, P., Sy, O. I., Breuil, C. (2005). Fishing livelihoods: Successful diversification,
or sinking into poverty? In B. Wisner, T. Camilla, R. Chitiga (Eds.), Towards a
New Map of Africa (pp. 71–96). London: Earthscan.
https://doi.org/10.4324/9781849773393

194
Muatha, I. T., Otieno, D. J., Nyikal, R. A. (2017). Determinants of smallholder farmers
awareness of agricultural extension devolution in Kenya. African Journal of
Agricultural Research, 12(51), 3549–3555.
https://doi.org/10.5897/AJAR2017.12603
Muawanah, U., Yusuf, G., Adrianto, L., Kalther, J., Pomeroy, R., Abdullah, H.,
Ruchimat, T. (2018). Review of national laws and regulation in Indonesia in
relation to an ecosystem approach to fisheries management. Marine Policy, 91,
150–160. https://doi.org/10.1016/j.marpol.2018.01.027
Munga, C. N., Omukoto, J. O., Kimani, E. N., Vanreusel, A., Bay, M. (2014).
Propulsion-gear-based characterisation of artisanal fisheries in the Malindi-
Ungwana Bay, Kenya and its use for fisheries management. Ocean and Coastal
Management, 98, 130–139. https://doi.org/10.1016/j.ocecoaman.2014.06.006
Mwirigi, F. M., Theuri, F. S. (2012). The challenge of value addition in the seafood
value chain along the Kenyan North coast. International Journal of Business and
Public Management, 2(2), 51–56.
Ngoc, N., Flaaten, O., Kim, L. (2015). Government support and profitability effects –
Vietnamese offshore fisheries. Marine Policy, 61, 77–86.
https://doi.org/10.1016/j.marpol.2015.07.013
O’Brien, R. M. (2007). A caution regarding rules of thumb for variance inflation factors.
Quality and Quantity, 41(5), 673–690. https://doi.org/10.1007/s11135-006-9018-6
Obayelu, A. E., Arowolo, A. O., Ibrahim, S. B., Oderinde, C. O. (2016). Socioeconomic
determinants of profitability of fresh fish marketing in Ogun State, Nigeria.
International Journal of Social Economics, 43(8), 871–883.
https://doi.org/10.1108/IJSE-07-2014-0147
Obura, D., Celliers, L., Machano, H., Mangubhai, S., Mohammed, M. S., Motta, H., …

195
Schleyer, M. (2002). Status of coral reefs in Eastern Africa: Kenya, Tanzania,
Mozambique and South Africa. In Status of Coral Reefs of the World.
Ochieng, C. A., Erftemeijer, P. (2003). The Seagrasses of Kenya and Tanzania. In T.
Green, E. P., Short, F. T., Frederick (Ed.), World Atlas of Seagrasses (pp. 82–92).
University of California Press.
Okemwa, G. M., Maina, G. W., Munga, C. N., Mueni, E., Barabara, M. S., Ndegwa, S.,
… Ntheketha, N. (2017). Managing coastal pelagic fisheries: A case study of the
small-scale purse seine fishery in Kenya. Ocean and Coastal Management, 144,
31–39. https://doi.org/10.1016/j.ocecoaman.2017.04.013
Olivier, G., Manuel, B., Lionel, R., Sébastien, D. (2013). Fishing strategies, economic
performance and management of moored fishing aggregating devices in
Guadeloupe. Aquatic Living Resources, 26, 97–105.
Olorunfemi, O. D., Adekunle, O. A., Oladipo, F. O., Oladele, O. I. (2017). Training
needs of fish farmers on value addition initiatives in Kwara State, Nigeria. Sarhad
Journal of Agriculture, 33(1), 14–21.
Olsson, J. (2009). Improved road accessibility and indirect development effects:
evidence from rural Philippines. Journal of Transport Geography, 17(6), 476–483.
https://doi.org/10.1016/j.jtrangeo.2008.09.001
Olsson, J. (2010). Road investment as enabling local economic development? Evidence
from a rural Philippine fishing village. Singapore Journal of Tropical Geography,
31(3), 343–356. https://doi.org/10.1111/j.1467-9493.2010.00407.x
Ouma, S. A., Odongo, T. M., Were, M. (2017). Mobile financial services and financial
inclusion: Is it a boon for savings mobilization? Review of Development Finance,
7(1), 29–35. https://doi.org/10.1016/j.rdf.2017.01.001
Parris, H. (2010). Tuna dreams and tuna realities: Defining the term “maximising

196
economic returns from the tuna fisheries” in six Pacific Island states. Marine
Policy, 34(1), 105–113. https://doi.org/10.1016/j.marpol.2009.04.022
Pascoe, S. (2006). Economics, fisheries, and the marine environment. ICES Journal of
Marine Science, 63(1), 1–3. https://doi.org/10.1016/j.icesjms.2005.11.001
Pascoe, S., Brooks, K., Cannard, T., Dichmont, C. M., Jebreen, E., Schirmer, J.,
Triantafillos, L. (2014). Social objectives of fisheries management: What are
managers’ priorities? Ocean and Coastal Management, 98, 1–10.
https://doi.org/10.1016/j.ocecoaman.2014.05.014
Pascoe, S., Robinson, C., Coglan, L. (1996a). Economic and financial performance of
the UK. CEMARE Research Report No. 44, CEMARE, University of Portsmouth,
UK.
Pascoe, S., Robinson, C., Coglan, L. (1996b). Economic and financial performance of
the UK English Channel fleet.
Pascoe, S., Vieira, S., Thebaud, O. (2015). Allocating repairs and maintenance costs to
fixed or variable costs in fisheries bioeconomic models. Applied Economics Letters,
22(2), 127–131. https://doi.org/10.1080/13504851.2014.929619
Pauly, D. (1997). Small-scale fisheries in the tropics: Marginality, marginalization, and
some implications for fisheries management. Global Trends: Fisheries
Management, 20, 40–49.
Pauly, D., Zeller, D. (2017a). Comments on FAOs State of World Fisheries and
Aquaculture (SOFIA 2016). Marine Policy, 77, 176–181.
https://doi.org/10.1016/j.marpol.2017.01.006
Pauly, D., Zeller, D. (2017b). The best catch data that can possibly be? Rejoinder to Ye
et al. “FAO’s statistic data and sustainability of fisheries and aquaculture.” Marine
Policy, 81, 406–410. https://doi.org/10.1016/j.marpol.2017.03.013

197
Pedroza-Gutiérrez, C., López-Rocha, J. A. (2016). Key constraints and problems
affecting the inland fishery value chain in central Mexico. Lake and Reservoir
Management, 32(1), 27–40. https://doi.org/10.1080/10402381.2015.1107666
Pita, C., Pierce, G. J., Theodossiou, I. (2010). Stakeholders’ participation in the
fisheries management decision-making process: Fishers’ perceptions of
participation. Marine Policy, 34(5), 1093–1102.
https://doi.org/10.1016/j.marpol.2010.03.009
Platteau, J. (1984). The drive towards mechanization of small-scale fisheries in Kerala:
A study of the transformation process of traditional village societies. Development
and Change, 15(1), 65–103. https://doi.org/https://doi.org/10.1111/j.1467-
7660.1984.tb00174.x
Pomeroy, R. (2016). A research framework for traditional fisheries: Revisited. Marine
Policy, 70, 153–163.
Pomeroy, R., Trinidad, A. C. (1995). Industrial organization and market analysis: Fish
marketing. In G. J. Scott (Ed.), Prices, products and people: analysing agricultural
markets in developing countries. (pp. 217-238.). Boulder: Lynne Rienner.
Porter, M. (1985). Competitive advantage: Creating and sustaining superior
perfomance. New york: The Free Press.
Prescott, J., Riwu, J., Prasetyo, A. P., Stacey, N. (2017). The money side of livelihoods:
Economics of an unregulated small-scale Indonesian sea cucumber fishery in the
Timor Sea. Marine Policy, 82, 197–205.
https://doi.org/10.1016/j.marpol.2017.03.033
R Development Core Team 3.0.1. (2013). A language and environment for statistical
computing. Vienna: R Foundation for Statistical Computing. Retrieved from
http://www.r-project.org

198
Ramírez-Rodríguez, M. (2017). A profitability analysis of catch quotas for the Pacific
hake fishery in the Gulf of California. North American Journal of Fisheries
Management, 37(1), 23–29. https://doi.org/10.1080/02755947.2016.1227400
Ranjan, R. (2017). Challenges to farm produce marketing: A model of bargaining
between farmers and middlemen under risk. Journal of Agricultural and Resource
Economics, 42(3), 386–405. https://doi.org/10.22004/ag.econ.264068
Rhoades, S. A. (1993). The Herfindahl-Hirschman Index. Federal Reserve Bulletin, 79,
188–189. https://doi.org/http://www.federalreserve.gov/pubs/bulletin/default.htm
Rochet, M. J., Prigent, M., Bertrand, J. A., Carpentier, A., Coppin, F., Delpech, J. P., …
Trenkel, V. M. (2008). Ecosystem trends: Evidence for agreement between fishers’
perceptions and scientific information. ICES Journal of Marine Science, 65(6),
1057–1068. https://doi.org/10.1093/icesjms/fsn062
Rodrigo, G. C. (2012). Micro and macro: The economic divide. Retrieved May 15,
2017, from http://www.imf.org/external/pubs/ft/fandd/basics/bigsmall.htm
Rodrigues, A. R., Raggi Abdallah, P., Gasalla, M. A. (2019). Cost structure and
financial performance of marine commercial fisheries in the South Brazil Bight.
Fisheries Research, 210(October 2018), 162–174.
https://doi.org/10.1016/j.fishres.2018.10.017
Rodríguez-Garcia, J., Villasante, S. (2016). Disentagling seafood value chains: Tourism
and the local market driving small-scale fisheries. Marine Policy, 74, 33–42.
https://doi.org/10.1016/J.MARPOL.2016.09.006
Roheim, C. a., Asche, F., Santos, J. I. (2011). The elusive price premium for ecolabelled
products: Evidence from seafood in the UK market. Journal of Agricultural
Economics, 62(3), 655–668.
Roheim, C. a, Gardiner, L., Asche, F. (2007). Value of brands and other attributes:

199
Hedonic analysis of retail frozen fish in the UK. Marine Resource …, 22, 1–32.
Retrieved from http://ageconsearch.umn.edu/bitstream/47053/2/02-Roheim-06-
44.pdf
Rosales, R. M., Pomeroy, R., Calabio, I. J., Batong, M., Cedo, K., Escara, N., …
Sobrevega, M. A. (2017). Value chain analysis and small-scale fisheries
management. Marine Policy, 83, 11–21.
https://doi.org/10.1016/j.marpol.2017.05.023
Ruppert, D., Harezlak, J., Wand, M. (2018). Semiparametric Regression with R. (R.
Gentleman, K. Hornik, G. Parmigiani, Eds.). Springer.
Saaty, T. (1990). How to make a decision: The analytic hierarchy process. European
Journal of Operational Research, 48(1), 9–26. https://doi.org/10.1016/0377-
2217(90)90057-i
Saaty, T. L. (1977). A scaling method for priorities in hierarchical structures. Journal of
Mathematical Psychology, 15(3), 234–281. https://doi.org/10.1016/0022-
2496(77)90033-5
Salas, S., Chuenpagdee, R., Carlos, J., Charles, A., Seijo, J. C., Charles, A. (2007).
Challenges in the assessment and management of small-scale fisheries in Latin
America and the Caribbean. Fisheries Research, 87(1), 5–16.
https://doi.org/10.1016/j.fishres.2007.06.015
Salmi, P. (2015). Constraints and opportunities for small-scale fishing livelihoods in a
post-productivist coastal setting. Sociologia Ruralis, 55(3), 258–274.
https://doi.org/10.1111/soru.12095
Sambuo, D., Kirama, S. (2018). Fish price determination around Lake Victoria,
Tanzania: Analysis of factors affecting fish landing price. Global Business Review,
1–16. https://doi.org/10.1177/0972150917811509

200
Samoilys, M. A., Osuka, K., Maina, G. W., Obura, D. O. (2017). Artisanal fisheries on
Kenya’s coral reefs: Decadal trends reveal management needs. Fisheries Research,
186, 177–191. https://doi.org/10.1016/j.fishres.2016.07.025
Schmitt, K. M., Kramer, D. B. (2009). Road development and market access on
Nicaragua’s Atlantic coast: Implications for household fishing and farming
practices. Environmental Conservation, 36(4), 289–300.
https://doi.org/10.1017/S0376892910000159
Schmitz, H. (2005). Value chain analysis for policy-makers and practitioners. ILO.
Shamsuzzaman, M. M., Islam, M. M. (2018). Analysing the legal framework of marine
living resources management in Bangladesh: Towards achieving Sustainable
Development Goal 14. Marine Policy, 87, 255–262.
https://doi.org/10.1016/j.marpol.2017.10.026
Sharp, M. (2011). The benefits of fish aggregating devices in the Pacific. SPC Fisheries
Newsletter, 135, 28–36.
Simon, H., Christophe, B., Roberto, R.-G. (2007). Investing in African fisheries:
building links to the Millennium Development Goals. Fish and Fisheries, 8(3),
211–226. Retrieved from http://dx.doi.org/10.1111/j.1467-2679.2007.00251.x
Sjöberg, E. (2015). Pricing on the fish market — does size matter? Marine Resource
Economics, 30(3), 277–296.
Smith, I. R. (1979). A research framework for traditional fisheries. ICLARM Studies and
Reviews No. 2. International Center for Living Aquatic Resources Management,
Manila., (2), 45.
Smith, M. D., Roheim, C. A., Crowder, L. B., Halpern, B. S., Turnipseed, M., Anderson,
J. L., … Selkoe, K. A. (2010). Sustainability and global seafood. Science.
https://doi.org/10.1126/science.1185345
201
Soma, K. (2003). How to involve stakeholders in fisheries management — A country
case study in Trinidad and Tobago. Marine Policy, 27(1), 47–58.
https://doi.org/10.1016/S0308-597X(02)00050-7
Sowman, M., Sunde, J., Raemaekers, S., Schultz, O. (2014). Fishing for equality: Policy
for poverty alleviation for South Africa’s small-scale fisheries. Marine Policy, 46,
31–42. https://doi.org/10.1016/j.marpol.2013.12.005
Spronk, R. (2014). Exploring the middle classes in Nairobi: From modes of production
to modes of sophistication. African Studies Review, 57(1), 93–114.
https://doi.org/10.1017/asr.2014.7
Stevens, K., Irwin, B., Kramer, D., Urquhart, G. (2014). Impact of increasing market
access on a tropical small-scale fishery. Marine Policy, 50, 46–52.
https://doi.org/10.1016/j.marpol.2014.05.007
Sunoko, R., Huang, H. W. (2014). Indonesia tuna fisheries development and future
strategy. Marine Policy, 43, 174–183. https://doi.org/10.1016/j.marpol.2013.05.011
Teh, L. C. L., Sumaila, U. R. (2011a). Contribution of marine fisheries to worldwide
employment. Fish and Fisheries, 14(1), 77–88. https://doi.org/10.1111/j.1467-
2979.2011.00450.x
Teh, L. S. L., Teh, L. C. L., Sumaila, U. R. (2011b). Quantifying the overlooked socio-
economic contribution of small-scale fisheries in Sabah, Malaysia. Fisheries
Research, 110(3), 450–458. https://doi.org/10.1016/j.fishres.2011.06.001
Tejada, J. J., Raymond, J., Punzalan, B. (2012). On the misuse of Slovin’s formula. The
Philippine Statistician, 61(1), 8.
Thilsted, H. S., Thorne-lyman, A., Webb, P., Bogard, R. J., Subasinghe, R., John, M.,
Hugh, E. (2016). Sustaining healthy diets: The role of capture fisheries and
aquaculture for improving nutrition in the post-2015 era. Food Policy, 61, 126–131.

202
https://doi.org/10.1016/j.foodpol.2016.02.005
Thyresson, M., Crona, B., Nystrom, M., de la Torre-Castro, M., Jiddawi, N. (2013).
Tracing value chains to understand effects of trade on coral reef fish in Zanzibar,
Tanzania. Marine Policy, 38, 246–256.
Tuda, A. O., Stevens, T. F., Rodwell, L. D. (2014). Resolving coastal conflicts using
marine spatial planning. Journal of Environmental Management, 133, 59–68.
https://doi.org/10.1016/j.jenvman.2013.10.029
Turay, F., Verstralen, K. (1997). Costs and earnings in artisanal fisheries: Methodology
and lessons learned from case studies, Programme for the Integrated Development
of Artisanal Fisheries in West Africa. IDAF/WP/100. Cotonou.
Turyahabwe, N., Tumusiime, D. M., Yikii, F., Kakuru, W., Barugahare, V. (2017).
Awareness, perceptions and implementation of policy and legal provisions on
wetlands in Uganda. African Journal of Rural Development, 2(May 2016), 161–
174.
UCLA. (n.d.). Logit regression, R data analysis examples. Retrieved October 10, 2018,
from https://stats.idre.ucla.edu/r/dae/logit-regression/
UN. (2003). Handbook of national accounting. National accounts: A practical
introduction. New York.
UNEP. (1998). Eastern Africa atlas of coastal resources, Kenya. United Nations
Environment Programme. https://doi.org/10.1007/s13398-014-0173-7.2
US Department of Justice. (2017). Concentration and market shares. Retrieved July 3,
2017, from https://www.justice.gov/atr/15-concentration-and-market-shares
USAID. (2008). The Kenya capture fisheries value chain: an AMAP-FSKG value chain
finance case study.
Verweij, M. C., van Densen, W. L. T., Mol, A. J. P. (2010). The tower of Babel:

203
Different perceptions and controversies on change and status of North Sea fish
stocks in multi-stakeholder settings. Marine Policy, 34(3), 522–533.
https://doi.org/10.1016/j.marpol.2009.10.008
Viaene, J., Gellynck, X. (1995). Structure, conduct and performance of the European
food sector. European Review of Agricultural Economics, 22(3), 282–295.
https://doi.org/10.1093/erae/22.3.282
Villasante, S., Rodrıguez-Gonzalez, D., Antelo, M., Susana Rivero-Rodrıguez, Joseba,
L.-N. (2013). Why are prices in wild catch and aquaculture industries so different?
Ambio, 42, 937–950.
Wamukota, A. (2009). The structure of marine fish marketing in Kenya: The case of
Malindi and Kilifi districts. Western Indian Ocean J. Mar. Sci, 8(2), 215–224.
Wamukota, A., Brewer, T. D., Crona, B. (2014). Market integration and its relation to
income distribution and inequality among fishers and traders: The case of two
small-scale Kenyan reef fisheries. Marine Policy, 48, 93–101.
https://doi.org/10.1016/j.marpol.2014.03.013
Wamukota, A. W., Crona, B., Osuka, K., Daw, T. M. (2015). The importance of
selected individual characteristics in determining market prices for fishers and
traders in Kenyan small-scale fisheries. Society and Natural Resources, 28(9), 959–
974. https://doi.org/10.1080/08941920.2015.1014600
Wamukota, A. W., McClanahan, T. R. (2017). Global fish trade, prices, and food
security in an African coral reef fishery. Coastal Management, 45(2), 143–160.
https://doi.org/10.1080/08920753.2017.1278146
Wanyonyi, I. N., Wamukota, A., Mesaki, S., Guissamulo, A. T., Ochiewo, J. (2016a).
Artisanal fisher migration patterns in coastal East Africa. Ocean and Coastal
Management, 119, 93–108.

204
https://doi.org/https://doi.org/10.1016/j.ocecoaman.2015.09.006
Wanyonyi, I. N., Wamukota, A., Tuda, P., Mwakha, V. A., Nguti, L. M. (2016b).
Migrant fishers of Pemba: Drivers, impacts and mediating factors. Marine Policy,
71, 242–255. https://doi.org/https://doi.org/10.1016/j.marpol.2016.06.009
Webber, C. M., Labaste, P. (2010). Building competitiveness in Africa’s agriculture: A
guide to value chain concepts and applications. Washington: The International
Bank for Reconstruction and Development / The World Bank.
Wever, L., Glaser, M., Gorris, P., Ferrol-Schulte, D. (2012). Decentralization and
participation in integrated coastal management: Policy lessons from Brazil and
Indonesia. Ocean and Coastal Management, 66, 63–72.
https://doi.org/10.1016/j.ocecoaman.2012.05.001
Whitmarsh, D., James, C., Pickering, H., Neiland, A. (2000). The profitability of marine
commercial fisheries: a review of economic information needs with particular
reference to the UK. Marine Policy, 24, 257–263.
Wind, Y., Saaty, T. L. (1980). Marketing applications of the Analytic Hierarchy
Process. Management Science. https://doi.org/10.1287/mnsc.26.7.641
Yamane, T. (1967). Elementary sampling theory. New Jersey: Prentice-Hall, Inc.
Ye, Y., Barange, M., Beveridge, M., Garibaldi, L., Gutierrez, N., Anganuzzi, A.,
Taconet, M. (2017). FAO’s statistical databases and the sustainability of fisheries
and aquaculture: Comments to Pauly and Zeller 2017. Marine Policy, 81, 401–405.
https://doi.org/10.1016/j.marpol.2017.03.012
Yeeting, A. D., Bush, S. R., Ram-Bidesi, V., Bailey, M. (2016). Implications of new
economic policy instruments for tuna management in the Western and Central
Pacific. Marine Policy, 63, 45–52. https://doi.org/10.1016/j.marpol.2015.10.003

205
APPENDICES
Appendix 1: Individual survey questionnaire
This study on value chains of small-scale fisheries is part of PhD work at Pwani
University, Kilifi. You have been randomly nominated as a respondent to answer some
questions. Kindly assist me by answering questions to the best of your understanding. I
assure that confidentiality will be observed. You may interject at any point for clarification
or questions you are uncomfortable with. Thank you in advance for your cooperation.
Data Collector Initials: ……………... Date: ………….....Study site………………
Main Occupation…………….. Main gear………………………………
Section A: Demographic data.
1. Respondent’s name: …………….….(For fishers, target Captain of the vessel only)
Name of boat/business………….……………Tel No: ……………………….
2. Sex: …………………Number of years in school ………………………………
3. Age: …………………..Marital status………………………
4. No. of dependents below (Watu wangapi wanakutegemea)
Below 18 years Above 18 years
5. How long have you been in fish related activities? (Umekua katika shughuli za
samaki hapa kwa muda gani?)
6. How long in this area? (Muda gani katika sehemu hii?)
7. Where is your home origin? (Nyumbani ulikotoka ni wapi?)

206
8. If from elsewhere, when and why did you relocate here? (Ni lini na mbona ukahamia
hapa?)
Section B: Socio-economic data.
9. List your occupations? rank the occupations in importance of income generation
(from most important) (Taja shughuli zako muhimu za kuleta mapato?
Orodhesha shughuli hizi kuanzia iliyo muhimu zaidi kimapato?)
List occupations Rank in importance of income
1.
Section C: Inputs and costs
a) Investment costs
10. List equipment you use in your business? What is its ownership and costs in Kshs?
(Note: This refers to equipment only and not materials). (Taja umiliki wa vyombo na
vifaa vya kufanyia kazi, gharama ya ununuzi na mwaka wa kuvinunua?)
List Equipment
e.g. (Gear, boat,
engine, sail,
transport means,
ice box, freezer)
Chombo au kifaa
Ownership
Umiliki
If yes;
cost of
purchase
Bei
Age of
equipment/
year of
purchase
Mwaka wa
kununua
If not
owned;
the cost
of rent/
day
Sources of
inputs
(location)
Yes/ No
Have the costs been given to you by the owner of the gears ……………….
b) Operational costs (Fixed and variable)
11. What is the cost of equipment repair per week? Who bears it? Indicate share
arrangement of costs. (Inakugharimu pesa ngapi kurekebisha vyombo na vifaa
vinapoharibika kwa kila wiki?Na inachukua muda gani kurekebisha kila wiki?)

207
Costs borne by; Mwenye
gharama
Type of
equipment
(Chombo
au kifaa)
Repair costs/
week in Kshs.
(Gharama ya
kurekebisha)
Hours taken to
repair/ week?
(Muda wa
kurekebisha
kila wiki)
Myself/
crew
only
Jointly
with
owner
Owner
only
12. If a fisher using engine boat, what is the fuel consumption and it’s cost per day and
who bears it? Indicate share arrangement of costs (Unatumia mafuta kiasi gani kwa
chombo, gharama yake ni ngapi, na nani anaisimamamia?)
Costs borne by; (Mwenye gharama)
Fuel amount in Litres if
applicable
(Unatumia mafuta kiasi gani?)
Myself /
crew only
Jointly with
owner of fish
Owner of fish
only
Kusi
Kaskazi
13. What type of transport do you use to reach the market or arrive at work, it’s cost
per day and who bears it? Indicate share arrangement of costs (Unatumia usafiri wa
aina gani kusafirisha samaki sokoni na gharama ni ya nani?)
Costs borne by; (Mwenye gharama)
Means of transport e.g boat,
mkokoteni labour, canoe,
bicycle, motorcycle, public
transport, truck. (Aina ya
usafiri)
Cost of
transport
Myself /
crew
only
Jointly
with
owner of
fish
Owner of
fish only
14. What are other associated costs per day? Who bears them? Indicate share
arrangement of costs (Taja gharama nyingine za kila siku? Mfano; chambo, leseni,
mawasiliano, malazi, chakula wakati wa kazi)

208
Costs borne by; (Mwenye gharama)
Type of cost e.g
(bait, license,
BMU registration
fee, cess,
anchorage,
communication,
accommodation
and food during
work only) (Aina
ya gharama)
Kusi-
cost per
day
(Gharam
a ya kila
siku-
Kusi)
Kaskazi-
cost per
day
(Gharam
a ya kila
siku-
Kaskazi)
Mysel
f /
crew
only
Jointly
with
owner
of fish
Owner
of fish
only
Sources of
inputs
(location)
b) Fish handling, value addition and associated costs
15. In what condition/rule e.g. (size, composition and freshness) does the buyer require
the fish to be in? What are the consequences of not meeting the requirements e.g.
(lowered price, rejected)? (Wanunuzi wanahitaji samaki wako wawe katika hali
/masharti gani? Mfano; ubora, ukubwa, aina, jeraha? Je kutotimiza haya masharti
kuna adhari gani?)
Condition /rule
(Masharti)
Type of buyer
(Aina ya mnunuzi)
Consequences of not meeting
requirement (Athari za kutotimiza )
16. How do you process/preserve your fish e.g. (ice-chilled, frozen, salted, sun dried,
smoked, gutted, filleted, frying, salting or no preservation)? Who bears the cost? If
shared state the share arrangement (Unatayarisha samaki wako namna gani?Mfano;
kutia chumvi na kukausha, kukaanga, kutia barafu. Gharama yake ni pesa ngapi kila
siku, na ni nani anayesimamia gharama hii?)
Costs borne by; (Mwenye gharama)
Type of preservation/
processing
Cost per
day
Myself /
crew only
Jointly with
owner of fish
Owner of
fish only
17. What quantity of fish gets spoilt in Kg per month during? (Ni kilo ngapi za samaki
wako zinaharibika kila mwezi?)

209
a). Kusi (SEM)…………………………. b). Kaskazi (NEM)…………………….
Section D: Fishery products, marketing and income
Fish buying
18. *If a trader or processor; what are the five most common fish types you buy and
their prices by commonest grades. Where do you source the fish? (Taja aina tano za
samaki unazonunua kwa kawaida. Kisha elezea kuhusu bei ya kununua)
Fish type
traded/
processed
(Aina ya
samaki
unazonunua)
Commonest
Grade you buy
Gredi Large
(A) or (1) Mix-
B (B)or (2)
Smalli (C)
or(kitoweo)
Lowest
buying
price/Kg
(Bei ya
chini zaidi
kwa Kilo)
Highest
buying
price/Kg
(Bei ya
juu zaidi
kwa Kilo)
Average
buying
price/Kg
(Bei ya
kawaida
kwa Kilo)
Source of
fish;
(Unanunu
a wapi?)
Fish selling
19. What is the selling price of the five most common fish types you deal with, their
commonest grades and destination? (Taja aina tano za samaki unazouza kwa
kawaida. Kisha elezea kuhusu bei ya kuuza)
Fish type
caught/
traded/
processed
(Aina ya
samaki
unazouza)
Commonest
Grade you
sell
(Gredi
Large (A)
or (1) Mix-
B (B)or (2)
Smalli (C)
Kusi Kaskazi Lowest
selling
price/Kg
(Bei ya
chini
zaidi ya
kuuza
kwa
Kilo)
Highest
selling
price/
Kg
(Bei ya
juu
zaidi ya
kuuza
kwa
Kilo)
Average
selling
price/Kg
(Bei ya
kawaida
ya kuuza
kwa
Kilo)
Customer
market;
(Unauzia
nani?)
20. If lowest and highest prices are different, what causes the variations? (Kwa nini bei
ya samaki ni tofauti katika nyakati tofauti?)

210
21. If a trader or processor; from how many boats do you buy from?…………
22. If a trader or processor; do you have arrangements with these boats?
Yes…………….No…………
23. What quantity of fish in Kgs do you catch/trade/process per day and what is your
daily income variation in Kshs? (These refers to the fishing unit/boat) (Kwa kila
siku ni kiasi gani cha samaki unanunua/ unashika na mapato yako ni ngapi?)
Quantity
Lowest quantity
your boat catches
or sold (Kiasi cha
chini zaidi)
Highest quantity your
boat catches or sold
(Kiasi cha juu zaidi)
Average quantity
your boat catches or
sold
(Kiasi cha kawaida/
wastani)
Kusi
Kaskazi
Lowest buying
amount & revenue
from fish sales before
costs (Ununuzi na
mauzo ya chini zaidi
kabla ya kutoa
gharama)
Highest buying
amount & revenue
from fish sales before
costs (Ununuzi na
Mauzo ya juu zaidi
kabla ya kutoa
gharama)
Average buying
amount & revenue
from fish sales
before costs
(Ununuzi na mauzo
ya kawaida/
wastani kabla ya
kutoa gharama)
Kusi Buying
Selling
Kaskazi Buying
Selling
24. On average, what amount of fish in (Kg) goes to personal consumption or gifts/fees
(Kwa kadri ni kiasi gani cha samaki wewe/nyinyi hutenga kwa kitoweo, zawadi ama
ada kila siku?)
Home consumption Gifts

211
25. What amounts of fish on a typical day do you commonly sell to the following
destinations per day? (Unauza kiasi gani cha samaki kwa wateja wafuatao kila
siku?)
Market destination
Local
consumer
(Walaji
wa hapa)
Small Scale Trader/
Restaurant/ Mama
karanga (Matajiri
wadogo wadogo na
vibanda hapa)
Fish Shop
Dealer /
Middlemen
(matajiri
wakubwa)
Beach
Hotels
(Mahoteli )
Amount in
Kgs
Place
26. If trader/processor; do you buy fish usually from only one specific supplier or
multiple suppliers every day? (Je unanunua samaki kutoka wauzaji/wavuvi maalum
kila siku na kwa nini? Ni nani anayeweka bei?)
Tick appropriately
Suppliers / fishers
(Wauzaji/wavuvi)
Single
Multiple
27. Who determines the price?
28. If price is not determined by self, why?
29. Do you sell your fish usually to only one specific or multiple trader/s every day? (Je
unauza samaki kwa wauzaji maalum pekee kila siku?)
Tick appropriately
Trader (Mnunuzi) Single
Multiple
30. Who determines the price? (Nani anayeweka bei?)
31. If price is not determined by self, why? (Kama sio wewe, kwa nini?)
32. Do you usually know at what price colleagues are buying or selling fish?
(Je unajua ni bei gani wavuvi, mama karanga na matajiri wanauza samaki?)

212
Yes No
Buying
Selling
33. If yes, how do you usually know? (Hua unajua bei ya wengine namna gani?)
34. If knows the price of others, do you discuss to set the price? (Huwa mnajadiliana na
kuweka bei ya kunua au kuuza?)
Yes No
Buying
Selling
35. On average how many fulltime crews/assistants do you engage in your fish business/
fishing unit per day? (Ni kadri mabaharia / watu wangapi unafanya nao kazi ya
samaki kila siku) (This targets crew or employees if applicable)
36. If a fisher; how do you share the catch amongst crew, gears and boat owner?
(Je mnagawana mapato ya samaki kwa mafungu mangapi?)
Share for Crew Share gear Share for Boat Share Engine
37. If fisher, is catch share arrangement done after off-setting operational costs?
(Je mnagawana kwa mafungu badaa ya kutoa gharama?)
Yes No
38. On average how much time do you spend in your fish related activity per day? (Kwa
kadri, ni muda gani inakuchukua kufanya shughuli za samaki kutoka kuanza hadi
kukamilisha?) (This refers to total time taken from home to completion of business).
Start time End time Total time taken
39. How many days per week do you fish/trade/ process fish during? (Unafanya
shughuli za samaki kwa siku ngapi kwa wiki katika majira yafuatayo?)
a). Days/week: Days/Kusi (SEM)………. b). Days/Kaskazi (NEM)…………

213
c). Months/year: Months/Kusi (SEM)…… ….d). Months/Kaskazi (NEM)………
Section F: Support services and regulatory framework
a) Access to capital/credit
40. Do you operate a bank account? (Je una njia ya kuweka pesa zako kwenye benki
ama mashirika mengine ya kifedha?)
Yes No
Comments
41. Have you ever got a bank loan? (Umewahi pata mkopo kutoka kwa benki? Kama
hujawai pata mkopo ni kwa nini?)
Yes No
42. *If not? State reasons.
43. Do you save your money through Merry-go-rounds or chama?
Yes No
44. Do you use any of the mobile savings schemes? (e.g. M-shwari and M-Benki (KCB)
etc.)? (Je unatumia njia ya kuweka pesa kwenye benki kwa kutumia simu? Mfano;
M-swari au M-Benki?)
Yes No
45. *If uses mobile savings system, why do you prefer this mode? (Je ni kwanini
unapendelea kuweka pesa kwa kupitia simu?)
46. Do you use mobile phone money transfer services in your fish business/activity?
(e.g. M-pesa and airtel money etc.). (Je unatumia simu ya rununu kutuma au
kupokea pesa? Mfano; M-pesa, Airtel money).

214
If uses mobile phone transfer system, what do you use it for?
(Je unaitumia kufanyia nini?)
47. Who finances your daily operational costs? (Je unadhaminiwa na nani katika
shughuli zako za samaki kila siku na ni kwa masharti gani?)
Source (e.g.
bank, grant,
micro-finance,
middlemen,
Mobile money)
(Mtaji. Mfano;
Benki, mtajiri)
Amount Interest
rate
(Riba)
Repayment
period in
months
(Muda wa
kulipa)
Condition (e.g. need for
collateral, staggered monthly
premium payments, must
sell fish to middleman etc.)
(Masharti ya kulipa. Mfano;
title ya shamba, lazima
kuuzia tajiri, lazima tajiri
kuweka bei)
48. What was the source of your start-up capital/credit (to purchase your equipment and
cater for operational costs) and what were the amounts? (Je ulipata mtaji wako wa
kwanza wa kuanzia shughuli zako za samaki wapi?)
Source (e.g.
bank, grant,
micro-finance,
middlemen,
Mobile money)
Mtaji. Mfano;
Benki, mtajiri,
Amount Interest
rate
Riba
Repayment
period in
months
Muda wa
kulipa
Condition (e.g. need for
collateral, staggered monthly
premium payments, must sell
fish to middleman etc.)
Masharti ya kulipa. Mfano;
title ya shamba, lazima
kuuzia tajiri, lazima tajiri
kuweka bei
49. What would be the start-up capital today for the same business? (Inagaharimu kiasi
gani cha fedha kuanzisha shughuli hii leo?)
Yes No

215
b) Institutional support
50. Have you received institutional support on the following? If yes name institutions
(Je umewahi pata aina ya misaada ifuatayo? Ni nani aliyekufadhili?)
Tick
Yes No Type No. Institution/s
Equipment supply (Vyombo na vifaa vya
kazi)
Training (Mafunzo)
Assistance to access credit (Msaada
kupata mkopo)
Assistance to access markets
(Msaada kupata soko)
Others:
51. What other training do you require? (Je ni mafunzo mengine yapi unahitaji?)
c) Regulatory aspects in Kenya (Likert scale)
In the following statements, I request that you agree or disagree with them. (Kwa
maoni yafuatayo nakuomba ukubali ama ukatae)
52. Government has promoted cooperation between fisheries operators (Serikali
imedumisha ushirikiano baina ya wenye shughuli za samaki?)
Strongly
disagree
Sikubali
kabisa
Disagree
Sikubali
Undecided
Sina
uhakika/
sijui
Agree
Nakubali
Strongly
agree
Nakubali
kabisa
Central Government
County Government
Comments:
53. Government has supported your BMU? (Serikali imeboresha BMU yenu?)

216
Strongly
disagree
Sikubali
kabisa
Disagree
Sikubali
Undecided
Sina
uhakika/
sijui
Agree
Nakubali
Strongly
agree
Nakubali
kabisa
Central Government
County Government
Comments:
54. Government promoted fish marketing (Serikali imeboresha uuzaji wa samaki)
Strongly
disagree
Sikubali
kabisa
Disagree
Sikubali
Undecided Sina
uhakika/ sijui
Agree
Nakubali
Strongly
agree
Nakubali
kabisa
Central
Government
County
Government
Comments:
55. Government has helped you in value addition? (Serikali imekusaidia katika
kuongeza dhamani ya samaki; mfano kutayarisha samaki ?)
Strongly
disagree
Sikubali
kabisa
Disagree
Sikubali
Undecided Sina
uhakika/ sijui
Agree
Nakubali
Strongly
agree
Nakubali
kabisa
Central
Government
County
Government
Comments:
56. Government has helped you in provision of equipment? (Serikali imekusaidia kwa
vifaa)
Strongly
disagree
Sikubali
kabisa
Disagree
Sikubali
Undecided Sina
uhakika/ sijui
Agree
Nakubali
Strongly
agree
Nakubali
kabisa
Central
Government
County
Government
Comments:

217
57. Government has helped you to promote fish handling, hygiene and quality? (Serikali
imekusaidia kudumisha ubora wa samaki; mfano kutoa mitambo ya barafuu na
mafunzo?)
Strongly
disagree
Sikubali
kabisa
Disagree
Sikubali
Undecided
Sina uhakika/
sijui
Agree
Nakubali
Strongly
agree
Nakubali
kabisa
Central
Government
County
Government
Comments:
58. Government Officials provide extension services (Maafisa wa Serikali huwa
wanakutembelea na kukupa mawaidha kuhusu shughuli za samaki?)
Strongly
disagree
Sikubali
kabisa
Disagree
Sikubali
Undecided Sina
uhakika/ sijui
Agree
Nakubali
Strongly
agree
Nakubali
kabisa
Central
Government
County
Government
Comments:
59. Has there been any research conducted in this area that you know of and by whom?
(Kuna utafiti gani uliofanywa hapa kwenu kuhusu samaki nan i nani aliyefanya?)
60. *If yes The research results have been beneficial to me/us (Matokeo ya utafiti
yametufaidi)
Strongly
disagree
Sikubali
kabisa
Disagree
Sikubali
Undecided Sina
uhakika/ sijui
Agree
Nakubali
Strongly
agree
Nakubali
kabisa
Central
Government
County
Government
Comments:

218
Certificate of consent
I have understood the foregoing information. I have had the opportunity to ask questions
about it and all my questions have been answered to my satisfaction. I therefore give my
consent to voluntarily participate as a respondent in this research.
Name of participant:
Signature of participant:
Date
Day/Month/Year
Statement by the researcher/person taking consent

219
Appendix 2: Focus group discussions questionnaire
This part of the study addressed the following:
1. Objective 4: analyze constraints and opportunities existing in the value chain
2. Key Research Question 4: What are the constraints facing actors and
opportunities for improvement of the value chain?
Based on researcher’s field experience during field interviews, respondents were selected
based on experience, reliability and ability to analytically discuss issues at hand. About 6-
12 respondents amongst fishers, middlemen and processors participated from each site.
Questions addressed
1. List most important success factors in advancement of your business and
profitability (training, costs, credit, fish supply, markets etc.)
2. Which of these factors is a challenge/constraint to attain? Score severity of each
constraint using the Analytical Hierarchical Process (AHP) ranking method by
applying the pairwise comparison (Saaty, 1977; Wind & Saaty, 1980).
Constraints
Score of importance (Equal importance=1, Moderate
importance=3, Strong importance=5, Very strong importance=7,
Extreme importance=9)
3. What do you think can be done in order to attain success (opportunities)? Score
priority for each opportunity using the AHP ranking method
Opportunities
Score of importance (Equal importance=1, Moderate
importance=3, Strong importance=5, Very strong importance=7,
Extreme importance=9)