economic development and institutional quality in uruguay
TRANSCRIPT

1
Economic development and institutional quality in Uruguay:
contract enforcement, investment and growth since 18701
Sebastián Fleitas♦
Andrés Rius♦
Carolina Román♦
Henry Willebald ♦
Instituto de Economía, Facultad de Ciencias Económicas y de Administración,
Universidad de la República, Uruguay.
Abstract
Institutional quality constitutes a central concept in the recent economic
development and institutionalist literatures. Our hypothesis is that difficulties to
promote and sustain the enforceability of contracts and the security of property
rights conditioned investment and, in consequence, economic growth in Uruguay
in the long run. We first review the concepts and the approaches to define and
measure institutional quality. We then adopt a measure of “institutional quality”
based on the use of ”contract intensive money” (the CIM indicator). Using our
long series for the CIM indicator, we estimate a structural model to explore the
plausibility of our hypothesis. In the estimation, based on the seemingly unrelated
regression method (SUR), we find support for the thesis that institutional quality
influences growth through its impact on investment. Put differently, our results
suggest that poor contract enforcement played a significant role at the origins of
the Uruguay’s failure and its experience of long-run decline.
Keywords: Institutional quality, Contract intensive money, investment, Uruguay
JEL: N16, N26, N46, O43
1 This paper is part of the Project “Instituciones e Inversión en el Uruguay”, CSIC, I+D. ♦ Authors email addresses are, respectively: [email protected]; [email protected]; [email protected] and [email protected]

2
Introduction
Institutional quality constitutes a central concept in the recent economic development and
institutionalist literatures. Our hypothesis is that inadequate contract enforcement and insecure
property rights affected investment and, in consequence, undermined long run economic
performance in Uruguay. After discussing the literature, we estimate a measure of “institutional
quality” using the ”contract intensive money” indicator (CIM). We examine the long term series
(from 1870 to 2010) and discuss it in light of the informed conventional wisdom among
historians about Uruguay’s development process. We find that the indicator’s trajectory matches
the intuitions about quality of institutions in Uruguay’s long range. Then we run some
econometric exercises to explore further the hypothesis that the quality of institutions has been
linked to capital accumulation and growth. The estimations based on the “seemingly unrelated
regressions” method (SUR) suggest that poor contract enforcement played a significant role at
the origins of the Uruguay’s failure and its experience of long-run relative decline.
The structure of the paper is the following. The next section reviews the literature, concepts and
summarizes the justification for the empirical work. The third section proposes our hypothesis
about the relationship between institutions, investment and growth for Uruguay in the long run,
and we describe the data we will use to test it. We then present our series to illustrate the
economic growth, the capital accumulation and the institutional quality evolution in historical
perspective. Following the methodology used by Prados de la Escosura and Sanz (2006 & 2009)
and by Clague et al (1999) we then approach the analysis in a dual manner. The fourth section
examines the CIM series against the backdrop of the economic and political/policy record for
the period under study. The fifth section presents an exercise of estimation where we employ the
seemingly unrelated regression method (SUR) to discern the empirical patterns of influence
among variables. Finally, we provide some concluding remarks.
Background, concepts and justification 2
Conceptual framework
The research on the effects of institutions on aggregate economic performance has grown very
rapidly since the early 1990s, stimulated by the theoretical contributions of Douglass North and
the New Institutional Economics (NIE) school as well as by empirical findings from
“augmented” growth models (see North, 1990; Shirley, 2008). This growth of knowledge has
2 This section relies heavily on Aboal, Noya and Rius (2011).

3
yielded no unanimity but there seems to be a strong consensus in the sense that institutions
matter for the allocation of a society’s effort and ingenuity, for the accumulation of productive
assets and, ultimately, for growth. Yet, there is still a broad agenda for theoretical and empirical
work, because there is a variety of institutions that could matter for a number of important
economic processes, and testing plausible hypotheses requires potentially controversial
interpretations, operationalizations, and measurement of key concepts. To specify the narrow
portion of that agenda that this paper aims to address, it is then sensible to look back at one of
its foundational texts (North, 1990) for organization of key concepts.3
According to North, economic exchanges inevitably involve transaction costs and asymmetries
of information, and it is to make these manageable (and the fundamental exchange viable) that
societies devise institutions. Institutions are “the humanly devised constraints that shape human
interaction” (North, 1990, p. 3; all the following page citations from the same volume). They
can be formal or informal, and their main difference is that formal institutions are written (and
they may include a written code for how to reach settlement of disputes). For North, formal
institutions only differ in degrees of strength, coercive power or broader legitimacy from
informal ones (p. 46). “Formal rules include political (and judicial) rules, economic rules, and
contracts” (p. 47). As with regards to informal institutions, they can be “(1) extensions,
elaborations, and modifications of formal rules, (2) socially sanctioned norms of behavior, and
(3) internally enforced standards of conduct.” (p. 40). They may also stipulate enforcement
mechanisms, as we will see.
The whole theory of institutions and economic performance advocated by North rests on the
adoption of new institutional arrangements as the agents’ response to the increasing complexity
of economic transactions. In pre-modern societies, transactions were essentially personalized
exchanges among “neighbors”, and production and trade was in small scales. Reputation and the
risk of isolation from a community could function effectively to prevent or address
opportunism. Gradually, impersonal exchanges among more distant parties became more
frequent and economically significant, which led to the emergence of informal institutions with
more explicit enforcement arrangements (these would include, for example, the ostracism of
those who violated agreements, stipulated in unwritten codes of commercial conduct; p. 43).
With complex contracts that contain many hard-to-measure attributes about exchanged goods
and services, and that are plagued by information asymmetries; and with the geographic 3 North’s and mainstream NIE’s frameworks are not free of conceptual problems (see, for example, Rutherford, 1994; Rodrik, 2000; Field, 2006). However, it is appropriate to borrow basic definitions from the original source, given that these definitions are widely used, and the framework provides a basic benchmark to which complications or refinements can be compared.

4
expansion of trade and the chances that transactions may never be repeated between the same
two parties, it became necessary to devise third-party enforcement. In fact, it would be more
appropriate to say that in modern societies the three forms of exchanges (and enforcement
arrangements) co-exist, and even archaic and seemingly dysfunctional informal rules can have
major impacts, as demonstrated by the evidence that the same formal rules introduced in
different societies often produce different outcomes (p. 36).
Enforcement poses no problem when it is in the interests of the other party to live up to agreements. But without institutional constraints, self-interested behavior will foreclose complex exchange, because of the uncertainty that the other party will find it in his or her interest to live up to the agreement. (p. 33)
Enforcement can come from societal sanctions, from second-party retaliation or from a coercive
third party (typically, the State), and the long-range economic history of the world shows each
of these forms prevailing in different times-places.4
As noted by Acemoglu and Johnson (2005), the NIE has persuaded many economists and
political scientists that institutions are a primary determinant of economic performance.
However, in much of the literature there has been a tendency to conflate a variety of economic
institutions in a “cluster” that presumably defines a favorable business environment. In their
work, Acemoglu and Johnson distinguish contracting institutions, which are the institutions
supporting private contracts, from property rights institutions, which are the institutions
constraining government and elite expropriation. With these authors, we also note that there is
much overlap between the two types (inadequate enforcement of bilateral private contracts
could result in expropriation, and constraints on governments’ expropriatory powers could be
contained in seemingly voluntary bilateral contracts such as those for a concession to build
basic infrastructure).
There is a range of possible institutional innovations that may directly or indirectly impact on
the enforcement of contracts. For example, in recent times, donor-funded legal and judicial
reform programs have tackled a number of “problems” in the laws and their enforcement (for
instance, removing perceived inconsistencies or flaws in the letter of the laws, creating non-
judicial arbitration mechanisms, facilitating access by aggrieved parties to the judicial system,
reducing various costs of litigation, strengthening the capacities of the courts and judges, etc.).
All these have some bearing on the speed and effectiveness of contract enforcement, and more
broadly on “the rule of law” (see, e.g., World Bank, 2001). Moreover, other policies not directly 4 Most of the empirical literature focuses on formal, third-party (state-backed) enforcement. However, there are more carefully executed, analytically rich and extremely interesting studies on informal institutions, such as Besley (1995).

5
connected to the contents or enforcement of written laws, may directly impact on the
effectiveness of extant mechanisms for contract enforcement. Woodruf (1998), for example,
identifies a more or less direct effect of trade liberalization on previously existing informal
enforcement mechanisms.
The hypothesis that, if it exists, the effect of contract enforcement on growth occurs (directly or
indirectly, but largely) through investment seems uncontroversial.5 Diagram 1 shows how
“institutions” have been added to conventional growth analytics in what are often called
“institutions-augmented” growth models.
Diagram 1
Institutions, investment and growth: Causal pathways
The discontinuous lines originating in “institutions” show less focal effects for the purpose of
this paper, but ones that have some presence in the literature. The line flowing back from
growth to investment acknowledges the fact that there are “demand pull” effects on the latter
that require attention in empirical analyses.
Analytically, weak enforcement of contracts has been found to impact on investment through a
number of channels. First, it could most directly influence the uncertainty surrounding an
investment project, or some of its critical activities or dimensions, and therefore influence
5 It becomes less and less controversial when one broadens the definition of investment to go beyond accumulation of tangible assets to include, e.g., investments in R&D, or in human capital.

6
investors’ decisions by reducing its net expected returns (note that we are not considering here
the risk of expropriation of assets created by the investment, which would pertain to the effects
of “property rights institutions”). Second, weak enforcement could inhibit lending, or otherwise
influence financial markets in a way that hinders investment (Acemoglu and Johnson, 2005). In
this line, some authors have found analytical grounds for the idea that “limited enforceability”
not only affects the level of firms’ investments but it also increases its “sensitivity to the arrival
of new technologies and generates greater macroeconomic volatility” (Cooley, Marimon and
Quadrini, 2004). To the extent that aggregate (output) volatility influences investment (a simple
accelerator model could show this), there is here another causal channel from enforcement of
contracts to rates/levels of capital accumulation. Others have argued that, through financial
contracts, imperfect enforcement influences the size distribution and overall heterogeneity of
firms, which could reflect on the level or rate of investment (Monge-Naranjo, 2009). These are
just examples of relevant or conceivable impact channels, of which there are a wide variety in
the literature but few that have been rigorously established.
Institutional quality and economic performance in Uruguay
Without attempting a thorough review, we can summarize the state of the debate on institutional
quality and economic performance in Uruguay by commenting briefly on some of the most
salient contributions.
In the field of economic history, there has been an increasing interest in institutional theories of
economic performance. Part of the recent literature is based on analytical descriptions of the
institutional frameworks while others reflect the institutions more explicitly in the empirical
study.
From a very long run perspective, Bértola and Porcile (2000) made some first attempts to
introduce the role of institutions within a convergence and divergence framework comparing the
Southern Cone’s performance with that of the core economies in the long run.
Another group of articles has studied the role of institutions mainly focused on the description
of the land property system, especially in the agrarian sector. On the one hand, Álvarez, Bértola
and Porcile (2007) collect several articles that introduced the impact of the land property system
in the discussion about growth and income distribution during the First Globalization,
comparing the experiences of Uruguay and Argentina with Australia and New Zealand. Within
the same approach, Alvarez et al. (2010) and Álvarez and Willebald (2009) go deeper in a
systematic description of the agrarian land ownership system. They identify some specific

7
features of the River Plate region, contrasted with the Australasian economies that may explain
the worse performance of the first group in the long run. On the other hand, Moraes (2001)
explained the long run performance of the livestock industry (cattle and sheep) during the period
1870-1970 focusing on the relation between technological change and institutional change.
An empirical study of the role of institutions on growth and income distribution is provided by
Willebald (2011). This author introduces explicitly an indicator of institutional quality in
historical perspective, the CIM indicator, to explain, among others factors, the diverse
development process of the settler economies during the First Globalization. Siniscalchi (2010)
is another prominent effort to introduce the quality of institutions in the long run performance,
but focused on the institutions constraining government. This approach would complement
some contributions coming form Political Science, such as Zurbriggen (2006), where the author
proposes a political institutional approach to explain the effect of the rent-seeking behavior
during the period of import substitution industrialization.
Oddone (2005) is another recent attempt to explain Uruguay’s performance over more than a
century giving a prominent role to “institutions”. The definition of “institutions” used is broad
and –most clearly in the empirical exercises— tends to focus on the “political rules” about who
decides what and when or under what constraints. However, the author does discuss property
rights and contract enforcement institutions, even if he does not attempt to reflect them more
explicitly in the empirical study (mainly due to lack of readily available indicators covering a
long enough span). He also partly chooses not to pursue the empirical research further because
he somehow subordinates property rights and contract integrity institutions to a broader degree
of “discretionary” power by governments (p. 179).
Interestingly enough, the “rules vs. discretion” debate had had an earlier and somewhat original
expression in another widely cited study; namely, Rama (1990). Analyzing mainly the last two
thirds of the 20th century, Rama had argued that Uruguay had done best when the governments
had been most isolated from interest group pressures. Those pressures would translate in various
forms of overt or hidden patronage, and taylor-made policies to favor specific groups or even
companies. This “patronage cum rent-seeking” explanation, which was more systematically
examined in other contributions by the same author, has to be understood as a weakening of the
rule of law, and eventually disrespect for contracts. What is worth noting is that, in Rama, it is
government “discretion” that favors economic growth rather than “rules” (perhaps because the
former is assumed to be put to constructive use when available, while the latter are too often
interest-group oriented).

8
Perhaps the study that goes deeper into the theoretical and observed complications in the
protection of property rights and enforcement of contracts in the Uruguayan context is Bergara
and Zipitría (2003), and its predecessor, Zipitría (2001). While the authors do not adopt a long
term perspective, and essentially focus more on providing an account for the observed
(contemporaneous) weak protection of investor’s rights and contracts, they are the ones that
identify these perhaps more decidedly as crucial to understanding the country’s performance.
The cited works focus on bankruptcy law and explaining its ineffectiveness more than exploring
empirically its consequences. The lead author (Bergara) explores other institutional features of
the country in the cited volume, generally with an important amount of detail about specific
formal arrangements. Yet, they rightly point out more generally that formal rules alone cannot
account for the weakness of those institutions, and that the effects of the law must be understood
in a broader institutional context.
Measuring institutional quality
The last two decades have seen efforts to generate indicators and proxies to test those and other
hypotheses (see, e.g., Knack and Keefer, 1995; Kaufman et al., 2004; Williams and Siddique,
2008). At the same time, proliferation of databases that include measures of institutional
arrangements have also stimulated the generation and empirical investigation of new research
questions (but also, sometimes, “data-driven” research that has not shed much light on the
causal chains or the robustness of meaningful theoretical hypotheses; Aaron, 2000; Keefer,
2004; Pande and Udry, 2005).
As mentioned above, the enforcement of contracts can be “private” (Hamish et al., 2000). In
these cases, it tends to be informal and will be affected by reforms to the formal enforcement
mechanisms, but also by other policy reforms (as, e.g., in Woodruf, 1998). That said, at least
since the consolidation of nation-states, national and subnational jurisdictions will have some
form of third-party, formal enforcement mechanism, and that is why quality of contract
enforcement is usually taken to be an attribute of those political entities (Djankov et al., 2003;
Acemoglu and Johnson, 2005). For those reasons, the quantitative operationalization of quality
or effectiveness of enforcement has largely been done by creating indicators that rate such
quality jurisdictions at given points in time (typically, ratings for “country-time” observations).
Four broad approaches have been followed to generate cross-section and longitudinal variation
in indicators for “quality of institutions”. In roughly chronological order, they are:
(i) Experts’ assessment: effectiveness, efficiency and/or fairness of the formal
enforcement mechanism is assessed by practitioners and other key
9
informants and conveyed and aggregated through surveys (Knack and
Keefer, 1995; but also La Porta et al. 1997, and Berkowitz et al., 2003; Staats
et al., 2000). Since several of these have been carried out by investor advise
companies, for a relatively long period of time, these indicators often permit
to introduce a diachronical perspective spanning about four decades for
major or more developed countries, and shorter periods for others.
(ii) Indirect measures based on “objective” data, such as the observed use of
“contract-intensive” money: the relative use of currency relative to contract-
intensive money is taken as an indicator of inadequate/weak contract
enforcement (Clague et al., 1999; Prados de la Escosura et al, 2009). This is
the strategy that is favored in this article, and probably the only one that
permits to have really long series of “quality of institutions” data.
(iii) Surveys of economic agents in which questions about contract enforcement
and protection of investors’ rights are asked to those that most directly bear
their effects (Brunetti et al., 1997, Dao, 2008). These have the advantage of
eventually leading to the construction of pooled cross-sections of firms, if not
proper panels; but suffer from the same constraint or a more binding one
regarding the diachronical analysis.
(iv) Quantification of time and pecuniary costs to enforce standard contracts:
Legal experts are not asked about their opinions but to estimate the time and
financial costs incurred by a private party to get its rights established when
facing breach of some universal and seemingly straightforward contracts
(e.g., collect a bounced check, or evict a delinquent tenant; Djankov et al.
2003), or more complex lending contracts (Djankov et al. 2008). This
approach has the advantage of relying in more “objective” basic data, but has
to take jurisdictions as the unit of analysis (not economic agents) and there
aren’t yet any series of observations to introduce the time dimension.
A significant body of research has focused on exploiting these data sets and the variations over
space and time of institutional factors and economic outcomes. This explains why most of the
studies in the literature are cross-section, panel or longitudinal analysis, for countries, firms or
sub-national jurisdictions as the units of analysis.6 These studies are the ones that yield
estimates of quantitative effects of (some measure) of institutional quality on aggregate
economic outcomes. Le (2004) is a good example of the conventional approach.
6 See Aboal, Noya and Rius (2011)
10
“Contract Intensive Money” and the long term analysis of institutions and performance
While there are good reasons to go beyond these readily available data sets (see the persuasive
arguments in Pande and Udry, 2005; also Rehme, 2007; Rodrik, 2005), we are of the view that
there is still value in extending the reach of studies undertaken with conventional and tried
approaches. This paper extends the “indirect measures” strategy, by using the “contract-
intensive money” (or CIM) indicator to study more than a century of a single country’s history.
The value added of the paper derives from (a) using a historical lens to critically analyze what
the indicator supposedly shows about institutions’ quality, (b) the “pull” effect on work to
estimate longer-term investment data (to pair it up with farther-reaching monetary indicators),
and (c) a conscious discussion of the econometric findings, looking as much for analytically
interesting insights as well as for lessons on methods and their potential limitations.
Clague et al. (1999, p.187) argue that the government has four crucial roles to play in contract
enforcement and the protection of property rights: (i) it provides third-party enforcement when
no self-enforcing mechanism exists; (ii) it may be the source of information about branches of
contracts; (iii) it may enforce the arrangement that private agents devise to constitute themselves
as a formal group and thus “self-enforce” contracts; and (iv) it guarantees internal peace,
preventing agents for acting as in a Hobbesian anarchy. These functions would be valuable in a
variety of historical settings. The authors then argue that, to capture the effectiveness of contract
enforcement through time, it is possible to use the societies’ reliance on non-currency money,
since such “means of payment” and “reserves of value” would not be chosen by agents that are
skeptic about the government’s willingness or capacity to enforce contracts.
The application of those ideas to developing economies is not new. Prados de la Escosura &
Sanz-Villarroya (2006, 2009) use the same concept to evaluate the role of institutional
arrangements in the long-run decline of Argentina, comparing the evolution of CIM with
Australia and Canada. Both, Clague et al. (1999) and Prados de la Escosura & Sanz-Villarroya
(2009), argue about the validity of the indicators and the evidence is convincing. “CIM is a
reflection or measure of the type of governance that improves economic performance rather
than a cause of that performance”(Clague et al., 1999, p. 189) and, in this sense, it can operate
as an instrumental variable in the historical analysis.
The main advantages of the CIM indicator as a measure of quality of contract enforcement, and
more generally as a proxy for institutional quality, are (i) that it relies on secondary quantitative
measures that are not likely to be influenced (biased) by any expert group’s subjective
assessment of how institutions worked or are working in any particular setting, and (ii) that with

11
meticulous economic-historical effort, one can build rather long series for the indicator. There
are, however, some potential downsides that must be acknowledged. On one hand, it can
arguably be a reflection, for longer or shorter periods, of depth (or repression) of the financial
system, for reasons unrelated to the respect of contracts, and it can reflect perhaps too directly
the effects of changes in macroeconomic policies even while maintaining constant the quality of
institutions (Williams and Siddique, 2008). Nonetheless, we understand that the advantages are
powerful enough to merit its further investigation, including that about methods or estimation
tactics to address the indicator’s potential shortcomings.
Data and methods
Following the methodology used by Clague et al (1999) and Prados de la Escosura & Sanz
(2006, 2009) we propose two approaches: a historical description of the evolution of the series
and an exercise of estimation where we employ the seemingly unrelated regression method
(SUR). Econometric exercises require long-run series that are typically not available in the
national statistical system, so we propose original estimates of CIM, and other variables, for the
period 1870-2010. 7
With Clague et al (1999), we define contract-intensive money (CIM) as the ratio of non
currency money to the total money supply, or (M2-C)/M2, where M2 is a broad definition of the
money supply and C is currency held outside banks. The availability of monetary statistics for
the 19th century in the case of Uruguay is limited. We use official surveys, other information and
indirect indicators to fill gaps in the series, and we elaborate series of currency in circulation
and total deposits for the period 1870-2010 in order to calculate the share of deposits in the total
money supply. For the estimation of currency in circulation we consider different sources. From
1912 on we take the currency in circulation from Banco Central del Uruguay (1971; and on-line
data available at www.bcu.gub.uy); for 1900-1911 we consider the variation of total emission
from Banco Central del Uruguay (1971). For the period before 1900 we rely on the data of total
emission reported in Eduardo Acevedo (1933, 1934) and Arocena Olivera & Graziani (1987).
For the years where there is no information (1869, 1877, 1878, 1879 and 1881) we propose
lineal interpolations.
For the estimation of the deposits we also consider different sources. From 1912 on we take the
data of total deposits from Banco Central del Uruguay (1971 and data on line) calculated as
7 Details about the methodology and data sources used to estimate the CIM (1870-2010) and the investment (1870-1954; from 1955 to the present we consider official estimates) are described in Román and Willebald (2011).
12
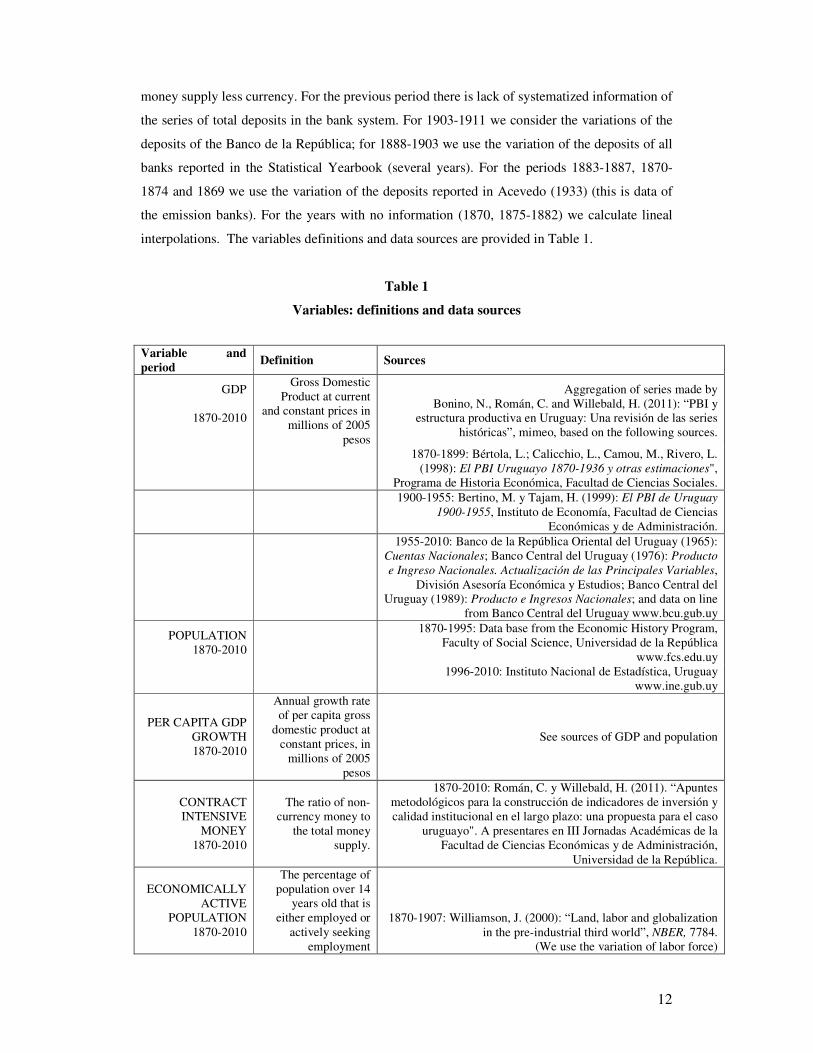
money supply less currency. For the previous period there is lack of systematized information of
the series of total deposits in the bank system. For 1903-1911 we consider the variations of the
deposits of the Banco de la República; for 1888-1903 we use the variation of the deposits of all
banks reported in the Statistical Yearbook (several years). For the periods 1883-1887, 1870-
1874 and 1869 we use the variation of the deposits reported in Acevedo (1933) (this is data of
the emission banks). For the years with no information (1870, 1875-1882) we calculate lineal
interpolations. The variables definitions and data sources are provided in Table 1.
Table 1
Variables: definitions and data sources
Variable and
period Definition Sources
GDP
1870-2010
Gross Domestic Product at current
and constant prices in millions of 2005
pesos
Aggregation of series made by Bonino, N., Román, C. and Willebald, H. (2011): “PBI y
estructura productiva en Uruguay: Una revisión de las series históricas”, mimeo, based on the following sources.
1870-1899: Bértola, L.; Calicchio, L., Camou, M., Rivero, L.
(1998): El PBI Uruguayo 1870-1936 y otras estimaciones", Programa de Historia Económica, Facultad de Ciencias Sociales.
1900-1955: Bertino, M. y Tajam, H. (1999): El PBI de Uruguay
1900-1955, Instituto de Economía, Facultad de Ciencias Económicas y de Administración.
1955-2010: Banco de la República Oriental del Uruguay (1965): Cuentas Nacionales; Banco Central del Uruguay (1976): Producto
e Ingreso Nacionales. Actualización de las Principales Variables, División Asesoría Económica y Estudios; Banco Central del
Uruguay (1989): Producto e Ingresos Nacionales; and data on line from Banco Central del Uruguay www.bcu.gub.uy
POPULATION 1870-2010
1870-1995: Data base from the Economic History Program,
Faculty of Social Science, Universidad de la República www.fcs.edu.uy
1996-2010: Instituto Nacional de Estadística, Uruguay
www.ine.gub.uy
PER CAPITA GDP GROWTH 1870-2010
Annual growth rate of per capita gross
domestic product at constant prices, in
millions of 2005 pesos
See sources of GDP and population
CONTRACT INTENSIVE
MONEY 1870-2010
The ratio of non-currency money to
the total money supply.
1870-2010: Román, C. y Willebald, H. (2011). “Apuntes metodológicos para la construcción de indicadores de inversión y calidad institucional en el largo plazo: una propuesta para el caso
uruguayo". A presentares en III Jornadas Académicas de la Facultad de Ciencias Económicas y de Administración,
Universidad de la República.
ECONOMICALLY ACTIVE
POPULATION 1870-2010
The percentage of population over 14
years old that is either employed or
actively seeking employment
1870-1907: Williamson, J. (2000): “Land, labor and globalization in the pre-industrial third world”, NBER, 7784.
(We use the variation of labor force)

13
1908-1996: Fleitas, S. y Román, C. (2010). "Evolución de la población económicamente activa en el siglo XX: un análisis de la
estructura por sexo, edad y generaciones", Boletín de la
Asociación Uruguaya de Historia Económica, Nº 9. (1908-1949 data every five years with linear interpolations; 1950-
1996 annual data). 1997-2010: CEPAL (2006): "Población Económicamente Activa",
América Latina y el Caribe, Observatorio demográfico, Year 1, Nº2, (Data every five years, with linear interpolation)
PRIMARY AND SECONDARY
ENROLLMENT 1870-2010
Proportion of population ages 5 to
18 in primary and secondary school
POPULATION 1870-1907: Interpolation with the movement of the total
population. See sources of population.
1908 and 1909-1939: Fleitas, S. y Román, C. (2010). "Evolución de la población económicamente activa en el siglo XX: un análisis
de la estructura por sexo, edad y generaciones", Boletín de la
Asociación Uruguaya de Historia Económica, Nº 9 (1909-1939 Population by five-year age group
)
1940-1945: Mitchell, B. R., (1993): International Historical
Statistics: The Americas 1750-1988, MacMillan Publishers Ltd, England. (Population by five-year age group)
1950-2010: United Nations, Department of Economic and Social Affairs, Population Division, Population Estimates and
Projections Section http://esa.un.org/unpd/wpp/unpp/panel_indicators.htm
(Population by five-year age group)
ENROLLMENT 1870-1875: Estimation of primary enrolment using a polynomial
of third order. 1870-1899: Estimation of secondary enrolment using an
exponential function.
1876 (from Primary) and 1900 (from Secondary) - 2003: Student by level. Bértola, L., Camou, M. Maubrigades, S., and Melgar, N. (2010). “Human Development and Inequality in the 20th Century:
the Mercosur Countries in a comparative perspective”, R. Salvatore, J. Coatsworth and A. Challú, Living Standards in Latin
American History. Height, Welfare and Development, 1750-2000, Harvard University Press.
2004-2010 Own estimates from Ministerio de Educación y
Cultura. Dirección de Educación, Uruguay www.mec.gub.uy
DEPENDENCY RATE
1870-2010
Percentage of population below 15
and above 64 over population ages 15 to
64
1870-1907: Interpolation based on own estimations using the data from the Census of Uruguay of 1852.
1908 and 1909-1939: Fleitas, S. y Román, C. (2010). "Evolución de la población económicamente activa en el siglo XX: un análisis
de la estructura por sexo, edad y generaciones", Boletín de la
Asociación Uruguaya de Historia Económica, Nº 9 (Population by five-year age group 1909-1939)
1955-1995: Population Division of the Department of Economic and Social Affairs of the United Nations Secretariat (data every
five years, with linear interpolation)
1996-2010: Instituto Nacional de Estadística, Uruguay. www.ine.gub.uy
INVESTMENT RATE
Investment ratio to GDP
Román, C. y Willebald, H. (2011). “Apuntes metodológicos para la construcción de indicadores de inversión y calidad institucional

14
1870-2010 en el largo plazo: una propuesta para el caso uruguayo". A presentares en III Jornadas Académicas de la Facultad de Ciencias
Económicas y de Administración, Universidad de la República.
1955-2010: Banco República Oriental del Uruguay (1965): Cuentas Nacionales, Banco Central del Uruguay (1976): Producto
e ingreso nacionales. Actualización de las Principales Variables, División Asesoría Económica y Estudios, Banco Central del
Uruguay; Banco Central del Uruguay (1989): Producto e Ingresos
Nacionales; and data on line www.bcu.gub.uy
EXPORTS RATIO 1870-2010
Ratio Export/GDP
EXPORTS 1870-1928: Donnángelo, A y Millán, I (2006): Uruguay 1970-
2003: “Un enfoque del crecimiento económico a través de la balanza de pagos”, Monografía, Facultad de Ciencias Económicas
y de Administración, Universidad de la República.
1928-1969: Azar, P. y Fleitas, S. (2007): "Impulsos y frenos: las
relaciones económicas entre Estados Unidos y Uruguay entre 1930 y 2005", Cuadernos del CLAEH 93-94. Montevideo.
1970-2010: Banco Central del Uruguay. Data on line
www.bcu.gub.uy
REAL INTEREST RATE
1870-2010
Lending interest rate adjusted for inflation as measured by price
consumption index
1870-1872: We assume the same rate as 1872 1872-1897: Obstfeld, M. and Taylor, A. (2003): "Sovereign risk, credibility and the gold standard: 1970-1913 versus 1925-1931".
The Economic Journal 113, pp. 241-275, April. 1898-1954 Own estimations made by Carolina Román
1955-2009: Fleitas y Rius (2010) "Determinantes de la Inversión en Uruguay", IV Jornadas de Investigación del Instituto de
Economía, Facultad de Ciencias Económicas y Administración; and 2010 Banco Central del Uruguay, data on line
www.bcu.gub.uy
INFLATION 1870 assumed the same as 1871
1871-1936: Bértola, L; Calicchio, L; Camou, M. and Porcile, G. (1999): “Southern Cone Real Wages Compared: A Purchasing
Power Parity Approach to Convergence and Divergence Trends,1870-1996”, Documento de Trabajo No. 44, Montevideo: Programa de Historia Económica y Social, Facultad de Ciencias
Sociales, Universidad de la Republica.
1937-2010: Instituto Nacional de Estadística, Uruguay.
www.ine.gub.uy RELATIVE PRICE
OF CAPITAL GOODS
1870-2010
The investment deflator ratio to the price consumption
index
Investment deflator: See sources for investment rate and investment at constant prices.
INVESTMENT AT CONSTANT
PRICES 1870-2010
Fixed Investment in million of 2005 pesos
1870-1955: Román, C. y Willebald, H. (2011). “Apuntes metodológicos para la construcción de indicadores de inversión y calidad institucional en el largo plazo: una propuesta para el caso
uruguayo". A presentares en III Jornadas Académicas de la Facultad de Ciencias Económicas y de Administración,
Universidad de la República.
1955-2010: Banco de la República Oriental del Uruguay (1965): Cuentas Nacionales, Banco Central del Uruguay (1976): Producto
e ingreso nacionales. Actualización de las Principales Variables, División Asesoría Económica y Estudios; Banco Central del
Uruguay (1989): Producto e Ingresos Nacionales; and Banco Central del Uruguay data on line www.bcu.gub.uy
15
Growth, capital accumulation and institutional quality: observed historical trajectories
We first discuss Uruguay’s economic behavior in the long run –since the end of the 19th century
and up until 2010—, looking at the evolution of the GDP, and what happens with the CIM
indicator and the investment ratio. We present an historical overview of the performance of the
Uruguayan economy to identify some relevant stylized facts. We focus on the joint evolution of
overall economic growth, fixed capital accumulation, and institutional quality.
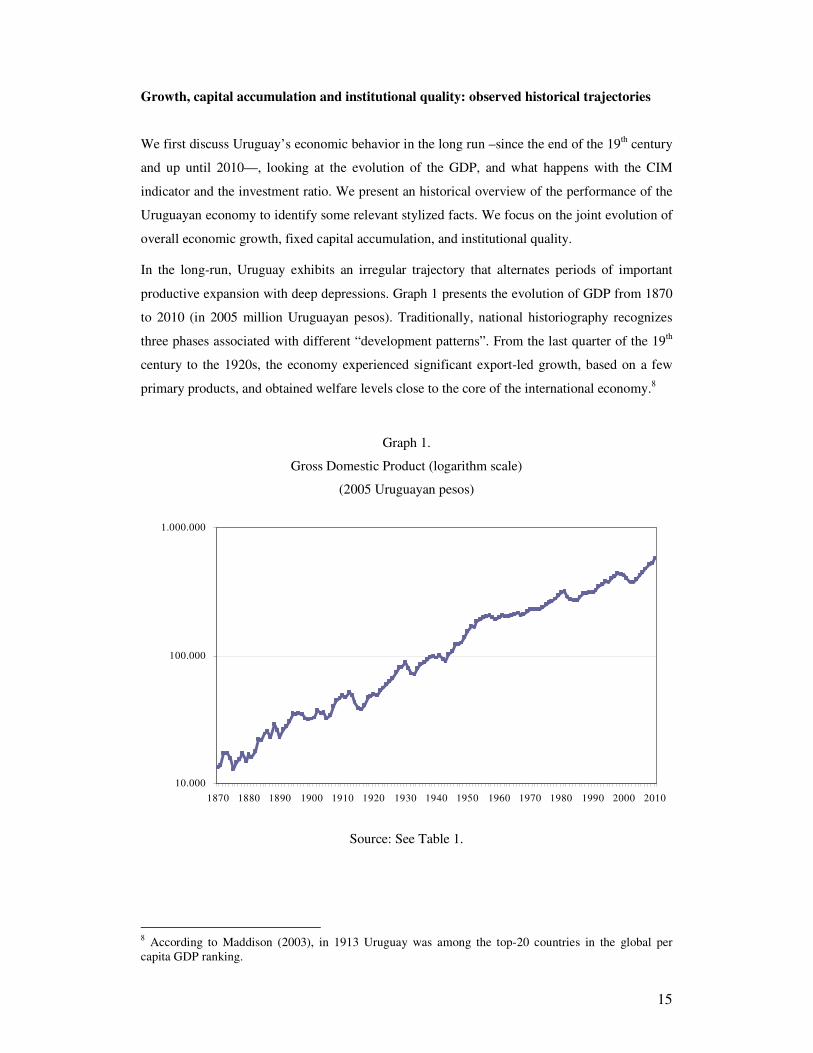
In the long-run, Uruguay exhibits an irregular trajectory that alternates periods of important
productive expansion with deep depressions. Graph 1 presents the evolution of GDP from 1870
to 2010 (in 2005 million Uruguayan pesos). Traditionally, national historiography recognizes
three phases associated with different “development patterns”. From the last quarter of the 19th
century to the 1920s, the economy experienced significant export-led growth, based on a few
primary products, and obtained welfare levels close to the core of the international economy.8
Graph 1.
Gross Domestic Product (logarithm scale)
(2005 Uruguayan pesos)
10.000
100.000
1.000.000
1870 1880 1890 1900 1910 1920 1930 1940 1950 1960 1970 1980 1990 2000 2010
Source: See Table 1.
8 According to Maddison (2003), in 1913 Uruguay was among the top-20 countries in the global per capita GDP ranking.

16
The Great Depression had a big impact in the economy and the poor performance extended
practically until the middle of the 1930s. After the Second World War, the economy presented
the second period of steady economic growth characterized by an increasing participation of the
state in the economy and a (truncated) process of import substitution industrialization. However,
the positive evolution was mostly exhausted by the end of the 1950s, and the economy entered
in a long period of “stagflation” that lasted until the beginning of the 1970s. During the first half
of the 1970s, and among deep social and political changes, the economy experienced important
modifications that became a new development pattern. Increasing trade openness, financial
liberalization, and new regional trade agreements gave place to a new phase of economic
expansion that extended until the end of 20th century. The 21st Century begun with one of the
deeper crisis of the last one hundred years and, from 2003, the economy recovered strongly to
the present. In that context, our CIM indicator shows interesting insights (Graph 2).
Graph 2.
Institutional quality: Contract Intensive Money
Ratio (M2-C)/ M2
0,00
0,10
0,20
0,30
0,40
0,50
0,60
0,70
0,80
0,90
1870
1877
1884
1891
1898
1905
1912
1919
1926
1933
1940
1947
1954
1961
1968
1975
1982
1989
1996
2003
2010
Source: See Table 1.
The “volatility” of the early trajectory coincides with a period of high institutional instability,
when internal conflicts and scarce government enforcement characterized the Uruguayan
economy at the beginning of the 20th century.9 The dynamics change after the First World War
and the indicator increases towards the 1940s and it maintains a relative stable level through the
1950s. During the stagflation period and the increasing political and social instability of the
9 See Roman & Willebald (2010) for a review and Willebald (2011) for a comparison with settler economies.

17
1960s, the CIM indicator shows a deep decreasing trajectory until the end of the decade. During
the next 20 years, the CIM indicator recovered and approached its former levels of the 1940s,
but fell again in 1985 and was relatively stable at levels around 0.7 until the present. Since 2007
the ratio is increasing coinciding with the strong economic growth.
What did happen with the investment in historical perspective? The evolution of the fixed
investment rate was volatile and without clear trends. In the long run (1870-2010), the average
rate was 18 per cent although this ratio was not representative of the historical performance. In
the 1870s, the investment rate declined but, in the second half of the 1880s, the economy
experienced the first boom of the construction that meant investment rates higher than 30 per
cent. This boom finished with the 1890’s Crisis, a critical period characterized by bankrupts and
a general depression. Afterwards, the investment recovered slowly during the second half of the
1890s and quickly from 1904, during a period that coincided with a strong economic growth
that closed abruptly with the First War World. The 1920s were years of recovering in several
spheres of the economy, and the physical capital formation followed this process until achieving
levels close to 20 per cent. However, the Great Depression constituted another strong negative
shock and the investment rate went down until levels close to 10 per cent in 1934. It recovered
in the second half of the 1930s, although the Second War World meant a new break in the
evolution. Since 1944, and probably determined by the process known as industrialization by
import substitution that dominated the Uruguayan economy during the 1950s, the fixed
investment overcome the 20 per cent until the 1960s, when the capital formation experienced a
new decreasing trend. Other new boom in the construction sector happened in the 1970s. It was
an increasing cycle that, as in other periods, ended with a deep decline in the investment rate
(the 1982’Crisis); the 1980s was a period of weak evolution and huge difficulties in the capital
formation. The economy increased during the 1990s but showing low investment rates (below
15 per cent), and suffered another negative impact during the Crisis of the first years of the 21st
century. Since 2003, the investment recovered significantly to perform a trajectory close to 20
per cent.

18
Graph 3.
Fixed Investment Rate
Ratio Gross Fixed Capital Formation / GDP
0,00
0,05
0,10
0,15
0,20
0,25
0,30
0,35
0,4018
70
1877
1884
1891
1898
1905
1912
1919
1926
1933
1940
1947
1954
1961
1968
1975
1982
1989
1996
2003
2010
Source: See Table 1.
Growth, capital accumulation and institutional quality: an econometric exercise
Following Clague et al. (1999) and Prados de la Escosura & Sanz (2006 and 2009) we propose a
structural model to provide an answer to our question about the relation between quality of
institutions and economic performance in the long run for the case of Uruguay. We replicate the
same equations as the latter authors based on a system of simultaneous equations and employ
the seemingly unrelated regression method (SUR) that allows solving the problems of
contemporary correlation between the equation’s residuals and therefore increases in estimation
efficiency.
We based the estimations on a conventional growth model where institutions have been added.
First we estimate a regression in which the dependent variable is the level of real per capita
GDP, and the right-hand-side variables are lagged per capita GDP, the economically active
population (EAP) as an indicator of the growth of the labor force, the rate of enrollment in the
education system –primary and secondary– representing the growth of human capital, the
investment –at constant prices– as a proxy of the growth of physical capital, and finally the rate
of variation of the exports ratio to GDP as the indicator of openness. For the specification of the
equations we apply the logistic transformation on the enrollment rate, the CIM indicator, export

19
rate, and the dependency rate. In addition, we use a logarithm transformation for per capita
GDP, the economically active population and the relative price.
Then, we estimate a set of three equations which attempt to endogenize each explanatory
variable (investment, economically active population and enrollment). For example, we estimate
an equation in which the investment depends on the real interest rate, on the relative price of
capital goods, on per capita GDP growth, on the variation in the dependency ratio, and on CIM.
In the third equation the explanatory variable is the EAP and the independent variables are per
capita GDP growth, EAP lagged and CIM. Finally, the last equation with enrollment as the
dependent variable, which depends on per capita GDP growth, enrollment lagged, and CIM.
The main statistics for the key variables are shown in Table 2 and the econometric results of the
SUR model are presented in Table 3.10
Table 2
Statistics descriptive of the variables for the period 1890-2010
Variables Mean
Standard
Deviation Obs
Per capita GDP level (logs) 11,061 0,478 120 Economically active population (in logs) 13,548 0,527 120 Primary and Secondary enrollment (logit) 0,127 1,156 120 Real interest rate 16,143 20,548 120 Openness (rate of variation) -1,516 0,379 120 Dependency rate (rate of variation) 0,577 0,438 120 Relative price of capital goods (in logs) 0,705 0,697 120 CIM (logit) 0,793 0,331 120 Investment (constant prices in logs) 9,361 1,018 120
10 We run the econometric estimates for the period 1890-2010 because we evaluate critically the CIM indicator for the previous decades and its high volatility probably derives from the debilities of our method of construction for those years. We hoped high variability although our initial results exaggerate the expected instability due to the historical context.

20
Table 3
Econometric results seemingly unrelated regression model (SUR) 1890-2010
Coef. t ratios Coef. t ratios Coef. t ratios Coef. t ratios
Constant 0,166 0,090 -1,237 -0,320 -0,246 -1,15 10,592 3,310
Trend 0,002 1,330 0,002 1,010 0,000 1,92 -0,005 -2,970
GDPpc (log) (-1) 0,739 13,590 -0,007 -1,12 -0,032 -0,290
EAP (log) -0,160 -2,040
EAP (log) (-1) 0,970 105,81
Investment (logs) 0,098 35,100
Investment (logs) (-1) 0,729 13,130
Enrollment rate (logit) 0,038 2,510
Enrollment rate (logit) (-1) 1,232 21,100
Openness rate of variation 0,025 1,520
Dependency rate of variation -0,009 -0,150
GDPpc growth 1,602 5,630
Real interest rate -0,003 -2,710
Relative price of capital (log) -0,258 -2,370
CIM (logit) 0,127 2,180 0,001 0,39 0,127 2,840
R2
Number observationsNote: Coefficients significative at the 5 per cent are marked in bold
0,9816
120
0,9686
120
0,9997
120
0,9881
120
(4)GDPpc (logs) Investment (logs) EAP (logs) Enrollment rate (logit)
(1) (2) (3)
The first runs of our econometric exercise (column number 1 in Table 3) show that per capita
current GDP relates positively and significantly to enrolment rate and investment and, in turn,
investment depends on the quality of institutions as expected (and as measured by the CIM
indicator, column number 2). The economically active population also appears as a significant,
but negative, determinant of per capita GDP. Regarding the investment equation (column
number 2), it confirms theoretical predictions by displaying significant positive coefficients for
lagged investment, and per capita GDP growth, and shows a significant negative coefficient for
the relative price of capital goods and the real interest rate. We also explored with other
estimations methods, such as doing simple OLS regressions for each equation, and the results
for the main variables were the same, so it seems that our results are robust to other estimation
procedures.
Concluding remarks
This paper estimates and uses long term series of an indicator of institutional quality (the CIM
indicator) and of total fixed capital accumulation, for the period 1870-2010, attempting to shed
new light on the relationship between institutions and economic performance, in the case of
Uruguay. The estimated CIM indicator shows a long term trajectory that seems to match
intuitively and in broad terms the country’s political and economic historical record. The
evolution of the estimated long run investment series brings new insights of the historical
capital accumulation process. Econometric results using seemingly unrelated regression models

21
suggest that institutional quality (and contract enforcement more specifically) influences
aggregate economic performance through the accumulation of capital.
References
Aaron, J. (2000). “Growth and institutions: A review of the Evidence”, World Bank Research
Observer, 15(1): 99–135.
Aboal, Noya and Rius (2011). A systematic review on the evidence of the impact on investment
rates of reforms to improve the enforcement of contracts, Montevideo: CINVE (mimeo).
Acemoglu, D., and S. Johnson (2005). “Unbundling institutions”, Journal of Political Economy,
113 (5): 949-995.
Álvarez, J, Bilancini, E, Dalessandro, S. Porcile, G (2010). “Agricultural Institutions,
Industrialization and Growth: The Case of New Zealand and Uruguay” in Explorations
in Economic History, vol. 48(2), pages 151-168, April.
Álvarez, J. and Willebald, H. (2009): “Land ownership systems and the conditions for the
economic growth: settler economies during the First Globalization”. XV World
Economic History Congress, Utrecht, Netherlands, Session J4: Property Rights,
Institutional Settings, and Economic Growth, August.
Bergara, M. and L. Zipitría, (2003). “Una visión institucional de la legislación de bancarrota”,
en Las reglas de juego en Uruguay, Mario Bergara, Montevideo: Trilce.
Bértola, L. and Porcile, G. (2000). “Argentina, Brasil, Uruguay y la economía mundial: una
aproximación a diferentes regímenes de convergencia y divergencia”, en Bértola, L.
(2000) Ensayos de Historia Económica. El Uruguay y la región en la economía
mundial 1870 – 1990. Ed. Trilce. Montevideo.
Besley, T. 1995. “Property Rights and investment Incentives: Theory and Evidence from
Ghana” Journal of Political Economy. 103(5): 903-937.
Brunetti, A., G. Kisunko, and B. Weder (1998). “Credibility of Rules and Economic Growth.
Evidence from a Worldwide Survey of the Private Sector”, World Bank Economic Review
12 (3): 353-384.
Clague, C., Keefer, P., Knack, S. and Olson, M. (1999). “Contract-Intensive Money: Contract
Enforcement, Property Rights, and Economic Performance”. Journal of Economic
Growth, 4 (2):185-211.
Cooley, T, Marimon, R. and Quadrini, V. (2004). “Aggregate Consequences of Limited
Contract Enforceability”, Journal of Political Economy, 112(4): 817-847.
Dao, M. (2008). “The Impact of Investment Climate Indicators on Gross Capital Formation in
Developing Countries”, Journal of Developing Areas, 42(1): 155-163.
22
Djankov, S., La Porta, R., Lopez-de-Silanes, F. and Schleifer, A. (2003). “Courts”, Quarterly
Journal of Economics 118(2): 453-517.
Djankov, S.; R. La Porta; F. Lopez-de-Silanes and Shleifer, A. (2008). “Debt Enforcement
Around the World". Journal of Political Economy 116(6): 1105-1149.
Field, A. (2006). “North, Douglass (b. 1920)”, in David A. Clark (ed.), The Elgar Companion to
Development Studies, 423-426. Cheltenham: Edward Elgar Publishing.
Kaufmann, D., Kraay, A. and Mastruzzi, M. (2004). Governance Matters IV: Governance
Indicators for 1996-2004, Washington, DC, USA: The World Bank.
Keefer, P. (2004). “A Review of The Political Economy of Governance: From Property Rights
to Voice”, Washington, DC, USA: The World Bank.
Knack, S.; and Keefer, P. (1995). “Institutions and Economic Performance: Cross-Country
Tests Using Alternative Institutional Measures”. Economics and Politics, 7: 207-227.
La Porta, R., F. Lopez-de-Silanes, A. Shleifer, and R. W. Vishny. (1997). "Legal Determinants
of External Finance". The Journal of Finance 52(3):1131-1150.
Le, Q. (2004). “Political and Economic Determinants of Private Investment”, Journal of
International Development 16(4): 589–604
Maddison, A. (2003). Historical Statistics of the World Economy: 1-2008 AD; OECD, Paris.
Monge-Naranjo, A. (2009). “Entrepreneurship and Firm Heterogeneity with Limited
Enforcement.” Annals of Finance 5, no. 3 (June 1): 465-494.
Moraes, I (2001). “Las determinantes tecnológicas e institucionales del desempeño ganadero en
el largo plazo, 1870-1970”, Tesis de Maestría en Historia Económica, Facultad de
Ciencias Sociales, Universidad de la República.
North, D. (1990). Institutions, Institutional Change and Economic Performance. Cambridge:
Cambridge University Press.
Oddone, G. (2005). El largo declive de Uruguay durante el siglo XX, Tesis Doctoral,
Universitat de Barcelona, Departament d'Història i Institucions Econòmiques.
Pande, R. and Udry, C.R. (2005). Institutions and Development: A View from Below. Center
Discussion Papers. New Haven, USA: Economic Growth Center, Yale University,
November.
Prados de la Escosura, L. and Sanz, I. (2009). “Contract Enforcement, capital accumulation, and
Argentina’s long-run decline”. Cliometrica, 3, pp. 1-26.
Prados de la Escosura, L. and Sanz, I. (2006). “Contract Enforcement and Argentina’s Long-
Run Decline”. Economic History and Institutions Series Working Paper 06-06, Dpto. de
Historia Económica e Instituciones, Universidad Carlos III, Madrid.
Rama, M. (1990). “Crecimiento y Estancamiento Económico en Uruguay”, in Trayectorias
Divergentes, Blömstrom, M, and Meller, P. (eds.), Santiago: CIEPLAN-Hachette.

23
Rehme, G. (2007). Endogenous Policy and Cross-Country Growth Empirics. Darmstadt
Discussion Papers in Economics. Darmstadt, Germany: Darmstadt Technical University,
Department of Business Administration, Economics and Law, Institute of Economics.
Rodrik, D. (2000). “Institutions for high quality growth: What they are and how to acquire
them.” Studies in Comparative International Development 35(3): 3-31.
Rodrik, D. (2005). Why We Learn Nothing from Regressing Economic Growth on Policies.
Mimeo, Harvard University. Boston, MA, USA.
Román, C. y Willebald, H. (2011). “Apuntes metodológicos para la construcción de indicadores
de inversión y calidad institucional en el largo plazo: una propuesta para el caso
uruguayo". A presentares en III Jornadas Académicas de la Facultad de Ciencias
Económicas y de Administración, Universidad de la República.
Rutherford, M. (1994). Institutions in Economics: The Old and the New Institutionalism.
Cambridge: Cambridge University Press.
Shirley, M. M. (2008). Institutions and Development. Cheltenham, UK and Northampton, MA:
Edward Elgar.
Siniscalchi, S. (2010). “Rol de las instituciones políticas en el Desarrollo. Apuntes para la
construcción de un indicador de calidad institucional”, Escuela de Verano de Historia
Económica del Hemisferio Sur, Facultad de Ciencias Sociales, Universidad de la
República. Montevideo.
Willebald, H. (2011). “Land-abundance, frontier expansion and the hypothesis of
appropriability revisited from an historical perspective”. First Quantitative Agricultural
and Natural Resources History Workshop, Zaragoza, España.
http://estructuraehistoria.unizar.es/gihea/agricliometrics.htm
Williams, A. and Siddique, A. (2008). “The Use (and Abuse) of Governance Indicators in
Economics: A Review”, Economics of Governance 9:131–175.
Woodruf, C. (1998). “Contract Enforcement and Trade Liberalization in Mexico’s Footwear
Industry”, World Development 26(6)979-991.
World Bank. (2001). World Development Report 2002: Building Institutions for Markets.
Washington DC, USA: The World Bank.
Zipitría, L. (2001). “Un análisis económico-institucional de los procedimientos concursales en
el Uruguay”, presentado en la Conferencia Anual de LACEA, Montevideo.
Zurbriggen, C (2006). Estado, empresarios y redes rentistas. Ediciones de la Banda
Oriental, Montevideo.