economic consulting associates limited 41 lonsdale road london nw6 6ra uk tel +44 (0)20 7604 4545 /...
TRANSCRIPT

ECONOMIC CONSULTING ASSOCIATES LIMITED 41 Lonsdale Road London NW6 6RA UKtel +44 (0)20 7604 4545 / fax +44 (0)20 7604 4547 www.eca-uk.com
1 © 2008 Economic Consulting Associates Ltd
SEE Regional Gasification StudyWorld Bank and KfWStephen Wilson ECA Dr Detlef Edler UGS
Joint Working Group Belgrade, 11 September 2008

2 © 2008 Economic Consulting Associates Ltd
Overview
Underground Gas Storage (UGS) outside original study scope new Task 10 is on storage
Storage in context of EC Ring security of supply synergies with EC Ring
Expected demand for storage projected annual demand seasonality of demand
Existing storage and prospects sites and technical potential SEE storage project case studies
Economics of UGS estimating storage costs opportunity costs, modelling seasonal
prices Results: Economics of storage in
SEE Final Report Gas Forum

3 © 2008 Economic Consulting Associates Ltd
SEE gasification and the EC Ring
4 © 2008 Economic Consulting Associates Ltd
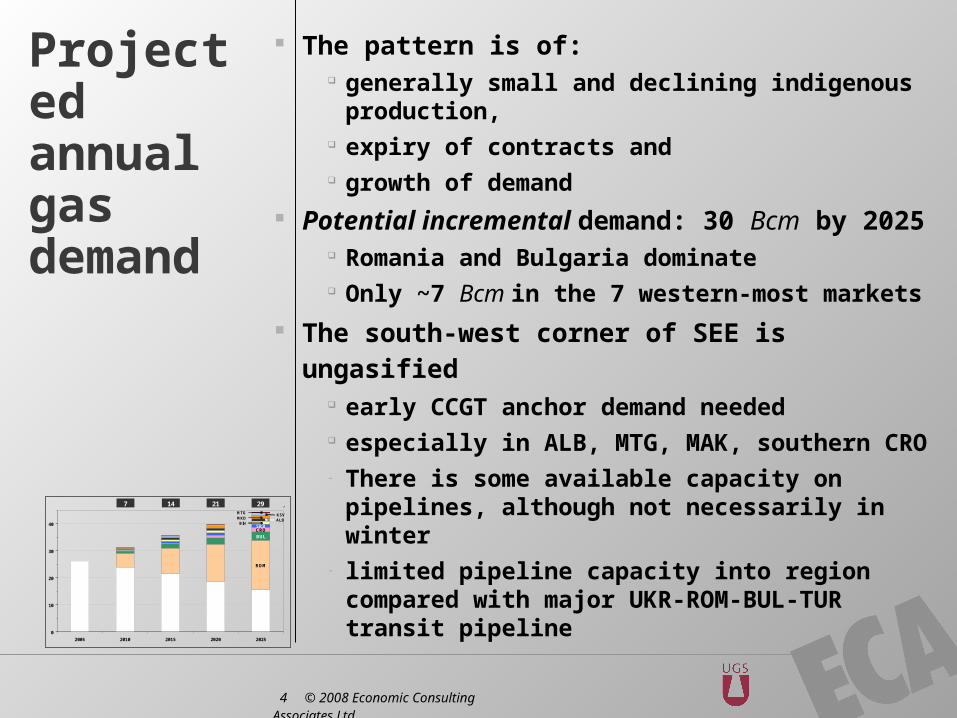
Projected annual gas demand
The pattern is of: generally small and declining indigenous
production, expiry of contracts and growth of demand
Potential incremental demand: 30 Bcm by 2025
Romania and Bulgaria dominate Only ~7 Bcm in the 7 western-most markets
The south-west corner of SEE is ungasified early CCGT anchor demand needed especially in ALB, MTG, MAK, southern CRO - There is some available capacity on
pipelines, although not necessarily in winter - limited pipeline capacity into region
compared with major UKR-ROM-BUL-TUR transit pipeline
BUL
ROM
CROSRB
0
10
20
30
40
2005 2010 2015 2020 2025
BiHALBMKDKSVMTG
bcm/y14 21 29Incremental imports for 9 SEE markets:
7

5 © 2008 Economic Consulting Associates Ltd
Source: Base Map WinGas GmbH. © Verlag Gluckhauf GmbH, Essen 2006
Supply possibilities and EC Ring
Supply possibilities and EC Ring

6 © 2008 Economic Consulting Associates Ltd
Demand for underground gas storage

7 © 2008 Economic Consulting Associates Ltd
Demand for storage
Seasonality of demand can be represented on a load-duration
curve average year, 1-in-20 or 1-in-50
shapes general growth scales up the shape changing the mix changes the shape
Peak demands the more ‘peaky’ the shape, the more
high deliverability storage is required

8 © 2008 Economic Consulting Associates Ltd
UGS in the context of SEE gas
Synergies with the EC Ring Seasonal balancing Additional winter injection points to complement transmission supply
Interaction with neighbouring markets
facilitates future trading SEE – PSV – Baumgarten
Can increase security of supply
UGS

9 © 2008 Economic Consulting Associates Ltd
Existing and prospective UGS

10 © 2008 Economic Consulting Associates Ltd
Source: Base Map WinGas GmbH. © Verlag Gluckhauf GmbH, Essen 2006
Existing and potential UGS sites in SEE
Existing and potential UGS sites in SEE
OkoliOkoli
BenicanciBenicanci
Banatski Banatski DvorDvor
othersothers
DumreaDumrea
DivjakaDivjaka
ChirenChiren
[various][various]
Tuzla-TetimaTuzla-Tetima

11 © 2008 Economic Consulting Associates Ltd
Site Type
Existing Potential Bcm
ALB Divjaka DF - 0.06
Dumrea SC - 0.07 * N
BiH Tuzla-Tetima SC - 0.05
BUL Chiren DF 0.5
Unspecified SC - ?
CRO Okoli DF 0.58 +0.4
Benicanci DF - 0.5 … 2
KSV ~ ~ -
MAK ? SC - ?
MTG ~ ~ - -
ROM Ten sites DF 4.45 1.1
SRB Banatski Dvor
DF 0.03 0.8
Various DF 3 to 5
Total All ~ 5.5 ~ 3 … 8

12 © 2008 Economic Consulting Associates Ltd
Case studies of potential UGS projects

13 © 2008 Economic Consulting Associates Ltd
Prospective new UGS
Croatia: Okoli (depleted field expansion) Benicanci (depleted field)
Bosnia and Herzegovina Tuzla-Tetima (salt structure)
Serbia: Banatski Dvor (depleted field)
Albania Dumrea (salt structure) Divjaka (depleted field)

14 © 2008 Economic Consulting Associates Ltd
Source: Base Map WinGas GmbH. © Verlag Gluckhauf GmbH, Essen 2006
Prospective new UGS sites: study focus
Prospective new UGS sites: study focus
OkoliOkoli
BenicanciBenicanci
Banatski Banatski DvorDvor
DumreaDumrea
DivjakaDivjaka
Chiren
[various]
Tuzla-TetimaTuzla-Tetimaothers

15 © 2008 Economic Consulting Associates Ltd
Economics of storage

16 © 2008 Economic Consulting Associates Ltd
Economics of gas storage
Cost of developing and operating
depleted fields salt caverns
Value of storage: opportunity costs
line pack from larger Ø EC ring peak or seasonal LNG supply pipeline gas supply & capacity electricity sector seasonal dispatch
alternate fuel (secondary or backup)
interruptible (non-firm) customers

17 © 2008 Economic Consulting Associates Ltd
Estimating costs: depleted fields
UGS experts reviewed design of similar wells recently completed
For each potential new facility:
adjust costs for SEE conditions define expected parameters:
working gas volume, MMscm cushion gas, MMscm max withdrawal capacity, MMscm/d number of production wells, # average well depth, m
Taking into account (if known): porosity, % permeability, mDarcy

18 © 2008 Economic Consulting Associates Ltd
Estimating costs: salt caverns
Similar cost estimation approach
For each potential new facility: define expected parameters:
cavern diameter, m cavern height, m cavern net volume, m³ minimum and maximum pressure, bar working gas volume, MMscm cushion gas volume, MMscm number of production wells, # average well depth, m
Taking into account: caverns simultaneously leaching, # water flow rates, m³/h time for cavern creation, months

19 © 2008 Economic Consulting Associates Ltd
Oil-gas price linkage
Oil-steel price linkage
Handling underlying price uncertainty
20 © 2008 Economic Consulting Associates Ltd
Alternatives to UGS
Dual-firing power plants boilers (cost of backup fuel storage)
Seasonal generation dispatch summer peaking gas-fired plants can complement winter-peaking temperature-sensitive (heating) loads
Interruptible customers industrial customers seasonal shifting, when priced correctly(where capacity is more economic)
LNG LNG

21 © 2008 Economic Consulting Associates Ltd
Modelling storage prices
Infer summer-winter (shadow) prices from a set of gas contract terms:
Annual Contract Quantity, ACQ Actual Annual Quantity, AAQ Maximum Daily Quantity, MDQ Take-or-Pay Quantity, TPQ Take-or-Pay Penalty, TPP

22 © 2008 Economic Consulting Associates Ltd
Final report: Gas Forum
23 © 2008 Economic Consulting Associates Ltd
Final report including storage
New sub-sections in existing structure
§2: Demand-side assessments seasonal swing daily variability security of supply
§3: Supply-side options UGS sites geological characteristics development cost estimates cost of alternatives economic analysis updated with
storage §5: Institutional framework
Regulated v market-based storage under national gas markets and cross-border framework

ECONOMIC CONSULTING ASSOCIATES LIMITED 41 Lonsdale Road London NW6 6RA UKtel +44 (0)20 7604 4545 / fax +44 (0)20 7604 4547 www.eca-uk.com
24 © 2008 Economic Consulting Associates Ltd
SEE Regional Gasification StudyWorld Bank and KfWStephen Wilson ECA Dr Detlef Edler UGS
Joint Working Group Belgrade, 11 September 2008

25 © 2008 Economic Consulting Associates Ltd
Estimating economic costs of gas storage worked exampleItem Quantity Price
USD /unit
Cost USD M
Surface facilities and wells
20
Cushion gas 500 MMcm 300 150
TOTAL CAPITAL COST 170
Annualised capital costs 20 years 10 % pa 20.0
Storage cost of carry (6 months)
5% of 500 300 7.5
Annual compression work 2.5% of 500 300 3.8
TOTAL ANNUALISED COSTS
62 31.2

26 © 2008 Economic Consulting Associates Ltd
BUL
ROM
CROSRB
+2.3
0
10
20
30
40
2005 2010 2015 2020 2025
BiHALBMKDKSVMTG
bcm/y14 21 29Incremental imports for 9 SEE markets:
7
3.7
Projected incremental imports for 9 SEE markets
Declining indigenous production and existing import contracts

27 © 2008 Economic Consulting Associates Ltd

28 © 2008 Economic Consulting Associates Ltd
Historical oil and gas prices
$50 oil
$25 oil
$75 oil
$100 oil
0
25
50
75
100
125
150
2000 2001 2002 2003 2004 2005 2006 2007 2008
Brent price US$ / bbl
0
100
200
300
400
Gas price US$ / Mcm
LH axis: Europe Brent spot price FOB$100 oilRH axis: SEE regional gas price estimateRH axis: Baumgarten → AUTRH axis: Baumgarten → ITARH axis: Velke Kapusany

29 © 2008 Economic Consulting Associates Ltd
Oil-Gas price relationship490
410
330
250
170
90
460
385
310
235
160
85
0
100
200
300
400
500
0 25 50 75 100 125 150
Oil US$/bbl
Gas US$/Mcm

30 © 2008 Economic Consulting Associates Ltd
Historical oil and steel prices
0
50
100
150
1990 1995 2000 2005 2010 2015
Oil US$/bbl
100
500
900
1 300
Steel US$/t
Brent crude OIL daily prices
Brent Crude monthly average
Hot rolled STEEL coil (EU)
1997 - 2003 inclusiveOil: $10-35 /bblSteel: $200-400 /t
2004 - mid 2007Oil: $35-75 /bblSteel: $400-700 /t
mid 2007 - … Oil: $75-150 /bbl
Steel: $700-1400 /t

31 © 2008 Economic Consulting Associates Ltd
Oil-Steel price relationship
0
500
1 000
1 500
0 50 100 150
Oil US$ /bbl
Steel US$ /t EU hot rolled steel coil price v Brent crude oil price
Steel = 157.1 + 7.136BrentR² = 0.82
+2σ
-2σ
-1σ
+1σ
inferred EAF cost function
inferred BOF cost function

32 © 2008 Economic Consulting Associates Ltd
AAQ
Annual peak day
0
20
40
60
80
100
Jul Oct Jan Apr
Daily flow
Monthly Average Daily Quantities
(ADQ)
Take-or-Pay Quantity
System Peak Capacity
Maximum Daily Contract Quantity
Average Daily Contract Quantity
MDQ = 106% of ADCQ
ADCQ
TPQ = 85% of ACQ

33 © 2008 Economic Consulting Associates Ltd
34 © 2008 Economic Consulting Associates Ltd
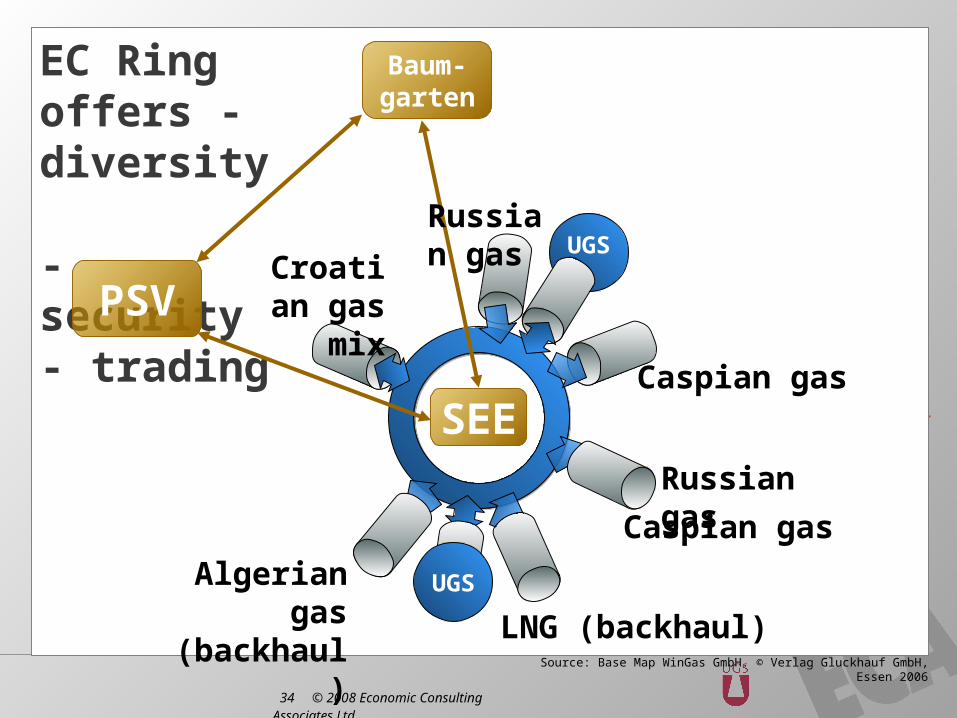
EC Ring offers - diversity - security
- trading
EC Ring offers - diversity - security
- trading
Caspian gas
LNG (backhaul)
Algerian gas
(backhaul)
Croatian gas
mix
SEE
Baum-garten
PSV
Caspian gas
UGS
UGSRussian gas
Russian gas
Source: Base Map WinGas GmbH. © Verlag Gluckhauf GmbH, Essen 2006

35 © 2008 Economic Consulting Associates Ltd
LNG in SEE region Bcm/y of capacityLNG in SEE region Bcm/y of capacity
3.0
Rovigo, ITARovigo, ITA
Adriatic, CROAdriatic, CRO Marmara Marmara Ereglisi, TUREreglisi, TUR
Revithoussa, GRERevithoussa, GRE
Panigaglia, ITAPanigaglia, ITA
3.63.6
8.0
6.3
8.0

36 © 2008 Economic Consulting Associates Ltd