economic challenges and opportunities sa will be facing over the next 5 years
TRANSCRIPT
Challenges & Opportunities Manufacturing and Economic Growth Outlook
www.frost.com [email protected]

[email protected] www.frost.com
AGENDA
1) INTRODUCTION
Overview
Key influencers, challenges and enablers
2) MACROECONOMIC OVERVIEW
External influencers and challenges
3) DOMESTIC ECONOMY
Growth trajectory
Key domestic influencers to manufacturing sector – supply & demand factors
Manufacturing sector growth
4) GROWTH DRIVERS AND OPPORTUNITIES IN AFRICA
Realistic expectations
Explore growth & key enablers
Where do the opportunities lie
Craig Parker
Programme Manager,
Mobility
Africa

External Influences:
Macroeconomic Overview
[email protected] www.frost.com
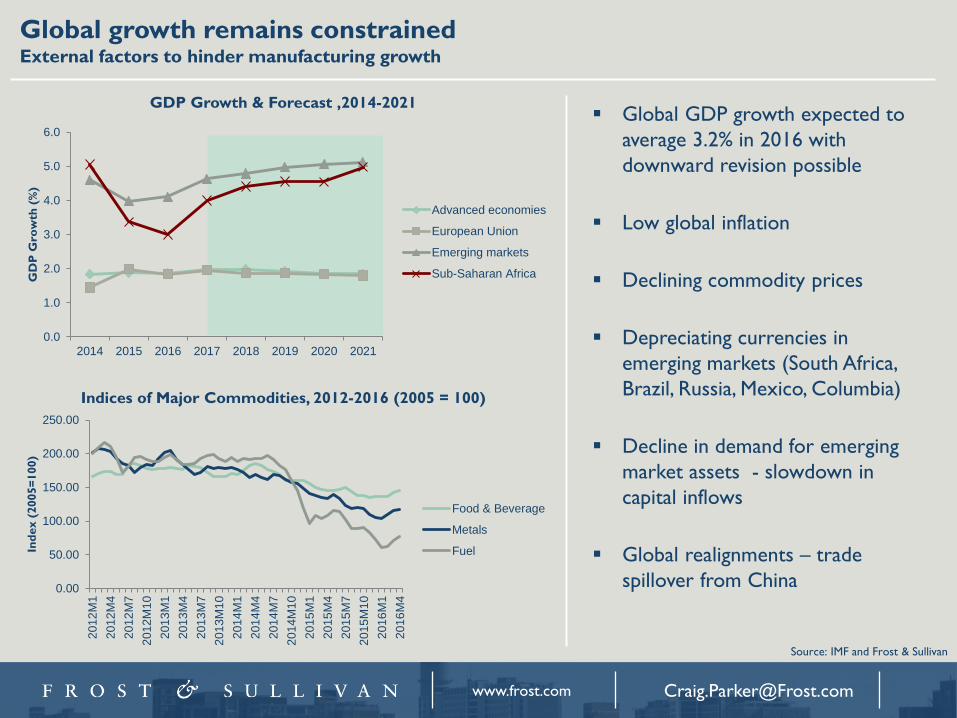
Global growth remains constrained External factors to hinder manufacturing growth
Global GDP growth expected to
average 3.2% in 2016 with
downward revision possible
Low global inflation
Declining commodity prices
Depreciating currencies in
emerging markets (South Africa,
Brazil, Russia, Mexico, Columbia)
Decline in demand for emerging
market assets - slowdown in
capital inflows
Global realignments – trade
spillover from China 0.00
50.00
100.00
150.00
200.00
250.00
201
2M
1
201
2M
4
201
2M
7
201
2M
10
201
3M
1
201
3M
4
201
3M
7
201
3M
10
201
4M
1
201
4M
4
201
4M
7
201
4M
10
201
5M
1
201
5M
4
201
5M
7
201
5M
10
201
6M
1
201
6M
4
Ind
ex (
2005=
100)
Food & Beverage
Metals
Fuel
Indices of Major Commodities, 2012-2016 (2005 = 100)
0.0
1.0
2.0
3.0
4.0
5.0
6.0
2014 2015 2016 2017 2018 2019 2020 2021
GD
P G
row
th (
%)
Advanced economies
European Union
Emerging markets
Sub-Saharan Africa
GDP Growth & Forecast ,2014-2021
Source: IMF and Frost & Sullivan
[email protected] www.frost.com
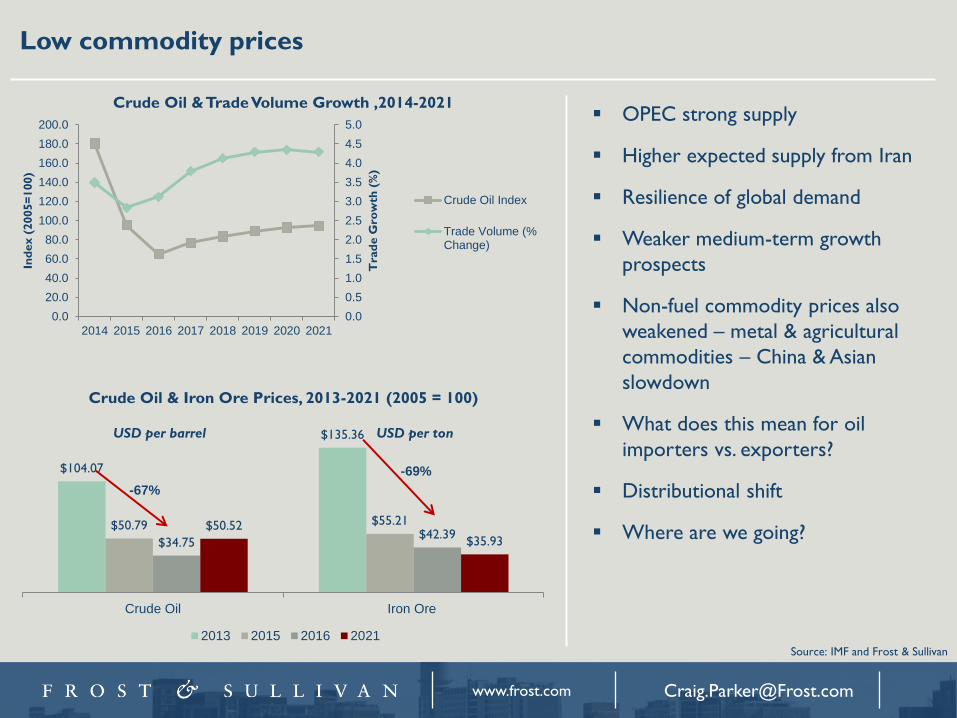
Low commodity prices
0.0
0.5
1.0
1.5
2.0
2.5
3.0
3.5
4.0
4.5
5.0
0.0
20.0
40.0
60.0
80.0
100.0
120.0
140.0
160.0
180.0
200.0
2014 2015 2016 2017 2018 2019 2020 2021
Tra
de G
row
th (
%)
Ind
ex (
2005=
100)
Crude Oil Index
Trade Volume (%Change)
OPEC strong supply
Higher expected supply from Iran
Resilience of global demand
Weaker medium-term growth
prospects
Non-fuel commodity prices also
weakened – metal & agricultural
commodities – China & Asian
slowdown
What does this mean for oil
importers vs. exporters?
Distributional shift
Where are we going?
Source: IMF and Frost & Sullivan
$104.07
$135.36
$50.79 $55.21
$34.75 $42.39
$50.52
$35.93
Crude Oil Iron Ore
2013 2015 2016 2021
USD per barrel USD per ton
Crude Oil & Trade Volume Growth ,2014-2021
Crude Oil & Iron Ore Prices, 2013-2021 (2005 = 100)
-67%
-69%
[email protected] www.frost.com
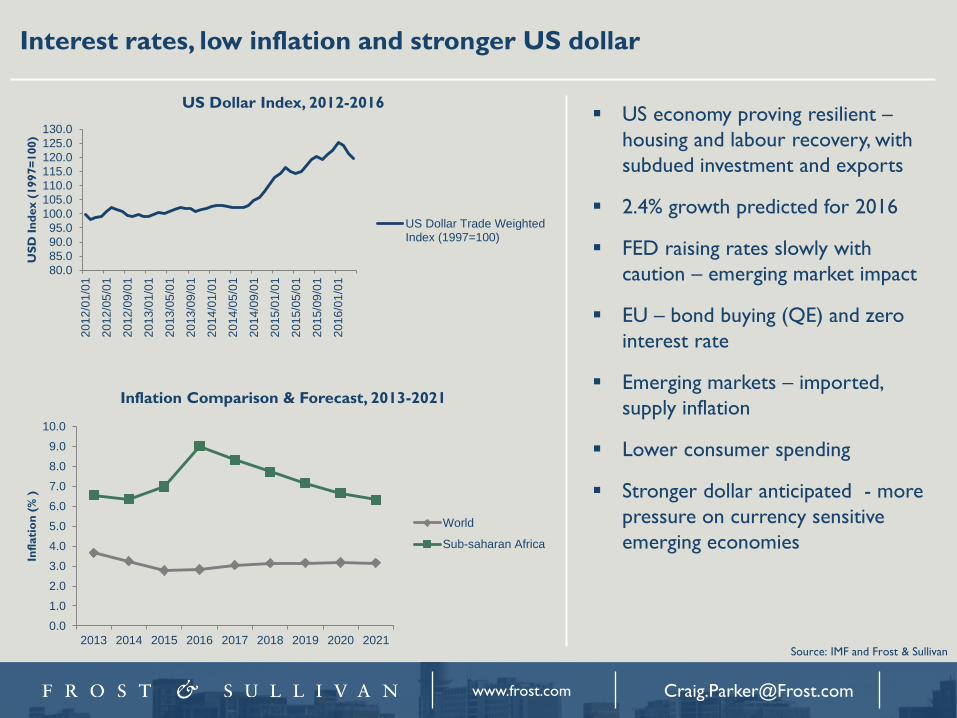
Interest rates, low inflation and stronger US dollar
80.0
85.0
90.0
95.0
100.0
105.0
110.0
115.0
120.0
125.0
130.0
201
2/0
1/0
1
201
2/0
5/0
1
201
2/0
9/0
1
201
3/0
1/0
1
201
3/0
5/0
1
201
3/0
9/0
1
201
4/0
1/0
1
201
4/0
5/0
1
201
4/0
9/0
1
201
5/0
1/0
1
201
5/0
5/0
1
201
5/0
9/0
1
201
6/0
1/0
1
US
D I
nd
ex (
1997=
100)
US Dollar Trade WeightedIndex (1997=100)
0.0
1.0
2.0
3.0
4.0
5.0
6.0
7.0
8.0
9.0
10.0
2013 2014 2015 2016 2017 2018 2019 2020 2021
Infl
ati
on
(%
)
World
Sub-saharan Africa
Source: IMF and Frost & Sullivan
US Dollar Index, 2012-2016
Inflation Comparison & Forecast, 2013-2021
US economy proving resilient –
housing and labour recovery, with
subdued investment and exports
2.4% growth predicted for 2016
FED raising rates slowly with
caution – emerging market impact
EU – bond buying (QE) and zero
interest rate
Emerging markets – imported,
supply inflation
Lower consumer spending
Stronger dollar anticipated - more
pressure on currency sensitive
emerging economies
[email protected] www.frost.com
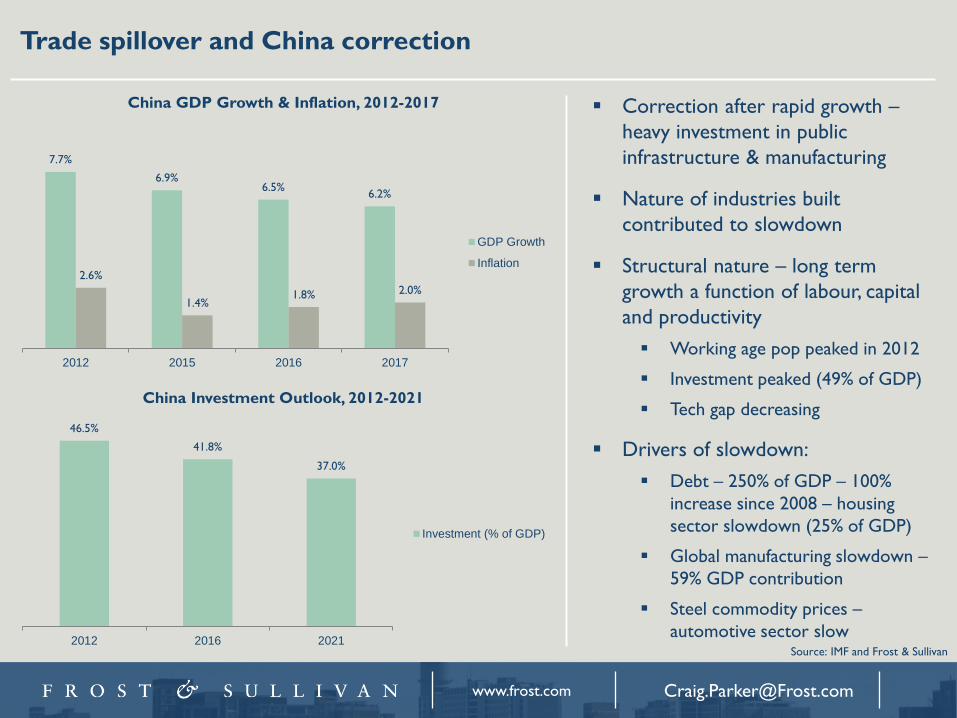
Trade spillover and China correction
Correction after rapid growth –
heavy investment in public
infrastructure & manufacturing
Nature of industries built
contributed to slowdown
Structural nature – long term
growth a function of labour, capital
and productivity
Working age pop peaked in 2012
Investment peaked (49% of GDP)
Tech gap decreasing
Drivers of slowdown:
Debt – 250% of GDP – 100%
increase since 2008 – housing
sector slowdown (25% of GDP)
Global manufacturing slowdown –
59% GDP contribution
Steel commodity prices –
automotive sector slow
7.7%
6.9% 6.5%
6.2%
2.6%
1.4% 1.8% 2.0%
2012 2015 2016 2017
GDP Growth
Inflation
China GDP Growth & Inflation, 2012-2017
46.5%
41.8%
37.0%
2012 2016 2021
Investment (% of GDP)
China Investment Outlook, 2012-2021
Source: IMF and Frost & Sullivan

[email protected] www.frost.com
Macroeconomic outlook
1.8%
1.9%
2010-2015 Average 2016-2021 Average
Advanced economies
1.2%
1.9%
2010-2015 Average 2016-2021 Average
European Union
7.4%
6.3%
2010-2015 Average 2016-2021 Average
Emerging and developing Asia
5.4%
5.2%
2010-2015 Average 2016-2021 Average
ASEAN-5
3.0%
1.9%
2010-2015 Average 2016-2021 Average
Latin America and the Caribbean
3.6%
3.4%
2010-2015 Average 2016-2021 Average
Middle East and North Africa
4.9%
4.2%
2010-2015 Average 2016-2021 Average
Sub-Saharan Africa Note: Indonesia, Malaysia, the Philippines, Singapore and
Thailand
Why growth slowing in emerging markets? Subdued investment
Risk aversion
Geopolitical tensions
Commodity ‘super-cycle’ & trade spillover from China
Currency pressure: Developed stronger, developing weaker with capital
flow constraints Source: IMF and Frost & Sullivan

Local Influences: Domestic
Economy, Policy &
Investment

[email protected] www.frost.com
Domestic Influences to South Africa’s Economy
Political risk and uncertainty
Greatest threat to economic stability>
rand volatility
Rand volatility linked to uncertainty and
risk aversion
Growth outlook remains uncertain
Ratings important to investors –
Standard & Poor’s and Fitch to release
reviews in June. Moody’s left rating at
Baa2 – 2 levels above sub-investment
grade
FDI in 2015
Developed economies up to
$963b (2nd highest level)
EU gained traction
US at $384b highest since 2000
Developing Asia rose by 15% to
$548b
Africa declined by 31% to $38b:
Nigeria (-27%), Mozambique (-
21%)
South Africa dramatic decline, 74%
to $1.5b
2.22% 2.21%
1.55%
1.28%
0.61%
1.21%
2.06%
2.40% 2.40% 2.40%
2012 2013 2014 2015 2016 2017 2018 2019 2020 2021
South Africa Growth Outlook (GDP), 2012-2021
R10.00
R11.00
R12.00
R13.00
R14.00
R15.00
R16.00
R17.00
South Africa Exchange Rate, 2012-2021
Source: IMF and Frost & Sullivan
[email protected] www.frost.com
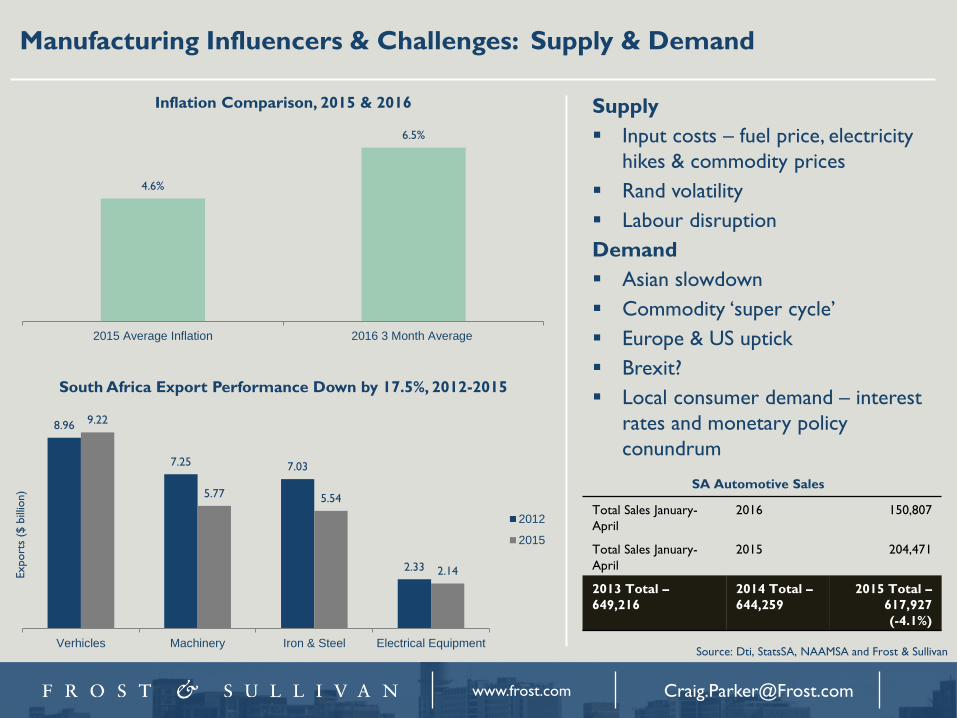
Manufacturing Influencers & Challenges: Supply & Demand
4.6%
6.5%
2015 Average Inflation 2016 3 Month Average
South Africa Export Performance Down by 17.5%, 2012-2015
Inflation Comparison, 2015 & 2016 Supply
Input costs – fuel price, electricity
hikes & commodity prices
Rand volatility
Labour disruption
Demand
Asian slowdown
Commodity ‘super cycle’
Europe & US uptick
Brexit?
Local consumer demand – interest
rates and monetary policy
conundrum
Total Sales January-
April
2016 150,807
Total Sales January-
April
2015 204,471
2013 Total –
649,216
2014 Total –
644,259
2015 Total –
617,927
(-4.1%)
SA Automotive Sales
8.96
7.25 7.03
2.33
9.22
5.77 5.54
2.14
Verhicles Machinery Iron & Steel Electrical Equipment
2012
2015
Export
s ($
bill
ion)
Source: Dti, StatsSA, NAAMSA and Frost & Sullivan

[email protected] www.frost.com
Manufacturing Sector Growth Enablers
Rand depreciation for export
competitiveness?
Feedback mechanism was not
working
Improved demand from Europe
Shift in export dependence &
diversification of markets to Africa
Macroeconomic challenges, but
small scale business has
opportunities – business incubation
and World Bank view on Africa
Value chain enhancement and
SMME involvement in larger value
chains – SEZ’s
Possible small business incubation
policy? (Department of Small
Business Development – DSBD) –
R475m from National Budget
South Africa Export Partners, 2011 & 2015
China 12%
United States of
America
7%
Germany 5%
Namibia 4%
Botswana 4% Japan
7%
United Kingdom
4%
India 3%
ROW 54%
China 9%
United States of America
8%
Germany 7%
Namibia
5%
Botswana 5%
Japan
5% United
Kingdom
4%
India 4%
ROW 53%
2011 2015
20
40
60
80
100
120
140
160
MO
012
012
MO
032
012
MO
052
012
MO
072
012
MO
092
012
MO
112
012
MO
012
013
MO
032
013
MO
052
013
MO
072
013
MO
092
013
MO
112
013
MO
012
014
MO
032
014
MO
052
014
MO
072
014
MO
092
014
MO
112
014
MO
012
015
MO
032
015
MO
052
015
MO
072
015
MO
092
015
MO
112
015
MO
012
016
MO
032
016
Ind
ex (
2010 =
100)
Food andbeverages
Basic chemicals
Basic iron andsteel products
GeneralpurposemachineryHouseholdappliances
Electricalmachinery
South Africa Production Indices, 2012-2016
Source: Dti, StatsSA and Frost & Sullivan
Growth Drivers & Opportunities within
Africa
[email protected] www.frost.com
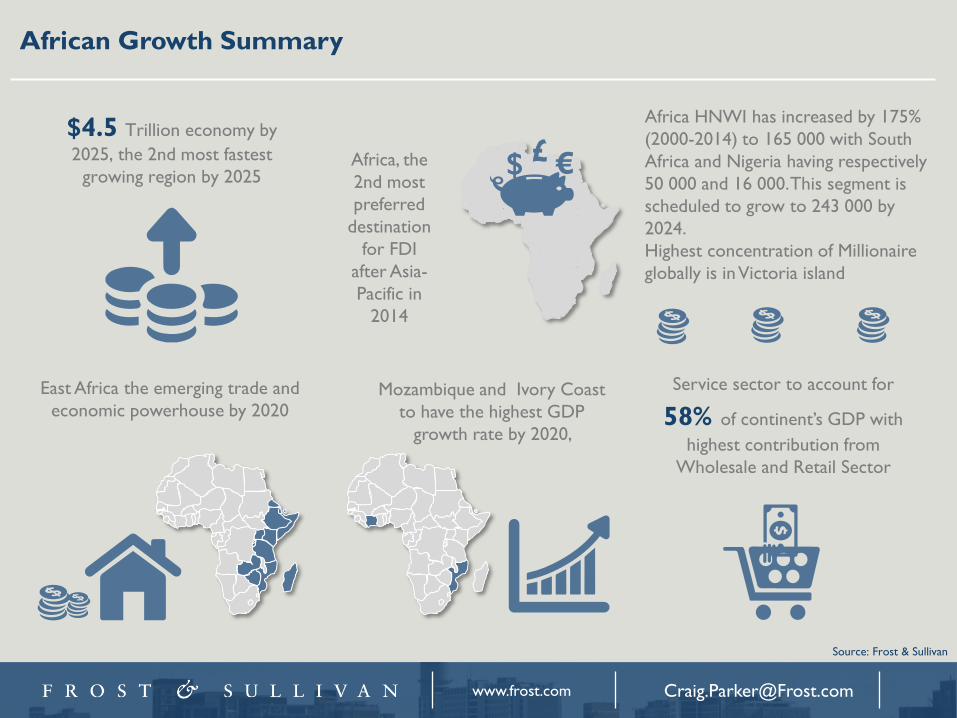
African Growth Summary
Service sector to account for
58% of continent’s GDP with
highest contribution from
Wholesale and Retail Sector
East Africa the emerging trade and
economic powerhouse by 2020 Mozambique and Ivory Coast
to have the highest GDP
growth rate by 2020,
Africa HNWI has increased by 175%
(2000-2014) to 165 000 with South
Africa and Nigeria having respectively
50 000 and 16 000. This segment is
scheduled to grow to 243 000 by
2024.
Highest concentration of Millionaire
globally is in Victoria island
$4.5 Trillion economy by
2025, the 2nd most fastest
growing region by 2025 Africa, the
2nd most
preferred
destination
for FDI
after Asia-
Pacific in
2014
$ € £
Source: Frost & Sullivan

[email protected] www.frost.com
The Urbanization of Africa and the Development of Smart Cities Almost Half of the African Population is Expected to Be Living in Urban Areas by 2025
Rising Urban Population Proportion (% of total
population) across Africa, 2000, 2014, 2025
AFRICA
34.5
40.0
44.9
Western Africa
34.7
41.4
51.4
Southern Africa
53.8 61.2
66.1
Eastern Africa
25.2 30.3
20.6
48.4 51.4
54.3
Northern Africa
Middle Africa
36.8
43.5 49.0
Cairo, Egypt
2000
2014
2025
Megacities
Lagos,
Nigeria
Kinshasa, Congo
Source: Frost & Sullivan
Africa is expected to get 5 smart cities by 2030 and a
consolidated investment of $59.8billion through PPP funding.
Rwanda
Smart
City
$10 Billion
(2013–
2018)
Modderfont
ein Smart
City
$7 Billion
(2014–2030)
Konza
Techno City
$14.5 Billion
(2010–2030)
Hope City,
Ghana
$10 Billion
(2013–2023)
Abuja
Centenary
City
$18.3 Billion
(2013–2018)
[email protected] www.frost.com
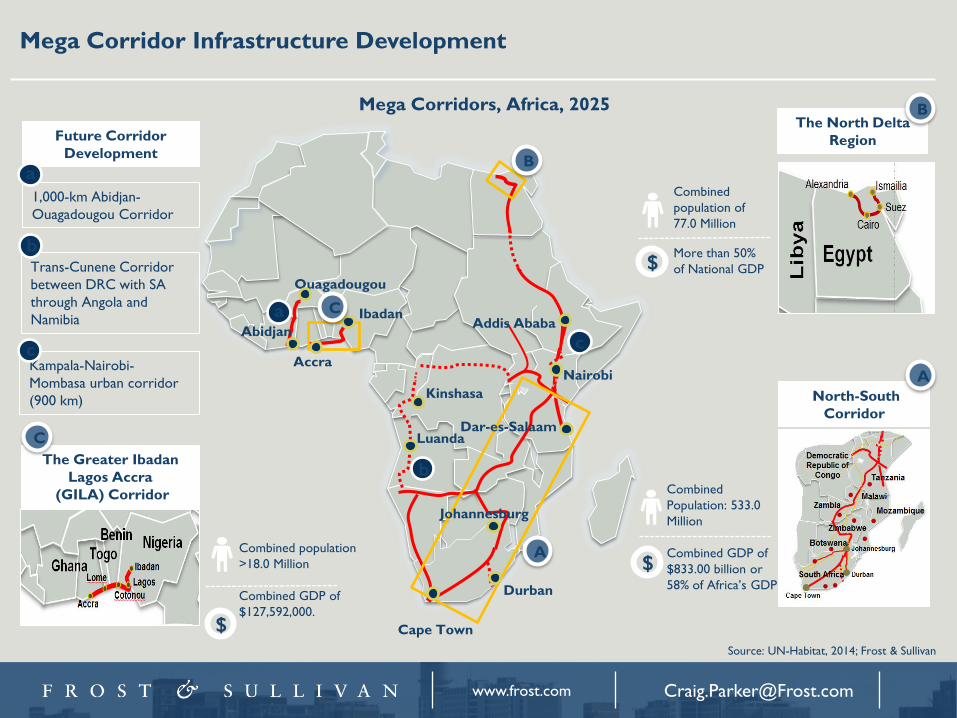
Mega Corridor Infrastructure Development
Source: UN-Habitat, 2014; Frost & Sullivan
Combined population
>18.0 Million
Combined GDP of
$127,592,000.
North-South
Corridor
The Greater Ibadan
Lagos Accra
(GILA) Corridor
The North Delta
Region
Combined
Population: 533.0
Million
Combined GDP of
$833.00 billion or
58% of Africa’s GDP
More than 50%
of National GDP
Abidjan
Ouagadougou
Ibadan
Accra
Luanda
Kinshasa
Cape Town
Durban
Johannesburg
Dar-es-Salaam
Nairobi
Addis Ababa
A
Future Corridor
Development
1,000-km Abidjan-
Ouagadougou Corridor
Trans-Cunene Corridor
between DRC with SA
through Angola and
Namibia
Kampala-Nairobi-
Mombasa urban corridor
(900 km)
A
B
B
C
C
a
Mega Corridors, Africa, 2025
$
Combined
population of
77.0 Million
$
$
b
c
a
b
c
[email protected] www.frost.com
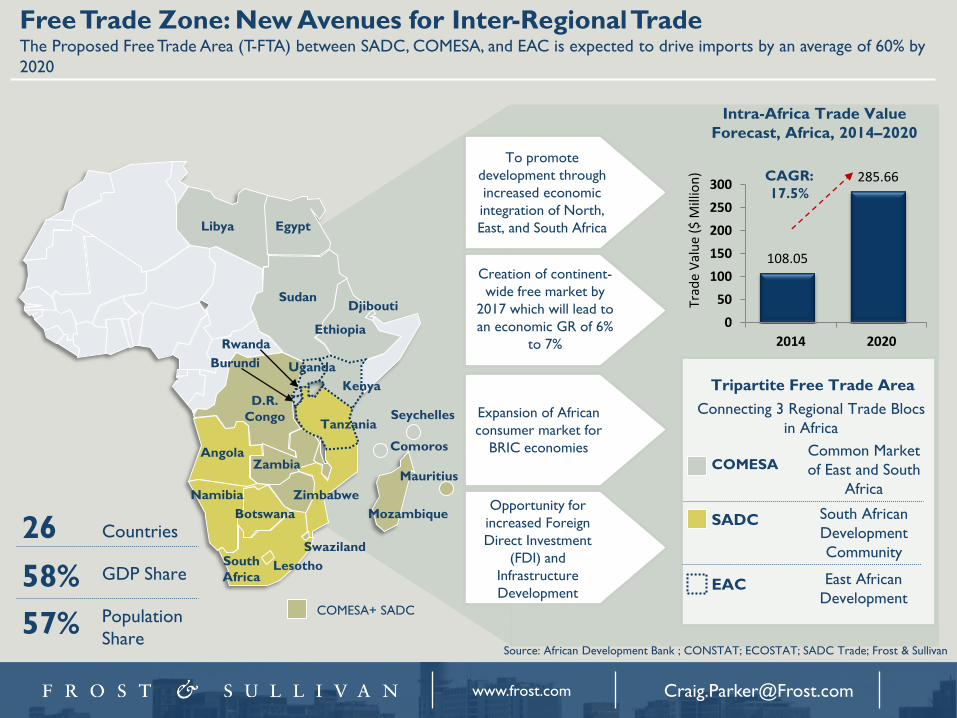
Free Trade Zone: New Avenues for Inter-Regional Trade The Proposed Free Trade Area (T-FTA) between SADC, COMESA, and EAC is expected to drive imports by an average of 60% by
2020
Tripartite Free Trade Area
Connecting 3 Regional Trade Blocs
in Africa
Libya Egypt
Sudan
Ethiopia
Djibouti
Kenya
Uganda
D.R.
Congo Tanzania
Rwanda
Burundi
Angola
Namibia
Botswana
South
Africa Lesotho
Mozambique
Zimbabwe
Zambia
Swaziland
Mauritius
Comoros
Seychelles
COMESA+ SADC
To promote
development through
increased economic
integration of North,
East, and South Africa
Intra-Africa Trade Value
Forecast, Africa, 2014–2020
26
58%
57%
Countries
GDP Share
Population
Share
COMESA
SADC
EAC
Common Market
of East and South
Africa
South African
Development
Community
East African
Development
Creation of continent-
wide free market by
2017 which will lead to
an economic GR of 6%
to 7%
Expansion of African
consumer market for
BRIC economies
Opportunity for
increased Foreign
Direct Investment
(FDI) and
Infrastructure
Development
Source: African Development Bank ; CONSTAT; ECOSTAT; SADC Trade; Frost & Sullivan
108.05
285.66
0
50
100
150
200
250
300
2014 2020
Trad
e V
alu
e ($
Mill
ion
) CAGR:
17.5%
[email protected] www.frost.com
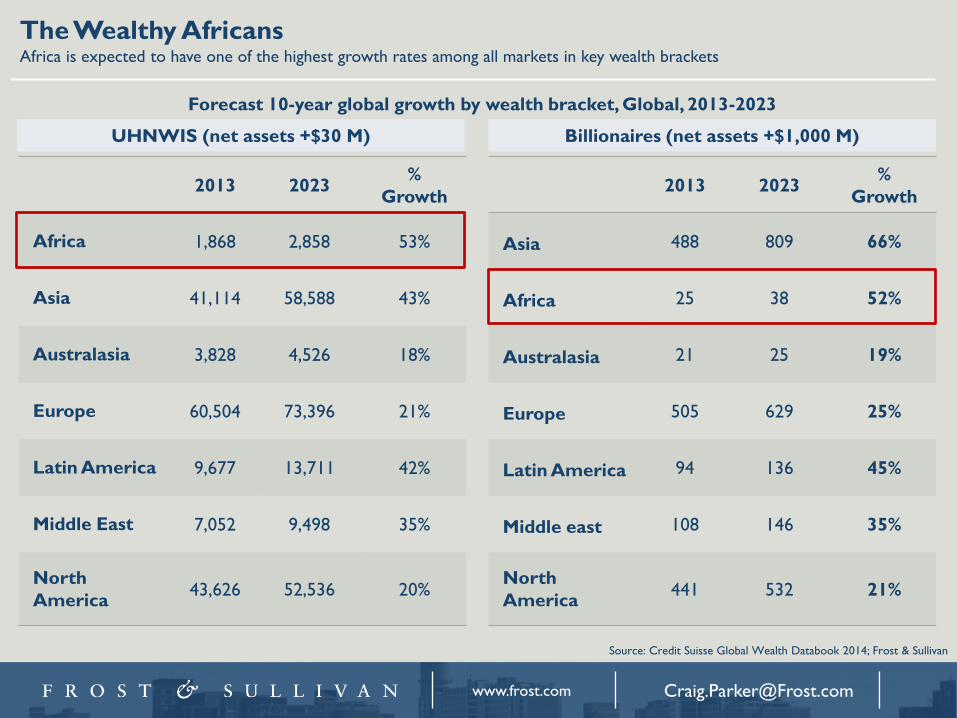
The Wealthy Africans Africa is expected to have one of the highest growth rates among all markets in key wealth brackets
Source: Credit Suisse Global Wealth Databook 2014; Frost & Sullivan
2013 2023 %
Growth
Africa 1,868 2,858 53%
Asia 41,114 58,588 43%
Australasia 3,828 4,526 18%
Europe 60,504 73,396 21%
Latin America 9,677 13,711 42%
Middle East 7,052 9,498 35%
North
America 43,626 52,536 20%
2013 2023 %
Growth
Asia 488 809 66%
Africa 25 38 52%
Australasia 21 25 19%
Europe 505 629 25%
Latin America 94 136 45%
Middle east 108 146 35%
North
America 441 532 21%
UHNWIS (net assets +$30 M) Billionaires (net assets +$1,000 M)
Forecast 10-year global growth by wealth bracket, Global, 2013-2023

[email protected] www.frost.com
Infrastructure Spending Growth Infrastructure gap in SSA to drive infrastructure spending and PPP opportunities in the next decade
• Strong drive to
agricultural development
in Zambia, Kenya and
Nigeria
• 40,000 MW Grand Inga
Hydropower project
(DRC, South Africa)
• Significant gas development in
Mozambique and Nigeria
• Trans-Sahara natural gas
project (Nigeria, Niger,
Algeria)
•Mombasa-Kigali railway and highway (Kenya
and Tanzania)
•North-South Africa corridor (South Africa,
Zambia, Botswana, DRC, Malawi)
• LAPSSET Corridor (Kenya, South Sudan,
Ethiopia)
Nigeria DRC
Ghana
South Africa
Infrastructure spending to
grow by more than 10% annually in SSA to 2025
48 countries in SSA
(population 800 million)
generate the same amount of
power as Spain (population 45
million)
Addressing Africa’s
infrastructure deficit is
estimated at $90bn
new investment per
year till 2025
Kenya
Mozambique
Angola
Key Investment Destinations In SSA, 2015-
2025
Source: Frost & Sullivan

[email protected] www.frost.com
African Airport Infrastructure Development Major developments in air transport infrastructure underway in Africa
Asia Pacific
34.6%
Europe
21.4%
North America
19.4%
Middle East
11.5%
Africa
8.5%
Latin America
4.6%
$467.9 B Global airport infrastructure
investment in on-going
projects
$39.6 B African airport
infrastructure
investment in on-
going projects
Share of Global Airport Infrastructure Investment,
On-going & Planned as of 2015
Source: Frost & Sullivan
[email protected] www.frost.com
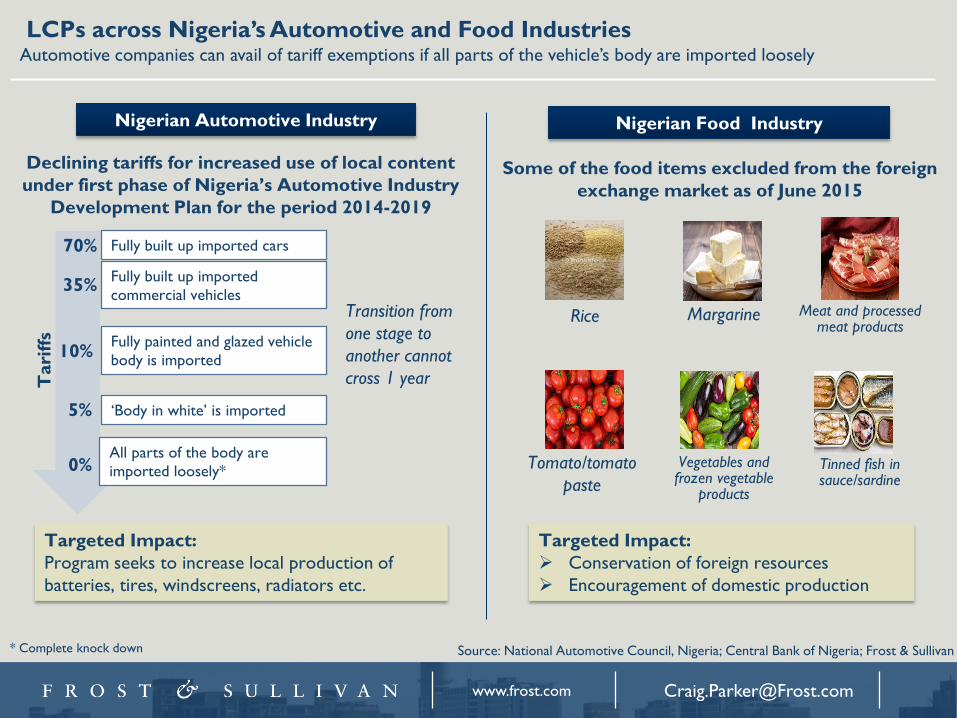
LCPs across Nigeria’s Automotive and Food Industries Automotive companies can avail of tariff exemptions if all parts of the vehicle’s body are imported loosely
Nigerian Automotive Industry Nigerian Food Industry
Declining tariffs for increased use of local content
under first phase of Nigeria’s Automotive Industry
Development Plan for the period 2014-2019
Tari
ffs
Fully built up imported cars
Fully built up imported
commercial vehicles
Fully painted and glazed vehicle
body is imported
‘Body in white’ is imported
All parts of the body are
imported loosely*
Transition from
one stage to
another cannot
cross 1 year
70%
35%
10%
5%
0%
Source: National Automotive Council, Nigeria; Central Bank of Nigeria; Frost & Sullivan
Some of the food items excluded from the foreign
exchange market as of June 2015
* Complete knock down
Targeted Impact:
Conservation of foreign resources
Encouragement of domestic production
Targeted Impact:
Program seeks to increase local production of
batteries, tires, windscreens, radiators etc.
Rice Margarine Meat and processed meat products
Tomato/tomato
paste
Vegetables and frozen vegetable
products
Tinned fish in sauce/sardine
[email protected] www.frost.com
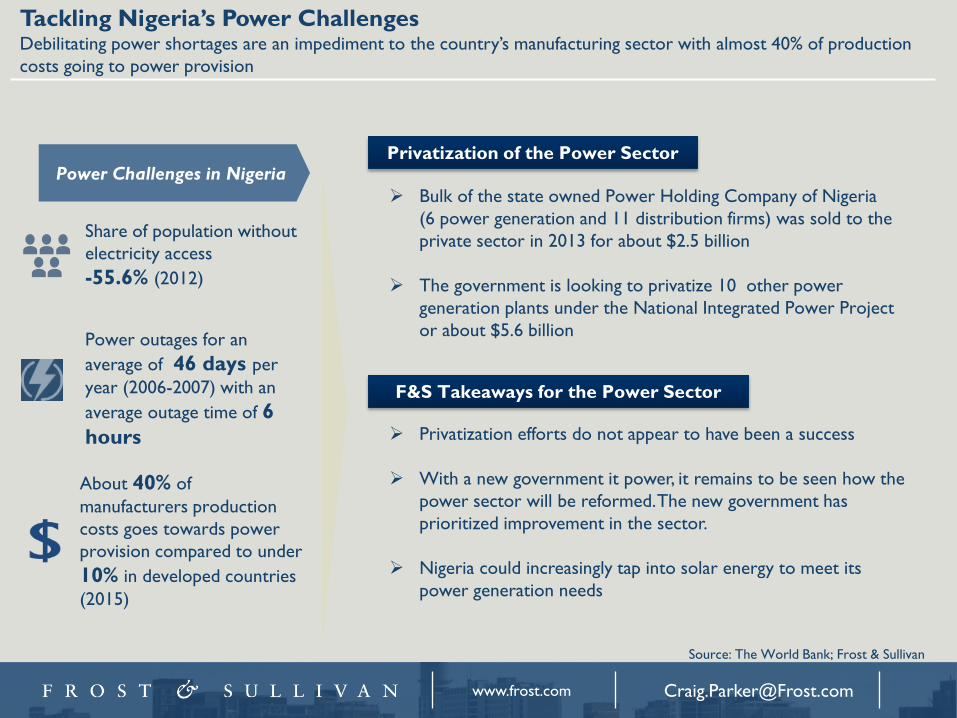
Tackling Nigeria’s Power Challenges Debilitating power shortages are an impediment to the country’s manufacturing sector with almost 40% of production
costs going to power provision
Source: The World Bank; Frost & Sullivan
Power Challenges in Nigeria
Share of population without
electricity access
-55.6% (2012)
Power outages for an
average of 46 days per
year (2006-2007) with an
average outage time of 6
hours
About 40% of
manufacturers production
costs goes towards power
provision compared to under
10% in developed countries
(2015)
Privatization of the Power Sector
Bulk of the state owned Power Holding Company of Nigeria
(6 power generation and 11 distribution firms) was sold to the
private sector in 2013 for about $2.5 billion
The government is looking to privatize 10 other power
generation plants under the National Integrated Power Project
or about $5.6 billion
F&S Takeaways for the Power Sector
Privatization efforts do not appear to have been a success
With a new government it power, it remains to be seen how the
power sector will be reformed. The new government has
prioritized improvement in the sector.
Nigeria could increasingly tap into solar energy to meet its
power generation needs

[email protected] www.frost.com
Africa growth drivers and opportunities – challenges ahead
$645
$383
$138 $164 $150
$40 $108
$811
$408
$241 $249
$168
$91
$199
2010
2014
$373 $410
$342
$295
$157
$276
$66
$533
$470
$410 $393
$316 $279
$119
2010
2014
Nigeria DRC
Ghana
South Africa
Kenya
Mozambique
Angola 3.4%
1.8%
3.4%
6.3%
Ethiopia
6.9%
Tanzania 6.7%
7.5%
3.5% 5.7%
Automotive Exports to Africa, 2010 and 2014 (US$ million)
Machinery Exports to Africa, 2010 and 2014 (US$ million)
Average GDP Growth Forecast, 2016-2021
Source: Trademap, IMF and Frost & Sullivan
Thank you Samantha James
Corporate Communications
Frost & Sullivan Africa
+27 (0) 21 680 3574