economic brief - industrial policy at the service of ... · afdb african development bank...
TRANSCRIPT

AfDB
A f r i c a n D e v e l o p m e n t B a n k
Industrial Policy at the Service of Balanced Territorial Development inTunisia
2014www.afdb.org
E c o n o m i c B r i e f
CONTENTS
Summary p.1
1 – Introduction p.2
2 – Agglomeration, SpatialDisparities and IndustrialPolicies: Brief Overviewof the Theoretical andEmpirical Literature p.3
3- Analysis of IndustrialSector SpatialConcentration in Tunisia p.5
4- Agglomeration of Industrial Activities in Tunisia: An Exploratory Analysis of Spatial Data p.12
5- Conclusion: IndustrialPolicy Implications p.17
Annexes p.21
BibliographicalReferences p.27
Zondo SakalaVice [email protected]
Jacob KolsterDirector ORNA [email protected]+216 7110 2065
Summary
The purpose of this study is to analyse the
extent to which new industrial policy
components can facilitate the achievement of
more balanced territorial development in
Tunisia. To that end, we initiated a statistical
analysis of spatial concentration in Tunisia by
calculating the Herfindahl and Ellison & Glaeser
indices of the various regions and industrial
sectors. We then studied the interactions
between neighbouring regions to determine the
agglomeration of industrial activities using
spatial data exploratory analysis tools. The
empirical results show that Tunisia’s industrial
fabric has two spatial agglomeration patterns:
first of all, the coastal governorates, which are
more developed, have relatively diversified
industrial activities; and, secondly, the
governorates in the hinterlands and in southern
Tunisia, which are less developed, have a less-
diversified industrial structure. To guarantee the
achievement of more balanced industrial
development, we propose the adoption of new
industrial policy components that will generate
synergies of proximity between hinterland
governorates and their coastal neighbours in
order to trigger a partial migration of labour-
intensive activities to disadvantaged regions.
Such regions will have to start by optimizing
their current specialties before embarking on
diversification.
This paper was prepared by Dr. Zouhour Karray (Coordinateur, Professeur, Département Economie Université de Tunis) et Dr. Slim Driss (Maître de Conférences, Département Economie Université de Tunis), under the supervision of Vincent Castel (Chief Economist, ORNA) and Sahar Rad (Senior Economist, ORNA). Overall guidance was received from Jacob Kolster (Director, ORNA).

A f r i c a n D e v e l o p m e n t B a n k
2
AfDB E c o n o m i c B r i e f
2 0 1 4 • w w w . a f d b . o r g
1. Introduction
For a long time, industrial development policies have been considered
the strategic pillar that guarantees growth and economic
development in Tunisia. More precisely, industrialisation, technological
catch-up and policies that ensure trade liberalization and export
promotion are deemed the key measures of economic development.
However, these concepts bear little or no relationship to territorial
development in some regions. Consequently, although Tunisia has been
able to achieve economic growth rates of approximately 5% since the
late 1990s, the fruits of this growth have not been equitably distributed
among the various regions (especially between the coastal and hinterland
regions). Regional disparity issues only caught the attention of policy
makers and economists studying Tunisia’s economy after the events
of 14 January 2011.
Several studies have been conducted on spatial disparities in Tunisia
and their impact on regional development. These studies: i) focused
attention on certain regions like Zaghouan, which underwent remarkable
development during the last decade (Kriaa and Montacer, 2009); ii)
analysed traditional sectors like the textile industry that experienced a
recession (Driss, 2009); iii) identified the factors that account for the
geographic location of foreign investments (Karray, 2009); or lastly and
in general, iv) analysed the determinants of regional growth (Karray and
Driss, 2009). Other studies assessed regional poverty (Montacer et al.,
2010; Ayadi and El Lahga, 2006) and reviewed the impact of economic
openness on regional disparities in Tunisia (Kriaa, Driss and Karray,
2011). However, none of the above studies dwelt on the role that
industrial policy can play in territorial development and regional
convergence.
The purpose of this study is to analyse the extent to which new industrial
policy components can facilitate the achievement of more balanced
territorial development in Tunisia. More precisely, this study has a dual
objective. Firstly, it seeks to provide much-needed clarifications on the
concepts of industrial concentration and agglomeration, considered to
be the causes of regional disparities, by identifying the specificities of
each region. Secondly, it proposes some economic policy measures
that can ensure a certain degree of regional convergence by blending
industrial policy with regional development policy.
The rest of the paper is structured as follows: Section two provides a
brief overview of the theoretical and empirical literature on industry
agglomeration, its impact in terms of spatial disparities and the renewed
role that industrial policy can henceforth play to guarantee the attainment
of more balanced territorial development. Section three makes a
statistical analysis of spatial concentration in Tunisia by calculating the
Herfindahl and Ellison & Glaeser indices of various regions and industrial
sectors. Section four studies the interactions between neighbouring
regions and determines industrial agglomeration using spatial data
exploratory analysis tools. Relying on the results obtained from analyses
of geographic concentration and spatial auto-correlation, the last section
of the paper concludes by proposing new industrial policy measures
that guarantee more balanced territorial development.

A f r i c a n D e v e l o p m e n t B a n k
3
E c o n o m i c B r i e f
2 0 1 4 • w w w . a f d b . o r g
AfDB
2. Agglomeration, Spatial Disparities and Industrial Policies: Brief Overview ofthe Theoretical and Empirical Literature
The agglomeration of productive activities creates positive
feedback loops that new economic geography associates with
externalities: the location of an activity in a given locality attracts other
activities and this engenders a "virtuous circle" for the host locality
while creating a "vicious circle" for other localities which perforce
gradually lose their appeal. This is the foundation of the core-periphery
model described by Krugman (1991). Indeed, the effects of spatial
agglomeration are ambiguous from the territorial development
standpoint. By encouraging the spatial concentration of activities in
certain localities of the national territory (usually urban areas), this
phenomenon triggers an exodus from localities that do not benefit
from a spatial positive feedback (essentially rural areas). Such
aggravation of geographic inequalities prompts the following question:
At what point does a locality cease to be unappealing for business
and becomes an attractive space, and vice versa?
Local economic development is based on positive externalities, be
they pecuniary or technological in origin. In the first case, the location
of an activity could have a catalytic effect on the development of
complementary activities. Externalities linked to supply and demand
both upstream (backward linkages) and downstream (forward linkages)
reinforce each other to create concentration phenomena. The
attraction of businesses to agglomerations is enhanced by the
existence of a large customer base, the availability of specialised
suppliers and a skilled and diversified labour force. According to
Venables (1996), firms tend to agglomerate because of externalities
related to labour supply, demand for goods, and inter-firm input-
output externalities.
Technological externalities refer to interactions between productive
processes that do not transit through the market. By nature, they are
intangible and hardly identifiable or measurable. The concentration of
activities in a region creates economies of scale that are external to
the firm (within the meaning of Marshall) and internal to the region in
question (Catin et al., 2007). The role played by externalities differs
depending on: i) whether the economies of agglomeration are internal
to one industry or generated among various industries; ii) the role played
by the level of local competition. Hence, a distinction is made between
three types of dynamic externalities. MAR (Marshall-Arrow-Romer)
externalities, which relate to the presence of intra-industry economies
of agglomeration, boost regional specialisation and account for the
growth of a particular industry and of the region in which that industry
developed; Jacobs externalities (1969, 1984) result from a region's
industrial diversity and create economies of agglomeration that are
external to the firm and the sector, but internal to the region.
Pioneer empirical studies based on the contributions of the endogenous
growth theory (Romer 1986; Lucas 1988), explain the growth of towns
in developed countries (Glaeser et al., 1992; Henderson et al., 1995)
in terms of their industrial structures, explicitly introducing the role of
dynamic externalities. Drawing on these works and considering the
specificities of developing countries, certain empirical studies (Catin
et al., 2007; Karray and Driss, 2009; Amara and Thabet, 2012) explore
this research avenue to determine the extent to which the industrial
structure of a region determines its growth. These studies found that
both pecuniary and technological externalities are responsible for the
growth of certain regions to the detriment of others, but failed to
mention the role that public authorities can play to achieve more
balanced territorial development.
Hence, this raises the question of territorial regulation that must be
directly related to the local industrial structure. This situation prompted
Rodrik (2004) to state that industrial policy is back, especially in countries
currently engaged in policy renewal efforts. Industrial policy renewal
must introduce at least two essential elements. Firstly, the State must
reduce its erstwhile role of omnipresent stakeholder who allocates
resources and dictates action, and assume the role of an economic
stakeholder capable of creating an enabling environment and establishing
institutions that rally the economic activity around one or several industrial
activities with high growth potential for the region. Hence, according to
Bourque et al. (2013), industrial policy is gradually emerging as the ideal
strategy for guiding and developing the potential of a region and/or
industry because, although it certainly seeks to achieve results, it strives
above all to enhance and boost the performance of each economic
stakeholder.
Secondly, the fundamentals of a new industrial policy should focus
more on industrial activities with high value-added, by giving priority
to: i) resource development that focuses on skills and qualification; ii)
research and innovation efforts; and iii) more balanced territorial
development. In this regard, the OECD (2012) considers that the long-
neglected linkage between industrial policy and territorial development

A f r i c a n D e v e l o p m e n t B a n k
4
AfDB E c o n o m i c B r i e f
2 0 1 4 • w w w . a f d b . o r g
must be factored into any industrial policy renewal drive so as to reduce
the imbalance between a developed centre and neglected suburbs.
Each region has its own cultural, social and historical specificities that
fashion its industrial development. Hence, supporting regional industrial
development requires the design of specific programmes that target
priority regions and the encouragement of inter-regional cooperation.

A f r i c a n D e v e l o p m e n t B a n k
5
3. Analysis of Industrial Sector Spatial Concentration in Tunisia
The statistical analysis of industrial sector spatial concentration (and
resulting regional specialization) is often based on the calculation
of indices that show the degree of regional inequality. Spatial
concentration determines whether a given sector is more or less
concentrated among the regions, while specialization determines
whether a particular region enjoys more or less equitable distribution of
sectors. Hence, it can be said that “the obverse side of any spatial
concentration index of a sector among various regions is the
specialisation index of a region in terms of sector composition”1 (unofficial
translation). Consideration of this dual dimension of industrial/spatial
concentration brings out salient facts about regional disparities in Tunisia.
Currently, this is a highly topical issue in Tunisia, which has the following
geographic/administrative structure: 6 regions, comprising a total of 24
governorates, in turn sub-divided into 263 delegations. Empirical studies
conducted hitherto on Tunisia focus on an aggregated geographic level,
namely the regions (Karray and Driss, 2006). This masks any disparities
that could exist within the same region. Other studies conducted
on much smaller geographical units, namely the delegations, show
disparities at a precise geographic level but remain limited to a single
year for want of data2 (Kriaa, Driss and Karray, 2011) or merely analyse
disparities within the capital city (Greater Tunis) alone (Amara, 2009).
Our study will focus on an intermediate geographic level, namely the
governorates, for which data is available for several years. We will start
by presenting the variables used, the data sources and the indices to
be calculated. Secondly, the empirical results will be presented and
interpreted.
3.1. Presentation of Variables, Data and Indices
To consider the key industrial structure components that indicate regional
disparities, we will analyse variables of the industrial fabric, in general,
and those of foreign-owned companies, in particular. From the early
1990s, Tunisia embarked on a trade liberalization and capital movements
process that generated, inter alia, foreign direct investment (FDI) inflows.
Consideration of the variables of foreign-owned companies will show
the extent to which the establishment of such companies reduces or
aggravates regional disparities in Tunisia. Hence, the variables considered
in the calculation of concentration indices are: number of industrial
companies with over 10 employees (NE), employment created by such
companies (Emp), number of foreign-owned companies (NE-FDI),
employment created by these companies (Emp-FDI) and the foreign
direct investment stock (Stock-FDI). These variables are broken down
by manufacturing sector and by governorate (see Annex 1 for the list
of governorates per region and the nomenclature of manufacturing
sectors).
The data analysed for variables of the industrial fabric in general was
collected from the Agency for the Promotion of Industry and Innovation
in Tunisia (APII) while data on FDI variables came from the Foreign
Investment Promotion Agency (FIPA)3. The statistical analysis proposed
here focuses on four years, namely 2000, 2005, 2010 and 20124.
The indicator widely used to measure inequalities is the Gini index,
which was initially adopted to evaluate income inequalities among
individuals. It was subsequently applied to spatial and industrial
economics to evaluate the spatial concentration of economic activity
(employment, production, investment, etc.). However, this index cannot
be used to determine diversification or specialization of concentrated
activities. Hence, we will consider two concentration indices often used
in industrial economics and which facilitate the determination of the
region’s industrial structure. These are the Herfindhal index and the
Ellison and Glaeser index (see Annex 2 for a detailed presentation of
both indices). The Herfindhal index measures both the spatial
concentration of an industry and the degree of specialization in a region.
However, it does not provide the overall structure of a given variable
by sector and by region. The contribution of Ellison and Glaeser (1997)
profoundly renovated the methods used to measure spatial
concentration by considering heterogeneity in the dispersal of
establishments within the governorates. The proposed index (EG)
considers the degree of industrial concentration within the sector.
1 Combes, Mayer and Thisse (2006), Économie géographique, Corpus Économie, Economica, p 276.2 It should be noted that the studies carried out in the delegations use data from the census conducted every 10 years. Meanwhile, manufacturing sector datais only available in the governorates.3 As concerns FIPA data and in a bid to respect API nomenclature, the plastics industry was included in the miscellaneous industries sector. 4 The year 2012 is fairly close to 2010, but its consideration will make it possible to take account of the post-revolution effects in Tunisia.
E c o n o m i c B r i e f
2 0 1 4 • w w w . a f d b . o r g
AfDB

A f r i c a n D e v e l o p m e n t B a n k
6
Indeed, when dealing with an industry that has a limited number of
establishments (monopolistic structure of the sector), it is quite
predictable that employment will be concentrated in the same areas,
and this influences the spatial concentration of the sector. The resulting
spatial concentration clearly stems from the fact that employment is
itself concentrated in a small number of establishments.
Hence, the Ellison and Glaeser index makes it possible to establish
simultaneously the diversity of industrial sectors (Jacobs’ externalities)
or local sectoral specialisation (MAR externalities). Governorates with
a low EGg index value are characterised by great diversity in their
activities. In contrast, governorates with a high value for this index are
characterised by concentration of their activities around certain specific
sectors.
3.2. Presentation and Interpretation of Results
Tables 1 and 2 present the spatial concentration trends of various
industrial sectors between 2000 and 2012, as regards employment and
number of companies, respectively.
AfDB E c o n o m i c B r i e f
2 0 1 4 • w w w . a f d b . o r g
SectorsEmp Emp-FDI
2000 2005 2010 2012 2000 2005 2010 2012
IAA 0.116 0.109 0.095 0.095 0.147 0.131 0.128 0.127
IMCCV 0.094 0.090 0.085 0.080 0.154 0.144 0.117 0.107
IMM 0.149 0.138 0.134 0.132 0.104 0.119 0.160 0.155
IEE 0.167 0.148 0.103 0.112 0.176 0.153 0.112 0.116
ICH 0.137 0.130 0.117 0.114 0.173 0.151 0.194 0.192
ITH 0.141 0.138 0.129 0.127 0.143 0.137 0.135 0.137
ICC 0.201 0.180 0.141 0.136 0.210 0.218 0.191 0.182
ID 0.094 0.093 0.090 0.089 0.106 0.108 0.121 0.117
Total Industries 0.095 0.092 0.085 0.085 0.115 0.111 0.100 0.101
Table 1: Geographic Concentration Index Trends, as Regards Employment per Sector between 2000 and 2012
SectorsNE NE-FDI
2000 2005 2010 2012 2000 2005 2010 2012
IAA 0.078 0.072 0.065 0.064 0.109 0.105 0.095 0.092
IMCCV 0.078 0.071 0.065 0.063 0.131 0.108 0.118 0.114
IMM 0.141 0.124 0.114 0.111 0.131 0.131 0.136 0.133
IEE 0.130 0.129 0.112 0.108 0.134 0.117 0.117 0.112
ICH 0.130 0.122 0.104 0.104 0.127 0.116 0.143 0.139
ITH 0.121 0.126 0.125 0.121 0.132 0.129 0.131 0.135
ICC 0.125 0.116 0.097 0.099 0.160 0.155 0.155 0.150
ID 0.112 0.107 0.094 0.094 0.097 0.097 0.106 0.105
Total Industries 0.089 0.084 0.079 0.077 0.112 0.105 0.104 0.104
Table 2: Geographic Concentration Index Trends, as Regards Number of Companies per Sector between 2000 and 2012

A f r i c a n D e v e l o p m e n t B a n k
7
E c o n o m i c B r i e f
2 0 1 4 • w w w . a f d b . o r g
AfDB
Table 3: Regional Specialisation Index Trends between 2000 and 2012
GovernoratesEmp Emp-FDI
2000 2005 2010 2012 2000 2005 2010 2012
Ariana 0.223 0.212 0.216 0.211 0.382 0.293 0.360 0.340
Ben Arous 0.157 0.161 0.165 0.181 0.260 0.247 0.219 0.238
Bizerte 0.341 0.332 0.330 0.324 0.348 0.339 0.277 0.274
Mahdia 0.527 0.588 0.659 0.511 0.764 0.780 0.676 0.533
Manouba 0.281 0.305 0.359 0.335 0.482 0.440 0.461 0.433
Monastir 0.578 0.612 0.630 0.626 0.806 0.813 0.692 0.695
Nabeul 0.243 0.238 0.272 0.269 0.431 0.362 0.314 0.322
Sfax 0.161 0.177 0.191 0.180 0.423 0.453 0.468 0.471
Sousse 0.183 0.179 0.206 0.206 0.307 0.321 0.288 0.284
Tunis 0.194 0.193 0.191 0.190 0.290 0.280 0.240 0.237
Beja 0.353 0.313 0.358 0.340 0.477 0.505 0.344 0.331
Gabes 0.356 0.327 0.272 0.298 0.275 0.269 0.330 0.298
Gafsa 0.451 0.346 0.248 0.237 1.000 0.562 0.591 0.552
Jendouba 0.349 0.349 0.267 0.251 0.523 0.432 0.255 0.230
Kairouan 0.450 0.360 0.262 0.257 0.301 0.370 0.292 0.274
Kasserine 0.386 0.347 0.303 0.296 0.703 0.864 0.416 0.416
Kebili 0.509 0.529 0.392 0.381 - 1.000 1.000 1.000
Le Kef 0.325 0.321 0.233 0.247 0.710 0.654 0.474 0.474
Medenine 0.326 0.322 0.331 0.338 0.561 0.269 0.400 0.411
Sidi Bouzid 0.330 0.273 0.236 0.235 0.614 0.388 0.499 0.499
Siliana 0.672 0.407 0.338 0.265 1.000 0.975 0.495 0.494
Tataouine 0.653 0.542 0.575 0.533 0.512 0.512 1.000 1.000
Tozeur 0.697 0.741 0.794 0.794 0.601 0.543 0.545 0.530
Zaghouan 0.304 0.230 0.221 0.220 0.255 0.226 0.248 0.244
Coas
tal R
egions
Hinterlan
d Reg
ions
In analysing the four years (2000, 2005, 2010 and 2012), Table 1
distinguishes between the concentration indices of total employment
and those of FDI-created employment. Table 2 presents the same
indices for total number of companies and number of foreign-owned
companies. According to Table 1, employment in the agro-food
industry (IAA) and the building materials, ceramics and glass industries
(IMCCV) is globally dispersed while FDI-created employment in both
sectors is relatively more geographically concentrated. In contrast,
employment in the mechanical and metallurgical industries (IMM),
electrical and electronics industries (IEE), chemical industries (ICH),
textiles and clothing industries (ITH) and leather and shoe industries
(ICC) is relatively more geographically concentrated. Furthermore, for
the various years under observation, FDI-created employment in these
sectors is also concentrated. Specifically, FDI-created employment
is relatively more concentrated than overall employment in the ICH,
ICC and, to a lesser extent, ITH sectors. The results on number of
companies (total and foreign-owned) presented in Table 2 generally
show the same trends.
A f r i c a n D e v e l o p m e n t B a n k
8
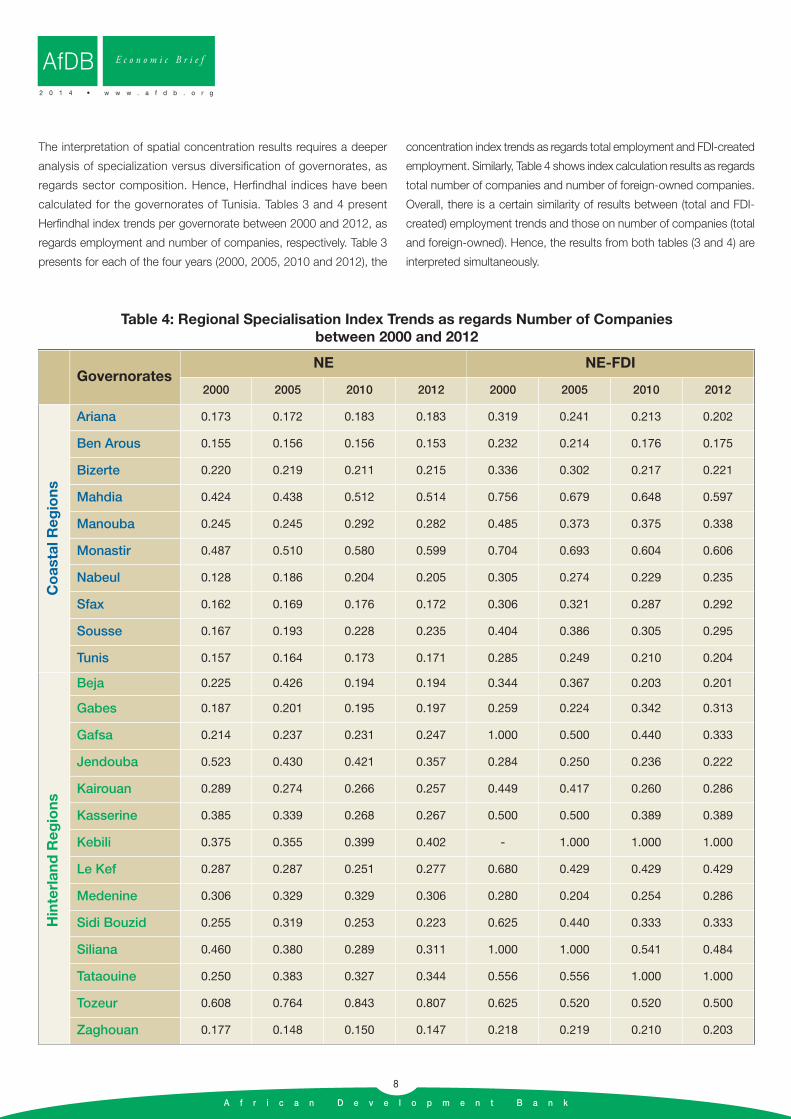
The interpretation of spatial concentration results requires a deeper
analysis of specialization versus diversification of governorates, as
regards sector composition. Hence, Herfindhal indices have been
calculated for the governorates of Tunisia. Tables 3 and 4 present
Herfindhal index trends per governorate between 2000 and 2012, as
regards employment and number of companies, respectively. Table 3
presents for each of the four years (2000, 2005, 2010 and 2012), the
concentration index trends as regards total employment and FDI-created
employment. Similarly, Table 4 shows index calculation results as regards
total number of companies and number of foreign-owned companies.
Overall, there is a certain similarity of results between (total and FDI-
created) employment trends and those on number of companies (total
and foreign-owned). Hence, the results from both tables (3 and 4) are
interpreted simultaneously.
AfDB E c o n o m i c B r i e f
2 0 1 4 • w w w . a f d b . o r g
Table 4: Regional Specialisation Index Trends as regards Number of Companiesbetween 2000 and 2012
GovernoratesNE NE-FDI
2000 2005 2010 2012 2000 2005 2010 2012
Ariana 0.173 0.172 0.183 0.183 0.319 0.241 0.213 0.202
Ben Arous 0.155 0.156 0.156 0.153 0.232 0.214 0.176 0.175
Bizerte 0.220 0.219 0.211 0.215 0.336 0.302 0.217 0.221
Mahdia 0.424 0.438 0.512 0.514 0.756 0.679 0.648 0.597
Manouba 0.245 0.245 0.292 0.282 0.485 0.373 0.375 0.338
Monastir 0.487 0.510 0.580 0.599 0.704 0.693 0.604 0.606
Nabeul 0.128 0.186 0.204 0.205 0.305 0.274 0.229 0.235
Sfax 0.162 0.169 0.176 0.172 0.306 0.321 0.287 0.292
Sousse 0.167 0.193 0.228 0.235 0.404 0.386 0.305 0.295
Tunis 0.157 0.164 0.173 0.171 0.285 0.249 0.210 0.204
Beja 0.225 0.426 0.194 0.194 0.344 0.367 0.203 0.201
Gabes 0.187 0.201 0.195 0.197 0.259 0.224 0.342 0.313
Gafsa 0.214 0.237 0.231 0.247 1.000 0.500 0.440 0.333
Jendouba 0.523 0.430 0.421 0.357 0.284 0.250 0.236 0.222
Kairouan 0.289 0.274 0.266 0.257 0.449 0.417 0.260 0.286
Kasserine 0.385 0.339 0.268 0.267 0.500 0.500 0.389 0.389
Kebili 0.375 0.355 0.399 0.402 - 1.000 1.000 1.000
Le Kef 0.287 0.287 0.251 0.277 0.680 0.429 0.429 0.429
Medenine 0.306 0.329 0.329 0.306 0.280 0.204 0.254 0.286
Sidi Bouzid 0.255 0.319 0.253 0.223 0.625 0.440 0.333 0.333
Siliana 0.460 0.380 0.289 0.311 1.000 1.000 0.541 0.484
Tataouine 0.250 0.383 0.327 0.344 0.556 0.556 1.000 1.000
Tozeur 0.608 0.764 0.843 0.807 0.625 0.520 0.520 0.500
Zaghouan 0.177 0.148 0.150 0.147 0.218 0.219 0.210 0.203
Coastal Regions
Hinterland Regions

A f r i c a n D e v e l o p m e n t B a n k
9
On the whole, calculation of the Herfindhal index on number of
manufacturing sector companies and total employment created by such
companies shows that, apart from Mahdia and Monastir governorates
that are specialised in textiles and clothing, the coastal governorates
are relatively more diversified than the hinterland governorates. It will be
noted that the index value for Zaghouan is comparable to values of the
coastal governorates because Zaghouan benefits from the externalities
of proximity to the Greater Tunis and to Nabeul governorates, leading
to the development of several sectors of activity in Zaghouan. The high
value of this index in certain hinterland governorates like Siliana, Tataouine
and Tozeur stems from the fact that a number of industrial sectors are
not represented in these governorates. Analysis of the index trends
between 2000 and 2012 shows: i) a certain degree of stability in the
diversified industrial structure of coastal governorates (except again for
Mahdia and Monastir); ii) a downward trend for most of the hinterland
governorates, which reflects slight diversification of activities. In this
regard, the industrial diversification of Kairouan stems from the
development of sectors like textiles and clothing and IEE, whereas in
2000, employment in this town was largely concentrated in the agro-
food sector. Similarly, Siliana governorate experienced diversification of
its activities in 2012 thanks to the establishment of a large foreign-
owned company in the IEE sector and the development of other industrial
sectors such as IAA. In contrast, Tozeur and Medenine governorates
are experiencing greater specialization in the agro-food sector.
Comparison of the Herfindhal indices for total employment and total
number of companies with the indices for FDI-created employment and
number of foreign-owned companies, shows that: i) For the coastal
governorates, despite the presence of FDI in almost all industrial sectors,
FDI-created employment has relatively higher values for this index. This
attests to the relative concentration of FDI, which translates into regional
specialization, such that there is an FDI concentration in the ITH sector
in Monastir and Mahdia or in the IMM sector in Ben Arous. ii) For the
hinterland governorates (except Zaghouan), the high index values
essentially stem from the fact that FDI-created employment is concentrated
in a limited number of sectors. The extreme case of Tataouine and Kebili
can be explained by the presence of a single foreign-owned company
operating in the IMCCV sector.
The spatial concentration analysis conducted hitherto (by considering
total manufacturing sector employment and manufacturing sector FDI-
created employment as well as the total number of companies and
number of foreign-owned companies) reveals at least two salient facts
about the industrial structure in the various governorates of Tunisia.
Firstly, coastal governorates, including Zaghouan, had a relatively more
diversified industrial structure while hinterland governorates experienced
more specialisation during the 2000-2012 period. Secondly, FDI
contributes in curbing the diversification observed in the coastal regions
and in boosting the specialisation of hinterland governorates.
As stated above, the Herfindhal index, although relevant, takes no
account of the relatively concentrated structure of an industry,
regardless of any spatial considerations; neither does it take account
of the more or less concentrated structure of a region, regardless of
any sector considerations. By considering the size of establishments
within an industry or governorate, the Ellison and Glaeser (EG) index
provides the necessary clarifications for the results obtained, especially
those obtained for hinterland governorates that have a very small
number of firms per sector.
Comme souligné plus haut, malgré l’intérêt que présente l’indice
d’Herfindhal, ce dernier ne tient pas compte de la structure plus ou
moins concentrée d’une industrie en dehors de toute considération
spatiale et ne tient pas compte non plus de la structure plus ou moins
concentrée d’une région en dehors de toute considération sectorielle.
La prise en compte de la taille des établissements au sein d’une industrie
ou d’un gouvernorat par l’indice d’Ellison et Glaeser (EG) permet
d’apporter les éclairages nécessaires par rapport aux résultats trouvés,
en particulier ceux relatifs aux gouvernorats de l’intérieur du pays où le
nombre de firmes par secteur peut être très réduit.
Table 5 presents a calculation of the index of various industrial sectors
for 2000 and 2012. The sectors are classified by increasing order of
spatial concentration, with 2012 as the base year. Three facts should
here be highlighted. Firstly, the ranking of sectors is relatively stable
between 2000 and 2012, albeit with a decline in index value for all
sectors. It will be noted that the EG index for the ICC sector plummeted
during this period, reflecting the transition from a concentrated sector
to a more spatially-dispersed one. Secondly, IMCCV emerges as the
most geographically dispersed sector. This result is quite predictable
since this sector largely benefitted from the presence of foreign-owned
companies5. Thirdly, compared to other sectors, ICH and ICC are
relatively the most concentrated sectors while the ITH, IEE, IMM and
IAA sectors are at an intermediate position.
E c o n o m i c B r i e f
2 0 1 4 • w w w . a f d b . o r g
AfDB
5 Figure A1 in Annex 3 shows that 38.1% of the manufacturing sector FDI stock is concentrated in the IMCCV sector, including 21% located in hinterland governorates. IMCCV is the only sector with a higher FDI stock in hinterland governorates than in coastal governorates (see Figures A1 and A2, Annex 3).

A f r i c a n D e v e l o p m e n t B a n k
10
Table 6 presents a calculation of the EG index of various governorates
for 2000 and 2012. The governorates are ranked in increasing order
of specialisation, with 2012 as the base year. This table also presents
the 2012 ranking of governorates according to the regional
development indicator calculated by Tunisia’s Ministry of Regional
Development6. The results for 2012 confirm those already obtained
using the Herfindhal index. Indeed, apart from Mahdia and Monastir
(which are relatively specialized in the textile and clothing sector),
the coastal governorates are more diversified than hinterland
governorates.
6 This is a composite index comprising 17 variables classified under four major indices: knowledge index, wealth and employment index, health and populationindex, justice and equity index (see ITCEQ, 2012, p. 22).
AfDB E c o n o m i c B r i e f
2 0 1 4 • w w w . a f d b . o r g
Table 5: Ellison and Glaeser Index per Sector
Table 6: Ellison and Glaeser Index and Regional Development Index* per Governorate
SectorsYear 2000 Year 2012
EGs Ranking EGs Ranking
IMCCV 0.0202 1 0.0130 1
ID 0.0214 2 0.0171 2
ITH 0.0367 3 0.0294 3
IEE 0.0476 6 0.0296 4
IMM 0.0430 5 0.0343 5
IAA 0.0368 4 0.0350 6
ICH 0.0541 7 0.0411 7
ICC 0.1221 8 0.0544 8
GovernoratesYear 2000 Year 2012 Year 2012
EGg Ranking EGg Ranking EGg Ranking
Ariana 0.0310 3 0.0097 1 0.69 2Sousse 0.0521 6 0.0171 2 0.62 5Nabeul 0.0228 1 0.0214 3 0.57 6Bizerte 0.0931 8 0.0425 4 0.49 14Manouba 0.0294 2 0.0507 5 0.53 9Tunis 0.0532 7 0.0588 6 0.76 1Sidi Bouzid 0.2395 14 0.0588 7 0.28 22Sfax 0.0518 5 0.0658 8 0.56 7Kairouan 0.3183 18 0.0688 9 0.25 23Ben Arous 0.0318 4 0.0767 10 0.66 3Zaghouan 0.3211 20 0.0801 11 0.39 19Kasserine 0.4807 23 0.1150 12 0.16 24Mahdia 0.1865 12 0.1291 13 0.42 15Jendouba 0.3181 17 0.1409 14 0.31 21Le Kef 0.1331 9 0.1581 15 0.40 17Monastir 0.2708 15 0.2615 16 0.64 4Medenine 0.1786 11 0.2707 17 0.50 13Beja 0.3037 16 0.2778 18 0.39 18Gabes 0.3490 21 0.3500 19 0.53 10Kebili 0.3201 19 0.4173 20 0.50 12Tataouine 0.2223 13 0.6707 21 0.55 8Tozeur 0.5621 24 0.8524 22 0.51 11Gafsa 0.4047 22 -0.0151 - 0.41 16Siliana 0.1350 100 -0.1235 - 0.36 20
* Based on statistics from the Ministry of Regional Development and Planning, November 2012.

A f r i c a n D e v e l o p m e n t B a n k
11
E c o n o m i c B r i e f
2 0 1 4 • w w w . a f d b . o r g
AfDB
EG index trends between 2000 and 2012 show that:
i) Medenine, Kebili and Tataouine governorates are increasingly
specialised, their rankings having moved from 11, 19 and 13 to 17,
20 and 21, in that order. The case of Medenine can be explained
by the fact that over 50% of employment in this governorate is
concentrated in the IAA sector. As regards Kebili, in 2000, the IAA
and IMCCV industries accounted for over 90% of employment in
the governorate. In 2012, employment in these two sectors increased
by over 10% and 12% respectively, while other sectors did not follow
the same trend. Tataouine’s case is similar to that of Kebili. Lastly,
compared to other governorates of Tunisia, Tozeur governorate is
still deemed the most specialized. Its specialization, which became
increasingly more pronounced between 2000 and 2012, stems
essentially from development of the agro-food sector in which the
number of companies almost tripled while the labour force in the
other sectors remained stable.
ii) Coastal governorates are experiencing increased diversification of
their industrial activities. Meanwhile, certain hinterland governorates
such as Kasserine, Sidi Bouzid and Kairouan are experiencing a
remarkable diversification of their industrial activities. This trend was
identified through calculation of the Herfindhal index for Zaghouan
and Kairouan, but not for Sidi Bouzid and Kasserine. As stated
above, Kairouan and Zaghouan governorates benefit from their
proximity to the Sahel and catalytic effects from Greater Tunis. In
Sidi Bouzid, employment was essentially concentrated in the IAA
sectors and various industries with a limited number of companies,
whereas in 2012, employment became relatively more diversified
with the development of approximately ten production units in the
textile and clothing sector (thus increasing employment fivefold in
this sector) and of a more limited number of production units in the
other sectors (IMM, ICH) that were previously not represented. The
situation in Kasserine governorate is similar to that in Sidi Bouzid.
iii) The EG index value for Siliana and Gafsa governorates was
negative in 2012, but stood at 0.135 for Siliana and 0.4047 for
Gafsa in 2000. It should be recalled that the Herfindhal index for
Siliana gives the impression that this governorate is specialized
since over 50% of its employment is generated in the IEE sector.
The employment generated in this sector stems from the presence
of a single foreign-owned company. Hence, it is the dominance
of this company within the governorate (quasi-monopoly of the
labour market) that accounts for the index value and the non-
specialisation of the region in the IEE sector. Similarly, the presence
of one foreign company in the IEE sector in Gafsa, which generates
close to 20% of the governorate’s total employment, lends
relatively significant weight to this company. Gafsa’s EG index
indicates that the industrial fabric is diversified simply because,
although this governorate accounted for only 1% of national
employment in 2012 (see Annex 4), its industrial structure
closely mirrors the national structure. The EG index compares
the level of industrial concentration observed in a given region
to the level that would be obtained if the same establishments
in that governorate were randomly distributed among the
sectors.
Lastly, comparison of the ranking of Tunisian governorates in
ascending order of specialisation with their ranking in ascending
order of development (according to the regional development
indicator, RDI) shows that coastal governorates, which are more
diversified, enjoy a higher level of development (RDI rankings from
1 to 9). Only Monastir and Tataouine governorates, respectively
ranked 4th and 8th, are relatively specialized. Certain governorates
occupy an intermediate position (ranked between 10th and 15th)
as regards regional development thanks to their specialization
efforts in a limited number of industrial sectors (which could
place them in a position to catch up and achieve regional
convergence).

A f r i c a n D e v e l o p m e n t B a n k
12
4. Agglomeration of Industrial Activities in Tunisia: An Exploratory Ana lys isof Spatial Data
Geographic concentration of an activity is said to occur if most of
that activity is conducted in a limited number of governorates,
regardless of their geographic position relative to the others. Hence,
the concentration indices used hitherto are a-spatial and do not show
the localization structure of industrial activities in Tunisia. In other words,
they do not make it possible to gauge the extent to which the level of
industrial activities in a governorate may influence the level of activities
in another governorate and whether it is the same or different
observations that have the most influence on the concentration of
industrial activities. Hence, it is relevant to study concentration that
takes account of the geographic position of each supposedly non-
random observation; that is, which takes account of the spatial
interactions between observations. This type of concentration is none
other than an agglomeration. It raises the assumption that a spatial
correlation exists between neighbouring governorates.
According to Anselin and Bera (1998), spatial autocorrelation translates
the idea that the recorded values of a random variable in a given
geographic entity are not displayed randomly, but rather are often
correlated for two neighbouring spatial observations (Jayet, 1993).
In other words, positive autocorrelation is reflected by a tendency
towards spatial concentration of the low or high values of a random
variable, while negative autocorrelation is characterized by wide
differences in the values of variables for neighbouring regions. The
absence of autocorrelation is reflected by a random spatial distribution
of the variable (Vasiliev, 1996). Spatial heterogeneity reflects unstable
economic relations within a geographic entity. Such instability is often
encountered. Hence, economic phenomena differ between the city
centre and city periphery, between rural and urban areas.
Spatial data exploratory analysis techniques7 are a set of statistics used
to determine the various forms of spatial heterogeneity, by relying
essentially on global and local spatial autocorrelation measures. Hence,
usage is made of spatial agglomeration indices that take account of the
relative location of governorates. These are the global Moran’s index
and the local Moran’s index. These statistics take account of the relative
positions of the various observations by considering the weight matrices
(distance or contiguity). Hence, the comparison of a spatial observation
and its neighbours is done directly and no longer ex post. Furthermore,
ESDA techniques help to determine the significance of global and local
spatial association (Le Gallo, 2002; Guillain, Le Gallo and Boiteux-Orain,
2004).
4.1. Global Spatial Autocorrelation Analysis
To evaluate the size of the agglomeration, we observe the global spatial
autocorrelation between the observations within the governorates studied.
The most used and the most widely known statistic for measuring global
spatial autocorrelation is the global Moran's I. Moran’s index is defined
as a conventional correlation coefficient. It varies between the value -1,
where there is negative spatial autocorrelation indicating the concentration
of dissimilar values, and the value 1, where there is positive autocorrelation
indicating a concentration of similar values (Anselin, 1995). Calculation
of the Moran’s I index requires the selection of a proximity matrix. Given
the size of the country (from the spatial standpoint) and the spatial
configuration of the governorates, characterized by heterogeneity in size
and surface area, we retain a contiguity matrix of 1. Hence, Table 7
presents the results of the Moran’s index calculation for each variable to
determine the degree of agglomeration.
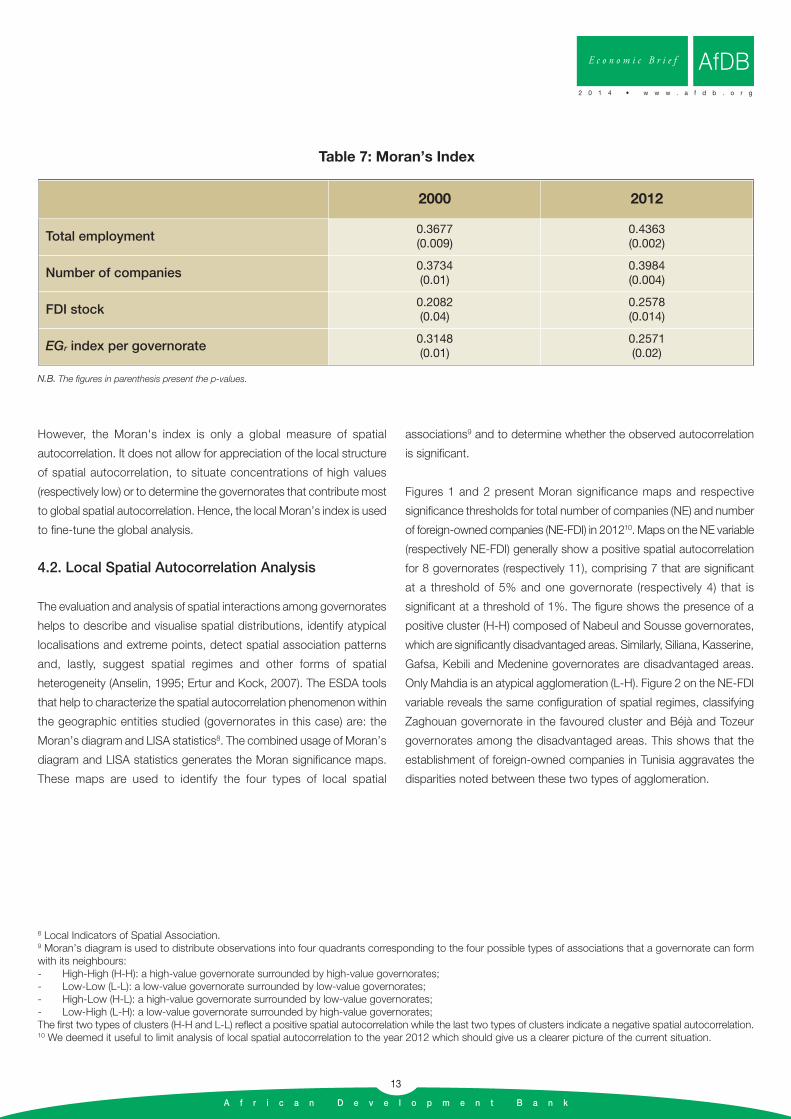
The calculations show that the Moran’s index values for all variables
considered are positive (exceed their mathematical expectation) and
relatively high for total employment in 2012. This shows that there is
significant global spatial autocorrelation of these variables among
the governorates in Tunisia. This positive relation portrays a spatial
configuration of the industrial structure, characterized by a tendency
towards spatial concentration of the low values of these variables, on
the one hand, and of the high values of the same variables, on the other
hand. All these variables are considered as agglomerated, according
to the global Moran's index, at a threshold of 5%; except for the Moran’s
indices relating to total employment (in 2000 and 2012) and to number
of companies in 2012, which are significant at a threshold of 1%.
7 These techniques are known as ESDA (Exploratory Spatial Data Analysis).
AfDB E c o n o m i c B r i e f
2 0 1 4 • w w w . a f d b . o r g
A f r i c a n D e v e l o p m e n t B a n k
13
However, the Moran's index is only a global measure of spatial
autocorrelation. It does not allow for appreciation of the local structure
of spatial autocorrelation, to situate concentrations of high values
(respectively low) or to determine the governorates that contribute most
to global spatial autocorrelation. Hence, the local Moran’s index is used
to fine-tune the global analysis.
4.2. Local Spatial Autocorrelation Analysis
The evaluation and analysis of spatial interactions among governorates
helps to describe and visualise spatial distributions, identify atypical
localisations and extreme points, detect spatial association patterns
and, lastly, suggest spatial regimes and other forms of spatial
heterogeneity (Anselin, 1995; Ertur and Kock, 2007). The ESDA tools
that help to characterize the spatial autocorrelation phenomenon within
the geographic entities studied (governorates in this case) are: the
Moran’s diagram and LISA statistics8. The combined usage of Moran’s
diagram and LISA statistics generates the Moran significance maps.
These maps are used to identify the four types of local spatial
associations9 and to determine whether the observed autocorrelation
is significant.
Figures 1 and 2 present Moran significance maps and respective
significance thresholds for total number of companies (NE) and number
of foreign-owned companies (NE-FDI) in 201210. Maps on the NE variable
(respectively NE-FDI) generally show a positive spatial autocorrelation
for 8 governorates (respectively 11), comprising 7 that are significant
at a threshold of 5% and one governorate (respectively 4) that is
significant at a threshold of 1%. The figure shows the presence of a
positive cluster (H-H) composed of Nabeul and Sousse governorates,
which are significantly disadvantaged areas. Similarly, Siliana, Kasserine,
Gafsa, Kebili and Medenine governorates are disadvantaged areas.
Only Mahdia is an atypical agglomeration (L-H). Figure 2 on the NE-FDI
variable reveals the same configuration of spatial regimes, classifying
Zaghouan governorate in the favoured cluster and Béjà and Tozeur
governorates among the disadvantaged areas. This shows that the
establishment of foreign-owned companies in Tunisia aggravates the
disparities noted between these two types of agglomeration.
8 Local Indicators of Spatial Association.9 Moran’s diagram is used to distribute observations into four quadrants corresponding to the four possible types of associations that a governorate can formwith its neighbours:- High-High (H-H): a high-value governorate surrounded by high-value governorates;- Low-Low (L-L): a low-value governorate surrounded by low-value governorates;- High-Low (H-L): a high-value governorate surrounded by low-value governorates;- Low-High (L-H): a low-value governorate surrounded by high-value governorates;The first two types of clusters (H-H and L-L) reflect a positive spatial autocorrelation while the last two types of clusters indicate a negative spatial autocorrelation.10 We deemed it useful to limit analysis of local spatial autocorrelation to the year 2012 which should give us a clearer picture of the current situation.
E c o n o m i c B r i e f
2 0 1 4 • w w w . a f d b . o r g
AfDB
Table 7: Moran’s Index
2000 2012
Total employment 0.3677(0.009)
0.4363(0.002)
Number of companies 0.3734(0.01)
0.3984(0.004)
FDI stock 0.2082(0.04)
0.2578(0.014)
EGr index per governorate0.3148(0.01)
0.2571(0.02)
N.B. The figures in parenthesis present the p-values.

A f r i c a n D e v e l o p m e n t B a n k
14
Figures 3 and 4 present the Moran significance maps and their
significance thresholds, respectively, for total employment (Emp) and
FDI-created employment (Emp-FDI) in 2012. The Emp variable shows
positive spatial autocorrelation and significance at a threshold of 5%
for 9 governorates. Meanwhile, the Emp-FDI variable shows positive
spatial autocorrelation for 10 governorates, with significance at a
threshold of 5% for 6 governorates and 1% for 4 governorates. Local
spatial autocorrelation analysis reveals spatial regimes comparable to
those observed for the variables on number of companies. Consequently,
it can be said that Nabeul and Sousse constitute the core of the affluent
cluster, while Kasserine, Gafsa, Kebili and Tataouine governorates are
the nucleus of the disadvantaged cluster.
AfDB E c o n o m i c B r i e f
2 0 1 4 • w w w . a f d b . o r g
Figure 1: Moran Significance Maps on Number of Companies in 2012
Not significant (16)
High – High (2)
Low – Low (5)
Low – High (1)
High – Low (0)
Not significant (16)
p = 0.05 (7)
p = 0.01 (1)
p = 0.001 (0)
p = 0.0001 (0)
Not significant (13)
High – High (3)
Low – Low (7)
Low – High (1)
High – Low (0)
Not significant (13)
p = 0.05 (7)
p = 0.01 (4)
p = 0.001 (0)
p = 0.0001 (0)
Figure 2: Moran Significance Maps on Number of Foreign-owned companies in 2012

A f r i c a n D e v e l o p m e n t B a n k
15
E c o n o m i c B r i e f
2 0 1 4 • w w w . a f d b . o r g
AfDB
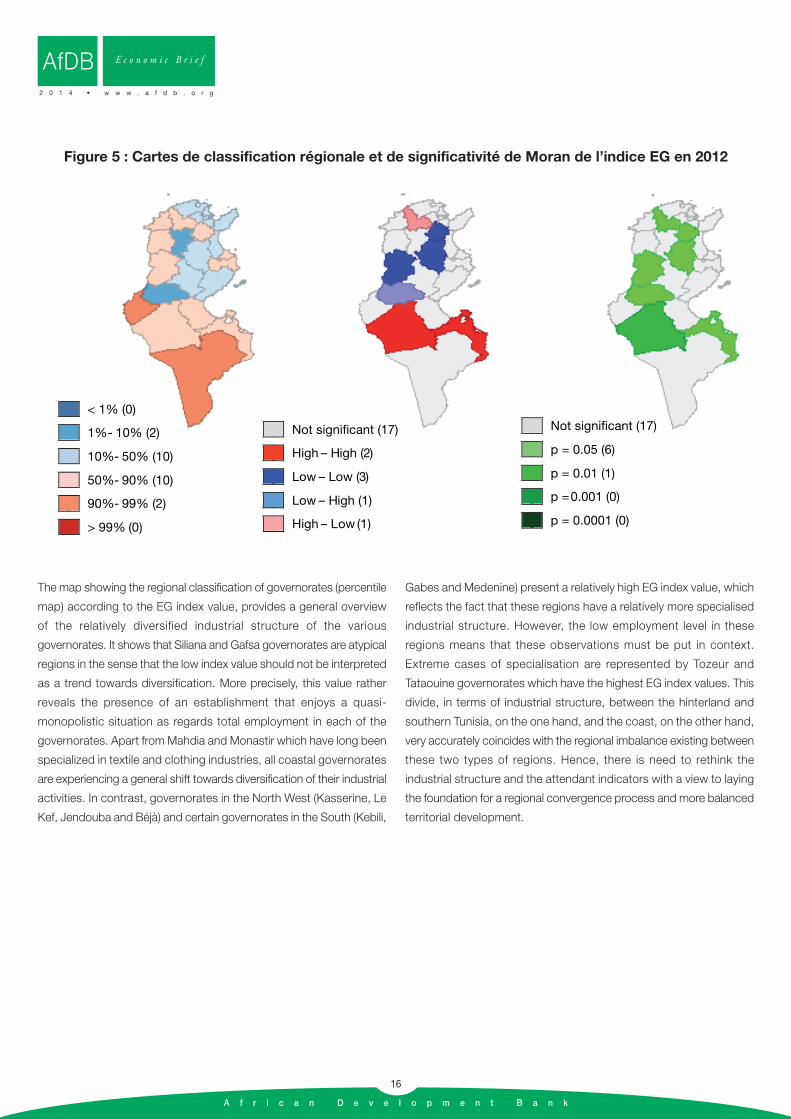
Moran significance maps and significance threshold for the EG index
(Figure 5) reveal the presence of two governorates with high index
values that are surrounded by high-value governorates. These are
Kebili and Medenine, which have an index value above average,
indicating that the region is relatively specialised in the IAA sector.
Significance at the thresholds of 1% and 5% for Kebili and Medenine,
respectively, proves that the value attributed to a governorate is
significantly influenced by the values of neighbouring governorates.
We also note a positive spatial autocorrelation (L-L) with a value below
average and significant at a threshold of 5%. This concerns Kasserine,
Kairouan and Zaghouan governorates that have low EG index values
and a positive autocorrelation with their neighbours like Sidi Bouzid,
Sfax and Sousse. These governorates are considered to be relatively
diversified and, above all, surrounded by governorates whose activities
have a diversified industrial structure. The significance maps also
reveal two atypical spatial patterns with a negative spatial
autocorrelation: the first refers to Béjà, which has a high index value
and is surrounded by low-value governorates (H-L), and the second
concerns Gafsa governorate which rather has a low index value and
is surrounded by high-value governorates (L-H).
Figure 3: Moran Significance Maps on Total Employment in 2012
Not significant (15)
High – High (3)
Low – Low (5)
Low – High (1)
High – Low (0)
Not significant (15)
p = 0.05 (9)
p = 0.01 (0)
p = 0.001 (0)
p = 0.0001 (0)
Figure 4: Moran Significance Maps on FDI-created Employment in 2012
Not significant (14)
High – High (3)
Low – Low (6)
Low – High (1)
High – Low (0)
Not significant (14)
p = 0.05 (6)
p = 0.01 (4)
p = 0.001 (0)
p = 0.0001 (0)
A f r i c a n D e v e l o p m e n t B a n k
16
AfDB E c o n o m i c B r i e f
2 0 1 4 • w w w . a f d b . o r g
Figure 5 : Cartes de classification régionale et de significativité de Moran de l’indice EG en 2012
Not significant (17)
p = 0.05 (6)
p = 0.01 (1)
p = 0.001 (0)
p = 0.0001 (0)
Not significant (17)
High – High (2)
Low – Low (3)
Low – High (1)
High – Low (1)
< 1% (0) 1% - 10% (2)
10% - 50% (10)
50% - 90% (10)
90% - 99% (2)
> 99% (0)
The map showing the regional classification of governorates (percentile
map) according to the EG index value, provides a general overview
of the relatively diversified industrial structure of the various
governorates. It shows that Siliana and Gafsa governorates are atypical
regions in the sense that the low index value should not be interpreted
as a trend towards diversification. More precisely, this value rather
reveals the presence of an establishment that enjoys a quasi-
monopolistic situation as regards total employment in each of the
governorates. Apart from Mahdia and Monastir which have long been
specialized in textile and clothing industries, all coastal governorates
are experiencing a general shift towards diversification of their industrial
activities. In contrast, governorates in the North West (Kasserine, Le
Kef, Jendouba and Béjà) and certain governorates in the South (Kebili,
Gabes and Medenine) present a relatively high EG index value, which
reflects the fact that these regions have a relatively more specialised
industrial structure. However, the low employment level in these
regions means that these observations must be put in context.
Extreme cases of specialisation are represented by Tozeur and
Tataouine governorates which have the highest EG index values. This
divide, in terms of industrial structure, between the hinterland and
southern Tunisia, on the one hand, and the coast, on the other hand,
very accurately coincides with the regional imbalance existing between
these two types of regions. Hence, there is need to rethink the
industrial structure and the attendant indicators with a view to laying
the foundation for a regional convergence process and more balanced
territorial development.

A f r i c a n D e v e l o p m e n t B a n k
17
E c o n o m i c B r i e f
2 0 1 4 • w w w . a f d b . o r g
AfDB
5. Conclusion : Conclusion: Industrial Policy Implications
The statistical analysis conducted under this study yields at least
three key findings. Firstly, measurement of the spatial concentration
of industrial activities using the Herfindhal index and the Ellison and
Glaeser index reveals the geographic concentration of certain industrial
sectors and the specialization of certain governorates. Secondly, the
use of spatial data exploratory analysis tools (global Moran’s index and
the LISA statistic) leads to the conclusion that there is a certain degree
of spatial autocorrelation since the situation of a governorate i (in terms
of employment, number of companies, etc.) is significantly influenced
by that of its neighbours, and vice-versa. Thirdly, two spatial patterns
of agglomeration characterize Tunisia's industrial fabric: on the one
hand, the governorates along the coast, which are more developed,
have relatively diversified industrial activities; and on the other hand, the
governorates in the hinterland and in southern Tunisia, which are less
developed, have a less-diversified industrial structure. More precisely,
agglomeration analysis reveals a type H-H positive cluster composed
essentially of Sousse and Nabeul governorates, and a type L-L positive
cluster composed of Kasserine and Gafsa governorates.
The industrial policy implemented hitherto in Tunisia follows a more
global process of economic openness and trade liberalization (initiated
in the early 1970s and consolidated in the mid-1990s by joining WTO
and signing free trade agreements with the European Union). Two
main measures characterise this policy: Firstly, a drive to promote
exports (initiated through Law No. 72-38) and boost corporate
competitiveness (especially for SMEs) was started to bolster the
national industrial fabric in the face of foreign competition11. Secondly,
the investment code provides for classification of the least developed
zones as regional development and priority development areas. This
classification offers a number of benefits (in the form of specific
subsidies, tax exemptions, etc.) to companies (both national and
foreign) wishing to establish in these regions. In spite of the respectable
results obtained over the last two decades with regard to economic
growth, per capita income, export growth, investments, etc., the
fallouts from these policies benefitted only a limited number of industrial
sectors and, moreover, were inequitably distributed among the various
regions of the country. The failure to closely coordinate industrial
policy measures with regional development measures foiled the
achievement of balanced territorial development. The resulting
structural imbalance between the hinterland and the coast was clearly
the root cause of the social tensions that sparked the events of 14
January 2011 in Tunisia. Hence, there is need to renew industrial
policy measures, paying close attention to the specificities
of each region. We make a distinction between suggestions for
coastal governorates and those that concern the hinterland. Besides,
supplementary regional development actions are indispensable and
constitute a prerequisite for the industrial policy measures that can
produce the expected effects, especially for hinterland regions.
Actions Specific to Coastal Governorates
It is clear that coastal governorates, including Zaghouan, enjoy a
certain degree of diversification in their productive structure that has
enabled them to achieve a certain level of economic development.
Henceforth, such diversification of industrial activities is no longer
sufficient. Rather, it seems necessary to embark on a structural
transformation process by focusing more attention on new economic
activities with higher value-added that yield higher levels of production,
stimulate innovation, reduce unemployment among university
graduates, pay higher salaries and guarantee more prosperity in the
country. Indeed, these governorates have the prerequisites for
embarking on such a process since diversification of activities has
led to the mobilisation of a skilled and diversified labour force, the
acquisition of a certain level of experience and the benefit of a learning
process driven by the pressure of foreign competition. Hence, the
new investment code should propose incentives tailored to the nature
of employment and technological content. It is clear that investors
have to be given incentives to take up activities that are less-intensive
in unskilled labour (as has been the case over the last three decades)
and more intensive in technological content. Such a policy would also
11 A large number of support programmes have been implemented under the generic appellation of “updates” to help SMEs to export and to cope with competitive pressures generated by this process by adopting new technologies, new skills, by engaging in financial and commercial restructuring, in short, byembarking on a real strategic repositioning.

A f r i c a n D e v e l o p m e n t B a n k
18
AfDB E c o n o m i c B r i e f
2 0 1 4 • w w w . a f d b . o r g
address one of Tunisia’s fundamental problems, namely graduate
unemployment. Indeed, activities with high value-added and a high
technological content require more skilled labour12.
Furthermore, the export promotion policy in general should be revised
country-wide, starting with the coastal governorates that are most ready
to engage in export modernisation and sophistication. Indeed, as
suggested by Hausmann and Rodrik (2003) and Hausmann, Hwang
and Rodrik (2006), what a country produces and exports is a lot more
important and fundamental than the value of its exports. These authors
have shown that countries with more sophisticated export baskets
record higher growth rates. This highlights the importance of a country’s
productive structure. More precisely, export growth should not be
perceived as an end in itself. On the contrary, there is need to boost
the capacity to develop more productive activities that guarantee more
sustained economic growth. The composition of a country’s export
basket influences the volume and value of its exports, increases
productivity gains and guarantees more investments in export capacity.
Embarking on such a process is completely feasible for coastal
governorates that already enjoy a certain level of development.
Actions Specific to Hinterland Governorates
As concerns the most disadvantaged governorates located in the
hinterland and in southern Tunisia, actions to be implemented must
imperatively take account of their specificities. Given the economic size
of the governorates in terms of population, labour force, investment,
etc. action should be taken at the level of the regions and not of the 13
governorates, taken separately. Indeed, only 17.9% of national
manufacturing sector employment and 22.5% of industrial companies
are found in hinterland governorates (see Annex 4). Hence, the
specialization trend detected through calculation of the Herfindhal index
and the Ellison and Gleaser index does not actually stem from a deliberate
policy but is prompted by the preponderance of a limited number of
establishments and consequently of industrial sectors.
A region’s territorial development process requires a long-term
perspective and the definition of a public development strategy that
is specific to each region and tailored to its own characteristics. Such
a strategy requires State intervention that marshals deliberate
measures to develop an industrial activity, which brings synergies to
the region and somehow serves as a stimulus triggering a cumulative
virtuous circle of external effects. As is the case with certain regions
or towns in developed countries13, the development of this activity
could, in the short term, lead to relative specialisation and promote,
in the medium and long term, the development of activities upstream
and downstream (and consequently in the entire sub-sector).
Ultimately, this development pattern could either increase the region’s
specialization or lead to diversification resulting from inter-industry
externalities.
For these reasons, public authorities in Tunisia must institute industrial
policy measures that encourage the development of one or several
industrial activities in each of the three disadvantaged regions (North
West, Centre West and South) which cover 13 hinterland governorates.
Such measures could relate to:
i) classification of development zones according to the region’s industrial
strategy;
ii) institution of a system of tax incentives (within the new investment
code) depending on the resources (material and human) and industrial
strategy of each region;
iii) the creation of techno-cities whose main role is to foster an
environment that generates synergies among the main stakeholders
in a sector of activity. For example:
• North-West Region: The main industrial sectors in this region
(comprising Béjà, Jendouba, Le Kef and Siliana governorates) are
IAA and IEE. The proximity of Bizerte, where the ITH and IEE sectors
are relatively developed, could contribute to the expansion of these
three sectors in the whole region.
12 University graduates represent almost 25% of non-engaged job seekers. Each year, close to 60,000 new graduates arrive on the job market and will repre-sent almost 70% of additional demand in 2014. The paradox is that the higher the level of education, the greater the probability of unemployment. Hence, uni-versity graduates represented only 4% of all job seekers in 1995; then the figure rose to 10% in 2004 and finally spiralled to almost 25% in 2012. In the meantime,the percentage of uneducated persons among the unemployed declined from 17% in 1995 to 12% in 2004 and finally 5% in 2012. The problem is that the eco-nomic space to employ them is currently limited given the low value-added of the key sectors of activity in Tunisia such as agriculture, which has less than 1%of persons holding a post-baccalaureate certificate (high school certificate) qualification, construction (less than 4%), textiles-leather and shoes (6%), hotels-res-taurants (7%), agro-industry (8%), etc. Hence, Tunisia’s challenge is to develop a productive sector with higher value-added that is capable of absorbing younguniversity graduates. 13 For example, we can cite the development of the Midi-Pyrénées region in France following a public decision to relocate aerospace activities from Paris to Tou-louse.

A f r i c a n D e v e l o p m e n t B a n k
19
E c o n o m i c B r i e f
2 0 1 4 • w w w . a f d b . o r g
AfDB
• Centre-West Region: The relatively developed sectors in the
governorates of this region (Kairouan, Kasserine and Sidi Bouzid)
are IAA and ITH. Certain incentive measures should trigger the
development of the IMM sector in this region by taking advantage
of its proximity to Sfax and Sousse in which the sector is relatively
well developed, just like the ITH sector expanded in Kairouan due
to that governorate’s proximity to Sousse, Monastir and Mahdia.
• South Region: In the governorates of this region (Gabes, Gafsa,
Kebili, Medenine, Tataouine and Tozeur), where total employment
in 2012 accounted for 5.28% of national manufacturing employment,
the IAA, IMCCV, ICH and ITH sectors are relatively the most
developed while the other sectors are virtually non-existent. The
industrial development of this region requires structural actions
targeting these four sectors while boosting and restructuring the
multi-sectoral competitiveness pole of Gafsa that is supposed to
serve as a catalyst which generates synergies of proximity, as well
as the sharing of information and knowledge among the region’s
establishments.
Supplementary Actions: Prerequisites of RegionalDevelopment
The industrial policy measures suggested for the various disadvantaged
regions will trigger intra- and inter-industry externalities and yield the
expected results only if certain preconditions are fulfilled in these regions.
For instance, supplementary infrastructure development actions must
be envisaged in the disadvantaged regions and should somehow
constitute a prerequisite to any regional development strategy. To ensure
more balanced territorial development (through a catch-up process that
leads to a certain degree of regional convergence), public regional
development actions must target the three priority regions (North-West,
Centre-West and South). Although founded on recent infrastructure
development statistics for the governorates/regions, such actions must
be based on a combination of the following aspects:
• Development of transport infrastructure (highways and roads)
between and to hinterland governorates to finally open up access to
these landlocked areas. According to a study conducted by the Ministry
of Development and International Cooperation in 2012, the percentage
of classified roads (which reflects level of access) per governorate
reveals great disparities between and within the governorates (that is,
between the delegations of the same governorate)14. Similarly, there
is need to develop and upgrade the inter-regional railway network to
facilitate the circulation of goods and persons.
• Reinforcement of communication infrastructure in the three regions
to encourage the creation of knowledge sharing and dissemination
networks. According to a study on the calculation of a regional
development indicator conducted by the Tunisian Institute of
Competitiveness and Quantitative Studies (ITCEQ) in 2012, one of
the components considered in this composite index is the knowledge
index15. For instance, this index is 91% and 78% for Tunis and
Sousse, respectively, but is limited to 19% and 24% for Sidi Bouzid
and Jendouba, respectively.
• Planning and development of the most important industrial zones
in the hinterland regions. According to a study conducted by the
World Bank in 2010 on competitiveness poles in Tunisia, the
projection for the creation of new industrial zones by 2016 is 40%
compared to 16% previously.
• Development of new forms of public-private partnership that boost
the competitiveness of industrial and service companies.
• A more significant contribution of the competitiveness poles (located
in Bizerte, Sousse, Monastir and Gafsa) to enhance the appeal of
the territories and the employment of experts in the region (World
Bank, 2010). These poles, created mainly in the coastal governorates
and each of which focuses on an industrial sector, should be able
to drive development (in terms of creation of businesses and jobs)
towards neighbouring hinterland governorates. Trade and partnership
initiatives should create catalytic effects and expand economic
activities from the coast to the hinterlands.
The combined effect of the new components of new industrial policies
specific to the three disadvantaged regions and the supplementary
regional development actions should, in the short term, trigger a partial
migration of labour-intensive industrial activity to the hinterland regions16.
Such migration, driven by these catalytic effects, must be oriented
towards the sectors of activity that are already relatively developed in
these regions. This would not constitute a new form of disparities
between the hinterland regions that have labour-intensive activities and
14 The share of classified roads (ratio of classified roads to the total road network in kilometres) is 10% in Sidi Bouzid and 42% in Bizerte, whereas the nationalaverage is approximately 32%.15 The knowledge index is defined as a simple average between the education index (which covers the baccalaureate enrolment rate, the school enrolment rateand the literacy rate) and the communication index (which covers internet access and telephone density).16 According to a study conducted by the World Bank in 2010 on competitiveness poles in Tunisia, this partial migration process could concern, for instance,the textile, clothing, leather and shoe sectors: 40,000 projected jobs for 2016 in the hinterland regions of Kasserine, Siliana.

A f r i c a n D e v e l o p m e n t B a n k
20
AfDB E c o n o m i c B r i e f
2 0 1 4 • w w w . a f d b . o r g
coastal regions that have activities with greater value-added since such
migration is not the initial stage of the territorial development pattern
described above.
In fine, the industrial strategy that should be pursued to achieve more
balanced territorial development is twofold. On the one hand,
re-positioning and a policy that promotes industries with higher value-
added as well as a smarter export promotion policy (since content
matters more than the value of exports) must constitute the pillars of
strategic development for the coastal governorates. On the other hand,
a strategy to consolidate achievements using material and human
resources and reliance on the synergies of proximity between hinterland
governorates and their coastal neighbours should trigger a partial
migration of labour-intensive activities towards disadvantaged regions.
Such regions will have to start by optimizing their current specialties
before embarking on diversification.


A f r i c a n D e v e l o p m e n t B a n k
22
Annex 1: List of Governorates per Region and Nomenclature of Industrial Activity Sectors
AfDB E c o n o m i c B r i e f
2 0 1 4 • w w w . a f d b . o r g
Table A1: Definition of Regions in Tunisia
Regions 2000Greater Tunis Ariana, Ben Arous, Manouba, Tunis
North East Bizerte, Nabeul, Zaghouan
North West Beja, Jendouba, Le Kef, Siliana
Centre East Mahdia, Monastir, Sfax, Sousse
Centre West Kairouan, Kasserine, Sidi-Bouzid
South Gabes, Gafsa, Kebili, Medenine, Tataouine, Tozeur
Sector Code ActivityIAA Agricultural and agro-food industries
IMCCV Construction materials, ceramics and glass industries
IMM Mechanical, metallic and metallurgical industries
IEE Electrical and electronics industries
ICH Chemical and rubber industries
ITH Textile and clothing industries
ICC Leather and shoe industries
ID Miscellaneous industries
Table A2: List of Industrial Activity Sectors
A f r i c a n D e v e l o p m e n t B a n k
23
E c o n o m i c B r i e f
2 0 1 4 • w w w . a f d b . o r g
AfDB
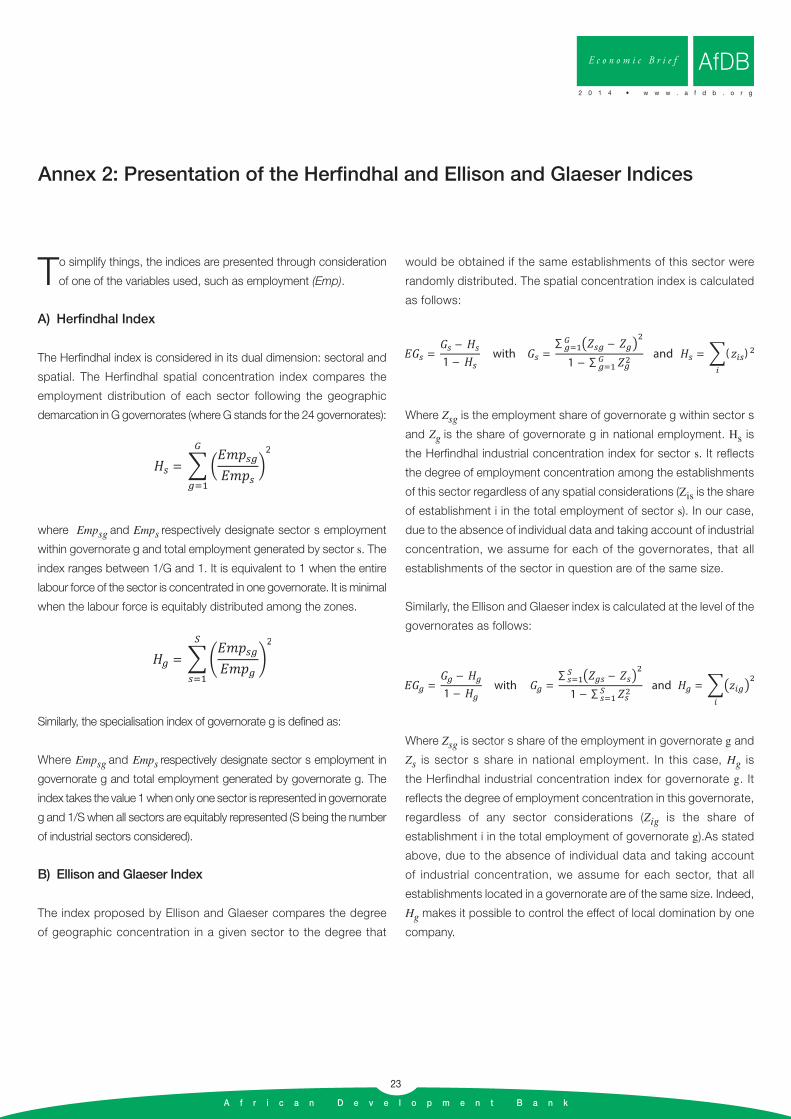
Annex 2: Presentation of the Herfindhal and Ellison and Glaeser Indices
To simplify things, the indices are presented through consideration
of one of the variables used, such as employment (Emp).
A) Herfindhal Index
The Herfindhal index is considered in its dual dimension: sectoral and
spatial. The Herfindhal spatial concentration index compares the
employment distribution of each sector following the geographic
demarcation in G governorates (where G stands for the 24 governorates):
where Empsg and Emps respectively designate sector s employment
within governorate g and total employment generated by sector s. The
index ranges between 1/G and 1. It is equivalent to 1 when the entire
labour force of the sector is concentrated in one governorate. It is minimal
when the labour force is equitably distributed among the zones.
Similarly, the specialisation index of governorate g is defined as:
Where Empsg and Emps respectively designate sector s employment in
governorate g and total employment generated by governorate g. The
index takes the value 1 when only one sector is represented in governorate
g and 1/S when all sectors are equitably represented (S being the number
of industrial sectors considered).
B) Ellison and Glaeser Index
The index proposed by Ellison and Glaeser compares the degree
of geographic concentration in a given sector to the degree that
would be obtained if the same establishments of this sector were
randomly distributed. The spatial concentration index is calculated
as follows:
Where Zsg is the employment share of governorate g within sector s
and Zg is the share of governorate g in national employment. Hs is
the Herfindhal industrial concentration index for sector s. It reflects
the degree of employment concentration among the establishments
of this sector regardless of any spatial considerations (Zis is the share
of establishment i in the total employment of sector s). In our case,
due to the absence of individual data and taking account of industrial
concentration, we assume for each of the governorates, that all
establishments of the sector in question are of the same size.
Similarly, the Ellison and Glaeser index is calculated at the level of the
governorates as follows:
Where Zsg is sector s share of the employment in governorate g and
Zs is sector s share in national employment. In this case, Hg is
the Herfindhal industrial concentration index for governorate g. It
reflects the degree of employment concentration in this governorate,
regardless of any sector considerations (Zig is the share of
establishment i in the total employment of governorate g).As stated
above, due to the absence of individual data and taking account
of industrial concentration, we assume for each sector, that all
establishments located in a governorate are of the same size. Indeed,
Hg makes it possible to control the effect of local domination by one
company.
=
=
=−
1 − with =
∑ −
1 − ∑ and = ( )
=−
1 − with =
∑ −
1 − ∑ and =

A f r i c a n D e v e l o p m e n t B a n k
24
AfDB E c o n o m i c B r i e f
2 0 1 4 • w w w . a f d b . o r g
Annex 3: Sector Distribution of FDI Stock
3.8%
14.9%
5.1%
10.5% 9.8%
17.9%
2.8% 2.5%
67.3%
0.9%
27.9%
0.4% 0.8% 0.8% 1.1% 0.2% 0.6%
32.7%
0.0%
10.0%
20.0%
30.0%
40.0%
50.0%
60.0%
70.0%
80.0%
IAA IMCCV IMM IEEE ICH ITH ICC ID Total
Coastal governorates
Interior governorates
3.8%
16.9%
9.6% 10.5% 6.2%
12.1%
2.4% 4.7%
66.3%
2.0%
21.2%
0.6% 4.2%
0.7% 1.4% 1.3% 2.3%
33.7%
0.0%
10.0%
20.0%
30.0%
40.0%
50.0%
60.0%
70.0%
IAA IMCCV IMM IEEE ICH ITH ICC ID Total
Coastal governorates Interior governorates
Figure A2: Percentage Distribution of FDI Stock (end 2012)
Figure A1: Percentage Distribution of FDI Stock (end 2000)

A f r i c a n D e v e l o p m e n t B a n k
25
E c o n o m i c B r i e f
2 0 1 4 • w w w . a f d b . o r g
AfDB
Annex 4: Number of Companies and Employment in 2012
Table A3: Distribution of Number of Companies per Governorate in 2012
Gouvernorats IAA IMCCV IMM IEEE ICH ITH ICC ID Sectortotal
Ariana 22 18 36 35 29 97 23 23 283
Ben Arous 88 27 108 74 93 93 17 42 542
Bizerte 40 18 51 35 25 114 5 14 302
Mahdia 24 5 3 1 6 100 1 4 144
Manouba 35 8 19 10 10 93 6 14 195
Monastir 33 28 25 22 22 510 8 16 664
Nabeul 125 61 70 56 39 208 18 20 597
Sfax 139 34 121 18 89 144 40 41 626
Sousse 62 28 67 25 61 224 24 37 528
Tunis 56 21 26 31 44 101 14 49 342
Zaghouan 45 35 43 37 54 43 10 12 279
Beja 44 11 10 15 14 15 5 8 122
Jendouba 37 6 3 3 0 9 7 1 66
Le Kef 20 17 4 2 2 6 0 1 52
Siliana 24 13 0 1 2 11 0 2 53
Kairouan 62 21 8 5 6 34 6 6 148
Kasserine 20 24 2 1 4 35 0 6 92
Le Sidi Bouzid 14 6 1 1 3 10 3 2 40
Gabes 27 32 19 0 14 11 1 9 113
Gafsa 28 8 3 2 7 27 4 3 82
Kebili 16 5 0 0 2 2 0 2 27
Medenine 49 15 8 1 4 16 6 0 99
Tataouine 7 6 0 0 1 1 0 1 16
Tozeur 34 0 0 0 0 3 1 0 38
Total Governorates 1051 447 627 375 531 1907 199 3131 5450
oastal & Zaghouan
North West
Centre West
South
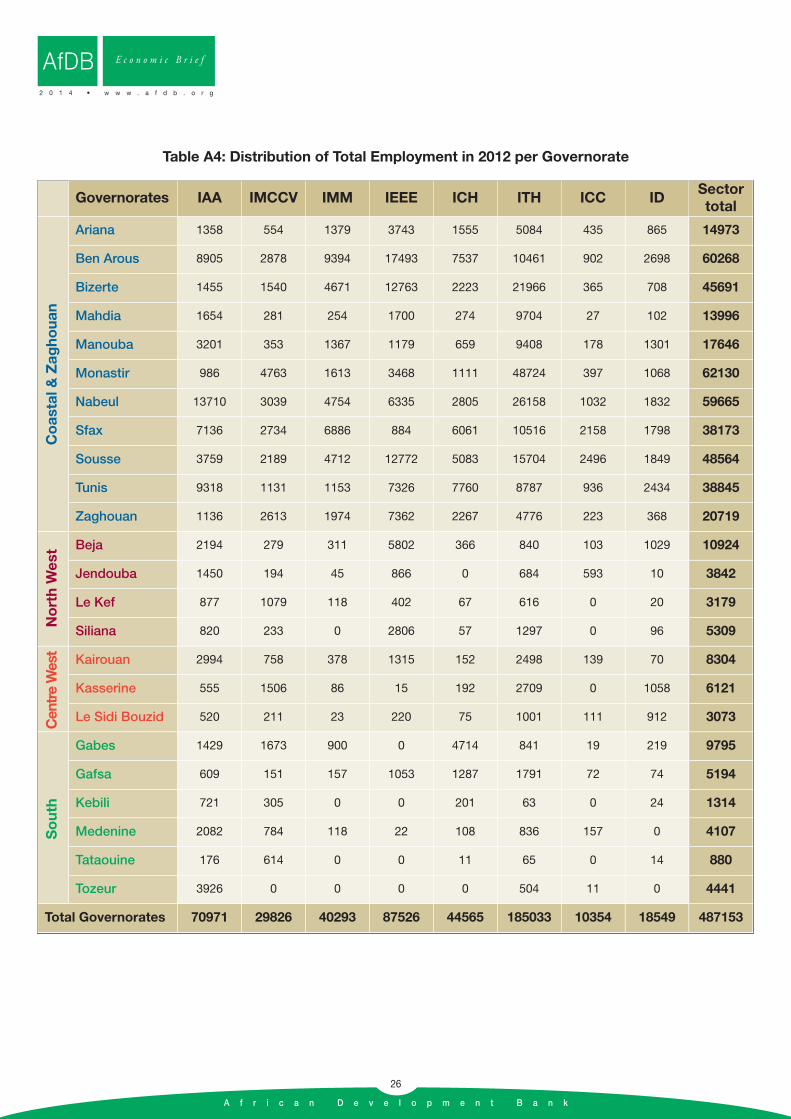
A f r i c a n D e v e l o p m e n t B a n k
26
AfDB E c o n o m i c B r i e f
2 0 1 4 • w w w . a f d b . o r g
Table A4: Distribution of Total Employment in 2012 per Governorate
Governorates IAA IMCCV IMM IEEE ICH ITH ICC ID Sectortotal
Ariana 1358 554 1379 3743 1555 5084 435 865 14973
Ben Arous 8905 2878 9394 17493 7537 10461 902 2698 60268
Bizerte 1455 1540 4671 12763 2223 21966 365 708 45691
Mahdia 1654 281 254 1700 274 9704 27 102 13996
Manouba 3201 353 1367 1179 659 9408 178 1301 17646
Monastir 986 4763 1613 3468 1111 48724 397 1068 62130
Nabeul 13710 3039 4754 6335 2805 26158 1032 1832 59665
Sfax 7136 2734 6886 884 6061 10516 2158 1798 38173
Sousse 3759 2189 4712 12772 5083 15704 2496 1849 48564
Tunis 9318 1131 1153 7326 7760 8787 936 2434 38845
Zaghouan 1136 2613 1974 7362 2267 4776 223 368 20719
Beja 2194 279 311 5802 366 840 103 1029 10924
Jendouba 1450 194 45 866 0 684 593 10 3842
Le Kef 877 1079 118 402 67 616 0 20 3179
Siliana 820 233 0 2806 57 1297 0 96 5309
Kairouan 2994 758 378 1315 152 2498 139 70 8304
Kasserine 555 1506 86 15 192 2709 0 1058 6121
Le Sidi Bouzid 520 211 23 220 75 1001 111 912 3073
Gabes 1429 1673 900 0 4714 841 19 219 9795
Gafsa 609 151 157 1053 1287 1791 72 74 5194
Kebili 721 305 0 0 201 63 0 24 1314
Medenine 2082 784 118 22 108 836 157 0 4107
Tataouine 176 614 0 0 11 65 0 14 880
Tozeur 3926 0 0 0 0 504 11 0 4441
Total Governorates 70971 29826 40293 87526 44565 185033 10354 18549 487153
Coastal & Zaghouan
North West
Centre West
South

A f r i c a n D e v e l o p m e n t B a n k
27
E c o n o m i c B r i e f
2 0 1 4 • w w w . a f d b . o r g
AfDB
Bibliographical References
Amara M. (2009), "Concentration et agglomération industrielles dans la métropole de Tunis", Revue d’Economie Régionale et Urbaine, vol. 3, pp.
599-624.
Amara M., Thabet K. (2012), Structure industrielle et développement local du littoral tunisien, 1998-2004, Mondes en Développement,
N° 157 (1), pp. 119-136.
Anselin L. (1988), "Spatial Econometrics: Methods and Models", Dordrecht: Kluwer Academic Publishers.
Anselin L. (1995), "Local Indicators of Spatial Association – LISA", Geographical Analysis, N° 27, pp. 93-115.
Anselin, L., Bera A-K. (1998), "Spatial Dependance in Linear Regression Models with Introduction to Spatial Econometrics", in Ullah (A) et Giles
(D), (eds.), Handbook of Applied Economic Statistics, New York, Marcel Dekker, pp. 237-289.
Ayadi M., El Lahga A. (2006), "Pauvreté et inégalités en Tunisie: une approche non-monétaire", ERF Conference Paper, 13th Annual Conference,
Kuwait.
World Bank (2010), Les pôles de compétitivité en Tunisie : note de problématique, March, Department of Sustainable Development, Middle East
and North Africa Region.
Bourque G-L., Perreault M., Laplante R. (2013), Politique industrielle : stratégie pour une grappe de mobilité durable, Rapport de recherche
de l’IREC, Québec, Canada, 59 p.
Catin M., Hanchane S., Kamal A., 2007, "Structure industrielle, externalités dynamiques et croissance locale au Maroc", Région et Développement,
N° 25, pp. 45-63.
Combes P., Mayer T., Thisse J-F. (2006), Economie géographique. L’intégration des régions et des nations, Corpus Économie, Economica, Paris.
Combes P., Overman H.G. (2004), "The Spatial Distribution of Economic Activities in the European Union", in Henderson J.V. & J.F. Thisse (eds.),
Handbook of Urban and Regional Economics, vol. 4.
Driss S. (2009), "Les investissements directs étrangers dans le secteur Textile Habillement en Tunisie : de nouvelles perspectives", in Mezouaghi.
M. (ed.) Les localisations industrielles au Maghreb : attractivité, agglomération et territoires, Edition Karthala, Paris, pp. 109-126.
Ellison G., Glaeser E. (1997), "Geographic Concentration in US Manufacturing Industries: a dartboard approach", Journal of Political Economy,
105, pp. 889-927.
Ertur C., Koch W. (2007), "Growth, Technological Interdependence and Spatial Externalities: Theory and Evidence", Journal of Applied Econometrics,
Vol. 22, No 6, pp. 1033-1062.
Guillain R., Le Gallo J., Boiteux-Orain C. (2004), "The Evolution of the Spatial and Sectoral Patterns in Ile-De-France over 1978-1997," LEG
– Working Paper - Economie 2004-02, LEG, Laboratoire d'Economie et de Gestion, CNRS UMR 5118, Université de Bourgogne.
Hausmann R., Hwang J., Rodrik D. (2006), "What you Export Matters", Journal of Economic Growth, Vol. 12, No 1, pp. 1-25.
Hausmann R., Rodrik. D. (2003), "Economic Development as Self-Discovery", Journal of Development Economics, Vol 72, N° 2, pp.603-633.
Henderson V., Kuncoro A., Turner M., 1995, "Externalities and Industrial Development", Journal of Political Economy, vol. 103, N° 5, pp. 1067-
1090.
Houdebine M. (1999), "Concentration géographique des activités et spécialisation des départements français", Economie et Statistique, N° 326-
327, pp. 189-204.
ITCEQ (2012), Indicateur de développement régional : étude comparative en termes de développement régional de la Tunisie, Juillet.
Jacobs J., 1969, The Economy of Cities, New York, Vintage.
Jacobs J., 1984, Cities and the Wealth of Nations: Principles of Economic Life, New York, Vintage.
Jayet, H. (1993), Analyse spatiale quantitative : une introduction, Economica, Paris, 1993.
Karray Z, Driss S. (2009), "Structure industrielle, économies d’agglomération, ouverture et croissance régionale en Tunisie", Région et Développement
N° 29, pp. 141-157.
Karray Z. (2009), "La localisation des entreprises étrangères en Tunisie. Attractivité-pays versus attractivité territoriale", in Mezouaghi M. (ed.), Les
localisations industrielles au Maghreb : attractivité, agglomération et territoires, Karthala éditions, pp. 87-108.

Kriaa M., Driss S., Karray Z. (2011), "Inequality and Spatial Disparities in Tunisia", Journal of Business Inquiry, vol. 10, n° 1, pp. 161-175.
Kriaa M., Montacer M. (2009), "Agglomération des activités industrielles à Zaghouan (Tunisie). Entre logique incitative et logique territoriale", in
Mezouaghi. M. (ed.) Les localisations industrielles au Maghreb : attractivité, agglomération et territoires, Edition Karthala, Paris, pp. 261-281.
Krugman P.R., 1991, "Increasing Returns and Economic Geography" Journal of Political Economy, vol. 99, N° 3, pp. 483-499.
Le Gallo J. (2002), "Économétrie spatiale : l’autocorrélation spatiale dans les modèles de régression linéaire", Économie et Prévision, vol155, pp.
139-158.
Lucas R.E. (1988), "On the Mechanics of Economic Development", Journal of Monetary Economics, N° 22, pp. 3-42.
Ministry of Development and International Cooperation (2012), L’indicateur du développement régional : pointer les difficultés pour orienter les
efforts et suivre le progrès, Septembre.
Montacer M., Kriaa M., Amara M. (2010), "Centralité des activités dans la région urbaine de Tunis (1994-2004) ", Revue d’Economie régionale et
Urbaine, N° 3, pp. 473-509.
OCDE (2012), Industrial Policy and Territorial Development: Lessons from Korea, Development Centre Studies, 36 p.
Ottaviano G. I., Puga D. (1997), "L'agglomération dans l'économie mondiale", Economie Internationale, N° 71, pp. 75-100.
Rodrik D. (2004), "Industrial Policy for the Twenty-First Century", KSG Working Paper, N° RWP04-047, John F. Kennedy School of Government
Faculty, p. 57.
Romer P.M., 1986, "Increasing Returns and Long-Run Growth", Journal of Political Economy, vol. 94, pp. 1002-1037.
Vasiliev I-R. (1996), "Visualization of Spatial Dependence: an Elementary View of Spatial Autocorrelation", in Alinghaus (S-L), Practical Handbook
of Spatial Statistics, CRC Press, Florida, pp. 17-30.
Venables A.J. (1996), "Equilibrium Locations of Vertically Linked Industries", International Economic Review, N° 37, pp. 341-359.
A f r i c a n D e v e l o p m e n t B a n k
28
AfDB E c o n o m i c B r i e f
2 0 1 4 • w w w . a f d b . o r g

A f r i c a n D e v e l o p m e n t B a n k
29
E c o n o m i c B r i e f
2 0 1 4 • w w w . a f d b . o r g
AfDB

A f r i c a n D e v e l o p m e n t B a n k
© 2010 - AfDB - Design, External R
elations and Com
munication Unit/YA
L