economic base analysis the foundation of highest and best use
TRANSCRIPT

Economic Base Analysis – the
foundation of Highest and Best Use Appraisal Institute Fall Conference
November 1, 2012
Gary S. DeWeese, MAI
Principal, Real Estate Strategic Solutions, LLC

Appraisal Institute | Advanced Market Analysis and Highest & Best Use Slide 2
Economic Base Analysis (EBA)
Economic base analysis.
A survey of the industries and businesses that
generate employment and income (and hence
the demand for real estate) in a community as
well as the rate of population growth and
levels of income, both of which are functions
of employment.

Appraisal Institute | Advanced Market Analysis and Highest & Best Use Slide 3
Economic Base Analysis (EBA)
Economic base analysis.
Answers the question:
If employment increases by “X”, what
will happen to demand for a certain
property type?

Appraisal Institute | General Appraiser Market Analysis and Highest & Best Use Slide 4
Market Value
Market
Analysis
Highest
& Best Use
Principles of Supply
& Demand
Foundations of Market Value
Appraisal Institute | Advanced Market Analysis and Highest & Best Use Slide 5
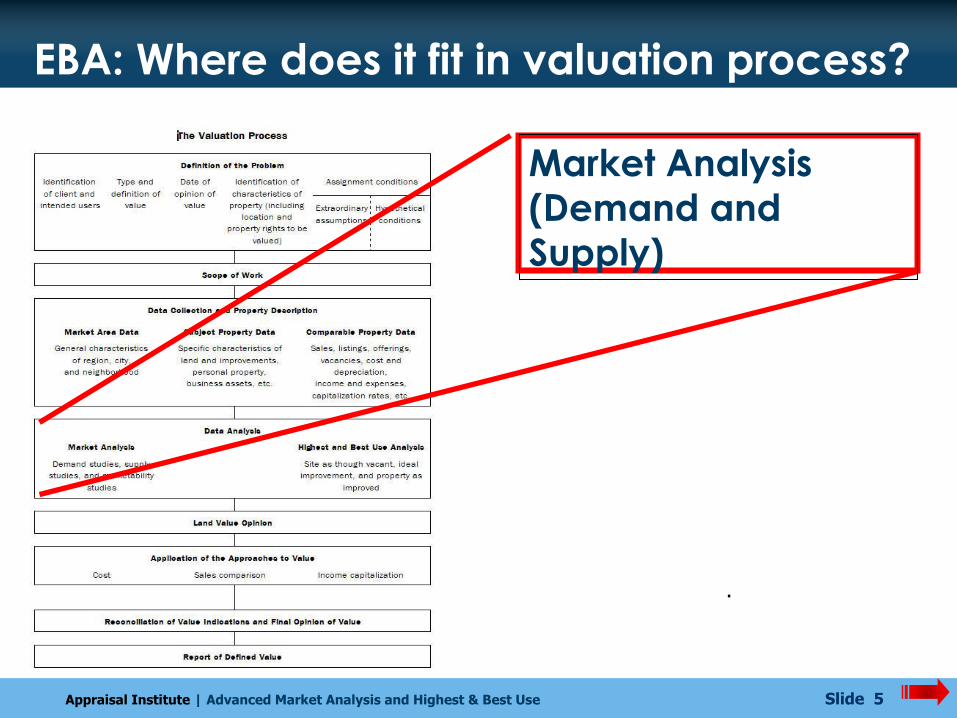
EBA: Where does it fit in valuation process?
.
Market Analysis
(Demand and
Supply)
Appraisal Institute | Advanced Market Analysis and Highest & Best Use Slide 6
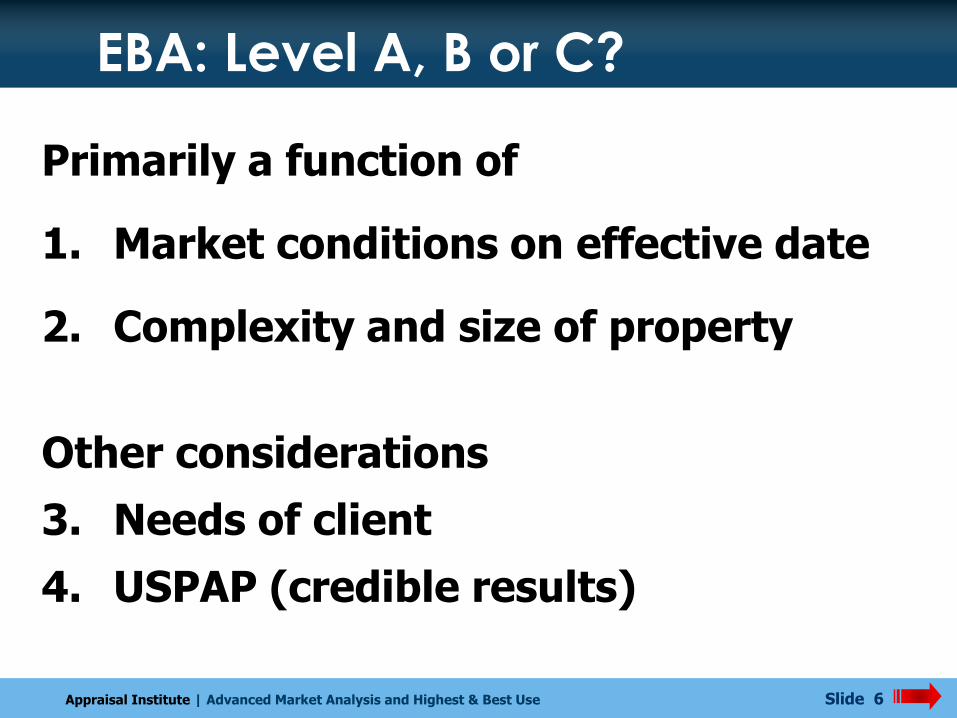
EBA: Level A, B or C?
Primarily a function of
1. Market conditions on effective date
2. Complexity and size of property
Other considerations
3. Needs of client
4. USPAP (credible results)

Appraisal Institute | Advanced Market Analysis and Highest & Best Use Slide 7
EBA: used in Level C Market Analysis
C
Complex Property
Large Property
Unstable Market
Simple
Property
Small Property
Stable Market
Level A
Timing Is NowLevel C
Timing Is Issue
Level BTiming Is
Probably Now
3 of 3 2+ of 3
1 of 3

Appraisal Institute | Advanced Market Analysis and Highest & Best Use Slide 8
Six-Step Market Analysis Process
Step
1. Analyze property productivity.
2. Delineate the market area.
3.Project/Forecast demand.
4. Measure and project/forecast
competitive supply.
5. Calculate marginal demand.
6. Project/Forecast subject capture.
.
Appraisal Institute | Advanced Market Analysis and Highest & Best Use Slide 9
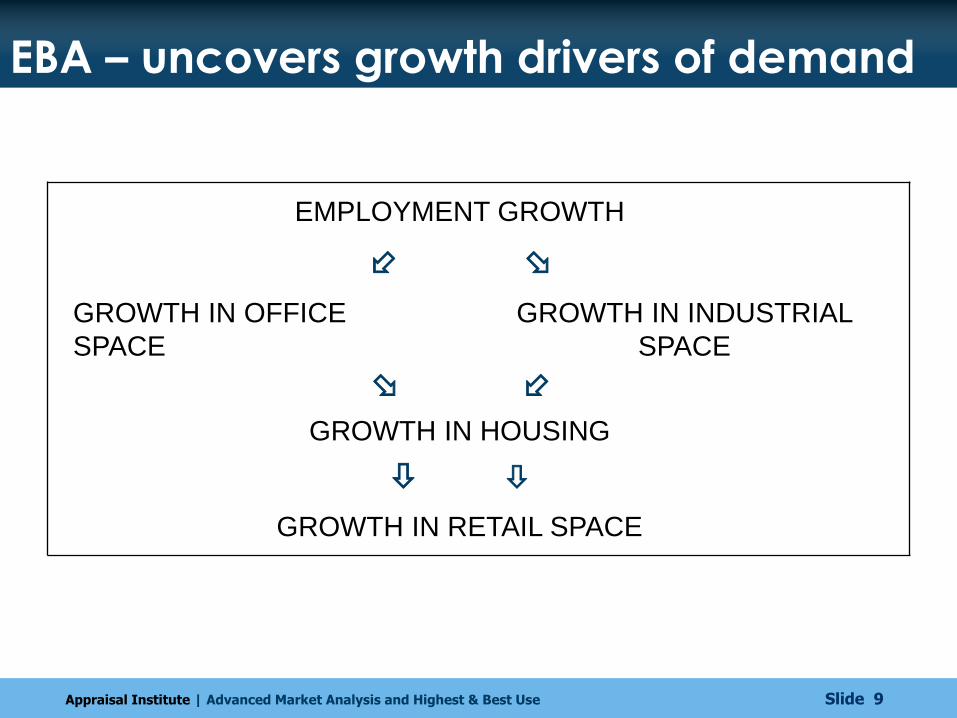
EBA – uncovers growth drivers of demand
EMPLOYMENT GROWTH
GROWTH IN OFFICE
SPACE
GROWTH IN INDUSTRIAL
SPACE
GROWTH IN HOUSING
GROWTH IN RETAIL SPACE

Appraisal Institute | Advanced Market Analysis and Highest & Best Use Slide 10
What’s in the “black box” of EBA?
.
.
EBA
Appraisal Institute | Advanced Market Analysis and Highest & Best Use Slide 11
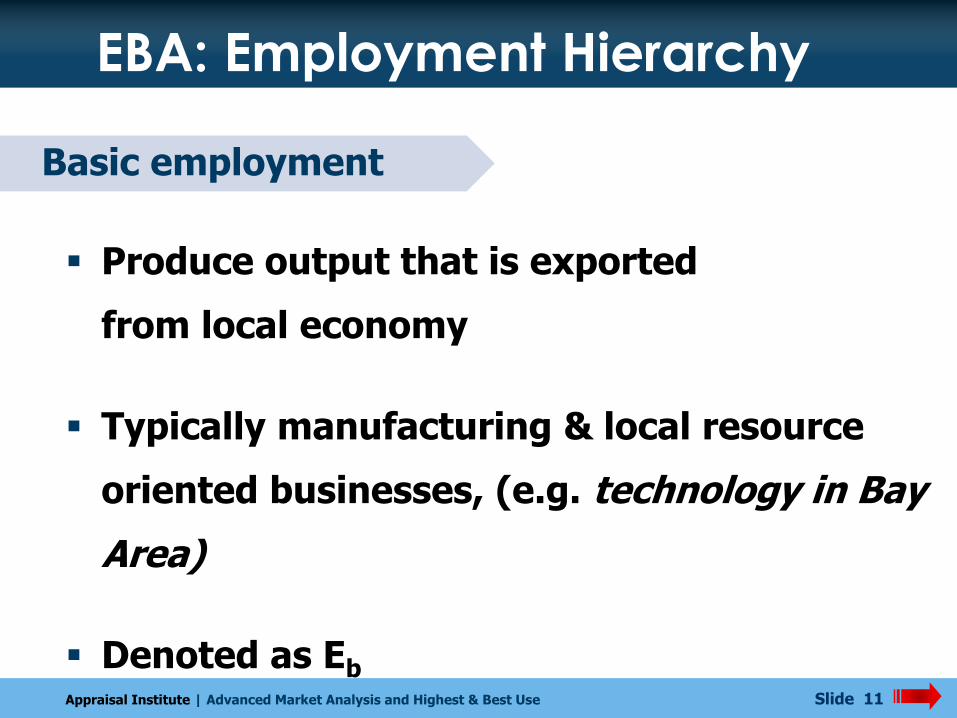
EBA: Employment Hierarchy
Basic employment
Produce output that is exported
from local economy
Typically manufacturing & local resource
oriented businesses, (e.g. technology in Bay
Area)
Denoted as Eb

Appraisal Institute | Advanced Market Analysis and Highest & Best Use Slide 12
Non-basic or secondary employment
Produces goods and services for local economy
Denoted as ES
EBA: Employment Hierarchy

Appraisal Institute | Advanced Market Analysis and Highest & Best Use Slide 13
Total employment
Denoted as Et
Et = Eb + Es
EBA: Employment Hierarchy

Appraisal Institute | Advanced Market Analysis and Highest & Best Use Slide 14
Step
1 Identify the geographic extent of the local economy.
2 Identify the basic industries in the local economy.
3 Estimate total basic employment for the community.
4 Calculate the economic base multiplier and other employment-linked ratios.
5 Forecast future basic employment.
6 Forecast future total employment and any other factors linked to employment.
Economic Base Analysis

Appraisal Institute | Advanced Market Analysis and Highest & Best Use Slide 15
Step
1 Identify the geographic extent of the local economy.
Typically defined by political areas (city, county,
region, usually depends on how data is
presented)
Often a combination – MSA
Main concern
– Local economy must contain basic industry
EBA: Economic Base Analysis
Appraisal Institute | Advanced Market Analysis and Highest & Best Use Slide 16
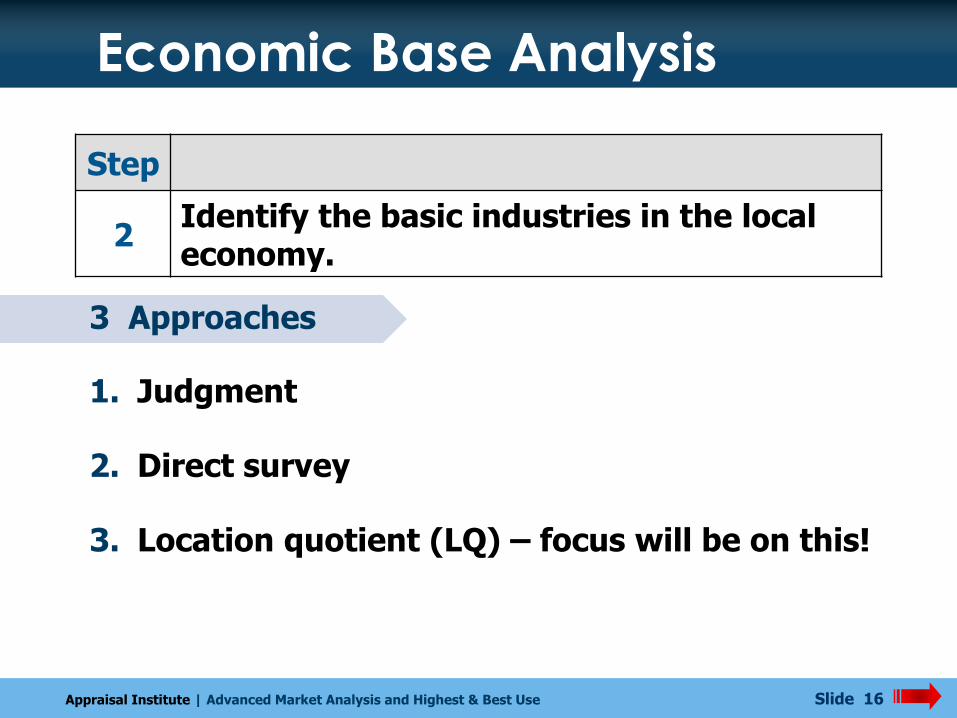
3 Approaches
1. Judgment
2. Direct survey
3. Location quotient (LQ) – focus will be on this!
Economic Base Analysis
Step
2 Identify the basic industries in the local economy.
Appraisal Institute | Advanced Market Analysis and Highest & Best Use Slide 17
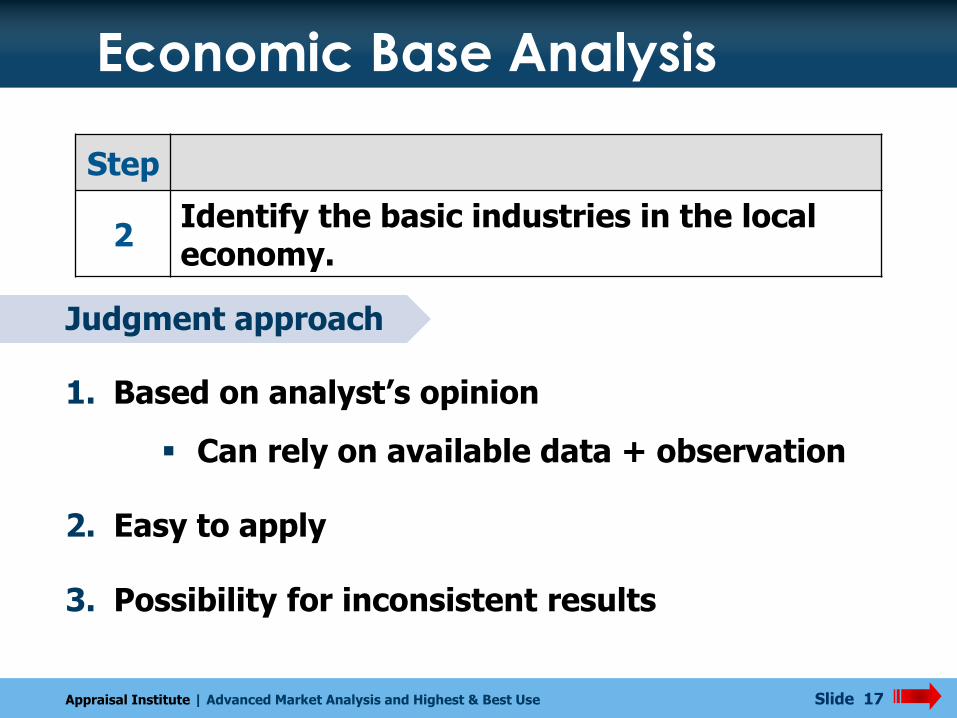
Step
2 Identify the basic industries in the local economy.
Judgment approach
1. Based on analyst’s opinion
Can rely on available data + observation
2. Easy to apply
3. Possibility for inconsistent results
Economic Base Analysis

Appraisal Institute | Advanced Market Analysis and Highest & Best Use Slide 18
Direct survey approach
1. Interviews with representatives of major
employers
Proportional sales to outside economy equal
proportional employment in base industry
(e.g. if 80% of company’s revenue is sales
o/s local economy, it is assumed 80% of its
employees are engaged in basic industry,
leaving 20% counted as non-basic)
Economic Base Analysis
Step
2 Identify the basic industries in the local economy.

Appraisal Institute | Advanced Market Analysis and Highest & Best Use Slide 19
Direct survey approach, continued
1. Reproducible empirical results (i.e., from actual
companies)
2. High administration costs, difficult to collect data,
sampling error make this approach somewhat
impractical
Economic Base Analysis
Step
2 Identify the basic industries in the local economy.
Appraisal Institute | Advanced Market Analysis and Highest & Best Use Slide 20
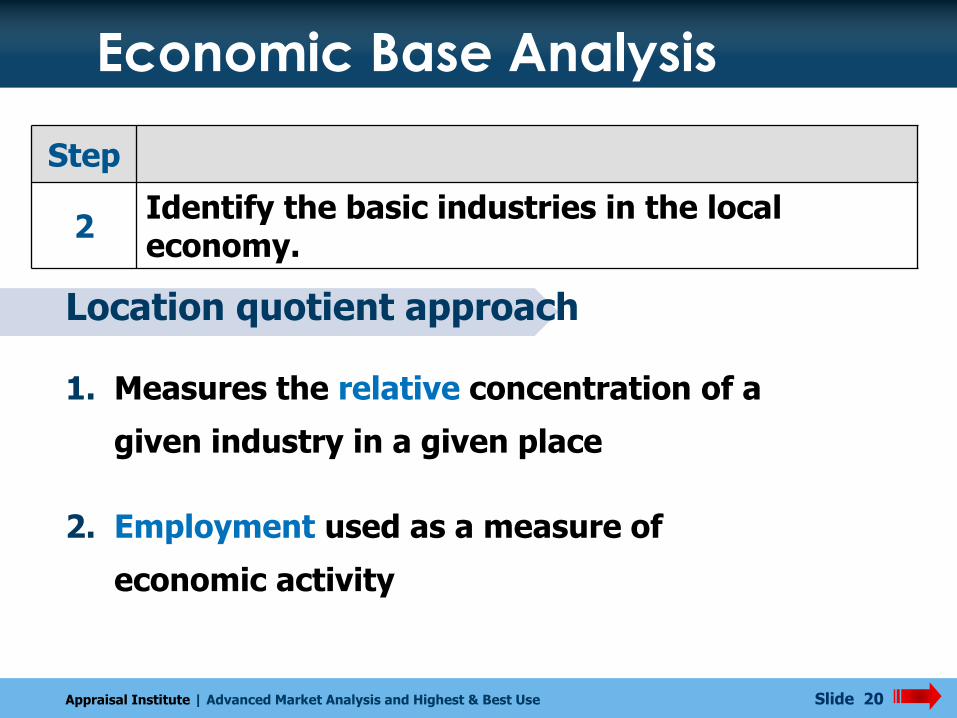
Location quotient approach
1. Measures the relative concentration of a
given industry in a given place
2. Employment used as a measure of
economic activity
Economic Base Analysis
Step
2 Identify the basic industries in the local economy.
Appraisal Institute | Advanced Market Analysis and Highest & Best Use Slide 21
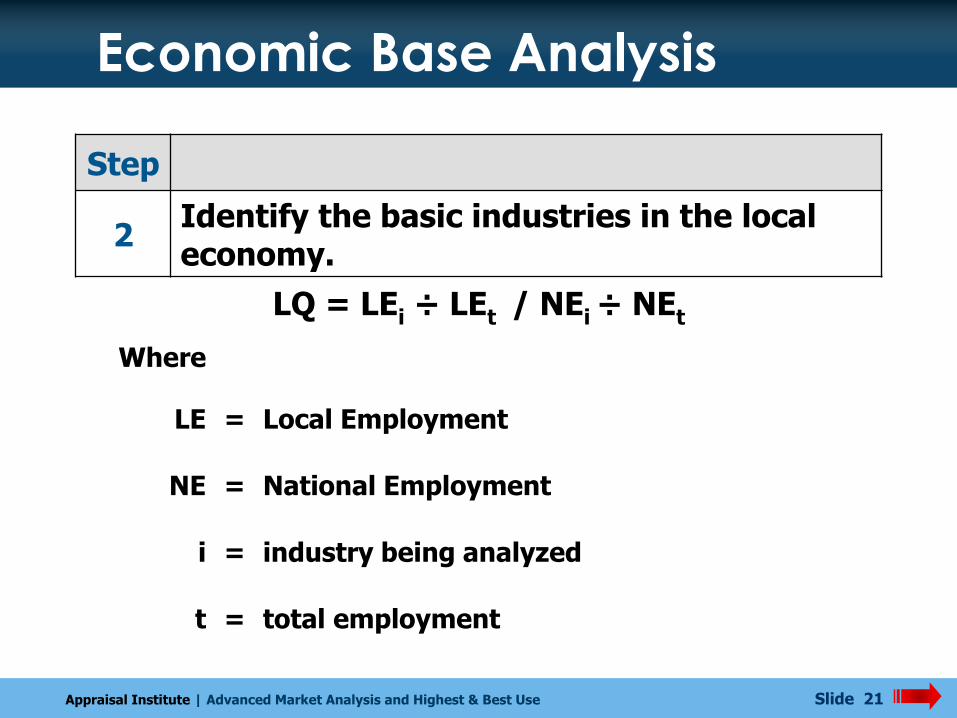
LQ = LEi ÷ LEt / NEi ÷ NEt
Where
LE = Local Employment
NE = National Employment
i = industry being analyzed
t = total employment
Economic Base Analysis
Step
2 Identify the basic industries in the local economy.
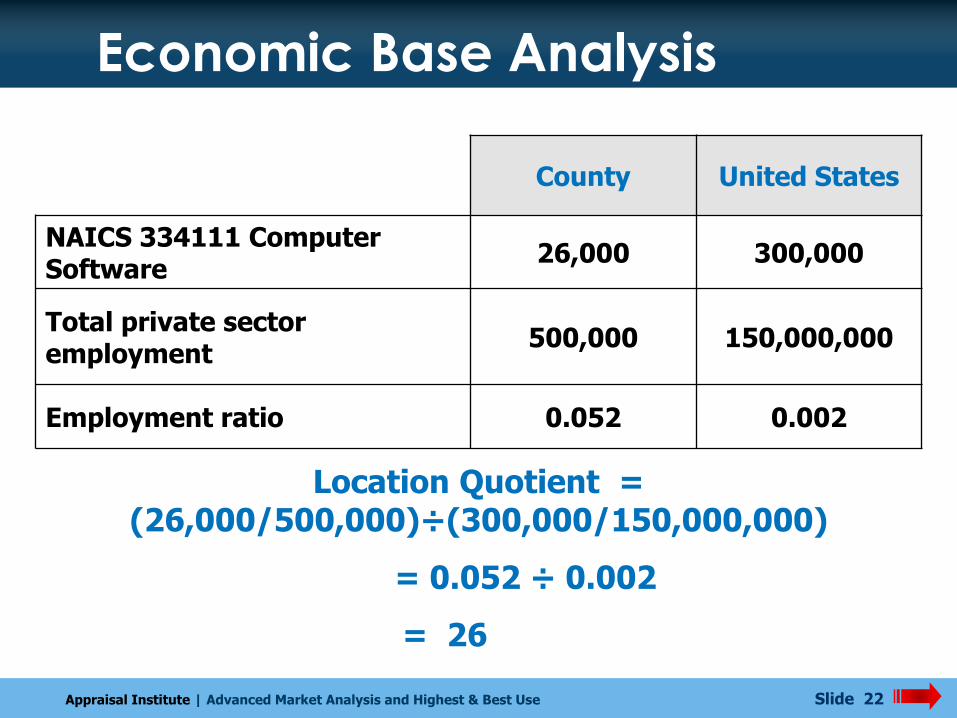
Appraisal Institute | Advanced Market Analysis and Highest & Best Use Slide 22
( County United States
NAICS 334111 Computer Software
26,000 300,000
Total private sector employment
500,000 150,000,000
Employment ratio 0.052 0.002
Location Quotient = (26,000/500,000)÷(300,000/150,000,000)
= 0.052 ÷ 0.002
= 26
Economic Base Analysis

Appraisal Institute | Advanced Market Analysis and Highest & Best Use Slide 23
Economic Base Analysis
Step
2 Identify the basic industries in the local economy.
Location quotient approach
Basic industry if LQ > 1
Non-basic industry if LQ ≤ 1

Appraisal Institute | Advanced Market Analysis and Highest & Best Use Slide 24
Step
3 Estimate total basic employment for the community.
Most communities have more than one basic industry, but assume for this example that computer software is the only basic industry. If not, the other basic industry jobs would have to be included.
Must factor out non-basic employment from basic industry (see next slide)
Economic Base Analysis

Appraisal Institute | Advanced Market Analysis and Highest & Best Use Slide 25
Location Quotient = 0.052 ÷ 0.002 = 26
Non-basic employment
0.002 × 500,000 (i.e.
surrogate for the % of basic industry employees performing non-basic type jobs=
1000 non-basic employees (e.g. truck drivers, secretaries) work in the basic industry
Basic employment = 26,000 – 1000 = 25,000
Alternatively:
Basic employment = Total local employment in basic
industry × (LQ – 1) ÷ LQ
= 26,000 × (26–1) ÷ 26 = 25,000
Economic Base Analysis
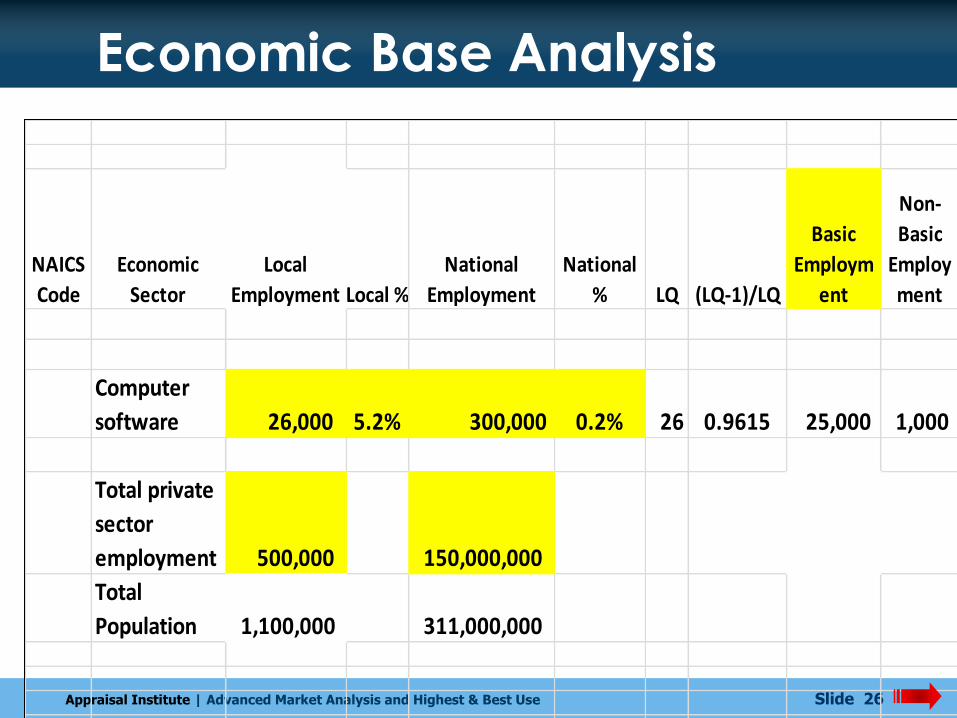
Appraisal Institute | Advanced Market Analysis and Highest & Best Use Slide 26
NAICS
Code
Economic
Sector
Local
Employment Local %
National
Employment
National
% LQ (LQ-1)/LQ
Basic
Employm
ent
Non-
Basic
Employ
ment
Computer
software 26,000 5.2% 300,000 0.2% 26 0.9615 25,000 1,000
Total private
sector
employment 500,000 150,000,000
Total
Population 1,100,000 311,000,000
Economic Base Analysis

Appraisal Institute | Advanced Market Analysis and Highest & Best Use Slide 27
Step
4 Calculate the economic base multiplier
Ke = Economic base multiplier
Ke = Total employment in the county ÷ basic
industry employment
Ke = 500,000 ÷ 25,000 = 20
Every basic job supports about 20 total jobs If other basic industries exist in subject market, then
denominator changes for Ke Relationship assumed to remain constant over time
Economic Base Analysis

Appraisal Institute | Advanced Market Analysis and Highest & Best Use Slide 28
Step
5 Forecast future basic employment.
Sources
News reports
Basic company plans
Announcements of relocations
Reports of planning agencies or economic
development departments
Consider national trends (interest rates etc.)
Economic Base Analysis

Appraisal Institute | Advanced Market Analysis and Highest & Best Use Slide 29
Step
6 Forecast future total employment and any other factors linked to employment.
ΔEt = ∆Eb × Ke Where
ΔEt = change in total employment
ΔEb = change in basic employment
Ke = economic base multiplier
Can be done based on change in basic employment (ΔEb ) for a market or a specific company
Economic Base Analysis

Appraisal Institute | Advanced Market Analysis and Highest & Best Use Slide 30
Ke
Economic Base Multiplier
x ΔEb = ΔEt
20
x 200 = 4,000
Say Computer Software firm will add 200 new basic jobs over N5Y. What is the expected change in total employment N5Y?
Economic Base Analysis

Appraisal Institute | Advanced Market Analysis and Highest & Best Use Slide 31
Step
6b Forecast future total population change
ΔPt = ∆Et × Kp Where
ΔPt = change in total population
ΔEt = change in basic employment
Kp = population base multiplier (next slide)
Economic Base Analysis
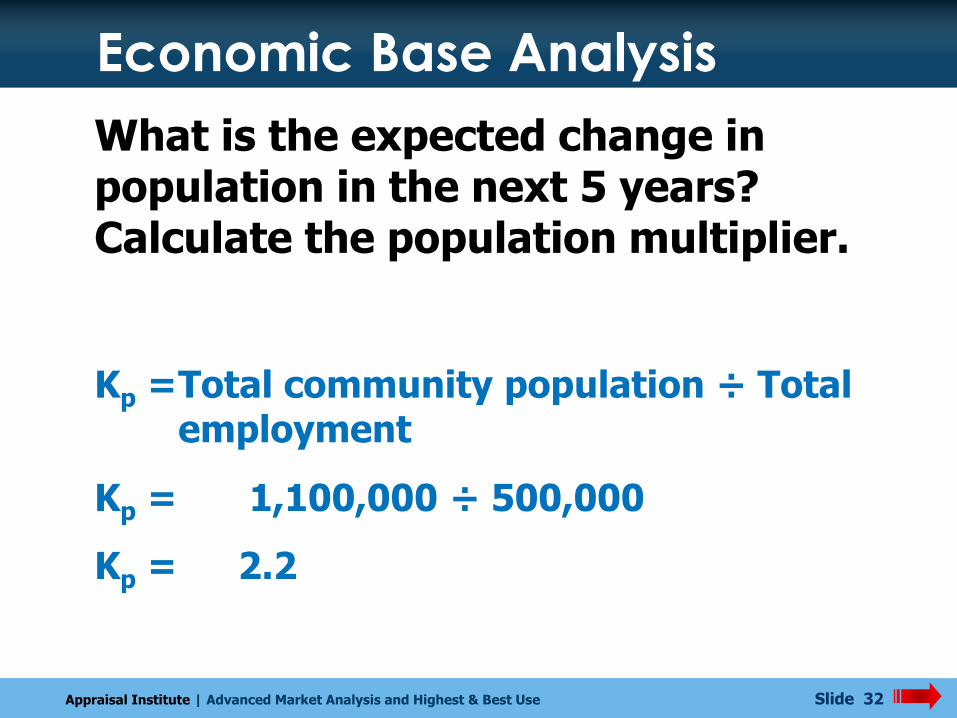
Appraisal Institute | Advanced Market Analysis and Highest & Best Use Slide 32
What is the expected change in population in the next 5 years? Calculate the population multiplier.
Kp = Total community population ÷ Total employment
Kp = 1,100,000 ÷ 500,000
Kp = 2.2
Economic Base Analysis

Appraisal Institute | Advanced Market Analysis and Highest & Best Use Slide 33
Impact on Population
Kp
x ΔEt = ΔPt
2.2
x 4,000 = 8,800
Economic Base Analysis

Appraisal Institute | Advanced Market Analysis and Highest & Best Use Slide 34
How does this translate into demand?
. EMPLOYMENT GROWTH (200) FROM NEW SOFTWARE FIRM
OFFICE SPACE SOFTWARE FIRM’S WORKERS
EMPLOYMENT GROWTH (4,000) IN TOTAL JOBS
INDUSTRIAL
RETAIL
OFFICE
POPULATION GROWTH (8,800)
HOUSEHOLDS
SFR
RENTAL

Appraisal Institute | Advanced Market Analysis and Highest & Best Use Slide 35
Cautionary Notes re: EBA
1. Particularly valuable in smaller
communities
2. Multipliers vary depending on
community size
Lower EBA multipliers associated
with smaller communities
3. Best suited for short-term analysis (<
5 years)

Appraisal Institute | Advanced Market Analysis and Highest & Best Use Slide 36
Sources of information: EBA
Commercial sources such as:
www.stdbonline.com
www.buydemographics.com
www.claritas.com
www.scanus.com
Appraisal Institute | Advanced Market Analysis and Highest & Best Use Slide 37
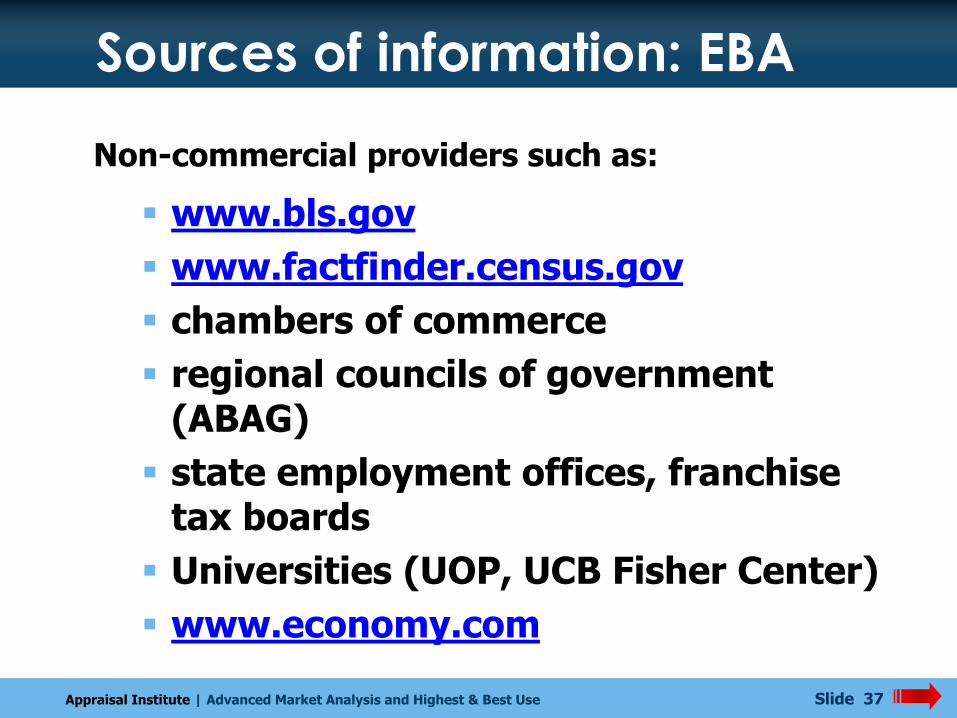
Sources of information: EBA
Non-commercial providers such as:
www.bls.gov
www.factfinder.census.gov
chambers of commerce
regional councils of government (ABAG)
state employment offices, franchise tax boards
Universities (UOP, UCB Fisher Center)
www.economy.com
Appraisal Institute | Advanced Market Analysis and Highest & Best Use Slide 38
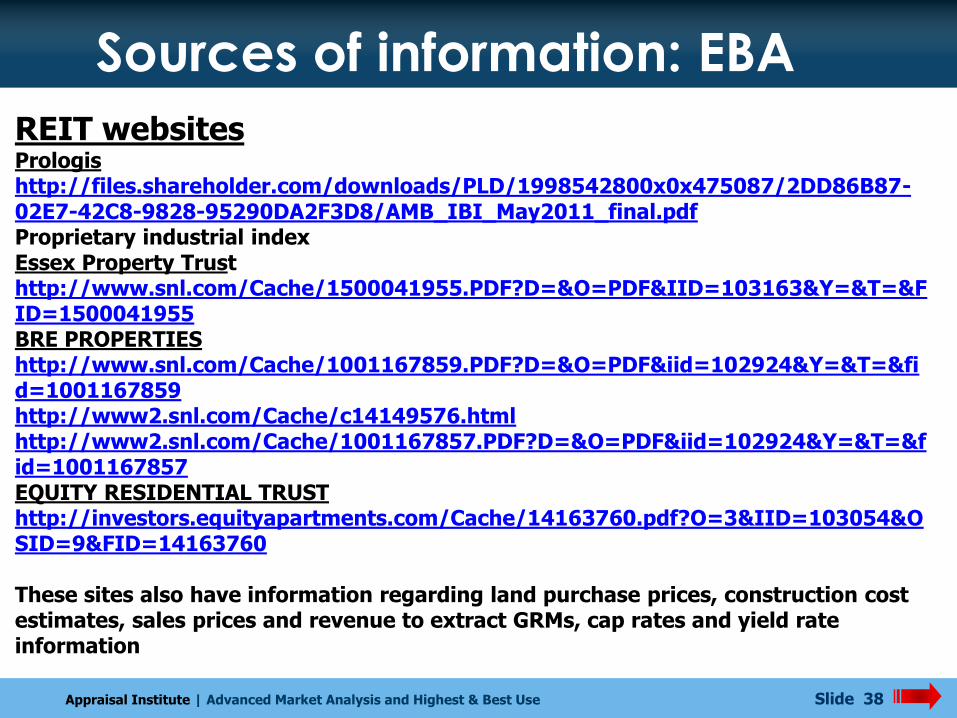
Sources of information: EBA
REIT websites Prologis http://files.shareholder.com/downloads/PLD/1998542800x0x475087/2DD86B87-02E7-42C8-9828-95290DA2F3D8/AMB_IBI_May2011_final.pdf Proprietary industrial index Essex Property Trust http://www.snl.com/Cache/1500041955.PDF?D=&O=PDF&IID=103163&Y=&T=&FID=1500041955 BRE PROPERTIES http://www.snl.com/Cache/1001167859.PDF?D=&O=PDF&iid=102924&Y=&T=&fid=1001167859 http://www2.snl.com/Cache/c14149576.html http://www2.snl.com/Cache/1001167857.PDF?D=&O=PDF&iid=102924&Y=&T=&fid=1001167857 EQUITY RESIDENTIAL TRUST http://investors.equityapartments.com/Cache/14163760.pdf?O=3&IID=103054&OSID=9&FID=14163760 These sites also have information regarding land purchase prices, construction cost estimates, sales prices and revenue to extract GRMs, cap rates and yield rate information

Appraisal Institute | Advanced Market Analysis and Highest & Best Use Slide 39
.