economic assessment of carbon capture and storage technologies · uses updated and refined costs to...
TRANSCRIPT

Economic AssEssmEnt of cArbon cApturE And storAgE tEchnologiEs
2011 update
2011
WorleyParsons
Schlumberger

This report has been prepared by WorleyParsons Services Pty Ltd (WorleyParsons) for the exclusive use of The Global CCS Institute. It is subject to and issued in accordance with the agreement between The Global CCS Institute and WorleyParsons. WorleyParsons accepts no liability or responsibility whatsoever for it in respect of any use of or reliance upon this report by any third party.
Copying this report without the permission of The Global CCS Institute or WorleyParsons is not permitted.
DiSclaimer

This report presents an update of the economics of Carbon Capture and Storage (CCS) prepared in 2009. The 2009 report was commissioned by the Global CCS Institute and delivered as Foundation Report Two in the series of five studies undertaken as part of the Strategic Analysis of the Global Status of Carbon Capture and Storage.
Foundation Report Two involved a detailed analysis of the capture, transport and storage costs for power plants and a select range of industrial applications. This report presents a transparent methodology that uses updated and refined costs to reflect changes in the market since 2009.
Preface
1

WorleyParsons gratefully acknowledges the Global CCS Institute for funding this study and particularly the efforts of Mr Chris Short (Chief Economist).
This project was sponsored by Peter Brooks (WorleyParsons) and the Project Manager was Chai McConnell (WorleyParsons).
The report authors are Dr James Simpson, Chai McConnell and Yukiyo Matsuda (WorleyParsons).
Dr Geoff Ingram, Dwight Peters, Koji Kusaka and Arnaud van der Beken (Schlumberger) provided information on storage costs that contributed to the economic model and report.
Additional input was provided by Michael DeLallo and Vlad Vaysman (WorleyParsons).
Graphic support was provided by Anthony Holt (WorleyParsons).
Economic AssEssmEnt of cArbon cApturE And storAgE tEchnologiEs: 2011 updAtE
© 2011 Global CCS Institute.
For general enquires about this or any of the foundation reports, please contact the Global CCS Institute, GPO Box 828, Canberra ACT 2601 Australia or email [email protected]
acknoWleDgementS
2
Economic AssEssmEnt of cArbon cApturE And storAgE tEchnologiEs: 2011 uPDate

contentS1 Executive summary 5
2 Introduction 10
2.1 The importance of CCS 102.2 Background 102.3 Scope 102.4 Caveats and exclusions 112.5 Following chapters 12
3 Methodology for CCS economic analysis update 13
3.1 Overview of the economic assessment methodology 133.2 New methods used in the 2011 update 153.3 Update of reference facility costs to 2010 163.4 Regional specific factors 183.5 Power generation, CO2 capture and coal type 203.6 CO2 capture from industrial processes 253.7 CO2 transport 263.8 CO2 storage 263.9 Summary of process and economic modelling
assumptions 29
4 Results and comparative sensitivity analysis 31
4.1 Capture of CO2 314.2 CO2 transportation by pipeline 444.3 CO2 storage 45
5 Conclusions 49
5.1 General observations 505.2 Application of CCS to power generation 505.3 Application of CCS to select industrial applications 525.4 CO2 transport 525.5 CO2 storage 52
6 References 53
APPENDICES 55
Appendix A Breakdown of overnight capital costs of PC supercritical facility 55
list of tAblEs
Table 1-1 Summary results of the economic assessment of CCS technologies 7
Table 3-1 Electric power generation (supercritical, ultra-supercritical and IGCC) facility parameters with and without capture. 16
Table 3-2 Electric power generation (oxy-combustion and NGCC) facility parameters with and without capture. 17
Table 3-3 Regional indices used to transfer projects from USGC to specific locations 18
Table 3-4 Coal types and prices used for coal and natural gas per region 20
Table 3-5 Emissions intensities, processing parameters, and commercial application examples for industrial processes 26
Table 3-6 Geological and well properties for ‘poorer reservoir’ and ‘good reservoir’ 27
Table 3-7 Well counts for ‘Poor reservoir’ and ‘Good reservoir’ 28
Table 3-8 Regional costs for CO2 storage 29
Table 3-9 Process modelling and financial assumptions for reference case 30
Table 4-1 Breakdown of LCOE for technologies with and without CCS for FOAK and NOAK plants 33
Table 4-2 Cost of CO2 avoided and captured for FOAK and NOAK plants 33
Table 4-3 Reduction in LCOE after deployment of 100GW capacity 35
Table 4-4 Percentage change in cost parameters from supercritical to ultra-supercritical technology. 36
Table 4-5 Incremental cost of CCS for industrial processes 42
Table 4-6 Commodity cost increase from CCS implementation 43
Table 4-7 CCS cost parameters for NOAK industrial processes 43
Table 4-8 Storage cost and contribution to LCOE based on reservoir properties 47
Table 5-1 Summary results of the economic assessment of CCS technologies 49
list of figurEs
Figure 3-1 Flowchart of methodology for CCS economic assessments 14
Figure 3-2 Heat rate factors as a function of coal heating value 23
Figure 3-3 Capital cost factors as a function of coal heating value 24
Figure 4-1 Installed costs for 550MW net generation and CO2 capture facility (FOAK) 32
Figure 4-2 Comparison of LCOE for reference generation, with and without CCS in USGC 34
Figure 4-3 Comparison of CO2 costs avoided and captured for power generation (FOAK) 35
Figure 4-4 LCOE as a function of fuel costs 37
Figure 4-5 Installed CO2 capture equipment cost as function of location 39
Figure 4-6 LCOE, including CCS, as a function of location 40
Figure 4-7 CO2 credit value breakpoint comparison for CO2 capture technologies. 41
Figure 4-8 Transportation cost saving from increasing pipeline flow for 100km pipeline 44
Figure 4-9 Transportation contribution to LCOE versus pipeline flow for 100km pipeline 45
Figure 4-10 Dependence of CO2 storage costs on initial site characterisation and identification costs 46
Figure 4-11 Dependence of storage contribution to LCOE on initial site characterisation and identification costs 46
3

abbreviationS3D �������������������������������������������������������������3-Dimensional
AACE ����������������������������������������������������Association for the Advancement of Cost Engineering
AD, A$ �����������������������������������������������Australian dollar
AFUDC ����������������������������������������������Allowance for Funds Used During Construction
AGR ��������������������������������������������������������acid gas removal
ANZ ��������������������������������������������������������Australia and New Zealand
ASU ��������������������������������������������������������air separation unit
CAPEX ������������������������������������������������capital expense
CCS���������������������������������������������������������carbon (carbon dioxide) capture, transport and storage
CO2 ����������������������������������������������������������carbon dioxide
CO2CRC ��������������������������������������������the Australian Government’s Cooperative Research Centre for Greenhouse Gas Technologies
CTG���������������������������������������������������������combustion turbine generator
ºC ����������������������������������������������������������������degrees Celsius
DrillEX ������������������������������������������������drilling expenditure
ECBM, ECBMR
�����������������������������������������������������������������������enhanced coal bed methane recovery
EGR ��������������������������������������������������������enhanced gas recovery
EIA �����������������������������������������������������������(United States) Energy Information Administration
EOR ��������������������������������������������������������enhanced oil recovery
EPC���������������������������������������������������������engineering, procurement and construction contract or contractor
EPCM ��������������������������������������������������engineering, procurement, construction and management contract or contractor
EPRI ������������������������������������������������������Electric Power Research Institute
FEED ����������������������������������������������������front-end engineering design
FGD ��������������������������������������������������������flue gas desulphurisation
FGR ��������������������������������������������������������flue gas recirculation
FID �����������������������������������������������������������final investment decision
FOAK ���������������������������������������������������first-of-a-kind
FOM �������������������������������������������������������fixed operating and maintenance
FRST ����������������������������������������������������Foundation for Research Science and Technology
G8 �������������������������������������������������������������Group of Eight (Canada, France, Germany, Italy, Japan, Russia, the United Kingdom, and the United States)
GHG �������������������������������������������������������greenhouse gas
GNS �������������������������������������������������������GNS Science, a New Zealand research and consultancy services organisation
GJ ��������������������������������������������������������������gigajoules
GWe��������������������������������������������������������gigawatt-electrical
HHV �������������������������������������������������������higher heating value
IEA �����������������������������������������������������������International Energy Agency
IGCC ������������������������������������������������������integrated gasification combined cycle
IPCC ������������������������������������������������������Intergovernmental Panel on Climate Change
ITM ���������������������������������������������������������ion transfer membrane
kg ���������������������������������������������������������������kilogram
kJ ���������������������������������������������������������������kilojoule
km ������������������������������������������������������������kilometre
kW, kWe ������������������������������������������kilowatt-electrical
LCOE ����������������������������������������������������levelised busbar cost of electricity, often expressed in $/MWh
LNB ��������������������������������������������������������low NOx burner
m ����������������������������������������������������������������metre
ME������������������������������������������������������������Middle East
MEA �����������������������������������������������������monoethanolamine
MMV ������������������������������������������������������measurement, monitoring and verification
MPa ��������������������������������������������������������megapascal
Mtonne, Mt ��������������������������������million (106) tonnes
Mtpa ������������������������������������������������������million (106) tonnes per annum
MW, MWe �������������������������������������megawatt-electrical
MWh ������������������������������������������������������megawatt-hours
NA, N/A �������������������������������������������not applicable
NETL ����������������������������������������������������US DOE National Energy Technology Laboratory
NGCC ���������������������������������������������������natural gas-fired combined cycle
NOAK ��������������������������������������������������nth-of-a-kind
NOx���������������������������������������������������������nitrous oxides
O&M ������������������������������������������������������Operating and Maintenance
OFO ��������������������������������������������������������overfire oxygen
OPEX ����������������������������������������������������operating and maintenance expense
pa���������������������������������������������������������������per annum
Pa ��������������������������������������������������������������pascal = N/m2
PC �������������������������������������������������������������pulverised coal
PCC���������������������������������������������������������post-combustion capture
PPP���������������������������������������������������������Public Private Partnership
RD&D ��������������������������������������������������research, development and demonstration
R&D �������������������������������������������������������research and development
ROW ������������������������������������������������������right(s) of way
SCR ��������������������������������������������������������selective catalytic reduction
Sm3 ���������������������������������������������������������standard cubic metres
Svy �����������������������������������������������������������survey
Syngas �����������������������������������������������synthetic gas
tonne ����������������������������������������������������metric ton, (1,000kg)
TPC ���������������������������������������������������������total plant cost
UK ������������������������������������������������������������United Kingdom
USA, US �����������������������������������������United States of America
USC ��������������������������������������������������������ultra-supercritical
USD, US$ ������������������������������������United States dollar
US DOE �������������������������������������������United States Department of Energy
US EIA ����������������������������������������������United States Energy Information Administration
US EPA ��������������������������������������������United States Environmental Protection Agency
USGC ���������������������������������������������������US Gulf Coast
VOM �������������������������������������������������������variable operating and maintenance
4
Economic AssEssmEnt of cArbon cApturE And storAgE tEchnologiEs: 2011 uPDate

1 executive Summary
In May 2009, a consortium led by WorleyParsons and comprising Schlumberger, Electric Power Research Institute and Baker & McKenzie was engaged to undertake the Strategic Analysis of the Global Status of Carbon Capture and Storage (CCS).
The consortium was tasked with undertaking a comprehensive survey of the status of CCS and to develop a series of reports analysing CCS projects, the economics of CCS, policies supporting CCS development and existing research and development networks. A fifth report – the Synthesis Report – was also developed and this summarised the findings of the first four reports, and provided a comprehensive assessment of the gaps and barriers to the deployment of large-scale CCS projects, including strategies and recommendations to address these issues.
The second of this series of reports (Foundation Report Two) presented a detailed analysis of the capture, transport and storage costs for power plants and a select range of industrial applications. The costs of CCS were presented on a levelised cost of production basis, as well as for the cost of carbon dioxide (CO2) captured and avoided. Foundation Report Two also considered the application of CCS in first-of-a-kind (FOAK) systems and nth-of-a-kind (NOAK) systems.
The modelling determined that the cost of CCS for power generation, based on the use of commercially available technology, was found to range from US$57-107 per tonne of CO2 avoided or US$42-90 per tonne of CO2 captured. The lowest cost of CO2 avoided was at US$57 per tonne of CO2 for the oxyfuel combustion technology, while the highest cost at US$107 per tonne of CO2 for the natural gas-fired combined cycle (NGCC) with post-combustion capture (PCC). This compared with the lowest cost of captured CO2 for the IGCC and oxy-combustion technologies at US$39 and US$42 per tonne of CO2 respectively and the highest of $90 per tonne of CO2 for NGCC technologies. The metrics were determined for the reference site in the United States of America (USA) with fuel costs based on values typical for 2010.
For the reference cases, taking into account currently available technologies, the levelised cost of electricity (LCOE) for FOAK pulverised coal (PC) supercritical technology was the greatest at US$131/MWh, while the oxy-combustion was the lowest of the commercially available technologies at US$121/MWh. While the cost of CO2 avoided and captured range by a factor of two, the LCOE estimates ranged between US$121-131/MWh with currently available technologies.
The percentage increases in costs that the application of CCS has over non-CCS facilities were also explored. For power generation, facilities that had the lowest cost increases were IGCC (37 per cent), NGCC (40 per cent), followed by oxyfuel combustion (53 to 65 per cent) and PC supercritical (61 to 76 per cent) technologies.
The application of CCS for FOAK industrial applications showed that cost of CO2 avoided was lowest for natural gas processing (US$19) and fertiliser production (US$20) followed by cement production and blast furnace steel production (US$54).
5
1 ExEcutivE summAry

1 executive Summary (continuEd)
The lowest cost increase was for natural gas processing (1 per cent) followed by fertiliser production (3 per cent). This was unsurprising given that these industries already have the process of capturing CO2 as a part of their design. The production of steel (10 to 14 per cent) and cement (39 to 52 per cent) had the highest percentage cost increases with the application of CCS because the capture of CO2 is not inherent in the design of these facilities.
The margin of error in this study made it difficult to select one technology over another based on the LCOE. Projects employing different capture technologies may be viable depending on a range of factors such as location, available fuels, regulations, risk appetite of owners and funding.
In July 2010, WorleyParsons and Schlumberger were engaged to undertake an update of Foundation Report Two. The objectives of this update were to:
• improve the regional localisation estimates;
• update and enhance capital cost estimates for power and a select range of industrial activities that could apply CCS; and
• update the economic model (having regard for the two previous items) to consider what, if any, material changed have occurred to the economics of CCS since 2009.
To meet these objectives, changes/modifications to the economic assessment methodology included:
• the revision of overnight capital costs used in the 2009 report to early 2010 US$;
• the revision of regional specific factors to move the capital costs from the reference location to the location of interest;
• the review of coal and natural gas prices on a regional basis, including the consideration of whether the fuels were locally sourced or imported and subject to international market prices;
• the adjustment of process parameters (heat rate, CO2 emissions and CO2 capture) according to regional coal composition and emissions requirements;
• a change in the approach for CCS on the oxyfuel combustion power generation to include an additional purification step of the CO2 to increase the CO2 purity to greater than 95 per cent;
• the modification of the reference pipeline length to 100km, based on findings for large-scale integrated CCS projects as identified in Foundation Report One;
• a revised approach to CO2 storage, which considered two cases of a ‘good’ reservoir and a ‘poorer’ reservoir with either 3Mtpa or 12Mtpa injection scenarios; and
• consideration of variations in storage costs across regions. Recent data on CO2 storage costs were obtained for Australia/New Zealand, Europe and North America for CO2 injection wells and associated services.
6
Economic AssEssmEnt of cArbon cApturE And storAgE tEchnologiEs: 2011 uPDate

The revised results of the economic assessment of CCS technologies are presented in Table 1-1.
Table 1-1 Summary results of the economic assessment of CCS technologies
Power generation Industrial applications
PC supercritical & ultra
supercritical*1
Oxyfuel combustion standard &
ITM*1 IGCC NGCC
Blast furnace steel production
Cement production
Natural gas processing
Fertiliser production
Dimensions US$/MWh US$/MWh US$/MWh US$/MWhUS$/tonne
steelUS$/tonne
cementUS$/GJ
natural gasUS$/tonne ammonia
Levelised cost of production
Without CCS*2 73-76 73-76*3 91 88 570-800 66-88 4.97 375
With CCS FOAK*3 120-131 114-123 125 123 82 34 0.056 11
With CCS NOAK*4
117-129 112-121 123 121 74 31 0.056 11
% Increase over without
CCS*5
61-76% 53-65% 37% 40% 10-14% 39-52% 1% 3%
Cost of CO2 avoided*6 ($/tonne CO2)
FOAK 62-81 47-59 67 107 54 54 19 20
NOAK 57-78 44-57 63 103 49 49 19 20
Cost of CO2 captured ($/tonne CO2)
FOAK 53-55 42-47 39 90 54 54 19 20
NOAK 52 41-45 38 87 49 49 19 20
Notes:1. The ultra-supercritical and ITM technologies are currently under development and are not commercially available. These technologies
represent options with the potential for increasing the process efficiency and reducing costs.2. Without CCS cost of production for industrial process are typical market prices for the commodities.3. Oxyfuel combustion systems are not typically configured to operate in an air fired mode. Therefore, oxyfuel combustion without CCS
is not an option. The values here are the PC without CCS value to be used as a reference for calculating the cost of CO2 avoided.4. For industrial processes, levelised cost of production presented as cost increment above current costs.5. Expressed with respect to current commodity prices of industrial processes.
The updated modelling yielded the findings listed below.
• All of the coal-fired technologies showed a decrease in fuel costs related to the lower coal costs in 2010.
• For the reference cases, taking into account currently available technologies, the lowest LCOE was for oxyfuel combustion at US$114/MWh, in contrast to 2009 where LCOE for NGCC technologies was the lowest at US$112/MWh. Consistent with the findings in 2009, the LCOE for PC supercritical and IGCC technologies were the greatest at US$131/MWh and US$125/MWh respectively.
• The percentage increases in costs that the application of CCS has over non-CCS facilities have remained relatively unchanged since 2009.
• There was an increase in the capital contribution to the LCOE for oxyfuel combustion with CCS, reflecting the inclusion of an additional purification process when capturing CO2.
• CO2 capture still represents the greatest contribution to the cost of CCS, with the majority of the cost increases being due to changes in the capture system.
• The reduction in the length of the pipeline for the reference case has reduced the overall transport costs and the contribution of transport cost to the overall cost of CCS.
7
1 ExEcutivE summAry

1 executive Summary (continuEd)
• Consistent with the findings from Foundation Report Two in 2009, the range in coal price lead to a US$10/MWh variation in the LCOE, while for the natural gas price range the variation in the LCOE was around US$30/MWh.
• For a supercritical PC with CCS technology, for a fixed fuel cost, the sensitivity of the CO2 capture installed capital costs and LCOE to the labour costs was reduced. The installed capital costs increased by 23 per cent (32 per cent in 2009), while the LCOE increased by 11 per cent (21 per cent in 2009). A similar trend would be observed for the other coal-fired technologies as they tend to be relatively labour-intensive installations.
• The installed CO2 capture equipment cost and LCOE increased across all technologies in India. This was due to the consideration of a 30 per cent increase in equipment being imported into the country as well as India’s typical coal heating value being very low, resulting in a greater capital cost.
• Costs increased across all technologies in Eastern Europe, primarily due to the increase in the reference coal price for the region.
• A 20 per cent increase in the technology cost in Australia which can be accounted for by the higher coal price utilised this year.
• A significant increase in the costs in Brazil, partially because of a lower labour rate being used in 2009. The revision of the coal type to one with a lower heating value also lead to a higher capital cost. Finally, additional costs associated with importing capital equipment contributed to the increase in CO2 capture costs in Brazil.
• Only NGCC costs are displayed for Saudi Arabia, reflecting that there are no coal-fired power generation applications in the region.
• The breakpoint for the CO2 credit value for oxyfuel has decreased from US$60/tonne of CO2 in 2009 to US$55/tonne, which can be attributed to the lower coal costs offsetting the additional purification step included in this study. This analysis continues to indicate that oxyfuel still has the lowest CO2 credit value breakpoint of approximately US$55/tonne of CO2.
• The IGCC breakpoint, with respect to supercritical PC technology has decreased from $80/tonne in 2009 to $70/tonne of CO2. This reflects the increase since 2009 in the LCOE and cost of CO2 avoided and captured for IGCC with CCS.
• The cost breakpoint for the supercritical technologies is approximately $80/tonne of CO2, an 11 per cent decrease from the 2009 breakpoint of $90/tonne of CO2.
• The high breakpoint for NGCC technology has remained relatively unchanged at $112/tonne of CO2, reflective of the lower CO2 emission intensity of natural gas and higher cycle efficiency compared to coal-fired technologies.
• For the industrial processes, the incremental levelised product costs and the cost of CO2 avoided/captured have increased by a small amount consistently across all applications.
• The cost to transport CO2 is estimated to be between US$1-2 per tonne of CO2, a decrease from US$3-4 per tonne of CO2 in 2009. This is due to the reduction of the pipeline length in the reference case from 250km in 2009 to 100km.
• The contribution of storage cost to the LCOE was found to range from US$6-13 per tonne of CO2 depending on whether the ‘good’ or ‘poorer’ reservoir option was considered.
8
Economic AssEssmEnt of cArbon cApturE And storAgE tEchnologiEs: 2011 uPDate

Though minor changes in the costs of CCS across power generation and industrial applications have occurred, the costs of CCS still remain high. This is expected, given that it has only been 12 months since the initial Foundation Report Two, and major developments that have the potential to dramatically reduce the cost of CCS have not yet occurred.
Despite the costs of CCS being high relative to traditional power generation and industrial facilities, it is important to consider that these traditional methods currently emit large amounts of CO2 into the atmosphere. Given the current and anticipated restrictions on facility emissions, these facilities will not be allowed to continue to operate as they have in the past.
The high costs of CCS as identified in this study should be considered with other low emission technologies to allow consideration of approaches to low emission power and industrial production. Further, if CCS is compared against the anticipated cost that may be imposed on facilities for emitting CO2 it is likely to appear more competitive in a low carbon market.
9
1 ExEcutivE summAry

2 introDuction
2�1 The importance of CCSThe successful development and widespread deployment of Carbon Capture and Storage (CCS) is considered by many key climate change stakeholders to be fundamental to achieving deep cuts in carbon dioxide (CO2) emissions to atmosphere. Among a portfolio of responses, such as energy efficiency and renewable energy, CCS is required to contribute approximately 19 per cent of CO2 emissions reductions globally by 2050 (International Energy Agency, 2008), if global emissions targets are to be achieved.
The business case to developing and deploying large-scale-integrated CCS projects (LSIPs) is challenging. One of the key challenges is the relatively high cost of CCS technology to capture, transport and safely store CO2, compared to the same facilities without CCS. This is unsurprising, given that it costs more to capture, transport and safely store CO2 as opposed to the current ‘business as usual’ scenario of venting CO2 emissions to the atmosphere.
This report was commissioned by the Global CCS Institute as an update to the 2009 Foundation Report Two.
2�2 Background The objective of this report is to build upon and update the cost estimates provided in ‘Report 2: Economic Assessment of Carbon Capture and Storage Technologies’ of the 2009 ‘Strategic Analysis on the Global Status of CCS’. As in 2009, the cost estimates are informed by WorleyParsons experience in the design, construction and operation of large infrastructure facilities that are likely candidates to apply CCS and direct engagement in assisting proponents to develop CCS projects. The cost estimates of storage are provided by Schlumberger and are similarly informed by their leading global position in this space.
Readers are encouraged to review the 2009 report if more background information and understanding is required. This can be found on the Global CCS Institute website at: http://www.globalccsinstitute.com/.
2�3 ScopeBuilding upon the 2009 study, the scope of this update is to consider the economics of CCS, based on 2010 capital, fuel and labour costs, and to assess several issues including:
• improving the regional localisation estimates;
• updating and enhancing capital cost estimates for power and a select range of industrial activities that could apply CCS; and
• updating the economic model (having regard for the two items above) to consider what, if any, material changes had occurred to the economics of CCS since 2009.
The additions to the scope were achieved by enhancing and improving operating cost estimates for capture facilities by improving fuel cost estimates at select locations and other key variables. Project location indices were also enhanced by providing greater specification that, where practicable, considered costs at a typical reference city level rather than a broad regional level.
10
Economic AssEssmEnt of cArbon cApturE And storAgE tEchnologiEs: 2011 uPDate

2�4 Caveats and exclusions As with the delivery of the Economic Assessment of Carbon Capture and Storage Technologies report (WorleyParsons, 2009), WorleyParsons and Schlumberger used its best endeavours to inform this update. Cost estimates used were observed in the global marketplace for developing large and often complex infrastructure projects and the costs of drilling for hydrocarbon were used as analogues for the cost of storage. US Gulf Coast (USGC) was the reference location.
The authors caution that when comparing costs, it is important to understand the purpose of the presented costs; are they presented to compare the costs between different technologies, or to inform how much a specific project will cost. There are several studies (e.g. the NETL Bituminous Baseline Study) which provide valuable information regarding the comparative costs of CCS technologies and the factors that impact these costs. The Global Carbon Capture Storage (CCS) Institute costing methodology and the studies prepared using it, fall into this group. These studies are typically poor predictors of project costs because they cannot accurately account for the variation in site and owner specifications included in a real project cost. Alternately, reported project costs, for specific projects, are poor sources for comparing technology costs. By the time the costs of a project are reported, only the cost of a single technology is presented which takes into account site specific requirements and owner’s preferences.
The authors recognise that the economics of CCS is the subject of much conjecture and debate. Much of the conjecture is founded upon differing studies providing different results. In many cases, different results arise because key variables such as capital and operating costs, location and cost year differ. Additionally, the basis of the costs, that is which costs are included, are often not well defined or overlooked. Indeed, it was largely because of this that the Global CCS Institute commissioned the original 2009 study in an effort to provide cost estimates based on transparent and consistent variables and assumptions. The authors caution readers that care is required when applying the results of the cost estimates provided in this report. The margin of error in this study is +/- 40 per cent and the significant impact that project location and preference for CCS technology type, for example, means that the economics of CCS projects needs to be assessed on a case-by-case basis. It is important to note that all project costs are specific to that project and the figures presented in this report represent ‘ball park’ cost estimates for developing CCS projects as at 2011.
Furthermore, the authors note that some recent studies on the economics of integrated gasification combined cycle (IGCC) capture facilities are documenting costs that are greater than those presented in this study. Analogously, some CCS stakeholders speculate that the cost of IGCC with CCS is prohibitive based on the findings of these studies. Caution needs to be taken in considering this issue. One finding of the work performed by the Global CCS Institute is the costs can vary significantly based on location specific factors such as labor rates, fuel costs, and fuel characteristics. Additionally, with high volatility in plant construction costs and few new coal fired power (without CCS) construction starts in locations, real project costs are difficult to gauge. Therefore, the suggestion of providing a reference plant cost without CO2 capture, using the same basis, along side of the facility with capture is suggested to give a better indication of the costs of CCS.
11
2 introduction

2 introDuction (continuEd)
Additionally, more detailed engineering has been undertaken for large-scale IGCC plants with CCS than for other power generation applications. As a result, lower levels of definition for technical design and cost for oxyfuel combustion and post-combustion CO2 capture technologies can be expected. Given that the cost estimates for IGCC increased as the projects were further defined across the asset lifecycle, it can be expected that cost estimates for the other capture technologies may also increase. In other words, the perception that oxyfuel combustion and post-combustion CO2 capture are economically more viable than IGCC may not be observed when projects applying these technologies undergo more detailed evaluations in the future.
2�5 Following chaptersChapter Three provides an overview of the methodology. Chapter Four presents the results and Chapter Five presents key conclusions and observations.
12
Economic AssEssmEnt of cArbon cApturE And storAgE tEchnologiEs: 2011 uPDate

3 methoDology for ccS economic analySiS uPDate
3�1 Overview of the economic assessment methodologyThis cost analysis of CCS projects is an update of the 2009 Foundation Report Two. Building upon the 2009 report, the methodology essentially assesses the capital and operating costs over the life of an investment necessary to meet CO2 emission reduction goals. The goal of private sector developers is to select the CCS technology that maximises profits over the long run in a sustainable way.
The methodology selected to define the economics of CCS investments is based on using capital costs and operating characteristics from published sources; WorleyParsons’ and Schlumberger’s in-house database of actual cost data gained from undertaking numerous designs, installations and analyses of CCS projects; and other data from corporate, government and research stakeholders. These were updated to 2010 dollars.
The methodology applied in this study combines these parameters to determine the appropriate metrics to be used in the economic analysis of CCS. This was conducted through:
• calculations of capital costs for the reference location;
• transposing the project to the selected location; and
• performing the subsequent economic analysis.
13
3 mEthodology for ccs Economic AnAlysis updAtE
3 methoDology for ccS economic analySiS uPDate (continuEd)
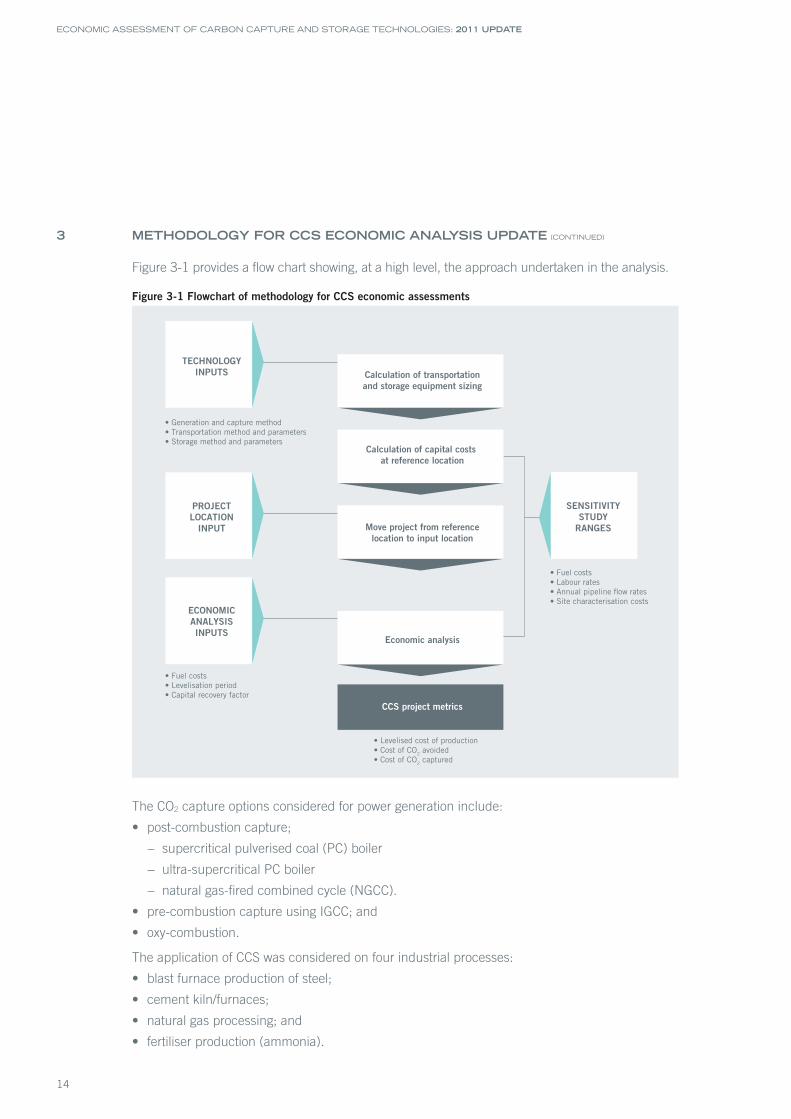
Figure 3-1 provides a flow chart showing, at a high level, the approach undertaken in the analysis.
Figure 3-1 Flowchart of methodology for CCS economic assessments
• Generation and capture method • Transportation method and parameters • Storage method and parameters
TECHNOLOGYINPUTS
• Fuel costs • Labour rates • Annual pipeline flow rates • Site characterisation costs
SENSITIVITYSTUDY
RANGES
• Fuel costs • Levelisation period • Capital recovery factor
• Levelised cost of production • Cost of CO2 avoided • Cost of CO2 captured
ECONOMICANALYSISINPUTS
PROJECTLOCATION
INPUT
Calculation of transportationand storage equipment sizing
Calculation of capital costs at reference location
Move project from referencelocation to input location
Economic analysis
CCS project metrics
The CO2 capture options considered for power generation include:
• post-combustion capture;
− supercritical pulverised coal (PC) boiler
− ultra-supercritical PC boiler
− natural gas-fired combined cycle (NGCC).
• pre-combustion capture using IGCC; and
• oxy-combustion.
The application of CCS was considered on four industrial processes:
• blast furnace production of steel;
• cement kiln/furnaces;
• natural gas processing; and
• fertiliser production (ammonia).
14
Economic AssEssmEnt of cArbon cApturE And storAgE tEchnologiEs: 2011 uPDate

While there are several methods of transporting CO2 to a storage site including trucking and shipping, this study consider only the costs involved in pipelining as a means of CO2 transport. To meet the G8 timeframes it is more than likely that transportation by pipeline will be the preferred approach, given the large volumes of CO2 that will need to be transferred.
The 2009 study found that while the largest cost component in the CCS value chain was with the capture component, the CO2 storage component of the value chain represents the greatest uncertainty. To model this uncertainty, the 2010 study provides a range of scenarios for ‘good’ and ‘poorer’ storage characteristics across a range of 3Mtpa and 12Mtpa reservoir capacities. This is discussed further in section 3.8.
As there have been no extensive changes in the economic and assessment methodology, refer to Foundation Report Two for the comprehensive description of the methodology. The metrics used to compare the costs of CCS projects have remained unchanged, with costs being presented in the form of:
• levelised cost of production;
• cost per tonne of CO2 captured and injected; and
• cost per tonne of CO2 avoided.
3�2 New methods used in the 2011 updateA change to the methodology occurred in the adjustment of process parameters of heat rate, CO2 emissions and CO2 capture according to regional coal composition and emissions requirements. This resulted in changes to the capital and operating and maintenance (O and M) costs for the capture facilities. This change improved the granularity of the estimates and analyses for the discrete regions given that:
• process design for coal-fired facilities is strongly dependent on local conditions including fuel composition, emissions regulations, climate and availability of water for cooling;
• design impacts sizing of equipment and thus capital costs;
• the heat rate of facilities increases with decreasing coal rank (heating value), therefore this increases the amount of fuel required and potential change in fuel costs; and
• the CO2 emission intensity change relates to changes in fuel, potential impact on cost of CO2 capture and avoided.
The adjustment of the process parameters was undertaken by:
• conducting a literature/study review of facility designs with different coal ranks;
• determining the heat rate and cost trend variations from reference coal designs. Trends described as simple functions from reference coal composition (Pittsburgh No. 8); and
• the adjustment of the capture technology costs at the reference location and then moving these to the region of interest.
15
3 mEthodology for ccs Economic AnAlysis updAtE

3 methoDology for ccS economic analySiS uPDate (continuEd)
3�3 Update of reference facility costs to 2010The overnight capital costs used in the 2009 report were revised to early 2010 US dollars. Over the span between the reporting periods, the equipment costs have increased on the order 1 per cent while the labour costs have increased 0.5 per cent. Table 3-1 and Table 3-2 provide the operating parameters and updated capital costs used in the economic analysis. In Table 3-2, the cost of oxy-combustion without capture is set to zero based on that oxy-combustion is not considered without CCS.
A key change from the 2009 approach for CCS on the oxyfuel combustion power generation has been implemented. CCS on this facility now considers an additional purification step of the CO2 to increase the CO2 purity to greater than 95 per cent.
Table 3-1 Electric power generation (supercritical, ultra-supercritical and IGCC) facility parameters with and without capture�
PC supercritical Supercritical 2 Ultra-supercritical IGCC
CO2 Capture No Yes No Yes No Yes No Yes
Fuel Coal Coal Coal Coal Coal Coal Coal Coal
Gross power output MW 580 663 580.2 661.1 576.6 644.4 748 694
Auxiliary power MW 30 117 30.2 111.1 26.6 94.4 112 176
Net power output MW 550 546 550 550 550 550 636 517
Net plant HHV efficiency % 39.10% 27.20% 39.4 28.3 44.6 33.2 41.10% 32.00%
Net plant HHV heat rate GJ/MWh 9.20 13.22 9.14 12.73 8.07 10.83 8.76 12.61
CO2 generated tonne/hr 442 631 440 613 389 521 479 470
CO2 emitted tonne/hr 442 63 440 61 389 52 479 47
CO2 captured tonne/hr 0 568 0 551 0 469 0 423
Emission intensity kg/MWh 804 115 800 112 707 95 753 90
Plant capital overnight costs ($)
CC equipment x1,000 539,576 957,610 542,507 950,517 559,043 930,710 948,200 962,087
CC materials x1,000 49,823 64,954 49,079 62,080 47,287 58,829 74,721 73,827
CC labour x1,000 276,417 437,869 275,494 449,302 267,061 422,973 256,759 296,617
Eng. CM HO & fees x1,000 78,055 133,336 77,810 133,053 78,074 128,088 104,631 113,334
Process contingency x1,000 0 63,711 0 61,096 40,686 104,045 55,227 74,764
Project contingency x1,000 111,985 234,026 111,926 235,789 114,883 227,726 224,927 244,510
Total x1,000 1,055,857 1,891,506 1,056,815 1,891,836 1,107,033 1,872,371 1,664,464 1,765,138
Total overnight $/kW 1,919 3,464 1,921 3,440 2,013 3,404 2,618 3,413
Variable O&M ($)
VOM equipment $/MWh 0.00 0.00 0.00 0.00 0.00 0.00 0.00 0.00
VOM materials $/MWh 3.19 6.03 3.13 6.07 2.70 5.07 1.40 2.10
VOM labour $/MWh 1.63 2.89 1.51 2.88 1.63 2.77 3.15 3.82
Total $/MWh 4.82 8.92 4.64 8.95 4.34 7.84 4.55 5.92
Fixed O&M ($)
FOM equipment x1,000 0 0 0 0 0 0 0 0
FOM materials x1,000 10,181 17,974 10,206 18,021 10,226 17,334 26,656 26,342
FOM labour x1,000 9,197 11,727 9,716 10,478 9,205 10,367 11,636 12,127
Total x1,000 19,378 29,701 19,922 28,499 19,431 27,701 38,292 38,469
16
Economic AssEssmEnt of cArbon cApturE And storAgE tEchnologiEs: 2011 uPDate

Table 3-2 Electric power generation (oxy-combustion and NGCC) facility parameters with and without capture�
Oxy-combustion supercritical
Oxy-combustion ultra-supercritical
Oxy-combustion ITM supercritical NGCC
Capture No Yes No Yes No Yes No Yes
Fuel Coal Coal Coal Coal Coal Coal NG NG
Gross power output MW NA 786 NA 759 NA 688 570 520
Auxiliary power MW NA 236 NA 209 NA 138 10 38
Net power output MW NA 550 NA 550 NA 550 560 482
Net plant HHV efficiency % NA 29.3 NA 33 NA 29.3 50.80% 43.70%
Net plant HHV heat rate GJ/MWh NA 12.30 NA 10.92 NA 12.27 7.09 8.24
CO2 generated tonne/hr NA 592 NA 525 NA 560 202 202
CO2 emitted tonne/hr NA 0 NA 0 NA 47 202 20
CO2 captured tonne/hr NA 592 NA 525 NA 514 0 182
Emission intensity kg/MWh NA 0 NA 0 NA 85 362 42
Plant capital overnight costs ($)
CC equipment x1,000 NA 851,291 NA 835,378 NA 950,517 245,193 391,048
CC materials x1,000 NA 61,530 NA 60,532 NA 62,080 23,710 28,771
CC labour x1,000 NA 503,652 NA 468,571 NA 449,302 58,152 105,552
Eng. CM HO & fees x1,000 NA 130,217 NA 124,831 NA 133,053 29,435 47,283
Process contingency x1,000 NA 53,683 NA 68,832 NA 61,096 0 33,450
Project contingency x1,000 NA 195,215 NA 185,014 NA 235,789 41,892 91,356
Total x1,000 NA 1,795,588 NA 1,743,157 NA 1,891,836 398,382 697,460
Total overnight $/kW NA 3,265 NA 3,169 NA 3,440 711 1,447
Variable O&M ($)
VOM equipment $/MWh NA 0.00 NA 0.00 NA 0.00 0.00 0.00
VOM materials $/MWh NA 3.44 NA 3.05 NA 3.36 0.48 1.01
VOM labour $/MWh NA 2.75 NA 2.68 NA 2.46 0.69 1.29
Total $/MWh NA 6.19 NA 5.73 NA 5.82 1.18 2.30
Fixed O&M ($)
FOM equipment x1,000 NA 0 NA 0 NA 0 0.00 0.00
FOM materials x1,000 NA 17,207 NA 16,774 NA 15,417 4,412.31 7,060.31
FOM labour x1,000 NA 10,346 NA 10,276 NA 10,053 3,411.58 4,560.27
Total x1,000 NA 27,553 NA 27,050 NA 25,470 7,823.89 11,620.57
17
3 mEthodology for ccs Economic AnAlysis updAtE
3 methoDology for ccS economic analySiS uPDate (continuEd)
3�4 Regional specific factorsThis update revises factors for moving the capital costs from the reference location to the location of interest and is described in section 3.4.1. The inclusion of region specific fuel information is described in section 3.4.2.
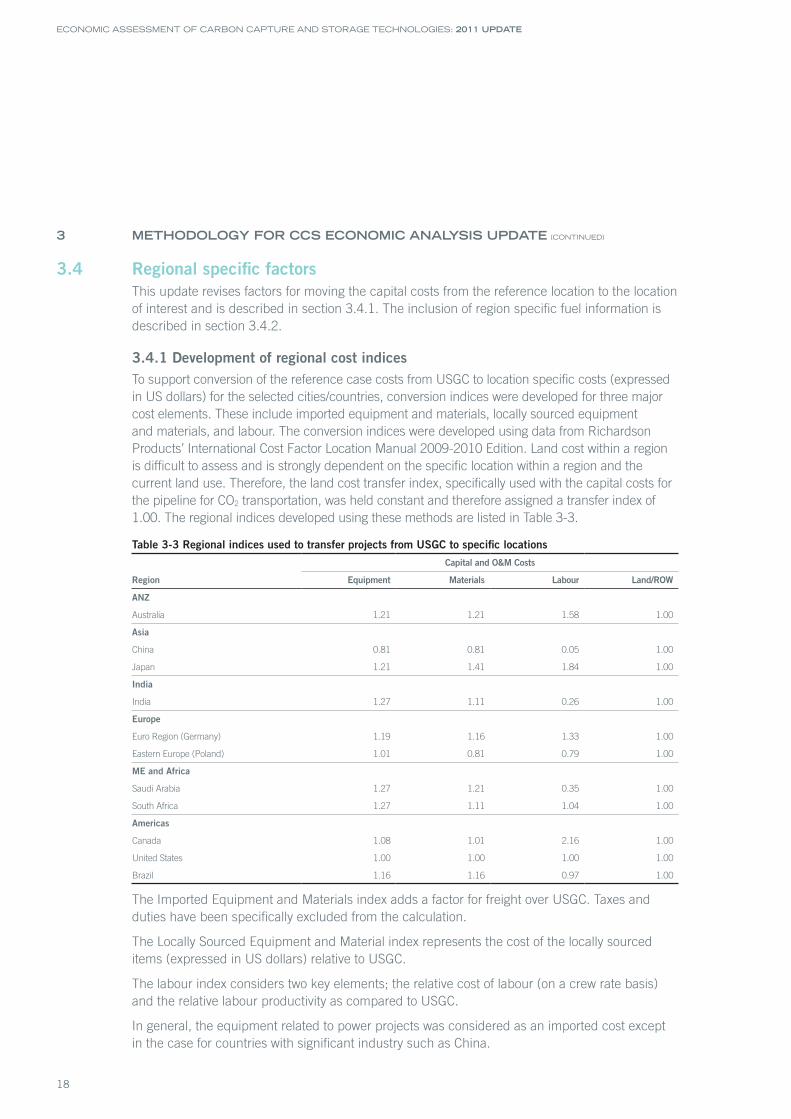
3�4�1 Development of regional cost indicesTo support conversion of the reference case costs from USGC to location specific costs (expressed in US dollars) for the selected cities/countries, conversion indices were developed for three major cost elements. These include imported equipment and materials, locally sourced equipment and materials, and labour. The conversion indices were developed using data from Richardson Products’ International Cost Factor Location Manual 2009-2010 Edition. Land cost within a region is difficult to assess and is strongly dependent on the specific location within a region and the current land use. Therefore, the land cost transfer index, specifically used with the capital costs for the pipeline for CO2 transportation, was held constant and therefore assigned a transfer index of 1.00. The regional indices developed using these methods are listed in Table 3-3.
Table 3-3 Regional indices used to transfer projects from USGC to specific locations
Capital and O&M Costs
Region Equipment Materials Labour Land/ROW
ANZ
Australia 1.21 1.21 1.58 1.00
Asia
China 0.81 0.81 0.05 1.00
Japan 1.21 1.41 1.84 1.00
India
India 1.27 1.11 0.26 1.00
Europe
Euro Region (Germany) 1.19 1.16 1.33 1.00
Eastern Europe (Poland) 1.01 0.81 0.79 1.00
ME and Africa
Saudi Arabia 1.27 1.21 0.35 1.00
South Africa 1.27 1.11 1.04 1.00
Americas
Canada 1.08 1.01 2.16 1.00
United States 1.00 1.00 1.00 1.00
Brazil 1.16 1.16 0.97 1.00
The Imported Equipment and Materials index adds a factor for freight over USGC. Taxes and duties have been specifically excluded from the calculation.
The Locally Sourced Equipment and Material index represents the cost of the locally sourced items (expressed in US dollars) relative to USGC.
The labour index considers two key elements; the relative cost of labour (on a crew rate basis) and the relative labour productivity as compared to USGC.
In general, the equipment related to power projects was considered as an imported cost except in the case for countries with significant industry such as China.
18
Economic AssEssmEnt of cArbon cApturE And storAgE tEchnologiEs: 2011 uPDate

The capital costs for power generation and capture were considered for the respective regions. Based on WorleyParsons experience, the China labour index was significantly greater than that previously reported and resulted in power plant capital costs greater than those typically reported. This higher than expected index is related to the urban locations used within the Richardson’s manual. Generally, the setting of most power plants is in rural areas, and as a result the labour index for China was reduced to a value more inline with the previous report of 0.05.
The reader is cautioned that the calculated indices are based on very specific locations/cities, generally major metropolitan areas, and can vary considerably, particularly with respect to labour, depending on the actual project location. Additionally, the type of labour used; non-union, union, or work camps, can greatly impact the labour costs within a given region. Further, the locally sourced equipment and materials and labour indices will vary with changes in currency exchange rates.
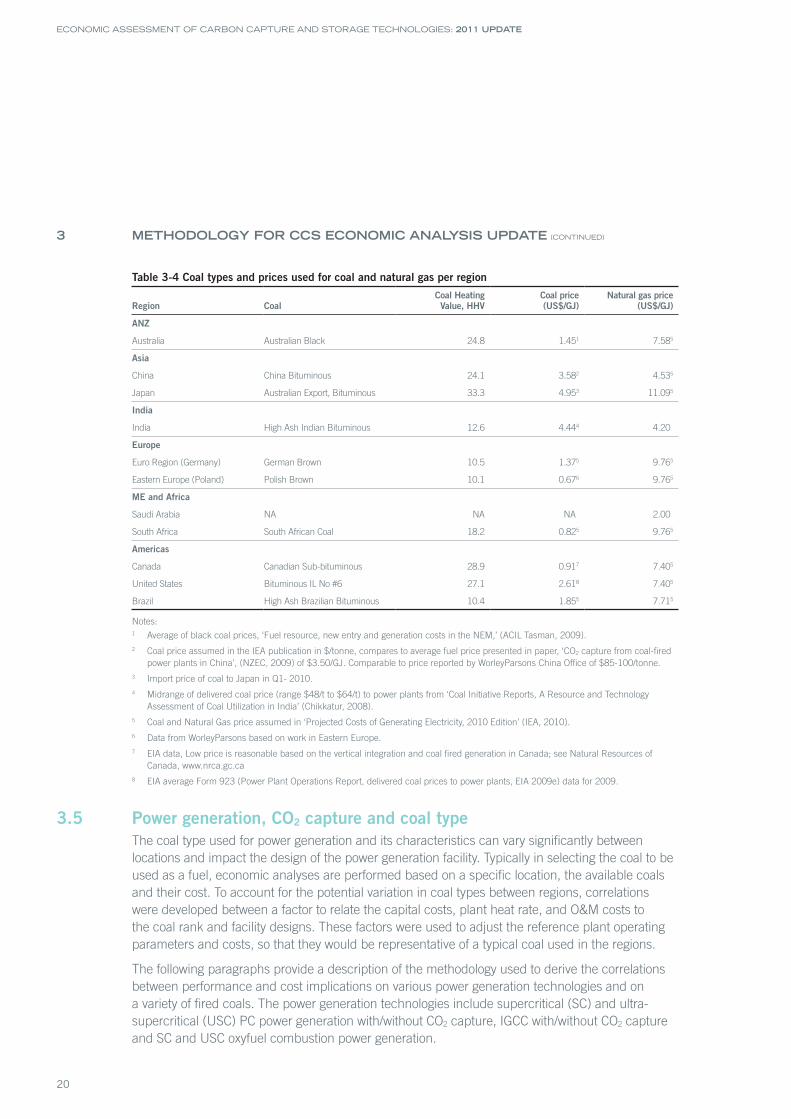
3�4�2 Regional coal type and fuel costsIn addition to the update of the regional factors, typical coal types for each of the regions were selected to be utilised in the economic analysis. The coal selections were based on the information provided in Projected Costs of Generating Electricity (IEA, 2010) and WorleyParsons’ experience. In general, obtaining the price paid by a generator for fuel is difficult and where this data is available, is found to vary significantly between facilities. The coal pricing approach for the regions was adopted from the Projected Costs of Generating Electricity in that for countries which produce coals, local coal prices were assumed while for non-coal producing countries international market prices were assumed. The local coal prices were determined through the review of the literature such as national energy surveys, the Projected Costs of Generating Electricity, and in the case of the United States, a database of delivered fuel costs. The regional natural gas prices were determined through similar methods. A summary of the coal types and coal and natural gas prices used in this study are provided in Table 3-4.
19
3 mEthodology for ccs Economic AnAlysis updAtE
3 methoDology for ccS economic analySiS uPDate (continuEd)
Table 3-4 Coal types and prices used for coal and natural gas per region
Region Coal Coal Heating Value, HHV
Coal price (US$/GJ)
Natural gas price (US$/GJ)
ANZ
Australia Australian Black 24.8 1.451 7.585
Asia
China China Bituminous 24.1 3.582 4.535
Japan Australian Export, Bituminous 33.3 4.953 11.095
India
India High Ash Indian Bituminous 12.6 4.444 4.20
Europe
Euro Region (Germany) German Brown 10.5 1.375 9.765
Eastern Europe (Poland) Polish Brown 10.1 0.676 9.765
ME and Africa
Saudi Arabia NA NA NA 2.00
South Africa South African Coal 18.2 0.825 9.765
Americas
Canada Canadian Sub-bituminous 28.9 0.917 7.405
United States Bituminous IL No #6 27.1 2.618 7.405
Brazil High Ash Brazilian Bituminous 10.4 1.855 7.715
Notes:1 Average of black coal prices, ‘Fuel resource, new entry and generation costs in the NEM,’ (ACIL Tasman, 2009).2 Coal price assumed in the IEA publication in $/tonne, compares to average fuel price presented in paper, ‘CO2 capture from coal-fired
power plants in China’, (NZEC, 2009) of $3.50/GJ. Comparable to price reported by WorleyParsons China Office of $85-100/tonne.3 Import price of coal to Japan in Q1- 2010.4 Midrange of delivered coal price (range $48/t to $64/t) to power plants from ‘Coal Initiative Reports, A Resource and Technology
Assessment of Coal Utilization in India’ (Chikkatur, 2008).5 Coal and Natural Gas price assumed in ‘Projected Costs of Generating Electricity, 2010 Edition’ (IEA, 2010).6 Data from WorleyParsons based on work in Eastern Europe.7 EIA data, Low price is reasonable based on the vertical integration and coal fired generation in Canada; see Natural Resources of
Canada, www.nrca.gc.ca8 EIA average Form 923 (Power Plant Operations Report, delivered coal prices to power plants, EIA 2009e) data for 2009.
3�5 Power generation, CO2 capture and coal typeThe coal type used for power generation and its characteristics can vary significantly between locations and impact the design of the power generation facility. Typically in selecting the coal to be used as a fuel, economic analyses are performed based on a specific location, the available coals and their cost. To account for the potential variation in coal types between regions, correlations were developed between a factor to relate the capital costs, plant heat rate, and O&M costs to the coal rank and facility designs. These factors were used to adjust the reference plant operating parameters and costs, so that they would be representative of a typical coal used in the regions.
The following paragraphs provide a description of the methodology used to derive the correlations between performance and cost implications on various power generation technologies and on a variety of fired coals. The power generation technologies include supercritical (SC) and ultra-supercritical (USC) PC power generation with/without CO2 capture, IGCC with/without CO2 capture and SC and USC oxyfuel combustion power generation.
20
Economic AssEssmEnt of cArbon cApturE And storAgE tEchnologiEs: 2011 uPDate

3�5�1 General methodologyTo obtain the correlations, plant performance and cost data for different coals were extracted from various publications and the WorleyParsons database. The data was then screened and analysed. The data was selected for producing the correlations only when it was from a single study and covered a relatively wide range of coals, typically one or two bituminous coals, one sub-bituminous coal and/or a lignite coal. Selecting studies that consider multiple coal types at the same location guarantees the data is on the same basis. The factor correlations were developed by considering the ratio of a parameter, that is capital cost, at different coal heating values, to a reference coal heating value of 30.8MJ/kg, the heating value of Pittsburgh No. 8 coal. Extrapolation or interpolation was applied in some cases when necessary. The best fit curves and correlation equations were found through selected data series using regression analysis techniques in Excel (Trendline function in Chart).
The correlation equations present the percentage change in plant performance or capital cost as a function of coal heating value from the reference coal heating value. The higher heating value (HHV) was used throughout this work. It is acknowledged that coal constituents have impacts on plant performance and cost to different degrees of extent. However, only HHV is used to represent coal categories in this study.
If multiple data sets from different sources were available, the correlation equation/curves were based on all data, which basically averages the selected parameters and hence reflects generic correlations. If the correlation equations were developed based on a single data set due to limited information, the correlations reflect the conditions defined in referred studies. In such case only the studies with relatively generic design conditions were chosen.
3�5�2 AssumptionsThe following assumptions were also made to derive the correlations between performance and cost implications on various power generation technologies and on a variety of fired coals.
General
a) Correlation equations are developed by data fitting technique if multiple data sets are available, which basically averages the subject parameters and hence reflects only generic trend of coal heating value. If the correlation equations are developed by single data set due to limited info availability, the equations will only reflect the data based on specific conditions of the referred study.
b) All the technical and cost data is based on studies in US region. It should be acknowledged that cost varies with the plant site, significantly sometimes. The studies are either public or from WorleyParsons database.
c) The data collected is based on the consistent system configurations for US region, and does not intend to reflect specific region or country’s pollutant emission requirements and other constraints such as water.
d) PC plant data is based on SC and USC plant. The IGCC plant data is based on Shell Technology only considering it is relatively abundant data for different coal including low rank coal.
21
3 mEthodology for ccs Economic AnAlysis updAtE
3 methoDology for ccS economic analySiS uPDate (continuEd)
PC case
a) All the SC and USC PC plants analysed with or without CO2 capture are equipped with flue gas desulphurisation (FGD) for sulphur reduction and selective catalytic reduction (SCR) for NOx reduction from the stack.
b) The SC or USC PC plant performance curve does not necessarily reflect the impact of sulphur content in coal on SC steam condition. The PC heat rate curves are based on consistent steam condition for the range of coal.
c) All cases with CO2 capture efficiencies are assumed to be approximately 90 per cent.
d) The SC/USC PC plant performance (heat rate) of each data set is based on new plants specifically designed for different coals.
e) The SC PC plant capital cost is based on sites in US. It should be acknowledged that cost varies with the plant site, dramatically sometimes.
f) PC FGD option data was based on FGD using limestone or lime in US corresponding to coals.
IGCC case
a) While specific component selection has an impact on IGCC system performance (for example an IGCC choosing Selexol as acid gas removal (AGR) system has slightly different performance from one choosing Amine system), the performance curve intends to reflect such differences.
b) IGCC with or without CO2 capture heat rate comparisons are based on Shell technology (dry feed). It should be noted that for other technologies, the comparison result may change to different degrees of extent.
Oxyfuel PC plant
a) Based on SC/USC pulverised coal power plants (24.1MPa/599°C/621°C, 3500 psig/1110°F/1150°F)
b) The plants are equipped with low NOx burner (LNB)/overfire oxygen (OFO)/flue gas recirculation (FGR) and FGD
c) Oxygen (95 per cent pure) used for combustion is produced from cryogenic air separation unit (ASU) system.
d) CO2 specification is for storage in saline formation (raw combustion product produced using 95 per cent oxygen and dehydrated to 0.015 per cent (by volume) H2O).
e) Assume the efficiency difference for an oxyfuel boiler firing different coal is similar to the difference for an air fired boiler firing different coal while the oxyfuel boiler efficiency has slightly higher efficiency.
f) CO2 compression uses integrally geared, multistage centrifugal with indirect water intercoolers.
FGD option factor
a) FGD performance and cost comparisons are based on a SC PC plant firing Illinois #6 bituminous coal with a wet limestone forced oxidation positive pressure absorber.
22
Economic AssEssmEnt of cArbon cApturE And storAgE tEchnologiEs: 2011 uPDate

Cooling options factor
a) The factor is based on mechanical draft wet cooling options and 100 per cent dry cooling.
b) Comparison is assumed on average annual ambient temperature of about 16°C (annual average). The performance impact is of average corresponding to the ambient. It should be noted that ambient temperature has significant impact on the performance when the plant switches between wet and dry cooling options at high temperature, for instance 0°C.
3�5�3 Correlations developedTo facilitate presentation, the correlations were given in the form of a ratio of studied plant performance/cost to a referred plant performance/cost as a function of heating value difference between studied coal and the referred coal heating value. The performance and cost of plants firing bituminous coal, i.e. Pittsburgh No. 8 coal, was used as the referred data point. Correlation diagrams between net plant heat rate (HHV) and coal heating value, and plant capital costs and coal heating value for a SC PC plant without CO2 capture are illustrated in Figure 3-2 and Figure 3-3.
Figure 3-2 Heat rate factors as a function of coal heating value
Figure 3.2
Heating rate ration for Supercritical PC plant w/o CO2 capture (HHV)
Heating Value of Fuel (MJ/kg HHV)
5 10 15 20 25 30 35
1.00
1.02
1.04
1.06
1.08
1.10
1.12
1.14
1.16
Base Fuel HHV =30.8 MJ/kg
23
3 mEthodology for ccs Economic AnAlysis updAtE

3 methoDology for ccS economic analySiS uPDate (continuEd)
Figure 3-3 Capital cost factors as a function of coal heating value
Figure 3.3
Capital cost ratio forSupercritical PC plantw/o CO2 capture
Heating Value Btu/lb MJ/kg
5 10 15 20 25 30 35
1.00
1.05
1.10
1.15
1.20
1.25
1.30
1.35
1.40
1.45
Base Fuel HHV =30.8 MJ/kg
Specifics regarding the data sources and specifics of the analyses for the various technologies are provided in the following sub-sections.
PC power plant
Correlations between performance/capital cost and coal heating values for SC-PC power plant without CO2 capture were derived using data from several public studies and a confidential WorleyParsons study (Holt, N & Booras, G 2007; WorleyParsons 2002; EPA 2006; WorleyParsons 2009a; DOE/NETL 2007; WorleyParsons 2009b). Performance and capital cost correlations for SC-PC power plant with CO2 capture were developed using data from various reports (WorleyParsons 2009a; DOE/NETL 2007; WP 2009b). Information were applied in correlations between coals and O&M cost for SC PC power plants with and without CO2 capture (DOE/NETL 2007; WorleyParsons 2009b).
For the case of heat rate correlation of USC-PC without CO2 capture, data from a WorleyParsons report (WorleyParsons 2009a) was used. Due to the sparse information the correlations for USC power plant capital cost, O&M cost, the data for SC PC plants were adopted. USC-PC plants have different capital and O&M costs from SC-PC plants. However using the ratio of the cost mitigates the impact to some extent.
IGCC power plant
Correlations for IGCC power plant were derived based on Shell coal gasification technology because of its suitability to relative wide range of coals and good information availability.
Data from several sources were used to develop the correlations for IGCC plant with and without CO2 capture (WorleyParsons 2009a; DOE/NETL 2007; WorleyParsons 2009b; Maurstad et al 2006).
24
Economic AssEssmEnt of cArbon cApturE And storAgE tEchnologiEs: 2011 uPDate

Oxycombustion power plant
Oxycombustion technology used for power generation is still in development. There is currently little published information on the impact of different coals on the plant performance and costs. However, many studies for power generation utilising oxycombustion boiler for single specific coal have been done, and some studies from technology vendors indicate that a oxycombustion PC boiler has similar or slightly higher efficiency as a conventional PC boiler, and the oxycombustion PC power plant essentially has the same system and equipment as the conventional PC power plant except the boiler island (US DOE 2008a; DOE/NETL 2006; DOE/NETL 2001). With these considerations in mind, the performance and cost for an oxycombustion power plant were estimated based on the performances and costs of an SC oxycombustion power plant based on a specific coal (US DOE 2008a) and a conventional SC PC power plant firing different coals (DOE/NETL 2007; WorleyParsons 2009b). The correlations for SC and USC PC oxycombustion power plants then were derived from these estimated performance and costs.
Flue gas desulphurisation and wet/dry cooling design options
The impact of a SC PC power plant with or without a FGD on cost and performance was estimated. The derived factor (percentage) was based on information from the ‘Cost and Performance Baseline for Fossil Energy Plants’ (DOE/NETL 2007). The study utilising wet limestone forced oxidation type FGD.
The impact for switching wet cooling to drying cooling on the performance and cost of PC and IGCC power plants were estimated based on information from various reports (DOE/NETL 2007; WorleyParsons 2007; Power, W.E 2005; Power, W.E 2009). It should be noted that the design ambient temperature may have significant impact on the performance and cost of a power plant. In this study the data was based on design ambient temperature of 60-65ºF, which is considered to be an annual average temperature.
3�5�4 Limitations of approachThe above approach is not intended to provide for detailed accounting of the coal type and process design requirements but rather a rapid method of assessing the impact of these parameters in an economic model. As illustrated these correlations are strictly empirical and should be treated as such. Limitations of this approach include:
• not considering variation in process designs which account for many interacting case specific factors;
• trends utilise coal heat heating as the primary driver for cost and heat rate changes, coal characteristics leading to coal heat rate are not necessarily considered; and
• impact of high coal ash content and ash composition/properties not included.
3�6 CO2 capture from industrial processesThere were minimal changes made to the method in which the CO2 capture cases for industrial processes were analysed. The capital and operating costs were updated from the 2009 figures, which resulted in an increase of approximately 1 per cent.
As with the initial economic assessment in 2009, the 2010 CCS economic analysis was applied to select industrial processes to determine the cost parameters for blast furnace steel production, cement production, natural gas processing, and fertiliser (ammonia) production. The specific
25
3 mEthodology for ccs Economic AnAlysis updAtE

3 methoDology for ccS economic analySiS uPDate (continuEd)
emission intensities, typical production rates, annual CO2 flow rates, and other parameters from current commercial practice were used as a basis (where available) and are listed in Table 3-5. Steel and cement production require both capture and compression while natural gas processing and fertiliser production are processes that require CO2 separation from a gas stream. Thus, these processes only need the addition of drying and CO2 compression.
Table 3-5 Emissions intensities, processing parameters, and commercial application examples for industrial processes
Blast Furnace Cement Natural Gas Processing Fertiliser Production
CO2 emission intensity2tonne CO2 /tonne steel
0.83tonne CO2 /tonne cement
0.13kg CO2 /Sm3
natural gas0.57tonne CO2 /tonne ammonia
Product production rate 40steel tonne/hour 40cement tonne/hour1,100Sm3/hour
46GJ/hour46tonne ammonia/hour
Annual CO2 flow of single plant (tonne/year)
706,000 296,000 1,000,000 194,000
Commercial exampleNo commercial operating facility
No commercial operating facility
SleipnerCoffeyville
gasification facility
The energy for capture (primarily solvent regeneration) and CO2 compression can be obtained through heat or electricity generated by the system or through purchased power. This uncertainty can lead to difficulties in the interpretation of the analyses. In this assessment, the following assumptions were made.
• The cost of the energy to meet the auxiliary load was determined from the natural gas cost in the region with 50 per cent conversion efficiency.
• The CO2 from the generation of heat or electricity used by the capture system was not included in the calculation.
The CO2 flows from the individual industrial processes, less than 1Mt per year of CO2, are smaller than those for standard power generation plants. Therefore, it was assumed that a multi-user pipeline and storage option would be available. For storage and transportation, costs of US$4/tonne of CO2 and US$7/tonne of CO2 were used, respectively. The basis for the cost is discussed in the following sections.
3�7 CO2 transportReport One from the 2009 Strategic Analysis work identified CCS projects around the world that are in operation or under development. The study also identified a subset of CCS projects that were classified as large-scale integrated CCS projects (LSIPs). Examination of this subset of LSIPs as part of the economic assessment update found that the average length of pipelines for the LSIPs was in the order of 100km. To reflect the activities occurring in the development of CCS projects globally, this distance for an onshore pipeline is used is estimating transport costs. This differs from the reference case assumption made in the 2009 economic assessment of 250km. The other process assumptions for CO2 transport including inlet temperature and pressures remained unchanged.
3�8 CO2 storageAs the 2009 study showed, the economics of CO2 storage is dependent upon the geology of the target formation. The geology will drive the storage site selection and the site will drive the commerciality of commercial scale, integrated CCS projects. In this update, the “finding” costs
26
Economic AssEssmEnt of cArbon cApturE And storAgE tEchnologiEs: 2011 uPDate

applied are assumed to range from US$25 million in the ideal case to US$150 million or more depending on the geology. This is consistent with the 2009 study.
Given the high variability of geologic properties within a region, let alone across nations, the assumption was made that the ‘reservoir’ properties were identical across all the jurisdictions for which recent market costs were available (North America, Europe and Australia/New Zealand). This allowed for a direct comparison of potential storage costs over these regions and an understanding of what the key capital and operating costs are for each region. It was also assumed that all storage projects occur onshore, an assumption that avoids the highly variable costs of drilling offshore. A further assumption is that no EOR is possible as a means of revenue offsets for CO2 storage. Thus, the storage scenarios allow for ‘reasonable’ comparisons. In cases where storage costs for CO2 were not available, the costs of hydrocarbons exploration programs were used as analogues.
Furthermore, in order to treat the inherent uncertainty of storage, two case study scenarios were considered. The two cases were for a ‘good’ reservoir and a ‘poorer’ reservoir with either 3Mtpa or 12Mtpa injection scenarios modeled. These are presented in Table 3-6. In this case, the primary differences between the two reservoirs are the absolute permeability and the reservoir thickness.
Table 3-6 Geological and well properties for ‘poorer reservoir’ and ‘good reservoir’
Units ‘Poor reservoir’ ‘Good reservoir’
Net thickness m 5.0 15.0
Absolute permeability md 150 400
Reservoir mid-depth m 1700 1700
Initial pore gradient bar/m 0.1002 0.1002
Temperature gradient °C/100m 3.0 3.0
Surface temperature °C 20 20
Fracture gradient bar/m 0.136 0.136
Initial pore pressure bar 170 170
Reservoir temperature °C 71 71
Injection pressure limit (of FG) – 90% 90%
Initial injection pressure bar 208 208
Relative permeability – 0.3 0.3
Drainage radius m 762 762
Wellbore – radius m 0.09 0.09
Total skin – 2.5 2.5
For both these cases, the well counts at the start of the injection period and end of the injection period were calculated using a number of factors to control well count. It was assumed that no heating of the CO2 was required upon delivery to the injection site (this may be a simplification which would require both power and compressors at the wellhead thus increasing capital (CAPEX) and operations and maintenance (OPEX) costs) and that the injection pressure was always maintained at 90 per cent of the fracture gradient thus reducing operational risk from injection induced fracturing. The drainage radius assumes that the CO2 forms a circular pool (‘pancake’) at the injection point (that is, that the reservoir is wholly homogenous throughout all the injection points).
27
3 mEthodology for ccs Economic AnAlysis updAtE

3 methoDology for ccS economic analySiS uPDate (continuEd)
The analysis assumed that a suitable reservoir was located and characterised and that injection could commence once the capture plant was online. It was also assumed that the exploration and appraisal program that would start in late 2010 to prove up these sites (and others as a potential portfolio of storage options) was successful and that the locations would have been shown to have suitable seals and other geological factors that would allow for safe storage of CO2 over the longer term. Thus, the analysis assumes that the developmental timeline for the storage site starts at the FEED phase to allow injection to commence from 2016 onwards. In both cases, ‘finding costs’ are included in the site selection and. Vertical injection wells are used in both cases as the standard. The evaluation did not consider stimulation by fracturing or deviated well placement that could increase injection rates. Such well design considerations would be considered after the site characterisation and the full field development program are complete.
This analysis required that the injection well pressure was below the fracture pressure (90 per cent of fracture pressure) which provides the first order constraint on potential storage volumes. CO2 injection above the fracture pressure could increase well injectivity rates, but at the risk of fracturing the cap-rock. Thus, an accurate determination of the actual fracture pressure can only be derived from laboratory tests on new core samples from both areas. Another assumption is that sufficient pore space is available over the life of the injection operations.
This analysis required that the injection well pressure was below the fracture pressure (90 per cent of fracture pressure) which provides the first order constraint on potential storage volumes. CO2 injection above the fracture pressure could increase well injectivity rates, but at the risk of fracturing the cap-rock. Thus, an accurate determination of the actual fracture pressure can only be derived from laboratory tests on new core samples from both areas. Another assumption is that sufficient pore space is available over the life of the injection operations.
As previously discussed in the 2009 Foundation Report Two, the key factor determining the cost of CO2 storage is the ‘reservoir permeability thickness product’ (k·h) since this determines the injectivity of the site and thus controls the well count needed for a given volume of CO2.
As can be seen in Table 3-7 below, the final well counts required for each reservoir for both injection scenarios are as follows.
Periodically new wells will need to be brought online in the poor reservoir to allow for the constant injection volume to be maintained on an annual basis. This is due to the ‘back pressure’ exerted by the reservoir as it fills with CO2, meaning that the original injection volume on the initial injector wells will decrease over time, thus necessitating new wells for constant volumetric injection.
Table 3-7 Well counts for ‘Poor reservoir’ and ‘Good reservoir’
Reservoir quality injection volume 3Mtpa 12Mtpa
‘Poor reservoir’ 16 61
‘Good reservoir’ 2 8
28
Economic AssEssmEnt of cArbon cApturE And storAgE tEchnologiEs: 2011 uPDate

Regional cost comparison
Recent data on the costs for CO2 storage were available from Australia/New Zealand, Europe, and North America for CO2 injection wells and associated services. These are listed in Table 3-8. Whilst proprietary data was available for China, confidentiality issues prevented the release of this information. As a result, Australia and New Zealand (ANZ) was used as a proxy for this region.
Table 3-8 Regional costs for CO2 storage
Regional Costs (in 2010 US$) ANZ Europe US
3D Seismic survey mln US$/svy 18 25 18
Deep monitoring well costs mln US$/well 6 6 5
Shallow monitoring well costs mln US$/well 0.50 0.70 1
Injection well costs mln US$/well 7 7 10
Injection well abandonment costs & rehab mln US$/well 1 0.70 1
Monitoring well abandonment costs & rehab mln US$/well 0.50 0.70 0.5
In-field flow lines mln US$/well 0.24 0.35 0.25
Drilling cost escalation per annum % 7 % 5 % 5 %
Well-related OPEX % of DrillEX 5 % 5 % 5 %
Monitoring OPEX mln $/yr 0.10 0.14 0.10
Fees & Rents OPEX mln $/yr 0.10 0.14 0.10
There is little headline difference in the well costs between each of the regions. This recognises that the costs estimates for the complete study is in the order of +/- 40 per cent and indeed the similarity of the costs can be taken as an indication that the market for well services/rigs is worldwide. Thus, companies will seek to move staff and assets to areas of demand.
3�9 Summary of process and economic modelling assumptions The default assumptions used for the reference CCS system during the assessments of the various technologies are listed in Table 3-9. As described in the previous sections within this chapter, primary changes from the initial report include revised parameters for the storage reservoir properties and the decrease of the pipeline length from 250km to 100km.
29
3 mEthodology for ccs Economic AnAlysis updAtE

3 methoDology for ccS economic analySiS uPDate (continuEd)
Table 3-9 Process modelling and financial assumptions for reference case
Capital cost estimate basis:
Constant 2010 US dollars (2010 US$)
The reference location is the US Gulf Coast.
Labour is based on non-union rates.
CO2 capture
Power generation: results listed for supercritical, oxy-combustion, IGCC, and NGCC technologies, system design parameters listed in Table 3-1 and Table 3-2.
Industrial processes: natural gas processing, cement production, blast furnace production of steel and fertiliser (ammonia) production.
Transportation: pipeline
CO2 pipeline length: 100km
CO2 pipeline inlet temperature: 25°C
CO2 pipeline inlet pressure: 20.2MPa
CO2 pipeline outlet pressure: 15.3MPa
Storage: saline aquifer (reference case was for ‘good reservoir’)
Reservoir pressure 17MPa
Reservoir thickness 15m
Reservoir depth 1,700m
Reservoir absolute permeability 400mD
Site screening and evaluation US$66,000,000
Financial: general
Levelisation period 30 years
Owners’ costs 15%
AFUDC rate 9%
Labour multiplier 1
Coal cost 2.61US$/GJ
Natural gas cost 7.40US$/GJ
Financial: cost of capital Per cent Rate
Debt 40% 6%
Equity 60% 12%
Tax rate for debt interest deduction 33%
Financial: escalation rates
Fixed O&M cost escalation rate 0%
Variable O&M cost escalation rate 0%
Real CO2 emissions escalation rate 0%
Real fuel escalation rate 3%
30
Economic AssEssmEnt of cArbon cApturE And storAgE tEchnologiEs: 2011 uPDate

4 reSultS anD comParative SenSitivity analySiS
An economic comparison of projects can be performed using the methodology and templates reviewed and developed in Chapters Two and Three, respectively of Foundation Report Two. Additionally, sensitivity analyses are also included in this evaluation to determine the range of results and their dependence on key cost components and design assumptions.
The assumptions used for the reference CCS system during the assessments of the various technologies are listed in Table 3-9. The following sections provide an update of the results.
4�1 Capture of CO2 The methodology developed was applied to power generation and select industrial processes to determine the levelised production costs (US$/unit of product), cost of CO2 avoided, and the cost of CO2 captured.
4�1�1 Power generation
Capital costs
The impact of CCS on the cost of new electric power generation facilities was the first set of cases to be reviewed using the model developed. The parameters for the facilities are listed in Table 3-1 and Table 3-2, and under the base case assumptions listed in Table 3-9. The capital costs, including the owners’ costs, for the CO2 capture portion of the CCS system are compared on a $/kW basis in Figure 4-1 for first-of-a-kind (FOAK) systems (note that transportation and storage cost components are not included). FOAK systems are innovative and inherently involve greater uncertainty and therefore costs. Experience gained from these plants (such as design and operation) will generate learnings which will reduce the uncertainty and hence the costs. As these experiences increase, the cost reductions (for example, through process optimisation) result in nth-of-a-kind (NOAK) plant estimates.
For the non-CO2 capture of PC supercritical and ultra-supercritical cases, there is a small cost increase related to the material requirements for the higher steam conditions. This capital cost is potentially recovered through lower fuel costs related to the greater efficiency of the ultra-supercritical unit. The selection of plant efficiency, as determined by the steam conditions, must consider a balance between the capital and fuel costs. Based on the small change in the overnight capital costs at the reference location, there is only a small increase in these values compared to the 2009 report.
31
4 rEsults And compArAtivE sEnsitivity AnAlysis

4 reSultS anD comParative SenSitivity analySiS (continuEd)
Figure 4-1 Installed costs for 550MW net generation and CO2 capture facility (FOAK)
Figure 4.1 Installed Costs for 550MW Net Generation and CO2 Capture Facility (FOAK)
Capital costs (US$/kW) 0 1,000 2,000 3,000 4,000 5,000
With captureWithout capture
NGCC
IGCC
Oxy-combustion ITM supercritical
Oxy-combustion ultra-supercritical
Oxy-combustion supercritical
Ultra-supercritical
Supercritical 2
PC supercritical
Region: United States
Levelised cost of electricity
Capital costs presented above, along with transportation and storage capital costs (based on matching the captured CO2 flows), were used as inputs to the economic assessments. The LCOEs for FOAK and NOAK plants are presented in tabular form in Table 4-1 and graphically in Figure 4-2.
The cost parameters calculated from the LCOEs, the cost of CO2 avoided and cost of CO2 captured (including transportation and storage), in the economic assessment are provided for FOAK and NOAK units in Table 4-2 and shown graphically for FOAK units in Figure 4-3.
The costs of LCOE and CO2 avoided and captured have decreased slightly since the 2009 report. This is likely to be a reflection of the revised fuel costs for this update.
32
Economic AssEssmEnt of cArbon cApturE And storAgE tEchnologiEs: 2011 uPDate

Table 4-1 Breakdown of LCOE for technologies with and without CCS for FOAK and NOAK plants
PC supercritical
PC supercritical
2Ultra-
supercritical
Oxy-combustion supercritical
Oxy-combustion
ultra-supercritical
Oxy-combustion
ITM supercritical IGCC NGCC
LCOE without capture ($/MWh)
Generation 76 76 73 NA NA NA 90 88
Transportation 0 0 0 0 0 0 0 0
Storage 0 0 0 0 0 0 0 0
Total 76 76 73 NA NA NA 90 78
LCOE with capture for FOAK ($/MWh)
Generation and capture 124 121 113 114 107 116 116 115
Transportation 1 1 1 1 1 1 1 1
Storage 6 6 6 6 6 6 6 6
Total 131 129 120 121 114 123 123 123
LCOE with capture for NOAK ($/MWh)
Generation and capture 122 119 109 112 104 114 113 114
Transportation 1 1 1 1 1 1 1 1
Storage 6 6 6 6 6 6 6 6
Total 129 127 117 119 112 121 121 121
Note: The steam conditions of the ultra-supercritical technologies presented are beyond those typical used in the industry today and therefore should be considered emerging technologies. The initial deployment of this technology will be strongly dependent on the specific site and available coal characteristics. Therefore, in the near term, the PC supercritical should be considered as the reference case.
Table 4-2 Cost of CO2 avoided and captured for FOAK and NOAK plants
PC supercritical
Ultra- supercritical*
Oxy-combustion supercritical
Oxy-combustion
ultra-supercritical
Oxy-combustion
ITM supercritical IGCC NGCC
FOAK
Cost of CO2 avoided ($/tonne CO2) 81 62 57 47 59 67 107
Cost of CO2 captured ($/tonne CO2) 53 55 42 43 47 39 90
NOAK
Cost of CO2 avoided ($/tonne CO2) 78 57 54 44 57 63 103
Cost of CO2 captured ($/tonne CO2) 52 52 41 42 45 38 87
Notes: In the cost of CO2 avoided calculations, for the coal-fired power generation, SC-PC without CCS was used as the reference case and for the NGGC without CCS was used as the reference case for NGCC with CCS. In select previous studies (such as DOE/NETL 2007) , the cost of CO2 avoided has been calculated with the reference plant selected as the similar technology without CCS. For IGCC, under this assumption, the FOAK and NOAK costs of CO2 avoided are $51/tonne and $50/tonne, respectively.
* With the assumption that ultra-supercritical technology, with the designed steam conditions, is available for CCS, this becomes a low cost option for the reference facility and thus is used for the reference plant in the cost of CO2 avoided calculation.
33
4 rEsults And compArAtivE sEnsitivity AnAlysis

4 reSultS anD comParative SenSitivity analySiS (continuEd)
Figure 4-2 Comparison of LCOE for reference generation, with and without CCS in USGC
LCOE (US$/MWh)
Region: AmericasCountry: United States
0 20 40 60 80 100 120 140
StorageTransportationGeneration capitalGeneration O&MFuel
NGCC
IGCC
Oxy-combustion ITM supercritical
Oxy-combustion ultra-supercritical
Oxy-combustion supercritical
Ultra-supercritical
Supercritical 2
Supercritical
Figure 4.2 Comparison of LCOE for Reference Generation, With and Without CCS in USGC
Figure 4-2 indicates varied results from the 2009 analysis, with some LCOE values increasing and some decreasing. All of the coal fired technologies show a decrease in fuel costs related to the lower coal cost used in this analysis. There is an increase in the capital contribution to the LCOE for oxy-combustion with CCS which reflects the inclusion of an additional purification process when capturing CO2 as discussed in section 3.3. Figure 4-2 also shows the relatively small contribution that CO2 transport has to the overall cost of CCS. Capture represents the greatest cost to CCS, and the majority of the cost increases have been due to changes in the capture system. The reduction in the length of the pipeline for the reference case has also reduced the contribution of transport cost to the overall cost of CCS to the power generation applications.
34
Economic AssEssmEnt of cArbon cApturE And storAgE tEchnologiEs: 2011 uPDate

Figure 4-3 Comparison of CO2 costs avoided and captured for power generation (FOAK)
US$/tonne CO2 0 20 40 60 80 100 120
Cost of CO2 capturedCost of CO2 avoided
NGCC
IGCC
Oxy-combustion ITM supercritical
Oxy-combustion ultra-supercritical
Oxy-combustion supercritical
Ultra-supercritical
Supercritical 2
PC supercritical
Figure 4.3 Comparison of CO2 Costs Avoided and Captured for Power Generation (FOAK)
First-of-a-kind versus Nth-of-a-kind
As introduced in Foundation Report Two in 2009, it can be expected that costs for CCS will decrease in the future as the implementation of CCS progresses along the experience curve.
There does not appear to be a great benefit with further process maturity for one CCS equipped technology over another, as indicated in Table 4-1 and Table 4-2 above. The potential cost reduction from FOAK to NOAK plants is less than 5 per cent. The reason for this small decrease is that the majority of the capital costs are associated with proven and (by and large) commercially available technologies. Therefore, decreasing the cost of risk with the new technologies does not provide the potential for future cost savings through increasing maturity.
The cost reductions presented here represent decreased risk in the existing technologies and do not consider other improvements such as implementing new technologies for capture or economies of scale savings in transportation and storage.
Introduction of emerging technologies improvements
The introduction of emerging technologies has great potential to reduce the CCS costs (Rubin 2007, EPRI 2008, US DOE 2009). Potential cost saving of emerging experienced gained and the introduction of new technologies is illustrated in Table 4-3.
Table 4-3 Reduction in LCOE after deployment of 100GW capacity
TechnologyAverage
decrease (%) Range (%)
PC Plant 14.4 6.2 to 21.3
Oxy-combustion 9.7 3.9 to 15.4
IGCC 17.6 7.7 to 25.8
NGCC 15.5 3.3 to 22.0
35
4 rEsults And compArAtivE sEnsitivity AnAlysis

4 reSultS anD comParative SenSitivity analySiS (continuEd)
The ultra-supercritical, as applied to the PC-supercritical and Oxy-combustion and the ion transfer membrane (ITM) technology as applied to the oxy-combustion technology illustrate the value of the introduction of emerging technologies to reducing the costs of CCS.
Efficiency improvements
Ultra-supercritical technology provides an efficiency improvement over supercritical combustion. Ultra-supercritical power plants achieve higher efficiencies through increasing steam temperature and pressure from the boiler. For CCS, cost savings with the ultra-supercritical technology are achieved through:
• decreasing the fuel cost per MWh of generation;
• decreasing the volume of flue gas to be treated per MWh of generation; and/or
• decreasing the amount of CO2 to be captured and compressed per MWh of generation.
Comparing the supercritical and ultra-supercritical LCOE for the PCC and oxyfuel-combustion cases in Figure 4-2, the benefits of improving generation efficiency is evident. As summarised in Table 4-4, the LCOE, including capture, transport, and storage, decrease by 6 and 9 per cent in moving from the supercritical to ultra-supercritical technologies for the PCC and oxyfuel combustion technologies, respectively. Combined with the cost decreases achieved through lessons learnt, the cost decreases approach the range of those presented by Rubin et al (2007) and are summarised in Table 4-3.
Table 4-4 Percentage change in cost parameters from supercritical to ultra-supercritical technology�
Percentage change from supercritical to ultra-super critical
Post-combustion capture Oxyfuel-combustion
LCOECost of CO2
captured LCOECost of CO2
captured
Without capture -4% NA NA NA
With capture -9% 3% -6% 4%
Ion transfer membrane for oxyfuel combustion
As discussed in Foundation Report Two, ITM is an emerging air separation technology that promises lower auxiliary loads and capital costs compared to cryogenic air separation. ITM presents a potential opportunity to reduce plant capital costs by 10 per cent due to a combination of reduced ASU equipment costs and decreased plant size, based on current status of development. The LCOE could also be reduced by approximately 10 per cent based on the estimations used in this model should this technology be implemented into oxy-combustion systems. This potential reduction is reported in Table 4-3 and is within the range anticipated by Rubin et al (2007).
Sensitivity study: fuel costs
As illustrated in Figure 4-2, fuel cost is a strong contributor to the LCOE. Fuel cost can vary significantly over time due to market conditions, including demand fluctuation, change in environmental regulations, speculation, natural disasters, and international disputes.
The sensitivities of the LCOE, with and without CCS, on fuel costs are illustrated in Figure 4-4. Typical fuel price ranges are included with the resulting LCOE ranges also calculated. For all
36
Economic AssEssmEnt of cArbon cApturE And storAgE tEchnologiEs: 2011 uPDate

coal-fired technologies, the coal price range leads to a variation in the LCOE on the order of US$10/MWh, while the natural gas price range leads to a US$30/MWh variation in the LCOE.
Figure 4-4 LCOE as a function of fuel costs
Fuel price (US$/GJ)
LCOE (US$/MWh)
0 2 4 6 8 10 12 14
0
50
100
150
200
250
Figure 4.4 LCOE as a Function of Fuel Costs
SC PC w/o CCS
SC PC w CCS
IGCC w/o CCS
IGCC w CCS
NGCC w/o CCS
NGCC w CCS
Oxy-comb w CCS
Coal w CCSLCOE Range
Coal w/o CCSLCOE Range
NGCC w CCSLCOE Range
NGCC w/o CCSLCOE Range
Range ofCoal Prices
ReferenceCoal Price
Range ofNatural Gas Prices
Reference Natural Gas Price
Sensitivity study: Labour costs
Labour costs for the installation and operation of a facility can vary significantly with location. The labour rates used for the base configuration are considered to be the minimum but could increase by 30 per cent within a region due to local labour conditions (that is, union labour rates or competing labour intensive projects), or up to 100 per cent in remote locations requiring labour camps. In some instances, federal government funding programs have as a condition the employment of unionised labour which can affect development costs. The sensitivity of labour to the project costs and economics in this study was the same as applied in 2009. It was investigated through applying a labour cost factor to the labour component, considering both installation and O&M labour, for each CCS component system. This factor ranged from one to two, corresponding to a labour rate increase of 0 to 100 per cent, respectively.
For a supercritical PC with CCS technology, for a fixed fuel cost, the sensitivity of the CO2 capture installed capital costs and LCOE to the labour costs was reduced. The installed capital costs increased by 23 per cent (32 per cent in 2009), while the LCOE increased by 11 per cent (21 per cent in 2009). A similar trend would be observed for the other coal-fired technologies as they tend to be relatively labour-intensive installations.
37
4 rEsults And compArAtivE sEnsitivity AnAlysis

4 reSultS anD comParative SenSitivity analySiS (continuEd)
Sensitivity study: Regional costs
The installed capital costs of the CO2 capture technologies for the power generation applications are shown in Figure 4-5, while the LCOE for these applications with CCS are presented in Figure 4-6. A number of key variations since last year emerge, as listed below.
• An increase in the installed CO2 capture equipment cost and LCOE across all technologies in India. This is due to a 30 per cent increase in equipment being imported into the country as well as India’s typical coal heating value being very low, resulting in a greater capital cost.
• An increase in costs across all technologies in Eastern Europe. The increase in the reference coal price for this region has been the major contributor to this change.
• Australia has also experienced a 20 per cent increase in the technology cost which can be accounted for by the higher coal price utilised this year.
• Significant increases in costs (specifically capital costs) are seen in India and Brazil. This is partially because of a lower labour rate being used in 2009. The revision of the coal type to one with a lower heating value also leads to a higher capital cost. Finally, additional costs associated with importing capital equipment have contributed to the increase in CO2 capture costs India and Brazil.
• Only NGCC costs are displayed for Saudi Arabia, reflecting that there are no coal-fired power generation applications in the region.
38
Economic AssEssmEnt of cArbon cApturE And storAgE tEchnologiEs: 2011 uPDate

Figure 4-5 Installed CO2 capture equipment cost as function of location
Installed capital costs(US$/kW) for technologieswith capture
0 1,000 2,000 3,000 4,000 5,000 6,000 7,000 8,000
Brazil
United States
Canada
South Africa
Saudi Arabia
Eastern Europe (Poland)
Euro region (Germany)
India
Japan
China
Australia
Oxy-combustion supercriticalIGCCNGCC
PC supercritical
Figure 4.5 Installed CO2 Capture Equipment Cost as Function of Location
The update of the fuel costs between the regions have increased the LCOE for several of the regions including Australia, China, India and Brazil. In comparing regions, the impact of the variation in fuel costs related to the fuel source and the contract type should be remembered. In many of these regions, such as the United States, Australia, and Europe, there are different coal sources that need to be considered along with the associated variation in price. Additionally, countries may choose to source their coal from international markets in the case where it may
39
4 rEsults And compArAtivE sEnsitivity AnAlysis

4 reSultS anD comParative SenSitivity analySiS (continuEd)
provide an economic benefit. Therefore, the cross-regional results presented in Figure 4-6 should be considered along with Figure 4-4 which illustrates the dependence of the LCOE on fuel costs.
Figure 4-6 LCOE, including CCS, as a function of location
Installed capital costs(US$/kW) for technologieswith capture
0 50 100 150 200 250
Brazil
United States
Canada
South Africa
Saudi Arabia
Eastern Europe (Poland)
Euro region (Germany)
India
Japan
China
Australia
Oxy-combustion supercriticalIGCCNGCC
PC supercritical
Figure 4.6 LCOE, including CCS, as a Function of Location
40
Economic AssEssmEnt of cArbon cApturE And storAgE tEchnologiEs: 2011 uPDate

Sensitivity study: CO2 credit value breakpoint
The CO2 credit value breakpoint refers to the CO2 credit value, as a $/tonne of CO2 emitted, that drives the economics in favour of a CCS system over that without CCS. Below the breakpoint, it is more economically favourable to operate the system without CCS and for owners to pay for the emissions in the form of a tax or purchased credits. Figure 4-7 illustrates the breakpoints for the major generation and CO2 capture technologies considered. While the oxyfuel combustion technology becomes favourable at the lowest CO2 credit value, conversely, NGCC does not become favourable until a CO2 credit value of greater than US$100/tonne of CO2 is reached. This is primarily related to the lower CO2 emission intensity of natural gas and relatively high efficiency of NGCC, as elaborated further below.
Figure 4-7 CO2 credit value breakpoint comparison for CO2 capture technologies�
CO2 credit value(US$/tonne CO2)
LCOE (US$/MWh)
0
200
175
150
125
100
75
50
25
0
20 40 60 80 100 120
Figure 4.7 CO2 Credit Value Breakpoint Comparison for CO2 Capture Technologies
SC PC w/o CCS
SC PC w CCS
IGCC w/o CCS
IGCC w CCS
NGCC w/o CCS
NGCC w CCS
Oxyfuel w CCS
OxyfuelBreakpoint
IGCCBreakpoint
SCPCBreakpoint
NGCCBreakpoint
The breakpoint for the CO2 credit value for oxyfuel has decreased from US$60/tonne of CO2 in 2009 to US$55/tonne, which can be attributed to the lower coal costs offsetting the additional purification step included in this study. This analysis continues to indicate that oxyfuel still has the lowest CO2 credit value breakpoint of approximately US$55/tonne of CO2.
The IGCC breakpoint, with respect to supercritical PC technology has decreased from US$80/tonne in 2009 to US$70/tonne of CO2. This reflects the increase since 2009 in the LCOE and cost of CO2 avoided and captured for IGCC with CCS.
The cost breakpoint for the supercritical technologies is approximately US$80/tonne of CO2, an 11 per cent decrease from the 2009 breakpoint of US$90/tonne of CO2.
41
4 rEsults And compArAtivE sEnsitivity AnAlysis

4 reSultS anD comParative SenSitivity analySiS (continuEd)
The high breakpoint for NGCC technology has remained relatively unchanged at US$112/tonne of CO2, reflective of the lower CO2 emission intensity of natural gas and higher cycle efficiency compared to coal-fired technologies.
Care needs to be used in assessing technologies with this breakpoint approach. While the breakpoint of a technology may be the lowest, indicating a smaller cost increase to incorporate CO2 capture, the initial cost of the technology may be high, thus still leading to a greater LCOE.
4�1�2 Industrial applicationsThe FOAK and NOAK cost parameters based on the methodology and assumptions described in section 3.6 for the industrial processes are listed in Table 4-5.
Table 4-5 Incremental cost of CCS for industrial processes
Blast furnace CementNatural gas processing
Fertiliser production
FOAK
Incremental levelised product costs US$82/tonne steel US$34/tonne cementUS$0.056/GJ natural gas
US$11/tonne ammonia
Cost of CO2 avoided/captured US$54/tonne CO2 US$54/tonne CO2 US$19/tonne CO2 US$20/tonne CO2
NOAK
Incremental levelised product costs US$74/tonne steel US$31/tonne cementUS$0.056/GJ natural gas
US$11/tonne ammonia
Cost of CO2 avoided/captured US$49/tonne CO2 US$49/tonne CO2 US$19/tonne CO2 US$20/tonne CO2
For the industrial processes, the incremental levelised product costs and the cost of CO2 avoided/captured have increased by a small amount consistently across all applications. For PCC of CO2 from blast furnace steel and cement production are in the order of US$50/tonne of CO2. These costs are inclusive of the capture and compression of the CO2 at the capture facility and the subsequent transportation and storage costs. A reduction of approximately 10 per cent is achieved through the removal of process contingency applied to the capture technology in moving from FOAK to NOAK systems.
The cost of CO2 avoided/captured is lower than those of PCC for industrial processes that currently include a CO2 separation/capture process, such as in natural gas processing and fertiliser production. The costs of CO2 avoided/captured are US$19/tonne of CO2 and US$20/tonne of CO2 respectively for these facilities. As discussed in 2009, the additional auxiliary load required is for the compression components only, compared to the capture and compression of the PCC case. This is also a reason for the lower CCS costs for these facilities.
Table 4-6 shows the current commodity prices and the resulting increase in commodity prices, derived from the incremental levelised cost of production. The percentage increase is strongly linked to the commodity price with lower cost commodity prices being impacted to a greater extent. For example, the commodity cost for steel has increased from US$350-500/tonne in 2009 to US$570-800/tonne in 2010. As a result, the contribution that CCS has to the overall commodity cost is reduced.
42
Economic AssEssmEnt of cArbon cApturE And storAgE tEchnologiEs: 2011 uPDate
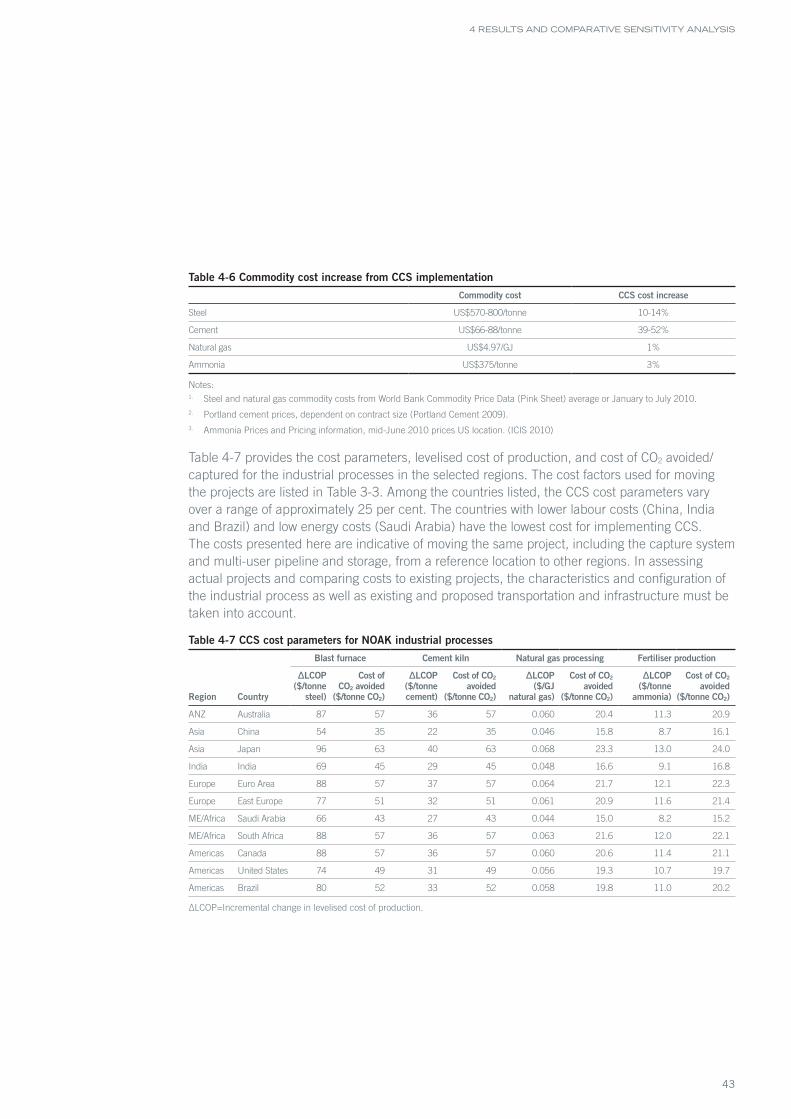
Table 4-6 Commodity cost increase from CCS implementation
Commodity cost CCS cost increase
Steel US$570-800/tonne 10-14%
Cement US$66-88/tonne 39-52%
Natural gas US$4.97/GJ 1%
Ammonia US$375/tonne 3%
Notes:1. Steel and natural gas commodity costs from World Bank Commodity Price Data (Pink Sheet) average or January to July 2010.2. Portland cement prices, dependent on contract size (Portland Cement 2009).3. Ammonia Prices and Pricing information, mid-June 2010 prices US location. (ICIS 2010)
Table 4-7 provides the cost parameters, levelised cost of production, and cost of CO2 avoided/captured for the industrial processes in the selected regions. The cost factors used for moving the projects are listed in Table 3-3. Among the countries listed, the CCS cost parameters vary over a range of approximately 25 per cent. The countries with lower labour costs (China, India and Brazil) and low energy costs (Saudi Arabia) have the lowest cost for implementing CCS. The costs presented here are indicative of moving the same project, including the capture system and multi-user pipeline and storage, from a reference location to other regions. In assessing actual projects and comparing costs to existing projects, the characteristics and configuration of the industrial process as well as existing and proposed transportation and infrastructure must be taken into account.
Table 4-7 CCS cost parameters for NOAK industrial processes
Blast furnace Cement kiln Natural gas processing Fertiliser production
Region Country
ΔLCOP ($/tonne
steel)
Cost of CO2 avoided
($/tonne CO2)
ΔLCOP ($/tonne cement)
Cost of CO2 avoided
($/tonne CO2)
ΔLCOP ($/GJ
natural gas)
Cost of CO2 avoided
($/tonne CO2)
ΔLCOP ($/tonne
ammonia)
Cost of CO2 avoided
($/tonne CO2)
ANZ Australia 87 57 36 57 0.060 20.4 11.3 20.9
Asia China 54 35 22 35 0.046 15.8 8.7 16.1
Asia Japan 96 63 40 63 0.068 23.3 13.0 24.0
India India 69 45 29 45 0.048 16.6 9.1 16.8
Europe Euro Area 88 57 37 57 0.064 21.7 12.1 22.3
Europe East Europe 77 51 32 51 0.061 20.9 11.6 21.4
ME/Africa Saudi Arabia 66 43 27 43 0.044 15.0 8.2 15.2
ME/Africa South Africa 88 57 36 57 0.063 21.6 12.0 22.1
Americas Canada 88 57 36 57 0.060 20.6 11.4 21.1
Americas United States 74 49 31 49 0.056 19.3 10.7 19.7
Americas Brazil 80 52 33 52 0.058 19.8 11.0 20.2
ΔLCOP=Incremental change in levelised cost of production.
43
4 rEsults And compArAtivE sEnsitivity AnAlysis

4 reSultS anD comParative SenSitivity analySiS (continuEd)
4�2 CO2 transportation by pipelineAs stated in the 2009 study, the pipeline transportation of CO2 offers potential cost savings through combining the flow of CO2 from multiple sources into a single pipeline for delivery to a single storage site.
Following the methodology used in the 2009 study, in the reference cases the CO2 flow through the pipelines was set to the CO2 generated by a single facility.
Figure 4-8 illustrates the cost savings achieved through increasing the CO2 flow through a pipeline. As illustrated in Figure 4-8, the cost to transport the CO2 will be between US$1-2 per tonne of CO2. Through combining three or more plants, the CO2 flow can be increased to greater than 10Mt per year, leading to a cost of less than US$1 per tonne for CO2 transport. The resulting impact on the LCOE is illustrated in Figure 4-9.
Figure 4-8 Transportation cost saving from increasing pipeline flow for 100km pipeline
Transportation cost(US$/tonne CO2)
Pipeline CO2 Flow (Mtpa of CO2)
2.5
2.0
1.5
1.0
0.5
0
0 5 10 15 20
Single User Pipeline(1 Large Facilities)
Multiuser Pipeline(~4 Large Facilities)
Figure 4.8 Transportation Cost Saving from Increasing Pipeline Flow for 100km Pipeline
44
Economic AssEssmEnt of cArbon cApturE And storAgE tEchnologiEs: 2011 uPDate

Figure 4-9 Transportation contribution to LCOE versus pipeline flow for 100km pipeline
Transportation contributionto LCOE (US$/MWh)
Pipeline CO2 flow (Mtpa of CO2)
2.5
2.0
1.5
1.0
0.5
0
0 5 10 15 20
NGCCIGCCOxy-combustion SupercriticalPC Supercritical
Single User Pipeline(1 Large Facilities) Multiuser Pipeline
(~4 Large Facilities)
Figure 4.9 Transportation Contribution to LCOE versus Pipeline Flow for 100km Pipeline
The costs of CO2 transport were less than those from they 2009 study as a result of the length of the pipeline being reduced from 250km to 100km.
4�3 CO2 storage
Initial Storage Site Finding and Characterisation CostsTo illustrate the impact of this cost on the CO2 storage cost, a sensitivity study was performed by varying the site characterisation costs over the anticipated cost range. The same cost range was used from the 2009 study (US$15 million to US$150 million) with the resulting impact on CO2 storage cost illustrated in Figure 4-10 and the storage cost contribution to LCOE shown in Figure 4-11. The upper value of US$150 million was used as this was considered the economic threshold before proponents would abandon investigations.
45
4 rEsults And compArAtivE sEnsitivity AnAlysis

4 reSultS anD comParative SenSitivity analySiS (continuEd)
Figure 4-10 Dependence of CO2 storage costs on initial site characterisation and identification costs
CO2 Storage cost(US$/tonne CO2)
Initial site characterisation andidentification costs (Million US$)
10
8
6
4
2
0
0 25 50 75 100 125 150 175
Early Identificationof Site
(Minimal Trials)
Several SitesEvaluated(~5 Trials)
Based on CO2 flow from single 550 MW net SC-PC
Figure 4.10 Dependence of CO2 Storage Costs on Initial Site Characterisation and Identification Costs
Figure 4-11 Dependence of storage contribution to LCOE on initial site characterisation and identification costs
Storage contributionto LCOE (US$/MWh)
Initial site characterisation andidentification costs (Million US$)
12
10
8
6
4
2
0
0 25 50 75 100 125 150 175
Figure 4.11 Dependence of Storage Contribution to LCOE on Initial Site Characterisation and Identification Costs
NGCCIGCCOxy-combustion supercriticalPC supercritical
46
Economic AssEssmEnt of cArbon cApturE And storAgE tEchnologiEs: 2011 uPDate

Storage site geological characteristics
The reservoir geological properties govern the rate that the CO2 can be injected. For reservoirs with geologic properties (low reservoir permeability thickness product) that significantly limit the injection rate, additional wells in the same area will be required to take all of the CO2 from the pipeline. However, the number of wells, and hence maximum rate in a given area, is limited not by the performance of a single well but by pressure interference between them, such that there is a diminishing return (incremental injection rate) for additional wells. A sensitivity study for the CO2 storage costs ($/tonne) and the LCOE ($/MWh) around the poor (absolute permeability = 150md and thickness = 5m) and the good (absolute permeability = 400md and thickness = 15m) reservoir properties are shown in Table 4-8.
In the case of the ‘poor reservoir’ case for NGCC, the storage cost contribution to LCOE is lower than for the other power generation applications. This can be attributed to the volumes of CO2 from an NGCC facility being approximately half that of the others. On the other hand for the ‘good reservoir’ case for NGCC, the storage cost contribution to LCOE is comparable to those of the other power generation applications as the number of wells required to inject the greater volumes of CO2 from the other applications is small.
Table 4-8 Storage cost and contribution to LCOE based on reservoir properties
Reservoir properties
Storage cost contribution to LCOE (US$/MWh)
Storage cost US$/tonne CO2PC supercritical
Oxy-combustion supercritical IGCC NGCC
Poor 13 13 13 9 13
Good 6 6 6 6 6
Summary of storage considerations
A number of reservoir characteristics for these conceptual case studies were assumed that allow a rapid preliminary assessment of their potential project economics. However, the reader must understand that these same assumptions remain simplifications for the purposes of these preliminary macroeconomic models. Developing an actual project will require a much deeper assessment that will require a project specific model be built once a suitable storage site has been identified and characterised.
Using these conceptual study assumptions, the overall economics show the discounted cost of storing a tonne of CO2 is similar in both cases at approximately US$10/tonne CO2, which shows that the storage costs under the assumptions used here could be relatively minor contributors to the overall cost of a full CCS project. However, such a statement must be read with caution that the assumption being made is that the exploration and appraisal program that must be undertaken to prove up the sites, works perfectly, and that the exploration wells can be re-used as both injection and monitoring wells. Thus there is no ‘lost’ exploration funds exhausted on sites that prove technically unsuitable for CO2 storage. Likewise, should a move offshore be required, it would dramatically increase the cost of CO2 storage and transportation over that used here.
47
4 rEsults And compArAtivE sEnsitivity AnAlysis

4 reSultS anD comParative SenSitivity analySiS (continuEd)
In reality, some key observations can be made on the cost of storing CO2. This model only considers onshore storage. However, the authors are aware of many projects proposing to store CO2 offshore. Storing CO2 offshore will increase costs significantly, especially in the existing relatively tight market for offshore drilling rigs and platforms.
Water issues are also becoming apparent, not just for CCS projects but for other new hydrocarbon projects such as shale gas and coal seam methane. Thus, it is reasonable to expect that there may be more upfront (and on-going) work needed to ensure regulators are satisfied that there is little or no impact of CCS operations on water resources. This extra monitoring will increase costs.
This analysis has also only considered ‘proven’ geological storage options into saline aquifers or depleted oil and gas reservoirs, and not any potential EOR, enhanced gas recovery (EGR) or enhanced coal-bed methane recovery (ECBM) options that could provide an offsetting economic benefit of carbon capture through beneficial re-use. ECBM still has a number of technical issues needing solved prior to the implementation on large scale CCS project though progress is being made, notably in the US and beneficial re-use needs to be considered on its own merits should it prove a potential early revenue generator for CO2 use. That said, the authors do reiterate that the sheer volumes of CO2 being emitted from even small power stations (500MW +) places a fundamental supply and demand mismatch with many EOR projects that would be at best only able to utilise 1-2Mtpa CO2 and indeed may not have anything like the 30 year lifespan of a power station project. This was discussed in Foundation Report Two in 2009.
As stated previously, CO2 storage costs are site specific and the local geology will drive the costs of CO2 storage. Injection enhancements such as deviated wells and fracturing operations may increase the injection rates, but the trade-off will need to be evaluated in the specific site context. The costs shown here are conservative. Based on currently industry trends, it is unlikely that these will decrease in the near future. Furthermore, many potential market pressures exist that are only likely to increase from this point onwards given the continued demand for oilfield services around the world.
It is important to recognise that should CO2 storage demand increase as much as predicted, then it will place significant pressure on the supply of oilfield services competing against a mature industry (hydrocarbons). As a result, prices and price inflation could rise significantly more than that assumed in this study.
48
Economic AssEssmEnt of cArbon cApturE And storAgE tEchnologiEs: 2011 uPDate

5 concluSionS
The second report as part of the Global CCS Institute’s Strategic Analysis of the Global Status of CCS in 2009 (Foundation Report Two) gave a detailed analysis of the capture, transport and storage costs for power plants and a select range of industrial applications. This has been updated in 2011 to reflect updates to:
• the regional localisation estimates;
• capital cost estimates for power and select industrial CCS applications; and
• the overall economic model.
The revised results of the economic assessment of CCS technologies are summarised in Table 5-1.
The primary purpose in providing these costs is to compare the relative costs of CCS for various technologies. The costs are prepared for specific bases and when comparing to other project costs, variations are to be expected based on changes in design specification, owner’s preferences and appetite for risk and how the project is financed. Great care and study is required to make these comparisons.
Table 5-1 Summary results of the economic assessment of CCS technologies
Power generation Industrial applications
PC supercritical
& ultra super-
critical*1
Oxyfuel combustion standard &
ITM*1 IGCC NGCC
Blast furnace steel production
Cement production
Natural gas processing
Fertiliser production
Levelised cost of production
Dimensions US$/MWh US$/MWh US$/MWh US$/MWhUS$/tonne
steelUS$/tonne
cementUS$/GJ
natural gasUS$/tonne ammonia
Without CCS*2 73-76 73-76*3 91 88 570-800 66-88 4.97 375
With CCS FOAK*3 120-131 114-123 125 123 82 34 0.056 11
With CCS NOAK*4
117-129 112-121 123 121 74 31 0.056 11
% Increase over without
CCS*5
61-76% 53-65% 37% 40% 10-14% 39-52% 1% 3%
Cost of CO2 avoided*6 ($/tonne CO2)
FOAK 62-81 47-59 67 107 54 54 19 20
NOAK 57-78 44-57 63 103 49 49 19 20
Cost of CO2 captured ($/tonne CO2)
FOAK 53-55 42-47 39 90 54 54 19 20
NOAK 52 41-45 38 87 49 49 19 20
Notes:1. The ultra-supercritical and ITM technologies are currently under development and are not commercially available. These technologies
represent options with the potential for increasing the process efficiency and reduce costs.2. Without CCS cost of production for industrial process are typical market prices for the commodities.3. Oxyfuel combustion systems are not typically configured to operate in an air fired mode. Therefore, oxyfuel combustion without CCS is
not an option. The values here are the PC without CCS value to be used as a reference for calculating the cost of CO2 avoided.4. For industrial processes, levelised cost of production presented as cost increment above current costs.5. Expressed with respect to current commodity prices industry industrial processes.
Key findings based on the updated economic modelling are presented in the following sections.
49
5 conclusions

5 concluSionS (continuEd)
5�1 General observationsCO2 capture still represents the greatest contribution to the cost of CCS, with the majority of the cost increases being due to changes in the capture system. The percentage increases in costs that the application of CCS has over non-CCS facilities have remained relatively unchanged since 2009.
Though minor changes in the costs of CCS across power generation and industrial applications have occurred, the costs of CCS still remain high. This is expected, given that it has only been 12 months since the initial Foundation Report Two, and major developments that have the potential to dramatically reduce the cost of CCS have not yet occurred or have been sufficiently tested for commercialisation.
Despite the costs of CCS being high relative to traditional power generation and industrial facilities, it is important to consider that these traditional methods currently emit large amounts of CO2 into the atmosphere. Given the current and anticipated restrictions on facility emissions, these facilities will not be allowed to continue to operate as they have in the past.
The high costs of CCS as identified in this study should be considered with other low emission technologies to allow consideration of approaches to low emission power and industrial production. Further, if CCS is compared against the anticipated cost that may be imposed on facilities for emitting CO2 it is likely to appear more competitive in a low carbon market.
5�2 Application of CCS to power generationFor the application of CCS in power generation in the United States, a decrease in fuel costs was seen across all of the coal fired technologies, related to the lower coal costs that emerged in 2010. The reduction in the length of the pipeline relative to the 2009 study reduced the contribution of transport cost to the overall cost of CCS to the power generation applications.
5�2�1 Levelised cost of electricityFor the reference cases, taking into account currently available technologies, the lowest LCOE was for oxyfuel combustion at US$114/MWh, in contrast to 2009 where LCOE for NGCC technologies was the lowest at US$112/MWh. Consistent with the findings in 2009, the LCOE for PC supercritical and IGCC technologies were the greatest at US$131/MWh and US$125/MWh respectively.
An update to the oxyfuel combustion process with CCS was the inclusion of an additional purification process when capturing the CO2. This resulted in an increase in the capital contribution of oxyfuel combustion with CCS to the LCOE. The effects of the ranges in the coal and natural gas prices were variations in the LCOE of US$10/MWh and US$30/MWh respectively. This reflects the potential greater volatility of natural gas prices.
For a supercritical PC with CCS technology, for a fixed fuel cost, the sensitivity of the CO2 capture installed capital costs and LCOE to the labour costs was reduced. The installed capital costs increased by 23 per cent (32 per cent in 2009), while the LCOE increased by 11 per cent (21 per cent in 2009). A similar trend would be observed for the other coal-fired technologies as they tend to be relatively labour-intensive installations.
50
Economic AssEssmEnt of cArbon cApturE And storAgE tEchnologiEs: 2011 uPDate

5�2�2 Cost of CO2 avoidedFor both FOAK and NOAK plants, the cost of CO2 avoided for the application of CCS across all power generation technologies decreased since 2009. There are various factors that resulted in this, including that most of the coal prices are lower than those modelled in the 2009 study, and that the CO2 transport distance for the reference case was reduced from 250km to 100km, reducing the transport costs and its contribution to the overall cost of CCS;
5�2�3 Regional observationsIn India, the installed CO2 capture equipment cost and LCOE increased across all technologies. This was due to the revised consideration of a 30 per cent increase in equipment being imported into the country as well as India’s typical coal heating value being very low, resulting in a greater capital cost.
The increase in costs for the coal fired technologies in Eastern Europe was primarily due to an increase in labor conversion factor from the reference location and switching to a low rank coal. Similarly, the capital cost in the euroregion increased related to a change to a low rank coal.
A higher coal price was utilised for Australia in this study, which resulted in a 20 per cent increase in the country’s technology cost.
The costs in Brazil increased significantly, partially because of a lower labour rate being used in 2009. The revision of the coal type to one with a lower heating value also led to a higher capital cost. Further, additional costs associated with importing capital equipment contributed to the increase in CO2 capture costs in Brazil.
Only NGCC costs were presented for Saudi Arabia, reflecting that there are no coal-fired power generation applications in the region.
5�2�4 CO2 credit value breakpointThe CO2 credit value, on a $/tonne of CO2 emitted basis that drives the economics of CCS in favour of a CCS system over that without CCS is known as the CO2 value breakpoint. Once the breakpoint is exceeded, it becomes more economically favourable to operate the system with CCS.
The CO2 credit value breakpoint for oxyfuel decreased from US$60/tonne of CO2 in 2009 to US$55/tonne, which can be attributed to the lower coal costs offsetting the additional purification step included in this study. This analysis continues to indicate that oxyfuel still has the lowest CO2 credit value breakpoint of approximately US$55/tonne of CO2.
For IGCC, the CO2 breakpoint with respect to supercritical PC technology PC technology has decreased from $80/tonne in 2009 to $70/tonne of CO2. This reflects the increase since 2009 in the LCOE and cost of CO2 avoided and captured for IGCC with CCS.
The cost breakpoint for the supercritical technologies is approximately $80/tonne of CO2, an 11 per cent decrease from the 2009 breakpoint of $90/tonne of CO2.
Finally, the high breakpoint for NGCC technology has remained relatively unchanged at $112/tonne of CO2, reflective of the lower CO2 emission intensity of natural gas and higher cycle efficiency compared to coal-fired technologies.
51
5 conclusions

5 concluSionS (continuEd)
5�3 Application of CCS to select industrial applicationsFor the application of CCS on select industrial processes, the incremental levelised product costs and the cost of CO2 avoided/captured have increased by a small amount consistently across all applications. A reduction of approximately 10 per cent is achieved through the removal of process contingency applied to the capture technology in moving from FOAK to NOAK systems.
Consistent with the findings from Foundation Report Two in 2009, the cost of CO2 avoided/captured is lower for those industrial processes that currently include a CO2 separation/capture process, compared to PCC from other industrial processes. Natural gas processing and fertiliser production, for example, already separate the CO2 so additional expenditure is required for the compression, transport and storage of the CO2 only.
The increases in the commodity costs due to CCS implementation also reflect the level of additional investment required to apply CCS to select industrial facilities. For example, for natural gas and fertiliser (ammonia) production, the commodity cost increases due to CCS are 1 and 3 per cent respectively. On the other hand, the commodity cost increases due to the application of CCS for steel and cement are 10-14 per cent and 39-52 per cent respectively.
5�4 CO2 transportThe reduction in the length of the pipeline for the reference case has reduced the overall transport costs and the contribution of transport cost to the overall cost of CCS. The cost to transport CO2 is estimated to be between US$1-2 per tonne of CO2, a decrease from US$3-4 per tonne of CO2 in 2009. This is due to the reduction of the pipeline length in the reference case from 250km in 2009 to 100km.
An opportunity to reduce the costs of CO2 transport is in increasing the CO2 flow through the pipeline, by combining the captured CO2 from multiple sources through a larger pipeline to a common storage site. The implementation of a common user pipeline can result in a cost of less than US$1 per tonne for CO2 transport.
5�5 CO2 storageThe contribution of storage cost to the LCOE was found to range from US$6-13 per tonne of CO2 depending on whether the ‘good’ or ‘poorer’ reservoir option was considered.
For the case of the ‘poor reservoir’ storage option being applied for NGCC, the storage cost contribution to LCOE us lower than for the other power generation applications. This can be attributed to the volumes of CO2 from an NGCC facility being approximately half of that of the others. This has a lesser impact for the ‘good reservoir’ case as the number of wells required to inject greater volumes of CO2 under this case do not vary significantly.
52
Economic AssEssmEnt of cArbon cApturE And storAgE tEchnologiEs: 2011 uPDate

6 referenceS
ACIL Tasman 2009, Fuel resources, new entry and generation costs in the NEM, viewed August 2009, <http://www.aciltasman.com.au/images/pdf/419_0035.pdf>.
Chikkatur, A. P 2008, A Resource and Technology Assessment of Coal Utilization in India, Pew Center on Climate Change, viewed 13 October 2010, <http://www.pewclimate.org/docUploads/india-coal-technology.pdf>.
DOE/NETL 2006, Oxyfuel Combustion Systems Analysis Study, August 2006.
DOE/NETL 2007, Cost and Performance Baseline for Fossil Energy Plants, Volume 1: Bituminous Coal and Natural Gas to Electricity, Rev. 1, DOE/NETL-2007/1281, August 2007.
DOE/NETL 2008 Cost and Performance Baseline for Fossil Energy Plants, Volume 1: Bituminous Coal and Natural Gas to Electricity, Rev. 2, DOE/NETL-2007/1291, August 2008.
DOE/NETL 2008b Storing CO2 with Enhanced Oil Recovery, DOE/NETL-402/1312/02-07-08. February 7.
DOE/NETL 2008c Pulverized Coal Oxycombustion Power Plants, Volume 1: Bituminous Coal to Electricity, Final Report, DOE/NETL 2007/1291, Revision 2, August.
DOE/NETL 2001, Engineering Feasibility and Economics of CO2 Capture in an Existing Coal-Fired Power Plant
Electric Power Research Institute (EPRI) 1987-1989, TAG™ – Technical Assessment Guide, Vol. 1, Electricity Supply – 1989; Vol. 2, Electricity End-Use – Part 1, 1987, Parts 2 & 3, 1988; Vol. 3, Fundamentals and Methods, Supply – 1987; Vol. 4, Fundamentals and End-Use” – 1987, EPRI P-4463-SR, Palo Alto, CA.
Electric Power Research Institute (EPRI) 1999, Enhanced Oil Recovery Scoping Study, EPRI, Palo Alto, CA. TR-113836.
Electric Power Research Institute (EPRI) 1994, Technical Assessment Guide, Palo Alto, CA.
Electric Power Research Institute (EPRI) 2008, CoalFleet Guideline for Advanced Pulverized Coal Power Plants, Version 3, EPRI, Palo Alto, CA: March.
Electric Power Research Institute (EPRI) 2007, CoalFleet RD&D Augmentation Plan for Integrated Gasification Combined Cycle (IGCC) Power Plants, Report no. 1013219, EPRI, Palo Alto, CA: January.
Energy Information Administration (EIA) 2009, Steam Coal Prices for Electricity Generation, viewed August 2009, <http://www.eia.doe.gov/emeu/international/stmforelec.html>.
Energy Information Administration (EIA) 2008, Natural Gas Prices for Electricity Generation, viewed August 2009, <http://www.eia.doe.gov/emeu/international/ngasprie.html>.
Energy Information Administration (EIA) 2009b, Coal News and Markets, viewed August 2009, <http://tonto.eia.doe.gov/FTPROOT/coal/newsmarket/coalmar090424.html>.
Energy Information Administration (EIA) 2009c, Natural Gas Prices, viewed August 2009, <http://tonto.eia.doe.gov/dnav/ng/ng_pri_sum_dcu_nus_m.htm>.
Energy Information Administration (EIA) 2009d, Monthly Fuel Receipts and Fuel Quality Database, viewed August 2009, <http://www.eia.doe.gov/cneaf/electricity/page/eia423.html>.
Energy Information Administration (EIA) 2009e, Form EIA-923, Power Plant Operations Report, US DOE, Washington D.C.
Energy Information Administration (EIA) 2000, Costs and Indices for Domestic Oil and Gas Field Equipment and Production Operations, EIA.
53
6 rEfErEncEs

6 referenceS (continuEd)
Energy Information Administration (EIA) 2008b, ‘Selected Countries, Most Recent Annual Estimates, 1980-2007’, International Net Electricity Generation Tables, viewed August 2009, data posted in 2008, <http://www.eia.doe.gov/emeu/international/electricitygeneration.html>.
Environmental Protection Agency (EPA) 2006, Environmental Footprints and Costs of Coal-Based Integrated Gasification Combined Cycle and Pulverized Coal Technologies, EPA, Washington D.C.
Holt, N & Booras, G 2007, Updated Cost and Performance Estimates for Clean Coal Technologies Including CO2 Capture – 2006, EPRI Report No. 1013355, March 2007.
International Energy Agency 2010, Projected Costs of Generating Electricity, 2010 Edition, OECD, IEA, Paris, France.
Maurstad et al 2005, ‘Impact of Coal Quality and Gasifier Technology on IGCC Performance’, presented at the 8th International Conference on Greenhouse Gas Control Technologies, Trondheim, Norway.
Nygaard R & Lavoie R 2009, Project Cost Estimate – Wabamum Area CO2 Sequestration Project (WASP), Institute for Sustainable Energy, Environment and Economy (ISEEE).
NZEC 2009, Carbon Dioxide Capture from Coal-Fired Power Plants in China, Summary Report for NZEC Work Package 3.
Powers, W.E 2005, ‘Peak and Annual Average Energy Efficiency Penalty of Optimised Air-Cooled Condenser on 515 MW Fossil Fuel-Fired Utility Boiler’, presented at California Energy Commission/Electric Power Research Institute Advanced Cooling Technologies Symposium, Sacramento, California, June 2005.
Powers, W.E 2009, 316(b)Phase II Closed-Cycle Cooling Retrofit Options, Feasibility and Cost, accessed 13 October 2010, <http://web.ead.nl.gov/bajatermoeis/documents/docs/09-30-09_cooling_retrofit_cost.pdf>.
Richardson Products 2010, International Cost Factor Location Manual, 2009-2010 Edition, Cost Data On Line Inc, Nevada.
Rubin, E.S, Chen, C, Rao, A.B 2007, ‘Cost and Performance of Fossil Fuel Power Plants with CO2 Capture and Storage’, Energy Policy, Volume 35, Issue 9, September 2007, pp 4444-4454.
Rubin, E.S., Yeh, S, Antes, M, Berkenpas, M, Davison, J 2007, ‘Use of experience curves to estimate the future cost of power plants with CO2 capture’, International Journal of Greenhouse Gas Control, Vol. 1, pp 188-197.
U.S. Department of Energy 2008a. Pulverized Coal Oxycombustion Power Plants, DOE/NETL-2007/1291, USA.
U.S. Department of Energy 2008b, Enhanced Oil Recovery/CO2 Injection Program Description. U.S. Department of Energy, Office of Fossil Energy, Office of Oil and Natural Gas viewed July 2009, <http://fossil.energy.gov/programs/oilgas/eor/>.
US DOE 2008c, Storing CO2 with Enhanced Oil Recovery, DOE/NETL-402/1312/02-07-08, USA, February 7.
US DOE 2009, High performance materials, U.S. Department of Energy, viewed July 2009, <www.fossil.energy.gov/programs/powersystems/advresearch/advresearch-materials.html>.
WorleyParsons 2002, Confidential Study Report 1
WorleyParsons 2007, Confidential Study Report 2
WorleyParsons 2009a, Cost Estimating Support for the Australian Government’s Energy White Paper
WorleyParsons 2009b, WorleyParsons internal data for US DOE “Low Rank Coal Study”, publication expected in 2010.
54
Economic AssEssmEnt of cArbon cApturE And storAgE tEchnologiEs: 2011 uPDate

aPPenDiceS
Appendix A Breakdown of overnight capital costs of PC supercritical facilityTable A-1 Cost accounts for PC boiler (1,000 x 2010 US$)
Acct No� Item/description
Equipment cost ($)
Material cost ($)
Labour ($)
Bare erected
cost ($)
Eng’g CM H�O�
& Fee ($)
Contingencies TOTAL PLANT COST
Process ($)
Project ($) ($) $/kW
1 COAL & SORBENT HANDLING 22,886 5,991 13,389 42,266 3,821 0 6,913 53,001 97
2 COAL & SORBENT PREP & FEED 15,552 875 3,809 20,237 1,776 0 3,302 25,314 46
3 FEEDWATER & MISC. BOP SYSTEMS 65,385 0 29,372 94,757 8,614 0 17,049 120,420 221
4 PC BOILER
4.1 PC Boiler & accessories 256,449 0 123,313 379,762 34,056 0 41,382 455,200 834
4.2 SCR (w/4.1) 0 0 0 0 0 0 0 0 0
4.3 Open 0 0 0 0 0 0 0 0 0
4.4-4.9 Boiler BoP (w/ID Fans) 0 0 0 0 0 0 0 0 0
SUBTOTAL 4 256,449 0 123,313 379,762 34,056 0 41,382 455,200 834
5 FLUE GAS CLEANUP 121,634 0 40,039 161,673 15,293 0 17,697 194,663 357
5B CO2 REMOVAL & COMPRESSION 274,753 0 79,993 354,746 33,486 62,597 90,166 540,995 991
6 COMBUSTION TURBINE/ACCESSORIES
6.1 Combustion turbine generator N/A 0 N/A 0 0 0 0 0 0
6.2-6.9 Combustion turbine other 0 0 0 0 0 0 0 0 0
SUBTOTAL 6 0 0 0 0 0 0 0 0 0
7 HRSG, DUCTING & STACK
7.1 Heat recovery steam generator N/A 0 N/A 0 0 0 0 0 0
7.2-7.9 Ductwork and stack 21,230 1,125 13,995 36,351 3,343 0 5,206 44,901 82
SUBTOTAL 7 21,230 1,125 13,995 36,351 3,343 0 5,206 44,901 82
8 STEAM TURBINE GENERATOR
8.1 Steam TG & accessories 75,946 0 8,237 84,183 6,871 0 9,105 100,159 183
8.2-8.9 Turbine plant auxiliaries and steam piping 32,386 1,317 17,111 50,814 4,385 0 7,906 63,105 116
SUBTOTAL 8 108,332 1,317 25,348 134,997 11,256 0 17,012 163,264 299
9 COOLING WATER SYSTEM 25,717 13,332 22,767 61,816 5,768 0 9,143 76,726 141
10 ASH/SPENT SORBENT HANDLING SYS 6,215 186 7,849 14,250 1,364 0 1,606 17,219 32
11 ACCESSORY ELECTRIC PLANT 24,495 12,167 33,539 70,201 6,277 0 9,702 86,180 158
12 INSTRUMENTATION & CONTROL 11,209 0 11,065 22,274 2,032 1,114 3,117 28,537 52
13 IMPROVEMENTS TO SITE 3,751 2,169 7,354 13,274 1,318 0 2,918 17,510 32
14 BUILDINGS & STRUCTURES 0 27,793 26,036 53,830 4,932 0 8,814 67,576 124
TOTAL COST 957,610 64,954 437,869 1,460,433 133,336 63,711 234,026 1,891,506 3,464
55
AppEndicEs

aPPenDiceS (continuEd)
Table A-2 Cost accounts for IGCC (1,000 x 2010 US$)
Acct No� Item/description
Equipment cost ($)
Material cost ($)
Labour ($)
Bare erected
cost ($)
Eng’g CM H�O�
& fee ($)
Contingencies TOTAL PLANT COST
Process ($)
Project ($) ($) $/kW
1 COAL & SORBENT HANDLING 15,665 2,827 11,864 30,356 2,778 0 6,627 39,761 77
2 COAL & SORBENT PREP & FEED 124,146 9,723 20,168 154,037 13,362 0 33,480 200,879 388
3 FEEDWATER & MISC. BOP SYSTEMS 10,562 8,463 9,974 28,999 2,712 0 7,275 38,987 75
4 GASIFIER & ACCESSORIES
4.1 Gasifier, syngas cooler & auxiliaries 207,320 0 50,519 257,839 15,431 36,360 47,288 356,918 690
4.2 Syngas cooling (w/4.1) w/4.1 0 w/4.1 0 0 0 0 0 0
4.3 ASU/oxidant compression 170,291 0 w/equip. 170,291 16,174 0 18,646 205,111 397
4.4-4.9 Other gasification equipment 30,560 11,134 17,201 58,895 5,646 0 13,703 78,244 151
SUBTOTAL 4 408,171 11,134 67,720 487,024 37,251 36,360 79,638 640,273 1,238
5A GAS CLEANUP & PIPING 96,734 5,219 79,386 181,339 17,454 26,141 45,223 270,157 522
5B CO2 REMOVAL & COMPRESSION 20,640 0 11,692 32,332 3,091 0 7,085 42,508 82
6 COMBUSTION TURBINE/ACCESSORIES
6.1 Combustion turbine generator 105,200 0 6,098 111,298 10,336 11,130 13,276 146,039 282
6.2-6.9 Combustion turbine other 0 784 873 1,657 158 0 545 2,360 5
SUBTOTAL 6 105,200 784 6,971 112,955 10,494 11,130 13,821 148,400 287
7 HRSG, DUCTING & STACK
7.1 Heat recovery steam generator 42,269 0 5,244 47,513 4,085 0 5,160 56,758 110
7.2-7.9 Ductwork and stack 3,851 2,653 3,482 9,987 928 0 1,768 12,682 25
SUBTOTAL 7 46,120 2,653 8,726 57,500 5,013 0 6,928 69,440 134
8 STEAM TURBINE GENERATOR
8.1 Steam TG & accessories 50,392 0 4,702 55,094 3,237 0 5,833 64,164 124
8.2-8.9 Turbine plant auxiliaries and steam piping 10,684 950 6,973 18,607 1,689 0 3,927 24,224 47
SUBTOTAL 8 61,076 950 11,675 73,701 4,926 0 9,760 88,388 171
9 COOLING WATER SYSTEM 8,308 9,297 7,366 24,970 2,284 0 5,594 32,849 64
10 ASH/SPENT SORBENT HANDLING SYS 21,365 1,642 10,157 33,164 3,151 0 3,968 40,282 78
11 ACCESSORY ELECTRIC PLANT 27,704 9,505 25,910 63,120 5,847 0 13,090 82,057 159
12 INSTRUMENTATION & CONTROL 12,592 2,244 7,837 22,673 2,055 1,134 4,291 30,153 58
13 IMPROVEMENTS TO SITE 3,804 2,255 9,130 15,190 1,512 0 5,010 21,712 42
14 BUILDINGS & STRUCTURES 0 7,130 8,041 15,171 1,403 0 2,721 19,294 37
TOTAL COST 962,087 73,827 296,617 1,332,531 113,334 74,764 244,510 1,765,138 3,413
56
Economic AssEssmEnt of cArbon cApturE And storAgE tEchnologiEs: 2011 uPDate
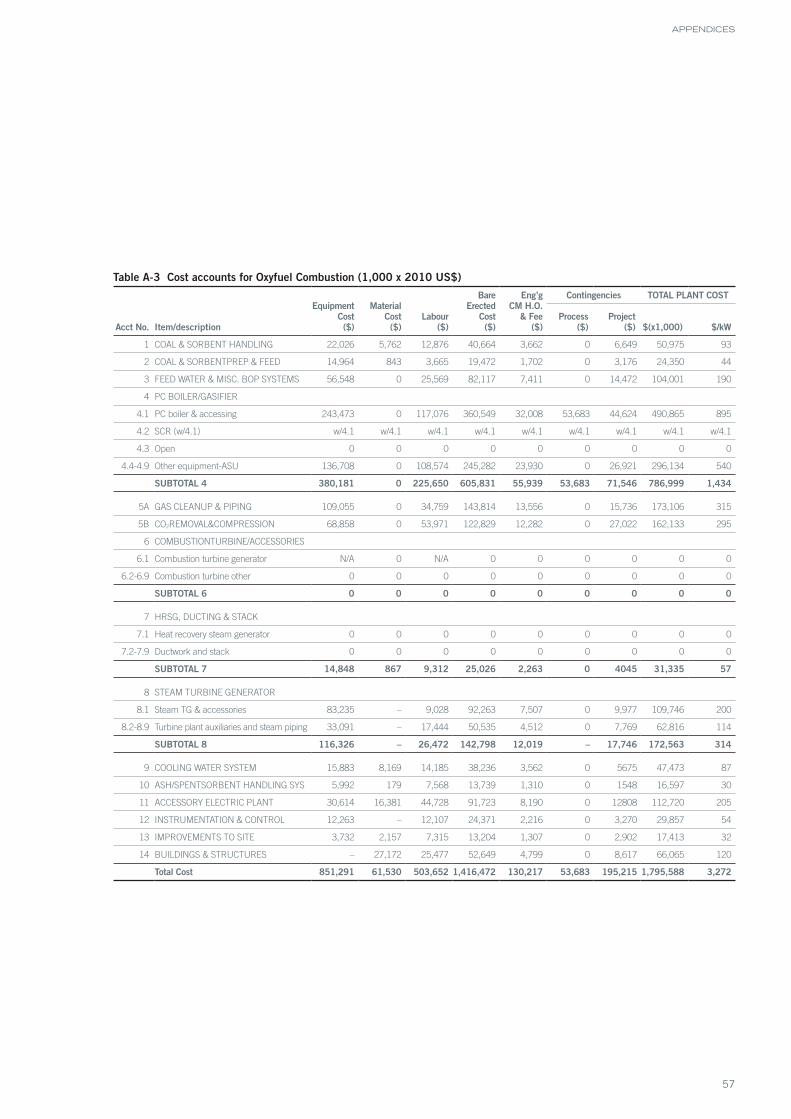
Table A-3 Cost accounts for Oxyfuel Combustion (1,000 x 2010 US$)
Acct No� Item/description
Equipment Cost ($)
Material Cost ($)
Labour ($)
Bare Erected
Cost ($)
Eng’g CM H�O�
& Fee ($)
Contingencies TOTAL PLANT COST
Process ($)
Project ($) $(x1,000) $/kW
1 COAL & SORBENT HANDLING 22,026 5,762 12,876 40,664 3,662 0 6,649 50,975 93
2 COAL & SORBENTPREP & FEED 14,964 843 3,665 19,472 1,702 0 3,176 24,350 44
3 FEED WATER & MISC. BOP SYSTEMS 56,548 0 25,569 82,117 7,411 0 14,472 104,001 190
4 PC BOILER/GASIFIER
4.1 PC boiler & accessing 243,473 0 117,076 360,549 32,008 53,683 44,624 490,865 895
4.2 SCR (w/4.1) w/4.1 w/4.1 w/4.1 w/4.1 w/4.1 w/4.1 w/4.1 w/4.1 w/4.1
4.3 Open 0 0 0 0 0 0 0 0 0
4.4-4.9 Other equipment-ASU 136,708 0 108,574 245,282 23,930 0 26,921 296,134 540
SUBTOTAL 4 380,181 0 225,650 605,831 55,939 53,683 71,546 786,999 1,434
5A GAS CLEANUP & PIPING 109,055 0 34,759 143,814 13,556 0 15,736 173,106 315
5B CO2REMOVAL&COMPRESSION 68,858 0 53,971 122,829 12,282 0 27,022 162,133 295
6 COMBUSTIONTURBINE/ACCESSORIES
6.1 Combustion turbine generator N/A 0 N/A 0 0 0 0 0 0
6.2-6.9 Combustion turbine other 0 0 0 0 0 0 0 0 0
SUBTOTAL 6 0 0 0 0 0 0 0 0 0
7 HRSG, DUCTING & STACK
7.1 Heat recovery steam generator 0 0 0 0 0 0 0 0 0
7.2-7.9 Ductwork and stack 0 0 0 0 0 0 0 0 0
SUBTOTAL 7 14,848 867 9,312 25,026 2,263 0 4045 31,335 57
8 STEAM TURBINE GENERATOR
8.1 Steam TG & accessories 83,235 – 9,028 92,263 7,507 0 9,977 109,746 200
8.2-8.9 Turbine plant auxiliaries and steam piping 33,091 – 17,444 50,535 4,512 0 7,769 62,816 114
SUBTOTAL 8 116,326 – 26,472 142,798 12,019 – 17,746 172,563 314
9 COOLING WATER SYSTEM 15,883 8,169 14,185 38,236 3,562 0 5675 47,473 87
10 ASH/SPENTSORBENT HANDLING SYS 5,992 179 7,568 13,739 1,310 0 1548 16,597 30
11 ACCESSORY ELECTRIC PLANT 30,614 16,381 44,728 91,723 8,190 0 12808 112,720 205
12 INSTRUMENTATION & CONTROL 12,263 – 12,107 24,371 2,216 0 3,270 29,857 54
13 IMPROVEMENTS TO SITE 3,732 2,157 7,315 13,204 1,307 0 2,902 17,413 32
14 BUILDINGS & STRUCTURES – 27,172 25,477 52,649 4,799 0 8,617 66,065 120
Total Cost 851,291 61,530 503,652 1,416,472 130,217 53,683 195,215 1,795,588 3,272
57
AppEndicEs

GLOBAL CCS INSTITUTE P +61 (0)2 6175 5300 E [email protected]
LEVEL 2, 64 ALLARA ST, CANBERRA ACT 2601 GPO BOX 828, CANBERRA ACT 2601 AUSTRALIA
WW
W.g
lo
ba
lc
cS
inS
tit
ut
e.c
om