economic and sustainability impact assessment
TRANSCRIPT

ECONOMIC AND SUSTAINABILITY IMPACT ASSESSMENT
Department of Enterprise, Trade and Employment (Ireland)
June 2021
for Ireland of the EU-Mercosur Trade Agreement
FINAL REPORT

1
Authors
Bodil Emilie Hovmand
Martin Hvidt Thelle
Eva Rytter Sunesen
Disclaimer
All scenarios and analyses contained in this
report assume “No policy change” – i.e.
before any mitigating actions are taken by
the Irish Government.

2
Acknowledgement
This study provides an assessment of the economic, social, human rights, and environmental impacts of
the trade component of the Association Agreement between the EU and the Mercosur countries –
Argentina, Brazil, Paraguay, and Uruguay. The report was prepared for the Irish Government and focuses
on impacts brought about by changes in Irish trade due to the EU-Mercosur Agreement.
The report has benefitted from valuable inputs from the broad group of stakeholders listed in Appendix A
representing agriculture, business and industry, NGOs, government departments and enterprise and
environmental agencies. The report has also benefited from the comments and insights by the steering
group chaired by the Department of Enterprise, Trade and Employment, and consisting of representatives
from the Department of Agriculture, Food, and the Marine and Teagasc.
Implement Economics would also like to acknowledge the contribution of Professor Alan Matthews and
Professor Joseph Francois to this report.

3
4
Table of Contents Executive Summary ...................................................................................................................................... 6
Acronyms & Definitions ............................................................................................................................... 12
1. Content and Context of the EU-Mercosur Agreement ......................................................................... 14
1.1 The Context of the EU-Mercosur Agreement .............................................................................. 14
1.2 Economic and Political Importance of the Agreement ................................................................. 15
1.3 Policy Scenarios and Methodologies Applied in the Study .......................................................... 16
1.4 Concluding Remarks ................................................................................................................... 18
2. Current Ireland-Mercosur Relations .................................................................................................... 19
2.1 Trends in Ireland-Mercosur Trade ............................................................................................... 19
2.2 Ireland’s Balance of Trade with Mercosur ................................................................................... 20
2.3 Profile of Ireland-Mercosur Goods Trade .................................................................................... 22
2.4 Profile of Ireland-Mercosur Services Trade ................................................................................. 26
2.5 Current Ireland-Mercosur Investments ........................................................................................ 29
2.6 Concluding Remarks ................................................................................................................... 30
3. Macroeconomic Impacts of the Agreement for Ireland ........................................................................ 31
3.1 Overview of the CGE model Applied in the Economic Modelling ................................................ 31
3.2 Long Term Trade and GDP Impacts for Ireland .......................................................................... 32
3.3 Impacts on Trade and Production across Sectors in Ireland ....................................................... 34
3.4 Impacts on Irish Workers and Consumers .................................................................................. 37
3.5 Concluding Remarks ................................................................................................................... 40
4. Impacts on Trade Across Sectors in Ireland ....................................................................................... 41
4.1 Opportunities in the Mercosur Market for Irish Goods Exporters ................................................. 41
4.2 Opportunities in the Mercosur Market for Irish Services Providers .............................................. 45
4.3 Benefits for Irish Consumers and Producers ............................................................................... 48
4.4 Challenges Posed by the EU-Mercosur Agreement .................................................................... 49
4.5 Concluding Remarks ................................................................................................................... 53
5. Environmental Impacts in Ireland ........................................................................................................ 55
5.1 Modelling of Trade-induced Environmental Impacts ................................................................... 55
5.2 Impacts on GHG Emissions in Ireland......................................................................................... 55
5.3 Impacts on Air Pollution in Ireland ............................................................................................... 57
5.4 Impacts on Land Use in Ireland ................................................................................................... 58
5.5 Concluding Remarks ................................................................................................................... 58
6. Broader Sustainability Impacts of the Agreement ............................................................................... 60
6.1 The Chapter on Trade and Sustainable Development ................................................................ 60

5
6.2 The Potential for Engagement in the EU-Mercosur Agreement .................................................. 61
6.3 Sustainability Impacts in the Mercosur countries ........................................................................ 63
6.4 Sustainability Impacts Related to the EU Beef Offer ................................................................... 71
6.5 Concluding Remarks ................................................................................................................... 75
7. Horizontal Issues ................................................................................................................................. 76
7.1 Potentials for Attracting Mercosur Investments ........................................................................... 76
7.2 Support for Irish SMEs ................................................................................................................ 77
7.3 Market Access through Public Procurements .............................................................................. 78
7.4 Intellectual Property Rights and Geographical Indications .......................................................... 79
7.5 Concluding Remarks ................................................................................................................... 79
8. Policy Implications and Options for Ireland ......................................................................................... 80
8.1 Initiatives to Implement and Enforce the Agreement ................................................................... 80
8.2 Initiatives to Enhance the Utilisation of the Agreement ............................................................... 81
8.3 Actions to Amplify Positive Impacts and Mitigate Negative Impacts ............................................ 82
8.4 Concluding Remarks ................................................................................................................... 83
Appendix A List of Stakeholder Consultations ............................................................................................ 85
Appendix B Technical Description of the CGE Model ................................................................................. 86
The CGE Model Methodology ............................................................................................................. 86
The Baseline Scenario ........................................................................................................................ 91
The Policy Scenario ............................................................................................................................ 91
Appendix C Market Access Impacts for the Beef Sector ............................................................................. 93
Executive Summary ............................................................................................................................ 93
Potential Market Impacts of the Trade Concessions ........................................................................... 94
The EU Beef Market and Existing Import Arrangements ..................................................................... 98
Mercosur Beef Imports to the EU: Trends and Quota Utilisation ....................................................... 104
Composition of Mercosur Fresh and Frozen Beef Imports ................................................................ 110
Mercosur Usage of Existing TRQs .................................................................................................... 114
Market Impacts of Additional Mercosur TRQ .................................................................................... 115
Expanded TRQ Access under the EU-Mercosur Agreement ............................................................ 118
Overview of Previous Results ........................................................................................................... 119
Taking Account of Quality ................................................................................................................. 121
Concluding Remarks ......................................................................................................................... 127
Appendix D Comparative Analysis of the Impacts of Methods of Production in the Beef Sector .............. 130
Comparative Analysis of GHG Emissions in Ireland and Mercosur .................................................. 130
Other Mechanisms to Improve the Sustainability of Trade ................................................................ 136
References ................................................................................................................................................ 139

6
Executive Summary
The Department of Enterprise, Trade and
Employment (DETE) has requested an
assessment of the economic, social, human
rights, and environmental impacts of the trade
component of the Association Agreement
between the EU and the Mercosur countries –
Argentina, Brazil, Paraguay, and Uruguay. The
report focuses on impacts in Ireland and in
Mercosur induced by changes in Irish trade.
The study combines economic modelling of
economic and sustainability impacts with
detailed stakeholder consultations to put the
Agreement into an Irish context. The results from
the economic modelling represent a ‘No policy
change’ scenario that does not account for
mitigating or incentivising policy interventions by
Ireland, the EU and Mercosur which may impact
on outcomes.
This study provides an independent economic
and sustainability impact assessment that can
assist the Irish Government to formulate its
position on the Agreement. Therefore, the study
also lays the basis for designing policy initiatives
that the Irish Government can implement to
amplify some of the positive impacts of the
Agreement assuming the Agreement is ratified.
First-Mover Advantage in a Challenging
Market for Ireland
The EU-Mercosur Agreement has been under
negotiation for almost 20 years. It is part of a
network of trade deals that the European
Commission has negotiated to improve market
access for EU firms and enable them to diversify
their exports and global value chains.
The Mercosur countries are relatively closed
economies with low levels of trade openness.
They accounted only for around 1.5% of global
imports and exports in 2018, while for 2.9% of
global GDP. For comparison, Ireland accounts
for a similar share of global trade but only a
minor share of global GDP (less than 0.005%).
The countries also have little tradition for
investing abroad and account only for 0.8% of
the global stock of foreign direct investments
(FDI).
Considering that the Mercosur countries when
combined is the 5th largest economy in the world
(measured by their share of global GDP),
Mercosur’s global trade and investment relations
are extremely underdeveloped. Also, positive
growth prospects in Mercosur are likely to
amplify their economic importance going
forward. The policy context and long term,
economic and strategic perspectives of the
Agreement should, therefore, not be
underestimated.
If the EU-Mercosur Agreement is ratified, the EU
will be the first major trading partner to conclude
a trade agreement with the Mercosur bloc.
Failure to ratify the Agreement risks damaging
the credibility of the EU in future trade
negotiations.
The enhanced market access provided by the
Agreement is expected to give EU firms, through
reducing tariffs and non-tariff barriers to trade in
goods and services relative to other countries, a
first-mover advantage and competitive edge in a
market of more than 260 million consumers.
However, Mercosur remains a challenging
market that is difficult to enter:
• Challenging business climate. The
regulatory environment and relatively low
English proficiency make it difficult to trade
with and start a firm in Mercosur. A
challenging business climate increases
uncertainty and makes it difficult for Irish
firms to enter the market, particularly for
SMEs.
• High natural trade barriers and
incomplete integration. The Mercosur bloc
is comprised of four markets with individual
cultures, languages, and regulation. Its
geographic location adds high transportation
costs for Irish exporters that erode their
competitiveness relative to local firms.
• Low purchasing power. GDP per capita in
Mercosur is low. The low-price domestic
markets make it difficult for Irish firms to be
competitive, and existing exports to the
Mercosur countries are mainly targeted to
the high-income segments.

7
Currently, there appears to be little momentum
for deepening integration among the Mercosur
countries as the level of consensus among the
Mercosur countries regarding economic
convergence remains low.
Current Levels of Trade and Investment
Relations are Relatively Low for Ireland
High entry barriers mean that very few Irish firms
currently export to Mercosur, and current
exporters often only do business in one market
(typically Brazil as the largest market in the
bloc). Enterprise Ireland estimates that only
around 180 firms out of 6,000 client firms
currently export to Mercosur (200-250 trade with
Latin America).
There is little trade and investment between
Ireland and Mercosur, and the Mercosur
countries accounted only for 0.6% of global Irish
exports and 0.3% of global Irish imports in 2018.
Ireland has run an overall trade surplus with
Mercosur since 2013, where the trade surplus in
services counterbalanced the small deficit in
goods.
Irish services exports have grown by 23%
annually since 2010 and accounted for 73% of
total Irish exports to Mercosur in 2018. 78% of
Irish services exports to Mercosur are within
technical, trade-related, and other business
services, where operating leasing services
(mainly of aircrafts) account for the main share.
In the same period, manufacturing exports have
grown by 4% annually, mainly driven by
chemicals and pharmaceuticals.
Increasing Irish exports indicate that Irish
exporters are gaining a foothold and making
progress in the Mercosur market even in the
absence of the Agreement. Considering the
improving trade performance, the value of the
Agreement for the Irish economy is likely to grow
over time. In combination with other EU FTAs,
the Agreement provides good prospects for Irish
companies to diversify and enhance the
resilience of their market base over the longer
term.
Imports from Mercosur have grown by 17% for
services (accounted for 0.1% of global Irish
services imports in 2018) and dropped by 5% for
goods in 2010-2019 (accounted for 0.6% of
global Irish good imports in 2019).
New Business Opportunities in Key Sectors
Boost Ireland-Mercosur Trade
Overall, the EU-Mercosur Agreement is forecast
to increase Ireland’s exports to Mercosur by
17% and imports by 12% but from a relatively
low base.
The increase in exports to Mercosur is worth
€1.2 bn in 2035 with large sectoral differences.
The Agreement holds the potential to increase
Irish manufacturing exports to Mercosur by €1.4
bn and agri-food exports by €10-20 mn. New
business opportunities in Mercosur will mainly
emerge in chemicals (incl. pharma); computer,
electronics & optical products; electrical
equipment & machinery; processed foods; and
beverages (e.g. whiskey).
The Agreement also offers new opportunities for
firms to provide services on both sides of the
Atlantic. Perhaps more importantly, the
Agreement binds existing levels of market
access and, therefore, gives better certainty to
services providers from the EU relative to third
countries. Given the low level of trade openness
and difficult business environments in the
Mercosur countries, it is very difficult to quantify
the extent to which existing barriers currently
restrict EU-Mercosur trade in services, and it is
equally difficult to quantify the extent to which
the Agreement will succeed in reducing these
barriers.
To be conservative, the economic modelling
assumes that the Agreement will have no impact
on market access for services, including
services barriers and NTBs for services. In the
absence of service trade opening, services
exports are expected to contract by €0.1 bn in
2035. A sensitivity analysis (based on the results
from the European Commission’s impact
assessment of the Agreement) shows that Irish
services exports could increase by
approximately 2% and add another €100-120
mn to Irish GDP in 2035. Opportunities for Irish
services firms are mainly within education
services, digital technologies
(telecommunications & software licences), and
engineering services.
Positive Macroeconomic Impacts for Ireland
Besides the impacts on bilateral trade between
Ireland and Mercosur, the Agreement is also
estimated to increase Irish exports to the EU
8
through EU value chains (e.g. to the motor
vehicle industry) and final goods producers (e.g.
of agri-food products) due to macroeconomic
gains from the Agreement for EU firms and
consumers.
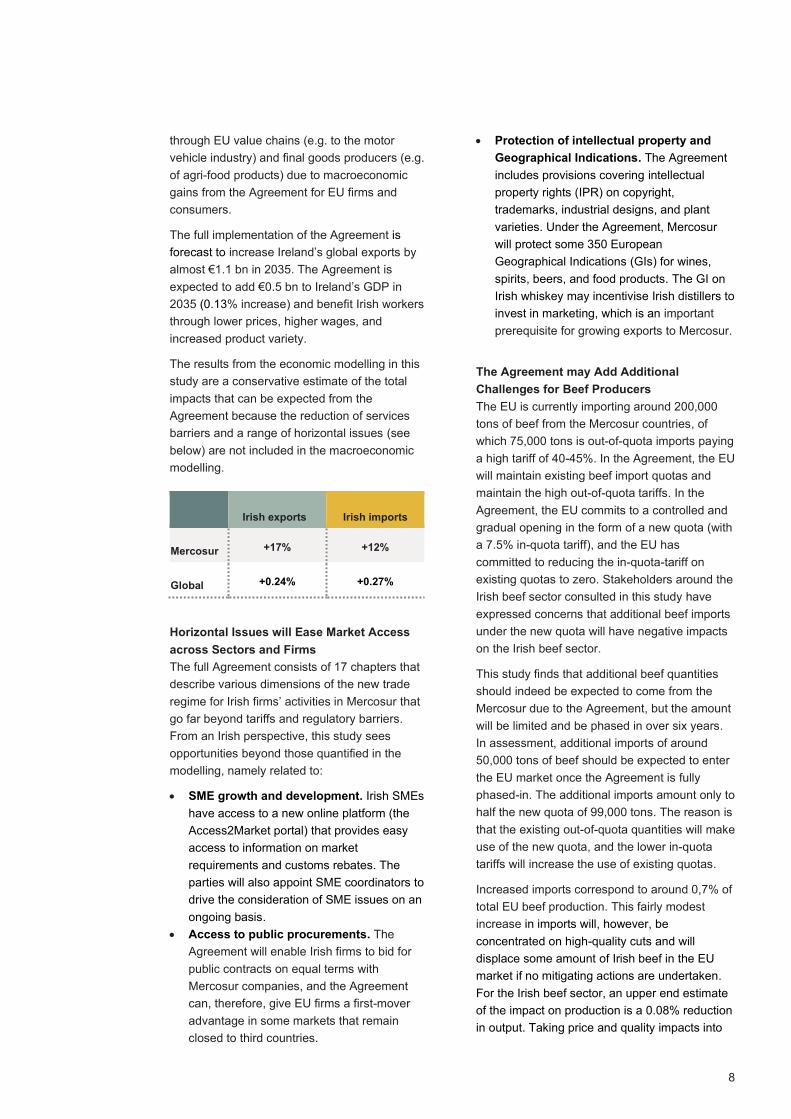
The full implementation of the Agreement is
forecast to increase Ireland’s global exports by
almost €1.1 bn in 2035. The Agreement is
expected to add €0.5 bn to Ireland’s GDP in
2035 (0.13% increase) and benefit Irish workers
through lower prices, higher wages, and
increased product variety.
The results from the economic modelling in this
study are a conservative estimate of the total
impacts that can be expected from the
Agreement because the reduction of services
barriers and a range of horizontal issues (see
below) are not included in the macroeconomic
modelling.
Irish exports Irish imports
Mercosur +17% +12%
Global +0.24% +0.27%
Horizontal Issues will Ease Market Access
across Sectors and Firms
The full Agreement consists of 17 chapters that
describe various dimensions of the new trade
regime for Irish firms’ activities in Mercosur that
go far beyond tariffs and regulatory barriers.
From an Irish perspective, this study sees
opportunities beyond those quantified in the
modelling, namely related to:
• SME growth and development. Irish SMEs
have access to a new online platform (the
Access2Market portal) that provides easy
access to information on market
requirements and customs rebates. The
parties will also appoint SME coordinators to
drive the consideration of SME issues on an
ongoing basis.
• Access to public procurements. The
Agreement will enable Irish firms to bid for
public contracts on equal terms with
Mercosur companies, and the Agreement
can, therefore, give EU firms a first-mover
advantage in some markets that remain
closed to third countries.
• Protection of intellectual property and
Geographical Indications. The Agreement
includes provisions covering intellectual
property rights (IPR) on copyright,
trademarks, industrial designs, and plant
varieties. Under the Agreement, Mercosur
will protect some 350 European
Geographical Indications (GIs) for wines,
spirits, beers, and food products. The GI on
Irish whiskey may incentivise Irish distillers to
invest in marketing, which is an important
prerequisite for growing exports to Mercosur.
The Agreement may Add Additional
Challenges for Beef Producers
The EU is currently importing around 200,000
tons of beef from the Mercosur countries, of
which 75,000 tons is out-of-quota imports paying
a high tariff of 40-45%. In the Agreement, the EU
will maintain existing beef import quotas and
maintain the high out-of-quota tariffs. In the
Agreement, the EU commits to a controlled and
gradual opening in the form of a new quota (with
a 7.5% in-quota tariff), and the EU has
committed to reducing the in-quota-tariff on
existing quotas to zero. Stakeholders around the
Irish beef sector consulted in this study have
expressed concerns that additional beef imports
under the new quota will have negative impacts
on the Irish beef sector.
This study finds that additional beef quantities
should indeed be expected to come from the
Mercosur due to the Agreement, but the amount
will be limited and be phased in over six years.
In assessment, additional imports of around
50,000 tons of beef should be expected to enter
the EU market once the Agreement is fully
phased-in. The additional imports amount only to
half the new quota of 99,000 tons. The reason is
that the existing out-of-quota quantities will make
use of the new quota, and the lower in-quota
tariffs will increase the use of existing quotas.
Increased imports correspond to around 0,7% of
total EU beef production. This fairly modest
increase in imports will, however, be
concentrated on high-quality cuts and will
displace some amount of Irish beef in the EU
market if no mitigating actions are undertaken.
For the Irish beef sector, an upper end estimate
of the impact on production is a 0.08% reduction
in output. Taking price and quality impacts into

9
consideration, lower production would translate
into a marginal reduction in the value of Irish
beef output of around €50 mn, compared to the
total value of Irish beef output of €2.3 bn (in
2019).
This is an upper end estimate based on
conservative assumptions about developments
in Mercosur beef exports in the absence of the
Agreement. The realisation of this upper bound
estimate is furthermore based on the
presumption that Mercosur exchange rates
remain competitive, and that the EU market
continues to be attractive relative to other main
Mercosur beef importers (such as China).
At the EU level, several important measures are
in place (or planned for) to protect the interests
of Irish farmers and consumers:
• A support package of up to €1 bn to assist
farmers, including Irish beef farmers, in the
event of significant market disturbance. This
support package is not accounted for in the
economic impact assessment.
• The Agreement includes a safeguard clause,
which can be used if the EU agri-food sector
is, or is at threat of being, seriously disturbed
by increased imports.
• The EU is a global standards setter and all
beef and other food products imported into
Ireland will still have to comply fully with the
EU’s food safety standards irrespective of
the Agreement.
• The Agreement provides a process whereby
the EU can raise concerns if the Mercosur
countries do not fulfil their obligations under
the Paris Climate Agreement insofar as food
production is concerned.
The Irish Government can work to ensure that
these measures are activated if needed, and
that the support package is used to compensate
Irish beef farmers for the potential loss due to
the Agreement. Besides economic
compensation, a longer-term investment in
building a GI for Irish grass-fed beef may
support the global competitiveness of Irish beef.
Marginal Sustainability Impacts for Ireland
Under all trade agreements there are trade-offs
created from enhanced market access.
Increases in trade can be expected to have
environmental impacts in terms of greenhouse
gas (GHG) emissions, water quality, air
pollution, land use, and a range of other
environmental indicators unless it is done in a
carbon neutral way. But trade can also be a
driver for transferring knowledge and technology
across borders, which can have positive
economic, social, and environmental impacts
(particularly for less advanced economies).
As the production and trade impacts of the
Agreement are expected to be small, the
environmental impacts in Ireland are expected to
be marginal.
If not countered by other measures, the
Agreement will slightly increase the reduction
requirements needed to meet the Paris
commitments in Ireland by 0.06% (or 0.05
MTCO2eq) towards 2035. The decarbonising
policy measures foreseen in the Irish Climate
Act Bill could realistically neutralise the impacts
of the Agreement. The Programme for
Government commits to an average 7% per
annum reduction in overall GHG from 2021 to
2030 - a 51% reduction over the decade - and to
achieving net zero emissions by 2050.
GHG emission
(%)
GHG emission
(MTCO2eq)
Ireland +0.06% +0.05 MTCO2eq
EU26 +0.07% +2.20 MTCO2eq
Mercosur +1.40% +17.5 MTCO2eq
Global +0.03% +15.9 MTCO2eq
Likewise, changes in production are forecast to
have marginal impacts on air pollution and land
use intensity in Ireland. The net impact reflects
environmental impacts of increased industry
production taking into consideration the very
slight decrease in beef production and the small
increase in dairy production in a ‘No policy
change’ scenario.
Negligible Impacts on Global Sustainability
Overall, the study finds that changes in Ireland-
Mercosur trade are forecast to have negligible
impacts on sustainability in the Mercosur
countries. In addition, refusal to ratify the EU-
Mercosur Agreement should be expected to
10
have little direct impact on deforestation rates or
emissions increases in Mercosur.
The modelling projects that the Agreement will
increase GDP in Mercosur by 1.0% and increase
real wages for all skill groups.
In a ‘No policy change’ scenario, increased
production in Mercosur is forecast to put more
pressure on the fulfilment of their Paris
commitments and imply an upwards pressure on
GHG emissions of 1.4% (or 17.5 MTCO2eq).
Over time, increased trade also stimulates
technology advancements and efficiency gains,
which in turn may lead to the dissemination of
more environmentally friendly technologies and
more sustainable development. In combination
with the GDP contribution of the Agreement that
can be invested in lowering GHG emissions, it is
possible that the impact of the Agreement can
be neutralised over the 15-year horizon.
The small increase in agri-food exports is
forecast to increase agri-food production in
Mercosur by 0.1-1.1%, but the economic
modelling makes no assumption of increased
use of land for agricultural purposes. Instead,
the results imply a more intense use of the
existing agricultural land. The increase in land-
use intensity (i.e. the value of production per
acre of land) in Brazil and Argentina is
predominantly driven by increased production of
grains, vegetables, and fruits, which account for
85-90% of agricultural land in the two countries.
In comparison, beef production accounts for 7-
10% of agricultural land.
Some stakeholders have expressed concerns
that increased beef production in Brazil may be
associated with illegal deforestation unless
preventive regulatory measures are put in place
by the Brazilian Government.
Without mitigating actions, the increase in EU
beef imports from Brazil under the Agreement is
expected to be around 20,000 tons, which
corresponds to a 0.2% increase in the quantity
produced in Brazil. This small increase in
quantity is believed to be consistent with the
assumption of no increase in agricultural land
use for beef production in Brazil.
If this increase should play a role in
deforestation in Mercosur countries, the impact
will be minor relative to the multiple other drivers
of deforestation, and a refusal to ratify the EU-
Mercosur Agreement would have little direct
impact on deforestation rates.
New Mechanism for Political Dialogue and
Cooperation
The ratification of the Agreement takes place in
a political environment influenced by a deep
economic recession due to the COVID-19
pandemic. The Agreement also coincides with a
global climate change crisis and resurgence of
deforestation in the Amazon rainforest. In an
open letter addressed to the Presidents of the
EU institutions, over 340 civil society
organisations urged the EU to halt negotiations
with the Mercosur countries on the grounds of
deteriorating human rights and environmental
conditions in Brazil.
Like all modern EU free trade agreements, the
EU-Mercosur Agreement includes a dedicated
chapter on Trade and Sustainable Development
(TSD). The intention of the TSD chapter is that,
through a cooperative approach, sufficient policy
changes would be incentivised both in the
Mercosur countries and in the EU that would
offset, or more than offset, any negative impacts
of trade on biodiversity and forests, the climate,
and the environment.
The TSD chapter provides, for the first time, an
explicit mechanism whereby the EU can raise
concerns about environmental and labour
conditions on a bilateral basis with the Mercosur
countries. In the Agreement, the Mercosur
reaffirms, for example, its commitment to the
Paris Climate Agreement and its effective
implementation. Cooperation on food safety,
animal welfare, and antimicrobial resistance can
also be further developed. Without the
Agreement, it may be more difficult for the EU to
exercise any influence with its Mercosur trading
partners in these and other policy fields.
To help enforce the sustainable development
commitments of EU trade agreements, the
European Commission has recently appointed a
Chief Trade Enforcement Officer (CTEO). In the
context of the EU-Mercosur Agreement, a key
responsibility of the CTEO will be to ensure that
Mercosur beef production meets EU rules and
regulations so that the commitments to
sustainability and the environment that are
required by EU farmers are also observed by
Mercosur producers. It will be important that the

11
CTEO has access to the required skills and
resources to meet expectations and fulfil the
important mandate given here.
Domestic Policy Responses can Improve
Outcomes for Ireland
The Irish Government has good opportunities to
implement policy initiatives that amplify some of
the positive impacts of the Agreement.
A precondition for Irish firms and consumers to
benefit from the Agreement is that it is fully
implemented and enforced. The newly appointed
CTEO will play a key role and with sufficient
resources and skills, is available to monitor
commitments under the Trade and Sustainable
Development Chapter, conduct consultations
over alleged violations, and activate the
safeguard clause if needed.
Another precondition is that Irish firms utilise the
Agreement. The Irish Government can prepare
an implementation strategy supported by
concrete action plans and delegated
responsibility to ensure that Irish firms are aware
of the Agreement and in a good position to use
it.
The Irish Government can also help by ensuring
that Irish firms are in a good position to diversify
towards the Mercosur markets. With boots on
the ground in Mercosur, for example, it will be
easier for Irish firms to find buyers, develop
business relationships, break into the market,
overcome language barriers etc. In addition,
Irish or EU funding for GI promotion could help
market Irish products (such as Irish whiskey) in
Mercosur.

12
Acronyms & Definitions
CAGR Compounded Annual Growth Rate
CGE model Computable General Equilibrium model
CH4 Methane
CO2 Carbon Dioxide
CSO Central Statistics Office
CTEO Chief Trade Enforcement Officer
CWE Carcass Weight Equivalent
EFTA European Free Trade Association
EPA Environmental Protection Environment
EU European Union (EU26 refers to the current EU Member States excl. the UK and
Ireland)
FAO Food and Agriculture Organisation
FCFS basis First Come First Served bases
FDI Foreign Direct Investment
FGAS Fluorinated Gas
FMD Food and Mouth Disease
FNFCCC United Nations Framework Convention on Climate Change
FTA Free Trade Agreement: An FTA is an agreement between two or more countries that
establishes the free exchange of goods and services among parties. Each party to an
FTA retains its own independent trade regime with respect to non-members (unlike
the case of a customs union). FTAs are subject to the disciplines and oversight of the
WTO
GATS The General Agreement on Trade in Services
GI Geographical Indications: A geographical indication is a distinctive sign used to
identify a product whose quality, reputation, or other such characteristics relate to its
geographical origin
GDP Gross Domestic Product: GDP is the market value of all goods and services
produced in a country in a year
GHG emissions Greenhouse Gas emissions
GLEAM database Global Livestock Environmental database
GMRIO database Global Multi-Regional Input-Output database
GTAP database Global Trade Analysis Project database: Global database describing bilateral trade
patterns, production, consumption, and intermediate use of commodities and
services
GWP Global Warming Potential
HQB quota High Quality Beef quota
IEA International Energy Agency

13
IMF International Monetary Fund
INPE National Institute for Space Research
IPCC Intergovernmental Panel on Climate Change
IPR Intellectual Property Rights
LAR Legal Amazon Region
LCA Life Cycle Analysis
LUC Land Use Change
Mercosur A trade bloc composed of Argentina, Brazil, Paraguay, and Uruguay
MFN Most Favoured Nation: MFN is the cornerstone of non-discrimination among WTO
members. Any favourable treatment provided by a WTO member to any other
country must immediately and unconditionally be provided to all other WTO members
MTCO2eq Mega Tons CO2 equivalents
N2O Nitrous Oxide
NGO Non-Governmental Organisation
NTBs Non-Tariff Barriers: NTBs refer to all restraints on the import of goods other than
tariffs
OECD Organisation for Economic Cooperation and Development
Rules of Origin Rules of Origin: The rules by which customs and other authorities determine the
source of an imported product
SPS Sanitary and Phytosanitary Measures: Measures to protect human, animal or plant
life, and health in the Single Market. The European Single Market seeks to guarantee
the free movement of goods, capital, services, and labour – the “four freedoms” –
within EU. It encompasses the EU’s 28 Member States, and has been extended, with
exceptions, to Iceland, Liechtenstein, and Norway through the Agreement on the
European Economic Area and to Switzerland through bilateral treaties
SMEs Small and Medium-sized Enterprises
TAC Training Accreditation Council
Tariff A duty levied on goods entering a new customs area – sometimes referred to as a
customs duty
TRQ Tariff Rate Quota: A quota within which imports enter a market with a tariff
advantage. A TRQ is a volume of imports whose tariff is lower than the tariff charged
for imports above the quota
TSD chapter Trade and Sustainable Development chapter
UN United Nation
WTO World Trade Organisation: The WTO is the international organisation dealing with the
rules of trade between nations. Its goal is to ensure that trade flows as smoothly,
predictably, and freely as possible

14
1. Content and Context of the EU-Mercosur Agreement
The EU-Mercosur Agreement has been in the pipeline for almost 20 years. In this chapter, we introduce
the content and context of the Agreement. Section 1.1 describes the economic and political context of the
Agreement and the ratification process ahead. Section 1.2 provides an overview of the economic
importance of Mercosur and the significance of the first-mover opportunities offered by the Agreement.
Section 1.3 gives more details on the methodology and policy scenarios that are applied in the study.
1.1 The Context of the EU-Mercosur Agreement
In June 2019, the EU and Mercosur (Argentina, Brazil, Paraguay, and Uruguay) reached a political
agreement for a trade deal that intends to create opportunities for growth, jobs, and sustainable
development on both sides through:
• Increased bilateral trade and investment through lower tariff and non-tariff barriers (NTBs),
notably for small and medium sized enterprises (SMEs).
• Creation of more stable and predictable rules for trade and investment through better and
stronger rules, e.g. around intellectual property rights (IPR) and geographical indications (GIs),
food safety standards, competition, and good regulatory practices.
• Promotion of joint values such as sustainable development, by strengthening worker’s rights,
fighting climate change, increasing environmental protection, encouraging companies to act
responsibly, and upholding high food safety standards.
Negotiations started back in 2000, but real progress was not made until 2016 when the EU and Mercosur
relaunched the negotiation process, exchanged new market access offers, and intensified the pace of
negotiations by holding negotiation rounds and meetings at regular intervals. What remains now is for the
Agreement to be ratified at EU and Member State levels, when a definitive legal text is available.
The EU-Mercosur Agreement is part of a network of bilateral and regional trade deals that the European
Commission has negotiated to improve market access for EU firms and enable them to diversify their
global value chains. The possible decisions on ratification of the Agreement are likely to coincide with the
COVID-19 pandemic that has thrown the world economy into a global recession, disrupted global value
chains, and triggered an increase in national trade barriers (World Bank 2020). Latest forecasts show that
the EU economy contracted by -6.1% in 2020 (European Commission 2021). All in all, the EU economy is
forecast to grow by 4.2% in 2021 and to strengthen to around 4.4% in 2022. The Agreement has,
therefore, gained a significant geopolitical relevance, and its ratification would signal that the EU continues
to see trade as key driver of economic prosperity and key to the recovery of the EU, Mercosur, and global
economies.
The Agreement also coincides with a global climate change crisis and resurgence of deforestation in the
Amazon rainforest. Deforestation is detrimental to the climate and generates particular challenges with
indigenous communities. Concerns have been raised by some stakeholders regarding the Agreement and
its potential impacts on climate change and the ambitions of the SDGs. In an open letter addressed to the
Presidents of the EU institutions, over 340 civil society organisations urged the EU to halt negotiations with
the Mercosur countries on the grounds of deteriorating human rights and environmental conditions in
Brazil (FERN 2020).
It is within this context that this study sets out to provide an independent economic and sustainability
impact assessment that can be used by the Irish Government to assist in formulating its position on the
future ratification of the Agreement.

15
1.2 Economic and Political Importance of the Agreement
The Mercosur countries form a free trade area with an increasingly integrated market of more than 260
million consumers. In combination, Argentina, Brazil, Paraguay, and Uruguay generate the 5th largest GDP
in the world. Brazil alone accounts for 79% of the Mercosur population and is the 9th largest economy in
the world. Almost 14,000 Brazilians live in Ireland, and the sizable Brazilian diaspora may open business
opportunities for Irish firms and stimulate Brazilian investments into Ireland.
The economic importance of Mercosur is likely to grow over time. While high inflation rates in the past
have eroded real GDP in Mercosur countries (mainly in Brazil), IMF forecasts prior to the COVID-19
pandemic nevertheless predicted growth of 2-3% in all Mercosur countries over the next 5-year period.
The Mercosur countries are relatively closed and accounted only for around 1.5% of global imports and
exports in 2018 (similar market share as Ireland). Considering the economic size of the region, these trade
figures show that Mercosur global trade is extremely underdeveloped. The policy context and long term,
strategic perspectives of the Agreement should not be underestimated.
Upon ratification of the EU-Mercosur Agreement, the EU will be the first major trading partner to conclude
a trade agreement with the Mercosur bloc. The Agreement will, therefore, give EU firms a first-mover
advantage in the Mercosur market with enhanced market access terms and lower trade barriers that will
improve their competitiveness relative to local and third country firms. As Mercosur becomes more open to
global trade, the Agreement should also be seen as a pathway to deepen collaboration on harmonised
standards. Failure to ratify the risks damaging the credibility of the EU in future trade negotiations.
Figure 1 The position of the Mercosur countries in the global economy
Source: Implement Economics based on World Bank data and IMF forecasts from October 2019
While attractive in size, low trade openness reflects that the Mercosur markets are also difficult to enter:
• High trade barriers. High tariffs effectively protect Mercosur firms from outside competition.
According to the World Tariff Profiles, the Mercosur countries applied an average tariff rate of
13.6% in 2016 (the latest year available) compared to an EU tariff rate of 5.2%. In addition, peak
tariffs (tariff rates higher than 15%) apply to 33.6% of EU products in the Mercosur market
compared to just 4.6 % for Mercosur products in the EU market (European Parliament 2019).

16
Indicators on services trade and FDI restrictions also show that Mercosur is a difficult market for
foreign firms.
• Challenging business climate. The regulatory environment and relatively low English
proficiency1 make it difficult to trade with and start a firm in Mercosur. Out of 190 countries, the
Mercosur countries rank 101 (Uruguay), 124 (Brazil), 125 (Paraguay), and 126 (Argentina) on the
World Bank’s Ease of Doing Business Index. In comparison, Ireland ranks 24. A challenging
business climate increases uncertainty and may make it relatively challenging for new Irish firms
to enter the Mercosur market, particularly for SMEs.
• Natural trade barriers and incomplete integration. While the Mercosur bloc is increasingly
integrated, it is nevertheless comprised of four different markets with individual languages,
cultures, and regulation. Currently, there appears to be little momentum for deepening integration
among the Mercosur countries as the level of consensus among the Mercosur countries
regarding economic convergence remains low. Mercosur should, therefore, not be expected to
constitute as fully an integrated trade block as the European Single Market in the short to medium
run. Its geographic location also adds high transportation costs for Irish exporters that impact their
competitiveness.
• Low purchasing power. GDP per capita in Mercosur is low (on average €6,700 compared to
€66,700 for Ireland), and inequality is high but falling. The low-price domestic markets make it
difficult for Irish firms to be competitive, and existing exports to the Mercosur countries are mainly
targeted at the high-income segments in the population.
High entry barriers mean that very few Irish firms currently export to Mercosur, and existing exporters often
only do business in one market (typically Brazil as the largest market). Enterprise Ireland estimates that
only around 180 firms out of 6,000 client firms currently export to Mercosur (200-250 trade with Latin
America). These numbers confirm that Ireland-Mercosur trade relations are relatively underdeveloped.
1.3 Policy Scenarios and Methodologies Applied in the Study
When fully phased in, the EU-Mercosur Agreement is expected to expand GDP in the EU by €11-15 bn
(LSE 2020). This study provides an assessment of the potential gains and challenges from an Irish
perspective. The impact assessment combines economic modelling using a Computational General
Equilibrium (CGE) model with an extensive consultation process to ensure a high degree of transparency
and engagement of stakeholders in the assessment (see Appendix A for a list of stakeholders).
The policy scenarios analysed in the economic modelling are based on the negotiating results of the trade
part of the EU-Mercosur Association Agreement from 28 June 2019 and are largely similar to the policy
scenarios analysed in the European Commission’s own impact assessment.2 The main elements in the
Agreement are summarised below, and an overview can be found in Figure 2.
• Tariff elimination or reduction. The Agreement will eliminate all EU tariffs on industrial goods
imports from Mercosur and significantly reduce (but not eliminate) tariffs facing the EU
manufacturing sector. The impact assessment will be based on the detailed tariff schedules in the
Agreement, and an overview of the new tariffs can be found in Chapter 2.
• New or expanded quotas. The Agreement includes EU tariff-rate quotas (TRQs) offered to the
Mercosur countries (most notably in beef, poultry, and pigmeat) and reciprocal TRQs in dairy.
• Convergence toward EU standards. The Agreement foresees that the costs for Mercosur
exporters to comply with EU NTBs are unchanged as existing EU SPS measures will be upheld.
1 Measured by the EF English Proficiency Index, English proficiency is low in Brazil (rank 53) and Uruguay (rank 51) but high in Argentina (rank 25) and moderate in Paraguay (39).
2 In terms of the scenarios being modelled, the main difference is that this study is based on the actual tariff schedules in the Agreement, whereas the Commission’s own impact assessment was initiated before these schedules were finally agreed upon and is therefore based on expected tariffs. As described in Appendix B, differences also relate to the way TRQs are modelled. In terms of the modelling of the scenarios, the main differences between the two studies relate to the chosen baseline year (2035 instead of 2032), the country grouping (Ireland, the UK, and EU26 instead of EU28), and the sector aggregation. The underlying data have also been improved with the newly released GTAP 10 database and new FAO data on environmental indicators.

17
Costs of NTBs on Mercosur imports of industrial products from the EU are expected to be
reduced, mainly due to convergence of Mercosur standards and regulation towards international
standards. Costs related to NTBs on industrial products are assumed to be reduced by 5% in the
modest scenario and by 10% in the ambitious scenario.
Tariffs in the EU-Mercosur Agreement will in most cases be phased out linearly over up to ten years,
whereas reductions in NTBs take time to materialise. A projection horizon to 2035 is, therefore, likely to
capture the long-term impacts of the Agreement in both respects. The two policy scenarios only vary in
their assumption regarding the NTBs on industrial products, and the results from the economic modelling
are therefore largely similar.
Figure 2 Overview of the policy scenario
Note: The assumptions regarding Brexit are consistent with previous studies commissioned for the Irish Government, in particular
the assessment of the economic impacts arising for Ireland from the potential future trading relationship between the EU and
UK, which was based on the trade provisions of the Revised Political Declaration on the Future Relationship between the EU
and the UK that was agreed alongside the Withdrawal Agreement (Copenhagen Economics 2020).
Source: Implement Economics based on the Association Agreement between the EU and Mercosur
The Agreement also offers new opportunities for firms to provide services on both sides of the Atlantic
(e.g. postal and courier services, telecommunications, financial services, e-commerce, and maritime
services). Perhaps more importantly, the Agreement binds existing levels of market access and, therefore,
gives better certainty to services providers from the EU relative to third countries. Given the low level of
trade openness and difficult business environments in the Mercosur countries, it is very difficult to quantify
the extent to which existing barriers currently restrict EU-Mercosur trade in services, and it is equally
difficult to quantify the extent to which the Agreement will succeed in reducing these barriers.
To be conservative, we assume that the Agreement will have no impact on market access for services,
including services barriers and NTBs for services. The economic modelling will, therefore, tend to
underestimate the potential gains from the EU-Mercosur Agreement for services, in particular for a country
like Ireland where services make up a large share of total exports to the Mercosur countries (73% as
illustrated in Chapter 2). Chapter 4, therefore, includes a section on services that draws on a more detailed
analysis of opportunities for Irish service providers and includes a sensitivity analysis based on the
European Commission’s modelling results. The CGE modelling does not take into consideration several

18
horizontal issues in the EU-Mercosur Agreement, such as investment liberalisation, public procurement,
Intellectual Property Right (IPR) protection, Geographical Indications (GIs), and special SME initiatives
which are particularly important for countries like Ireland. These issues are assessed qualitatively in
Chapter 7.
Overall, the study consists of eight chapters. An overview of current trade and investment relations
between Ireland and Mercosur can be found in Chapter 2 to put the EU-Mercosur Agreement into context.
The macroeconomic impacts of the Agreement are shown in Chapter 3, and detailed impacts on a sectoral
level are reported in Chapter 4. Results for Ireland vary little between the two scenarios, and we have
chosen to focus on the ambitious scenario throughout the study. Chapter 5 provides an analysis of the
environmental impacts in Ireland of changes in production, and Chapter 6 assesses the broader
sustainability impacts of the Agreement, encompassing social, environmental, and human rights impacts in
Mercosur. Horizontal issues are assessed in Chapter 7, and Chapter 8 includes a description of initiatives
that will pull towards an ambitious implementation, enforcement, and utilisation of the Agreement.
In combination, the economic modelling, the qualitative analysis, and the consultations lay the basis for
designing policy initiatives that the Irish Government can implement to amplify some of the positive
impacts and mitigate some of the negative impacts to be expected if the Agreement is ratified. It should be
highlighted that the results from the economic and environmental modelling represent a ‘No policy change’
scenario, i.e. they do not account for mitigating or incentivising policy interventions by Ireland, the EU, and
Mercosur which may impact on outcomes.
1.4 Concluding Remarks
The Mercosur countries are relatively closed and accounted only for around 1.5% of global imports and
exports in 2018 (similar market share as Ireland). Considering the economic size of the region, these trade
figures show that Mercosur’s global trade is extremely underdeveloped. The policy context and long term,
strategic perspectives of the Agreement should, therefore, not be underestimated. Also, the economic
importance of Mercosur is likely to grow due to positive growth prospects.
If the EU-Mercosur Agreement is ratified, the EU will be the first major trading partner to conclude a trade
agreement with the Mercosur bloc. The Agreement will give EU firms a first-mover advantage in the
Mercosur market with enhanced market access terms and lower trade barriers that will improve their
competitiveness relative to local and third country firms. As Mercosur becomes more open to global trade,
the Agreement can be a pathway to modernising the region and harmonising towards EU standards.
Failure to ratify the Agreement risks damaging the credibility of the EU in future trade negotiations.
However, Mercosur remains a challenging market. Currently, there appears to be little momentum for
deepening integration among the Mercosur countries as the level of consensus among the Mercosur
countries regarding economic convergence remains low.
The EU-Mercosur Agreement has been in the pipeline for almost 20 years, but the ratification of the
Agreement takes place in a political environment influenced by an economic recession after the COVID-19
pandemic and a global climate change crisis that both require urgent policy responses.
This study provides an independent economic and sustainability impact assessment that can be used by
the Irish Government to formulate its position on the Agreement and ratification. Results throughout the
report are based on ambitious scenario, where the actual implementation of the Agreement will materialise
in a 10% reduction in costs related to NTBs on industrial products entering Mercosur. It should be
highlighted that the results in this study represent a ‘No policy change’ scenario i.e. the results do not
account for mitigating or incentivising policy interventions which may impact on outcomes. Therefore, the
study also lays the basis for designing policy initiatives that the Irish Government can implement to
address the opportunities and challenges of the Agreement.

19
2. Current Ireland-Mercosur Relations
The level, growth, and composition of current trade and capital flows between Ireland and Mercosur
constitute the starting point for understanding how the EU-Mercosur Agreement should be expected to
impact the Irish economy, workers, and consumers. Section 2.1 looks at trends in Ireland-Mercosur trade in
goods and services, and Section 2.2 maps Ireland’s trade balance vis-à-vis the Mercosur countries (as a
whole and individually). Section 2.3 disaggregates Ireland’s goods trade with Mercosur and compares the
trade profile with other major Irish trading partners, and Section 2.4 shows similar analysis of trade in
services. Finally, Section 2.5 looks at cross-border investments between Ireland and Mercosur.
2.1 Trends in Ireland-Mercosur Trade
Current trade flows between Ireland and Mercosur are limited. Ireland’s goods exports to Mercosur
amounted to €419 mn in 2019 and accounted only for 0.3% of global Irish exports. On average, Irish
goods exports to Mercosur increased by 2% annually during 2010-2018. Exports increased sharply
between 2017 and 2018 mainly due to an increase in exports of chemicals (incl. pharma). Since Irish
goods exports have been increasing, indicating that Irish exporters are gaining a foothold and making
progress in the Mercosur market even in the absence of the Agreement, the value of lower tariffs and
NTBs for the Irish economy is likely to grow over time.
Goods imports from Mercosur stood at €514 mn in 2019 and accounted for 0.6% of global Irish goods
imports. Irish goods imports from Mercosur have on average decreased 5% annually. The drop in goods
imports from 2012 to 2013 was mainly due to lower imports of machinery & transport equipment.
Figure 3 Ireland-Mercosur trade in goods, 2010-2018
Note: Values are shown in 2018 prices.
Source: Implement Economics based on CSO and Eurostat
Irish services exports to Mercosur stood at €1,289 mn in 2018 and accounted for 0.7% of global Irish
services exports. Services exports to Mercosur have increased steadily with an average annual growth
rate of 23% during 2010-2018, driven mainly by operating leasing services. Operating leasing services
refer to assets that are rented under operating leases and include real estate, aircraft, and equipment with
long, useful life spans - such as vehicles, office equipment, and industry-specific machinery.
Ireland’s imports of services from Mercosur have on average increased by 17% annually during 2010-2018
(driven mainly by personal, cultural, and recreational services) but remain at a very low level. Imports of
€263 mn from Mercosur accounted for around 0.1% of Ireland’s global imports of services in 2018.

20
Figure 4 Ireland-Mercosur trade in services, 2010-2018
Note: Values are shown in 2018 prices.
Source: Implement Economics based on data from CSO and Eurostat
2.2 Ireland’s Balance of Trade with Mercosur
Brazil is by far the largest Mercosur market for Irish firms and is the destination for 82.7% of total Irish
exports. Argentina accounts for 15.9%, leaving less than 2% for Uruguay and Paraguay. Imports are more
evenly distributed between Brazil (55.6% of Irish imports from Mercosur) and Argentina (41.3%).
Figure 5 Ireland-Mercosur trade, 2018
Source: Implement Economics based on data from CSO and Eurostat
Ireland has run a trade surplus with Mercosur since 2013, where the trade surplus in services has
counterbalanced the deficit in goods. The trade surplus in 2018 was €963 mn. Ireland has run a narrowing
goods trade deficit with Mercosur during 2010-2018, and the goods trade deficit amounted to €-63 mn in
2018 down from €-1,050 in 2012.
Ireland has had a positive and widening trade balance in services towards Mercosur during 2010-2018,
and the services trade surplus amounted to €1,026 mn in 2018.

21
Figure 6 Ireland-Mercosur trade balance, 2010-2018
Note: Values are shown in 2018 prices.
Source: Implement Economics based on data from CSO and Eurostat
Ireland’s trade balance with the individual Mercosur countries is shown in Figure 7. As Brazil is by far the
largest trading partner followed by Argentina, the figures have different scales. In goods, Ireland runs a
trade surplus with Brazil and Uruguay and a trade deficit with Argentina and Paraguay. In services, Ireland
runs a trade surplus with all the Mercosur countries. As the main importer of Irish goods and services
among the Mercosur countries, and by far the largest market in Mercosur, Ireland’s positive and widening
trade balance with Brazil in both goods and services indicates that the benefits of the EU-Mercosur
Agreement to Irish exporters in these markets are likely to grow over time.

22
Figure 7 Ireland’s trade balance with individual Mercosur countries, 2010-2018
Note: The trade balance is measured as exports subtracted by imports. Values are shown in 2018 prices.
Source: Implement Economics based on data from CSO and Eurostat
2.3 Profile of Ireland-Mercosur Goods Trade
Trade with Mercosur accounts only for 0.6% of global Irish trade. The composition of Irish goods exports to
Mercosur resembles the profile of Ireland’s exports to EU26 and globally but differs from the profile of Irish
exports to the UK. While FTAs such as the EU-Mercosur Agreement and other EU trade deals provide
good prospects for Irish companies to diversify and enhance the resilience of their market base over the
longer term, the Agreement should not be expected to compensate for Brexit for all sectors:
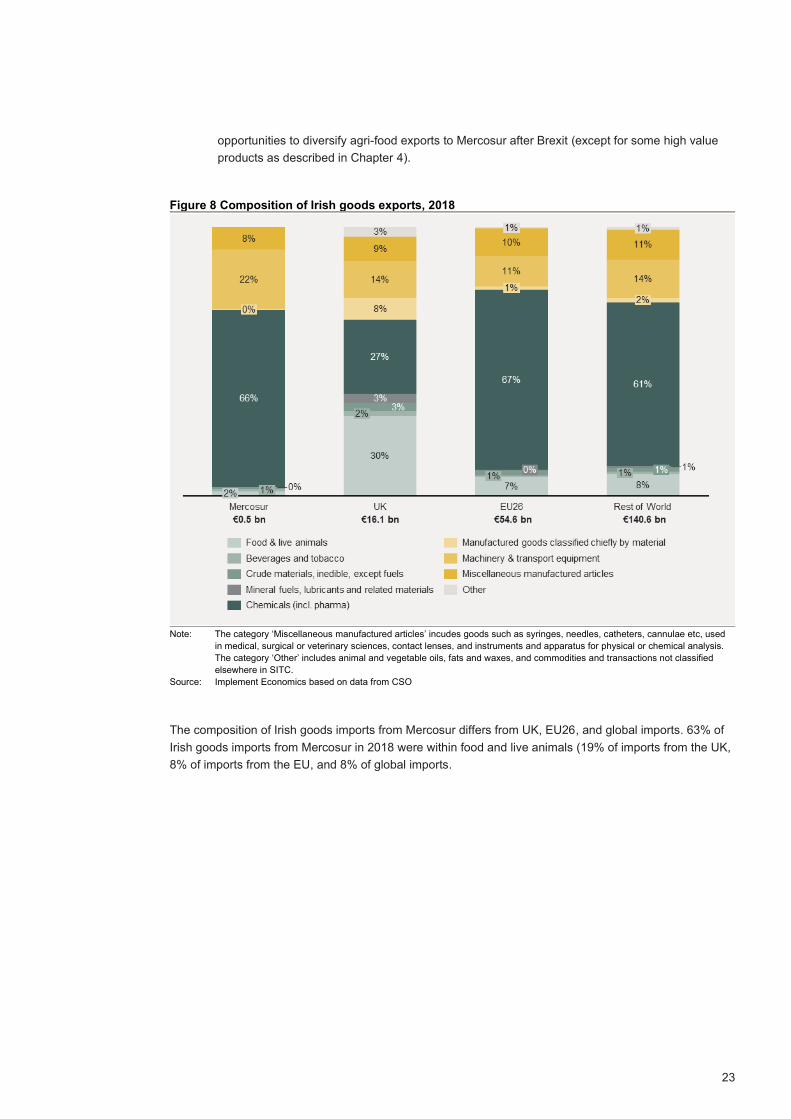
• Ireland’s goods exports are highly concentrated in chemicals (incl. pharma). 66% of Irish goods
exports to Mercosur in 2018 fall within this sector, and the sector accounted for 67% and 61%
respectively of Ireland’s goods exports to the EU and globally. Chemicals (incl. pharma)
accounted only for 27% of Ireland’s goods exports to the UK.
• 22% of Irish goods exports to Mercosur are within machinery & transport equipment, and
Ireland’s goods exports are slightly more concentrated in this sector compared to the EU (11%)
and globally (14%).
• Food & live animals accounted only for 2% of Ireland’s exports to Mercosur in 2018 (7% of
exports to the EU and 8% of Ireland’s global goods exports) compared to Ireland’s exports to the
UK where food & live animals account for 30% of Ireland’s total goods exports to the UK. As the
Mercosur countries account for 0.1% of global Irish exports in this product group, EU26 for 34%,
and the UK for 43%, the EU-Mercosur Agreement would appear to offer few immediate
23
opportunities to diversify agri-food exports to Mercosur after Brexit (except for some high value
products as described in Chapter 4).
Figure 8 Composition of Irish goods exports, 2018
Note: The category ‘Miscellaneous manufactured articles’ incudes goods such as syringes, needles, catheters, cannulae etc, used
in medical, surgical or veterinary sciences, contact lenses, and instruments and apparatus for physical or chemical analysis.
The category ‘Other’ includes animal and vegetable oils, fats and waxes, and commodities and transactions not classified
elsewhere in SITC.
Source: Implement Economics based on data from CSO
The composition of Irish goods imports from Mercosur differs from UK, EU26, and global imports. 63% of
Irish goods imports from Mercosur in 2018 were within food and live animals (19% of imports from the UK,
8% of imports from the EU, and 8% of global imports.

24
Figure 9 Composition of Irish goods imports, 2018
Note: The category ‘Miscellaneous manufactured articles’ incudes goods such as syringes, needles, catheters, cannulae etc, used
in medical, surgical or veterinary sciences, contact lenses, and instruments and apparatus for physical or chemical analysis.
The category ‘Other’ includes animal and vegetable oils, fats and waxes, and commodities and transactions not classified
elsewhere in SITC.
Source: Implement Economics based on data from CSO
The high concentration of food & live animals in Ireland’s goods imports from Mercosur suggests that Irish
consumers should be expected to benefit from expanded quotas and lower tariffs on agri-food products in
the Agreement, and most notably for imports of oil-cake of soy beans, vegetable residues and by-products,
maize, coffee, wine, fresh fruit (apples) and fruit juices.
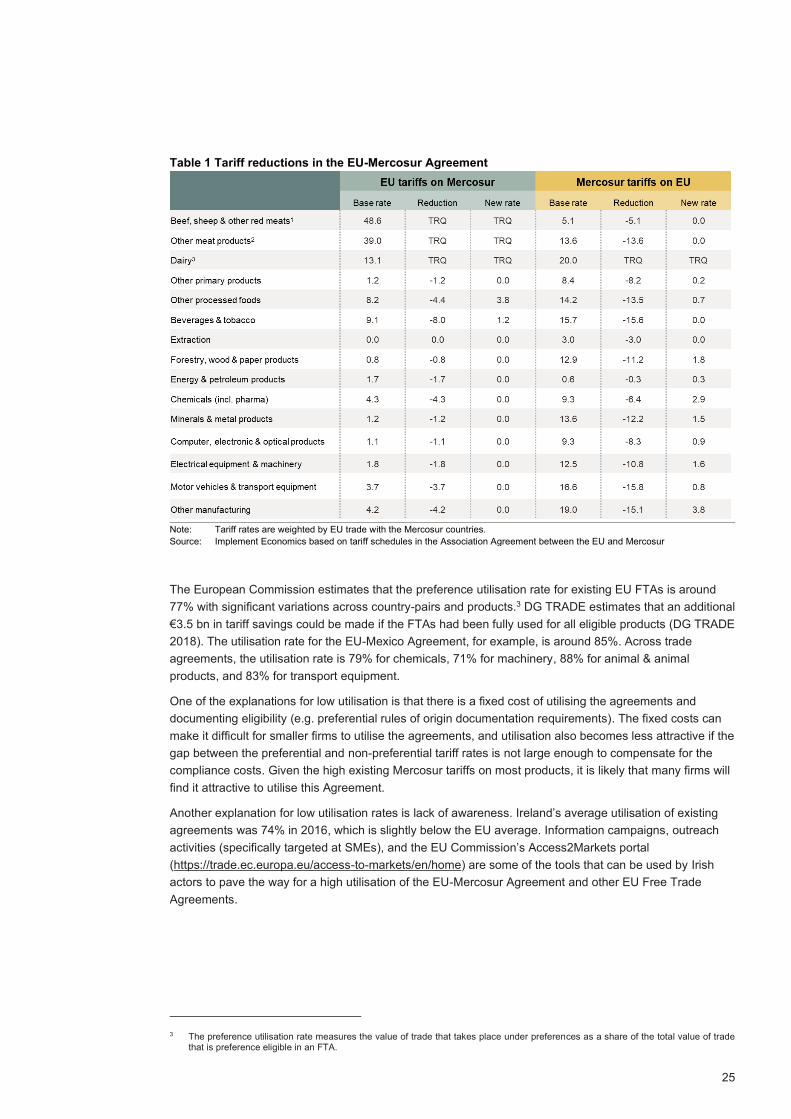
The new tariff schedules after the full implementation of the EU-Mercosur Agreement in Table 1 show that
Irish exporters in all sectors will face significantly lower tariffs once the Agreement is fully implemented,
which gives them a competitive advantage relative to third country exporters. Although tariffs are not
always fully eliminated, tariff reductions will be much larger on the Mercosur side than the EU side. Tariffs
on electrical equipment & machinery will on average be reduced from 12.5% to 1.7%, and tariffs on motor
vehicles & transport equipment will be reduced from 16.6% to 0.8%. Average tariffs on chemicals (incl.
pharma) will be reduced from 9.3% to 2.9%, which means that there may still be tariffs on some of
Ireland’s main export products to Mercosur.
25
Table 1 Tariff reductions in the EU-Mercosur Agreement
Note: Tariff rates are weighted by EU trade with the Mercosur countries.
Source: Implement Economics based on tariff schedules in the Association Agreement between the EU and Mercosur
The European Commission estimates that the preference utilisation rate for existing EU FTAs is around
77% with significant variations across country-pairs and products.3 DG TRADE estimates that an additional
€3.5 bn in tariff savings could be made if the FTAs had been fully used for all eligible products (DG TRADE
2018). The utilisation rate for the EU-Mexico Agreement, for example, is around 85%. Across trade
agreements, the utilisation rate is 79% for chemicals, 71% for machinery, 88% for animal & animal
products, and 83% for transport equipment.
One of the explanations for low utilisation is that there is a fixed cost of utilising the agreements and
documenting eligibility (e.g. preferential rules of origin documentation requirements). The fixed costs can
make it difficult for smaller firms to utilise the agreements, and utilisation also becomes less attractive if the
gap between the preferential and non-preferential tariff rates is not large enough to compensate for the
compliance costs. Given the high existing Mercosur tariffs on most products, it is likely that many firms will
find it attractive to utilise this Agreement.
Another explanation for low utilisation rates is lack of awareness. Ireland’s average utilisation of existing
agreements was 74% in 2016, which is slightly below the EU average. Information campaigns, outreach
activities (specifically targeted at SMEs), and the EU Commission’s Access2Markets portal
(https://trade.ec.europa.eu/access-to-markets/en/home) are some of the tools that can be used by Irish
actors to pave the way for a high utilisation of the EU-Mercosur Agreement and other EU Free Trade
Agreements.
3 The preference utilisation rate measures the value of trade that takes place under preferences as a share of the total value of trade that is preference eligible in an FTA.

26
2.4 Profile of Ireland-Mercosur Services Trade
The composition of Irish services trade with Mercosur also differs from trade with other partners. 78% of
Irish services exports are within technical, trade-related, and other business services, where operating
leasing services (mainly of aircrafts) account for the main share. Irish exports in some of the highly
productive sectors (e.g. financial services, telecommunications, and insurance) are more limited.
Figure 10 Composition of Irish services exports, 2018
Note: The category ‘Other’ includes service sectors that accounted for less than 1% of Irish services exports in 2018, including
maintenance and repair services; construction; government goods and services; and data suppressed for confidentiality. The
category ‘Other business services’ includes research and development services; legal services; accounting; auditing;
bookkeeping and tax consultancy services; management consulting and public relations services; advertising; market
research; public opinion polling; architectural services; engineering services; other technical services; waste treatment and
depollution; services for agriculture, forestry, and fishing; services related to mining and quarrying, and oil and gas extraction;
direct leasing services; trade-related services; and employment services.
Source: Implement Economics based on data from CSO and Eurostat
Irish imports of services from Mercosur amounted only to €263 mn in 2018 (0.1% of global Irish services
imports), and 88% were within technical, trade related, and other business services. Since a large share of
Ireland-Mercosur services trade is trade-related, and to some extent driven by trade in goods, it is likely
that services trade will be stimulated as Irish and EU goods trade with Mercosur expands – even in the
absence of reductions of barriers to trade in services.
Several service sectors that account for significant shares of Irish trade with the UK, EU, and globally have
little significance in Ireland-Mercosur trade. Telecommunications, computer, and information services
accounted for 48.1% of global Irish exports but only for 0.3% of Irish exports to Mercosur. The same
difference can be observed for financial services, insurance & pension services, travel services, and
transport services. Low Irish exports in these sectors reflect that the Mercosur market is protected by
relatively high barriers to trade in services.

27
Figure 11 Composition of Irish services imports, 2018
Note: The category ‘Other’ includes service sectors that accounted for less than 1% of Irish services exports in 2018, including
maintenance and repair services; construction; government goods and services; and data suppressed for confidentiality. The
category ‘Other business services’ includes research and development services; legal services; accounting; auditing;
bookkeeping and tax consultancy services; management consulting and public relations services; advertising; market
research; public opinion polling; architectural services; engineering services; other technical services; waste treatment and
depollution; services for agriculture, forestry, and fishing; services related to mining and quarrying, and oil and gas extraction;
direct leasing services; trade-related services; and employment services.
Source: Implement Economics based on data from CSO and Eurostat
Likewise, low Irish services imports reflect that the EU market also has restrictions for services providers
from third countries. Charges for the use of intellectual property, for example, account for 39% of Irish
global services imports but are largely absent in Irish services imports from Mercosur.4 When a foreign
pharmaceutical firm establishes a subsidiary in Ireland and uses patents owned by the parent company,
for example, such charges are registered as Irish services imports. Low Irish imports, therefore, also
reflect that very few Mercosur companies have established themselves in Ireland (see also Section 2.5).
Currently, Irish services exports to Mercosur fall under the existing GATS commitments that are provided
by schedules for all modes of services trade:
• Cross-border supply (Mode 1): The opportunity for Irish services providers to supply services
cross-border into the Mercosur markets.
• Consumption abroad (Mode 2): The freedom for Mercosur residents to purchase services in
Ireland.
4 Charges for the use of intellectual property are payments and receipts between residents and non-residents for the authorised use of proprietary rights (such as patents, trademarks, copyrights, industrial processes and designs including trade secrets, and franchises) and for the use, through licensing agreements, of produced originals or prototypes (such as copyrights on books and manuscripts, computer software, cinematographic works, and sound recordings) and related rights (such as for live performances and television, cable, or satellite broadcast).
28
• Commercial presence (Mode 3): The opportunity for Irish service providers to establish, operate,
or expand a commercial presence in the Mercosur market (e.g. a branch, agency, or wholly
owned subsidiary).
• Presence of natural persons (Mode 4): The opportunity for Irish service providers to enter and
temporarily stay in the Mercosur market to supply a service.
Market access in services can be measured by the Services Trade Restrictiveness index (STRI) from the
World Bank. The World Bank database provides comparable information on services trade policy
measures on five sectors (telecommunications, finance, transportation, retail, and professional services)
and key modes of delivery (cross-border supply, commercial presence, and personal presence). It makes
available information for 103 countries (79 developing countries and 24 OECD countries). In addition, the
World Bank has constructed an estimate for the EU based on data for the 20 EU countries for which data
are available.
The STRI comparisons for EU20 and the individual Mercosur countries are shown in Figure 12 for three
groups of services (‘Other business services’; ‘Transport’; and ‘Telecommunications, computer, and
information services’).
For other business services, the EU market is generally more closed to Mercosur services providers than
vice versa (with Brazil slightly more restrictive than EU20). Cross-border supply (Mode 1) is prohibited in
Brazil and Paraguay, whereas there are no restrictions on market access in Argentina and Uruguay. For
many Irish providers of business services, selling to customers in Mercosur requires a local presence (e.g.
through the establishment of a branch of a foreign bank or of a franchising outlet). Existing restrictions on
establishments (Mode 3) in Brazil and Argentina (the largest Mercosur countries), therefore, limit Irish
export opportunities in business services. Irish service providers in this sector have relatively good
opportunities to enter and temporarily stay in Uruguay and Paraguay (Mode 4), whereas the markets in
Argentina and Brazil are more closed.
The Mercosur countries are generally more restrictive on cross-border supply of transport services than
the EU (STRI for Mode 1 in this sector lies at 25 for Argentina, 25 for Brazil, 13 for Uruguay, and 25 for
Paraguay compared to 13 for the EU20). However, it is generally easier for an EU transport firm to
establish a business in the Mercosur than vice versa.
Like the EU, Argentina and Brazil allow establishments in telecommunications, computer, and information
services, whereas services restrictions are relatively high in Uruguay and Paraguay. There is no available
data on restrictions on cross-border trade in this sector.

29
Figure 12 Services Trade Restrictiveness Index
Note: The table shows trade barriers to services trade as measured by the World Bank’s Service Trade Restrictiveness Index (0: no
barriers, 100: sector closed to trade, N/A: no data available). The STRI breakdown does not cover Mode 2. EU20 is an
artificial entity of 20 EU Member States created by the World Bank to capture their policies as applicable to non-EU providers.
Data refer to 2008 (2011 for certain countries) and should be interpreted with caution for countries that have liberalised their
services trade restrictions in the last decade.
Source: Implement Economics based on data from World Bank STRI
2.5 Current Ireland-Mercosur Investments
Considering the economic size of the Mercosur countries, Ireland-Mercosur investments are very limited.
The Mercosur countries have little tradition for investing abroad and account only for 0.8% of the global
stock of Foreign Direct Investments (FDI) compared to a share of global GDP of 2.9%. The Mercosur stock
of FDI in Ireland was €326 mn in 2018 and has dropped by 9.4% since 2015. Due to lack of data, it is not
possible to analyse the sectoral composition of investments between Ireland and the Mercosur countries.
Ireland’s stock of FDI in Mercosur amounted to €515 mn in 2018, and Brazil accounted for as much as
67%. The FDI stock has dropped by 18.6% since 2015 driven mainly by a reduction in Irish investments in
Brazil. Restrictions on commercial presence (Mode 3) as described above help explain why Irish service
suppliers rarely establish, operate, or expand a commercial presence in the Mercosur countries.
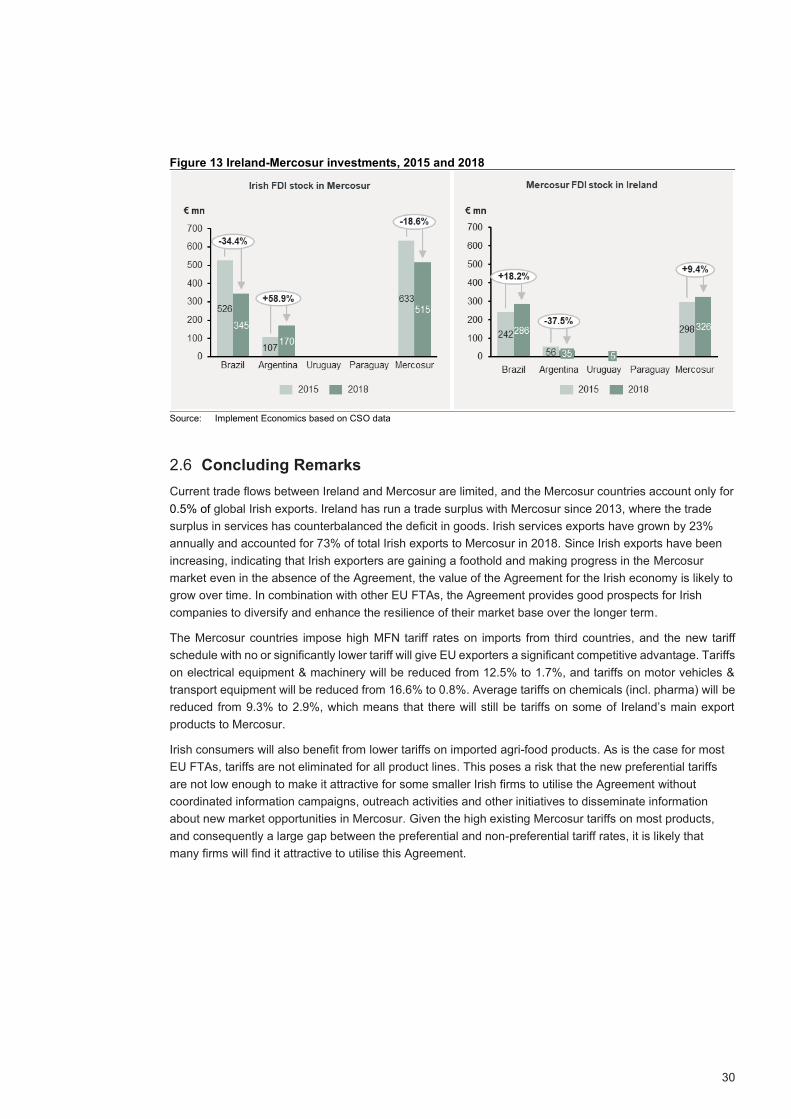
30
Figure 13 Ireland-Mercosur investments, 2015 and 2018
Source: Implement Economics based on CSO data
2.6 Concluding Remarks
Current trade flows between Ireland and Mercosur are limited, and the Mercosur countries account only for
0.5% of global Irish exports. Ireland has run a trade surplus with Mercosur since 2013, where the trade
surplus in services has counterbalanced the deficit in goods. Irish services exports have grown by 23%
annually and accounted for 73% of total Irish exports to Mercosur in 2018. Since Irish exports have been
increasing, indicating that Irish exporters are gaining a foothold and making progress in the Mercosur
market even in the absence of the Agreement, the value of the Agreement for the Irish economy is likely to
grow over time. In combination with other EU FTAs, the Agreement provides good prospects for Irish
companies to diversify and enhance the resilience of their market base over the longer term.
The Mercosur countries impose high MFN tariff rates on imports from third countries, and the new tariff
schedule with no or significantly lower tariff will give EU exporters a significant competitive advantage. Tariffs
on electrical equipment & machinery will be reduced from 12.5% to 1.7%, and tariffs on motor vehicles &
transport equipment will be reduced from 16.6% to 0.8%. Average tariffs on chemicals (incl. pharma) will be
reduced from 9.3% to 2.9%, which means that there will still be tariffs on some of Ireland’s main export
products to Mercosur.
Irish consumers will also benefit from lower tariffs on imported agri-food products. As is the case for most
EU FTAs, tariffs are not eliminated for all product lines. This poses a risk that the new preferential tariffs
are not low enough to make it attractive for some smaller Irish firms to utilise the Agreement without
coordinated information campaigns, outreach activities and other initiatives to disseminate information
about new market opportunities in Mercosur. Given the high existing Mercosur tariffs on most products,
and consequently a large gap between the preferential and non-preferential tariff rates, it is likely that
many firms will find it attractive to utilise this Agreement.

31
3. Macroeconomic Impacts of the Agreement for Ireland
Lower trade barriers due to the EU-Mercosur Agreement will enable Irish firms to enter new markets, benefit
from economies of scale, and improve their international competitiveness. Irish suppliers to EU firms will
experience increased demands, and Irish firms and consumers get improved access to imports at a lower
price. At the same time, Mercosur firms also get improved access to EU markets and compete against local
firms. In this chapter, we use a macroeconomic model to assess the net trade-induced impact of the
Agreement on the Irish economy in 2035. Section 3.1 provides a non-technical description of the economic
model that has been applied in study. Section 3.2 gives an overview and assesses impacts on total trade
and GDP for Ireland, and Section 3.3 maps impacts on trade and production across sectors. Finally, Section
3.4 looks at impacts for Irish workers and consumers.
3.1 Overview of the CGE model Applied in the Economic Modelling
The Computational General Equilibrium (CGE) model is a central element in the economic and sustainability
impact assessment. CGE analysis allows us to isolate the impacts of the EU-Mercosur Agreement from
other factors that should be expected to have a significant impact on the economies going forward. Further
details of the CGE model can be found in Appendix B. The isolated impact of the EU-Mercosur Agreement
in the long term can be measured as the difference between the projected development without the
Agreement (the 2035 baseline) and the development when the Agreement is fully implemented. The CGE
model covers direct impacts, indirect impacts, trade diversion, and general equilibrium effects as
described in Figure 14.
Figure 14 Overview of the types of impacts captured by the CGE model
Source: Implement Economics
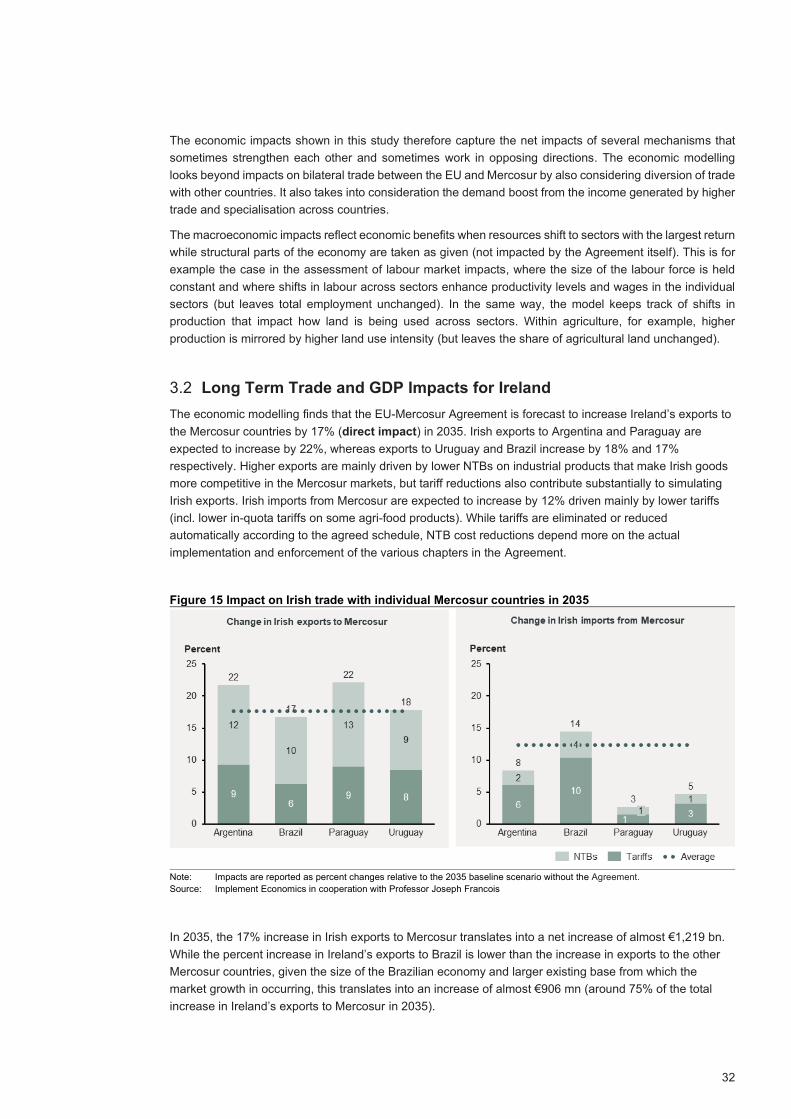
32
The economic impacts shown in this study therefore capture the net impacts of several mechanisms that
sometimes strengthen each other and sometimes work in opposing directions. The economic modelling
looks beyond impacts on bilateral trade between the EU and Mercosur by also considering diversion of trade
with other countries. It also takes into consideration the demand boost from the income generated by higher
trade and specialisation across countries.
The macroeconomic impacts reflect economic benefits when resources shift to sectors with the largest return
while structural parts of the economy are taken as given (not impacted by the Agreement itself). This is for
example the case in the assessment of labour market impacts, where the size of the labour force is held
constant and where shifts in labour across sectors enhance productivity levels and wages in the individual
sectors (but leaves total employment unchanged). In the same way, the model keeps track of shifts in
production that impact how land is being used across sectors. Within agriculture, for example, higher
production is mirrored by higher land use intensity (but leaves the share of agricultural land unchanged).
3.2 Long Term Trade and GDP Impacts for Ireland
The economic modelling finds that the EU-Mercosur Agreement is forecast to increase Ireland’s exports to
the Mercosur countries by 17% (direct impact) in 2035. Irish exports to Argentina and Paraguay are
expected to increase by 22%, whereas exports to Uruguay and Brazil increase by 18% and 17%
respectively. Higher exports are mainly driven by lower NTBs on industrial products that make Irish goods
more competitive in the Mercosur markets, but tariff reductions also contribute substantially to simulating
Irish exports. Irish imports from Mercosur are expected to increase by 12% driven mainly by lower tariffs
(incl. lower in-quota tariffs on some agri-food products). While tariffs are eliminated or reduced
automatically according to the agreed schedule, NTB cost reductions depend more on the actual
implementation and enforcement of the various chapters in the Agreement.
Figure 15 Impact on Irish trade with individual Mercosur countries in 2035
Note: Impacts are reported as percent changes relative to the 2035 baseline scenario without the Agreement.
Source: Implement Economics in cooperation with Professor Joseph Francois
In 2035, the 17% increase in Irish exports to Mercosur translates into a net increase of almost €1,219 bn.
While the percent increase in Ireland’s exports to Brazil is lower than the increase in exports to the other
Mercosur countries, given the size of the Brazilian economy and larger existing base from which the
market growth in occurring, this translates into an increase of almost €906 mn (around 75% of the total
increase in Ireland’s exports to Mercosur in 2035).

33
The Agreement will also increase Irish exports to the EU (indirect impact) and is estimated to add
another €921 mn to Irish exports in 2035. One key driver of this benefit is the integration of Irish firms in
EU supply chains, as Irish suppliers to firms located in other EU countries will experience a surge in
demand when EU exports to Mercosur increase. Another key driver is increased demand for Irish
consumer products when the EU economy grows due to the macroeconomic gains from the EU-Mercosur
Agreement.
Part of the increase in Ireland’s exports to Mercosur countries and the EU will divert existing exports to
third countries (trade diversion), and the net contribution to Ireland’s exports in 2035 is, therefore,
estimated to €1,115 mn. The economic modelling assumes that potential barriers to changing the direction
of trade diversion (e.g. finding buyers, developing business relationships, breaking into the market,
language etc.) are overcome in the long-term. In Chapter 8, we explain that policy support may be needed
to help the uptake of the Agreement by Irish exporters.
The Agreement is also forecast to increase global Irish imports by €750 mn. This reflects an increase in
Irish imports from Mercosur of €378 mn and a replacement of imports from the EU worth €408 mn. Imports
from the rest of the world increase due to higher demand for supplies into Irish production and for final
consumer products.
Figure 16 Impact on global Irish trade in 2035 across trading partners
Note: Impacts are reported as percent changes relative to the 2035 baseline scenario without the Agreement.
Source: Implement Economics in cooperation with Professor Joseph Francois
Higher trade is forecast to add 0.13% to Irish GDP in 2035 (worth €547 mn). For the remaining EU
Member States, the EU-Mercosur Agreement is on average expected to increase GDP by 0.11%, and the
value of the Agreement for Ireland is, therefore, marginally above the EU average.5
The GDP forecast should be considered a lower bound estimate. First, it assumes that the Agreement will
not reduce trade barriers and NTBs for services. Given the low level of trade openness and difficult
business environments in the Mercosur countries, it is very difficult to quantify the extent to which existing
barriers currently restrict EU-Mercosur trade in services, and it is equally difficult to quantify the extent to
which the Agreement will succeed in reducing these barriers. As Irish exports to Mercosur are even more
concentrated in services than the EU average (services account for 82% of Irish exports and 42% of EU26
exports based on GTAP data), the GDP impact will be an even more conservative estimate of the impact
for Ireland than for other Member States. Section 4.2 provides a sensitivity test of this assumption.
5 The macroeconomic impacts in this study are in line with the European Commission’s own impact assessment (LSE 2020), which finds an increase in EU28 GDP of 0.10%.

34
Second, it does not take the horizontal issues described in Chapter 7 into consideration (e.g. SME growth
and development, access to public procurements, and protection of intellectual property and Geographical
Indications) in the macroeconomic modelling. These horizontal issues have the potential to open new
business areas that remain closed to third country competitors, which will give Irish and EU firms a clear
first-mover advantage in Mercosur.
Figure 17 Impact on GDP in Ireland and selected trading partners in 2035
Note: Impacts are reported as percent changes relative to the 2035 baseline scenario without the Agreement.
Source: Implement Economics in cooperation with Professor Joseph Francois
3.3 Impacts on Trade and Production across Sectors in Ireland
The increase in global Irish exports of €1,115 mn (or 0.2%) due to the Agreement is driven mainly by the
manufacturing sector (increase in exports of €1,246 mn). Within manufacturing, the largest percent
increases can be found in electrical equipment & machinery (1.6% increase) and computer, electronics &
optical products (1.2% increase). However, due to its economic size, the 0.6% increase in Irish exports of
chemicals (incl. pharma) translates into an increase in exports of €953 mn, which accounts for 76.5% of
the increase in global manufacturing exports.
In a ‘No policy change’ scenario, exports in the agri-food sector are expected to be reduced by €27 mn (or
0.1%). Exports of beverages are forecast to increase by 0.1% and dairy exports to increase marginally by
0.04%, but the increase in these two sectors will not be large enough to compensate for the reduction in
other agri-food sectors (most notably other processed foods where the 0.1% reduction amounts to a
reduction in exports of €25.5 mn).
As mentioned above, the modelling finds very limited impacts on Irish services exports (export reduction of
€104 mn) because potential reductions in services barriers due to the Agreement are not modelled
explicitly. A sensitivity test on trade in services is, therefore, provided in Section 4.2.
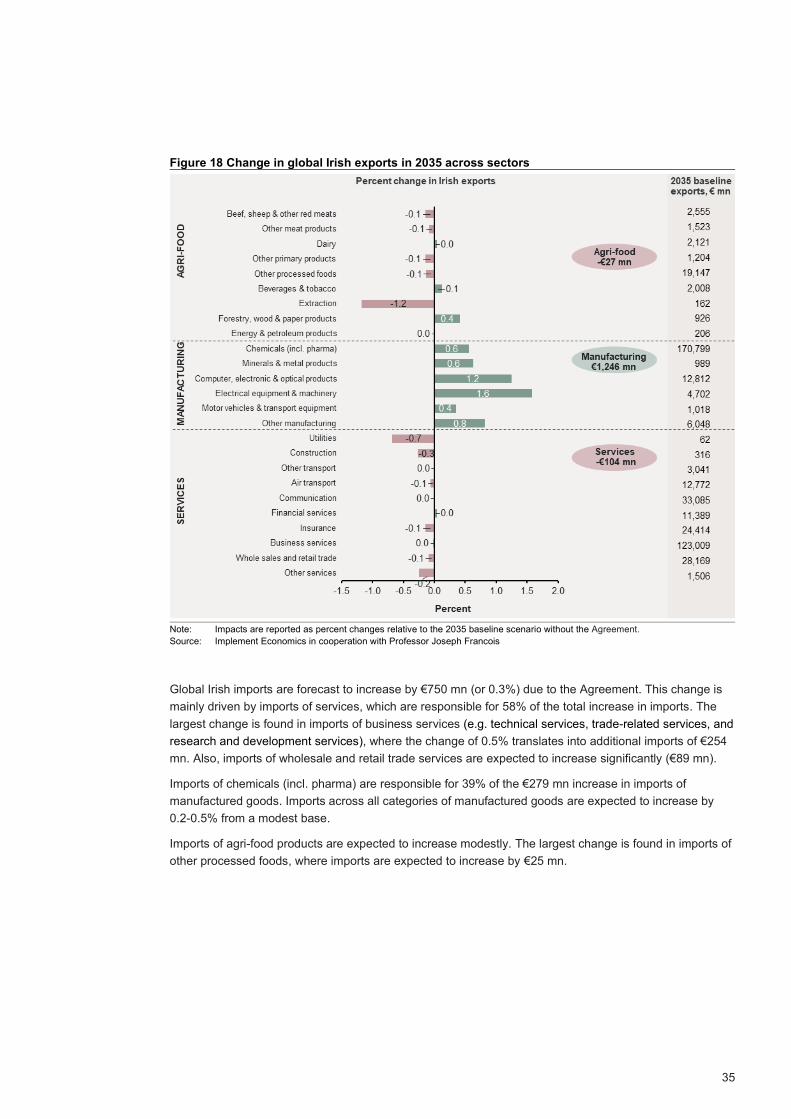
35
Figure 18 Change in global Irish exports in 2035 across sectors
Note: Impacts are reported as percent changes relative to the 2035 baseline scenario without the Agreement.
Source: Implement Economics in cooperation with Professor Joseph Francois
Global Irish imports are forecast to increase by €750 mn (or 0.3%) due to the Agreement. This change is
mainly driven by imports of services, which are responsible for 58% of the total increase in imports. The
largest change is found in imports of business services (e.g. technical services, trade-related services, and
research and development services), where the change of 0.5% translates into additional imports of €254
mn. Also, imports of wholesale and retail trade services are expected to increase significantly (€89 mn).
Imports of chemicals (incl. pharma) are responsible for 39% of the €279 mn increase in imports of
manufactured goods. Imports across all categories of manufactured goods are expected to increase by
0.2-0.5% from a modest base.
Imports of agri-food products are expected to increase modestly. The largest change is found in imports of
other processed foods, where imports are expected to increase by €25 mn.

36
Figure 19 Change in global Irish imports in 2035 across sectors
Note: Impacts are reported as percent changes relative to the 2035 baseline scenario without the Agreement.
Source: Implement Economics in cooperation with Professor Joseph Francois
Changes in Irish trade will impact Irish production differently across sectors. Resources will tend to shift
towards the manufacturing sector, where improved market access due to lower tariffs and NTBs opens
business opportunities for Irish firms. The marginally negative impact on services reflects redistribution of
resources towards manufacturing that becomes more attractive relative to services where potential
reductions in trade barriers from the Agreement are not included in the economic modelling (as it is very
difficult to quantify the size of existing barriers and estimate reductions from the Agreement). Value added
in the manufacturing sector is estimated to increase by €517 mn, driven mainly by chemicals (incl.
pharma). Due to its economic size, the 0.5% increase in production translates into a €417 mn increase in
value added.
In a ‘No policy change’ scenario, value-added in the agri-food sector is expected to be reduced by €15 mn,
where lower production in processed foods and beef, sheep & other red meats are the underlying drivers.
Production is expected to increase in dairy and the drinks industry. The next chapter provides a more
detailed discussion of opportunities and challenges for Ireland across sectors.

37
Figure 20 Change in Irish production in 2035 across sectors
Note: Impacts are reported as percent changes relative to the 2035 baseline scenario without the Agreement. Production is
measured as value-added.
Source: Implement Economics in cooperation with Professor Joseph Francois
3.4 Impacts on Irish Workers and Consumers
In the economic model, labour will shift to sectors where the Agreement will offer the largest improvements
in market access relative to other sectors (leaving total employment unchanged). Shifts in labour will cause
wages in these sectors to increase and benefit the types of workers (or skill groups) that are concentrated
in this sector.
Shifts in employment across sectors are forecast to be marginal and mirror changes in production across
sectors.6 Employment will generally increase in manufacturing and decrease slightly in the agri-food and
services sectors. These expected changes will materialise gradually towards 2035 and would reflect a ‘No
policy change’ scenario, where no mitigating actions by the Irish Government and its Agencies are
undertaken.
6 In the CGE model, total employment in the long term is determined by labour supply in the economy, which is not impacted by the entering into force of a trade deal. Impacts on employment in this type of model are therefore measured in terms of shifts across sectors and/or skill groups, where changes in the real wages are the underlying adjustment mechanism.

38
Figure 21 Change in Irish employment in 2035 across sectors
Note: Impacts are reported as percent changes relative to the 2035 baseline scenario without the Agreement.
Source: Implement Economics in cooperation with Professor Joseph Francois
Consumers in Ireland are expected to benefit from slightly lower prices and larger product variety across
all sectors although impacts on consumer prices appear to be marginal in line with the GDP and trade
impacts. The largest percent reductions in consumer prices can be found in the agri-food sector
(processed foods and primary agri-food products) and within motor vehicles & other transport equipment.
Given that prices on agri-food products are forecast to experience the largest cuts, income groups with
high expenditure on food will tend to benefit more from the Agreement because food accounts for a larger
share of their total income.

39
Figure 22 Change in consumer prices in 2035 across sectors
Note: Impacts are reported as percent changes relative to the 2035 baseline scenario without the Agreement.
Source: Implement Economics in cooperation with Professor Joseph Francois
Due to lower prices and increased economic activity, the Agreement is expected to have a positive but
small impact on real wages for all skill groups. While the average increase for the total economy is 0.11%,
wages in agriculture and manufacturing are forecast to increase more than average (0.23%) because the
more productive parts of the sector will grow while production will shrink in the less productive parts.
Figure 23 Change in real wages in Ireland across skill groups by 2035
Note: Impacts are reported as percent changes relative to the 2035 baseline scenario without the Agreement.
Source: Implement Economics in cooperation with Professor Joseph Francois

40
3.5 Concluding Remarks
Overall, it is forecasted that the EU-Mercosur Agreement will increase Ireland’s exports to Mercosur by 17%
and imports by 12% but from a relatively low base. The Agreement is also estimated to increase Irish exports
to the EU, and the full implementation of the Agreement will increase Ireland’s global exports by almost
€1,115 mn in 2035. The main driver is lower NTBs to exports of industrial products, but tariff reductions also
contribute substantially.
The Agreement is estimated to add €547 mn to Ireland’s GDP in 2035 (0.13% increase) and benefit Irish
workers through lower prices and increased product variety. For the remaining EU Member States, the EU-
Mercosur Agreement is on average expected to increase GDP by 0.11%, and the value of the Agreement
for Ireland is, therefore, marginally above the EU average.
The Agreement will also open new market for many manufacturing firms and create new jobs for Irish
workers within manufacturing. The results from the economic modelling in this study are a conservative
estimate of the total impacts that can be expected from the Agreement because the reduction of services
barriers and a range of horizontal issues are not included in the macroeconomic modelling.
The economic modelling assumes that potential barriers to changing the direction of trade diversion (e.g.
finding buyers, developing business relationships, breaking into the market, language etc.) are overcome in
the long-term. However, policy support may be needed to help the uptake of the Agreement by Irish
exporters.

41
4. Impacts on Trade Across Sectors in Ireland
The EU-Mercosur Agreement offers both opportunities and challenges to Irish firms, and impacts are
expected to be unevenly distributed across sectors. This chapter takes a closer look at impacts on exports
across sectors in Ireland. Section 4.1 describes some of the opportunities in the Mercosur market for Irish
goods exporters as shown by the economic modelling. Section 4.2 provides a sensitivity analysis for Irish
services exports and a supplementary qualitative analysis of Irish export opportunities in services. Section
4.3 describes impacts for Irish consumers and producers that benefit from lower prices on imported goods
and services from Mercosur. Finally, Section 4.4 assesses some of the challenges posed by the
Agreement to Irish beef and dairy producers in a ‘No policy change’ scenario.
4.1 Opportunities in the Mercosur Market for Irish Goods Exporters
Impacts on Irish exports to the Mercosur countries from the economic modelling can be used to identify
some of the market opportunities for Irish exporters that the EU-Mercosur Agreement offers relative to a
‘no agreement’ scenario. Irish goods exports to Mercosur are forecast to increase by €1,458 mn in 2035,
driven mainly by the manufacturing sectors where exports are expected to increase by €1,437 mn. This
increase is driven mainly by chemicals (104%); electrical equipment & machinery (184%); computer,
electronics & optical products (166%); and other manufacturing products (172%). Irish exports to Mercosur
are also forecast to increase for a range of agri-food sectors, such as the processed foods and drinks
industries. Market opportunities within these sectors are discussed below.
Figure 24 Impact on Irish goods exports to Mercosur in 2035 across sectors
Note: Impacts are reported as percent changes relative to the 2035 baseline scenario without the Agreement.
Source: Implement Economics in cooperation with Professor Joseph Francois
The Mercosur bloc also offers market opportunities in the services sectors that are not covered by the
economic modelling. When the policy scenario includes reductions in barriers to trade in goods, but leaves
barriers to trade in services unchanged, resources will tend to shift away from services into manufacturing.
The sensitivity analysis in Section 4.2 suggests that Irish services exports would increase by €118 mn if
the European Commission’s assumptions about reductions in trade barriers for services and sector
impacts are applied in an Irish context. Further details for some of the largest sectors in Irish exports to
Mercosur can be found below. Details have also been provided for some of the sectors that will be
challenged by the Agreement in a ‘No policy change’ scenario.

42
Chemicals & pharmaceutical products
This sector includes both the chemical industry (e.g. producers of rubber and plastics) and pharmaceutical
companies (e.g. producers of medicines and veterinary drugs). The top 3 products in Irish exports to
Mercosur are antisera & other blood fractions and modified immunological products; medicaments for retail
use; and human & animal blood prepared for therapeutic uses. Exports of these products have on average
increased by 14% annually from 2015 to 2019, a growth mainly driven by exports of antisera and other
blood fractions.7
Current Irish exports to Mercosur amount to €1,022 mn, driven mainly by some large multinational
pharmaceutical firms with significant value added in Ireland.8 The cut in tariffs from 9.3% to 2.9% foreseen
in the EU-Mercosur Agreement is estimated to increase Irish exports by 104% and add €1,062 mn to Irish
exports to Mercosur. Chemicals and pharmaceutical products alone, therefore, account for 87% of the total
boost to Irish exports to Mercosur. From a Mercosur perspective, the Agreement is likely to give
consumers access to a larger variety of medicine at lower prices.
The economic modelling tends to underestimate the export potential for this sector, because some of the
cross-cutting issues included in the Agreement will make it easier for Irish firms to do business in the
Mercosur countries:
• The chemical and pharmaceutical industry is often heavily regulated by national authorities (e.g.
health regulations), and trade flows both reflect the cross-border exchange of goods as well as
intellectual property coverage. Besides the gains from the lower tariffs and NTBs included in the
economic modelling, Irish firms in this sector will also benefit from better protection of intellectual
property.
• None of the Mercosur countries are signatories of the WTO Government Procurement
Agreement. Consequently, many Irish chemical and pharmaceutical companies are excluded
from participating in public tenders, e.g. to supply the public health systems. The EU-Mercosur
Agreement will offer opportunities for EU companies to participate, bid, and compete in
procurement processes, e.g. to supply public health systems in Mercosur with vaccines and
medicines (see Section 7.3). Health expenditures in the Mercosur countries amount to 4-6% of
GDP, and with third country providers still being excluded from public tenders, this part of the
Agreement could provide a significant market access advantage for EU pharmaceutical
companies.9
7 Growth in exports is measured by the Compounded Annual Growth Rate (CAGR). CAGR is calculated as the average year-over-year growth rate during 2015-2019.
8 The trade flows reported in this chapter are based on GTAP10 data to match the underlying data in the economic modelling. CSO data and GTAP data will not always match entirely due to different measuring methods. One primary reason for divergence between CSO data and GTAP data is that CSO data (and EU data in general) reflect BOPM6 definitions of trade, which are ownership rather than location-based definitions. As the economic modelling applies actual production using Irish value added, and in turn based on real cross-border trade flows, we will defer to the GTAP data where we can, since these reflect underlying input-output data and actual cross-border flows. This is necessary to correctly model changes in trade policy and changes between policy and domestic economic activity (employment). Another explanation for differences between GTAP and CSO data is that the national data underlying the GTAP database are adjusted to ensure that the global accounts sum to zero.
9 LSE (2020, p. 176) concludes that ‘the effects of the agreement on procurement are likely to be larger in sectors such as chemicals and pharmaceuticals and on machinery’. Health care expenditures can be found in LSE (2020, 125).

43
• Special initiatives towards smaller companies described in the SME chapter combined with lower
barriers to trade and establishments may also make it more attractive for smaller pharmaceutical
firms to start exporting to Mercosur and/or establish a local presence in the region.
Computer, electronics & optical products
Computer, electronics & optimal products cut across several industries, and the top 3 products in Ireland’s
exports to Mercosur within this product category are parts & accessories for machines, automatic data
processing machines, and telecommunication equipment. Irish exports of these products have decreased
by 9% in the period 2015-2019, which illustrates that the Mercosur market is highly competitive and that
diverging standards and heavy regulation in the Mercosur countries make it difficult for Irish firms to
access these markets. Total Irish exports to Mercosur in 2035 are expected to amount to €125 mn without
the Agreement, and lower trade barriers due to the EU-Mercosur Agreement are forecast to increase Irish
exports in this sector by 166% (worth €207 mn in additional Irish exports to Mercosur in 2035).
Electrical equipment & machinery
This sector covers a broad range of products within electrical equipment (e.g. sound recorders and
television image) and machinery (e.g. automatic data-processing machines, telecommunications
equipment, aeroplanes, centrifugal pumps, and mechanical appliances). The top 3 products in Irish
exports are heating & cooling equipment; mechanical handling equipment; and pumps, gas compressors &
fans. Exports of these products have on average increased by 26% annually from 2015 to 2019.
Expected Irish exports in this sector in 2035 amount to €44 mn, and the cut in tariffs from 12.5% to 1.6% in
combination with lower regulatory barriers are forecast to increase Irish exports by 184% and add €80 mn
to Irish exports to Mercosur. Some stakeholders emphasise the potential for Irish exports of engineering
transport equipment, electrical & electronic equipment, and other machinery & equipment across main
segments such as aerospace, agricultural machinery, and electric power systems.
Some stakeholders highlight that the globally competitive Irish firms within this sector already export to
Mercosur, and these firms have successfully navigated complex regulations and have been certified to
meet the national standards in the individual Mercosur countries. For these firms, convergence towards
EU standards will reduce compliance costs but will also make it easier for new EU competitors to enter the
Mercosur market. For new exporters, it will be important that there are enough locally accredited labs and
testing facilities in the EU to facilitate the certification of Mercosur standards by new Irish exporters.

44
Some stakeholders also point out that Irish firms located in the Mercosur bloc in many cases import
intermediate goods from Ireland (or some other EU country) and will benefit from lower tariffs on such
imports.
Processed foods
Processed foods is the largest agri-food sector and is projected to account for 42% of Ireland’s total value
added in the agri-food sector in 2035 (see Figure 20 in the previous chapter). The top 3 products in Irish
exports to Mercosur are malt extract (for example used for brewing beer) & food preparations, other food
preparations (mixed group of processed consumer food products), and food preparations for infant use
(e.g. weaning foods and processed cereal-based baby foods). Exports of these products have on average
increased by 35% annually from 2015 to 2019.
High tariffs currently limit Irish exports of processed foods to the Mercosur countries, and exports in 2035
are expected to be €23 mn under the existing trade regime. The EU-Mercosur Agreement will eliminate
most tariffs, and the average tariff facing Irish exporters in this sector will fall from 15.7% to 0.7%. Lower
trade barriers and higher GDP in Mercosur due to the Agreement are expected to boost Irish processed
foods exports by 64% and add €14.8 mn to Irish foods exports to Mercosur in 2035.
Beverages10
Irish producers in the drinks industry have become increasingly internationally competitive, particularly
Irish spirits. Global Irish exports of beverages in the period 2015-2018 have on average grown by 3%
annually (from €1.3 bn to €1.4 bn), and global exports in 2035 are forecast to be €2 bn. A recent study
(Drinks Ireland 2021) finds that Irish whiskey was the fastest growing spirits category of the past decade,
with 140% volume growth (from 60 mn bottles in 2010 to more than 144 mn bottles in 2020). Global Irish
whiskey exports reached €890 mn in 2019, and Irish whiskey is now being sold in 140 markets globally.
Before the Covid-19 pandemic, 1,640 persons were directly employed in whiskey production.
Without the EU-Mercosur Agreement, Irish exports of beverages to Mercosur in 2035 are estimated to
amount to €4 mn. The top 3 products in Irish exports to Mercosur are spirits & other distilled alcoholic
beverages, whiskies, and beer made from malt (including ale, stout, and porter). Irish exports of these
products to Mercosur have on average decreased by 11% annually from 2015 to 2019, suggesting that
Irish spirits have difficulties finding a foothold under the current trade regime.
10 Tobacco is in principle included in this product category but accounts for less than 1% of total Irish exports of beverages & tobacco. Impacts in this product category therefore relate to the Irish drinks industry.
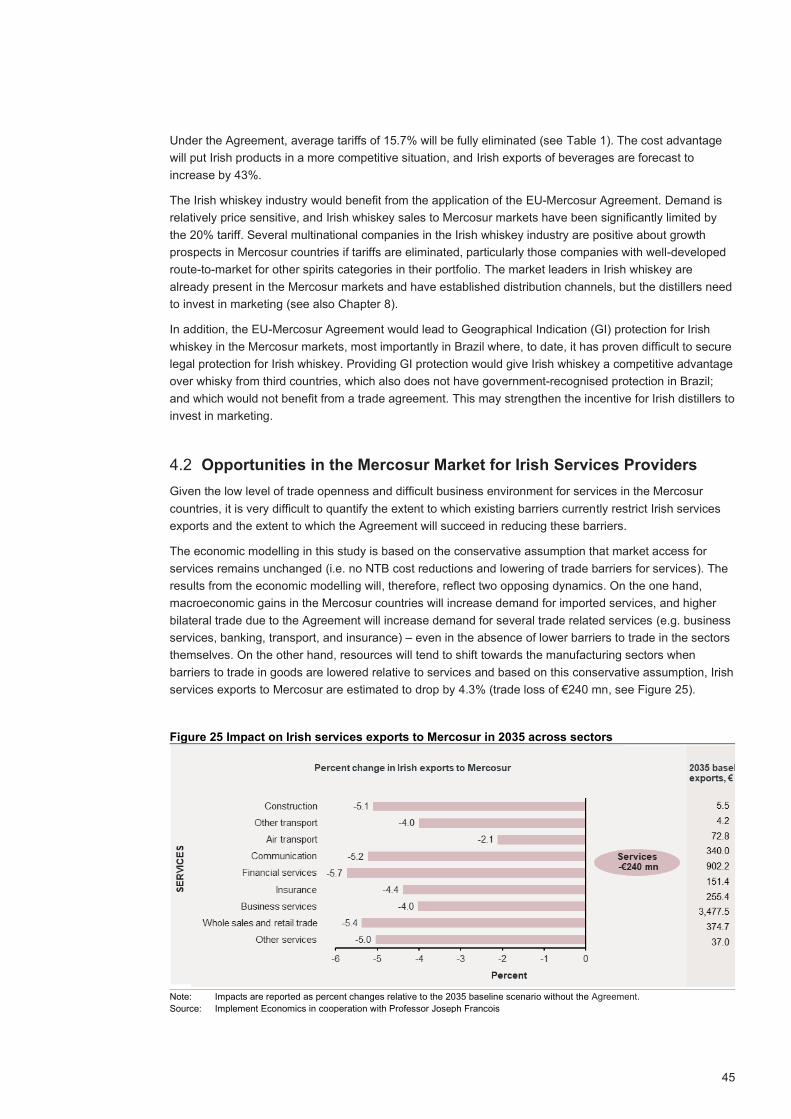
45
Under the Agreement, average tariffs of 15.7% will be fully eliminated (see Table 1). The cost advantage
will put Irish products in a more competitive situation, and Irish exports of beverages are forecast to
increase by 43%.
The Irish whiskey industry would benefit from the application of the EU-Mercosur Agreement. Demand is
relatively price sensitive, and Irish whiskey sales to Mercosur markets have been significantly limited by
the 20% tariff. Several multinational companies in the Irish whiskey industry are positive about growth
prospects in Mercosur countries if tariffs are eliminated, particularly those companies with well-developed
route-to-market for other spirits categories in their portfolio. The market leaders in Irish whiskey are
already present in the Mercosur markets and have established distribution channels, but the distillers need
to invest in marketing (see also Chapter 8).
In addition, the EU-Mercosur Agreement would lead to Geographical Indication (GI) protection for Irish
whiskey in the Mercosur markets, most importantly in Brazil where, to date, it has proven difficult to secure
legal protection for Irish whiskey. Providing GI protection would give Irish whiskey a competitive advantage
over whisky from third countries, which also does not have government-recognised protection in Brazil;
and which would not benefit from a trade agreement. This may strengthen the incentive for Irish distillers to
invest in marketing.
4.2 Opportunities in the Mercosur Market for Irish Services Providers
Given the low level of trade openness and difficult business environment for services in the Mercosur
countries, it is very difficult to quantify the extent to which existing barriers currently restrict Irish services
exports and the extent to which the Agreement will succeed in reducing these barriers.
The economic modelling in this study is based on the conservative assumption that market access for
services remains unchanged (i.e. no NTB cost reductions and lowering of trade barriers for services). The
results from the economic modelling will, therefore, reflect two opposing dynamics. On the one hand,
macroeconomic gains in the Mercosur countries will increase demand for imported services, and higher
bilateral trade due to the Agreement will increase demand for several trade related services (e.g. business
services, banking, transport, and insurance) – even in the absence of lower barriers to trade in the sectors
themselves. On the other hand, resources will tend to shift towards the manufacturing sectors when
barriers to trade in goods are lowered relative to services and based on this conservative assumption, Irish
services exports to Mercosur are estimated to drop by 4.3% (trade loss of €240 mn, see Figure 25).
Figure 25 Impact on Irish services exports to Mercosur in 2035 across sectors
Note: Impacts are reported as percent changes relative to the 2035 baseline scenario without the Agreement.
Source: Implement Economics in cooperation with Professor Joseph Francois

46
By contrast, the European Commission’s own impact assessment reported in Figure 26 finds that EU
services exports to Mercosur should on average be expected to increase by 2.1%. As a sensitivity test, we
calculate how much Irish exports would increase under the same assumptions regarding trade barriers for
services and similar sector impacts as in the European Commission’s impact assessment. If Irish exports
experience the same percent increase, Irish services exports should be expected to increase by €118
mn.11
Figure 26 Sensitivity analysis based on estimates on EU services exports
Note: Impacts are based on the assumption that NTBs for services are reduced by 10% in the ambitious scenario (same reduction
as for industrial goods) and the reduction of trade barriers for services is equivalent to a trade cost reduction of 3%. Impacts
are relative to 2032 baseline exports. The sector aggregation in LSE (2020) is not identical to the sectors applied in this study,
which means that the sum of the individual sector changes does not completely match the total change. The category
‘Transport’ includes Air transport and Other transport; ‘Telecoms, business services’ includes Communication; ‘Financial
services’ includes Financial services, Insurance, and Whole sales and retail trade; and ‘Other services’ includes Other
business services, Trade and distribution, and Other services.
Source: Implement Economics based on LSE (2020)
While Ireland’s services sector shows a relatively strong export performance in the Mercosur market with
an average annual growth of 23% from 2010 to 2018 (see Figure 4), the composition of trade between
sectors show that exports are low in areas where Ireland is generally internationally competitive. Global
Irish service exports within ‘Telecommunications, computers and information’, ‘Technical, trade-related
and other business services’ and ‘Charges used for intellectual property’ have grown substantially the past
years. Whereas Irish services exports to Mercosur have only seen performance growth within ‘Technical,
trade-related and other business services.’12 Some stakeholders point to factors that limit Irish exports in
these services sectors. First, close interactions with customers are required for many services providers.
Natural trade barriers (e.g. language, culture, and distance as described in Chapter 1) can significantly
limit cross-border exports and constrain the mode of supply to establishments. Since the Mercosur
countries also pose significant barriers on commercial presence (see Section 2.4), some of the markets for
services are as good as closed for Irish and other services providers.
Second, regulatory barriers (e.g. passporting13 and skills recognition) currently limit opportunities for Irish
firms to provide services in Mercosur and compete against local firms on equal terms. These trade barriers
can be particularly prohibitive because many of the Irish services firms are SMEs.
The Agreement is expected to reduce some of these barriers and offer new business opportunities for Irish
service providers for all modes of supply. Across sectors, the Agreement will:
11 This is a partial analysis based on the assumption that there are abundant resources available in the economy. Since the CGE model assumes that all resources are fully utilised, the €118 mn in additional services exports in the sensitivity analysis cannot be added to the increase in goods and agri-food exports.
12 Due to discretion Irish service export data to Mercosur within some sectors is missing for some or all years. It is estimated that the missing data would not change the conclusions, because these sectors make out a very small share of Irish service exports to Mercosur.
13 Financial companies established and authorised in one EU country can apply for the right to provide defined services across the EU or to open branches in other countries, with only a small number of additional requirements. This authorisation is a firm's financial services ‘passport’. Passporting eliminates the red tape associated with gaining authorisation from each country, a process which can be lengthy and costly for a business.

47
• Improve legal certainty and level the playing field between local and EU firms for all modes of
supply through the removal of unnecessary discriminatory obstacles.
• Provide new opportunities to invest through establishment in both services and manufacturing
sectors through provisions on the movement of professionals for business purposes, something
that, for example, will allow Irish companies to post managers or specialists in their subsidiaries in
Mercosur countries.
These initiatives will make it easier for Irish firms to provide services and establish footholds in the
Mercosur market. In particular, the Agreement improves market access in several services sectors that are
highly underrepresented in Irish exports to Mercosur compared to Ireland’s global exports. Irish service
providers may benefit from:
• A more level playing field for telecommunications, namely through modernised sector regulation
(such as licensing, management of scarce resources, or universal service obligations) as well as
initiatives to prohibit anti-competitive practices. The Agreement also includes a set of consumer-
oriented provisions, such as those pertaining to mobile roaming or confidentiality of
communications.
• Specific definitions, exceptions, and disciplines on new financial services, recognition, self-
regulatory organisations, payment and clearing systems, and transparency included in the
Agreement that reduce uncertainty and discriminatory practices.
Stakeholders confirm that the Agreement will improve market access and has the potential to increase
Irish services exports to Argentina and Brazil, particularly within education services, digital technologies
(telecommunications & software licences), and engineering services. Irish exports of educational services
to Brazil have been stimulated by the ‘Science without Borders’ scheme described in Box 1.
Box 1 The ‘Science without Borders’ scholarship scheme
The Brazilian student mobility programme - Science without Borders – was a scholarship scheme that
started in April 2011. Over four years, it sent nearly 100,000 Brazilians abroad to universities for
primary or master’s degrees or doctorates. Circa 3,300 Brazilians studied in 22 Irish Higher Education
Institutions (HEIs) under the programme Science without Borders. Students received scholarship
payments and their university fees were paid by the Brazilian Government. The direct value of these
scholarships to the Irish economy is estimated at over €72.6 mn over that period (fees paid to Irish
institutions and spending allowances for students). For the 2014 call, Ireland ranked as the fourth most
popular destination in terms of candidates who have selected Ireland as a preferred destination to
study. The Science without Borders programme was suspended in 2015 due to budget cuts.
After reviewing and adjusting the scholarship scheme, a new programme has been developed –
CAPES PRINT – Programme for Institutional Internationalisation of Brazilian HEIs. Ireland is on the
short list of 25 countries qualified for the programme. PRINT sets out a plan for the period 2018-2022
to internationalise Brazilian HEIs & research institutes, with R$300 mn to be invested annually over the
four years. 36 Brazilian universities were awarded funding, and 21 of these specifically listed Ireland as
preferred partner in their proposal.
The COVID-19 pandemic has larger effects in education than almost any other sector, with higher
education and research activities taking place primarily in online form. With travel restricted and
asynchronous health risks in different countries, international education is at a standstill except in
distance learning form.
Source: Implement Economics based on interview with Enterprise Irelands and Brazil Market Brief
However, some stakeholders also emphasise that natural trade barriers will continue to limit services
exports and that several other barriers to cross-border investments that are not removed by the
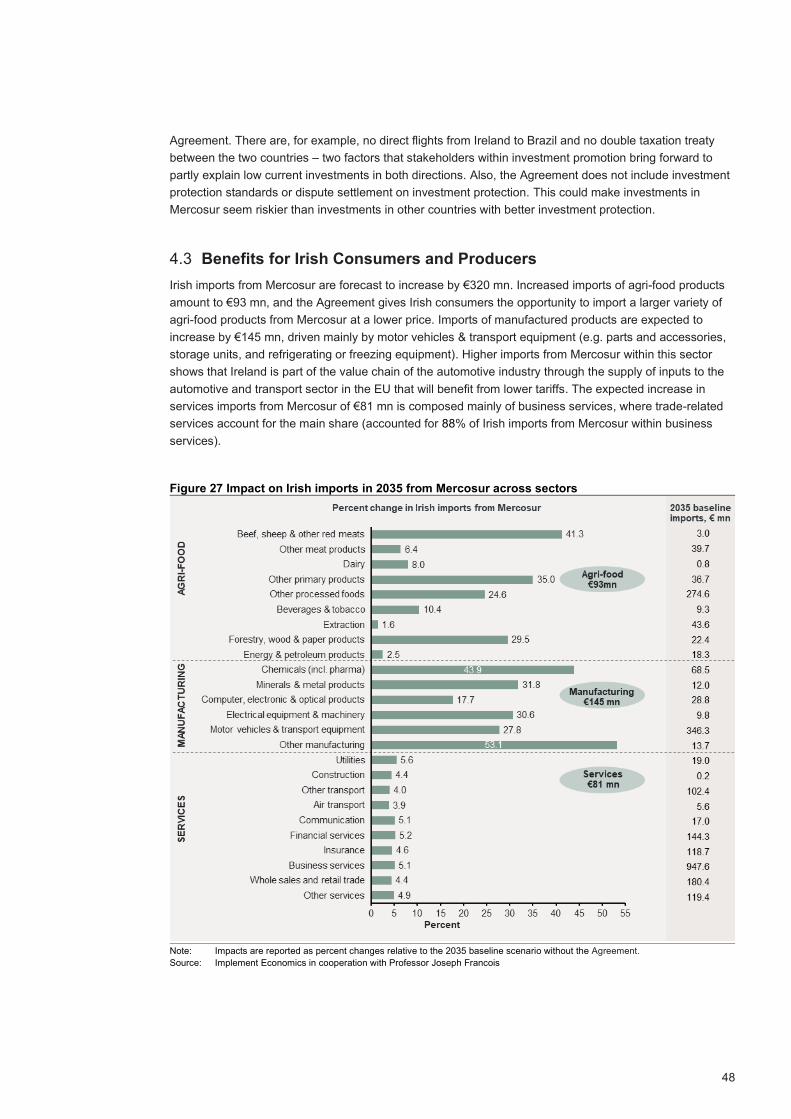
48
Agreement. There are, for example, no direct flights from Ireland to Brazil and no double taxation treaty
between the two countries – two factors that stakeholders within investment promotion bring forward to
partly explain low current investments in both directions. Also, the Agreement does not include investment
protection standards or dispute settlement on investment protection. This could make investments in
Mercosur seem riskier than investments in other countries with better investment protection.
4.3 Benefits for Irish Consumers and Producers
Irish imports from Mercosur are forecast to increase by €320 mn. Increased imports of agri-food products
amount to €93 mn, and the Agreement gives Irish consumers the opportunity to import a larger variety of
agri-food products from Mercosur at a lower price. Imports of manufactured products are expected to
increase by €145 mn, driven mainly by motor vehicles & transport equipment (e.g. parts and accessories,
storage units, and refrigerating or freezing equipment). Higher imports from Mercosur within this sector
shows that Ireland is part of the value chain of the automotive industry through the supply of inputs to the
automotive and transport sector in the EU that will benefit from lower tariffs. The expected increase in
services imports from Mercosur of €81 mn is composed mainly of business services, where trade-related
services account for the main share (accounted for 88% of Irish imports from Mercosur within business
services).
Figure 27 Impact on Irish imports in 2035 from Mercosur across sectors
Note: Impacts are reported as percent changes relative to the 2035 baseline scenario without the Agreement.
Source: Implement Economics in cooperation with Professor Joseph Francois
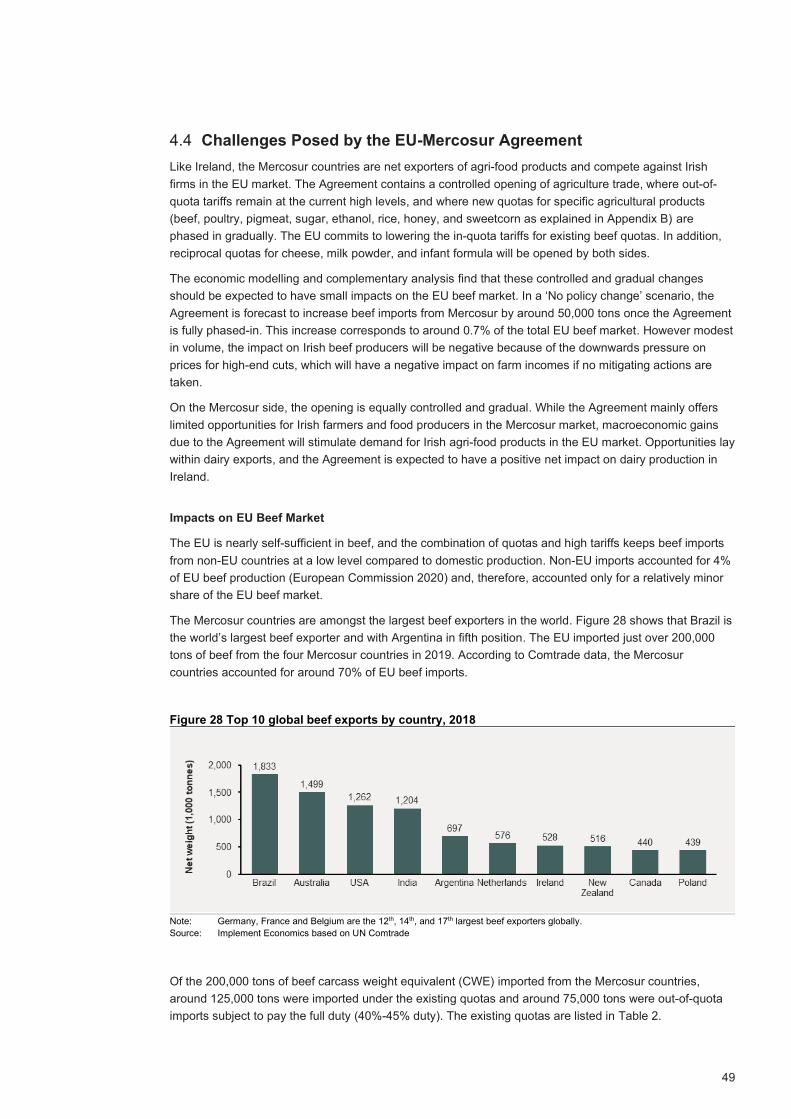
49
4.4 Challenges Posed by the EU-Mercosur Agreement
Like Ireland, the Mercosur countries are net exporters of agri-food products and compete against Irish
firms in the EU market. The Agreement contains a controlled opening of agriculture trade, where out-of-
quota tariffs remain at the current high levels, and where new quotas for specific agricultural products
(beef, poultry, pigmeat, sugar, ethanol, rice, honey, and sweetcorn as explained in Appendix B) are
phased in gradually. The EU commits to lowering the in-quota tariffs for existing beef quotas. In addition,
reciprocal quotas for cheese, milk powder, and infant formula will be opened by both sides.
The economic modelling and complementary analysis find that these controlled and gradual changes
should be expected to have small impacts on the EU beef market. In a ‘No policy change’ scenario, the
Agreement is forecast to increase beef imports from Mercosur by around 50,000 tons once the Agreement
is fully phased-in. This increase corresponds to around 0.7% of the total EU beef market. However modest
in volume, the impact on Irish beef producers will be negative because of the downwards pressure on
prices for high-end cuts, which will have a negative impact on farm incomes if no mitigating actions are
taken.
On the Mercosur side, the opening is equally controlled and gradual. While the Agreement mainly offers
limited opportunities for Irish farmers and food producers in the Mercosur market, macroeconomic gains
due to the Agreement will stimulate demand for Irish agri-food products in the EU market. Opportunities lay
within dairy exports, and the Agreement is expected to have a positive net impact on dairy production in
Ireland.
Impacts on EU Beef Market
The EU is nearly self-sufficient in beef, and the combination of quotas and high tariffs keeps beef imports
from non-EU countries at a low level compared to domestic production. Non-EU imports accounted for 4%
of EU beef production (European Commission 2020) and, therefore, accounted only for a relatively minor
share of the EU beef market.
The Mercosur countries are amongst the largest beef exporters in the world. Figure 28 shows that Brazil is
the world’s largest beef exporter and with Argentina in fifth position. The EU imported just over 200,000
tons of beef from the four Mercosur countries in 2019. According to Comtrade data, the Mercosur
countries accounted for around 70% of EU beef imports.
Figure 28 Top 10 global beef exports by country, 2018
Note: Germany, France and Belgium are the 12th, 14th, and 17th largest beef exporters globally.
Source: Implement Economics based on UN Comtrade
Of the 200,000 tons of beef carcass weight equivalent (CWE) imported from the Mercosur countries,
around 125,000 tons were imported under the existing quotas and around 75,000 tons were out-of-quota
imports subject to pay the full duty (40%-45% duty). The existing quotas are listed in Table 2.

50
Table 2 Estimated in and out of quota Mercosur imports, CWE thousand tons, 2019
Fresh Frozen Total
In quota 65 60 125
Out of quota 60 15 75
Total 125 75 200
Memo item: Allocation across quotas
Total quota for all non-EU countries
(pre-Brexit) Mercosur share
Mercosur in-quota imports
GATT frozen quota 71 82% 58
GATT frozen beef for processing ‘A’ 65 1.5% 1
Hilton HQB 63 61% 38
Grain-fed (‘hormones’) 58 49%* 28
Total in-quota 125
Note: Product weight has been multiplied by 1.3 to convert to CWE. * Argentina and Uruguay are the only Mercosur countries to
benefit from this quota.
Source: Compilation done in collaboration with Professor Alan Matthews
Under the Agreement, the EU has committed to an additional quota of 99,000 tons CWE. The new quota
will be phased in over a six-year period with a 7.5% in-quota tariff, and the out-of-quota tariff remains
unchanged from the current level (40-45%). Furthermore, the additional quota is divided with 55% for
"fresh“ beef and 45% for "frozen" beef. It has also been agreed that the in-quota duty rate on the existing
Hilton High Quality Beef (HQB) quota will be reduced from 20% to 0%.
While the size of the new TRQ is small relative to overall EU production and consumption, around 1% of
the market, some stakeholders in our consultations have expressed concerns about the potential impacts
for the Irish beef sector if more beef is being imported from Mercosur.
To understand the impact on Irish beef farmers, this study has assessed the impacts of the Agreement on
the EU market and how much additional import can be expected to arise from these new quotas and
reductions of existing in-quota tariffs. When assessing these impacts, two aspects are important to note:
• Same high out-of-quota tariff both before and after the agreement. Some of the Mercosur
beef quantities are imported to the EU at the out-of-quota tariff rate, and the Agreement will
maintain the same out-of-quota tariff. This implies that if beef import volumes after the Agreement
continue to exceed the sum of the existing and new quota, the marginal tariff on EU beef imports
from Mercosur will remain unchanged. This implies that there will be no change in the so-called
marginal tariff rate on beef imports.
• Lower average tariffs on beef imports. The new quota of 99,000 tons with a 7.5% tariff will be
used to shift some of the current 75,000 tons of out-of-quota imports to in-quota imports, and the
reduction of existing in-quota tariffs will imply a lower average tariff paid on beef imports from the
Mercosur. As current quotas are not fully utilised, the lowering of the in-quota tariff will make it
more attractive to fully utilise the existing quotas. The reduction in average tariffs will result in a
so-called ‘rent’, which will be shared between consumers, importers, and exporters.
To assess the likely impact on EU beef imports from the Mercosur, Professor Alan Matthews has reviewed
the details of the quota and current volumes at a detailed level. The quantitative assessment is based on
two underlying assumptions. Firstly, it is expected that Mercosur exporters will find the existing quotas
more attractive to utilise because of the zero in-quota tariff. Secondly, it is expected that existing out-of-
quota imports of specific products will in the future be imported under the new quota. However, shifting
existing volumes between quotas with lower tariffs will create quota rent, but not give rise to any additional
import. Consequently, the size and structure of quotas limit the extent to which new trade can occur before
the high out-of-quota tariff sets in.

51
As detailed in Table 3, our estimate is that the Agreement will increase EU beef imports from the Mercosur
countries by around 53,000 tons CWE (after fully phased in over six years) composed of:
• 9,000 tons high-quality beef imported under the existing Hilton HQB quota (Brazil)
• 34,000 tons frozen beef imported under the new TRQ
• 10,000 tons fresh beef imported under the new TRQ
Table 3 Expanded market access opportunities under the EU-Mercosur Agreement
Trade regime FTA change Existing trade Future trade Additional
trade (tons CWE)
Hilton HQB quota
Tariff rate reduced from 20% to 0%
All four Mercosur exporters have specific quotas, but Brazil currently fills less than half its quota, i.e. 4,000 tons of 13,000 tons CWE (10,000 tons net weight)
The reduction in the in-quota tariff will make use of this quota more attractive for Brazil, we assume it will make full use in future
9,000
Frozen beef Additional quota of 44,000 tons CWE frozen beef at 7.5% tariff
Current over-quota exports of frozen beef 10,000 tons CWE
We assume these over-quota exports will in future be exported under the Mercosur quota
34,000
Fresh beef Additional quota of 55,000 tons CWE fresh beef at 7.5% tariff
Current over-quota exports of fresh beef 45,000 tons CWE
We assume these over-quota exports will in future be exported under the Mercosur quota
10,000
Grain-fed beef quota
EU-US agreement August 2019 to reserve 35,000 tons of overall quota for the US
Argentina and Uruguay currently benefit from access under this quota and will see their exports under this quota reduced
These displaced exports will likely now enter the EU under the new TRQ, reducing its ability to generate new trade
0
Total 53,000 Note: The additional Brazilian imports of Hilton HQB are based on 2019 in-quota imports of 4,000 tons CWE. Actual 2019 over-
quota frozen beef imports amounted to 18,000 tons CWE and over-quota imports of fresh beef in 2019 amounted to 57,000
tons CWE.
Source: Compilation done in collaboration with Professor Alan Matthews

52
We have calculated the total saving in terms of tariffs (TRQ rent) from the above picture to amount to €340
mn. How this tariff saving will be distributed along the beef value chain – between the EU consumers,
importing companies, the exporting slaughterhouses, and the suppliers of beef to these slaughterhouses -
will depend on the relative bargaining strength of these actors which, in turn, will be influenced by the
import licensing mechanism that will be used.
Some of these savings will be taken as increased profits by the importing companies and export
slaughterhouses, some may be reflected in increased prices paid to Mercosur beef producers. To the
extent that the latter occurs, this would provide a small stimulus for increased cattle production in the
Mercosur countries. However, given the expected leakages along the supply chain, the size of any
stimulus effect is likely to be small.
Impacts on Irish Beef Producers
On the market response, the likelihood that these additional imports will consist mainly of high-value
premium cuts needs to be factored in. A drawback of CGE models is that they do not take such differences
in quality into consideration. Beef is treated as a homogenous commodity of uniform quality and,
consequently, the potential impact of increased imports consisting of high-quality cuts only cannot be
assessed in these models. Complementary analysis of the quality aspects is, therefore, needed to address
potential impacts of the Agreement on the economic viability of Irish beef producers in a ‘No policy change’
scenario.
We make an upper-bound assumption that all these additional imports will consist of high-quality beef cuts
that will compete in the high-end of the EU beef market. As expected, we estimate that there will be a
significant impact on the prices obtained for high-end cuts, which might fall by around 5% (with a range of
3.3%-7.2% based on a sensitivity analysis for different values of the responsiveness of EU beef supply
and demand to changes in prices). In addition, beef production would fall by 1.5% in the EU, so producer
returns in the high-end market would fall by 6.3% (4.7%-8.6%). This fall in beef production, however, will
result in a compensating increase in the price for lower-quality cuts – demand remains the same, but
supply is reduced.
As a result, overall, producer returns are forecast to be reduced by around 2% (1.9%-2.3%) due to the
increase in imports of high-quality beef cuts facilitated by the new Mercosur TRQ. This would translate into
a maximum reduction in the value of Irish beef output of between €44 and €55 mn, compared to the total
value of Irish beef output of between €2.4 bn (in 2017) and €2.3 bn (in 2019). Consequently, our economic
modelling shows that beef production in Ireland should be expected to fall by a maximum of 0.08%.14
This is a high-end estimate because:
• Over-quota imports in 2019 already exceeded the baseline assumed here, and over-quota
imports have been on a slowly rising trend over the past decade.
• Although Argentinian and Uruguayan beef will lose some of their quota access under the Grain-
fed beef quota (see Table 3) given the separate EU-US deal ring-fencing a higher share of that
quota for US exporters alone, the estimate of additional imports does not consider that exports
displaced from this quota will instead most likely enter under the new TRQ (further limiting the
extent to which the new TRQ will lead to additional imports).
The realisation of this upper bound estimate is furthermore based on the presumption that Mercosur
exchange rates remain competitive, and that the EU market continues to be attractive relative to other
main Mercosur beef importers (such as China).
14 In comparison, the Commission’s impact assessment (LSE 2020) finds that EU beef imports are forecast to increase by 128,000 tons CWE in the ambitious scenario. The LSE study found that EU beef output should be expected to fall by 1.2%. However, this study does not take account of the role of TRQs. Instead, it models the economic impact of the beef provisions as a 30% reduction in the MFN tariffs applied to beef imports.
53
Dairy Products
The Mercosur countries account for 2% of EU dairy imports.15 The EU is a key market for Irish exports of
these agri-food products (the EU accounts for 41% of Irish dairy exports16), and Irish exporters in this
sector may be challenged by the improved market access for Mercosur competitors. The dairy sector is
also exposed to the UK and will need to diversify trade after Brexit (Copenhagen Economics 2018) as the
UK opens up its markets to other third country exports.
53% of total Irish dairy exports went to the EU, US, and Middle East in 2019. Latin America and Mercosur
are not priority markets (accounted only for 0.3% of Irish exports in 2019).17 Irish global dairy exports have
grown by 14% yearly between 2015-2019, and an increasing number of dairy producers are internationally
competitive (e.g. Kerry, Ornua, and Glanbia).
Based on the economic modelling, the potential for increasing dairy exports to the Mercosur market is
limited. Bilateral exports to Mercosur are projected to fall by 8.1% but from a very low base (dairy exports
in the 2035 baseline to Mercosur amount to €0.2 mn equal to 0.01% of global Irish dairy exports).
Nevertheless, production in dairy is estimated to increase by 0.1% due to higher exports to the EU (see
Figure 20 in the previous chapter). The positive macroeconomic impacts of the Agreement in the other EU
Member States (higher GDP and wages) will stimulate demand for dairy products, and the increase in
dairy exports to the EU is expected to be large enough to compensate for lower exports to Mercosur and
potential import competition from Mercosur in the EU market.
The limited new market opportunities offered by the EU-Mercosur Agreement is confirmed by dairy
stakeholders who express disappointment with the dairy offer in the Agreement. These stakeholders point
out that there are opportunities for increasing exports of high-end cheese, butter, and milk powder under
the new TRQ and lower tariff rate, but the size of the TRQ is small. It is emphasised that the TRQ for
cheese amounts to one cheese factory producing 100,000 tons. Since the Japan and South Korea deals
were found to be more generous, these markets will stay more attractive than the Mercosur market.
Considering that Mercosur is a difficult market with high natural trade barriers, stakeholders expect that
Mercosur will not be a priority market for dairy exports in the shorter term.
4.5 Concluding Remarks
The EU-Mercosur Agreement is forecast to increase Irish net exports to Mercosur by €1,219 mn in 2035,
but there are large sectoral differences. The Agreement holds the potential to increase Irish manufacturing
exports to Mercosur by €1,437 mn and agri-food exports by €21 mn, mainly through lower tariffs. New
business opportunities in Mercosur will mainly emerge in chemicals (incl. pharma); computer, electronics &
optical products; electrical equipment & machinery; processed foods; and beverages.
The Agreement will also improve legal certainty and level the playing field between local and EU service
provides for all modes of supply through the removal of unnecessary discriminatory obstacles.
Furthermore, the Agreement will provide new opportunities to invest through establishment in both
services and manufacturing sectors through provisions on the movement of professionals for business
purposes, something that, for example, will allow Irish companies to post managers or specialists in their
subsidiaries in Mercosur countries.
Based on the same assumptions and sector impacts as in the European Commission’s own impact
assessment, we find that the Agreement has the potential to increase Irish services exports by €118 mn.
Stakeholders confirm that the Agreement will improve market access and has the potential to increase
Irish services exports to Mercosur, particularly within education services, digital technologies
(telecommunications & software licences), and engineering services.
15 Eurostat, Mercosur share of EU27 extra imports 2018. 16 CSO and Eurostat, EU26 share of Irish exports 2018. 17 Based on Eurostat data for product category 04 Dairy Produce.

54
However, some stakeholders also emphasise that natural trade barriers may continue to limit services
exports and that other barriers to cross-border investments are not removed by the Agreement. There are,
for example, no direct flights from Ireland to Brazil and no double taxation treaty between the two
countries. Also, the Agreement does not include investment protection standards or dispute settlement on
investment protection.
Finally, the study finds that an upper end estimate of the reduction in production is €45-€55 mn (0.08%
reduction), compared to the total value of Irish beef output of between €2.4 bn (in 2017) and €2.3 bn (in
2019). Dairy production is estimated to increase by 0.1% due to higher exports to the EU that compensate
for lower bilateral exports to Mercosur. The limited new market opportunities offered by the EU-Mercosur
Agreement reflect that the size of the dairy TRQ is too small to make Mercosur more attractive than other
markets (e.g. Japan and South Korea).

55
5. Environmental Impacts in Ireland
Under all trade agreements there are trade-offs created from enhanced market access. Increases in trade
can be expected to have environmental impacts in terms of greenhouse gas (GHG) emissions, water
quality, air pollution, land use, and a range of other environmental indicators unless it is done in a carbon
neutral way. In this chapter, we examine environmental impacts in Ireland caused by changes in Irish trade
and production. Section 5.1 describes our approach to modelling such trade-induced environmental
impacts. Section 5.2 assesses how changes in production impact GHG emissions in Ireland. Based on the
same economic modelling, Section 5.3 and Section 5.4 look at knock-on impacts on air pollution and land
use intensity from changes in production in Ireland.
5.1 Modelling of Trade-induced Environmental Impacts
In a ‘No policy change’ scenario, changes in production in Ireland (see Figure 20 in Chapter 3) can be
expected to have environmental impacts in Ireland in terms of GHG emissions, air pollution, land use, and
a range of other environmental indicators. To estimate model based environmental impacts, we follow the
Sustainability Impact Assessment methodology employed by the European Commission.18 The core of this
methodology is based on a two-stage approach that combines i) the economic impacts from the CGE
modelling results (i.e. changes in trade and production) with ii) a detailed environmental assessment (i.e.
trade-induced changes in environmental indicators).
This approach is grounded on the fact that, by definition, FTAs are themselves large trade-enhancing
mechanisms that primarily affect economic variables, and in this way indirectly also environmental indicators.
In other words, the environmental impacts are a consequence of the FTA impacts running through trade and
economic activity (therefore the term trade-induced impacts).19
In our CGE model, we have integrated data on GHG emissions (CO2, CH4, N2O, and fluorinated gases),
as well as data on air pollutants like black carbon and SO4. The model, therefore, goes beyond the standard
economic models as we link core model results on industry level activity (trade-induced impacts on inputs
and outputs) to calculate associated changes in these environmental indicators. As an example, our CGE
model has the advantage that we can generate CH4 and N2O emissions from the livestock sector.20
The CGE model can be used to assess incremental sustainability issues induced by changes in trade flows
but is not suitable for assessing major disruptions, e.g. irreversible climate change impacts of crossing
tipping points in global GHG emissions or economic costs related to permanent loss of biodiversity. The
environmental impacts from the CGE model should, therefore, be put into the context of ongoing
developments in global sustainability.
5.2 Impacts on GHG Emissions in Ireland
A wide range of gases known as greenhouse gases contribute to climate change. The most important
greenhouse gases are carbon dioxide (CO2), methane (CH4), and nitrous oxide (N2O). Other greenhouse
gases comprise so-called fluorinated gasses (FGAS), a wide variety of man-made gases used in various
applications, such as refrigeration and air conditioning. Collectively, these greenhouse gases are the
subject of international agreements, such as the United Nations Framework. To get an overview of total
18 This SIA methodology has been updated and revised since the initial SIA studies started in 1999. There have been around 30 SIA studies conducted by the European Commission to date (European Commission 2016).
19 In contrast, the Paris Climate Agreement, for example, deals directly with GHG emissions and other climate issues, and these climate policies will in turn, affect economic activity.
20 Our baseline data include estimates of emissions based on FAO data. In the case of livestock, CH4 and N2O emissions are linked to quantity of cattle/livestock as inputs, as well as output, and the use of energy inputs. As those change due to shifts in trade and production, the % change in emissions is then estimated as a trade-induced impact. For example, if production of livestock at level X yields associated emissions at level E, then CHANGE_E= .01*%CHANGE_X*E for a 1% change in production of livestock. This relationship applies in all cases where: (i) activity levels; (ii) energy inputs; (iii) primary factor inputs are associated with emissions at sector level.

56
emissions and make emissions of the four gasses comparable, GHG emissions are typically measured in
mega tons CO2 equivalents (MTCO2eq).21
As shown in Figure 29, the 2035 baseline GHG emissions for Ireland is projected to 89 MTCO2eq (total
EU26 emissions amount to 3,111 MTCO2eq). As the production and trade impacts of the EU-Mercosur
Agreement are small, environmental impacts in Ireland should also be expected to be marginal. In a ‘No
policy change’ scenario, GHG emissions in Ireland are forecast to increase by 0.06% or 0.05 MTCO2eq.22
The increase in total GHG emissions is driven by an increase in CO2 emissions of 0.05 MTCO2eq and in
FGAS emissions of 0.01 MTCO2eq. Emissions of N20 and CH4 are expected to drop slightly. Impacts on
GHG emissions in Ireland are of the same size and composition as the EU average (0.07% increase in
total GHG emissions). The Agreement is, therefore, forecast to have marginal impacts on GHG emissions
in the EU in a ‘No policy change’ scenario, which is also the conclusion from the European Commission’s
own impact assessment (LSE 2020).
Figure 29 Impact in 2035 on GHG emissions in Ireland and EU26
Note: Impacts are reported as percent changes relative to the 2035 baseline scenario without the Agreement.
Source: Implement Economics in cooperation with Professor Joseph Francois
It is important to emphasise that the results from the economic modelling reflect a ‘No policy change’
scenario that does not consider recently planned actions to decarbonise. The Irish Government recognises
that the window of opportunity to act is fast closing, and that the next ten years will be critical to address
21 Different greenhouse gases have different atmospheric characteristics, including Global Warming Potential (GWP). This is a measure of the cumulative warming of a gas over a specified period, usually 100 years. This is expressed relative to CO2 which has a GWP of 1. The amount emitted of any greenhouse gas multiplied by its GWP gives the equivalent emission of the gas as CO2. This is known as CO2 equivalent. Using CO2 equivalents makes it easier to sum up the emissions and contribution of greenhouse gases to climate change and determine options to address climate change (Government of Ireland 2019).
22 GHG emissions can be measured in two different ways. “Activity based" emissions are based on sector emissions from activity directly in each sector. “Use based" emissions are derived from multi-regional input-output (MRIO) analysis that takes global value chains into account. For the chemicals sector, for example, activity-based emissions from making fertilizer (that is then being used by agriculture for output feeding into processed foods) are assigned to output in the processed food sector. This is a direct analogue to "embodied valued added" in output but is instead embodied emissions in output. Since we are interested in environmental impacts in Ireland, this section applies activity-based emissions.
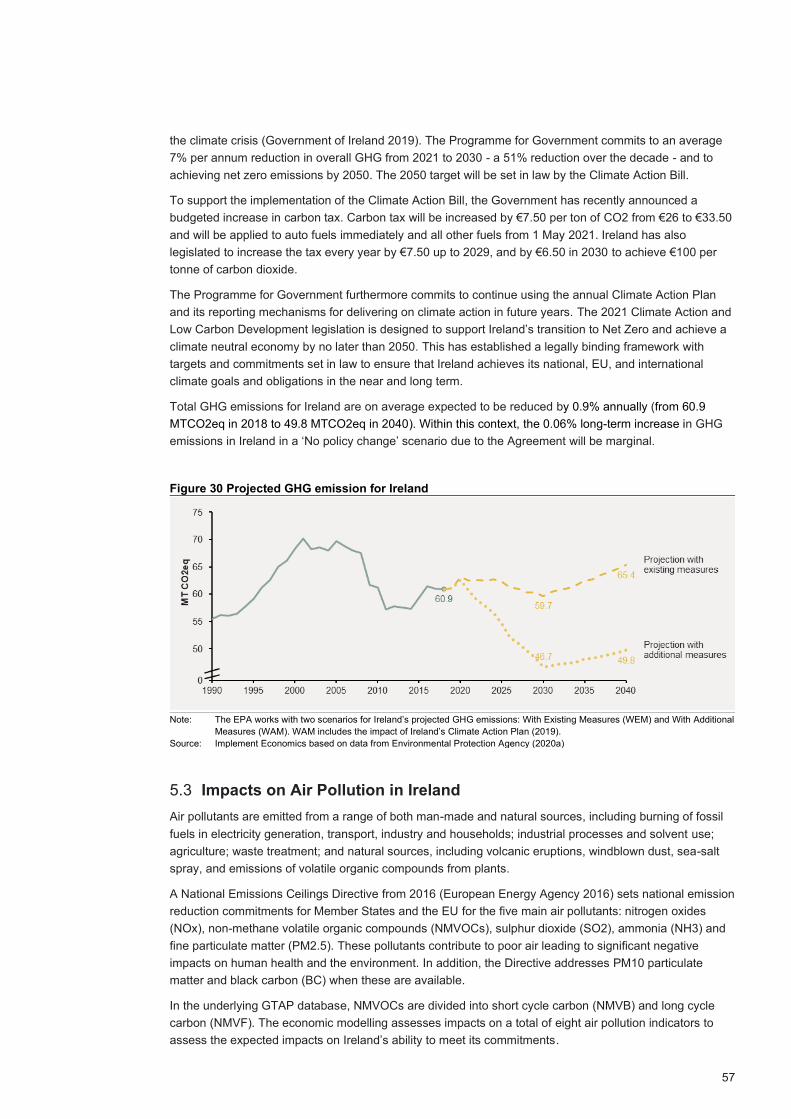
57
the climate crisis (Government of Ireland 2019). The Programme for Government commits to an average
7% per annum reduction in overall GHG from 2021 to 2030 - a 51% reduction over the decade - and to
achieving net zero emissions by 2050. The 2050 target will be set in law by the Climate Action Bill.
To support the implementation of the Climate Action Bill, the Government has recently announced a
budgeted increase in carbon tax. Carbon tax will be increased by €7.50 per ton of CO2 from €26 to €33.50
and will be applied to auto fuels immediately and all other fuels from 1 May 2021. Ireland has also
legislated to increase the tax every year by €7.50 up to 2029, and by €6.50 in 2030 to achieve €100 per
tonne of carbon dioxide.
The Programme for Government furthermore commits to continue using the annual Climate Action Plan
and its reporting mechanisms for delivering on climate action in future years. The 2021 Climate Action and
Low Carbon Development legislation is designed to support Ireland’s transition to Net Zero and achieve a
climate neutral economy by no later than 2050. This has established a legally binding framework with
targets and commitments set in law to ensure that Ireland achieves its national, EU, and international
climate goals and obligations in the near and long term.
Total GHG emissions for Ireland are on average expected to be reduced by 0.9% annually (from 60.9
MTCO2eq in 2018 to 49.8 MTCO2eq in 2040). Within this context, the 0.06% long-term increase in GHG
emissions in Ireland in a ‘No policy change’ scenario due to the Agreement will be marginal.
Figure 30 Projected GHG emission for Ireland
Note: The EPA works with two scenarios for Ireland’s projected GHG emissions: With Existing Measures (WEM) and With Additional
Measures (WAM). WAM includes the impact of Ireland’s Climate Action Plan (2019).
Source: Implement Economics based on data from Environmental Protection Agency (2020a)
5.3 Impacts on Air Pollution in Ireland
Air pollutants are emitted from a range of both man-made and natural sources, including burning of fossil
fuels in electricity generation, transport, industry and households; industrial processes and solvent use;
agriculture; waste treatment; and natural sources, including volcanic eruptions, windblown dust, sea-salt
spray, and emissions of volatile organic compounds from plants.
A National Emissions Ceilings Directive from 2016 (European Energy Agency 2016) sets national emission
reduction commitments for Member States and the EU for the five main air pollutants: nitrogen oxides
(NOx), non-methane volatile organic compounds (NMVOCs), sulphur dioxide (SO2), ammonia (NH3) and
fine particulate matter (PM2.5). These pollutants contribute to poor air leading to significant negative
impacts on human health and the environment. In addition, the Directive addresses PM10 particulate
matter and black carbon (BC) when these are available.
In the underlying GTAP database, NMVOCs are divided into short cycle carbon (NMVB) and long cycle
carbon (NMVF). The economic modelling assesses impacts on a total of eight air pollution indicators to
assess the expected impacts on Ireland’s ability to meet its commitments.

58
As the production and trade impacts of the EU-Mercosur Agreement are small, air pollution impacts in
Ireland are also expected to be marginal. Air pollution is forecast to increase marginally for 7 out of the 8
indicators. The only exception is ammonia (NH3) where cuts in beef production in a ‘No policy change’
scenario will marginally lower emissions (beef production accounts for 75% of total agriculture ammonia
emissions, EPA 2020b). The impact of increased economic activity on air pollution in Ireland should be
expected to be small (between 0.05% and 0.15% increase) and below the EU26 average.
Ireland is currently in breach of National Emission Ceilings Directive (NECD) ceiling for ammonia of 116 kt,
and the gap to target is 6.4 kt in 2020 and 4.3 kt in 2030. Lower NH3 emissions from the EU-Mercosur
Agreement will help Ireland meet its 2030 target. Again, the results reflect a ‘No policy change’ scenario
that does not consider planned initiatives to reduced air pollution in Ireland. Mitigation measures
announced in the Climate Action Plan are expected by the EPA to deliver substantial savings, but
additional measures will be needed to meet the 2030 target. An updated National Air Pollution Control
Programme under preparation will demonstrate how the gap will be closed.
Figure 31 Impact in 2035 on air pollution in Ireland and EU26
Note: Impacts are reported as percent changes relative to the 2035 baseline scenario without the Agreement.
Source: Implement Economics in cooperation with Professor Joseph Francois
5.4 Impacts on Land Use in Ireland
Our analyses assume no change in the total area of land used for agricultural production in Ireland. Our
analyses show very limited change in the total output value from the agri-food sectors and hance only a
very limited drop in the land use intensity (value of production per acre of land) in Ireland (-0.08%). Lower
beef production reduces the agricultural land use intensity, whereas increased dairy production pulls in the
other direction. Other EU Member States should also expect slightly lower land use intensity (-0.21% for
EU26). The mining sector does not play a significant role in the Irish or EU economies and no impacts
should be expected here.
5.5 Concluding Remarks
Unless it is done in a carbon neutral way, increased production in Ireland will have environmental impacts
in terms of GHG emissions, water quality, air pollution, land use, and a range of other environmental
indicators. However, as the production and trade impacts of the Agreement are expected to be small, the
environmental impacts in Ireland are also forecast to be marginal.
GHG emissions in Ireland are forecast to increase by 0.06% (or 0.05 MTCO2eq). Impacts on GHG
emissions in Ireland are of the same size and composition as the EU average (0.07% increase in total

59
GHG emissions for EU26). The Agreement is, therefore, expected to have marginal impacts on GHG
emissions in the EU, which is also the conclusion from the European Commission’s own impact
assessment (LSE 2020). It should be emphasised that the analysis does not take account of policy
interventions and technological advancements that could mitigate these marginal impacts from the
Agreement.
Likewise, changes in production should be expected to lead to a small increase in air pollution but lower
agricultural land use intensity in Ireland.
Initiatives to benefit further from the new export opportunities for dairy in the EU market (as higher GDP
and wages stimulate demand for dairy products) or mitigating actions to preserve beef exports to the EU
and/or diversify beef exports to third countries are not considered in the modelling.

60
6. Broader Sustainability Impacts of the Agreement
Changes in Irish trade and production induced by the EU-Mercosur Agreement should also be expected to
have broader impacts on sustainability in the Mercosur countries and globally. This chapter examines the
broader sustainability impacts of the Agreement that can be related to changes in Irish trade and
production. Section 6.1 describes how trade can impact sustainability and the role of the Chapter on Trade
and Sustainable Development in the Agreement. Section 6.2 discusses the potential for engagement in the
EU-Mercosur Agreement. Section 6.3 assesses trade-induced sustainability impacts related to changes in
Irish trade due to the Agreement. Finally, Section 6.4 takes a closer look at sustainability impacts related to
the EU beef offer.
6.1 The Chapter on Trade and Sustainable Development
EU trade agreements change production and consumption patterns bilaterally with trading partners and
more broadly through global value chains. The agreements can have complex trade-induced sustainability
implications due to:
• Replacement. Goods and services once produced in one geographic location will tend to move
to another geographic location where it can be more economically delivered. If production shifts
towards locations with more (less) environmental, social, and human rights protection, increased
trade can have a positive (negative) trade-induced impact on global sustainability.
• Transportation. Increased trade and consumption mean that more goods will be moved from
one location to another, which can have a negative environmental impact, mainly in terms of
GHG emissions, unless measures are taken to ensure carbon neutrality.
• Scale. Economic gains from increased trade will increase GDP and consumption, which can have
positive social impacts. Higher production may also increase emissions and accelerate resource
depletion, which can have negative environmental impacts if no further actions are taken.
• Spillovers. Trade can be a driver for transferring knowledge and technology across borders,
which can have positive economic, social, and environmental impacts (particularly for less
advanced economies).
• Convergence. Trade can be a driver for converging regulatory standards between trading
partners and improve (worsen) sustainability, if standards converge towards higher (lower) levels
of protection.
Since it is extremely difficult to monetarise all impacts and balance measurable against unmeasurable
impacts, it is likewise extremely difficult to estimate the net sustainability impacts induced by trade
agreements. In the past, observers clashed over whether trade and investment exacerbate unsustainable
economic models. According to Members of the World Economic Forum, conversations are now shifting
towards aligning trade and investment with the Sustainable Development Goals.
Box 2 Aligning trade and investment with the Sustainable Development Goals
Global trade has lifted millions out of poverty and accelerated innovation. Efforts are now being made
to ensure that global trade supports environmental action, alongside continued growth. The World
Economic Forum points to some of the trade mechanisms that support environmental goals and
outlines five ways in which trade rules could be further deployed for a greener global economy:
• Facilitate environmental goods and services trade, build circular economies
• Report, reduce, and eliminate fossil-fuel subsidies
• Engage in dialogue on climate policies
• Advance green government procurement
• Improve international collaboration
Source: Implement Economics based on World Economic Forum (2020)

61
The European Commission has entered trade negotiations over the EU-Mercosur Agreement on the
premise that trade should not happen at the expense of the environment or labour conditions. Rather, the
ambition is that the Agreement should promote sustainable development, e.g. through increased trade in
environmental goods and services, transfer of green technology, and increased international cooperation
in green R&D.
Like all modern EU FTAs, the EU-Mercosur Agreement, therefore, contains a dedicated chapter on Trade
and Sustainable Development (TSD). In the Agreement, both the EU and the Mercosur countries agree to
pursue their trade relationship in a way that contributes to sustainable development and builds on their
multilateral commitments in the fields of labour and environment (European Commission 2019):
• The EU and Mercosur commit to effectively implement the Paris Climate Agreement and agree to
cooperate on the climate aspects of trade between the two sides. This includes tackling
deforestation.
• The EU and Mercosur agree that they will not lower labour or environmental standards to
promote trade and attract investment. On the contrary, the TSD chapter includes specific
commitments related to environment protection, workers’ rights, and promotion of responsible
business conduct.
• The 'precautionary principle' is upheld in the Agreement and ensures that the EU and the
Mercosur countries can continue to regulate, including on environment or labour matters, even if
this affects trade, also in situations where scientific information is not conclusive.
Opponents argue that the EU-Mercosur Agreement can have negative trade-induced impacts on
environmental and social outcomes, because the Agreement fails to secure 1) inclusion of local
communities; 2) transparency mechanisms to trace commodities and provide open-access information;
and 3) enforcement to legally uphold sustainability commitments (Kehoe et al. 2020).
The European Commission argues that the TSD chapter in the Agreement provides, for the first time, an
explicit mechanism whereby the EU can raise concerns about environmental and labour conditions on a
bilateral basis with the Mercosur countries in a manner that is transparent and subject to public
accountability. The next section, therefore, includes an overview of the potential for engagement in the EU-
Mercosur Agreement and a discussion of other mechanisms to improve the sustainability of trade.
A detailed description of the current economic, social, environmental, and human rights situation in the
Mercosur countries can be found in the European Commission’s sustainability impact assessment
conducted by LSE Consulting. The EU-level impact assessment also provides an analysis of how changes
in EU-Mercosur trade relations have broader sustainability implications in the Mercosur countries and
globally. This report takes the Irish perspective and zooms in on sustainability impacts related to changes
in Irish production and trade patterns. This chapter will, therefore, provide a detailed analysis of the
following issues:
• Sustainability impacts in Mercosur and globally induced by changes in trade with Ireland, and
• Sustainability impacts in Mercosur from the EU beef offer.
6.2 The Potential for Engagement in the EU-Mercosur Agreement
The provisions in the TSD chapter will allow the EU to engage with the Mercosur countries through
structured dialogues on sensitive issues, to launch joint projects, to enhance interaction with international
bodies, and to set up dedicated institutional and civil society structures. The TSD provisions are binding
and subject to a dispute settlement mechanism, albeit different to the general dispute settlement
mechanism that applies to other chapters (European Commission 2017).
The main concern expressed by some stakeholders relates to the lack of force of any findings and
recommendations made by the Panel of Experts on foot of a dispute and the inability to impose targeted
sanctions for an alleged breach of commitments under the chapter. Critics argue that there is no
mechanism to impose countervailing measures in response to sustainability concerns. The European

62
Commission responded to this criticism in response to a parliamentary question in the European
Parliament.23
“Each Party is obliged to properly implement the Agreement and to adopt the measures necessary to
this effect. Any Party is entitled to request government consultations, as a first step, and the convening
of a panel of experts, as a second step, under the dispute resolution mechanism of the trade and
sustainable development (TSD) chapter.
A Party found by the panel to be in breach of any of the commitments in the TSD chapter must ensure
compliance with the Agreement, taking into account the findings and recommendations of the panel
report.
The TSD chapter is an integral part of the Agreement and its commitments are legally binding. A Party
that fails to comply will be in breach of the Agreement.
Any breach of environmental or other commitment in the Agreement does not necessarily render the
Agreement invalid. It is up to the Parties to decide whether the Agreement is considered to be invalid
and to terminate it.“
In other words, once the Agreement is signed, it is legally binding and will not be considered invalid even
in the case of any breach of environmental or other commitments in the Agreement. There is an ongoing
debate among academic experts on the most effective way to promote sustainability in trade agreements
and avoid breaches of environmental commitments. Enforcement mechanisms can be categorised into two
models (Kommerskollegium 2016).
The sanctions model is favoured by the US and Canada in their bilateral trade agreements. It assumes
that compliance can only be ensured by sanctions that create significant costs and remove benefits. Even
in this model, sanctions are imposed only as the final step in a dispute settlement process as a measure of
last resort, that should only be used after all attempts of consultations and dialogue have failed.
The alternative managerial model assumes that compliance can be ensured through positive means,
such as a combination of transparency, cooperation, dispute settlement, and capacity building. This is the
approach that has been adopted by the EU in the TSD chapters in its trade agreements. There is no
agreement in the literature as to which approach is most effective in achieving sustainability objectives.
The Commission in its FTA implementation report of 2017 concluded that the TSD chapters of EU trade
agreements have, in broad terms, worked well (European Commission 2018c).
The European Commission has recently taken stock of the implementation of TSD chapters in its trade
agreements (European Commission 2017). This non-paper comprised a description and an assessment of
current practice and presented two options to improve implementation of the TSD chapters. One,
described as a more assertive partnership on TSD, would maintain the existing structure of TSD chapters
but would improve the implementation and functioning of the various tools that are provided for. The other,
described as a model with sanctions, would adopt some features of the US/Canadian model by introducing
the possibility to apply sanctions in case of non-compliance impacting trade and investment between the
parties. In the US case, this means the withdrawal of trade concessions, while Canada relies on fines.
In a subsequent paper (European Commission 2018b), the Commission summarised the feedback it
received by noting the broad consensus that the implementation of the TSD chapters needed to be
improved. On the question of sanctions, it noted a difference of opinion but concluded that most voices
supported the current managerial model for enforcing TSD chapters. It noted that trade sanctions are
typically included in trade agreements to compensate parties for quantifiable economic damage resulting
from a failure to comply with commitments under the Agreement. It would be difficult to establish what
‘compensation’ the EU should be entitled to in the event of a failure to uphold environmental and social
23 Question for written answer E-002497-19, 31 July 2019, https://www.europarl.europa.eu/doceo/document/E-9-2019-002497_EN.html. Can the Commission confirm whether the rulings of the TSD panel, as described in the EU-Mercosur trade agreement, will be binding in relation to environmental disputes? Can the Commission also confirm whether any other environmental aspects of the agreement are binding on the Mercosur countries, meaning that a breach of such conditionality would invalidate the agreement?

63
standards, and it is not clear that the level of compensation would be sufficient to ensure compliance. It
also noted that trade partners would not accept the idea of trade sanctions in the context of the broad
commitments undertaken in TSD chapters. In those cases where sanctions were included in FTAs to apply
to environmental and social commitments (e.g. in US or Canadian FTAs), they have a much narrower
scope.
The Commission went on to outline 15 concrete steps to be taken to revamp the TSD chapters and make
them more effective. Specific innovations as compared to provisions in previous TSD chapters were
proposed in connection with climate change, enlarging the scope of issues that civil society could take up,
and increasing the resources available to support the implementation of TSD chapters. The Commission
note also outlined its commitment to more assertive enforcement. These steps will apply also to the TSD
chapter in the EU-Mercosur Agreement.
The recently appointed Chief Trade Enforcement Officer (CTEO) as part of DG TRADE in the European
Commission will also have a role in enforcing the sustainability provisions in EU trade agreements, notably
in relation to the climate agenda and labour rights (European Commission 2020b). The role of the CTEO is
described in more detail in Chapter 8.
In summary, while there seems to be no evidence that taking a more punitive approach results in more
positive environmental outcomes, the managerial model chosen by the EU opens the possibility to use the
commitments and mechanisms in the TSD chapter to press for policy changes that could offset, or more
than offset, the potentially negative static impacts of the Agreement.
6.3 Sustainability Impacts in the Mercosur countries
This section assesses the economic, social, and environmental impacts in the Mercosur countries. It is
important to underline that a negligible part of the trade-induced sustainability impacts in the Mercosur
countries is directly related to changes in trade with Ireland. Ireland currently accounts for 4.5% of total
EU27 imports from Mercosur, but Ireland only accounts for 3.0% of the additional imports generated by the
EU-Mercosur Agreement. Only within two sectors (Primary products and Forestry, wood & paper products)
is Ireland forecast to account over and above the EU average share of the additional imports, but Ireland’s
share remains small.
Ireland accounts for a large share of EU27 services imports from Mercosur, and these are generally high
value-added sectors with a low environmental footprint and positive social characteristics. Overall, the
economic modelling finds that changes in Ireland-Mercosur trade have negligible impacts on sustainability
in the Mercosur countries.

64
Figure 32 Ireland’s share of change in EU imports from Mercosur
Note: Ireland’s share of EU imports is based on 2035 baseline data, i.e. the share in the baseline scenario without the Agreement.
Ireland’s share of the impacts on EU imports due to the Agreement is measured as absolute change Irish imports from
Mercosur as a share of the absolute change in EU imports from Mercosur.
Source: Implement Economics in cooperation with Professor Joseph Francois
Macroeconomic Impacts
In this study, macroeconomic impacts are measured by the change in GDP relative to the 2035 baseline
projection of GDP without the Agreement. In the LSE study, impacts are measured relative to a 2032
baseline. Furthermore, the LSE study was conducted before the EU-UK trade deal was concluded and
before the tariff schedules in the EU-Mercosur Agreement were completed. As explained in Section 0 on
beef and in Appendix C, TRQs have also been modelled differently in the two studies. This means that
impacts for the EU and Mercosur are not entirely comparable.
GDP in the Mercosur countries is on average forecast to increase by 1.0%, and the Agreement is
expected to add €31 bn to the Mercosur economies (of which 35% are due to the tariff cuts). With a GDP
impact of 1.5%, Uruguay is the Mercosur country that is expected to experience the largest percent
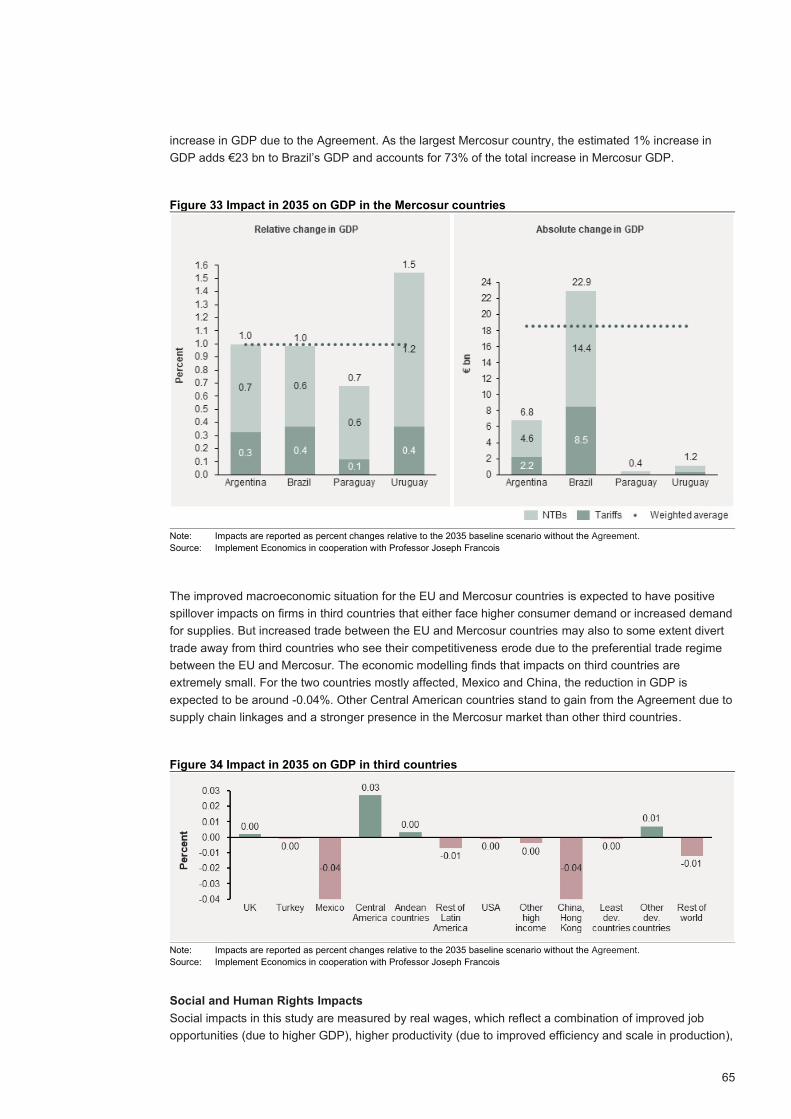
65
increase in GDP due to the Agreement. As the largest Mercosur country, the estimated 1% increase in
GDP adds €23 bn to Brazil’s GDP and accounts for 73% of the total increase in Mercosur GDP.
Figure 33 Impact in 2035 on GDP in the Mercosur countries
Note: Impacts are reported as percent changes relative to the 2035 baseline scenario without the Agreement.
Source: Implement Economics in cooperation with Professor Joseph Francois
The improved macroeconomic situation for the EU and Mercosur countries is expected to have positive
spillover impacts on firms in third countries that either face higher consumer demand or increased demand
for supplies. But increased trade between the EU and Mercosur countries may also to some extent divert
trade away from third countries who see their competitiveness erode due to the preferential trade regime
between the EU and Mercosur. The economic modelling finds that impacts on third countries are
extremely small. For the two countries mostly affected, Mexico and China, the reduction in GDP is
expected to be around -0.04%. Other Central American countries stand to gain from the Agreement due to
supply chain linkages and a stronger presence in the Mercosur market than other third countries.
Figure 34 Impact in 2035 on GDP in third countries
Note: Impacts are reported as percent changes relative to the 2035 baseline scenario without the Agreement.
Source: Implement Economics in cooperation with Professor Joseph Francois
Social and Human Rights Impacts
Social impacts in this study are measured by real wages, which reflect a combination of improved job
opportunities (due to higher GDP), higher productivity (due to improved efficiency and scale in production),

66
and lower prices (due to tariff and other cost reductions). The CGE model assumes that total employment
equals labour supply in the long term. When demand increases in one sector, wages increase to attract
workers from other sectors. We, therefore, look at real wages across sectors to assess whether there are
vulnerable workers in sectors that will experience a downward pressure on real wages. Since trade with
Ireland is small relative to the Mercosur economy, impacts on human rights related to changes in Ireland-
Mercosur trade have not been assessed in detail in this study (see LSE 2020 for more details).
Real wages in Mercosur are forecast to increase by 0.9% on average, and all skill groups should be
expected to benefit from the Agreement. The largest wage increase should be expected for workers in the
agriculture and production sectors, where wages on average increase by 1.1%. For the individual
Mercosur countries, the largest increases should be expected for Uruguay and Paraguay, which are also
the countries with the lowest GDP per capita in the Mercosur bloc. The smallest increases should be
expected for Argentina and Brazil.
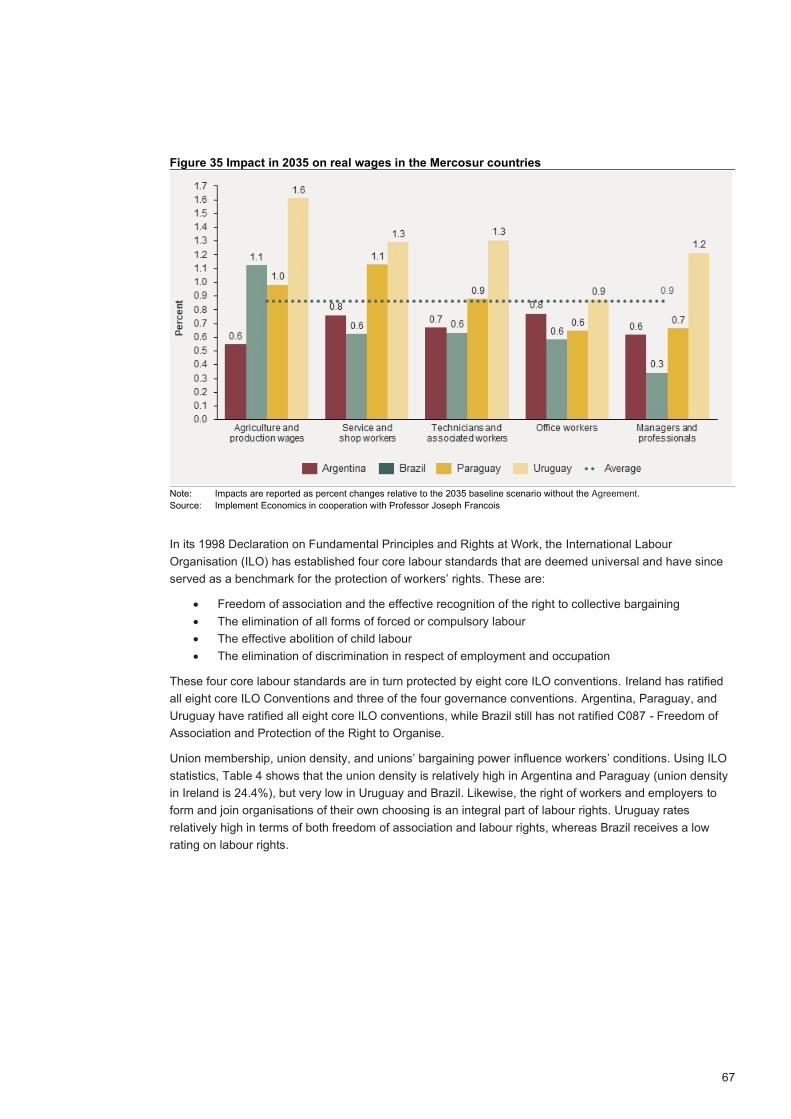
67
Figure 35 Impact in 2035 on real wages in the Mercosur countries
Note: Impacts are reported as percent changes relative to the 2035 baseline scenario without the Agreement.
Source: Implement Economics in cooperation with Professor Joseph Francois
In its 1998 Declaration on Fundamental Principles and Rights at Work, the International Labour
Organisation (ILO) has established four core labour standards that are deemed universal and have since
served as a benchmark for the protection of workers’ rights. These are:
• Freedom of association and the effective recognition of the right to collective bargaining
• The elimination of all forms of forced or compulsory labour
• The effective abolition of child labour
• The elimination of discrimination in respect of employment and occupation
These four core labour standards are in turn protected by eight core ILO conventions. Ireland has ratified
all eight core ILO Conventions and three of the four governance conventions. Argentina, Paraguay, and
Uruguay have ratified all eight core ILO conventions, while Brazil still has not ratified C087 - Freedom of
Association and Protection of the Right to Organise.
Union membership, union density, and unions’ bargaining power influence workers’ conditions. Using ILO
statistics, Table 4 shows that the union density is relatively high in Argentina and Paraguay (union density
in Ireland is 24.4%), but very low in Uruguay and Brazil. Likewise, the right of workers and employers to
form and join organisations of their own choosing is an integral part of labour rights. Uruguay rates
relatively high in terms of both freedom of association and labour rights, whereas Brazil receives a low
rating on labour rights.

68
Table 4 Labour rights in Mercosur
Note: 1) Union density measures the share of employees who are union members (in percent). The latest available data is used:
Brazil 2016, Argentina 2014, Paraguay 2015, Uruguay 2013.) 2) Measures if freedom of assembly and association’ is
effectively guaranteed based on the fundamental rights category in the World Justice Project (score of 1=strong adherence to
the law, score of 0=weak adherence to the rule of law). 3) Measures labour rights based on the fundamental rights category in
the World Justice Project (score of 1=strong adherence to the law, score of 0=weak adherence to the rule of law).
Source: Implement Economics based on ILOSTAT and LSE (2020)
While the TSD Chapter of the EU-Mercosur Agreement does emphasise the ratification of and compliance
with core ILO standards and core ILO conventions, some stakeholders have expressed concerns over
labour rights in Brazil. While Uruguay is on par or above EU levels, the Global Rights Index from the
International Trade Union Confederation (ITUC) finds that there are no guarantees of rights in Brazil and
regular violations of rights in Argentina and Paraguay.24 As was the case with environmental impacts, the
question for policymakers is whether the cooperation, consultation, and dispute settlement mechanisms
contained in the TSD chapter can be used effectively to press the Mercosur countries to reduce violations
of workers’ rights.
Environmental Impacts
Both the EU and the four Mercosur countries are signatories to the Paris Agreement on climate change
and, therefore, all parties to the EU-Mercosur Agreement have committed to binding and absolute
reductions in greenhouse gas (GHG) emissions. These commitments are assumed to be binding for each
signatory, and the EU-Mercosur Agreement will not change this.
The CGE model is used to assess impacts on GHG emissions and other environmental indicators from
trade-induced impacts on production. The economic modelling assumes that the total area of land used for
agricultural production in both the EU and Mercosur is fixed. This implies that increases in economic
activity and production will not increase land use for agriculture or other purposes. Consequently, impacts
on deforestation are typically assessed in supplementary analyses as was the case in the LSE study. The
risk of deforestation of the EU beef offer is assessed in Section 6.4.
24 ITUC’s annual Global Rights Index rates countries’ respect for workers’ rights throughout the world, on a scale of 1-5, with ‘1’ signifying a country where violations take place on an irregular basis and ‘5’ a country where workers’ rights are absent. The index documents practices such as the criminalisation of the right to strike; the erosion of collective bargaining; the exclusion of workers from labour protection; restrictions on access to justice; the de-registration of unions; and arbitrary arrests, detention, and imprisonment. Brazil is rated 5, Argentina and Paraguay are rated 3, and Uruguay is rated 1 along with Ireland.

69
Without mitigating measures, in a ‘No policy change’ scenario, the EU-Mercosur Agreement is forecast to
put a small upwards pressure on global GHG emissions of 0.03% or 15.9 MTCO2eq. For both the EU and
the Mercosur countries, the additional GHG reductions required to counter the effects of the Agreement
are marginal compared to baseline emissions in 2035 and does not account for any mitigating policy
measures that may be adopted to meet obligations under the Paris Agreement.
For the EU, the additional 2.2 MTCO2eq shall be seen in relation to a total EU26 emission in 2018 of
3,111 MTCO2eq. As stated by the European Environment Agency, the EU has a ‘narrow window of
opportunity in the next decade to scale measures to protect nature, lessen the impacts of climate change
and radically reduce our consumption of natural resources’ (European Environment Agency 2019). During
the consultations with Irish stakeholders for this report, concerns were raised regarding the consistency of
trade agreements and other climate action initiatives in the EU, such as the EU Green Deal and the Farm
to Fork Strategy. The concern is whether the upwards pressure on EU emissions can be managed and
Paris-commitments still be met. Some stakeholders also raised concerns about competition from Mercosur
producers that supposedly face less domestic pressure to reduce their climate footprint.

70
For the Mercosur countries, the Agreement will require a further reduction in GHG emissions of 17.5
MTCO2eq to be neutral. This is driven by Brazil due to its larger size. For Brazil, the 12.6 MTCO2eq
corresponds to a 1.5% additional GHG reduction requirement. Trade diversion leads to less pressure on
emissions in China and Hong Kong 4.2 MTCO2eq.
Figure 36 Additional GHG reduction requirements in 2035 by country
Note: Impacts are reported as percent changes relative to the 2035 baseline scenario without the Agreement.
Source: Implement Economics in cooperation with Professor Joseph Francois
Increased production due to the Agreement means that air pollution in Mercosur should be expected to
increase marginally on most indicators. Higher industrial production is expected to lead to marginally
higher air pollution in Argentina (0.6% increase on average) and Brazil (0.8% increase on average). For
Brazil, the increase is very small and should be seen in relation to the reasonably good level of air pollution
in Brazil (Copenhagen Consensus 2015).
This analysis shows that there will be a small increase in the total output value from the agri-food sectors
and, consequently, a limited increase in the land use intensity (value of production per acre of land) in the
Mercosur countries. The small increase can be explained by the controlled opening of trade in agricultural
products with the use of restrictive quotas and high out-of-quota tariffs, which will limit the increase in beef
exports to the EU to around 50,000 tons per year when the Agreement is fully phased in (see Section 4.4).
The small increase in exports of agri-food products is forecast to increase the production value in
Mercosur by 0.1-1.1%, which will imply a proportionate increase in the agricultural land use intensity, i.e.
an increase in the production value per acre of land assuming no change in the area of land used for
agricultural purposes. The increased production value will be largest in Brazil and Argentina, where the
intensity of land use increases by around 1%. Mining resource use intensity is also expected to increase in
the Mercosur countries, but mainly Uruguay, where the mining sector does not play a significant role in the
economy, and the increase should be seen in the context of a very small base (FAO 2017b).
For both Argentina and Brazil, the increase in agricultural land and resource use intensity is driven mainly
by an increase in the production of other primary products (grains, vegetables, and fruits), which account
for 85-90% of agricultural land in the two countries. In comparison, beef production only accounts for 7-
10% of agricultural land use.

71
Figure 37 Impact in 2035 on air pollution in the Mercosur countries (relative change)
Note: Impacts are reported as percent changes relative to the 2035 baseline scenario without the Agreement.
Source: Implement Economics in cooperation with Professor Joseph Francois
6.4 Sustainability Impacts Related to the EU Beef Offer
Chapter 4 analysed how the EU-Mercosur Agreement is likely to impact trade volumes, and the analysis
showed that the increase in beef imports from the Mercosur countries is expected to be around 50,000
tons of additional beef imports (in carcass weight equivalent) due to the structure of the quotas and high
tariffs outside the quotas.
In this section, we address the key sustainability question related to the EU beef commitment. 25 Our
consultations with Irish stakeholders for this report raised three areas of concern (McCabe et al. 2020):
• Food standards and animal welfare issues
• GHG emissions
• Deforestation
To summarise, on food standards and animal welfare, we find that the implementation of the Agreement
will not impact either the ability or the responsibility of the European Commission and Member States to
undertake its legal responsibilities to audit the operation of official controls in Mercosur and to check for
compliance at border inspections. In addition, the Agreement has the potential to drive higher food safety
and animal welfare standards in the Mercosur countries.
On GHG emissions, we point to the overall analyses of this question in Section 6.3. We add that our
analysis confirms a higher emissions intensity of beef production in the Mercosur countries than in Ireland
and the rest of the EU, but we also note that GHG emission should be evaluated on a global scale and in
its entirety across all sectors, and not in isolated sub-sector comparisons.
25 The sustainability impacts related to the EU beef offer have been analysed in close collaboration with Professor Alan Matthews.

72
On deforestation, we note that the economic modelling assumes no change in land use for agricultural
purposes and, therefore, that the increase in production value (which happens mainly via higher prices)
takes place without any increase in land use for agricultural purposes in any of the Mercosur countries. We
understand from the stakeholder consultations that concerns over land use and potential impacts on
deforestation are related to the situation in Brazil and notably its beef sector. In that context, we note that
our assessment shows a rather limited increase in imports of beef of 50,000 tons from all four countries
combined, of which an estimated 20,000 tons would come from Brazil. This potential increase in exports
should be seen in the context of the annual beef production in Brazil of 11,000,000 tons, which implies that
the maximum increase in production volume in Brazil related to the Agreement would be a 0.2% increase
after the six-year phasing-in.
Finally, we underline that the TSD chapter of the EU-Mercosur Agreement provides a set of mechanisms
that give the EU leverage in Brazilian climate and forest policy, which are not available without the
Agreement. Under the cooperative approach taken by the European Commission, the EU can also
strengthen complementary measures to compel private sector companies to forest-friendly suppliers and
reduce emissions in their supply chains. We find that there is no evidence that taking a more punitive
approach (sanctions model) results in more positive environmental outcomes.
Each of the three main areas are elaborated in the following.
Food Standards and Animal Welfare Issues
Regarding food standards and animal welfare, existing EU’s import rules state that only beef from
slaughtering plants that have been individually approved by the Competent Authority as meeting EU
standards can be exported to the EU. All exported beef must be accompanied by a veterinary certificate
signed by an official veterinarian that EU import requirements have been met.
Successive audits undertaken by DG SANTE of the legislation and official controls in each Mercosur
country have generally been positive and found that the beef exported from Mercosur complies with the
legal requirement of the EU. Exports must be able to show that they provide equivalent levels of
guarantees as regards safety and animal welfare. Where specific lapses are identified, the exporting
country is asked to bring itself into compliance. In serious cases of non-compliance, individual export
establishments can be and have been delisted, and, if necessary, a temporary ban can be imposed on all
beef exports (as happened with Brazil in 2008) if the competent authority cannot show that the country is
compliant with EU standards.
The SPS chapter in the Agreement confirms the status quo with respect to beef imports under existing EU
legislation and practice, i.e. that the Agreement does not in any way lower EU standards regarding market
access for Mercosur that the EU has towards any third country. There is nothing in the Agreement that
impinges on the EU’s ability to maintain the existing level of official controls on beef imports from Mercosur
or to alter EU standards applied to domestic and imported beef in the future. The Agreement provides for a
dispute settlement mechanism that can be used in the case of SPS disputes and which might be preferred
to the WTO dispute settlement mechanism if it is seen to be cheaper and more effective.
Furthermore, there is also a Dialogues chapter in the Agreement that commits the parties to establish
dialogues and exchange of information on a range of issues relevant to food standards, animal health, and
welfare. This will build on and extend the technical cooperation around animal welfare initiated with Brazil
in 2013. The mechanisms in this chapter can help the EU to raise standards in these areas in the
Mercosur countries through a cooperative approach.
We note from the consultations with Irish stakeholders during the preparation of this report that the main
concerns relate to (a) imports of additional beef from Brazil (and to a lesser extent Argentina) under the
Agreement that could be a threat to consumer health, and (b) that it represents unfair competition to EU
and Irish beef producers because of alleged lower production standards in Mercosur countries. The
concerns refer to the absence of tagging and the lack of traceability, suspected use of growth hormones,
and lower animal welfare standards.

73
The systems to control EU farmers are often different than their counterparts in other trade partners, i.e.
the Mercosur countries. For example, all cattle in the EU must be individually identified from birth whereas
in Brazil and Argentina this is not the case. Veterinary medicines in many cases are available without
prescription in Mercosur countries whereas this is not the case in the EU. In the context of WTO rules,
there is a limit to what Europe can insist on regarding food production methods in any other trade partner.
As long as third country meat products meet EU standards on import, it cannot be treated differently to
meat produced in the EU for the purposes of trade. Consequently, although approaches are different, the
differences do not imply that the requirements on food safety for products that enter the EU are lowered.
Overall, we find that the implementation of the Agreement should be expected to have no impact on either
the ability or the responsibility of the European Commission and/or Member States to undertake its legal
responsibilities to audit the operation of official controls in third countries and to check for compliance at
border inspections. In addition, the Agreement has the potential to drive higher food safety and animal
welfare standards in the Mercosur countries. This is not only because they can help to diffuse norms and
practices through co-operative approaches such as information exchange and technical co-operation, but
also because of the spillover effect of the requirements for access to the EU and other international
markets and the business needs of exporters to meet these requirements.
GHG Emissions
During the consultations with Irish stakeholders, we noted concerns that GHG emissions could increase if
Brazilian beef were to displace beef produced in the EU (including Ireland). Based on a review of relevant
data and literature (see Appendix D), this study finds somewhat higher emissions intensity of beef
production in the Mercosur countries, but we also point to the overall analyses of this question in Section
6.3, and we emphasise that GHG emission should be evaluated on a global scale and in its entirety across
all sectors of our societies, and not in isolated sub-sector comparisons.
Deforestation
We understand from the stakeholder consultations that concerns over land use and potential impacts on
deforestation are related to the beef sector and the situation in Brazil.
It is our understanding that most, if not all, major Brazilian beef exporters to the EU have signed up to the
so-called Trading Accreditation Council (TAC) under which they commit not to purchase cattle from
illegally deforested holdings in the Amazonas area. It is beyond the scope of this report to assess how this
initiative is working in practice, and we have not been tasked to assess the comprehensiveness of the
tracking systems in place to enforce the commitments under the initiative or whether there is adequate
information on indirect suppliers. A comprehensive tracking system must indeed be important for
processors to be sure they are buying cattle that comply with the commitments under the initiative.
We have not found any arguments to suggest that a refusal to ratify the EU-Mercosur Agreement would
have any positive impact in relation to ensuring backing and support for the Trading Accreditation Council.
On the contrary, the TSD chapter would provide for a set of mechanisms that give the EU some leverage
to ensure that commitments under the initiative are met. The Agreement can also strengthen
complementary private sector initiatives to combat deforestation. These mechanisms provide a means of
engagement to ensure that deforestation is high on the agenda.
As a final note, additional imports of beef under the Agreement will amount to around 50,000 tons from all
four countries combined, of which an estimated 20,000 tons would come from Brazil. This potential
increase in exports should be seen in the context of the annual beef production in Brazil of 11,000,000
tons, which implies that the maximum increase in production quantity in Brazil related to the EU-Mercosur
Agreement would be a 0.2% increase after the six-year phasing-in. Furthermore, we note that the
economic modelling assumes no change in land use for agricultural purposes, and hence assumes that
the increase in production value (which happens mainly via higher prices) takes place without any increase
in land use for agricultural purposes in any of the Mercosur countries.

74
On the Importance of Enforcement and the TSD chapter
In our assessment, the ability to strengthen enforcement of good practices and comprehensive tracking in
relation to deforestation is crucial for creating and upholding a sustainable beef production in Brazil. The
TSD chapter provides, for the first time, an explicit mechanism whereby the EU can raise concerns about
environmental and labour conditions on a bilateral basis with the Mercosur countries in a manner that is
transparent and subject to public accountability. The TSD provisions are binding and subject to a dispute
settlement mechanism, albeit different to the general dispute settlement mechanism that applies to other
chapters. The main concern expressed relates to the lack of force of any findings and recommendations
made by the Panel of Experts on foot of a dispute and the inability to impose targeted sanctions for an
alleged breach of commitments under the chapter. Critics argue that there is no mechanism to impose
countervailing measures in response to sustainability concerns.
However, there is no evidence that taking a more punitive approach results in more positive environmental
outcomes. Potentially, more can be gained by the more assertive implementation of the provisions in the
TSD chapter in ways that the Commission has already identified (in its 15-point plan proposed in 2018) as
well as by accompanying measures such as, for example, requiring due diligence by major importers to
ensure deforestation-free supply chains. Appendix D also provides an overview of other mechanisms to
bring about deforestation-free beef and more ambitious climate action.
Commission Executive Vice President and Trade Commissioner, Valdis Dombrovskis, has stated that the
EU is engaging with the Mercosur countries to negotiate an additional text on climate and deforestation as
there must be: “lasting solutions for the Amazon region” before the Agreement is proposed for ratification.
The evidence suggests that this cooperative approach of working with the Mercosur countries is likely to
more effective in bringing about change than relying on a more punitive (sanctions-based) approach”.
Overall, the question for policymakers is whether the cooperation, consultation and dispute settlement
mechanisms contained in the TSD chapter can be used effectively to press the Mercosur countries to raise
their level of ambition and enforcement of their climate and deforestation commitments. The potential
under these cooperation mechanisms to exert additional pressure for desirable policy changes must be
weighed against the potential adverse impacts on deforestation and climate in the absence of an
Agreement.
Failure to ratify the Agreement would leave the EU without any means of policy leverage. It would avoid
the immediate, static, negative consequences of a small increase in beef imports into the EU from the
Mercosur countries, but would result in Brazil becoming more dependent on third country markets where
interest in linking trade with sustainability issues is much lower than in the EU (FERN 2020). Ratifying the
Agreement could give the EU increased leverage to influence the climate and deforestation policies of the
Mercosur countries in ways that could more than offset the immediate negative impacts of the anticipated
increase in beef imports.
The European Commission is currently engaging with Mercosur countries to negotiate the June 2019
political agreement to include additional pre-commitments on climate and deforestation before the
Agreement is formally presented to EU Member States for ratification. The recent EU Trade Policy Review
Communication (COM(2021) 66 final, p. 13) states that “In addition, autonomous measures are supporting
the objective to ensure that trade is sustainable, responsible and coherent with our overall objectives and
values. The Carbon Border Adjustment Mechanism (CBAM) is a case-in-point. The Commission is working
on a proposal for a CBAM in order to avoid the effectiveness of its own climate policies being undermined
by carbon leakage. Another example is the intention of the Commission to put forward legislation
addressing deforestation and forest degradation. An important element in ensuring that supply chains are
sustainable and responsible will be the Commission’s proposal on sustainable corporate governance,
including mandatory environmental, human and labour rights due diligence. Subject to the impact
assessment, this will include effective action and enforcement mechanisms to ensure that forced labour
does not find a place in the value chains of EU companies”. In this context, beyond the Agreement itself,
there are also complementary EU autonomous proposals to support to support combatting climate change
and deforestation.

75
6.5 Concluding Remarks
The 2030 Agenda for Sustainable Development recognises international trade as an engine for inclusive
economic growth and poverty reduction, and an important means to achieve the Sustainable Development
Goals (SDGs). Overall, the economic modelling finds that changes in Ireland-Mercosur trade have
negligible negative impacts on sustainability in the Mercosur countries in a ‘No policy change’ scenario.
Equally, effective implementation and enforcement of TSD provisions can have a positive impact.
The EU-Mercosur Agreement is forecast to increase GDP in the Mercosur countries by 1.0% and increase
real wages for all skill groups (real wages in Mercosur will on average increase by 0.9%).
Regarding GHG emissions, we note that all parties to the EU-Mercosur Agreement are signatories to the
Paris Agreement on climate change and, therefore, that all parties to the EU-Mercosur Agreement have
committed to binding reductions in greenhouse gas emissions. These commitments are assumed to be
binding for each signatory both before and after an entry into force of the EU-Mercosur Agreement.
The analysis of GHG emissions shows that without mitigating measures, in a ‘No policy change’ scenario,
the EU-Mercosur Agreement is forecast to put a small upwards pressure on global GHG emissions of
0.03% or 15.9 MTCO2eq. For both the EU and the Mercosur countries, the additional GHG reductions
required to counter the effects of the Agreement are marginal compared to baseline emissions in 2035.
We point to the overall analyses of this question in Section 6.3, and we underline that GHG emissions
should be evaluated on a global scale and in its entirety across all sectors of our societies, and not in
isolated sub-sector comparisons. Over time, increased trade also offers a potential for technology
advancements and efficiency gains, which in turn may lead to the dissemination of more environmentally
friendly technologies and more sustainable development.
We find that the implementation of the Agreement does not impact either the ability or the responsibility of
the European Commission and Member States to undertake its legal responsibilities to audit the operation
of official controls in Mercosur countries and to check for compliance at border inspections. In addition, the
Agreement has the potential to drive higher food safety and animal welfare standards in the Mercosur
countries.
Increased EU agri-food imports under the additional TRQs are expected to increase production, but the
economic analyses assume no increase in agricultural land use in Mercosur. The increase in production
value – mainly via higher prices – may entail investments in more productive and better technology, which
can help beef producers to produce more effectively. Our analyses find that the Agreement in isolation will
lead to a marginal increase in beef production in Brazil (+0,2%), and our results do not assume any further
deforestation of the Amazon in relation to this small increase. At the same time, we note that failure to
ratify the EU-Mercosur Agreement would deny newly created opportunities to enforce traceability and
enforcement of good practices ensuring that products imported to the EU comply with commitments on
deforestation.
Furthermore, the intention of the TSD chapter included in the Agreement is that, through a cooperative
approach, sufficient policy changes would be incentivised both in the Mercosur countries and in the EU
that would set conditions for bilateral trade in respect of biodiversity, the forests, the climate, and the
environment.
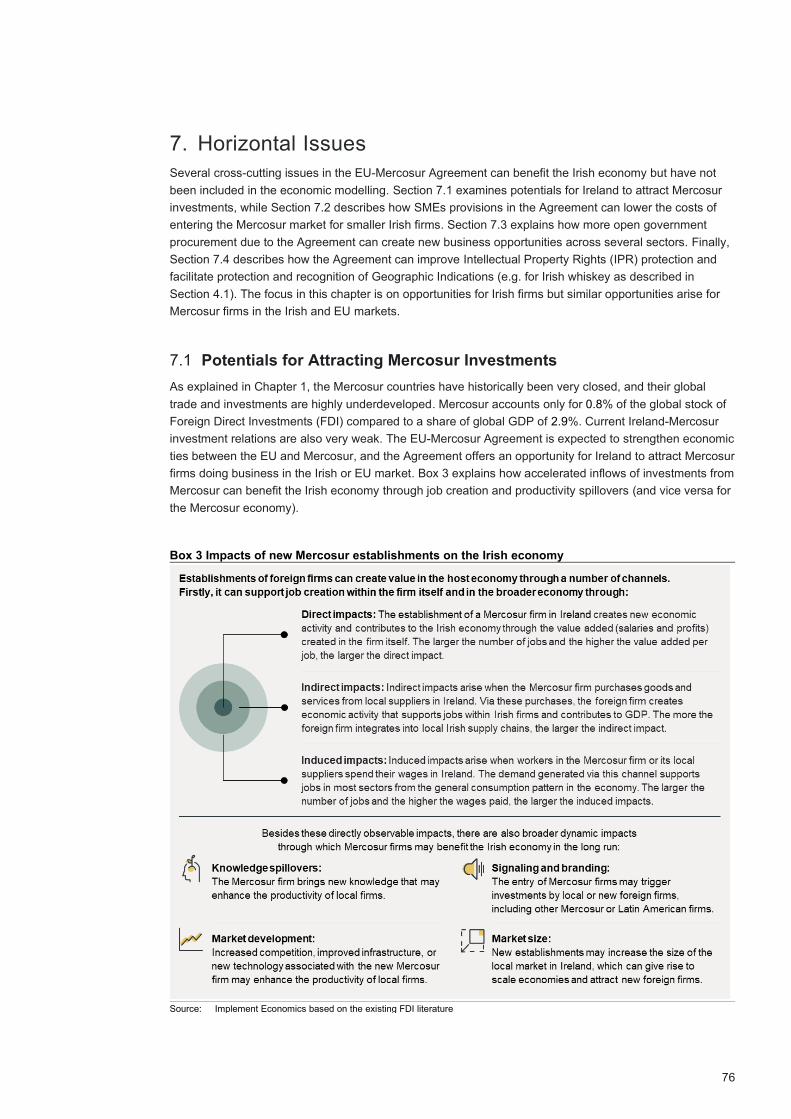
76
7. Horizontal Issues
Several cross-cutting issues in the EU-Mercosur Agreement can benefit the Irish economy but have not
been included in the economic modelling. Section 7.1 examines potentials for Ireland to attract Mercosur
investments, while Section 7.2 describes how SMEs provisions in the Agreement can lower the costs of
entering the Mercosur market for smaller Irish firms. Section 7.3 explains how more open government
procurement due to the Agreement can create new business opportunities across several sectors. Finally,
Section 7.4 describes how the Agreement can improve Intellectual Property Rights (IPR) protection and
facilitate protection and recognition of Geographic Indications (e.g. for Irish whiskey as described in
Section 4.1). The focus in this chapter is on opportunities for Irish firms but similar opportunities arise for
Mercosur firms in the Irish and EU markets.
7.1 Potentials for Attracting Mercosur Investments
As explained in Chapter 1, the Mercosur countries have historically been very closed, and their global
trade and investments are highly underdeveloped. Mercosur accounts only for 0.8% of the global stock of
Foreign Direct Investments (FDI) compared to a share of global GDP of 2.9%. Current Ireland-Mercosur
investment relations are also very weak. The EU-Mercosur Agreement is expected to strengthen economic
ties between the EU and Mercosur, and the Agreement offers an opportunity for Ireland to attract Mercosur
firms doing business in the Irish or EU market. Box 3 explains how accelerated inflows of investments from
Mercosur can benefit the Irish economy through job creation and productivity spillovers (and vice versa for
the Mercosur economy).
Box 3 Impacts of new Mercosur establishments on the Irish economy
Source: Implement Economics based on the existing FDI literature

77
Ireland competes with other EU Member States over Mercosur and global investments. Given the
expected economic benefits from inward FDI flows, most European countries have publicly funded
agencies that seek to attract foreign firms through various investment promotion activities. In Ireland, this
mandate is given to IDA Ireland.
In terms of inward investments from Mercosur, stakeholders see opportunities for pharmaceutical
companies producing generics to establish R&D units in Ireland to tap into the Irish sectoral cluster.
However, some stakeholders assess that large-scale investments from Mercosur in this sector should not
be expected because the business environment for factories is too competitive in Europe compared to
South Africa and South America.
Stakeholders also point out that the gaming sectors have opportunities for attracting Mercosur firms who
need to be close to the players and marketing campaigns targeted at local players. The same is the case
for communication and e-commerce where local presence is an advantage and in some cases a
prerequisite for servicing clients. One concern is that many of the Mercosur firms in these innovative and
fast-growing sectors are start-ups with limited experience with investing abroad. IDA Ireland supports FDI
projects with companies at varying stages of development, including fast growing companies who are
internationalising for the first time, along with larger multinationals, through a combination of supports (both
soft & financial).
IDA Ireland has had a market presence in Mercosur (and the wider South American market), through a
Pathfinder representing IDA Ireland in Brazil, since January 2009. Positive inroads have been made in
recent years with IDA Ireland supporting new FDI projects from Wildlife Studios, the largest mobile games
company in Latin America, during 2018 and from Affero Lab, leaders in the e-learning space. IDA Ireland
has identified pockets of FDI opportunity for Ireland across Mercosur, particularly in Argentina
(predominantly in Buenos Aires), and plans to engage with companies across this region through IDA’s
Pathfinder in Brazil.
7.2 Support for Irish SMEs
Ireland is populated by many SMEs. According to the latest figures from CSO Business Demography from
2018, there are 335,400 SMEs active in Ireland (amount to 99.8% of the total number of enterprises in
Ireland), and 1,358,000 people are employed by SMEs. Construction had the largest share of persons
engaged in SMEs in 2018 (at 92.7%), and both the services and distribution sectors reported over 60% of
all persons employed in SMEs. Unlike other sectors, most of the workers in the financial & insurance
sector (65.6%) are employed by large enterprises.
Continued growth and development of SMEs across all sectors are key to the future prosperity of Ireland.
Ongoing initiatives have the overall ambition to increase productivity of Irish SMEs (e.g. the Future Jobs
Ireland 2019 Framework and the Road Map for SME and Entrepreneurship Policy in Ireland). The SME
Chapter in the EU-Mercosur Agreement may support this development by helping Irish SMEs
internationalise and gain scale.
SMEs often lack the resources to enter new export markets due to red tape at customs, costly testing, and
certification requirements. In many cases, this adds to a lack of knowledge of regulatory requirements and
processes to place their products on the export market. Language barriers will also be disproportionately
costly to SMEs because the fixed costs need to be covered by lower sales. Irish SMEs have access to a
new online platform (the Access2Market portal) that provides easy access to information on market
requirements and customs rebates. The parties will also appoint SME coordinators to ensure that SME
needs are reflected in the implementation of the Agreement.
Some stakeholders express concerns that, without physical presence by the Enterprise Agencies in
Mercosur, some Irish firms may not have the required capacity to enter the Mercosur markets, and that
other exports market will be a more natural way for most Irish SMEs to internationalise and diversify their
exports. The export potential from the SME platform is, therefore, expected to require targeted assistance.
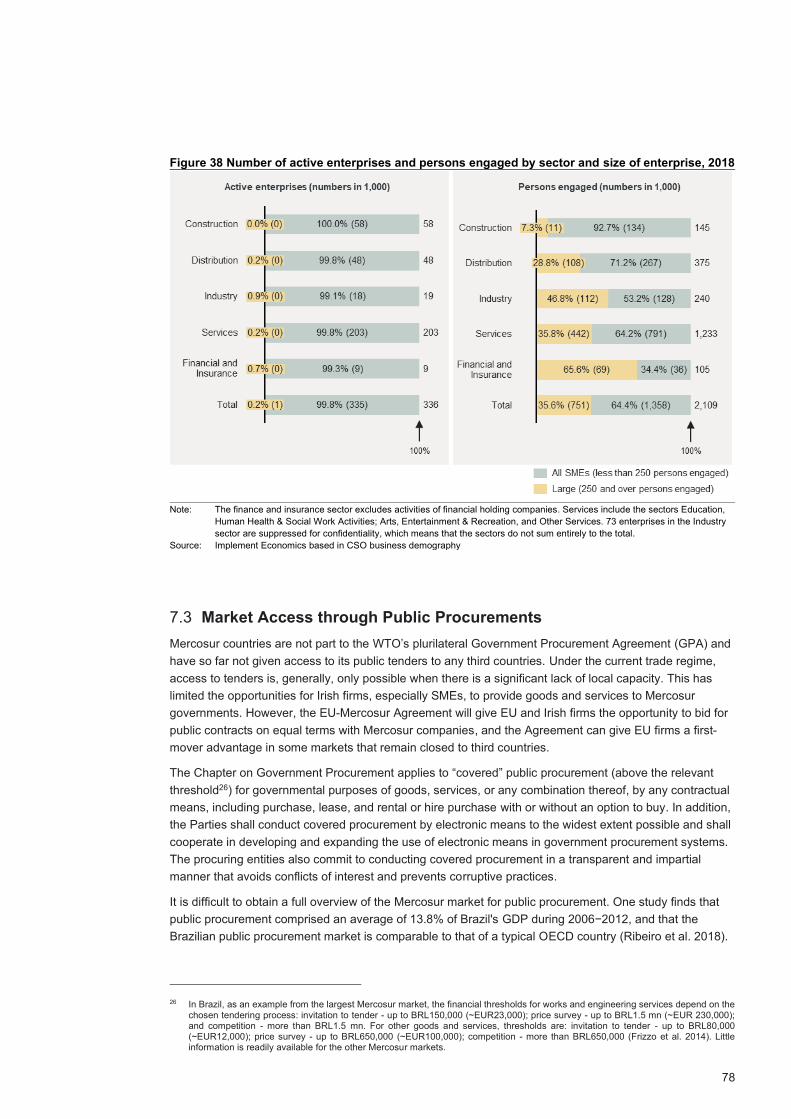
78
Figure 38 Number of active enterprises and persons engaged by sector and size of enterprise, 2018
Note: The finance and insurance sector excludes activities of financial holding companies. Services include the sectors Education,
Human Health & Social Work Activities; Arts, Entertainment & Recreation, and Other Services. 73 enterprises in the Industry
sector are suppressed for confidentiality, which means that the sectors do not sum entirely to the total.
Source: Implement Economics based in CSO business demography
7.3 Market Access through Public Procurements
Mercosur countries are not part to the WTO’s plurilateral Government Procurement Agreement (GPA) and
have so far not given access to its public tenders to any third countries. Under the current trade regime,
access to tenders is, generally, only possible when there is a significant lack of local capacity. This has
limited the opportunities for Irish firms, especially SMEs, to provide goods and services to Mercosur
governments. However, the EU-Mercosur Agreement will give EU and Irish firms the opportunity to bid for
public contracts on equal terms with Mercosur companies, and the Agreement can give EU firms a first-
mover advantage in some markets that remain closed to third countries.
The Chapter on Government Procurement applies to “covered” public procurement (above the relevant
threshold26) for governmental purposes of goods, services, or any combination thereof, by any contractual
means, including purchase, lease, and rental or hire purchase with or without an option to buy. In addition,
the Parties shall conduct covered procurement by electronic means to the widest extent possible and shall
cooperate in developing and expanding the use of electronic means in government procurement systems.
The procuring entities also commit to conducting covered procurement in a transparent and impartial
manner that avoids conflicts of interest and prevents corruptive practices.
It is difficult to obtain a full overview of the Mercosur market for public procurement. One study finds that
public procurement comprised an average of 13.8% of Brazil's GDP during 2006−2012, and that the
Brazilian public procurement market is comparable to that of a typical OECD country (Ribeiro et al. 2018).
26 In Brazil, as an example from the largest Mercosur market, the financial thresholds for works and engineering services depend on the chosen tendering process: invitation to tender - up to BRL150,000 (~EUR23,000); price survey - up to BRL1.5 mn (~EUR 230,000); and competition - more than BRL1.5 mn. For other goods and services, thresholds are: invitation to tender - up to BRL80,000 (~EUR12,000); price survey - up to BRL650,000 (~EUR100,000); competition - more than BRL650,000 (Frizzo et al. 2014). Little information is readily available for the other Mercosur markets.

79
In this case, the Brazil public procurement market offers significant business opportunities for EU firms and
constitutes a policy instrument for promoting the country's development.
Stakeholders expect that the impacts of the Agreement on procurement from an Irish perspective are likely
to be larger in sectors such as chemicals (incl. pharma) and machinery, where Irish firms are globally
competitive and already have a foothold in the Mercosur market.
7.4 Intellectual Property Rights and Geographical Indications
The Agreement is expected to improve protection of intellectual property rights (IPR) and facilitate
protection and recognition of Geographical Indicators (GIs). The objectives of the Chapter on Intellectual
Property are to:
• Facilitate access, production, and commercialisation of innovative and creative products and
foster trade and investment between the Parties contributing to a more sustainable, equitable,
and inclusive economy for the Parties.
• Achieve an adequate and effective level of protection and enforcement of IPR that provides
incentives and rewards to innovation while contributing to the effective transfer and dissemination
of technology and favouring social and economic welfare and the balance between the rights of
the holders and the public interest.
• Foster measures that will help the Parties to promote research and development, and access to
knowledge, including to a rich public domain.
The Agreement includes provisions covering IPR on copyright, trademarks, industrial designs, and plant
varieties. A sub-section in the Chapter on Intellectual Property applies to the recognition and protection of
GIs originating in the territory of the Parties. Under the Agreement, Mercosur is committed to protect some
350 EU GIs for wines, spirits, beers, and food products. Likewise, EU is committed to protect Mercosur
GIs, e.g. for wine, coffee, and food products.
Furthermore, the Parties agree on the possibility to add new GIs, to be protected pursuant to a mutually
agreed decision. Irish cream and Irish whiskey will be protected under the Agreement, which means that
the name of these drinks will enjoy a comparable level of protection in Mercosur countries to that in the
EU. In addition, producers in Mercosur will not be able to sell local or foreign products as EU GIs if they
are not the genuine product. Some stakeholders point out that the GIs could give Irish producers an
incentive to invest in marketing, which is an important prerequisite for growing exports to Mercosur.
7.5 Concluding Remarks
The full EU-Mercosur Agreement consists of 17 chapters that describe various dimensions of the new
trade regime for Irish firms’ activities in Mercosur. Lower trade barriers through tariff cuts and lower NTBs
are relatively easy to estimate and assess using economic models. Other parts of the Agreement are less
measurable and must be assessed more qualitatively. The macroeconomic impacts from the economic
modelling should, therefore, be considered lower end estimate of the contribution of the Agreement to the
Irish economy.
Of these horizontal issues, stakeholders point to the chapters covering services and establishments,
SMEs, public procurements, and IPR (including GIs) as parts of the Agreement that will improve access to
the Mercosur market relative to competitors from third countries and reducing business uncertainty. The
value of these horizontal measures – in combination with lower trade barriers – should, therefore, not be
underestimated. However, as the horizontal issues are less measurable, it may be equally difficult to
monitor implementation and ensure enforcement.

80
8. Policy Implications and Options for Ireland
This chapter brings forward some of the policy options for Ireland that have become apparent from the
impact assessment or that have been brought forward by stakeholders. The policy options include both
initiatives to ensure an efficient implementation and enforcement of the EU-Mercosur Agreement in
Section 8.1 as well as initiatives to enhance the utilisation of the Agreement by Irish firms in Section 8.2.
Finally, Section 8.3 lists some actions that can be put in place to amplify positive impacts and mitigate
negative impacts from the Agreement.
8.1 Initiatives to Implement and Enforce the Agreement
The EU-Mercosur Agreement puts in place a mechanism to solve disputes that may arise regarding the
interpretation and application of its provisions. Among other things, it includes independent panellists and
due process and transparency involving open hearings, the publication of decisions, and the opportunity
for interested parties, including civil society, to submit views in writing. The EU has in place several
standards and the processes for verifying imports from Mercosur (e.g. verification of slaughterhouses,
approved facilities, inspections etc).
To enforce the sustainable development commitments of EU trade agreements, the European
Commission has recently appointed a Chief Trade Enforcement Officer (CTEO). The CTEO will be
responsible for monitoring and enforcing environmental and labour protection obligations of EU trade
agreements with third countries. In short, the CTEO is likely to have the following main responsibilities to
monitor and enforce the environmental and labour obligations under the agreements (Kim 2020):
• Monitor trade partners’ commitments under sustainable development chapters in EU trade
agreements and produce monitoring reports
• Conduct consultations over alleged violations of trade partners and, if necessary, initiate dispute
settlement procedures under EU trade agreements
• Suggest the imposition of rebalancing duties or suspension of tariff concessions after a
favourable ruling by an FTA panel27
In the context of the EU-Mercosur Agreement, a key responsibility of the CTEO will be to ensure that
Mercosur abides by EU rules and regulations for agri-food so that the commitments to sustainability and
the environment in the Agreement are observed.
Some stakeholders in the beef sector have claimed that Mercosur producers do not have to meet the
same consumer protection, food safety, traceability, sanitary and animal welfare standards as producers in
the EU. This study finds that the implementation of the Agreement should be expected to have no effect on
either the ability or the responsibility of the European Commission and/or Member States to undertake its
legal responsibilities to audit the operation of official controls in third countries and to check for compliance
at border inspections (see Section 6.4 and Box 4 below).
Many stakeholders nevertheless express high expectations of the CTEO, and they encourage the Irish
Government to ensure that the CTEO has access to the required skills and resources to meet expectations
and fulfil the important mandate given. With sufficient resources and skills available, the CTEO will be in a
better position to put pressure on the Mercosur governments to raise their level of ambition and
enforcement of their climate and deforestation commitments.
Stakeholders also underline that the scientific bodies behind the CTEO should be supported by
independent researchers with an integrated methodology (as is the case for the Paris Agreement). The
safeguard measures provided for in the Agreement also apply to beef, and stakeholders furthermore
27 The agreed list of experts who may serve as panellists under the EU-Korea FTA is set out in the annex to Decision No 2/2012 of the EU-Korea Committee on Trade and Sustainable Development of 27 June 2012 on the establishment of a Panel of Experts, as referred to in Article 13.15 of the EU-Korea FTA (2012/742/EU).
81
encourage the Irish Government to closely monitor how EU beef imports from Mercosur develop and act if
there is a sudden increase in beef imports that is causing serious market disturbance for Irish farmers.
Finally, some stakeholders point out that credentials of outbound trade flows (e.g. Irish beef or dairy
products) will also need to be verified upon request, and that the verification may be administratively costly
for the responsible Irish authority and may in some cases require additional investments to comply with
requirements under the Agreement.
If successful, the Commission legislative proposals for EU autonomous sustainability measures (e.g. on
the Carbon Border Adjustment Mechanism, deforestation, and mandatory due diligence) described in
Section 6.4 are likely to accommodate some of the concerns raised by stakeholders in Ireland.
Box 4 The legislative context of EU food and feed safety controls
According to EU legislation, imports of products of animal origin are only permitted from Third
Countries or parts thereof that have been specifically authorised following an in-depth assessment of
the performance of the Competent Authorities (CAs), and a favourable mission carried out by an audit
team from DG SANTE. The approval is also dependent on the animal health situation within the third
country in question, and approval of its residue control plan.
The effectiveness of control systems both inside the EU and in Third Countries approved for export to
the EU is ensured by DG SANTE through the Health and Food Audits and Analysis Directorate (until
2016 called the Food and Veterinary Office, FVO). This Directorate was originally established in 1997
in Grange, Co. Meath at arm’s length from the Commission offices in Brussels in the wake of the failure
in official controls during the BSE crisis. Its role is to ensure effective control systems through the
evaluation of compliance with the requirements of EU food safety/quality, veterinary and animal health
legislation. DG SANTE does this mainly by carrying out inspections in Member States and in Third
Countries exporting to the EU.28
Each year DG SANTE develops an inspection programme, identifying priority areas and countries for
inspection. To ensure that the programme remains up to date and relevant, it is reviewed mid-year. DG
SANTE makes recommendations to the country’s competent authority to deal with any shortcomings
revealed during the inspections. Following an inspection, the competent authority can be requested to
present an action plan to DG SANTE on how it intends to address any shortcomings. Together with
other Commission services, DG SANTE evaluates this action plan and monitors its implementation
through several follow-up activities.
Source: Implement Economics in collaboration with Professor Alan Mathews
8.2 Initiatives to Enhance the Utilisation of the Agreement
The economic modelling assumes that:
• Potential barriers to trade diversion (e.g. finding buyers, developing business relationships,
breaking into the market, overcome language barriers etc.) are overcome in the long-term.
• Irish exporters utilise the EU-Mercosur Agreement so lower tariffs translate into improved
competitiveness in the Mercosur markets.
While the European Commission has successfully concluded several important trade deals that provide
market openings for EU firms, available trade agreements are not fully utilised by EU firms - especially
SMEs. As described in Section 2.3, Ireland’s utilisation of existing FTAs was below EU average in the
2018 assessment from DG TRADE. The Department of Enterprise, Trade and Employment has recently
established a Trade and Investment Implementation Unit, which is specifically tasked with raising
awareness of the opportunities of EU FTAs through engagement with industry, its trade promotion agency
28 See the description of Health and Food Audits and Analysis on https://ec.europa.eu/food/audits_analysis_en.

82
Enterprise Ireland, chambers of commerce and business groups. The utilisation of FTAs is promoted in
part as a key enabler of trade within the broader business and trading environment in the target market.
Some stakeholders consulted as part of this study highlight the need for the Irish Government to put
forward an implementation strategy for the EU-Mercosur Agreement (and other EU trade agreements)
potentially supported by concrete action plans and delegated responsibility to the relevant public
agencies.29 These stakeholders argue that the initiatives to improve communication and further
disseminate information will be mostly effective when coordinated across competent ministries, trade
promotion organisations, chambers of commerce, business associations, and customs authorities. One
stakeholder explicitly mentions that Ireland can get inspiration from the Canadian Government’s
information campaign on CETA.
The implementation strategy should ensure that Irish firms have immediate access to information on the
opportunities of the Agreement and how to access it. The strategy should include a series of roll-out
activities and targeted promotion campaigns to reduce barriers to trade diversification into Mercosur. In
this regard, the EC Access2Markets portal will also be a useful platform for information on the Agreement.
Some stakeholders highlight that focus on the initiatives to enhance the utilisation of the Agreement should
be given to Irish SMEs, and new initiatives on SME internationalisation should be integrated with ongoing
SME initiatives such as the SME and Entrepreneurship Policy.
Finally, to support the utilisation of the Agreement, some stakeholders from the agri-food sector point out
that the Department of Agriculture, Food, and the Marine should ensure easy facilitation of export
certification and access to licenses by the Mercosur countries.
8.3 Actions to Amplify Positive Impacts and Mitigate Negative Impacts
This study finds that the EU-Mercosur Agreement offers a first-mover advantage to a market that
historically has been closed to trade and investment, but that is gradually opening. While the Agreement
gives EU and Irish exporters a significant advantage, the Mercosur market will continue to be a difficult
market to enter. Besides initiatives to implement, enforce, and utilise the Agreement, some stakeholders
therefore also call for boots on the ground in Mercosur to market Irish products and help Irish firms pursue
the business opportunities offered by the Agreement.
The Enterprise Ireland office in Sao Paulo was established in 2009 and has responsibility for export growth
to Brazil and other markets in South America such as Colombia, Chile, and Argentina. Support is provided
to clients through 3 full-time staff members and through a network of consultants. Enterprise Ireland
primarily works on a one-to-one basis with clients on developing their market entry strategy, researching
market and competitor intelligence, identifying opportunities, undertaking product benchmarking, and
assisting in sourcing agents and distributors in the target market.
Enterprise Ireland proactively targets large Brazilian corporate buyers, forms end-market clusters of
Enterprise Ireland clients, and identifies specific buyer interests. Education promotion is an important
priority for Enterprise Ireland in Brazil. Education in Ireland (under the umbrella of Enterprise Ireland) has
had part-time representation in-market for the past five years, largely focused on promoting the higher
education sector. Enterprise Ireland informs that four Ministerial trade events and missions have been
conducted in the region during 2018-2019 (1 in Argentina and 3 in Brazil).
Stakeholders argue that further resources will be needed to scale-up export promotion in Mercosur under
the Agreement. This is for example the case for Irish whiskey, particularly in Brazil which is an attractive
market where Irish whiskey exports have grown by 20% in 2019 (albeit from a low base). There is a need
for Irish producers to invest in marketing of Irish whiskey (see Chapter 4), and some stakeholders point out
29 One stakeholder points to the politically binding action plan described in EUROCHAMBRE (2018).
83
that Irish or EU funding for GI promotion could help. These stakeholders also argue that building capacity
in the Irish export promotion system to market drinks can help grow new markets for whiskey (similarly to
traditional Irish strongholds in branding Irish beef and dairy). They also highlight the importance of
ensuring that tariff elimination on beverages is not offset by other taxes.
On the more defensive side, stakeholders argue that the European Commission should monitor and
potentially take action to mitigate negative impacts for Irish farmers. The European Commission points out
that several important measures will be in place to protect the interests of Irish farmers and consumers
(DG TRADE 2019):
• A support package of up to €1 bn to assist farmers, including Irish beef farmers, in the event of
significant market disturbance. As provision for this money in the EU budget has not been
confirmed yet, details of the planned support package remain unknown.
• The deal also includes a safeguard clause, which can be used if the EU agri-food sector is, or is
at threat of being, seriously affected by increased imports. This is the first time that such a
measure was included in any FTA.
• The EU is a global standards setter, and all beef and other food products imported into Ireland
will have to comply fully with the EU’s food safety standards (see Section 8.1).
• Several environment/climate commitments in the Agreement give the EU an explicit mechanism
to raise concerns about the Mercosur countries’ fulfilment of their obligations under the Paris
Climate Agreement (see Section 6.4).
In relation to that, some stakeholders emphasise that it will be the responsibility of the European
Commission to ensure that these measures are speedily available when needed. Ireland exports 85%30 of
their beef production, whereas other EU Member States have larger home markets and are not as
exposed to increased competition. Stakeholders in the beef sector, therefore, argue that Irish beef farmers
should receive a proportionately higher share of the support packages. Some of these stakeholders argue
that any compensation schemes for potential economic damage to beef farmers should support climate
change and pave the way for investments in a more diversified and sustainable agricultural model in
Ireland.
Besides economic compensation, some stakeholders in the beef sector would welcome a longer-term
investment in building a GI for Irish grass-fed beef, if the administration and compliance costs of using the
GI can be kept low. An application for a GI for “Irish Grass Fed Beef” has already been made by the
Department of Agriculture, Food, and the Marine.
8.4 Concluding Remarks
This study finds that the EU-Mercosur Agreement offers a first-mover advantage to a market that
historically has been closed to trade and investment, but that is gradually opening. While the Agreement
gives EU and Irish exporters a significant competitive advantage relative to third countries, the Mercosur
market will continue to be a difficult market to enter for Irish firms, particularly SMEs.
A precondition for Irish firms and consumers to benefit from the Agreement is that it is fully implemented
and enforced. The newly appointment CTEO will play a key role and should be secured sufficient
resources and skills available to monitor commitments under the Trade and Sustainable Development
Chapter, conduct consultations over alleged violations, and activate the safeguard clause if needed.
Another precondition is that Irish firms utilise the Agreement. The Irish Government can prepare an
implementation strategy supported by concrete action plans and delegated responsibility to ensure that
Irish firms are aware of the Agreement and in a good position to use it. The Irish Government can also
help by ensuring that Irish firms are in a good position to diversify towards the Mercosur markets. With
boots on the ground in Mercosur, for example, it will be easier for Irish firms to find buyers, develop
30 Teagasc – Agriculture in Ireland: https://www.teagasc.ie/rural-economy/rural-economy/agri-food-business/agriculture-in-ireland/.

84
business relationships, break into the market, overcome language barriers etc. In addition, Irish or EU
funding for GI promotion could help market Irish products (such as Irish whiskey) in Mercosur.
This study assesses the impacts for Ireland of the EU-Mercosur Agreement in a ‘No policy change’
scenario, but it should be emphasised that policy initiatives can help mitigate potential negative impacts.
The Irish Government can for example help secure a fair share the EU support package to Irish farmers
and that the safeguard clause is activated if needed. Besides economic compensation, a longer-term
investment in building a GI for Irish grass-fed beef could be worth considering, if the administration and
compliance costs of using the GI can be kept low.

85
Appendix A List of Stakeholder Consultations
American Chambers of Commerce
Biopharmachem Ireland
Bord Bia
Bord Iascaigh Mhara (Ireland's Seafood Development Agency)
Chambers Ireland
Dairy Industry Ireland
Department of Agriculture, Food and Marine
Department of Communications, Climate Action and Environment
Department of Foreign Affairs and Trade
Drinks Ireland
Enterprise Ireland
Environmental Protection Agency
Financial Services Ireland
Frontline Defenders
IBEC
IDA Brazil
IDA Ireland
Irish Congress of Trade Unions
Irish Creamery Milk Suppliers Association (ISMSA)
Irish Environmental Network
Irish Exporters Association
Irish Farmers Association
Irish MedTech Association
Irish Natura and Hill Farmers Association (INHFA)
Latin America Solidarity Centre
Meat Industry Ireland
Ornua (Irish Dairy Board)
Dr Laura Kehoe, Oxford University
Retail Grocery Dairy & Allied Trades Association
Retail Ireland
Small Firms Association (IBEC)
Technology Ireland
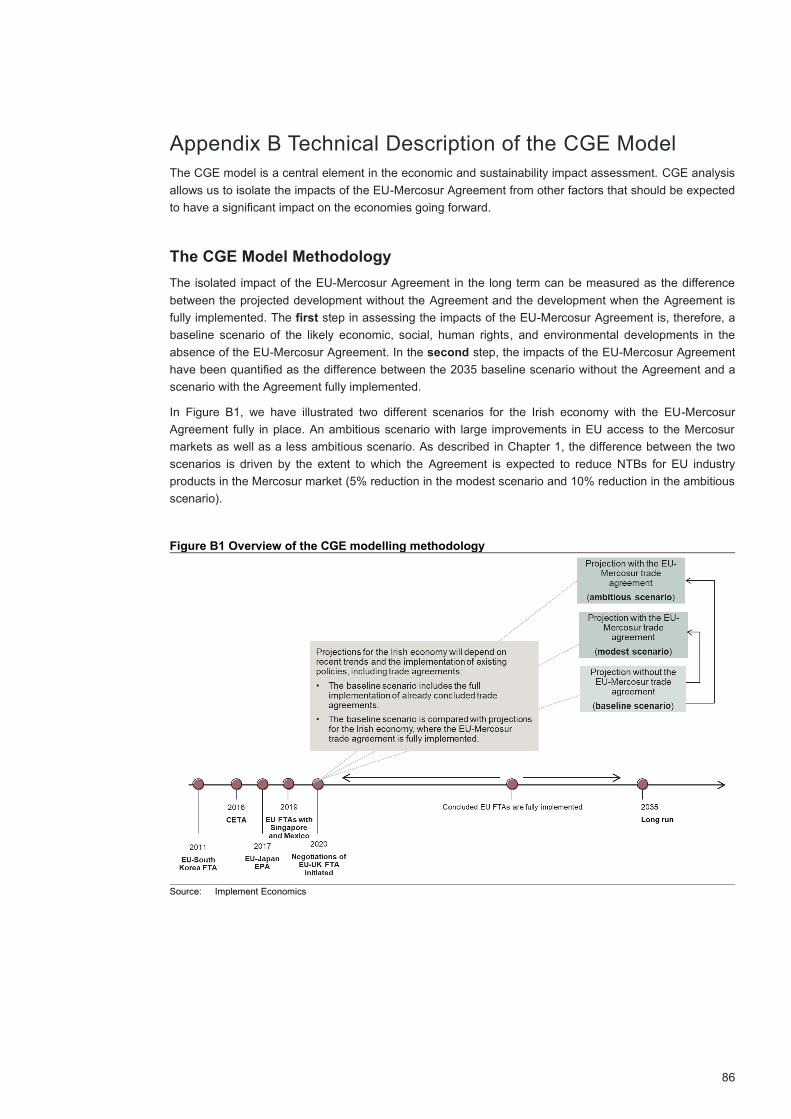
86
Appendix B Technical Description of the CGE Model
The CGE model is a central element in the economic and sustainability impact assessment. CGE analysis
allows us to isolate the impacts of the EU-Mercosur Agreement from other factors that should be expected
to have a significant impact on the economies going forward.
The CGE Model Methodology
The isolated impact of the EU-Mercosur Agreement in the long term can be measured as the difference
between the projected development without the Agreement and the development when the Agreement is
fully implemented. The first step in assessing the impacts of the EU-Mercosur Agreement is, therefore, a
baseline scenario of the likely economic, social, human rights, and environmental developments in the
absence of the EU-Mercosur Agreement. In the second step, the impacts of the EU-Mercosur Agreement
have been quantified as the difference between the 2035 baseline scenario without the Agreement and a
scenario with the Agreement fully implemented.
In Figure B1, we have illustrated two different scenarios for the Irish economy with the EU-Mercosur
Agreement fully in place. An ambitious scenario with large improvements in EU access to the Mercosur
markets as well as a less ambitious scenario. As described in Chapter 1, the difference between the two
scenarios is driven by the extent to which the Agreement is expected to reduce NTBs for EU industry
products in the Mercosur market (5% reduction in the modest scenario and 10% reduction in the ambitious
scenario).
Figure B1 Overview of the CGE modelling methodology
Source: Implement Economics

87
The CGE model covers direct impacts, indirect impacts, trade diversion, and general equilibrium
effects. The CGE model uses new trade data from the so-called GTAP10 database31 (base year 2014 and
projected to 203532), which among others includes global trade flows on a sectoral level for goods and
services. The GTAP10 database is based on updated input-output tables, which makes it more suitable to
mirror shifts in global value chains and sector interlinkages than GTAP9. Compared to the GTAP9 database
(base year 2011), this database includes more recent policy developments in trade negotiations:
• EU FTAs with South Korea (2011), Canada (2016), Japan (2017), Mexico (2019), and Singapore
(2019)
• The Russian ban, the Customs Union with Turkey and export subsidies from the EU that were
erronerously included in the GTAP9 database (LSE 2020)
The model includes specificities of the Irish economy, and the 67 production sectors included in the GTAP
database have been aggregated to reflect the Irish economy and the specific circumstances of Ireland. Given
the importance of Irish food and drink exports, we model explicitly several agri-food sub-sectors:
• Beef, sheep meat & other red meats
• Other meat products
• Dairy
• Other primary products
• Processed foods
• Beverages & tobacco
The sector aggregation to be used in the study is shown in Table B2.
31 The GTAP database is a global multi-regional input-output (GMRIO) database that has extensive and comprehensive economic data for 141 countries/regions and 67 production sectors. This database provides disaggregated data for sectoral production, consumption, taxes and subsidies, trade, government finances, labour variables for different skill levels, and data on other production factors.
32 Here, we use real GDP projections from the OECD and working age population projections from the UN, while domestic and international capital is endogenously determined by the model based on expected rates of return within and between different regions.

88
The mapping from GTAP sectors to NACE codes is shown in the tables below.
Figure B2 The 25 sectors to be used in the study
Note: The category ‘Other primary products’ includes agricultural products, forestry, fishing, and extraction. The category ‘Other
processed foods’ include processed rice, sugar and other food products. ‘Other manufactures’ includes textiles, wearing
apparel, leather products and other manufacturing products. The category ‘Other services’ includes accommodation, food
services, recreational services, public administration, defence, education, human health, social work, dwellings, real estate
and other service activities.
Source: Implement Economics based on the GTAP sector description

89
Table B1 Agri-food: Mapping of GTAP sectors to NACE codes
Source: Implement Economics based on the GTAP database
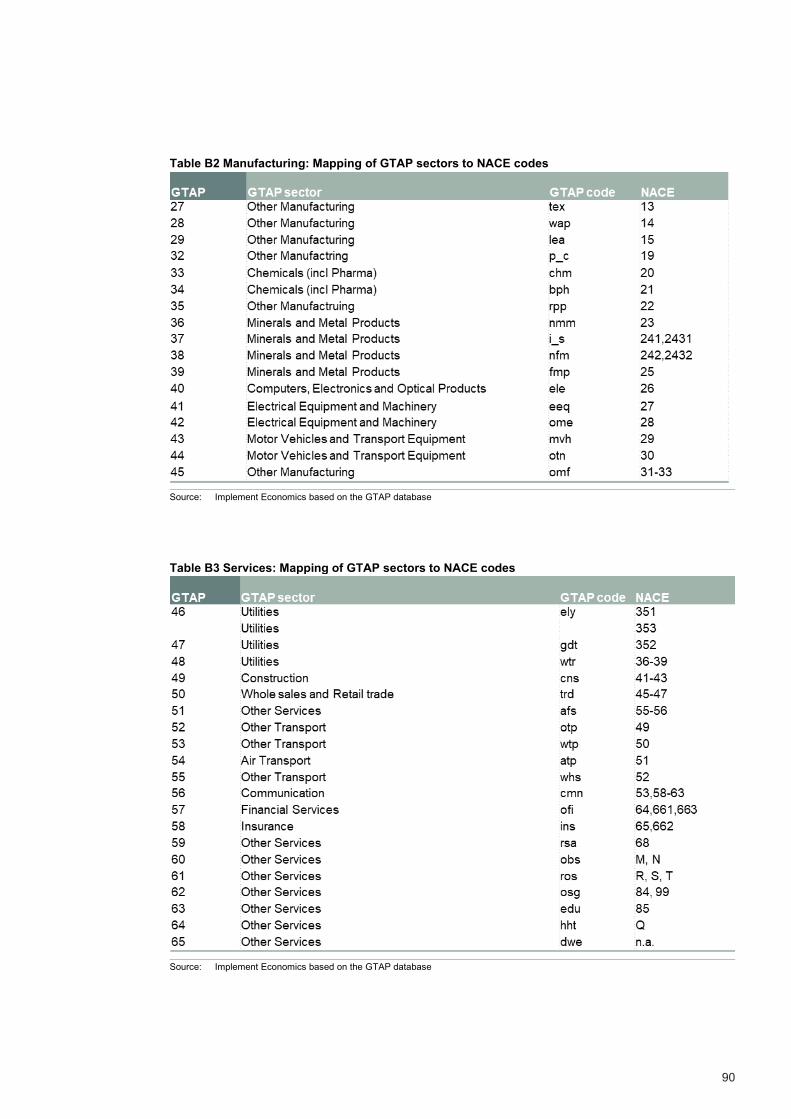
90
Table B2 Manufacturing: Mapping of GTAP sectors to NACE codes
Source: Implement Economics based on the GTAP database
Table B3 Services: Mapping of GTAP sectors to NACE codes
Source: Implement Economics based on the GTAP database
91
The Baseline Scenario
The baseline scenario attempts to reflect likely economic, social, human rights, and environmental
developments in the absence of the EU-Mercosur Agreement. The baseline considers recent trends and
implementation of existing policies, including completed trade agreements by the EU and Mercosur,
respectively, not fully implemented yet. For the purpose of this study, we incorporate the elements into the
baseline projection:
• Brexit as described in Box B1
• New environmental indicators based on data from the Food and Agriculture Organisation (FAO) for
agriculture and the International Energy Agency (IEA) for other sectors33
• The EFTA-Mercosur Agreement is fully implemented (the parallel agreement with Norway,
Switzerland, Iceland, and Lichtenstein)
Box B1 Adjustment for Brexit in the Baseline Scenario
Brexit will impact the Irish economy. As the new EU-UK trade agreement will be fully in place before
2035, it should be included in the baseline. We incorporate Brexit into the baseline using the following
assumptions:
1. The new EU-UK trade agreement will follow the revised Withdrawal Agreement and Political
Declaration from October 2019. We will apply the optimistic scenario, where Brexit is
estimated to reduce Irish GDP by -3.2% due to (Copenhagen Economics 2020):
• Zero tariffs and no quotas
• Customs procedures
• Regulatory divergence for goods
• Barriers to services trade
2. The UK will continue to have market access to all existing EU FTA partners under its own
post-Brexit FTAs with those countries. No additional UK FTAs are incorporated.
3. UK tariffs towards third countries will follow the Most Favoured Nation (MFN) tariffs
announced by the UK Department for International Trade on 6 February 2020. These tariffs
are expected to enter into force on 1 January 2021.
4. Existing EU28 quotas for partner countries are split pro rata between the EU27 and the UK
based on historic volumes of the partner’s exports to the EU and UK respectively, as
proposed by the EU27 and the UK at the WTO.
Note: The assumptions regarding Brexit are consistent with previous studies commissioned for the Irish Government, in particular
the assessment of the economic impacts arising for Ireland from the potential future trading relationship between the EU and
UK, which are based on the trade provisions of the Revised Political Declaration on the Future Relationship between the EU
and the UK that was agreed alongside the Withdrawal Agreement.
Source: Implement Economics based on Copenhagen Economics (2018, 2020)
The Policy Scenario
The economic modelling is based on the negotiating results of the trade part of the EU-Mercosur Association
Agreement from 28 June 2019 as illustrated in Figure 2 in Chapter 2. Tariff schedules and quotas are now
commitments for the two trading partners that can be modelled precisely, whereas the reduction of non-tariff
barriers remains an assumption in the policy scenario.
In the Agreement, the EU commits the following quotas to Mercosur:
• Beef: 99,000 tons carcass weight equivalent (CWE), subdivided into 55% fresh and 45% frozen
with in-quota rate of 5.5% and elimination at entry into force of the in-quota rate in the Mercosur-
specific WTO “Hilton” quotas. The volume will be phased in over six years.
33 The transformation of new environmental indicators into the GTAP database are explained in Octavio et al. (2017 and 2020).

92
• Poultry: 180,000 tons CWE duty free, subdivided into 50% bone-in and 50% boneless. The volume
will be phased in over six years.
• Pigmeat: 25,000 tons with an in-quota duty of €83 per tonne. The volume will be phased in over
six years.
• Sugar: Elimination at entry into force of the in-quota 180,000 tons of the Brazil-specific WTO quota
for sugar refining. No additional volume other than a new quota of 10,000 tons duty free at entry
into force for Paraguay. Specialty sugars are excluded.
• Ethanol: 450,000 tons of ethanol for chemical use, duty-free 200,000 tons pf ethanol for all uses,
with an in-quota rate 1/3 of MFN duty. The volumes will be phased in over six years.
• Rice: 60,000 tons duty free. The volume will be phased on over 6 years.
• Honey: 45,000 tons duty free. The volume will be phased on over 6 years.
• Sweetcorn: 1,000 tons duty free at entry into force.
The following reciprocal TRQs will be opened by both sides and phased in over 10 years:
• Cheese: 30,000 tons duty free.
• Milk powder: 10,000 tons duty free.
• Infant formula: 5,000 tons duty free.
For all three products, the in-quota tariffs will be reduced from the base rate to zero.
TRQ management will vary depending on the quota. For EU export quotas, notably cheese, skimmed milk
formula, and infant formula, the European Commission has informed that TRQ management will be on a
First Come First Served (FCFS basis). For EU import quotas, the EU-Mercosur Agreement foresees
management by the EU in accordance with its legislation. For all the most sensitive products (notably for
beef), this will entail the use of import licenses allocated through simultaneous examination. For less
sensitive quotas, another method such as FCFS may apply.
As regards apportionment, EU import quotas will be apportioned between Mercosur countries with shares
agreed between Mercosur countries and communicated to the EU in advance. For beef, it has been
tentatively indicated that Mercosur will maintain a 2004 agreement between the four countries according to
which 42.5% of any EU quota would go to Brazil, 29.5% to Argentina, 21% to Uruguay, and 7% to Paraguay.
93
Appendix C Market Access Impacts for the Beef Sector
This appendix assesses the likely impacts of the trade concessions that the EU has granted to the
Mercosur countries in the beef sector in the proposed EU-Mercosur Agreement. In the light of the
concerns raised in the stakeholder consultations, this supplementary analysis examines three specific
issues: the impact on the EU beef market and thus returns to Irish beef producers; concerns around the
inadequacy of food safety and animal welfare standards in Mercosur countries: and concerns around the
potential environmental impacts, particularly for global greenhouse gas emissions and deforestation. The
assessment was undertaken by Professor Alan Mathews in August 2020 based on latest data and policy
developments available at the time. Throughout the case study, where assumptions had to be made,
assumptions likely to give the maximum impact on the EU beef market were made. This was a deliberate
choice to achieve an upper bound estimate of the potential impacts for the EU beef market.
Executive Summary
This appendix on market access impacts for the beef sector was undertaken to examine the concerns of
stakeholders about the price and market impacts of the additional beef market access granted to Mercosur
exporters under the proposed EU-Mercosur Agreement. It complements the impact analysis undertaken
using a computable general equilibrium model by taking account of some specific aspects of trade in beef
that a large, economy-wide model of necessity is not able to consider. Particular attention is paid to the
argument that imported Mercosur beef and domestically produced beef are not homogeneous products
because Mercosur imports, whether fresh or frozen, are largely high-value cuts such as steaks. This would
be expected to have a disproportionate effect on the EU beef market relative to an increase in the volume
of beef imports that was proportionate to the product breakdown of the carcass.
The Agreement provides for an additional Tariff Rate Quota (TRQ) of 99,000 tons beef carcass weight
equivalent (CWE) to enter the EU market with a 7.5% in-quota tariff. 55% of this is for fresh beef and the
remaining 45% for frozen beef, phased in over six equal steps. In addition, the in-quota duty rate on the
Hilton High Quality Beef quota (46,876 tons in product weight for the four Mercosur exporters) is reduced
from 20% to 0%.
The key issues examined in this chapter are (a) how much additional exports can we expect arising from
these changes in TRQ access? (b) What will be the market access effects, taking into account that these
exports will consist primarily of high-value beef cuts?
Beef imports are a relatively minor share of the EU beef market, amounting to around 300,000 tons CWE
annually or around 4% of EU beef production. The bulk of imports enter the EU as fresh or frozen beef,
although there is also a significant import of processed beef. Mercosur imports account for 71% of total EU
imports of fresh and frozen beef in CWE, with a slight increase in this share in recent years. The EU is now
a minor destination for Mercosur exports compared to China and Hong Kong, accounting for about 5% of
its fresh and frozen beef exports by volume but about 10% by value. Over 80% of Mercosur beef exports
to the EU of fresh and frozen beef are destined for the three markets Netherlands, Germany, and Italy.
The UK, which is the main export market for Irish beef, is a very small importer of Mercosur fresh/frozen
beef, accounting for around 4% of their total exports to the EU.
Tariff rate quotas agreed with trading partners under the WTO or as autonomous quotas agreed to settle a
dispute over import restrictions on beef produced with the aid of hormones play an important role in
facilitating imports. Nonetheless, of Mercosur fresh/frozen imports of just over 200,000 tons CWE in 2019,
around 75,000 tons CWE were imported paying the full over-quota MFN tariff. The existence of these over-
quota imports is critical in determining the additional trade that would be generated by providing additional
TRQ access to Mercosur exporters. Our estimate is that actual imports could increase by up to 53,000
tons CWE because of the improved TRQ access. For reasons set out below, this is likely to be an upper
bound to the increase in Mercosur imports due to the TRQ.

94
The potential impact on the EU beef market and hence Irish producers of an increase in imports depends
not just on the volume but also on the composition of these imports. We assume that all these imports will
consist of high-quality beef cuts and will compete in the high-end of the EU beef market. Based on a small
simulation model of the EU beef market that distinguishes between high-quality and other beef cuts, we
estimate the impact of these additional high-value imports on EU market prices for both high-value and
low-value beef cuts and overall beef production.
As expected, there would be a significant impact on the prices obtained for high-end cuts, which might fall
by around 5% (with a range of 3.3% - 7.2% based on a sensitivity analysis for different values of the
responsiveness of EU beef supply and demand to changes in prices). In addition, beef production would
fall by 1.5% in the EU, so producer returns in the high-end market would fall by 6.3% (4.7% - 8.6%). What
is often forgotten is that, even though cheaper high-end beef would shift demand away from low-value
beef cuts to some extent, with lower supply of these cuts the overall effect will be to raise the average
price of low-value beef cuts. And because the value of these cuts makes up two-thirds of the market for
beef, this is an important factor in offsetting some of the expected losses in the market for high-value beef
cuts. Overall, producer returns will be reduced by around 2% (1.9% - 2.3%) due to the increase in imports
of high-quality beef cuts facilitated by the new Mercosur TRQ. This would translate into a reduction in the
value of Irish beef output of between €44-€55 mn, compared to the total value of Irish beef output
(including coupled subsidies) of between €2.4 bn (in 2017) and €2.3 bn (in 2019). As noted above, this is
likely to be an upper bound on the negative impacts on producers arising from the beef offer in the EU-
Mercosur Agreement.
If the additional market access were assumed to be shared across both the high and low value portions of
the market, the reduction in producer returns and the value of Irish beef output would be smaller.
Therefore, this estimate is likely to be an upper bound to the increase in Mercosur imports due to the TRQ.
This is in line with the approach taken throughout this case study to apply assumptions that give the
maximum impact on the EU beef market.
Potential Market Impacts of the Trade Concessions
The tariff concessions granted by the EU for imports of beef products from the Mercosur countries are set
out in Table C1.
Table C1 Trade concessions on beef imports in the EU-Mercosur Agreement
CN2013
code
Description short EU MFN tariff
base rate
Mercosur
preferential
tariff
02011000 Carcases or half-carcases of bovine animals, fresh or
chilled
12,8 + 176,8 €/100 kg/net BF1
02012020 "Compensated" quarters of bovine animals with bone
in, fresh or chilled
12,8 + 176,8 €/100 kg/net BF1
02012030 Unseparated or separated forequarters of bovine
animals, with bone in, fresh or chilled
12,8 + 141,4 €/100 kg/net BF1
02012050 Unseparated or separated hindquarters of bovine
animals, with bone in, fresh or chilled
12,8 + 212,2 €/100 kg/net BF1
02012090 Fresh or chilled bovine cuts, with bone in (excl.
carcases and half-carcases, "compensated quarters",
forequarters and hindquarters)
12,8 + 265,2 €/100 kg/net BF1
02013000 Fresh or chilled bovine meat, boneless 12,8 + 303,4 €/100 kg/net BF1
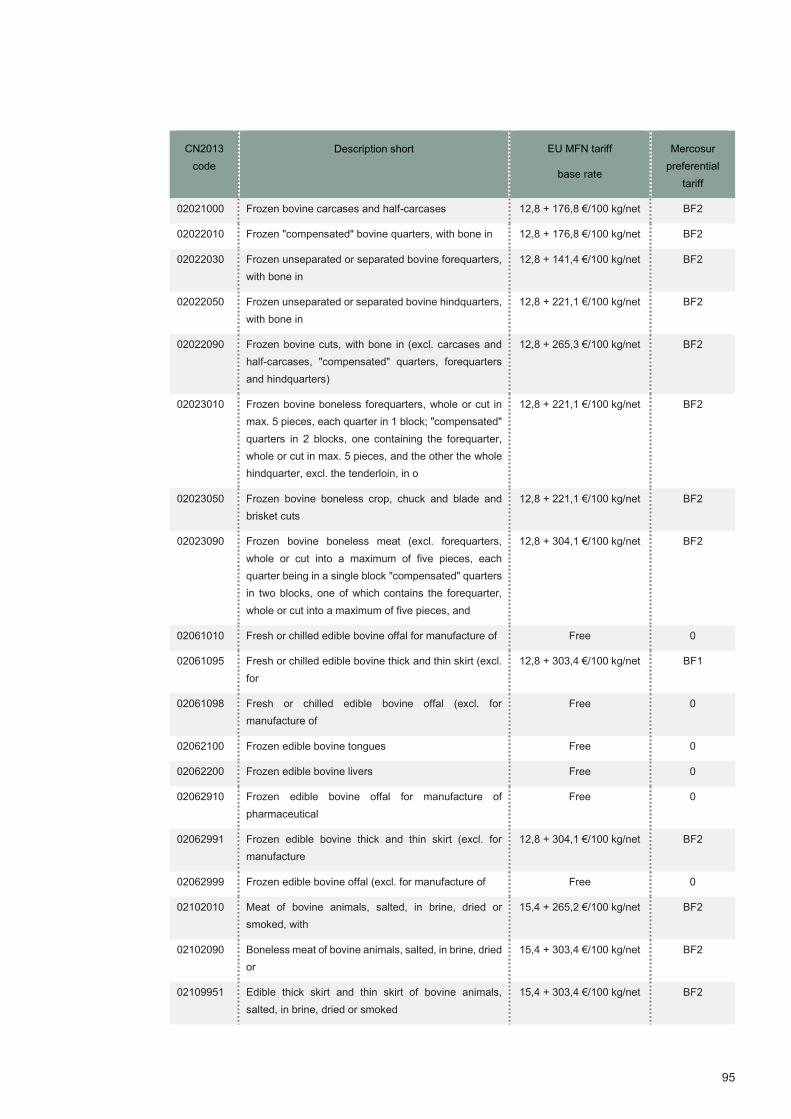
95
CN2013
code
Description short EU MFN tariff
base rate
Mercosur
preferential
tariff
02021000 Frozen bovine carcases and half-carcases 12,8 + 176,8 €/100 kg/net BF2
02022010 Frozen "compensated" bovine quarters, with bone in 12,8 + 176,8 €/100 kg/net BF2
02022030 Frozen unseparated or separated bovine forequarters,
with bone in
12,8 + 141,4 €/100 kg/net BF2
02022050 Frozen unseparated or separated bovine hindquarters,
with bone in
12,8 + 221,1 €/100 kg/net BF2
02022090 Frozen bovine cuts, with bone in (excl. carcases and
half-carcases, "compensated" quarters, forequarters
and hindquarters)
12,8 + 265,3 €/100 kg/net BF2
02023010 Frozen bovine boneless forequarters, whole or cut in
max. 5 pieces, each quarter in 1 block; "compensated"
quarters in 2 blocks, one containing the forequarter,
whole or cut in max. 5 pieces, and the other the whole
hindquarter, excl. the tenderloin, in o
12,8 + 221,1 €/100 kg/net BF2
02023050 Frozen bovine boneless crop, chuck and blade and
brisket cuts
12,8 + 221,1 €/100 kg/net BF2
02023090 Frozen bovine boneless meat (excl. forequarters,
whole or cut into a maximum of five pieces, each
quarter being in a single block "compensated" quarters
in two blocks, one of which contains the forequarter,
whole or cut into a maximum of five pieces, and
12,8 + 304,1 €/100 kg/net BF2
02061010 Fresh or chilled edible bovine offal for manufacture of Free 0
02061095 Fresh or chilled edible bovine thick and thin skirt (excl.
for
12,8 + 303,4 €/100 kg/net BF1
02061098 Fresh or chilled edible bovine offal (excl. for
manufacture of
Free 0
02062100 Frozen edible bovine tongues Free 0
02062200 Frozen edible bovine livers Free 0
02062910 Frozen edible bovine offal for manufacture of
pharmaceutical
Free 0
02062991 Frozen edible bovine thick and thin skirt (excl. for
manufacture
12,8 + 304,1 €/100 kg/net BF2
02062999 Frozen edible bovine offal (excl. for manufacture of Free 0
02102010 Meat of bovine animals, salted, in brine, dried or
smoked, with
15,4 + 265,2 €/100 kg/net BF2
02102090 Boneless meat of bovine animals, salted, in brine, dried
or
15,4 + 303,4 €/100 kg/net BF2
02109951 Edible thick skirt and thin skirt of bovine animals,
salted, in brine, dried or smoked
15,4 + 303,4 €/100 kg/net BF2

96
CN2013
code
Description short EU MFN tariff
base rate
Mercosur
preferential
tariff
02109959 Edible offal of bovine animals, salted, in brine, dried or
smoked (excl. thick skirt and thin skirt)
12,8 7
15021010 Tallow of bovine animals, sheep or goats, for industrial
uses (excl. for manufacture of foodstuffs, and oil and
oleo stearin)
Free 0
15021090 Tallow of bovine animals, sheep or goats (excl. for
technical/industrial uses, and oil and oleostearin)
3,2 0
15029010 Fats of bovine animals, sheep or goats, for industrial
uses (excl. for manufacture of foodstuffs, and tallow,
oleostearin and oleo-oil)
Free 0
15029090 Fats of bovine animals, sheep or goats (excl. for
technical/industrial uses, and tallow, oleostearin and
oleo-oil)
3,2 0
16025010 Prepared or preserved meat or offal of bovine animals, 303,4 €/100 kg/net BF2
16025031 Corned beef, in airtight containers 16,6 4
16025095 Meat or offal of bovine animals, prepared or preserved,
cooked (excl. corned beef in airtight containers,
sausages and similar products, finely homogenised
preparations put up for retail
16,6 4
16029069 Prepared or preserved meat or meat offal, cooked,
containing meat or offal of bovine animals (excl. of
poultry, domestic swine, game or rabbits, sausages
and similar products, finely homogenised preparations
put up for retail sale as infant food or for dietetic
purposes, in containers of a net weight of <= 250 g,
preparations of liver and meat extracts and juices)
16,6 10
Notes: BF1: Included in the tariff rate quota of 55,000 tons CWE of fresh beef at 7.5% preferential tariff. BF2: Included in the tariff
rate quota of 44,000 tons CWE of frozen beef at 7.5% preferential tariff.
For some tariff lines, these concessions consist of a preferential tariff rate (not necessarily zero, but lower
than the Most Favoured Nation (MFN) rate). For other tariff lines, the EU has offered preferential TRQs
which would allow a limited quantity of beef to be imported at a reduced rate of duty. Imports beyond this
quantity would pay the full EU MFN tariff.
The Agreement would allow an additional 99,000 tons of beef CWE to enter the EU market with a 7.5%
tariff. 55% of this is for "fresh", high quality beef, and the remaining 45% for "frozen" beef. This has been
interpreted as an additional TRQ of 55,000 tons CWE for fresh beef and 44,000 tons CWE for frozen
beef.34 This quota access will be gradually phased in in six equal annual steps.
These EU import quotas will be apportioned between Mercosur countries with shares agreed between
Mercosur countries and communicated to the EU in advance. One suggestion is that Mercosur will
maintain a 1994 agreement on the share-out of the Hilton beef quota (see below) between the four
countries according to which 42.5% of any EU quota would go to Brazil, 29.5% to Argentina, 21% to
34 Strictly, a 55%/45% division of a total quota of 99,000 tons would yield shares of 54,450 tons and 44,550 tons.

97
Uruguay and 7% to Paraguay.35 The smaller countries are holding out for a larger share. In addition, the
in-quota duty rate on the Hilton High Quality Beef quota (46,876 tons in product weight for the four
Mercosur exporters) is reduced from 20% to 0%.
For EU import quotas, the Agreement foresees management by the EU in accordance with its legislation.
For all the most sensitive products (notably for beef), this entails the use of import licenses allocated
through simultaneous examination (this is a method of distributing the quota among applicants in
proportion to the quantities requested when the applications were lodged). For less sensitive quotas,
another method such as first come, first served may apply.
In addition, the Agreement includes a bilateral safeguard mechanism that allows the EU to suspend a tariff
preference that results in a significant increase in imports, which causes, or threatens to cause, serious
injury to EU producers.
The former Commissioner for Agriculture and Rural Development Phil Hogan announced that the
Commission is committed to making available a EUR 1 bn support package for the agriculture sector in
case the implementation of the EU-Mercosur Agreement would result in market disturbances.36
The significance of these tariff and market access concessions is underlined by comparing them to the
MFN tariffs on beef expressed in ad valorem terms. All Mercosur fresh beef enters the EU under the tariff
code 02013000 (fresh or chilled boneless cuts) and virtually all of the frozen beef enters under the tariff
code 02023090 (frozen boneless cuts), so these two tariff codes are chosen as examples in Table C1. The
tariffs imposed on beef imports are compound tariffs, consisting both of an ad valorem component and a
specific tariff expressed in EUR/100 kg. To calculate an overall ad valorem equivalent (AVE), the relevant
tariff rates are applied to the unit value of EU imports from Mercosur countries (see Table C11). As these
unit values can vary from year to year, two recent years (2017 and 2019) are arbitrarily chosen and shown
in Table C2.
For fresh beef, the MFN AVE tariff is 45-48%, while for frozen beef the AVE tariff is 64-71%. Note the
significant difference between these AVEs despite the similarity of the tariffs applied. The average value of
frozen beef is lower compared to fresh beef, hence the MFN ad valorem equivalent tariff works out much
higher. Compared to these MFN AVEs, the tariff rates currently charged on in-quota imports under the
Hilton beef quota (20%) and GATT frozen beef quota (20%) represent a significant preferential margin.
This preferential margin would be further increased for the EU-Mercosur Agreement quota (7.5%) while
the in-quota tariff on Hilton beef imports would be reduced to 0%.
Table C2 Selection of beef products exported by Mercosur countries to the EU with effective ad
valorem equivalent comparison
CN Code Product Tariff rate Effective ad valorem
equivalent (2017
unit value price)
Effective ad valorem
equivalent (2019
unit value price)
02013000 Fresh or chilled –
boneless cuts
12.8%
+€303.4/100kg
45% 48%
02023090 Frozen - Other
boneless cuts
12.8% +
€304.10/100 kg
64% 71%
Source: Professor Alan Mathews calculations based on Eurostat COMEXT and TARIC data
35 See also IEG Vu/IEG Policy (2019). Although these are the shares in the 1994 agreement, the current shares administered by the EU are very different and give Argentina the largest share, see Section 2 below for the bilateral distribution.
36 See Commission answers to Parliamentary questions from Diane Dodds MEP 15 July 2019 E-002283-19, from Irene Tollet MEP 26 July 2019 P-002464-19, and from Matt McCarthy MEP 31 July 2019 E-002496-19.
98
Some stakeholders have raised concerns that the proposed additional TRQ for fresh and frozen beef in
the EU-Mercosur Agreement will mean an additional volume of beef imports on the EU market that will
depress prices to the detriment of Irish producers. They also highlighted that, because the cuts that will be
shipped are high value steaks, the market impact will be greater than what might be expected by looking at
volumes alone. The concerns focused on the TRQ access because beef imported under the TRQ will
compete most directly with Irish product; the reduction in tariffs on processed beef products (e.g. on
corned beef from 16.6% to 4%) was not specifically raised as an issue.
The European Commission has responded to these concerns by pointing out that the size of the new tariff
quota is small relative to overall EU production and consumption, around 1% of the market. It also
highlights that the EU already imports beef from Mercosur countries both in-quota (at preferential tariff
rates) and over-quota (paying the full MFN tariffs shown in Table C1). The first effect of the new quota will
therefore be to relieve existing imports from duties rather than to create new trade flows (additional market
access).
The main concern of Irish stakeholders is not that Mercosur beef will be exported to Ireland and compete
with Irish beef on the Irish market. As shown later, Mercosur beef is largely sold to a handful of other EU
countries that account for the bulk of imports. The concern is that additional competition on these markets,
and the erosion of Ireland’s preferential access to other EU member state markets, will lower the EU
market price and hence the price that Irish beef producers can expect to receive on these markets.
The objective of this supplementary analysis is therefore to determine the likely market impact of the
additional Mercosur tariff quota for beef on EU market prices. In conducting this analysis, we have paid
attention to two issues in particular:
• How much additional beef imports might the new TRQ in the proposed EU-Mercosur Agreement
generate, given that Mercosur exporters have shown they are already able to export beef at the
full MFN tariff?
• The implications of recognising that imports under the TRQ will largely be high-value beef cuts
and may have a disproportionate effect on market prices for this reason.
This supplementary analysis proceeds in three steps. The first step describes the role of imports on the EU
beef market and the various tariff rate quotas (TRQs) that facilitate these imports. The second step
examines existing Mercosur beef exports to the EU and the utilisation by these exporters of existing TRQs.
The third step provides our estimate of the market impacts taking account of our estimate of the additional
imports that will be facilitated by the TRQ and the higher quality of these imports.
The EU Beef Market and Existing Import Arrangements
The beef supply balance sheet in the EU28 is shown in Table C3. On a volume basis, the EU market is
self-sufficient in beef and veal (the ratio of production to consumption was around 100% in the early 2010s
and has since grown to 102% as consumption has fallen while production has remained steady). Imports
are a small share of domestic supply. Imports of beef of around 300,000 tons annually amount to about
4% of domestic production and are almost counterbalanced by beef exports of a similar order of
magnitude. In addition, there is also a live export trade in cattle, while live imports of cattle are negligible.
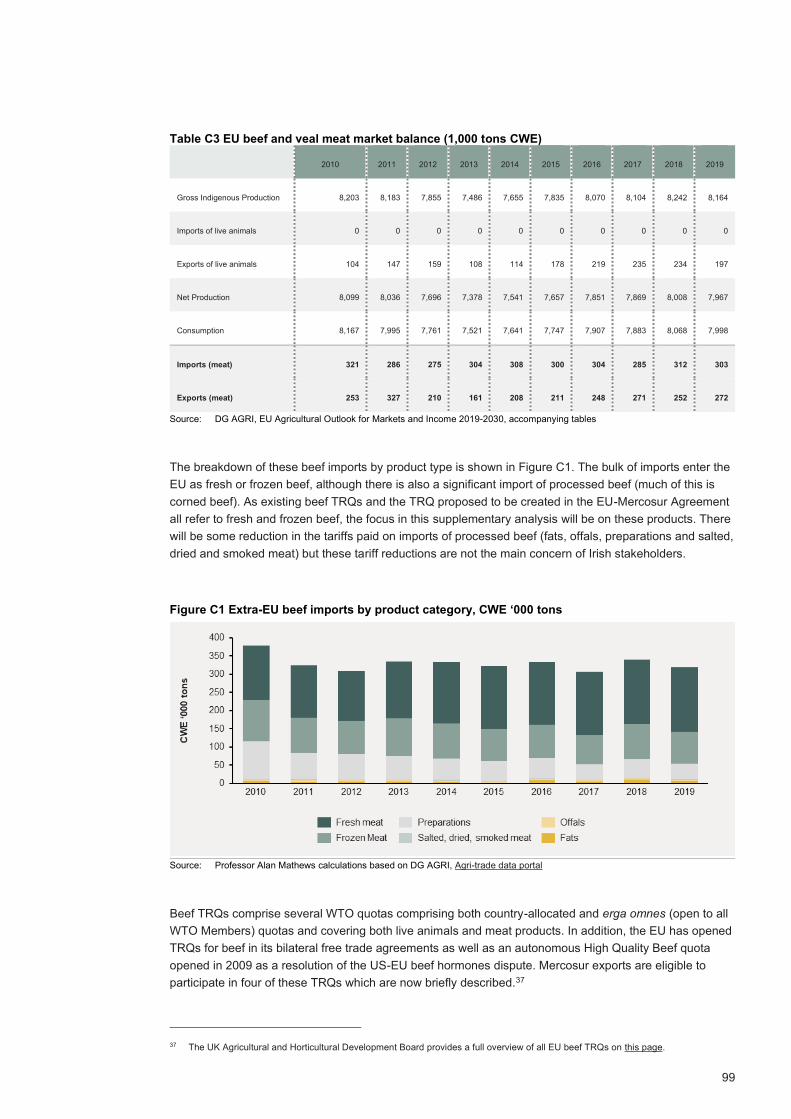
99
Table C3 EU beef and veal meat market balance (1,000 tons CWE)
2010 2011 2012 2013 2014 2015 2016 2017 2018 2019
Gross Indigenous Production 8,203 8,183 7,855 7,486 7,655 7,835 8,070 8,104 8,242 8,164
Imports of live animals 0 0 0 0 0 0 0 0 0 0
Exports of live animals 104 147 159 108 114 178 219 235 234 197
Net Production 8,099 8,036 7,696 7,378 7,541 7,657 7,851 7,869 8,008 7,967
Consumption 8,167 7,995 7,761 7,521 7,641 7,747 7,907 7,883 8,068 7,998
Imports (meat) 321 286 275 304 308 300 304 285 312 303
Exports (meat) 253 327 210 161 208 211 248 271 252 272
Source: DG AGRI, EU Agricultural Outlook for Markets and Income 2019-2030, accompanying tables
The breakdown of these beef imports by product type is shown in Figure C1. The bulk of imports enter the
EU as fresh or frozen beef, although there is also a significant import of processed beef (much of this is
corned beef). As existing beef TRQs and the TRQ proposed to be created in the EU-Mercosur Agreement
all refer to fresh and frozen beef, the focus in this supplementary analysis will be on these products. There
will be some reduction in the tariffs paid on imports of processed beef (fats, offals, preparations and salted,
dried and smoked meat) but these tariff reductions are not the main concern of Irish stakeholders.
Figure C1 Extra-EU beef imports by product category, CWE ‘000 tons
Source: Professor Alan Mathews calculations based on DG AGRI, Agri-trade data portal
Beef TRQs comprise several WTO quotas comprising both country-allocated and erga omnes (open to all
WTO Members) quotas and covering both live animals and meat products. In addition, the EU has opened
TRQs for beef in its bilateral free trade agreements as well as an autonomous High Quality Beef quota
opened in 2009 as a resolution of the US-EU beef hormones dispute. Mercosur exports are eligible to
participate in four of these TRQs which are now briefly described.37
37 The UK Agricultural and Horticultural Development Board provides a full overview of all EU beef TRQs on this page.

100
Hilton High Quality Beef (HQB) quota
The Hilton quota is for 66,826 tons of beef on a product weight basis with quantities allocated on a
country-specific basis plus two quotas for buffalo meat for Australia and Argentina, respectively. The Hilton
beef quota had originally been granted by the European Economic Community during the Tokyo Round
Multilateral Trade Negotiations in 1979 under the auspices of GATT, the General Agreement on Tariffs
and Trade. As a result of the Uruguay Round Trade Negotiations, the European Communities converted
the Hilton beef quota to a tariff rate quota listed in its schedule of WTO commitments.38 Over the years,
both the beneficiaries and the TRQ amounts have changed, for example, because of successive
enlargements of the EU. The current legislative basis for the Hilton beef quota is Commission
Implementing Regulation (EU) No 593/2013 which has been updated on several occasions.
The Hilton beef quota is specifically allocated for high-quality fresh, chilled, and frozen beef, the
specifications for which are set out in Regulation 593/2013. Generally, the quota covers selected cuts of
boneless beef meeting certain age and conformation standards and, in the case of Mercosur beneficiaries,
must have been exclusively fed through pasture grazing since weaning. The in-quota tariff is 20% (except
for Canada since September 2017 when the EU-Canada Free Trade Agreement went into effect under
which the in-quota rate applicable to beef imports from Canada has been reduced to zero).
The table below shows all four Mercosur countries have specific allocations under the Hilton beef quota,
with Argentina by far the largest beneficiary. The table also shows that Argentina, Uruguay, and Paraguay
generally make full use of their allocations, but Brazil recently has taken up less than half of its allocated
quota. Brazilian beef exporters may have difficulty in sourcing sufficient animals with the specification that
they are fully pasture-fed after weaning to be able to utilise all its Hilton beef quota.
Table C4 Allocation and usage of Hilton beef tariff quota (product weight)
Source: DG AGRI, Market situation for beef, Beef Market Observatory, version 20 May 2020
38 Schedule CXL - European Communities, Part I Most-Favoured-Nation Tariff, Section I - Agricultural Products, Section I B Tariff Quotas.

101
GATT frozen beef quota
The quantity which may be imported under the GATT frozen beef quota is 54,875 tons of frozen beef and
veal (expressed as boneless product weight), falling within CN codes 0202 and 0206 2991 with an in-
quota preferential customs duty of 20% ad valorem.39 Unlike the Hilton quota, this is an erga omnes quota.
This means that the quota is not pre-allocated to individual countries but is managed by first allocating
import rights to importers who apply and subsequently issuing import licences. The relevant legislation is
Commission Regulation (EC) No 431/2008.
Frozen beef (A & B) intended for processing
This refers to an import tariff quota of 63,703 tons, bone-in (or carcass weight equivalent) of frozen beef
falling within CN codes 0202 20 30, 0202 30 10, 0202 30 50, 0202 30 90 or 0206 29 91 and intended for
processing in the Community. Two types of products are distinguished for duty purposes: ‘A’ products
include meat intended to produce cooked beef products and ‘B’ products are meat intended to be used to
produce smoked and salted products. 50,000 tons are reserved for A products and the remaining 13,703
tons is intended for the manufacture of B products. The in-quota tariff rate for A products is 20% and an
additional specific levy is added for B products. The quota is managed on an erga omnes basis. The
relevant EU legislation is Commission Regulation (EC) No. 412/2008 as updated.
Grain-fed beef (High Quality Beef “Hormones”)
In 2009, the EU and the US concluded a Memorandum of Understanding, revised in 2014, that provided a
solution to a longstanding dispute in the World Trade Organization (WTO) regarding the use of certain
growth-promoting hormones in beef production in the US. Under the agreement, a 45,000 tons (product
weight) quota of non-hormone treated fresh, chilled or frozen beef was opened by the EU to qualifying
suppliers, which included the United States. This is an autonomous quota referred to as the ‘EU 481 grain
fed beef’ quota. Although managed on an erga omnes basis until now, only the US, Canada, New
Zealand, Australia, Uruguay and Argentina are recognised by the EU as eligible.
Licenses are allocated on a first-come, first served basis. Contrary to the requirements for Mercosur
countries under the Hilton quota which is limited to beef derived from solely pasture-fed animals, eligibility
for the grain-fed beef quota requires that the beef cuts are obtained from carcasses of heifers and steers
less than 30 months of age at slaughter which have only been fed a diet, for at least the last 100 days
before slaughter, containing not less than 62% of concentrates and/or feed grain co-products on a dietary
dry matter basis. The in-quota tariff is 0%.
The usage of the grain-fed beef quota is shown in the following table. This quota is fully subscribed. As this
is an erga omnes TRQ at present, individual suppliers are not identified. It should be noted that only
Argentina and Uruguay among the Mercosur countries can access this quota (Argentina was granted
access in 2014). Over the years, the US share of imports under the grain-fed beef quota has fallen relative
to these other exporters.
An agreement in August 2019 established that 35,000 tons of this erga omnes quota will now be allocated
to the US, phased in over a 7-year period, with the remaining amount (10,000 tons at the end of the 7-year
phase-in period) left available for all other eligible exporters. This means that some amount of Argentinian
and Uruguayan beef currently exported under this quota will likely be displaced to the new Mercosur
quota. The legislative basis for this quota is Commission Implementing Regulation (EU) No 481/2012 as
updated.
39 For the purposes of this quota, the legislation specifies that 100kgs of bone-in meat equates to 77kgs of boneless meat.

102
Table C5 Allocation and usage of grain-fed beef TRQ by quarterly tranche
Source: DG AGRI, Market situation for beef, Beef Market Observatory, version 20 May 2020
Impact of Brexit on TRQ volumes and market balance
There will be a further change in the quantities involved following the end of the transition period and the
application of the EU-UK Trade and Cooperation Agreement (TCA). The parties have agreed that import
commitments under WTO tariff quotas will be apportioned between them based on historic usage. The
impact of this apportionment on future TRQ volumes is shown in Table C6. Negotiations with WTO
members affected by the re-apportionment to resolve this issue are ongoing at the WTO.
Notwithstanding the successful conclusion of the EU-UK TCA, relative to previous arrangements in the
Single Market, there will still be an increase in trade frictions and trade costs due to the need for border
checks and particularly sanitary inspections at border inspection posts. In addition, the UK will forge its
independent trade policy in a post-Brexit world, which may result in free trade agreements with third
countries that further increase competition for EU exporters on the UK market. While these potential
market impacts are not within the scope of this study, Table C6 gives an indication of the current volume of
trade that will be affected. The outcome of the EU-UK trade negotiations will affect a much larger volume
of beef trade than that covered by the EU-Mercosur Agreement.
Table C6 Trade in beef and live animals between UK and EU27, CWE
2016 2017 2018 2019
Exports to the UK 477,394 493,228 486,487 440,170
Imports from the UK 134,098 133,588 138,603 159.683
Source: DG AGRI, Market situation for beef, Beef Market Observatory, version 20 May 2020
Table C7 summarises current Mercosur access under the main beef TRQs. For management purposes,
each of the TRQs is given an Order Number by the European Commission which is shown in the second
column. The table also shows the current volumes permitted for entry to EU28 and how these will change

103
for the EU27 following the end of the Withdrawal Agreement transition period. Finally, the table notes the
usage of these TRQs in recent years.40
Table C5 EU beef TRQs relevant for Mercosur exporters
Import TRQ Order
No.
Origin Annual
tonnage
(tons)
Tonnage in
CWE*
(tons)
Annual
tonnage EU27
post Brexit
(tons)
Usage in
recent years
GATT frozen beef 09.4003 Erga omnes 54,875 71,266 43,732 Over-
subscribed
A & B Processing Erga omnes 63,703 63,703
A products 09.4057 50,000 50,000 15,443 Virtually no
demand
B products 09.4058 13,703 13,703 4,223 No demand
Hilton HQB Beef
66,750 86,688 Approx. 80%
usage
09.4002 US/Canada 11,500 14,590 11,481 Limited uptake
2019
09.4450 Argentina 29,500 38,312 29,389 Well used
9.4451 Australia 7,150 9,295 2,481 Two-thirds
used
9.4452 Uruguay 6,376 8,281 3,584 Well used
9.4453 Brazil 10,000 12,987 8,951 Half used
9.4454 New Zealand 1,300 846 80% used
9.4455 Paraguay 1,000 1,299 711 Well used
481 grain-fed HQB
beef Hormones**
09.2201 Erga omnes
among eligible
exporters
45,000 58,441 Over-
subscribed
US 35,000 35,000
09.2202 ARG, AUS, CAN,
NZ, URU
10,000 10,000
40 TRQ usage figures are available for selected Order Numbers in the DG AGRI document on allocation coefficients. For the Hilton and HQB quotas, the information is provided in the regular updates in the DG AGRI Beef Market Observatory.
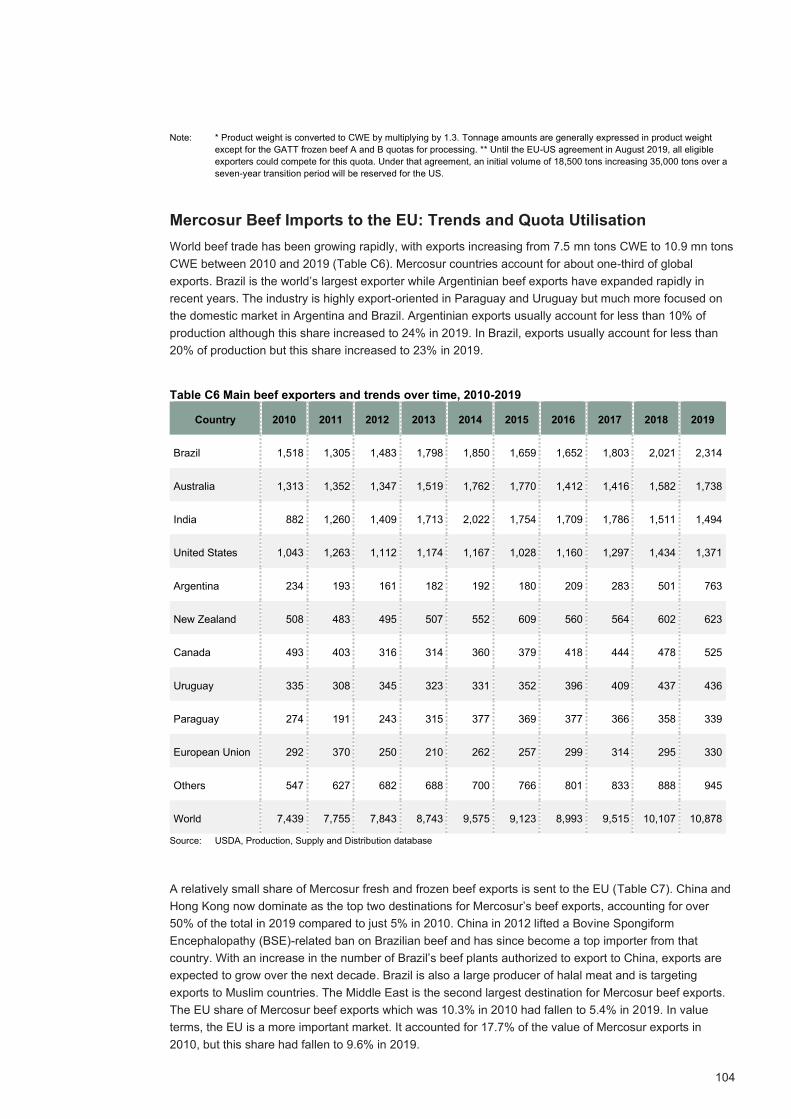
104
Note: * Product weight is converted to CWE by multiplying by 1.3. Tonnage amounts are generally expressed in product weight
except for the GATT frozen beef A and B quotas for processing. ** Until the EU-US agreement in August 2019, all eligible
exporters could compete for this quota. Under that agreement, an initial volume of 18,500 tons increasing 35,000 tons over a
seven-year transition period will be reserved for the US.
Mercosur Beef Imports to the EU: Trends and Quota Utilisation
World beef trade has been growing rapidly, with exports increasing from 7.5 mn tons CWE to 10.9 mn tons
CWE between 2010 and 2019 (Table C6). Mercosur countries account for about one-third of global
exports. Brazil is the world’s largest exporter while Argentinian beef exports have expanded rapidly in
recent years. The industry is highly export-oriented in Paraguay and Uruguay but much more focused on
the domestic market in Argentina and Brazil. Argentinian exports usually account for less than 10% of
production although this share increased to 24% in 2019. In Brazil, exports usually account for less than
20% of production but this share increased to 23% in 2019.
Table C6 Main beef exporters and trends over time, 2010-2019
Country 2010 2011 2012 2013 2014 2015 2016 2017 2018 2019
Brazil 1,518 1,305 1,483 1,798 1,850 1,659 1,652 1,803 2,021 2,314
Australia 1,313 1,352 1,347 1,519 1,762 1,770 1,412 1,416 1,582 1,738
India 882 1,260 1,409 1,713 2,022 1,754 1,709 1,786 1,511 1,494
United States 1,043 1,263 1,112 1,174 1,167 1,028 1,160 1,297 1,434 1,371
Argentina 234 193 161 182 192 180 209 283 501 763
New Zealand 508 483 495 507 552 609 560 564 602 623
Canada 493 403 316 314 360 379 418 444 478 525
Uruguay 335 308 345 323 331 352 396 409 437 436
Paraguay 274 191 243 315 377 369 377 366 358 339
European Union 292 370 250 210 262 257 299 314 295 330
Others 547 627 682 688 700 766 801 833 888 945
World 7,439 7,755 7,843 8,743 9,575 9,123 8,993 9,515 10,107 10,878
Source: USDA, Production, Supply and Distribution database
A relatively small share of Mercosur fresh and frozen beef exports is sent to the EU (Table C7). China and
Hong Kong now dominate as the top two destinations for Mercosur’s beef exports, accounting for over
50% of the total in 2019 compared to just 5% in 2010. China in 2012 lifted a Bovine Spongiform
Encephalopathy (BSE)-related ban on Brazilian beef and has since become a top importer from that
country. With an increase in the number of Brazil’s beef plants authorized to export to China, exports are
expected to grow over the next decade. Brazil is also a large producer of halal meat and is targeting
exports to Muslim countries. The Middle East is the second largest destination for Mercosur beef exports.
The EU share of Mercosur beef exports which was 10.3% in 2010 had fallen to 5.4% in 2019. In value
terms, the EU is a more important market. It accounted for 17.7% of the value of Mercosur exports in
2010, but this share had fallen to 9.6% in 2019.

105
Table C7 Relative importance of importers for Mercosur fresh/frozen beef exports
Quantity shares
2010 2011 2012 2013 2014 2015 2016 2017 2018 2019
EU28 10.3% 11.2% 9.6% 8.3% 7.6% 7.8% 7.8% 7.4% 7.0% 5.4%
Middle East 27.3% 25.5% 22.7% 17.8% 16.9% 21.6% 21.9% 21.9% 18.1% 16.1%
Chile 8.1% 7.9% 6.9% 7.1% 6.9% 7.8% 8.9% 8.7% 8.6% 7.5%
Russian Federation 31.2% 29.9% 30.8% 25.9% 24.4% 15.1% 11.1% 9.9% 7.4% 5.7%
China 1.0% 1.3% 3.3% 7.4% 7.3% 19.3% 24.4% 27.9% 34.7% 46.3%
Hong Kong, China 4.5% 5.6% 6.5% 11.8% 13.2% 9.0% 9.0% 11.3% 10.8% 7.5%
Other 17.6% 18.6% 20.2% 21.7% 23.9% 19.5% 16.9% 12.8% 13.3% 11.6%
Value shares
2010 2011 2012 2013 2014 2015 2016 2017 2018 2019
EU28 17.7% 20.1% 17.3% 15.2% 14.7% 14.8% 16.1% 14.4% 13.3% 9.6%
Middle East 26.2% 24.3% 22.0% 16.1% 14.8% 19.7% 20.0% 20.7% 16.6% 14.0%
Chile 15.2% 12.6% 8.5% 9.8% 10.2% 12.4% 13.8% 13.9% 12.7% 10.3%
Russian Federation 21.9% 20.9% 24.0% 21.2% 20.1% 10.9% 8.1% 7.4% 6.0% 4.4%
China 0.4% 0.5% 1.9% 3.5% 3.7% 13.4% 17.0% 20.3% 29.2% 45.4%
Hong Kong, China 3.5% 4.7% 6.1% 11.8% 12.8% 8.1% 8.7% 10.9% 10.1% 5.7%
Other 15.2% 16.9% 20.1% 22.3% 23.7% 20.6% 16.2% 12.4% 12.2% 10.5%
Source: Professor Alan Mathews calculations based on UN COMTRADE trade statistics, sum of HS 0201 and 0202 trade
Beef producer prices in Brazil and Argentina are much lower than in the EU: differences with Uruguayan
producer prices are less pronounced and in recent months producer prices in Uruguay have climbed
higher than in the EU (Figure C2). In May 2020, the average EU price was €346/100kg compared to
€231/100kg in Argentina and €191/100kg in Brazil. Brazil in particular has always been a low-cost supplier.

106
Figure C2 Beef prices in major producing countries
Source: DG AGRI, Market situation for beef, Beef Market Observatory, version 20 May 2020
Prices are just one component in determining the relative competitiveness of different suppliers; costs and
productivity are also important. The competitiveness of Irish beef producers relative to other EU and non-
EU producers has been examined in Thorne et al. (2017). For countries outside the EU, this study uses
cost comparisons derived from the agribenchmark network which collects and publishes data on the costs
and returns from beef production at the farm level for typical beef farms from around the world. Teagasc is
the Irish partner in this international network and provides data on typical Irish beef farms based on
information collected in the Teagasc National Farm Survey. For the purposes of the exercise the typical
Irish beef finisher has 40 finishers, while the typical Irish cow-calf (single suckling) farm has 30 beef cows.
The agribenchmark results compare total returns for the beef enterprise (including coupled payments but
excluding decoupled payments that contribute to whole farm profitability) with total costs (including cash
costs, depreciation, and opportunity costs). The Thorne et al. (2017) study, based on data for 2013-2015,
noted that, with few exceptions, beef finishing enterprises around the world have low levels of profitability.
It concluded that cash costs on a typical Irish finishing farm are higher than costs on typical Brazilian and
Argentinian farms. It also found that opportunity costs, and consequently the total economic costs on the
typical Irish finishing farm, are much higher than the average for typical farms from Brazil and Argentina.
For the cow-calf (suckler) enterprise, the Thorne et al. (2017) report noted that, while total returns in
Ireland were higher than on Argentinian and Brazilian farms, both cash costs and, particularly, opportunity
costs, were much higher on Irish farms. It concluded that, when total economic costs are compared to total
revenues from production, the typical Irish cow-calf farm is one of the worst performing farms in the
agribenchmark sample when assessed based on total economic profit per 100 kg liveweight produced.
The next two figures (Figure C3 and Figure C4) provide the most recent data from the agribenchmark
sample on comparative costs of beef production. These figures compare returns to cash costs and
depreciation, neglecting opportunity costs. The horizontal bars show the average results for all the
representative farms considered in each country, while the vertical lines show the range. These more
recent results suggest that profitability on Irish beef farms may now be on a par with Brazilian and
Argentinian producers considering only cash costs and depreciation. Inclusion of opportunity costs, as
Thorne et al. (2017) point out, would make the Irish figures look much less favourable.

107
Figure C3 Medium-term profitability of the cow-calf enterprise, 2018 (USD per 100 kg CWE)
Source: Deblitz (2019)
Figure C4 Medium-term profitability of the beef finishing enterprise 2018 (USD per 100 kg CWE)
Source: Deblitz (2019)
Just as the comparison of producer prices (Figure C2) requires conversion to a common currency (EUR),
the agribenchmark cost comparisons are provided in a common currency (USD). The exchange rates used
to convert national currencies to a common currency will influence the relative rankings. The
competitiveness of Mercosur beef exports to the EU depends, in part, on relative exchange rates. The
movement in nominal exchange rates between the Brazilian real and the Argentinian peso and the euro
are shown in Figure C5. Both currencies have depreciated strongly against the euro (shown by the
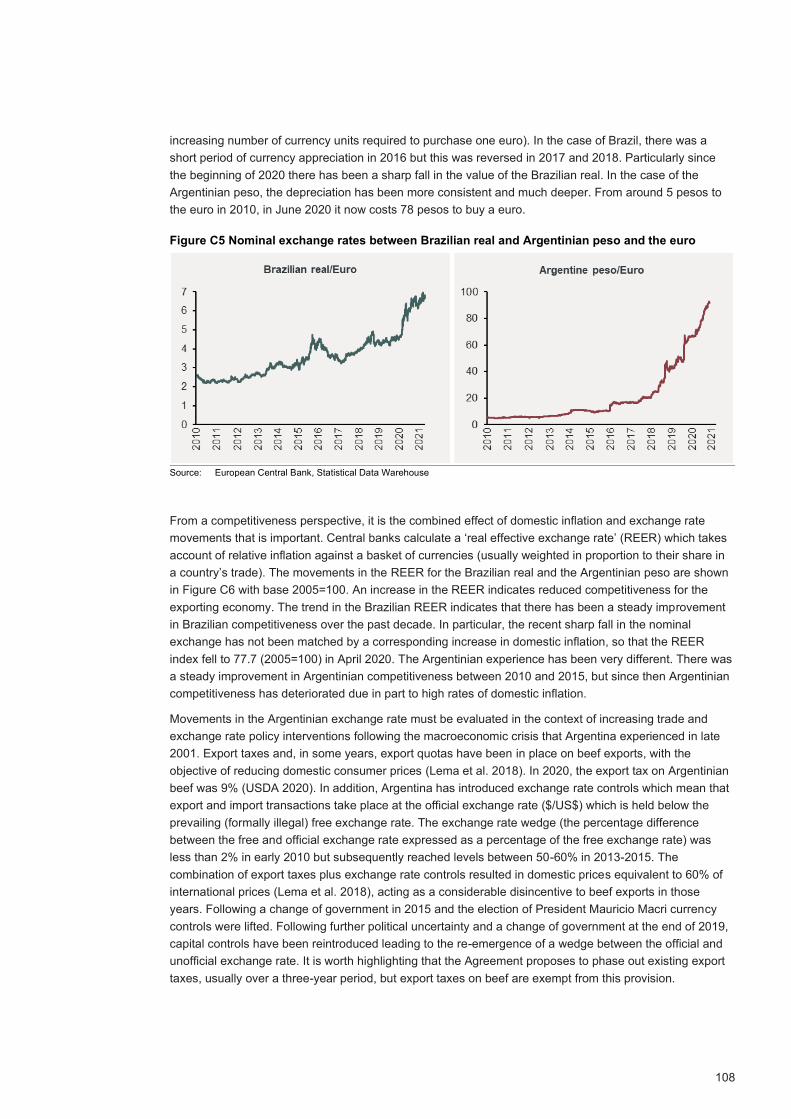
108
increasing number of currency units required to purchase one euro). In the case of Brazil, there was a
short period of currency appreciation in 2016 but this was reversed in 2017 and 2018. Particularly since
the beginning of 2020 there has been a sharp fall in the value of the Brazilian real. In the case of the
Argentinian peso, the depreciation has been more consistent and much deeper. From around 5 pesos to
the euro in 2010, in June 2020 it now costs 78 pesos to buy a euro.
Figure C5 Nominal exchange rates between Brazilian real and Argentinian peso and the euro
Source: European Central Bank, Statistical Data Warehouse
From a competitiveness perspective, it is the combined effect of domestic inflation and exchange rate
movements that is important. Central banks calculate a ‘real effective exchange rate’ (REER) which takes
account of relative inflation against a basket of currencies (usually weighted in proportion to their share in
a country’s trade). The movements in the REER for the Brazilian real and the Argentinian peso are shown
in Figure C6 with base 2005=100. An increase in the REER indicates reduced competitiveness for the
exporting economy. The trend in the Brazilian REER indicates that there has been a steady improvement
in Brazilian competitiveness over the past decade. In particular, the recent sharp fall in the nominal
exchange has not been matched by a corresponding increase in domestic inflation, so that the REER
index fell to 77.7 (2005=100) in April 2020. The Argentinian experience has been very different. There was
a steady improvement in Argentinian competitiveness between 2010 and 2015, but since then Argentinian
competitiveness has deteriorated due in part to high rates of domestic inflation.
Movements in the Argentinian exchange rate must be evaluated in the context of increasing trade and
exchange rate policy interventions following the macroeconomic crisis that Argentina experienced in late
2001. Export taxes and, in some years, export quotas have been in place on beef exports, with the
objective of reducing domestic consumer prices (Lema et al. 2018). In 2020, the export tax on Argentinian
beef was 9% (USDA 2020). In addition, Argentina has introduced exchange rate controls which mean that
export and import transactions take place at the official exchange rate ($/US$) which is held below the
prevailing (formally illegal) free exchange rate. The exchange rate wedge (the percentage difference
between the free and official exchange rate expressed as a percentage of the free exchange rate) was
less than 2% in early 2010 but subsequently reached levels between 50-60% in 2013-2015. The
combination of export taxes plus exchange rate controls resulted in domestic prices equivalent to 60% of
international prices (Lema et al. 2018), acting as a considerable disincentive to beef exports in those
years. Following a change of government in 2015 and the election of President Mauricio Macri currency
controls were lifted. Following further political uncertainty and a change of government at the end of 2019,
capital controls have been reintroduced leading to the re-emergence of a wedge between the official and
unofficial exchange rate. It is worth highlighting that the Agreement proposes to phase out existing export
taxes, usually over a three-year period, but export taxes on beef are exempt from this provision.

109
Figure C6 Real effective exchange rates for the Brazilian real and Argentinian peso
Source: ceicdata.com
Total EU28 fresh and frozen beef imports from all suppliers have amounted to around 260,000 tons
annually. The trend appears slightly upward though with some annual fluctuations (Figure C7). Imports
from Mercosur exporters have grown from around 175,000 tons annually to over 200,000 tons annually in
recent years (but were even higher in earlier years). Throughout the past decade, Mercosur imports have
accounted for 71% of total EU imports of fresh and frozen beef in CWE, with a slight increase in this share
in recent years.
Figure C7 EU28 Beef imports (fresh & frozen) in total and from Mercosur, CWE ‘000 tons
Source: Professor Alan Mathews calculations based on DG AGRI, Agri-trade data portal
The increase in Mercosur imports in recent years is due to Argentina, whose exports have recovered to
levels previously seen at the beginning of the decade at around 65,000 tons, helped by the removal of
exchange rate discrimination. Imports from Brazil experienced a step change in 2013 from a level of
around 60,000 tons to a new ‘normal’ of around 85,000 tons in recent years. Imports from Uruguay have
remained rather stable at around 50,000 tons annually. Imports from Paraguay in some years have been
zero but generally amount to about 5,000 tons annually (Figure C8).

110
Figure C8 EU28 imports of fresh/frozen beef from Mercosur, CWE ‘000 tons
Source: Professor Alan Mathews calculations based on DG AGRI, Agri-trade data portal
Composition of Mercosur Fresh and Frozen Beef Imports
Mercosur fresh/frozen beef imports enter the EU mainly under two product codes (Table C10). Beef is
imported in boneless rather than bone-in or carcass form. This is mainly a sanitary requirement to avoid
importing the foot-and-mouth (FMD) virus from countries and regions that are FMD free with vaccination.
Even if this were not the case, where beef is exported under a tariff quota with a fixed volume specified in
product weight or carcass weight, the value of exports can be maximised by first removing the bones and
selling a premium product. There is just one CN8 tariff heading for fresh and chilled boneless beef
(02013000). For frozen boneless beef there are three possible headings. However, virtually all Mercosur
exports come in the form of ‘frozen beef boneless, other’ (02023090).
There are important differences between Mercosur exporters. For example, nearly all Argentinian exports
come in the form of fresh beef. Uruguay and Paraguay also export more fresh beef although
proportionately more frozen beef than Argentina. Brazil, although a large exporter of fresh beef, exports far
more frozen beef than fresh beef to the EU. Given that the overall Mercosur tariff quota will be allocated
between the individual Mercosur exporters, these differences may influence the future utilisation of these
quotas.
Table C8 Import values and volumes for selected beef products from Mercosur, 2017-2019
Exporter CN Code Product Value (€ mn)
Quantity (tons)
2017 2018 2019 2017 2018 2019
Argentina 02013000 Fresh or chilled beef, boneless 401 428 451 37,016 46,095 48,749
02023010 Frozen beef boneless,
forequarters
0 0 0 11 0 0
02023050 Frozen beef boneless, crop,
chuck and brisket
0 0 0 0 0 0
02023090 Frozen beef boneless, other 8 11 11 1,283 1,891 2,261
Brazil 02013000 Fresh or chilled beef, boneless 196 169 143 22,917 22,436 20,933

111
02023010 Frozen beef boneless,
forequarters
0 0 0 74 121 0
02023050 Frozen beef boneless, crop,
chuck and brisket
0 0 0 0 0 48
02023090 Frozen beef boneless, other 198 248 230 33,520 47,191 45,931
Paraguay 02013000 Fresh or chilled beef, boneless 29 20 17 3,858 2,951 2,431
02023010 Frozen beef boneless,
forequarters
0 0 0 0 0 0
02023050 Frozen beef boneless, crop,
chuck and brisket
0 0 0 0 0 0
02023090 Frozen beef boneless, other 8 10 8 1,460 1,886 1,595
Uruguay 02013000 Fresh or chilled beef, boneless 233 213 211 26,444 25,096 24,226
02023010 Frozen beef boneless,
forequarters
0 0 0 34 17 0
02023050 Frozen beef boneless, crop,
chuck and brisket
0 0 0 0 0 0
02023090 Frozen beef boneless, other 97 90 58 15,697 14,608 9,525
Mercosur 02013000 Fresh or chilled beef, boneless 860 830 823 90,234 96,577 96,340
02023010 Frozen beef boneless,
forequarters
1 0 0 120 138 0
02023050 Frozen beef boneless, crop,
chuck and brisket
0 0 0 0 0 48
02023090 Frozen beef boneless, other 311 359 307 51,960 65,576 59,313
Note: Values less than €0.5 mn are rounded down to zero.
Source: Professor Alan Mathews compilation based on Eurostat COMEXT database
Unit values can be calculated by dividing the value of imports under a product code by the quantity
imported. The unit value of product imported under different product codes is shown in Table C11. As unit
values can be unreliable and fluctuate wildly where there is only occasional trade, unit values are shown
only for the two product codes mostly used by Mercosur exporters (02013000 & 02023090). These unit
values are calculated per tonne product weight, but as both tariff headings refer to boneless beef, the unit
values are comparable.
Several conclusions can be drawn from Table C11. First, for each country, fresh beef is valued more
highly than frozen beef. Given these price differences it might seem moot to ask why a country would
choose to export beef in a frozen state rather than the higher valued fresh chilled product. While there may
be differences in market demands for the two types of product, the availability of significant preferential
access (under the GATT frozen beef quota) which incentivises the export of frozen beef is also a factor.
Note that this distinction is maintained in the additional tariff quota proposed under the EU-Mercosur
Agreement where 45% of the Mercosur TRQ is for frozen beef.

112
Argentinian fresh beef sells at a significant premium to beef from other Mercosur countries. This reflects
subjective impressions that Argentinian beef is perceived as a high-quality product (Argentinian steak
restaurants are found in most major European cities). There seems to be some evidence that fresh beef
from Uruguay is also perceived as a superior product. There is little significant difference in the unit values
for frozen beef products between the different sources.
Table C11 Unit values for main beef products exported by Mercosur, €/ton
Exporter CN code Product 2017 2018 2019
Argentina 02013000 Fresh or chilled beef, boneless 10,834 9,289 9,259
02023090 Frozen beef boneless, other 6,225 5,631 4,911
Brazil 02013000 Fresh or chilled beef, boneless 8,552 7,515 6,837
02023090 Frozen beef boneless, other 5,903 5,253 5,003
Paraguay 02013000 Fresh or chilled beef, boneless 7,612 6,844 7,124
02023090 Frozen beef boneless, other 5,355 5,566 5,040
Uruguay 02013000 Fresh or chilled beef, boneless 8,817 8,473 8,703
02023090 Frozen beef boneless, other 6,186 6,138 6,130
MERCOSUR 02013000 Fresh or chilled beef, boneless 9,525 8,590 8,539
02023090 Frozen beef boneless, other 5,981 5,470 5,181
Source: Professor Alan Mathews compilation based on Eurostat COMEXT database
Import destinations are highly concentrated, with the top three destinations (Netherlands, Italy, and
Germany) accounting for over 80% of imports by volume and 84% of imports by value in 2019. The UK
accounted for just 4% of Mercosur fresh/frozen beef imports by volume and value in 2019. The figures for
Netherlands likely exaggerate the volumes consumed in that country given its role as the main country of
entry for EU imports, and some unknown share of its imports will end up in other Member States.
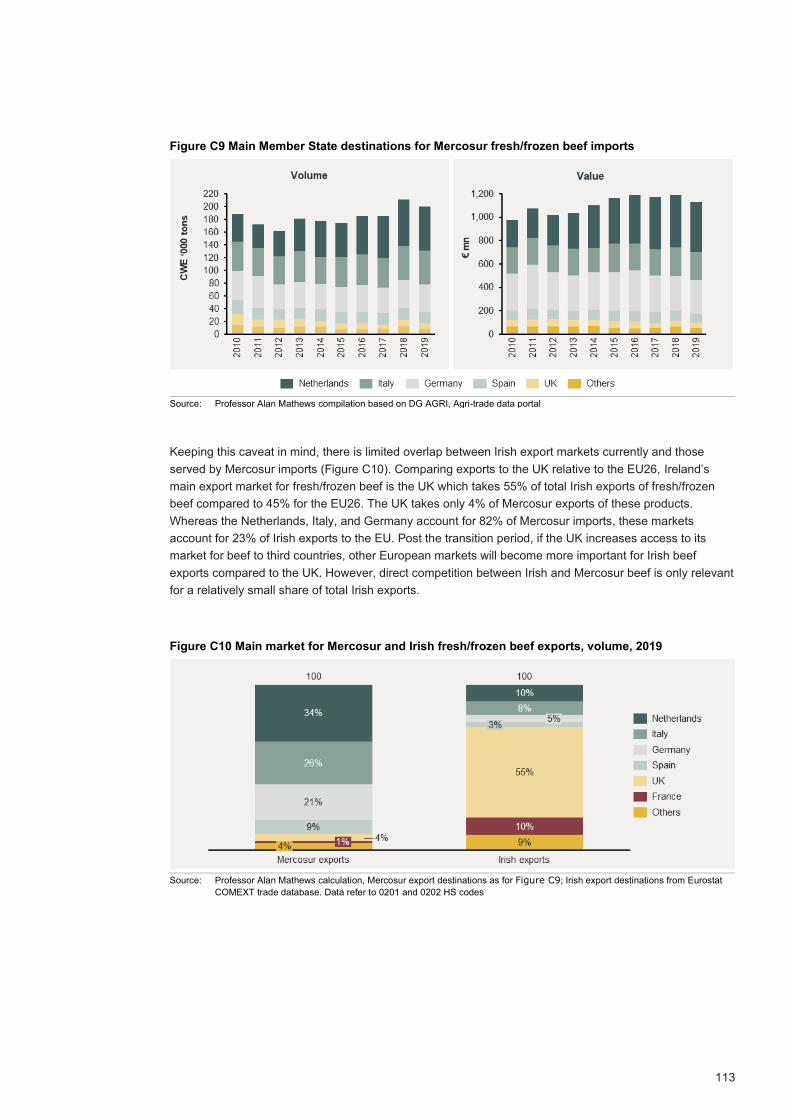
113
Figure C9 Main Member State destinations for Mercosur fresh/frozen beef imports
Source: Professor Alan Mathews compilation based on DG AGRI, Agri-trade data portal
Keeping this caveat in mind, there is limited overlap between Irish export markets currently and those
served by Mercosur imports (Figure C10). Comparing exports to the UK relative to the EU26, Ireland’s
main export market for fresh/frozen beef is the UK which takes 55% of total Irish exports of fresh/frozen
beef compared to 45% for the EU26. The UK takes only 4% of Mercosur exports of these products.
Whereas the Netherlands, Italy, and Germany account for 82% of Mercosur imports, these markets
account for 23% of Irish exports to the EU. Post the transition period, if the UK increases access to its
market for beef to third countries, other European markets will become more important for Irish beef
exports compared to the UK. However, direct competition between Irish and Mercosur beef is only relevant
for a relatively small share of total Irish exports.
Figure C10 Main market for Mercosur and Irish fresh/frozen beef exports, volume, 2019
Source: Professor Alan Mathews calculation, Mercosur export destinations as for Figure C9; Irish export destinations from Eurostat
COMEXT trade database. Data refer to 0201 and 0202 HS codes

114
Mercosur Usage of Existing TRQs
To assess the market impact of the new Mercosur tariff quota, the usage by Mercosur exporters of existing
TRQs is needed. Published data are limited in this respect.41 DG AGRI presents charts showing imports of
total beef products (not only fresh/frozen) broken down between in-quota and out-of-quota imports (Figure
C11). In 2019 Mercosur beef exports to EU amounted to around 249,000 tons, of which 124,000 tons were
fresh beef, 75,000 tons were frozen beef and the remainder were offals, beef preparations, salted and
smoked meat, and fat. The DG AGRI graphics show the significance of full-duty imports from Mercosur
countries, although whether these are primarily fresh beef, frozen beef, beef preparations or salted and
smoked beef is not known. The in-quota imports (red bars) are more important in value than in volume
terms (blue bars). This may reflect the concentration on High Quality Beef imports in the Hilton and grain-
fed quotas. It may also confirm the theoretical prediction that exporters maximise the value of a tariff quota
by using it to export high-value rather than low-value product (Borcherding and Silberberg 1978; Ramos,
Bureau, and Salvatici 2010).
Figure C11 EU28 imports of beef from Mercosur countries, in and out of quota, by CWE and value
Source: DG AGRI, Market situation for beef, Beef Market Observatory, version 20 May 2020
The Commission in its Fact Sheet on the agricultural aspects of the EU-Mercosur Agreement highlights
that “The EU currently imports around 200,000 tons of beef cuts every year from Mercosur countries.
These imports cater mostly for the high value market segment, dominated by European production and
facing increasing consumers' demand. This is why more than a quarter of this amount (around 45 000 tons
of "fresh" beef and a further 10,000 tons of frozen beef) enters the EU market despite being subject to a
40%-45% duty.”42 These figures refer to fresh and frozen imports only and imply that around one-quarter
of these imports pay the full duty. Eyeballing the data in Figure C48 which refer to all beef imports
suggests that the share paying the full duty is somewhat greater. This is because of the considerable
imports of offals and processed beef products that do not benefit from TRQ treatment.
Figures obtained from DG AGRI for 2019 show that the share of over-quota imports in 2019 was even
higher than implied in the previous quotation (Table C12). This shows the distribution of Mercosur
fresh/frozen imports across various tariff quotas and the volume paying full MFN duty in 2019. They imply
that 127,000 tons entered under tariff quotas and 75,000 tons paid the full duty in 2019. The lower half of
the table shows how in-quota Mercosur imports were allocated across the four most important tariff quotas
41 The Eurostat COMEXT database does contain tables showing adjusted Extra- EU imports by tariff regime which gives a breakdown of imports by MFN zero and non-zero tariffs, GSP zero and non-zero tariffs, and preferential trade with zero and non-zero tariffs. Imports entering under a TRQ should be recorded in the preferential trade category. However, no preferential imports are recorded under the beef tariff codes from Mercosur countries. All imports are shown as MFN imports.
42 European Commission, EU-Mercosur Free Trade Agreement: Creating Opportunities while respecting the interests of European farmers, 2019. We assume that these figures refer to imports in CWE in the subsequent analysis.

115
open to its exporters. To derive these figures the assumption is made that only fresh beef is imported
under the Hilton HQB and grain-fed quotas and that in-quota frozen beef is imported only under the GATT
frozen quota.43
Table C12 Estimated in and out of quota Mercosur imports, CWE ‘000 tons, 2019
Fresh Frozen Total
In quota 67,762 59,316 127,078
Out of quota 57,482 17,858 75,340
Total 125,244 77,174 202,418
Memo item: Allocation across quotas
Total quota
Pre-Brexit Mercosur share
Mercosur in-quota
imports
GATT frozen quota 71,266 82% 58,367
GATT frozen beef for processing ‘A’ 65,000 1.5% 949
Hilton HQB 63,539 61% 39,060
Grain-fed (‘hormones’) 58,441 49%* 28,702
Total in-quota 127,078
Source: Professor Alan Mathews calculations. Total fresh and frozen imports from Mercosur countries from DG AGRI, Agri-trade data
portal. In-quota imports from DG AGRI, personal communication. The Hilton quota figure represents the quota allocated to the
four Mercosur countries. Product weight has been multiplied by 1.3 to convert to CWE. * Argentina and Uruguay are the only
Mercosur countries to benefit from this quota.
Market Impacts of Additional Mercosur TRQ
The economic theory of tariff rate quotas is well understood and helps to explain when expansion of a
TRQ leads to additional trade or the conversion of tariff revenue into quota rent (Abbott 2002; Boughner,
de Gorter, and Sheldon 2002; Skully 2001a; 2001b). As explained below, the impact of increasing the TRQ
or reducing the in-quota tariff on imports will depend on the initial market situation and which element of
the TRQ is the binding constraint on imports. Reducing the in-quota tariff can increase imports where a
TRQ is underfilled. Increasing the TRQ volume can increase imports where imports are limited by the
quota and the over-quota tariff is prohibitive. Where over-quota (non-preferential) imports take place,
increasing the TRQ volume creates additional quota rent but does not necessarily lead to increased
imports. Only if the increase in the TRQ volume is greater than the volume of over-quota imports would we
expect imports to increase.
A TRQ is a quota for a volume of imports at a preferential tariff rate. Once the quota is filled, a higher tariff
is applied on additional imports. A TRQ has four components: an in-quota tariff (t); a quota defining the
maximum volume of imports charged the in-quota tariff (Q); an over-quota tariff (T); and a method of quota
administration. The way a TRQ affects the incentive to import is explained here based on the description in
Skully (2001b). The level of domestic demand for imports and the world price jointly determine which of the
TRQ elements constrains imports.
43 There was also a very small import of frozen beef for processing under the GATT ‘A’ processing quota of 949 tons CWE which has been ignored.

116
Figure C12 Interaction of TRQ and import demand
Source: Skully, 2001b; right-hand lower panel, Professor Alan Mathews construction
The upper left-hand panel in Figure C12 shows three possible import demand curves. If there is no
demand for imports at the world price, none of the TRQ elements constrains imports: there would be no
imports even with free trade — D1. Similarly, if there is no import demand at the in-quota tariff rate (1+t),
domestic demand remains the binding constraint — D2. A small reduction in the in-quota tariff will not
increase imports, but a large reduction could make the in-quota tariff binding. When import demand
intersects the in-quota tariff - illustrated by D3 - a volume of M(t) is imported and the domestic market price
equilibrates at 1+t. In-quota tariff revenue equals t times the volume of imports, as shown in the shaded
rectangle.
The upper right-hand panel in Figure C12 illustrates import demand constrained by the quota. When the
quota determines imports, the import volume is Q and the domestic price is 1+t+r (r represents the unit
quota rent). This rent arises because a tariff quota implies rationing – there is a limited supply of the
attractively-priced in-quota product and its price will be bid up to the level where demand equals supply.
The unit rent is the difference between the domestic price (the price an importer can sell the product in the
domestic market) and the world price inclusive of the in-quota tariff (what it costs an importer to purchase
the product on the world market and pay the tariff).
The third panel (lower left-hand panel in Figure C12) illustrates a situation where there are over-quota
imports. The over-quota tariff determines the volume of imports at M(T) and the domestic price equals
1+T. When there are over-quota imports, imports within the quota are charged the in-quota tariff and
imports beyond the quota are charged the over-quota tariff. Thus, there are two shaded rectangles of tariff
revenue in Figure C13. In-quota imports can be imported for (1+t) and sold on the domestic market for
(1+T) so the per unit quota rent equals (T-t). The shaded rectangle labelled “quota rent” represents the
total value of quota rents.
The impact of increasing the TRQ (Q) or reducing the in-quota tariff (t) on imports will depend on the initial
market situation and which element of the TRQ is the binding constraint on imports. Relaxing either
element either increases market access or has no effect. In Table C13, a plus symbol (‘+’) in a cell

117
indicates there is an increase in market access when a constraint is binding, otherwise it has no effect,
thus ‘0’. Reducing the in-quota tariff will only increase imports where the TRQ is underfilled. Increasing the
TRQ volume will only increase imports if the quota itself is the binding constraint such that there are no
over-quota imports.
Table C13 TRQ liberalisation and market access
Binding constraint on imports
Action Demand In-quota tariff (t) Quota (Q) Over-quota tariff
(T)
Reducing t 0 + 0 0
Increasing Q 0 a 0 + 0
Source: Professor Alan Mathews compilation based on Skully 2001b
The conclusion from this analysis is that reducing the in-quota tariff can increase imports where a TRQ is
underfilled and increasing the TRQ volume can increase imports where imports are limited by the quota
and the over-quota tariff is prohibitive. Where over-quota imports take place, increasing the TRQ volume
creates additional quota rent but not necessarily increased imports.
This latter conclusion must be modified if the new TRQ volume is greater than the existing (or projected)
volume of over-quota imports (see lower right-hand panel in Figure C12). Here, the TRQ has been
increased from Q to Q1 so that it now exceeds what importers were prepared to purchase at the over-quota
tariff. However, because imports within the new TRQ are now available at the in-quota tariff, there is a
movement along the import demand curve and imports will increase. The conclusion is that it is important
not only to understand the utilisation of current TRQs but also the relationship between the increased TRQ
offer in the EU-Mercosur Agreement and the existing volume of over-quota imports.44
This analysis assumes that the supply of exports is perfectly elastic at the world market price. In the case
of Mercosur imports, both slaughterhouses and holdings must observe EU standards and adopt additional
practices which are costly to be eligible to export to the EU market. One would expect that, if the EU
market becomes more attractive and easier to access, there will be a greater incentive to invest in the
steps needed to become eligible to export. Thus, it may not be unreasonable to assume a perfectly elastic
export supply curve. However, if more supplies can be attracted to the EU market only by paying a higher
price, this will tend to dampen the Mercosur supply response to the additional market access. An upward-
sloping supply curve could erode some of the expected quota rent shown in the lower right-hand panel in
Figure C12. If it were sufficiently steep, it could also mean that the expansion in trade would be smaller
than implied in that figure.
44 As the increased beef quotas under the EU-Mercosur Agreement will be phased in in six equal steps, the increased TRQ volume should be compared with projected over-quota imports at that time when the new levels are fully operative. Over the past decade, there has been a slight upward trend in the volume of fresh and frozen beef imports from Mercosur exporters, largely because of increased exports from Argentina in the past two years. In the empirical analysis, we assume no further increase in Mercosur exports will take place in the absence of the Agreement.

118
Expanded TRQ Access under the EU-Mercosur Agreement
The expected additional imports because of the EU offer in the EU-Mercosur Agreement can now be
estimated, based on the information on the utilisation of existing tariff quotas by Mercosur exporters. The
key issue in determining the economic effects of an additional tariff quota is whether the additional quota
exceeds the current (and expected future) level of over-quota imports or not. In addition, the impact of the
lower in-quota tariff for the Hilton HQB beef quota must be considered. Table C14 explains how the
Mercosur beef offer (creation of additional TRQ and reducing in-quota tariffs on pre-existing TRQ) may
increase market access opportunities for Mercosur beef exports to the EU.
These imports will enter the market of the EU27 following the withdrawal of the UK from the EU. Brexit will
reduce the TRQ volumes for Mercosur exporters for existing WTO quotas, but it will also reduce the
volume of in-quota imports from Mercosur by the same amount, as this was the basis on which the
allocation of TRQs between the UK and the EU27 was agreed. The historical division of over-quota
imports between the UK and the EU27 is not known. As the UK is a relatively minor importer from
Mercosur, our assumption is that most of these over-quota imports enter the EU27 market. For this
exercise, we opt to use the over-quota import figures in DG TRADE’s factsheet (footnote 42). On this
basis, we estimate that the EU offer will lead to increased market access for just over half of the new EU-
Mercosur Agreement tariff quota, or 52,963 tons CWE (Table C14). The balance of the new TRQ will be
used by existing over-quota imports.
This is a high-end estimate of the likely additional market access, in part because in 2019 over-quota
imports already exceeded the baseline assumed here, in part because these over-quota imports have
been on a slowly rising trend over the past decade, and in part because the fact that some Argentinian and
Uruguayan beef will lose their quota access under the ‘481 grain-feed beef’’ hormones quota and will
instead enter under the new quota has not been taken into account. On the other hand, DG AGRI
projections in its December 2020 Market Outlook 2020-2030 indicate that total beef imports peaked in
2019 and will remain below this level for most of the coming decade until 2029 (European Commission
2020).
Table C14 Expanded market access opportunities under the EU-Mercosur Agreement
Trade regime FTA change Existing trade Future trade Additional
trade (tons CWE)
Hilton HQB quota
Tariff rate reduced from 20% to 0%
All four Mercosur exporters have specific quotas, but Brazil currently fills less than half its quota, i.e. 4,000 tons of 13,000 tons CWE (10,000 tons net weight)
The reduction in the in-quota tariff will make use of this quota more attractive for Brazil, we assume it will make full use in future
9,000
Frozen beef Additional quota of 44,000 tons CWE frozen beef at 7.5% tariff
Current over-quota exports of frozen beef 10,000 tons CWE
We assume these over-quota exports will in future be exported under the Mercosur quota
34,000
Fresh beef Additional quota of 55,000 tons CWE fresh beef at 7.5% tariff
Current over-quota exports of fresh beef 45,000 tons CWE
We assume these over-quota exports will in future be exported under the Mercosur quota
10,000
Grain-fed beef quota
EU-US agreement August 2019 to reserve 35,000 tons of overall quota for the US
Argentina and Uruguay currently benefit from access under this quota and will see their exports under this quota reduced
These displaced exports will likely now enter the EU under the new TRQ, reducing its ability to generate new trade
0
Total 53,000 Note: The additional Brazilian imports of Hilton HQB are based on 2019 in-quota imports of 4,000 tons CWE. Actual 2019 over-
quota frozen beef imports amounted to 18,000 tons CWE and over-quota imports of fresh beef in 2019 amounted to 57,000
tons CWE.
Source: Professor Alan Matthews compilation
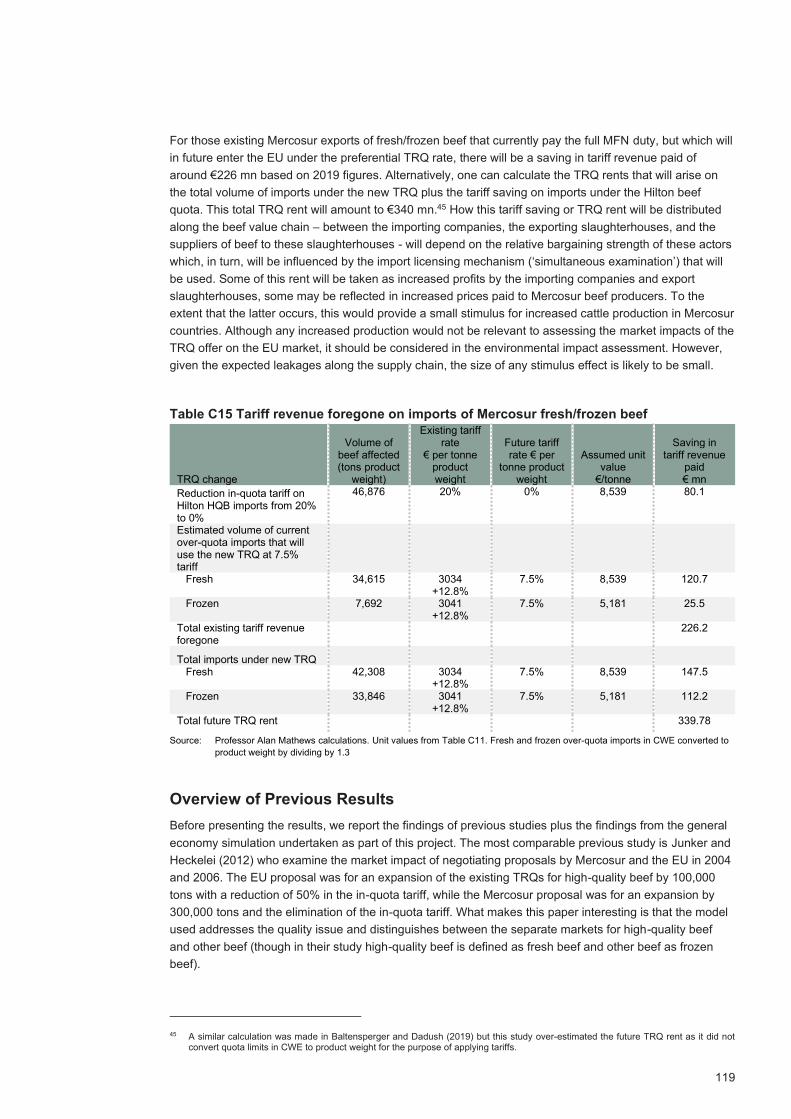
119
For those existing Mercosur exports of fresh/frozen beef that currently pay the full MFN duty, but which will
in future enter the EU under the preferential TRQ rate, there will be a saving in tariff revenue paid of
around €226 mn based on 2019 figures. Alternatively, one can calculate the TRQ rents that will arise on
the total volume of imports under the new TRQ plus the tariff saving on imports under the Hilton beef
quota. This total TRQ rent will amount to €340 mn.45 How this tariff saving or TRQ rent will be distributed
along the beef value chain – between the importing companies, the exporting slaughterhouses, and the
suppliers of beef to these slaughterhouses - will depend on the relative bargaining strength of these actors
which, in turn, will be influenced by the import licensing mechanism (‘simultaneous examination’) that will
be used. Some of this rent will be taken as increased profits by the importing companies and export
slaughterhouses, some may be reflected in increased prices paid to Mercosur beef producers. To the
extent that the latter occurs, this would provide a small stimulus for increased cattle production in Mercosur
countries. Although any increased production would not be relevant to assessing the market impacts of the
TRQ offer on the EU market, it should be considered in the environmental impact assessment. However,
given the expected leakages along the supply chain, the size of any stimulus effect is likely to be small.
Table C15 Tariff revenue foregone on imports of Mercosur fresh/frozen beef
TRQ change
Volume of beef affected (tons product
weight)
Existing tariff rate
€ per tonne product weight
Future tariff rate € per
tonne product weight
Assumed unit value
€/tonne
Saving in tariff revenue
paid € mn
Reduction in-quota tariff on Hilton HQB imports from 20% to 0%
46,876 20% 0% 8,539 80.1
Estimated volume of current over-quota imports that will use the new TRQ at 7.5% tariff
Fresh 34,615 3034 +12.8%
7.5% 8,539 120.7
Frozen 7,692 3041 +12.8%
7.5% 5,181 25.5
Total existing tariff revenue foregone
226.2
Total imports under new TRQ
Fresh 42,308 3034 +12.8%
7.5% 8,539 147.5
Frozen 33,846 3041 +12.8%
7.5% 5,181 112.2
Total future TRQ rent
339.78
Source: Professor Alan Mathews calculations. Unit values from Table C11. Fresh and frozen over-quota imports in CWE converted to
product weight by dividing by 1.3
Overview of Previous Results
Before presenting the results, we report the findings of previous studies plus the findings from the general
economy simulation undertaken as part of this project. The most comparable previous study is Junker and
Heckelei (2012) who examine the market impact of negotiating proposals by Mercosur and the EU in 2004
and 2006. The EU proposal was for an expansion of the existing TRQs for high-quality beef by 100,000
tons with a reduction of 50% in the in-quota tariff, while the Mercosur proposal was for an expansion by
300,000 tons and the elimination of the in-quota tariff. What makes this paper interesting is that the model
used addresses the quality issue and distinguishes between the separate markets for high-quality beef
and other beef (though in their study high-quality beef is defined as fresh beef and other beef as frozen
beef).
45 A similar calculation was made in Baltensperger and Dadush (2019) but this study over-estimated the future TRQ rent as it did not convert quota limits in CWE to product weight for the purpose of applying tariffs.

120
Considering the existence of over-quota imports in the base years 2004-2006, the paper concludes that
the EU proposal would result in a very limited increase in imports of high-quality beef by only 5% or slightly
more than 8,000 tons. In the Mercosur proposal, the EU increases imports of high-quality beef by more
than 100,000 tons (an increase of 37% compared to the base situation). The study does not state explicitly
the likely impact on EU producer prices. However, it estimates that the EU beef sector (farmers and
processors) would lose €7.9 mn under the EU commitment and €89.4 mn under the Mercosur
commitment.
A study undertaken by the Joint Research Centre examined the cumulative impact of a dozen free trade
agreements either recently concluded or under negotiation at the time (USA, Canada, Mercosur, Australia,
New Zealand, Japan, Vietnam, Thailand, Turkey, Mexico, Philippines and Indonesia) which included
results for the beef sector (Boulanger et al. 2016). As the outcome of most of these negotiations was not
known at the time of the study, it examined two synthetic liberalisation scenarios. In the ambitious
scenario, tariffs were fully liberalised for 98.5% of HS-6 tariff lines and cut by 50% for the remaining tariff
lines (sensitive products). In the conservative scenario, full tariff liberalisation was applied to 97% of tariff
lines and a reduction of 25% for the remainder. In both scenarios, beef was treated as a sensitive product.
The results show by how much imports of beef from Mercosur would increase because of the cumulative
impact of these twelve FTAs. It is not a study of an EU-Mercosur Agreement alone although, as 80% of the
estimated increase in beef imports under these twelve FTAs was projected to come from Mercosur, it may
not be a bad proxy in the case of beef. Base imports from Mercosur were estimated at €1,424 mn and
were projected to increase to €2,372 mn (+€948 mn) in the conservative scenario and to €3,789 mn
(+€2,365 mn) in the ambitious scenario. Overall, the volume increases were projected at 146,000 tons and
356,000 tons (corresponding to increases in Mercosur imports of 117,000 and 285,000 tons respectively,
applying the 80% share). In addition, more favourable export opportunities for dairy products under these
FTAs were expected to lead to an increased EU supply of dairy beef (two-thirds of EU beef comes from
the dairy herd). The combined pressures on the EU market were projected to lead to a steep drop in beef
prices, -8% in the conservative scenario and -16% in the ambitious scenario. It must be underlined that
these results were derived from scenarios in which preferential tariffs applied to all imports from FTA
partners. In the actual EU-Mercosur Agreement, the volume of preferential imports is limited by a TRQ,
and the additional imports facilitated by this TRQ will likely be considerably smaller than projected in this
study.
The official sustainability impact assessment of the EU-Mercosur Agreement undertaken by LSE
Consulting (2020) includes a special section on potential impacts on the beef sector. Its modelling
approach, based on a CGE model, also did not take account of the role of TRQs. Instead, it modelled the
economic impact of the beef provisions as a reduction in the MFN tariffs applied to beef imports, modelling
a conservative scenario with a reduction of 15% and an ambitious scenario with a reduction of 30%. On
these assumptions, it projected that Mercosur imports would increase in both scenarios (by 30% and 64%,
respectively). Based on recent trend imports of 200,000 tons per year, these increases would represent
volume increases of 60,000 tons in the conservative scenario and 128,000 tons in the ambitious scenario.
The study found that EU beef output would fall by between 0.7% (conservative) and 1.2% (ambitious)
depending on the scenario considered.46 No details of price impacts were provided.
The results of this project in the main report are based on a simulation of the provisions of the proposed
Agreement using a CGE model as in the LSE Consulting (2020) study. The TRQ impact of the EU-
Mercosur Agreement has been correctly modelled by implementing an increase in TRQ imports. Two
scenarios are run: one is a scenario where the Agreement leads to a modest reduction in non-tariff barriers
(NTBs) on industrial goods, while the second scenario assumes a more ambitious reduction in these
NTBs. Average export unit values for the Irish beef (red meat) sector would fall by between 0.15% (in the
46 In the CGE model used, beef and sheep meat are aggregated. For trade flows from Mercosur this makes no difference as there is no trade in sheep meat. The impact on EU beef production alone will be somewhat greater than these figures on the assumption that sheep meat production is unaffected.
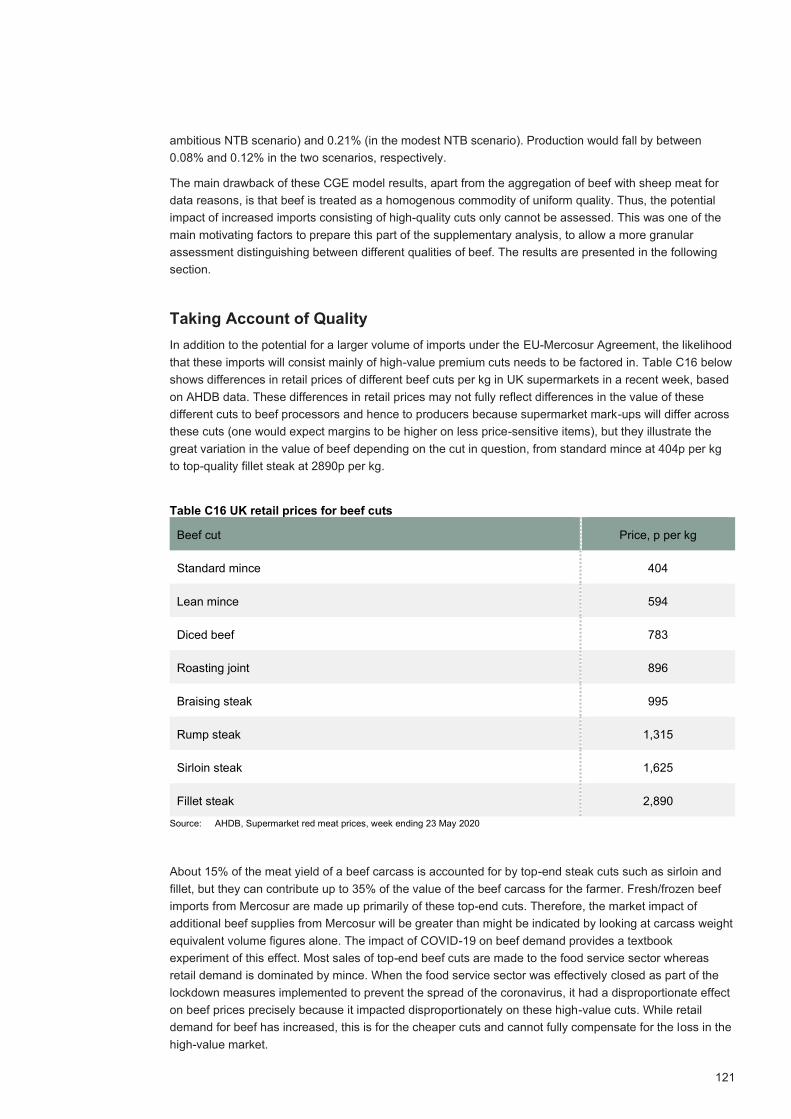
121
ambitious NTB scenario) and 0.21% (in the modest NTB scenario). Production would fall by between
0.08% and 0.12% in the two scenarios, respectively.
The main drawback of these CGE model results, apart from the aggregation of beef with sheep meat for
data reasons, is that beef is treated as a homogenous commodity of uniform quality. Thus, the potential
impact of increased imports consisting of high-quality cuts only cannot be assessed. This was one of the
main motivating factors to prepare this part of the supplementary analysis, to allow a more granular
assessment distinguishing between different qualities of beef. The results are presented in the following
section.
Taking Account of Quality
In addition to the potential for a larger volume of imports under the EU-Mercosur Agreement, the likelihood
that these imports will consist mainly of high-value premium cuts needs to be factored in. Table C16 below
shows differences in retail prices of different beef cuts per kg in UK supermarkets in a recent week, based
on AHDB data. These differences in retail prices may not fully reflect differences in the value of these
different cuts to beef processors and hence to producers because supermarket mark-ups will differ across
these cuts (one would expect margins to be higher on less price-sensitive items), but they illustrate the
great variation in the value of beef depending on the cut in question, from standard mince at 404p per kg
to top-quality fillet steak at 2890p per kg.
Table C16 UK retail prices for beef cuts
Beef cut Price, p per kg
Standard mince 404
Lean mince 594
Diced beef 783
Roasting joint 896
Braising steak 995
Rump steak 1,315
Sirloin steak 1,625
Fillet steak 2,890
Source: AHDB, Supermarket red meat prices, week ending 23 May 2020
About 15% of the meat yield of a beef carcass is accounted for by top-end steak cuts such as sirloin and
fillet, but they can contribute up to 35% of the value of the beef carcass for the farmer. Fresh/frozen beef
imports from Mercosur are made up primarily of these top-end cuts. Therefore, the market impact of
additional beef supplies from Mercosur will be greater than might be indicated by looking at carcass weight
equivalent volume figures alone. The impact of COVID-19 on beef demand provides a textbook
experiment of this effect. Most sales of top-end beef cuts are made to the food service sector whereas
retail demand is dominated by mince. When the food service sector was effectively closed as part of the
lockdown measures implemented to prevent the spread of the coronavirus, it had a disproportionate effect
on beef prices precisely because it impacted disproportionately on these high-value cuts. While retail
demand for beef has increased, this is for the cheaper cuts and cannot fully compensate for the loss in the
high-value market.

122
While additional Mercosur imports would account for just 0.8% of total EU27 production, if they are
compared to the volume of high-value cuts alone their impact would be more significant, increasing
supplies by 5.2%. We develop a small numerical model to show the potential impact of this increased
supply availability on EU producer returns if all additional Mercosur imports come in the form of high-value
cuts. This model is a partial equilibrium model of the EU beef market that distinguishes between high-value
beef cuts and other cuts. Details of the model are given below. We assume that high-value cuts make up
15% of total EU beef consumption and that the average price for these cuts is three times the average
price for other cuts. This implies that high-end cuts contribute around 35% of total producer returns from
beef production. We ignore the role of external trade and assume that domestic consumption is wholly
supplied by domestic production in the baseline. With an additional supply of high-value imported beef cuts
due to implementing the additional TRQ in the proposed EU-Mercosur Agreement, the price must fall to
clear the market. This fall in price will encourage both greater consumption as well as lower the EU
supply.47
As for all empirical models, the results depend on the parameter values chosen, in this case the own-price
and cross-price elasticities of demand and own-price elasticity of supply. The choice of elasticities used in
the baseline is justified below. The more responsive is the domestic supply of high-value cuts to a
reduction in price, the smaller the price reduction will be. Similarly, the more elastic (responsive) is the
demand for high-quality cuts to a price reduction, the smaller the price reduction will be. To evaluate the
robustness of the empirical results, results are also shown using elasticity values 50% higher and 33%
lower than the baseline values. The numerical results are shown in Table .
Table C17 Importance of Mercosur imports in a quality-differentiated market
EU27
domestic
production
Producer
Price
Producer
Returns
Additional
Mercosur
imports
Tons €/ton € mn Tons
Assumed original market
situation
High-value cuts (15%) 1,036,200 8,678 8,992 52,963
Other cuts (85%) 5,871,800 2,893 16,984
Total supply 6,908,000 3,760 25,976
Post EU-Mercosur
Agreement - base
elasticities
New EU27
production
New producer
price
New producer
returns
Per cent
change in
producer
returns
Per cent
change in
producer
prices
Tons €/ton € mn % %
High value cuts - production 1,020,717 8,253 8,424 -6.3% -4.9%
Other cuts - production 5,784,065 2,941 17,011 0.2% 1.7%
47 In the short run, there can be a seemingly perverse supply response to a fall in the price of beef as supply increases due to liquidation of breeding stock. The model simulations here assume a medium-run response in which supply elasticities are positive.

123
Total supply 6,804,782 3,738 25,435 -2.1% -0.6%
Post EU-Mercosur Agreement -
higher (absolute) elasticities
High value cuts - production 1,020,717 8,392 8,566 -4.7% -3.3%
Other cuts - production 5,784,065 2,925 16,917 -0.4% 1.1%
Total supply 6,804,782 3,745 25,483 -1.9% -0.4%
Post EU-Mercosur Agreement -
lower (absolute) elasticities
High value cuts - production 1,020,717 8,049 8,215 -8.6% -7.2%
Other cuts - production 5,784,065 2,965 17,153 1.0% 2.5%
Total supply 6,804,782 3,728 25,368 -2.3% -0.9%
Source: Professor Alan Mathews calculations. Total EU27 beef production in volume and in value in the baseline from Eurostat, with
average producer price derived by dividing one by the other. Source for other baseline figures in the text.
Using the base elasticities (our estimate of their most likely values, see below), we estimate that the EU-
Mercosur Agreement would result in a 5% drop in the price of high-value beef cuts on the EU market. This
would lead to a reduction in EU beef supply which, because high-value cuts and other cuts are produced
in fixed proportions, would also lead to a fall in the supply of other beef cuts. For high-value cuts, there
would be a reduction in producer returns of -6.3%. For other cuts, although there will be a fall in demand
(due to substitution towards the now-cheaper higher-value cuts), the net impact also considering the
reduction in supply is a small increase in their price of 1.7%. Although small, because these cuts make up
two-thirds of all producer revenue from beef production, this price increase makes an important
contribution to stabilising overall producer returns. Overall, taking both types of cuts together, EU producer
returns would be expected to fall by around -2.1% or by €541 mn. As the Irish share of the value of EU
beef production in volume terms is 9%, this implies a loss to Irish producers of €49 mn.
Because there is uncertainty around the true values of the elasticity parameters, a sensitivity analysis was
undertaken to test the robustness of these results to different elasticity values.
With higher assumed elasticities, the price effects and producer losses would be smaller. Assuming 50%
higher supply and demand elasticities than in the base case, EU producer losses are estimated to be €493
mn, of which the Irish producer share would be €44 mn.
Conversely, with lower assumed elasticities, the price effects and producer losses would be greater.
Assuming 33% lower supply and demand elasticities than in the base case, EU producer losses are
estimated to be €608 mn, of which the Irish producer share would be €55 mn. In all scenarios, beef
production would fall by 1.5% and the value of Irish beef output by around 2% (1.9% - 2.3%).
Details of the partial equilibrium beef model
The model is a partial equilibrium model with two products, high value beef cuts and other beef cuts,
where supply and demand functions are constant elasticity functions.
Let QH = Quantity of high value cuts

124
Let QL = Quantity of other cuts
Let PH = Price of high value cuts
Let PL= Price of other cuts
The following are the equations of the model
Supply of high value cuts
QHs = a * PHc where c is the own-price elasticity of supply and a is a constant
Supply of other cuts
QLs = (QH * 0.85) / 0.15 (high value and other cuts are produced in fixed proportions assuming 15% by
weight is high-value cuts)
Demand for high value cuts
QHd = b * PHd * PLe where d is the own-price elasticity of demand for high value cuts, e is the cross-price
elasticity with respect to the price of other cuts, and b is a constant.
Demand for other cuts
QLd = w * PLf * PHg where f is the own-price elasticity of demand for other cuts, g is the cross-price
elasticity of demand with respect to the price of high-value cuts, and w is a constant.
Demand and supply for high-value cuts should be equal.
QHd = QHs
Demand and supply for other cuts should be equal
QLd = QLs
The model is solved in Excel using the Solver function.
The parameter values needed are the supply and demand elasticities c, d, e, f and g.
Although the supply elasticity only enters the supply function for high-value cuts, because of the Leontief
relationship with other cuts this is effectively a supply elasticity for beef as a whole. Short-run and long-run
elasticities tend to be very different. For example, the FAPRI-UK model has short-run elasticities of beef
cows with respect to own prices of 0.1- 0.2 but long-run elasticities between 0.5 and 1.0. The FAPRI-
Ireland model assumes a short-run elasticity of the suckler cow inventory with respect to the price of cattle
of 0.3 and a long-run elasticity close to 1.48
Two-thirds of EU beef comes from the dairy herd where supply response will be determined mainly by milk
prices. The breeding decisions of dairy farmers are not driven in any substantive way by the price of
calves. Therefore, we expect the supply elasticity for beef as a whole to be significantly lower. A value of
0.3 is chosen for the base estimation. This is increased by 50% to 0.45 in the high elasticity scenario and
reduced by 33% to 0.2 in the low elasticity scenario.
Table C20 gives examples of own-price elasticities of demand for beef from the literature. The range of
estimates is very wide, in part reflecting differences in definitions and estimation techniques. Elasticities
can be derived from statistical techniques using observed data or from consumer choice experiments.
Elasticities can be estimated within an unconditional demand system which recognises all
interrelationships between food and non-food products, or within a conditional demand system which
focuses on relationships among a group of closely related foods. Elasticities can be Marshallian
(uncompensated) or Hicksian (compensated, holding real income constant) with uncompensated
elasticities often up to twice as large as compensated elasticities. Elasticities can be short-run or long-run,
48 Kevin Hanrahan, personal communication.

125
with the latter usually larger in absolute value. There may also be a bias arising from the publication date
of studies as estimation techniques have improved over time.
Table C20 gives examples of own-price elasticities of demand for beef as an aggregate product. A result
from Seale et al. (1996) is also included to show how aggregating further overall all meats again tends to
lower the elasticity in absolute value. While there are some outliers, a consensus estimate is that the own-
price elasticity of demand for beef at retail level is close to -0.80.
When individual beef cuts are identified, price elasticities of demand tend to be larger in absolute value
because there is now the possibility to substitute another beef product as well as shifting to another meat
or some other food product (Table C20). While some of the estimates for high-value cuts are close to the
previous figure for beef as a whole, other estimates are much more elastic. A simple average of own-price
elasticities for high-value cuts averages out at -1.34. A similar simple average for ground beef is -1.45,
suggesting that higher-value cuts tend to be less price sensitive than low-value cuts (Lusk and Tonsor
2016).
Choosing appropriate values for the cross-elasticities is more challenging. In the studies shown in Table
C20, the average cross-price elasticity of the demand for steak with respect to a change in the price of
ground beef is 0.23, while the average cross-price elasticity of the demand for ground beef with respect to
a change in the price of steak is 0.44. As the cross-price elasticity for hamburger in the Eales and
Unnevehr (1988) is very much an outlier, excluding this observation reduces the average to 0.25. The
median values are 0.22 and 0.28, respectively.
However, these cross-price elasticities should observe the Slutsky condition that specifies the relationship
between cross-elasticities (Tomek and Robinson 1972). Under specified conditions, the Slutsky condition
states that cross-price elasticities between two products should be inversely related to their relative
expenditure.
In the baseline, expenditure on the lower-value cuts is almost double (1.89 times) expenditure on the
higher-value cuts. This implies that the cross-price elasticity of high-value beef with respect to a change in
the price of low-value beef should be roughly double the cross-price elasticity of low-value beef with
respect to a change in the price of high-value beef. In only two of the quoted studies is the cross-price
elasticity of the higher-value beef cuts higher than the cross-price elasticity of ground beef. We have
therefore chosen to anchor the estimates in the average cross-price elasticity of the demand for high-value
cuts with respect to a change in the price of low-value products using a value of 0.23. Applying the Slutsky
condition, the cross-price elasticity of demand for lower-value products with respect to a change in the
price of high-value cuts is then calculated to be 0.12.
Table C20 Examples of own-price elasticities of demand for beef (aggregate)
Country Commodity Price elasticity of
demand value
Source
UK,
France
Meat -0.28 (Seale, Regmi, and Berstein 1996)
Japan Beef -1.26 (Sasaki 1995)
Canada Beef -0.76 (Eales and Unnevehr 1993)
U.S. Beef -0.57 (Eales and Unnevehr 1988)
U.S. Beef -0.98 (Moschini and Meilke 1989)
UK Beef -1.76 (Burton and Young 1992)

126
U.S. Beef -0.70 (Okrent and Alston 2012)
U.S. Beef -0.72/-0.95 (Taylor and Tonsor 2013)
Source: Professor Alan Mathews compilation
Table C21 Compensated disaggregated beef product own-price elasticities
Country Beef cut Own price
elasticity
Cross price
elasticity
Source
U.S. Beef table cuts -0.68 0.38 (Eales and Unnevehr 1988)
Hamburger -2.59 1.59
U.S. Table cut beef -0.74 0.11 (Brester and Wohlgenant
1991)
Ground beef -0.88 0.29
U.S. Steak -1.67/-1.84
(depending on
income class),
0.25/0.38
(depending on
income class)
(Lusk and Tonsor 2016)
Ground beef -1.70/-1.96
(depending on
income class)
0.18/0.46
(depending on
income class)
U.S. Beef loin -1.88 0.08 (Taylor and Tonsor 2013)
Ground beef -1.05 0.05
U.S. Ground -0.90 0.15/0.05 (Coffey, Schroeder, and
Marsh 2011)
Roast -2.35 0.38
Steak -0.64 0.09
Other -2.69 0.09/0.47
Source: Professor Alan Mathews compilation
Demand elasticities are estimated using retail or consumer data. Unless marketing and processing
margins are entirely proportional, these elasticities will tend to be larger in absolute value than the
elasticity at producer level. On the other hand, high-value cuts tend to be consumed in food service
outlets. The price elasticity of demand for full-service outlets tends to be higher than for food purchased for
home consumption (Okrent and Alston 2012). We arbitrarily reduce these elasticities by 50% to convert
them to producer-level elasticities for use in the numerical model. The elasticities used for the base case in
the model and the two sensitivity scenarios are shown in Table C22.

127
Table C22 Demand elasticities used in numerical model
Base case High elasticity case
(+50%)
Low elasticity case (-
33%)
High-value cuts
own-price
-0.67 -1.01 -0.45
High-value cuts
cross-price
0.12 0.17 0.08
Other beef own-
price
-0.73 -1.09 -0.48
Other beef cross-
price
0.06 0.09 0.04
Source: Professor Alan Mathews compilation
Concluding Remarks
This appendix examines the concerns of stakeholders about the price and market impacts of the additional
beef market access granted to Mercosur exporters under the proposed EU-Mercosur Agreement. It
complements the CGE modelling by taking account of some specific aspects of trade in beef that a large,
economy-wide model of necessity is not able to consider. Particular attention is paid to the argument that
imported Mercosur beef and domestically produced beef are not homogeneous products because
Mercosur imports, whether fresh or frozen, are largely high-value cuts such as steaks.
The EU-Mercosur Agreement provides for an additional Tariff Rate Quota (TRQ) of 99,000 tons beef
carcass weight equivalent (CWE) to enter the EU market with a 7.5% in-quota tariff. 55% of this is for fresh
beef and the remaining 45% for frozen beef, phased in over six equal steps. In addition, the in-quota duty
rate on the Hilton High Quality Beef quota (46,876 tons in product weight for the four Mercosur exporters)
is reduced from 20% to 0%.
The key issues examined in this chapter are (a) how much additional exports can be expected to arise
from these changes in TRQ access? (b) What will be the market access effects, considering that these
exports will consist primarily of high-value beef cuts?
Beef imports are a relatively minor share of the EU beef market, amounting to around 300,000 tons CWE
annually or around 4% of EU beef production. The bulk of imports enter the EU as fresh or frozen beef,
although there is also a significant import of processed beef. Mercosur imports account for 71% of total EU
imports of fresh and frozen beef in CWE, with a slight increase in this share in recent years. The EU is now
a minor destination for Mercosur exports compared to China and Hong Kong, accounting for about 5% of
its fresh and frozen beef exports by volume but about 10% by value. Over 80% of Mercosur beef exports
of fresh and frozen beef to the EU are destined for the three markets Netherlands, Germany, and Italy.
The UK, which is the main export market for Irish beef, is a very small importer of Mercosur fresh/frozen
beef, accounting for around 4% of their total exports to the EU.
TRQs agreed with trading partners under the WTO or as autonomous quotas agreed to settle a dispute
over import restrictions on beef produced with the aid of hormones play an important role in facilitating
imports. Nonetheless, of Mercosur fresh/frozen imports of just over 200,000 tons CWE in 2019, around
75,000 tons CWE were imported paying the full over-quota MFN tariff. The existence of these over-quota
imports is critical in determining the additional trade that would be generated by providing additional TRQ
access to Mercosur exporters. Our estimate is that actual imports could increase by up to 53,000 tons
CWE because of the improved TRQ access. For reasons set out in this appendix, this is likely to be an
upper bound to the increase in Mercosur imports due to the TRQ.

128
The potential impact on the EU beef market and hence Irish producers of an increase in imports depends
not just on the volume but also on the composition of these imports. We assume that all these imports will
consist of high-quality beef cuts and will compete in the high-end of the EU beef market. Based on a small
simulation model of the EU beef market that distinguishes between high-quality and other beef cuts, we
estimate the impact of these additional high-value imports on EU market prices for both high-value and
low-value beef cuts and overall beef production.
As expected, there would be a significant impact on the prices obtained for high-end cuts, which might fall
by around 5% (with a range of 3.3% - 7.2% based on a sensitivity analysis for different values of the
responsiveness of EU beef supply and demand to changes in prices). In addition, beef production would
fall by 1.5% in the EU, so producer returns in the high-end market would fall by 6.3% (4.7% - 8.6%). What
is often forgotten is that, even though cheaper high-end beef would shift demand away from low-value
beef cuts to some extent, with lower supply of these cuts the overall effect will be to raise the average
price of low-value beef cuts. And because the value of these cuts makes up two-thirds of the market for
beef, this is an important factor in offsetting some of the expected losses in the market for high-value beef
cuts. Overall, producer returns will be reduced by around 2% (1.9% - 2.3%) due to the increase in imports
of high-quality beef cuts facilitated by the new Mercosur TRQ. This would translate into a reduction in the
value of Irish beef output of between €44-€55 mn, compared to the total value of Irish beef output
(including coupled subsidies) of between €2.4 bn (in 2017) and €2.3 bn (in 2019). As noted above, this is
likely to be an upper bound on the negative impacts on producers arising from the beef offer in the EU-
Mercosur Agreement.
If the additional market access were assumed to be shared across both the high and low value portions of
the market, the reduction in producer returns and the value of Irish beef output would be smaller.
Therefore, this estimate is likely to be an upper bound to the increase in Mercosur imports due to the TRQ.
Overall, this supplementary analysis finds that the estimates of the price and quantity effects of the EU
beef commitment are, as expected, higher than those found in the CGE model. This is because the more
detailed analysis enables us to take full account of the heterogeneity of beef with the different quality cuts.
We also stress that these detailed results represent an upper bound on the likely potential losses for the
Irish beef sector arising from implementation of the EU-Mercosur Agreement. There are several reasons
for this.
• We use a DG AGRI estimate of the size of Mercosur over-quota imports into the EU in recent
years rather than the higher 2019 over-quota imports. Using the latter would reduce the expected
impact of the Agreement.
• The new TRQ arrangements in the Agreement will be implemented over six equal annual steps
during which time (based on observed past trends) over-quota imports from Mercosur exporters
are expected to grow. The larger the volume of over-quota exports when the Agreement is
implemented, the smaller will be the additional access created by the TRQ as these imports will
be the first users of the new quota.
• We assume that the impact of frozen boneless beef imports is the same as for fresh or chilled
beef imports. However, these compete less directly with Irish exports on EU markets.
• We assume that the new TRQ will be fully utilised and that the drop in the tariff-inclusive price will
make it sufficiently attractive for EU demand for imported beef from Mercosur to expand by the
full amount of 53,000 tons, the difference between the new TRQ and existing over-quota imports.
• We assume that Brazil will fully utilise its Hilton Beef Quota (limited to pasture-fed animals) in the
light of the reduced tariff unlike at present. If Imports to its Chinese and Middle Eastern markets
remain buoyant, this assumption may not be fulfilled.
• We have not considered that some Argentinian and Uruguayan exports that currently benefit from
preferential access under the Hilton High Quality Beef quota will be displaced by US beef under
the Agreement on the reallocation of quota shares recently concluded with the Commission.
These exports will be displaced to the new TRQ, thus further limiting the extent to which the new
TRQ will create additional market access.

129
• The main market for Irish beef exports is the UK which imports almost no fresh/frozen Mercosur
beef at present. Irish beef exports are for the most part not directly competing with Mercosur
imports on EU markets. Brexit may bring about the need for a significant re-orientation of Irish
beef exports away from the UK market towards continental European markets so that in future
competition with Mercosur beef may become more intense. Quite independently of any EU FTA
with Mercosur, Irish exporters could also face greater competition with Mercosur beef on the UK
market after Brexit, either because the UK lowers its general MFN tariff or itself concludes an FTA
with Mercosur that contains trade concessions on beef.49 Until these outcomes occur, Irish
producers may benefit from a certain ‘stickiness’ in trade flows due to business relationships and
trust that have been built up over many years.
49 In its UK Global Tariff published in May 2020, the UK made very minor adjustments in its MFN tariffs on various beef tariff lines as compared to the EU tariff. For example, the tariff on ‘Fresh or chilled bovine meat, boneless’ (02013000) will be reduced from 12.80% + 303.40 EUR / 100 kg to 12.00% + 253.00 GBP/100kg. The specific tariff remains the same (converted at the exchange rate of €1 = 0.83687 GBP apart from any rounding down), while the ad valorem component has been slightly reduced. Under a ‘no-deal’ Brexit where no free trade agreement is negotiated with the EU, this tariff would also apply to Irish exports to the EU. If the UK were to introduce an autonomous preferential TRQ (as it had previously proposed in its UK Temporary Tariff regime published in March 2019) then Ireland would have to compete with Mercosur and other exporters for a share of this preferential tariff regime.
130
Appendix D Comparative Analysis of the Impacts of Methods of Production in the Beef Sector
This appendix provides a comparative analysis of GHG emissions related to beef production in Ireland and
the Mercosur countries. Based on the comparative analysis, the displacement of EU and Irish beef
production by Mercosur imports is forecast to lead to a marginal increase in overall global GHG emissions
in a ‘No policy change’ scenario. We also find that the TSD chapter in the EU-Mercosur Agreement
provides a set of mechanisms that potentially would give the EU some leverage to bring about a change in
Brazilian climate and forest policy.
Comparative Analysis of GHG Emissions in Ireland and Mercosur
Activity-based Estimates
The emissions intensity of beef production can be measured in various ways, depending on the scope of
the analysis and the metrics used. In this section, we compare emissions intensities of beef production in
Ireland and the Mercosur countries using several methodologies.
FAOSTAT from the UN Food and Agriculture Organisation provides the most comprehensive comparable
dataset, but also the simplest. It measures direct emissions from cattle production (i.e. from enteric
fermentation, manure management, agricultural soils) within the farm gate, referred to as activity-based
estimates. Additional emissions from upstream and downstream production and consumption processes
and trade are excluded. This corresponds to the scope of the national emissions inventories for the
Agriculture sector forwarded to the UNFCCC.50 The FAOSTAT emissions intensities for the Mercosur
countries and Ireland are shown in Table D1.
Emissions intensities of beef production in the Mercosur countries on this measure are all much higher
than in Ireland. The Irish figures show no improvement in emissions intensity over time (probably because
the use of IPCC default emission factors in the FAOSTAT database does not capture all the areas where
improvements have been made). The same is true for Argentina (where the emissions intensity in 1990
was already at the low end for the Mercosur countries), but the other Mercosur countries have made
steady progress in reducing their emissions intensity over time. The higher emissions intensities in the
Mercosur countries reflects poor forage quality and thus a higher age of slaughter than in Ireland as well
as low reproductive rates. Calving intervals of around 20 months and 3-4 years to slaughter are the norm.
The reduction over time reflects moves towards greater intensification and better management on some
farms. The relatively low Irish emissions also reflect the calculation methodology where only emissions
from non-dairy cattle are allocated to beef production despite much Irish beef originating from the dairy
herd.51
50 In Ireland’s case, the national inventory data are prepared by the Environmental Protection Agency and forwarded both to the EU and the UNFCCC. There are differences between FAOSTAT and national inventory figures. FAOSTAT uses the IPCC’s default Tier 1 emissions factors to make their calculations, while national inventories often make use of more specific (and more accurate) Tier 2 or Tier 3 emissions factors. Another source of possible differences is the metric used to aggregate emissions of the different gases to CO2eq. FAOSTAT uses Global Warming Potential equivalents from the IPCC Second Assessment Report (a description of the calculation method can be found in FAO, 2019) whereas the EU and its member states now use GWP equivalents from the IPCC Fourth Assessment Report.
51 This is a limitation of the FAOSTAT figures. FAOSTAT calculates the emissions associated with beef production by counting all the non-dairy cattle in a country (so, all cattle except for dairy cows) and then applying age-specific default emission factors to each category of cattle to sum the total emissions. This is then divided by total beef output to calculate the emissions intensity. Where beef is also produced as a by-product of milk production, as in Ireland, some portion of the emissions emitted by dairy cattle should be added to the non-dairy cattle emissions. It would be possible to impute some proportion of the dairy cattle emissions to beef production in Ireland and to recalculate the emissions intensity. O’Brien et al (2014) compared seven different ways of allocating dairy cow emissions between milk and meat in three different countries, Ireland, UK, and US. The different methods allocate between 81% and 98% of the dairy cow emissions to milk compared to a scenario where all emissions are automatically allocated only to milk. An adjustment of this size is unlikely to change the results dramatically.

131
Table D1 Emissions intensity of beef production in Ireland vs. Mercosur countries
Country Element Unit 1990 2017
Argentina Emissions (CO2eq) 000 tons 84,216.01 83,454.84
Production tons 3,007,000 2,842,000
Emissions intensity kg CO2eq/kg product 28.0 29.4
Brazil Emissions (CO2eq) 000 tons 213,740.24 330,285.83
Production tons 4,115,000 9,550,000
Emissions intensity kg CO2eq/kg product 51.9 34.6
Paraguay Emissions (CO2eq) 000 tons 13,580.91 22,710.57
Production tons 189,000 484,000
Emissions intensity kg CO2eq/kg product 71.9 46.9
Uruguay Emissions (CO2eq) 000 tons 13,464.21 18,304.54
Production tons 334,552 594,122
Emissions intensity kg CO2eq/kg product 40.2 30.8
Ireland Emissions (CO2eq) 000 tons 8,422.30 10,795.31
Production tons 515,000 617,000
Emissions intensity kg CO2eq/kg product 16.4 17.5
Note: The emissions intensities per kg of beef production in the FAOSTAT database are calculated by dividing
emissions from non-dairy cattle (estimated using IPCC Tier 1 emission factors) by the total volume of beef
produced in each country (emissions from dairy cows are assigned to the commodity milk output).
Source: Professor Alan Matthews based on FAOSTAT Agri-environment indicator, Emissions intensity, available at
http://www.fao.org/faostat/en/#data/EI
International comparisons of emissions intensity usually rely on national averages. Variation within a
country can be substantial, both across systems (e.g. conventional vs organic, dairy beef vs suckler beef)
and across management levels. When results are compared across different studies, the comparison is
also affected by different methodologies that are used (e.g. how to apportion emissions between the milk
and meat outputs from dairy cows, or the metrics used to aggregate different gases to CO2-equivalents).
The 2018 Teagasc Sustainability Survey estimates that average within-farm emissions for cattle
production on cattle farms in Ireland (thus calculated with a comparable scope to the FAOSTAT estimates)
were 12.1 kg CO2eq per kg liveweight but varied between the top performing third of farms (10.1 kg
CO2eq per kg liveweight) and the bottom performing third of cattle farms (14.5 kg CO2eq per kg
liveweight) (Buckley and Donnellan, 2020). Assuming a dressing percentage (the ratio of the carcass
weight to live animal weight) of 55% (Coyne, Evans, and Berry 2019), these figures convert to 22.0, 18.4
and 26.4 kg CO2eq per kg CW, respectively. These figures are somewhat higher than the corresponding
FAOSTAT figures and narrow the gap in within-farm emissions intensities shown in Table C1, but the
differences are still substantial.

132
Life Cycle Estimates of Beef Emissions in Brazil and Ireland
Life cycle analyses (LCA) of beef emissions extend the scope of the beef production system boundary to
include, in addition to the direct activity-based emissions, emissions from the production of materials (feed,
fertilisers, etc) and energy. GHG emissions from land use change (LUC), such as emissions from
conversion from forest to pastureland, as well as from land use (LU) such as carbon sequestration in soils,
can also be included. In addition to questions of scope, results can differ due to the functional unit
considered (emissions per unit weight, per calorie, or per unit protein), the emission factors used, as well
as allocation techniques (e.g. to allocate emissions from dairy cows between milk and meat production
and other services). This section examines LCA estimates of the carbon footprint of Brazilian beef
production with a specific focus on deforestation and compares these with available evidence for Ireland.
Cederberg, Meyer, and Flysjö (2009) were one of the first to provide an LCA estimate of Brazilian beef
emissions. Their LCA estimate, not including land use (LU) and land use change (LUC), was around 28 kg
CO2eq per kg carcass weight (CW) at the farm-gate as a national average. Methane from enteric
fermentation represented around 75% of this estimate and depended mainly on current breeding practice
of the livestock population and its feed intake. Based on an assumption of 25% uncertainty in the methane
calculations, they concluded that the national average carbon footprint of Brazilian beef (LUC not included)
fell in the range 23-34 kg CO2eq per kg carcass weight in the mid-2000’s. This estimate is lower than the
FAOSTAT estimate of direct emissions only, possibly because of the use of different emissions factors.
Cattle are the most important driver of land conversion in Brazil. Beef and dairy production accounted for
63% of the cleared surface in the Amazon biome in 2000-2013 (Tyukavina et al. 2017). Another study (De
Sy et al. 2015) found that, between 1990 and 2005, 71% of deforestation in South America was linked to
cattle, compared with 14% to planting crops. This emphasises the importance of including deforestation
emissions arising from LUC in LCA carbon footprint estimates.52
In a subsequent paper, Cederberg and colleagues took account of deforestation in LCA estimates of the
carbon footprint of Brazilian beef production (Cederberg et al. 2011). Associating deforestation emissions
with beef production begins with the area of deforested land and tracking its subsequent usage to
determine the proportion used for pasture. They made use of deforestation estimates in the Legal Amazon
Region (LAR) from INPE (the Brazilian National Institute for Space Research) and land use data from
agricultural censuses to track the transition to pasture. The paper converts the deforested land used for
pasture to beef using estimates of pasture productivity averaged over the LAR. The calculated carbon
footprint is sensitive to the time period selected for accounting, i.e. the production period over which the
emissions from the initial deforestation are amortized. They estimate that the carbon footprint of beef
produced on newly deforested land is 726 kg CO2eq per kg carcass weight if direct land use emissions
are annualised over 20 years. This is orders of magnitude larger than the figure for beef production on
established pasture on land that has not been recently deforested.
These figures refer to beef production. Cederberg et al. (2011) recognise that Brazilian beef exports mainly
originate from areas outside the LAR in the south and centre of the country (i.e. from areas not subject to
recent deforestation). They consider the question as to which beef from what areas should be associated
with these GHG emissions. The figure of 726 kg CO2eq per kg carcass weight associates deforestation
emissions solely with the beef produced on deforested land in the LAR. If these emissions are spread over
all beef production in the LAR, the LUC overhead is still high but reduces to 180 kg CO2eq per kg carcass
weight. If spread over all beef produced in Brazil, it reduces further to 44 kg CO2eq per kg carcass weight.
They also consider the extent to which these deforestation emissions should be associated with beef
exports from Brazil, given that most exports originated in non-deforestation states in the south, south-east
and centre-west of Brazil. Historically, this had been due to foot and mouth disease (FMD) restrictions. The
non-deforestation states had more effective FMD control and were qualified to export, whereas beef from
52 In assessing GHG emissions from LUC, it is conventional to distinguish between direct LUC, which can be attributed directly to a product from a specific piece of land following a change of use, and indirect LUC, where changes in agricultural activity or aggregate demand induce land-use changes that cannot be associated directly with a specific product. The carbon footprint reporting standards currently under development include only emissions from direct LUC.

133
the LAR mainly supplied domestic and regional markets. Between 2001 and 2003, Mato Grosso and
Rondônia (both states in the Legal Amazon Region) became disease-free zones, and beef from these
states now provides an increasing share of total export. Cederberg et al. (2011) observed that in the period
up to 2006 exports had increased significantly while domestic consumption remained flat. They concluded
that increased production for export was the key driver of the pasture expansion and deforestation in the
LAR in the decade 1997-2006 and that this should be reflected in the carbon footprint attributed to beef
exports. Attributing deforestation emissions from the production of beef for the domestic market displaced
because of increased exports from other parts of the country is an example of indirect land use change.
Several studies are available that estimate LCA estimates of emissions from beef cattle production in
Ireland. According to Casey and Holden (2006), average emissions from conventional suckler-beef farms
amounted to 26.3 kg CO2eq per kg carcass weight, but were 22.2 kg CO2eq per kg carcass weight for
suckler beef farms enrolled in an agri-environment scheme, and 20.2 kg CO2eq per kg carcass weight for
organic farms.53 Foley et al. (2011) found the lowest GHG emissions per kg beef carcass were achieved
for bull beef production systems at moderate stocking rates which had direct and total system GHG
emissions of 15.7 and 18.9 kg CO2eq per kg beef carcass, respectively. The highest GHG emissions were
for the scenario representing average farm conditions in Ireland with direct and total emissions of 19.0 and
23.1 kg CO2eq per kg beef carcass, respectively. Crosson and colleagues compared total greenhouse gas
emissions on an LCA basis for suckler beef systems at different levels of management intensity. Their
estimates ranged from 20.1 kg CO2eq per kg beef carcass for bull/heifer systems at the lowest stocking
intensity to 23.1 kg CO2eq per kg beef carcass for a steer/heifer system at the highest stocking intensity
(Crosson 2013).
Recent estimates from O’Brien et al. (2020) derived from research farms in Ireland (which would be
expected to have a lower footprint than for commercial farms on average) reported a carbon footprint of
22.7 kg CO2eq per kg carcass weight for a suckler to beef farm but a footprint of only 14.7 kg CO2eq/kg
carcass weight for a dairy calf to beef farm where the emissions associated with the dairy cow are
assigned to the milk output. These LCA estimates are comparable to but lower than the single Brazilian
estimate excluding deforestation. We come back to this point after considering two further comparative
studies.
Comparative LCA Studies of Beef Emissions
The drawback in making comparisons between results from individual studies is that there are inevitably
differences in the way the studies have been conducted that mean the results do not strictly compare like-
for-like. There are two comparative studies which include both Ireland and Brazil which allow a more direct
comparison. One is the well-known study undertaken by the European Commission’s Joint Research
Centre (Leip et al. 2010) that compared the carbon footprint of Irish beef with beef produced in other EU
countries as well as Brazil.54 Irish beef production was estimated to be amongst the most carbon efficient
in Europe. Irish beef had a carbon footprint of 19 kg CO2eq per kg beef, below the EU average of 22.1 kg
CO2eq per kg beef. The same study, drawing on data in the Cederberg et al. (2011) study, estimated that
the carbon footprint of Brazilian beef imported into the EU was 80 kg CO2eq per kg beef when LUC is
included and 48 kg CO2eq per kg meat excluding emissions from LUC.55 As the study notes: “A precise
allocation of emissions from land use change to exported beef is a challenging task, and no agreed
53 Their results were presented per kg of liveweight and have been converted in the text using a dressing percentage of 55%. 54 This LCA study included not only estimates of emissions due to LUC but also considered carbon sequestered in soils by grazing
animals (LU). The allocation of methane emissions between meat and milk from enteric fermentation and manure management of dairy cattle was made based on the energy requirement for lactation and pregnancy, respectively.
55 The loading attached to LUC (deforestation) depended on some important methodological assumptions. Specifically, the JRC study assumed that the share of Brazilian exports to the EU originating in the LAR was the same as this region’s share in total Brazilian exports. The estimate was also very dependent on the period investigated for the 20-year amortisation period which was 1987-2006. As noted elsewhere in this appendix, there was a dramatic fall in EU imports of Brazilian beef after 2007 when restrictions were put in place due to deficiencies found by the FVO in the Brazilian cattle identification and certification system and in Brazilian government oversight and testing. If the amortisation period had been based on the years 1989-2008, no deforestation emissions would have been associated with EU beef imports.

134
methodology and accurate data exists. This chapter presents a simplified approach, and the results should
be used with extreme caution”. (p. 294).
Another source of information on LCA emissions for beef production is the FAO GLEAM (Global Livestock
Environmental Accounting) database (Opio et al. 2013; FAO 2017). The second version of this database,
GLEAM 2.0, is based on the reference year 2010. GLEAM covers the entire livestock production chain,
from feed production to the retail point. The system boundary is defined from “Cradle-to-retail of processed
animal products.”56 Production systems are distinguished between grassland-based, mixed farming and
feedlot systems but only averages (‘All systems’) are presented here. The database distinguishes between
beef from the dairy herd and other beef.57 LUC elements involving transformation of forest to pasture are
included in GLEAM for Latin America only and were attributed to beef in grassland-based production
systems in those countries in which the conversion occurred. Changes in soil organic carbon stocks on
grazing land are not considered due to lack of validated international data but could offset emissions in
both Mercosur countries and Ireland.58
Table D2 shows some results extracted from GLEAM comparing emissions per kg carcass weight
(Column 1) and per kg protein (Cols 2-4). The emission intensities for Irish suckler beef are much higher
than those previously quoted from independent studies and the JRC study. Based on these estimates,
overall emissions intensities per kg carcass weight are similar in Ireland to Argentina and Uruguay, while
adding the deforestation penalty greatly increases the reported emissions intensities for Brazil and
particularly Paraguay. It should be noted that, if LUC emissions are removed from Brazil’s figures, its
emissions would be 50.1 kg CO2eq per kg carcass weight, thus still higher than the Irish figure.59 Given
the rapid rate of productivity growth in Brazil’s beef production in the last decade, it is likely that the gap
has been reduced in the decade since 2010 to which these figures refer.60
56 The functional units used to report GHG emissions in GLEAM are expressed as “kg of carbon dioxide equivalents (CO2eq) per kg of protein in animal product”. This choice allows the comparison between different livestock products. IPCC Tier 2 approaches were used in the characterization of livestock population, to calculate emissions related to enteric fermentation as well as manure management and storage. The Tier 1 method was used where data was generally lacking, e.g. estimation of carbon stocks from LUC and N2O emissions from feed production. Global Warming Potentials (GWPs) with a time horizon of 100 years based on the 4th Assessment Report of the IPCC (IPCC, 2007) were used to convert N2O and CH4 to CO2eq terms. Consequently, GWP of 25 and 298 were used for CH4 and N2O, respectively.
57 The total cattle herd is divided into the dairy herd and the non-dairy herd. The dairy herd includes milking cows, adult males and replacement stock, while surplus males and females are included in the herd producing meat only along with beef cows and their followers. Emissions from the dairy herd are divided between milk and meat production according to the fractions of total protein contained within the milk and meat produced.
58 Around 86% of Brazilian livestock are solely grass-fed (mainly tropical grasses of genus Brachiaria). Several studies show that improving tropical grasses productivity results in increased soil carbon stocks, with net atmospheric CO2 removals of almost 1 Mg C ha-1yr-1 when comparing degraded and improved pastures under a standard IPCC method (de Oliveira Silva et al. 2016).
59 The Cederberg et al (2011) estimate of deforestation emissions is very close to the estimate derived from the FAO GLEAM 2.0 database of (88.4 – 50.1 = 38.3 kg CO2eq per kg carcass weight) for a similar time period, given that the GLEAM database averages these emissions over all non-dairy cattle production in Brazil.
60 The Brazilian Government loaned US$ 3.9 bn to farmers in 2010-2018 to support the adoption of technologies to increase the productivity of pastures (Vale et al. 2019).

135
Table D2 LCA Emission Estimates for Ireland vs. Mercosur Countries
Country
Emissions intensity
Non-dairy beef
Emissions intensity
Dairy beef
Emissions intensity
Non-dairy beef
Emissions intensity
All beef
kg CO2eq/kg CW kg CO2eq/kg protein kg CO2eq/kg protein kg CO2eq/kg protein
(1) (2) (3) (4)
Argentina 46.9 296.0 98.7 251.0
Brazil 88.4 557.5 132.3 430.5
Paraguay 223.0 129.6 1,406.9 1,307.9
Uruguay 44.4 99.4 279.9 234.4
Ireland 42.3 138.6 266.7 214.8
Source: Professor Alan Mathews based on FAO GLEAM 2.0 database
Data are not reported in the GLEAM database to allow the calculation of the emissions intensity of dairy
beef on a per kg carcass weight basis and thus overall beef production. Instead, emission intensities are
standardised on a per kg protein basis. As the protein content of beef is derived from carcass weight using
fixed bone-free meat to carcass weight and average protein content in meat ratios, the ranking using
carcass weight or protein should not change.61 For non-dairy beef, the ratios shown for Ireland and
Paraguay are in line with expectations, but not for the other Mercosur countries. For this reason, we do not
pay further attention to the rankings in Columns 2-4.
Although there must be some doubt about the validity of the Irish figures for suckler beef in the GLEAM
database given that they are so different to the estimates found in the Irish and JRC studies quoted, it is
still interesting to observe that Irish LCA emissions are similar to emissions in Argentina and Uruguay,
given that Ireland’s direct emissions shown in the FAOSTAT database are much lower. There are two
possible explanations which underline the inevitable uncertainty in making international comparisons.
First, the FAOSTAT figures calculate the direct emissions intensities for beef based only on emissions
from non-dairy animals, as previously discussed. By ignoring the contribution of emissions from dairy cows
in the production of dairy beef, they underestimate the emissions intensity of Irish beef production. On the
other hand, it is well established that the emissions intensity of dairy beef is significantly lower than for
suckler beef because the overhead of the dairy cow is mainly attributed to the production of milk. The
higher share of dairy beef in Ireland compared to the Mercosur countries where most beef is produced
from beef cows will tend to reduce the relative average Irish emissions, all other things being equal.
Second, production in Ireland is more efficient than in Mercosur countries with their longer calving periods
and longer age to slaughter. This is reflected in lower direct emissions including for non-dairy cattle.
However, that additional production efficiency comes at a price. This advantage is offset by the higher
indirect emissions associated with bought-in feed but also emissions from the spreading of slurry produced
when cattle are housed as well as those embodied in purchased nitrogen fertiliser. Fertiliser and housing
are hardly used in beef cattle production in Mercosur countries. The breakdown of emissions by source in
Table D3 illustrates this paradox.
61 Although dressing percentages (ratio of carcass weight to liveweight) can differ, fixed coefficients of 0.75 for the bone-free meat fraction of carcass weight, and 0.2113 kg protein per kg beef for the average protein content of beef, are used. Multiplying these together gives a fraction 0.158475 that should convert emissions per kg carcass weight to emissions per kg protein. This ratio holds in the case of Ireland and Paraguay but not for the other Mercosur countries (FAO 2017, Table 9.1).

136
Table D3 Composition of Emissions Associated with Non-dairy Cattle, Ireland vs. Mercosur
Argentina Brazil Paraguay Uruguay Ireland
Enteric fermentation 74% 39% 27% 75% 35%
Manure applied and
deposited 1% 2% 1% 2% 23%
Fertiliser and crop residues 3% 2% 3% 4% 17%
Feed production 11% 9% 4% 10% 18%
Land use change 3% 43% 63% 2% 0%
Manure management 7% 4% 2% 7% 5%
Energy use direct and indirect 1% 1% 0% 1% 2%
Total GHG emissions 100% 100% 100% 100% 100%
Source: Professor Alan Mathews based FAO, GLEAM 2.0 database
In summary, comparisons of greenhouse gas footprints across countries are often difficult to interpret
because the scope of the studies differ, and the assumptions made about key parameters are often
different. Also, comparative studies that try to control for these differences by applying a similar
methodology across all countries can still differ from each other. Based on the evidence reviewed,
however, we conclude that the emissions footprint of beef production in Ireland is substantially lower than
beef produced in the Mercosur countries, especially when deforestation emissions in Brazil and especially
Paraguay are accounted for.
Other Mechanisms to Improve the Sustainability of Trade
The cooperation mechanisms in the TSD chapter in the Mercosur Agreement are one approach to try to
bring about deforestation-free beef supply chains and more ambitious climate action. The EU also has
other regulatory and non-regulatory instruments that can be introduced in parallel to pursue these
objectives.
In 2019, the Commission presented a Communication on stepping up action to protect and restore the
world’s forests (European Commission 2019a). It recognised that the EU by itself cannot reverse the trend
of deforestation. It needs to be part of a global alliance. Consequently, the Communication proposed a
partnership approach - close cooperation with producer and consumer countries as well as business and
civil society. It argued such partnerships can facilitate action promoting land governance, sustainable
forest management and reforestation, transparent supply chains, effective monitoring, sustainable finance,
and multilateral cooperation. The Communication built on a previous commissioned study that examined
various options to step up EU action against deforestation (European Commission 2018a). However, given
that the then Commission was nearing the end of its mandate, the Communication stopped short of laying
out a definitive blueprint for the incoming Commission.
In its Communication on the European Green Deal in 2019, the incoming Commission indicated that it
would take measures, both regulatory and otherwise, to promote imported products and value chains that
do not involve deforestation and forest degradation (European Commission 2019b). In its resolution on the
European Green Deal, the European Parliament called on the Commission “to present, without delay, a
proposal for a European legal framework based on due diligence to ensure sustainable and deforestation-

137
free supply chains for products placed on the EU market, with a particular focus on tackling the main
drivers of imported deforestation and instead encouraging imports that do not create deforestation abroad”
(European Parliament 2020b).62
In an own-initiative report in 2018, the European Parliament proposed the following elements for a
regulatory framework to address EU trade and consumption of forest-risk commodities (European
Parliament 2018).
(a) mandatory criteria for sustainable and deforestation-free products;
(b) mandatory due diligence obligations on both upstream and downstream operators in forest-
risk commodity supply chains;
(c) enforced traceability of commodities and transparency throughout the supply chain;
(d) a requirement on Member States’ competent authorities to investigate and prosecute EU
nationals or EU-based companies that benefit from illegal land conversion in producer countries;
(e) ensure compliance with international human rights law, respect for customary rights as set out
in the FAO’s 2012 Voluntary Guidelines on the Governance of Tenure, and guarantee the free,
prior and informed consent of all potentially affected communities through the entire lifecycle of
the product.
The European Green Deal Communication promised action on this dossier from 2020 onwards.
Considerable preparatory work has already been undertaken, and the proposed legislation provides the
opportunity to introduce complementary measures to the EU-Mercosur Agreement to ensure deforestation-
free supply chains.
One specific mechanism relevant to deforestation due to beef production in Brazil is the Terms of
Adjustment of Conduct (TAC) voluntary code of conduct for meatpacking companies in Brazil. This was
signed in 2009 by cattle producers, meatpackers, and the federal government, aiming to prevent the sale
of cattle produced on land that was embargoed either due to illegal clearing or because other legal
requirements had not been met. It followed the publication of a major report by Greenpeace Slaughtering
the Amazon which documented the destruction caused by cattle ranching and named and shamed some
of the world’s leading brands for their involvement (Greenpeace 2009). Under the Agreement, animals
from properties in the Amazon biome cleared after July 2008 (the base date of the new forest code) cannot
be sold for slaughter and those meatpacking companies that signed up to the Agreement agreed not to
purchase such animals. Eight years after its creation, sixty-three meatpackers (48%) active in the Amazon
biome had joined the TAC, and they together slaughter approximately 70% of the cattle produced in the
biome (Carvalho et al. 2019).
However, the study suggests that some ranchers have found ways to circumvent the Agreement, either by
selling cattle to meatpackers that were not yet signatories to the TAC, by registering only the ‘deforestation
free’ parts of their properties in the Rural Environmental Register, or by “laundering” cattle raised and
fattened on non-compliant properties through compliant properties that serve as middlemen before sale to
slaughterhouses. When the Federal Public Prosecutor released the first audit of the TAC in 2018, there
was no punishment for the slaughterhouses that received cattle produced in illegal areas (Carvalho et al.
2019).
Greenpeace released a further update in June 2020 suggesting that the three major Brazilian meat
companies had purchased cattle raised on illegally deforested land that were laundered through a farm
with ‘clean’ credentials, in this case where both farms had the same owner (Reuters 2020). The
companies responded saying that they stood by their commitments not to purchase cattle from properties
with illegal deforestation but that the absence of a comprehensive cattle tracking system made it hard to
62 Due diligence exists in the EU Timber Regulation which obliges operators who place timber and timber products on the EU market to carry out due diligence to minimise the risk of importing illegally harvested timber.

138
scrutinise ‘indirect’ suppliers. Greenpeace concluded that a lack of end-to-end tracking in Brazil’s cattle
market makes it difficult for the buyers to know for certain if beef is linked to deforestation.
This study has not made new assessments of the traceability system in Brazil but rather relies on studies
from Greenpeace and academia in Brazil. As presented in the main study, the overall impacts of the
increased market access offer in the EU-Mercosur Agreement are low, with an estimated increase of
20,000 tons of exports from Brazil to the EU compared to annual beef production of 11 million tons. In this
context, such incremental change would not impact the extent of any illegal sourcing, nor is it likely to
create an incentive to do so. Finally, current conditions would be the outcome under a ‘No policy change’
scenario. The EU-Mercosur Agreement provides several provisions to promote the development of trade in
such a way as to contribute to the objective of sustainable development, for example, within the TSD and
the Dialogues chapters. This opens the possibility that the EU can use the commitments and mechanisms
of the Agreement to press for policy changes that would offset, or more than offset, the potentially negative
static effects of the Agreement.
The question for policymakers is whether the cooperation, consultation, and dispute settlement
mechanisms contained in the TSD chapter can be used effectively to press the Mercosur countries to raise
their level of ambition and enforcement of their climate and deforestation commitments. The potential
under these cooperation mechanisms to exert additional pressure for desirable policy changes must be
weighed against the potential adverse impacts on deforestation and climate from ratification in a ‘No policy
change’ scenario. But failure to ratify the Agreement would leave the EU without any means of policy
leverage. It would avoid the immediate, static, negative consequences of increased beef imports into the
EU from the Mercosur countries, but would result in Brazil becoming more dependent on other markets
where interest in linking trade with sustainability issues may be lower than in the EU. Ratifying the
Agreement could give the EU increased leverage to influence the climate and deforestation policies of the
Mercosur countries in ways that could more than offset the immediate negative impacts of the anticipated
increase in beef imports. The alternative of non-ratification of the Agreement would imply the loss of
potentially important tools that the EU could use to bring pressure on Brazil (and the other Mercosur
governments) to live up to the commitments they have made with respect to forests and climate.

139
References
Abbott, Philip C. 2002. “Tariff‐rate Quotas: Failed Market Access Instruments?” European Review of
Agricultural Economics 29 (1): 109–30. https://doi.org/10.1093/erae/29.1.109.
Baltensperger, M., and U. Dadush. 2019. The European Union-Mercosur Free Trade Agreement:
Prospects and Risks. Policy Contribution Issue No. 11. Brussels: Bruegel.
Borcherding, T., and E. Silberberg. 1978. “Shipping the Good Apples Out: The Alchian and Allen Theorem
Reconsidered.” Journal of Political Economy 86 (1): 131–38.
Boughner, D., H. de Gorter, and I. Sheldon. 2002. “The Economics of Two-Tier Tariff-Rate Import Quotas
in Agriculture.” Agricultural and Resource Economics Review 29 (1): 58–69.
Boulanger, P., H. Dudu, E. Ferrari, M. Himics, and R. M’barek. 2016. Cumulative Economic Impact of
Future Trade Agreements on EU Agriculture. Luxembourg: Publications Office of the European Union.
Brester, Gary W., and Michael K. Wohlgenant. 1991. “Estimating Interrelated Demands for Meats Using
New Measures for Ground and Table Cut Beef.” American Journal of Agricultural Economics 73 (4): 1182–
94. https://doi.org/10.2307/1242446.
Burton, M., and T. Young. 1992. “The Structure of Changing Tastes for Meat and Fish in Great Britain.”
European Review of Agricultural Economics 19: 165–80.
CAIT. 2016. Climate Data Explorer.
Carvalho, William D., Karen Mustin, Renato R. Hilário, Ivan M. Vasconcelos, Vivianne Eilers, and Philip M.
Fearnside. 2019. “Deforestation Control in the Brazilian Amazon: A Conservation Struggle Being Lost as
Agreements and Regulations Are Subverted and Bypassed.” Perspectives in Ecology and Conservation 17
(3): 122–130.
Casey, J. W., and N. M. Holden. 2006. “Greenhouse Gas Emissions from Conventional, Agri-
Environmental Scheme, and Organic Irish Suckler-Beef Units.” Journal of Environmental Quality 35 (1):
231–239.
Cederberg, C., D. Meyer, and A. Flysjö. 2009. Life Cycle Inventory of Greenhouse Gas Emissions and Use
of Land and Energy in Brazilian Beef Production. SIK Institutet för livsmedel och bioteknik.
Cederberg, C., U. Martin Persson, Kristian Neovius, Sverker Molander, and Roland Clift. 2011. “Including
Carbon Emissions from Deforestation in the Carbon Footprint of Brazilian Beef.” Environmental Science
and Technology 45 (5): 1773–79.
Coffey, Brian K., Ted C. Schroeder, and Thomas L. Marsh. 2011. “Disaggregated Household Meat
Demand with Censored Data.” Applied Economics 43 (18): 2343–63.
Copenhagen Consensus. 2015. Brazil Perspectives: Air Pollution.
Copenhagen Economics. 2018. Ireland & the Impacts of Brexit.
———.2020. An Assessment of the Economic Impacts Arising for Ireland from the Potential Future Trade
Relationship between the EU and UK.
Coyne, Jessica M., Ross D. Evans, and Donagh P. Berry. 2019. “Dressing Percentage and the Differential
between Live Weight and Carcass Weight in Cattle Are Influenced by Both Genetic and Non-Genetic
Factors.” Journal of Animal Science 97 (4): 1501–1512.
140
Crosson, P. 2013. Quantifying Greenhouse Gas Emissions from Beef Cattle Systems. Technology
Updates Project No. 6065. Ireland: Teagasc.
Deblitz, C. 2019. Beef and Sheep Report 2019. agribenchmark.org.
De Sy, Veronique, Martin Herold, F. Achard, René Beuchle, JGPW Clevers, Erik Lindquist, and Louis
Verchot. 2015. “Land Use Patterns and Related Carbon Losses Following Deforestation in South
America.” Environmental Research Letters 10 (12): 124004.
DG TRADE. 2019. The EU-Mercosur Trade Agreement - Opening up a wealth of opportunities for Ireland.
Brussels: Commission of the European Union.
———. 2018. EU Exports, Preference Utilisation and Duty Savings by Member State, Sector and Partner
Country.
Drinks Ireland. 2021. Irish Whiskey 2010-2020 - The Restoration of the Irish Whiskey Industry across our
Shared Island.
Eales, J., and L. Unnevehr. 1993. “Simultaneity and Structural Change in US Meat Demand.” American
Journal of Agricultural Economics 75: 259–68.
Eales, James S., and Laurian J. Unnevehr. 1988. “Demand for Beef and Chicken Products: Separability
and Structural Change.” American Journal of Agricultural Economics 70 (3): 521–32.
European Environment Agency. 2019. State of the Environment, December 2019.
Environmental Protection Agency. 2020a. Ireland's Greenhouse Gas Emissions Projections 2019-2040.
———. 2020b. Agriculture: Impact on Climate Change, Air Pollution and Water.
EUROCHAMBRE. 2018. Towards European Trade Implementation Action Plans. Concept Paper.
European Commission. 2008. Addressing the Challenges of Deforestation and Forest Degradation to
Tackle Climate Change and Biodiversity Loss. COM(2008) 645. Brussels.
European Commission. 2020. A medium-term outlook on the prospects for agricultural markets and
income.
European Commission. 2020. EU Agricultural Outlook for Markets, Income and Environment 2020-2030.
Brussels: European Commission Directorate-General for Agriculture and Rural Development.
———. 2013. The Impact of EU Consumption on Deforestation: Comprehensive Analysis of the Impact of
EU Consumption on Deforestation. Final Report. Study Funded by the European Commission and
Undertaken by VITO, the International Institute for Applied Systems Analysis, HIVA - Onderzoeksinstituut
Voor Arbeid En Samenleving and International Union for the Conservation of Nature NL. Brussels.
———. 2016. Handbook for Trade Sustainability Impact Assessment, 2nd edition.
———. 2017. Trade and Sustainable Development (TSD) Chapters in EU Free Trade Agreements (FTAs).
Non-Paper of the Commission Services. Brussels.
———. 2018a. Feasibility Study on Options to Step up EU Action against Deforestation. Brussels.
———. 2018b. Feedback and Way Forward on Improving the Implementation and Enforcement of Trade
and Sustainable Development Chapters in EU Free Trade Agreements.

141
———. 2018c. Report on Implementation of Free Trade Agreements 1 January 2017 - 31 December 2017.
COM(2018) 728. Brussels.
———. 2019a. Stepping up EU Action to Protect and Restore the World’s Forests. COM(2019) 352.
Brussels.
———. 2019b. The European Green Deal. COM(2019) 640. Brussels.
———.2020a. Trade Policy Reflections Beyond the COVID19 Outbreak.
———.2020b. European Commission appoints its first Chief Trade Enforcement Officer.
———.2021. European Commission Services’ Position Paper on the Sustainability Impact Assessment in
Support of Negotiations for the Trade Part of the European Union-Mercosur Association Agreement.
European Parliament. 2018. Resolution of 11 September 2018 on Transparent and Accountable
Management of Natural Resources in Developing Countries: The Case of Forests (2018/2003(INI)).
https://www.europarl.europa.eu/doceo/document/TA-8-2018-0333_EN.html.
———.2019. The Trade Pillar of the EU-Mercosur Association Agreement.
———. 2020. Resolution of 15 January 2020 on the European Green Deal (2019/2956(RSP)).
FAO. 2017a. Global Livestock Environmental Assessment Model: Model Description Version 2.0. Rome,
Italy.
———. 2017b. Uruguay – Case study.
———. 2019. FAOSTAT Agri-Environmental Indicators, Emissions Intensities.
FERN. 2020. The EU-Mercosur Trade Agreement: What It Is, and What Could It Mean for Forests and
Human Rights? Brussels.
Filho, Barbosa De Oliveira. 2020. “Impact of Environmental Law Enforcement on Deforestation, Land Use
and Natural Regeneration in the Brazilian Amazon.” PhD, University of Cambridge.
Foley, P. A., P. Crosson, D. K. Lovett, T. M. Boland, F. P. O’Mara, and D. A. Kenny. 2011. “Whole-Farm
Systems Modelling of Greenhouse Gas Emissions from Pastoral Suckler Beef Cow Production Systems.”
Agriculture, Ecosystems & Environment 142 (3–4): 222–230.
Frizzo, H. et al. 2014. Public procurement in Brazil: overview.
Government of Ireland. 2019. Climate Action Plan 2019.
Greenpeace. 2009. Slaughtering the Amazon. São Paolo, Brazil.
IEG Vu/IEG Policy. 2019. The EU-Mercosur Trade Agreement: Impacts on Food and Farming. London:
IHS Markit.
Junker, Franziska, and Thomas Heckelei. 2012. “TRQ-Complications: Who Gets the Benefits When the
EU Liberalizes Mercosur’s Access to the Beef Markets?” Agricultural Economics 43 (2): 215–31.
https://doi.org/10.1111/j.1574-0862.2011.00578.x.
Kehoe, L. et al. 2020. Inclusion, Transparency, & Enforcement: How the EU-Mercosur Trade Agreement
Fails the Sustainability Test.

142
Kim, J. W. 2020. Shedding Light on the Role of the EU’s Chief Trade Enforcement Officer: Dispute over
Labour Commitments under EU – Korea FTA and EU Enforcement Regulation.
Leip, A., F. Weiss, T. Wassenaar, I. Perez, T. Fellmann, P. Loudjani, F. Tubiello, D. Grandgirard, S. Monni,
and K. Biala. 2010. Evaluation of the Livestock Sector’s Contribution to the EU Greenhouse Gas
Emissions (GGELS) - Final Report. Seville: European Commission Joint Research Centre.
Lema, D., M. Gallachor, J. Yerovi, and C. De Salvo. 2018. Analysis of Agricultural Policies in Argentina
2007–2016. Washington, D.C.: Inter-American Development Bank.
Lusk, Jayson L., and Glynn T. Tonsor. 2016. “How Meat Demand Elasticities Vary with Price, Income, and
Product Category.” Applied Economic Perspectives and Policy 38 (4): 673–711.
https://doi.org/10.1093/aepp/ppv050.
LSE Consulting. 2020. Sustainability Impact Assessment in Support of the Association Agreement
Negotiations between the European Union and Mercosur. London: London School of Economics and
Political Science.
McCabe, S., D. Oliveira, L. McKenna, C. McFadden, C. Morrison, J. Cafferky, and T. Donnelly. 2020.
Assessment of the Social and Environmental Risks Posed by the EU-Mercosur Trade Agreement. Dublin:
Uplift and TASC.
Moschini, Giancarlo, and Karl D. Meilke. 1989. “Modeling the Pattern of Structural Change in US Meat
Demand.” American Journal of Agricultural Economics 71 (2): 253–61.
O’Brien, D., J. L. Capper, P. C. Garnsworthy, C. Grainger, and L. Shalloo. 2014. “A Case Study of the
Carbon Footprint of Milk from High-performing Confinement and Grass-based Dairy Farms”, Journal of
Dairy Science 97: 1835-1851.
O’Brien, D., J. Herron, J. Andurand, S. Caré, P. Martinez, L. Migliorati, M. Moro, G. Pirlo, and J.-B. Dollé.
2020. “LIFE BEEF CARBON: A Common Framework for Quantifying Grass and Corn Based Beef Farms’
Carbon Footprints.” Animal 14 (4): 834–45.
Okrent, A., and J. M. Alston. 2012. The Demand for Disaggregated Food-Away-From-Home and Food-at-
Home Products in the United States. Economic Research Report Number 139. Washington, D.C.:
Economic Research Service, U.S. Department of Agriculture.
Oliveira Silva, R. de, L. G. Barioni, J. A. J. Hall, M. Folegatti Matsuura, T. Zanett Albertini, F. A. Fernandes,
and D. Moran. 2016. “Increasing Beef Production Could Lower Greenhouse Gas Emissions in Brazil If
Decoupled from Deforestation.” Nature Climate Change 6 (5): 493–497.
Opio, C., P. Gerber, A. Mottet, A. Falcucci, G. Tempio, M. MacLeod, T. Vellinga, B. Henderson, and H.
Steinfeld. 2013. Greenhouse Gas Emissions from Ruminant Supply Chains: A Global Life Cycle
Assessment. Rome: Food and Agriculture Organization of the United Nations (FAO).
Ramos, M., J.-C. Bureau, and L Salvatici. 2010. “Trade Composition Effects of the EU Tariff Structure:
Beef Imports from Mercosur.” European Review of Agricultural Economics 37 (1): 1–26.
https://doi.org/10.1093/erae/jbq007.
Reuters. 2020. “Brazil Meatpackers Bought Cattle Linked to Deforestation, Says Greenpeace.” June 4,
2020.
Ribeiro, C. et al. 2018. “Unveiling the public procurement market in Brazil: A methodological tool to
measure its size and potential”. Development Policy Review Volume 36.
Sasaki, K. 1995. “Consumption Behavior of Japanese Agricultural Households: Analysis of an Almost Ideal
Demand System.” Journal of Rural Economics 67 (3): 141–50.
143
Seale, J., A. Regmi, and J. Berstein. 1996. International Evidence on Food Consumption Patterns.
Technical Bulletin Number 1904. Washington, D.C.: Economic Research Service, U.S. Department of
Agriculture.
Skully, D. 2001a. Economics of Tariff-Rate Quota Administration. Technical Bulletin No. 1893.
Washington, D.C.: Economic Research Service, U.S. Department of Agriculture.
———. 2001b. “Liberalizing Tariff-Rate Quotas.” In Agricultural Policy Reform in the WTO—The Road
Ahead, edited by M. Burfisher. Agricultural Economic Report No. 802. Washington, D.C.: Economic
Research Service, U.S. Department of Agriculture.
Taylor, Mykel R., and Glynn T. Tonsor. 2013. “Revealed Demand for Country-of-Origin Labeling of Meat in
the United States.” Journal of Agricultural and Resource Economics, 235–47.
Thorne, F., P. Gillespie, T. Donnellan, K. Hanrahan, A. Kinsella, and D. Läpple. 2017. The
Competitiveness of Irish Agriculture. Athenry: Teagasc.
Teagasc (Agriculture and Food Development Authority). 2017. ”Agriculture in Ireland”. October 12, 2020:
https://www.teagasc.ie/rural-economy/rural-economy/agri-food-business/agriculture-in-ireland/.
Tomek, W., and K. Robinson. 1972. Agricultural Product Prices. Ithaca and London: Cornell University
Press.
Tyukavina, Alexandra, Matthew C. Hansen, Peter V. Potapov, Stephen V. Stehman, Kevin Smith-
Rodriguez, Chima Okpa, and Ricardo Aguilar. 2017. “Types and Rates of Forest Disturbance in Brazilian
Legal Amazon, 2000–2013.” Science Advances 3 (4).
USDA. 2020. New Export Tax Rates in Argentina. GAIN Report Number AR2020-0008. Washington, D.C.:
USDA Foreign Agricultural Service.
United Nations. 2020. World Investment Report 2020 – International Production Beyond the Pandemic.
United Nations conference on trade and development (UNCTAD).
Vale, Petterson, Holly Gibbs, Ricardo Vale, Matthew Christie, Eduardo Florence, Jacob Munger, and
Derquiane Sabaini. 2019. “The Expansion of Intensive Beef Farming to the Brazilian Amazon.” Global
Environmental Change 57 (July).
World Bank. 2020. Covid-19 and Food Protectionism: The Impact of the Pandemic and Export Restrictions
on World Food Markets.
World Economic Forum. 2020. How Can Trade Rules Support Environmental Action? Global Future
Council on International Trade and Investment, World Economic Forum Briefing Paper.