economic and social research foundation
TRANSCRIPT

ECONOMIC AND SOCIAL RESEARCH FOUNDATION
(ESRF)
MMOOVVIINNGG OOUUTT OOFF PPOOVVEERRTTYY:: UUnnddeerrssttaannddiinngg GGrroowwtthh aanndd DDeemmooccrraaccyy ffrroomm tthhee BBoottttoomm UUpp
Regional Synthesis Report
By Dr Flora Kessy
Dr Oswald Mashindano Mr Dennis Rweyemamu
Mr Prosper Charle
Final Draft
September 2006

_____________________________________________________________________
MOVING OUT OF POVERTY: Understanding Growth and Democracy from the Bottom Up - Regional Synthesis Report
i
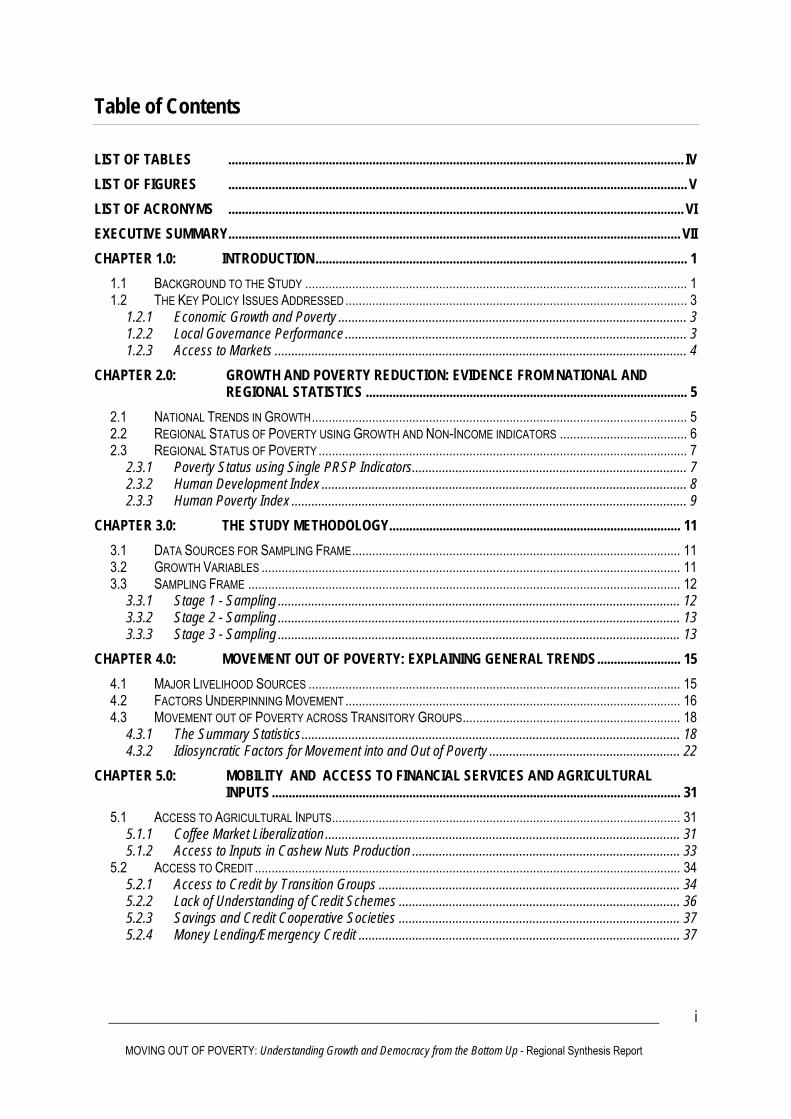
Table of Contents LIST OF TABLES ........................................................................................................................................ IV LIST OF FIGURES ......................................................................................................................................... V LIST OF ACRONYMS ........................................................................................................................................ VI EXECUTIVE SUMMARY....................................................................................................................................... VII CHAPTER 1.0: INTRODUCTION............................................................................................................... 1
1.1 BACKGROUND TO THE STUDY .................................................................................................................. 1 1.2 THE KEY POLICY ISSUES ADDRESSED...................................................................................................... 3
1.2.1 Economic Growth and Poverty ........................................................................................................ 3 1.2.2 Local Governance Performance ...................................................................................................... 3 1.2.3 Access to Markets ........................................................................................................................... 4
CHAPTER 2.0: GROWTH AND POVERTY REDUCTION: EVIDENCE FROM NATIONAL AND REGIONAL STATISTICS ................................................................................................ 5
2.1 NATIONAL TRENDS IN GROWTH................................................................................................................ 5 2.2 REGIONAL STATUS OF POVERTY USING GROWTH AND NON-INCOME INDICATORS ...................................... 6 2.3 REGIONAL STATUS OF POVERTY .............................................................................................................. 7
2.3.1 Poverty Status using Single PRSP Indicators.................................................................................. 7 2.3.2 Human Development Index ............................................................................................................. 8 2.3.3 Human Poverty Index ...................................................................................................................... 9
CHAPTER 3.0: THE STUDY METHODOLOGY....................................................................................... 11 3.1 DATA SOURCES FOR SAMPLING FRAME.................................................................................................. 11 3.2 GROWTH VARIABLES ............................................................................................................................. 11 3.3 SAMPLING FRAME ................................................................................................................................. 12
3.3.1 Stage 1 - Sampling ........................................................................................................................ 12 3.3.2 Stage 2 - Sampling ........................................................................................................................ 13 3.3.3 Stage 3 - Sampling ........................................................................................................................ 13
CHAPTER 4.0: MOVEMENT OUT OF POVERTY: EXPLAINING GENERAL TRENDS......................... 15 4.1 MAJOR LIVELIHOOD SOURCES ............................................................................................................... 15 4.2 FACTORS UNDERPINNING MOVEMENT .................................................................................................... 16 4.3 MOVEMENT OUT OF POVERTY ACROSS TRANSITORY GROUPS................................................................. 18
4.3.1 The Summary Statistics................................................................................................................. 18 4.3.2 Idiosyncratic Factors for Movement into and Out of Poverty ......................................................... 22
CHAPTER 5.0: MOBILITY AND ACCESS TO FINANCIAL SERVICES AND AGRICULTURAL INPUTS.......................................................................................................................... 31
5.1 ACCESS TO AGRICULTURAL INPUTS........................................................................................................ 31 5.1.1 Coffee Market Liberalization .......................................................................................................... 31 5.1.2 Access to Inputs in Cashew Nuts Production ................................................................................ 33
5.2 ACCESS TO CREDIT ............................................................................................................................... 34 5.2.1 Access to Credit by Transition Groups .......................................................................................... 34 5.2.2 Lack of Understanding of Credit Schemes .................................................................................... 36 5.2.3 Savings and Credit Cooperative Societies .................................................................................... 37 5.2.4 Money Lending/Emergency Credit ................................................................................................ 37
_____________________________________________________________________
MOVING OUT OF POVERTY: Understanding Growth and Democracy from the Bottom Up - Regional Synthesis Report
ii
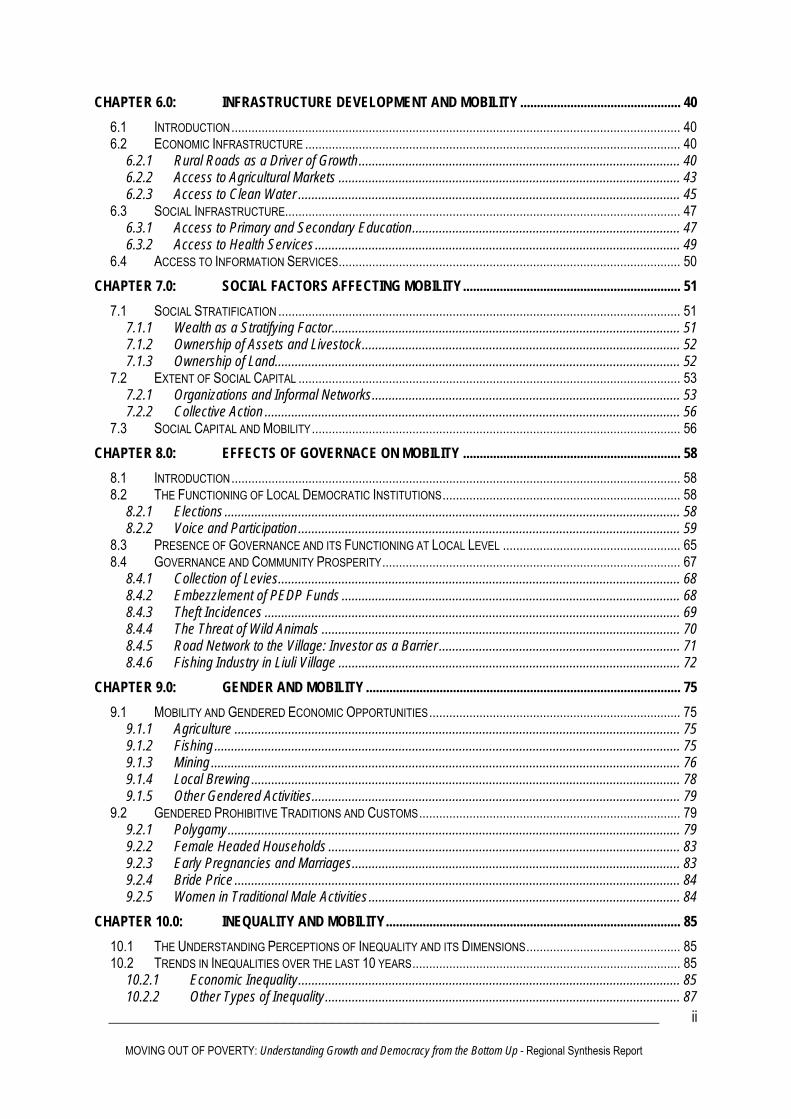
CHAPTER 6.0: INFRASTRUCTURE DEVELOPMENT AND MOBILITY ................................................ 40 6.1 INTRODUCTION...................................................................................................................................... 40 6.2 ECONOMIC INFRASTRUCTURE ................................................................................................................ 40
6.2.1 Rural Roads as a Driver of Growth................................................................................................ 40 6.2.2 Access to Agricultural Markets ...................................................................................................... 43 6.2.3 Access to Clean Water .................................................................................................................. 45
6.3 SOCIAL INFRASTRUCTURE...................................................................................................................... 47 6.3.1 Access to Primary and Secondary Education................................................................................ 47 6.3.2 Access to Health Services ............................................................................................................. 49
6.4 ACCESS TO INFORMATION SERVICES...................................................................................................... 50 CHAPTER 7.0: SOCIAL FACTORS AFFECTING MOBILITY................................................................. 51
7.1 SOCIAL STRATIFICATION ........................................................................................................................ 51 7.1.1 Wealth as a Stratifying Factor........................................................................................................ 51 7.1.2 Ownership of Assets and Livestock............................................................................................... 52 7.1.3 Ownership of Land......................................................................................................................... 52
7.2 EXTENT OF SOCIAL CAPITAL .................................................................................................................. 53 7.2.1 Organizations and Informal Networks............................................................................................ 53 7.2.2 Collective Action ............................................................................................................................ 56
7.3 SOCIAL CAPITAL AND MOBILITY.............................................................................................................. 56 CHAPTER 8.0: EFFECTS OF GOVERNACE ON MOBILITY ................................................................. 58
8.1 INTRODUCTION...................................................................................................................................... 58 8.2 THE FUNCTIONING OF LOCAL DEMOCRATIC INSTITUTIONS....................................................................... 58
8.2.1 Elections ........................................................................................................................................ 58 8.2.2 Voice and Participation .................................................................................................................. 59
8.3 PRESENCE OF GOVERNANCE AND ITS FUNCTIONING AT LOCAL LEVEL ..................................................... 65 8.4 GOVERNANCE AND COMMUNITY PROSPERITY......................................................................................... 67
8.4.1 Collection of Levies........................................................................................................................ 68 8.4.2 Embezzlement of PEDP Funds ..................................................................................................... 68 8.4.3 Theft Incidences ............................................................................................................................ 69 8.4.4 The Threat of Wild Animals ........................................................................................................... 70 8.4.5 Road Network to the Village: Investor as a Barrier ........................................................................ 71 8.4.6 Fishing Industry in Liuli Village ...................................................................................................... 72
CHAPTER 9.0: GENDER AND MOBILITY .............................................................................................. 75 9.1 MOBILITY AND GENDERED ECONOMIC OPPORTUNITIES........................................................................... 75
9.1.1 Agriculture ..................................................................................................................................... 75 9.1.2 Fishing ........................................................................................................................................... 75 9.1.3 Mining ............................................................................................................................................ 76 9.1.4 Local Brewing ................................................................................................................................ 78 9.1.5 Other Gendered Activities.............................................................................................................. 79
9.2 GENDERED PROHIBITIVE TRADITIONS AND CUSTOMS.............................................................................. 79 9.2.1 Polygamy....................................................................................................................................... 79 9.2.2 Female Headed Households ......................................................................................................... 83 9.2.3 Early Pregnancies and Marriages.................................................................................................. 83 9.2.4 Bride Price ..................................................................................................................................... 84 9.2.5 Women in Traditional Male Activities............................................................................................. 84
CHAPTER 10.0: INEQUALITY AND MOBILITY........................................................................................ 85 10.1 THE UNDERSTANDING PERCEPTIONS OF INEQUALITY AND ITS DIMENSIONS.............................................. 85 10.2 TRENDS IN INEQUALITIES OVER THE LAST 10 YEARS................................................................................ 85
10.2.1 Economic Inequality.................................................................................................................. 85 10.2.2 Other Types of Inequality.......................................................................................................... 87

_____________________________________________________________________
MOVING OUT OF POVERTY: Understanding Growth and Democracy from the Bottom Up - Regional Synthesis Report
iii
10.3 INEQUALITY AND MOBILITY..................................................................................................................... 87 CHAPTER 11.0: FREEDOM, POWER AND DEMOCRACY...................................................................... 89
11.1 UNDERSTANDING PERCEPTIONS OF FREEDOM, POWER AND DEMOCRACY............................................... 89 11.2 COMMUNITY STRATIFICATION................................................................................................................. 90 10.3 TRENDS IN FREEDOM, POWER AND DEMOCRACY.................................................................................... 90 11.4 FREEDOM, POWER AND DEMOCRACY, AND THEIR LINK WITH COMMUNITY AND HOUSEHOLD PROSPERITY . 91
CHAPTER 12.0: ASPIRATIONS OF YOUTH ............................................................................................ 93 12.1 OCCUPATIONAL ASPIRATIONS OF THE YOUTH......................................................................................... 93 12.2 GENDER DIFFERENCES WITHIN YOUTH................................................................................................... 93 12.3 CONSTRAINTS/PROBLEMS FACING YOUTH.............................................................................................. 94
CHAPTER 13.0: INTERACTION ACROSS FACTORS ............................................................................. 96 13.1 THE NATURE OF FACTORS FOR MOBILITY............................................................................................... 96 13.2 MOBILITY FACTORS ............................................................................................................................... 96 13.3 MULTIPLICITY OF FACTORS AT HOUSEHOLD LEVEL ................................................................................. 97 13.4 POLICY RELATED FACTORS AND MOBILITY ............................................................................................. 98
CHAPTER 14.0: CONCLUSIONS AND POLICY OPTIONS.................................................................... 100 14.1 THE POLICY FOCUS............................................................................................................................. 100 14.2 FACTORS FOR UPWARD AND DOWNWARD MOBILITY ............................................................................. 100 14.3 GROWTH AND POVERTY ...................................................................................................................... 101 14.4 IMPROVING LIVELIHOOD SOURCES ....................................................................................................... 102
14.4.1 Access to Markets................................................................................................................... 102 14.4.2 Access to Agricultural Inputs................................................................................................... 103 14.4.3 Promotion of the Cross Boarder Trade ................................................................................... 103 14.4.4 Access to Education and Entrepreneurial Skills...................................................................... 104 14.4.5 Access to Health Services ...................................................................................................... 104 14.4.6 Access to Water...................................................................................................................... 105 14.4.7 Programs for Vulnerable Groups ............................................................................................ 105 14.4.8 Youth and Development ......................................................................................................... 105 14.4.9 HIV/AIDS ................................................................................................................................ 106
14.5 GOOD GOVERNANCE........................................................................................................................... 106 14.5.1 Business Levies ...................................................................................................................... 107 14.5.2 Combating Wild Animals Threats............................................................................................ 107 14.5.3 Theft........................................................................................................................................ 108 14.5.4 Mining Activities ...................................................................................................................... 108 14.5.6 Fishing Industry....................................................................................................................... 108 14.5.7 Responsiveness to the Voices of the Poor ............................................................................. 109
REFERENCES ..................................................................................................................................... 110

_____________________________________________________________________
MOVING OUT OF POVERTY: Understanding Growth and Democracy from the Bottom Up - Regional Synthesis Report
iv
LIST OF TABLES
Table 2.1: Income Indicators, Baseline and Targets ....................................................................... 5 Table 2.2: Regional Per Capita Income in Tanzania (1997 and 2001)............................................ 6 Table 2.3: Non Income Indicators based on 2000/01 Household Budget Survey ........................... 7 Table 2.4: Summary of Regional Performance by Single PRSP Indicators .................................... 8 Table 2.5: Human Development Index by Region .......................................................................... 9 Table 2.6: Human Poverty Index by Region ................................................................................. 10 Table 3.1: Growth Variables in Individual Districts in Ruvuma...................................................... 12 Table 3.2: Stage 2 Sampling......................................................................................................... 13 Table 3.3: Summary of Fieldwork Activities .................................................................................. 14 Table 4.1: Major Crops Grown in the Study Area ......................................................................... 16 Table 4.2: Community Wide Factors for Upward and Downward Mobility .................................... 17 Table 4.3: Household’s Status of Movement on the Ladder of Life (Female Ladder of Life)......... 18 Table 4.4: Measuring Prosperity: Average of Selected Indices..................................................... 20 Table 4.5: Measuring Prosperity: Community Indices (Shifting Index).......................................... 20 Table 4.6: Measuring Prosperity: Community Indices (Fixed Index) ............................................. 21 Table 4.7: Household-level Correlates of Poverty Status, Now and 10 Years Ago....................... 25 Table 6.1: Tanzania Road Network Condition .............................................................................. 41 Table 6.2: Infrastructure Development over the Decade............................................................... 48 Table 8.1: Change Over the Study Period: Voice and Participation.............................................. 62 Table 8.2: Political Parties and Associations ................................................................................ 62 Table 8.3: Important Associations in the Surveyed Communities ................................................. 63 Table 8.4: Freedom of Speech, Media and Group (Association) Formation ................................. 64 Table 8.5: Change in the Functioning of Governance................................................................... 67 Table 9.1: Prevalence of HIV Infection among Blood Donors by District, Ruvuma Region........... 77 Table 9.2: Knowledge of and Ways to Avoid HIV/AIDS ................................................................ 78 Table 12.1: Obstacles for Working in Chosen Occupations............................................................ 94

_____________________________________________________________________
MOVING OUT OF POVERTY: Understanding Growth and Democracy from the Bottom Up - Regional Synthesis Report
v
LIST OF FIGURES Figure 4.1: Mean Transition Groups .............................................................................................. 18 Figure 4.2: Rich versus Poor Prosperity......................................................................................... 21 Figure 5.1: Percentage of Villagers who Received Credit .............................................................. 34 Figure 6.1: Distance from Nearest City versus MOP Index............................................................ 43 Figure 9.1: Polygamous Households versus Net Prosperity Index ................................................ 81 Figure 13.1: Example of Interactions and Sequencing of Factors.................................................... 99
_____________________________________________________________________
MOVING OUT OF POVERTY: Understanding Growth and Democracy from the Bottom Up - Regional Synthesis Report
vi
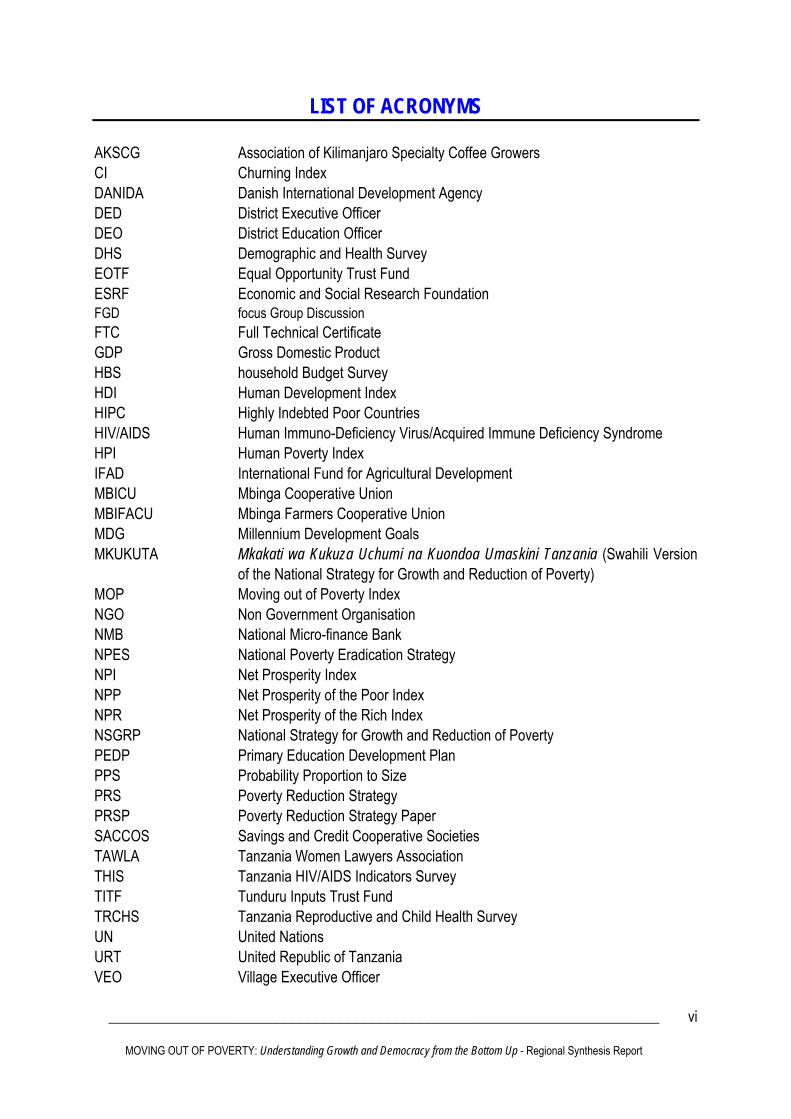
LIST OF ACRONYMS AKSCG Association of Kilimanjaro Specialty Coffee Growers CI Churning Index DANIDA Danish International Development Agency DED District Executive Officer DEO District Education Officer DHS Demographic and Health Survey EOTF Equal Opportunity Trust Fund ESRF Economic and Social Research Foundation FGD focus Group Discussion FTC Full Technical Certificate GDP Gross Domestic Product HBS household Budget Survey HDI Human Development Index HIPC Highly Indebted Poor Countries HIV/AIDS Human Immuno-Deficiency Virus/Acquired Immune Deficiency Syndrome HPI Human Poverty Index IFAD International Fund for Agricultural Development MBICU Mbinga Cooperative Union MBIFACU Mbinga Farmers Cooperative Union MDG Millennium Development Goals MKUKUTA Mkakati wa Kukuza Uchumi na Kuondoa Umaskini Tanzania (Swahili Version
of the National Strategy for Growth and Reduction of Poverty) MOP Moving out of Poverty Index NGO Non Government Organisation NMB National Micro-finance Bank NPES National Poverty Eradication Strategy NPI Net Prosperity Index NPP Net Prosperity of the Poor Index NPR Net Prosperity of the Rich Index NSGRP National Strategy for Growth and Reduction of Poverty PEDP Primary Education Development Plan PPS Probability Proportion to Size PRS Poverty Reduction Strategy PRSP Poverty Reduction Strategy Paper SACCOS Savings and Credit Cooperative Societies TAWLA Tanzania Women Lawyers Association THIS Tanzania HIV/AIDS Indicators Survey TITF Tunduru Inputs Trust Fund TRCHS Tanzania Reproductive and Child Health Survey UN United Nations URT United Republic of Tanzania VEO Village Executive Officer

_____________________________________________________________________
MOVING OUT OF POVERTY: Understanding Growth and Democracy from the Bottom Up - Regional Synthesis Report
vii
EXECUTIVE SUMMARY Tanzania’s poverty reduction efforts date as far back as the early years of the country’s independence. These efforts were however faced with considerable hurdles in 1970s that arose from domestic and external shocks, policy weaknesses, and policy implementation problems so that the government could not sustain them. The ensuing economic crisis in the second half of 1970s to early 1980s necessitated that the government adopt reform measures to bring the economy back on track. Early efforts to reform and revamp the economy were however preoccupied with achieving macroeconomic stability (low and stable inflation, a sustainable fiscal and current account balance, building foreign reserve position of the country, achieving a high GDP growth rate) as the necessary condition for growth, but little attention was directed to poverty reduction. A decade into the reforms, international evidence revealed that growth while necessary is nevertheless not sufficient for poverty reduction. Many countries undertaking reforms, including Tanzania, managed to achieve macroeconomic stability yet livelihoods of majority of their people and quality of their lives remained dismal. Apparent mismatch remained between macroeconomic achievements at the aggregate level and progress at the micro level. This mismatch led to growing advocacy in favor of “pro-poor growth”—the realization that quality of growth particularly in terms of distribution effects matter perhaps as much as the quantity does. Yet while pro poor growth has become an alluring policy objective, its achievement has remained a challenge for many countries partly due to limited understanding and lack of a common consensus about how to achieve it. Individually and collectively through international commitments countries continue to grapple with pro-poor growth and pro-poor policies. Tanzania renewed its attention to poverty reduction with support from the donor community in 1990s vowing to implement pro-poor growth and social policies. This went hand in hand with development of various policies and strategies, to guide the country towards achievement of a society with better and sustainable livelihoods, including the National Poverty Eradication Strategy, Tanzania Vision 2025, Poverty Reduction Strategies (I and II) and other sectoral development strategies. At international level, the international community also renewed its commitment towards poverty reduction as exemplified in various declarations including the Millennium Development Goals and Highly Indebted Poor Countries debt relief initiative. Over time poverty maps and studies based on household budget surveys have helped identify sources of growth and cluster of factors most often associated with growth that benefits the poor. Nonetheless, these studies have tended to involve considerable measurement errors. Furthermore, they neither examine interaction among variables, nor do they usually include social, institutional or political factors in their analyses. This study on Moving Out of Poverty, understanding growth and democracy from bottom up was undertaken in recognition of this caveat. Its objective was to solicit data and information on factors for mobility into and out of poverty of different households and individuals and through enhancing their understanding contribute towards informed policy design and monitoring of poverty reduction strategies and policies in Tanzania starting from the bottom up. The study intended to do this

_____________________________________________________________________
MOVING OUT OF POVERTY: Understanding Growth and Democracy from the Bottom Up - Regional Synthesis Report
viii
by providing policy insights from experiences of those who have moved out of poverty and stayed out of it over time, those who have maintained their wealth over time, and those who have fallen down and/or stayed trapped in chronic poverty. In order to achieve its objective the study explored a wide range of social, political, institutions, and economic mechanism that impact on poor people’s access to economic opportunities and thus their movement into and out of poverty. The study also provides insights on how freedom, power and aspirations contribute in building assets and/or wealth creation. Three hypotheses were tested under this study:
Ruvuma Region, being marginalized relative to other regions in Tanzania has not experienced
the desired growth given its agricultural and other economic potentials; Poor access to agricultural markets is another major impendent to poverty reduction in the
study area; and Poor governance is one of the major impediments to poverty reduction.
Ruvuma region in southern highlands was chosen as a case study area for this exercise, given its location relative to major trading centers in the country and nature of livelihood opportunities available in the region given its proximity to the neighboring countries that are also Tanzania’s trade partners. A three stage sampling exercise was done to determine key informants for the study. In the first stage, districts were chosen based on indicators of their performance relative to each other. In the second stage, Probability Proportion to Size sampling methodology was used to select communities to be studied from selected districts, while in the third stage a random sampling of households to be interviewed was made. The study revealed that while the primary economic activity in the study area is agricultural production, there are also a number of other sources of income including animal husbandry, fishing, mining, trade, transportation businesses, lumbering, masonry, and cross boarder trade. Wage labor for activities requiring limited skills for example, faming and operating of milling machine or coffee pulping machine is also practiced. Every household was found to own land and produced a large portion of its food requirements particularly rice, maize, cassava, and beans. For most people in the area investment in agriculture was also mentioned to be the major pillar for movement out of poverty, enabling them to accumulate assets and build houses using income acquired from selling agricultural produce, notably coffee and cashewnuts. Fishing, mostly practiced in the villages along the shores of Lake Nyasa was found to be the major non-agricultural income generating activity and the major protein source for villages along the shore. An examination of economic factors underpinning movement of individuals into and out of poverty revealed existence of two broad categories of factors: community wide factors and idiosyncratic factors. With respect to community wide factors, respondents identified events that have had positive effects on the economy or prosperity of the communities to include: availability of markets for agricultural produce,

_____________________________________________________________________
MOVING OUT OF POVERTY: Understanding Growth and Democracy from the Bottom Up - Regional Synthesis Report
ix
presence of health facilities, availability of water services, presence of transport infrastructure facilities, and presence of crop marketing unions and access to farm inputs and credit at affordable costs. On the other hand factors that have negatively affected their prosperity were identified to include lack of agricultural inputs, collapse of cooperative unions, influx of middlemen, crop diseases and attacks from vermin, attack from wild animals, insecurity and banning of beach net fishing by the government for environmental reasons that compromised livelihoods of individuals living along the lake shores and who were dependent on fishing for income. In the case of idiosyncratic factors, improved livelihoods and prosperity was associated with things such as hard work, access to opportunities for income diversification by households and entrepreneurial savvy of the same, as well as ability of households to adjust quickly from adverse economic and social shocks. Stagnation and movements deeper into poverty on the other hand was associated with insecurity (burglaries and organized thefts and violence), failure of investment ventures due to risks inherent in some of them, HIV/AIDS, and payment of bride price. In some of the cases it was also found that multiple factors, both community-wide and idiosyncratic contributed in either pushing people deeper into poverty, or facilitating their exit. Initial endowments are also found to be a very important factor in ability of individuals to move out of poverty. Extremely poor category of people and people with disability who also happen to fall in the extremely poor category find it very difficult to move up partly because of lack of productive resources making it difficult for them to engage effectively in productive activities. Disabled people find it even more difficult as there are no formal arrangements to help them out. For them therefore social capital (existence informal social networks, and self help groups including family ties) makes a great difference, as through them they are able to overcome economic hurdles and move out of poverty. For example through such arrangements they are able to obtain credits on softer terms, deal collectively with emergencies and undertake economic activities example farming collectively. Based on poverty lines derived by community members during focus group discussions, the study also attempted to gauge the nature of movement out or into poverty across four transition groups. These transitory groups were comprised of: households which have moved out of poverty (upward movers); those who have fallen into poverty (downward movers/fallers); those who have remained chronically poor over the period under study (chronic poor); and those that have remained chronically rich. The findings reveal that on aggregate only about 17 percent of households in the surveyed area moved out of poverty, while more than 50 percent of households remained poor in the ten-year period preceding the study. With respect to those that fell into poverty the study finds that these are about 7 percent of households in the surveyed community while those that remained rich over the period were 10 percent. In an attempt to compare what happened in different mobility matrices, simple summary statistics that allow for comparison of findings from the Mobility Matrices across communities were also calculated. These summary statistics are:
_____________________________________________________________________
MOVING OUT OF POVERTY: Understanding Growth and Democracy from the Bottom Up - Regional Synthesis Report
x
The Net Prosperity Index that measured overall improvement in the households on the ladder of life. A positive NPI indicates that there is general improvement in well-being while a negative NPI signifies decline in well-being;
Net Prosperity of the Poor Index (NPP), that gauges whether there has been a net
increase/decline in wealth in the community, here also a positive value indicates an improvement while a negative value indicate a net decline in wealth;
Net Prosperity of the Rich Index (NPR), which assesses how prosperity of the rich has evolved
over time, that is, whether they have experienced a net gain or loss in wealth; Moving out of Poverty Index (MOP), which assesses what happens to the poor, whether they
have been able to move or have remained poor overtime; and The Churning Index (CI), that gauges existent of movements up and down the ladder of life over
a given time period.
These summary statistics revealed the following about general movement of households in and out of poverty in Ruvuma Region in the last ten years: The NPI is positive which indicates that there has been net gain in wealth among the people of Ruvuma Region in the last ten years. With respect to developments in individual wards, the NPI also shows that only one ward among the 8 surveyed experienced a net loss in wealth. The Net Prosperity of the Poor Index is also positive revealing that in general the poor have been gaining ground over the year. A certain amount of redistribution also seems to be taking place as exemplified by the signs of the Net Prosperity of the Poor and Net Prosperity of the Rich Indices. While the NPP is positive, the NPR is negative which implies that while the initially poor have experienced improvement up the ladder of life, those that were initially rich have lost some ground in their well-being. Based on the Moving out of Poverty Index the study reveals further that about one fifth of the poor were able to climb the ladder of life and move out of poverty. The Churning Index shows that on the aggregate about 70 percent of the population has moved up or down by at least one step in the last 10 years. The democracy-poverty nexus was not clearly established using the findings from the studied communities. However, a common perception among respondents is that exercise of democracy has improved in the last ten years. Nonetheless they insisted that there is still a need to enhance voter education to ensure voters are not taken advantage of or coerced into making inappropriate choices by influential groups who have individual motives in election campaigns. In the case of governance however, it is noted that problems including lack of accountability, ineffectiveness in service delivery, breakdown in enforcement of law and order, and corruption continue to plague administrative divisions at village and ward levels as well as at district levels. In many cases the government administrative machinery has failed in responding to the voices of the people, and malpractices are also cited. Poor governance has meant that individuals are unable to obtain the required assistance from relevant

_____________________________________________________________________
MOVING OUT OF POVERTY: Understanding Growth and Democracy from the Bottom Up - Regional Synthesis Report
xi
authorities when they need it and further more there is administrative red tape and other hassles that individuals are forced to deal with. These in turn discourage fast progress of individuals out of poverty and also impinge on potential for progressing further for those that are out of poverty. A look at perceptions about nature of inequality in the study area and whether there have been redistribution effects revealed that, in terms of nature, inequality is perceived to be mainly of economic dimension. Things like income levels (also exemplified by lifestyles), accumulated wealth and assets stand out as major things people are looking at. Other major dimension of inequality which were mentioned by local communities include participation in decision making in the communities, membership to community organizations and political parties, and gender inequality. With respect to perception about incidence of inequality, while indices from mobility matrices revealed existence of some redistribution in favor of the poor, the majority’s perception arising from the Focus Group Discussions was that economic inequality had remained more or less the same over the last ten years. About 37.5 percent of the respondents also expressed concern that the gap between the poorest households and the richest had stayed about the same. Respondents however perceived that opportunities have increased in the communities over the years, yet despite the increase in opportunities the poor still face economic obstacles that limit their access to them. Such obstacles include: lack of capital for expansion of productive activities; difficulty in accessing credit at affordable terms; lack of access to markets, which resulted into the decline/fall in agricultural production; and lack of agro-inputs. Gender relations in the Ruvuma region, similar to the majority of the rural developing world, are unequal with men having more freedom, power and self-determination than women. Men also control the finances and investment decisions in the vast majority of households. There have in the past ten years, however, been advances in some communities in access of women to income generating activities, in particular local brewing and participation in leadership. The largest issue for the majority of women, however, is polygamy. Many women believe that it is a significant contributor to the downward mobility of a household, as resources are stretched over a larger number of wives and children, although some believe that polygamy results to a larger number of working adults in the household and this is a source of upward mobility. Yet, others believe that the household friction resulting from multiple wives is a reason for downward mobility. Youth are viewed as the next generation of leaders and so require appropriate support and incentives for exit out of poverty. From the FGDs, youth in the communities revealed a strong will to get out of poverty. In achieving their goals, they mentioned several key activities, which they intend to pursue which included agriculture and livestock husbandry, petty and small trades of various kinds. They however also noted that they persistently face a number of obstacles in realizing their objectives, particularly in participating effectively in non-farm activities such as trade. These are low levels of education, lack of business skills, and lack of capital. Some had plans of attending vocational training schools to enable them acquire required skills to employ themselves in the non-agricultural sector but still expressed lack of finances as one of the limitations they face in pursuing this objective. In the

_____________________________________________________________________
MOVING OUT OF POVERTY: Understanding Growth and Democracy from the Bottom Up - Regional Synthesis Report
xii
discussions therefore, the youth called for support from the government in areas such as initiation of projects that would assist them take up the challenges they face and achieve their goals in life for instance: establishment of non-formal education projects for out-of-school youth; income generating projects that allow individuals and groups to build on the training received, with supervision through youth group activities; rural services that include youth as beneficiaries, for example credit services; and organized community development programs that challenge them to take active part in implementation for instance reforestation, community development programs. The report concludes that in general there is notable evidence that economic conditions have improved in the surveyed area, and of correlation between growth and grassroots changes in welfare and overall living standards. There is also a nexus between poverty and governance on the one hand, and access to opportunities and therefore ability of individuals to move out of poverty and stay out. To facilitate mobility of individuals out of poverty it is recommended that concerted efforts be undertaken in facilitating access to markets, agricultural Inputs and other forms of support to the sector and access to education and entrepreneurial skills. Furthermore, improvement in health services, access to water, and establishment of programs for the poor and for youth development are also called for. With respect to governance, improvement in response to grievances of the people, accountability in the government machinery, and enforcement of rule of law are called for. It should be borne in mind that, the final analysis of the study and therefore the findings should not be considered to represent Ruvuma Region as a whole. However, the empirical evidence from this study shed some light of the regional as well as communities’ social, economic and political development in the communities participated in the study.

_____________________________________________________________________
MOVING OUT OF POVERTY: Understanding Growth and Democracy from the Bottom Up - Regional Synthesis Report
1
CHAPTER 1.0: INTRODUCTION 1.1 Background to the Study Since independence in 1961, the Government of Tanzania has been preoccupied with combating poverty. National efforts to tackle the problem were initially channeled through centrally directed medium-term and long-term development plans and resulted in a significant improvement in per capita income and access to education, health and other social services until the 1970s. Thereafter, these gains could not be sustained because of various domestic and external shocks and policy weaknesses. After a decade of preoccupation with re-establishing macro-economic stability and structural reforms aimed at creating an enabling environment that started in mid 1980s, Tanzania resumed its focus on poverty reduction. This renewal is part of global effort for a sustainable exit from the poverty trap. The Government undertook various initiatives towards poverty reduction and attainment of social and economic development. Those efforts are founded within a broad policy framework, the Vision 2025, which established the vision, mission, goals and targets to be achieved with respect to economic growth and poverty eradication by the year 2025. As an effort to operationalize Vision 2025, the Government formulated the National Poverty Eradication Strategy (NPES), which provides overall guidance to all stakeholders and provides a framework for co-ordination and supervision of the implementation of policies and strategies of poverty eradication. The Poverty Reduction Strategy Paper (PRSP) was thereafter formulated as a Medium-Term Strategy for poverty reduction, in the context of the enhanced Highly Indebted Poor Countries (HIPC) initiative. Initially, the country implemented PRS I that covered five priority sectors namely Agriculture, Health Education, Water, and Rural Roads and lasted for three years (2001 – 2003). Thereafter, the Government approved the PRS II known as the National Strategy for Growth and Reduction of Poverty (NSGRP), popularly known by its Kiswahili acronym as MKUKUTA (Mkakati wa Kukuza Uchumi na Kuondoa Umaskini Tanzania) in early 2005. The NSGRP keeps in focus the aspirations of Tanzania’s Development Vision (Vision 2025) for high and shared growth, high quality livelihood, peace, stability and unity, good governance, high quality education and international competitiveness. It is committed to the Millennium Development Goals (MDGs), as internationally agreed targets for reducing poverty, hunger, diseases, illiteracy, environmental degradation and discrimination against women by 2015 (URT, 2005a). These are addressed in the three clusters spelt out in the MKUKUTA: Cluster 1: Growth and Income Poverty Reduction Cluster 2: Improvement of Quality of Life and Social Wellbeing Cluster 3: Governance and Accountability
_____________________________________________________________________
MOVING OUT OF POVERTY: Understanding Growth and Democracy from the Bottom Up - Regional Synthesis Report
2
The NSGRP is expected to last 5 years, (i.e. from 2005/06 to 2009/10). The end point of the strategy coincides with the NPES’s 2010 poverty reduction targets; it is two thirds of the way towards the MDGs (2015) and 15 years to 2025 targets of Vision 2025. There is a broad agreement that growth that benefits the poor is critical for poverty reduction. But there is little agreement on how to achieve it. Most of our knowledge is partial, based on household surveys that focus primarily on household economic and demographic characteristics, rather than on the social, political and institutional conditions that operate at the community and national levels and also shape access to opportunities. A review of the economic literature based on household surveys confirms that the cluster of factors most often associated with growth that benefits the poor are: household endowments; geography; economy-wide factors including macroeconomic stability and trade policies; and initial levels of inequality in assets (for example land), education and literacy. Studies using panel data and poverty maps over time have contributed further to understanding of sources of growth and the role of inequality and initial conditions. However, researchers state over and over again that measurement error is likely to be high in these studies. Furthermore, these studies do not examine interaction among variables, nor do they usually include social, institutional or political factors. It is within this context that the Economic and Social Research Foundation (ESRF) conducted a study on moving out of poverty, understanding growth and democracy from bottom up, which aimed at soliciting data and information on factors for upward and downward mobility of different households and individuals. The study has strong relevance for policy design and monitoring of poverty reduction strategies and policies in Tanzania because starting from the bottom up, it provides policy insights based on the experiences of those who have actually moved out of poverty and stayed out of it over time, those who have maintained their wealth over time, and those who have fallen down and/or stayed trapped in chronic poverty. The study explored a wide range of social, political, institutions, and economic mechanism that hinder or facilitate poor people’s access to economic opportunity and movement out of poverty. The study further provides insights on how freedom, power and aspirations contribute to building assets or wealth creation. Ruvuma region was chosen as a case study. This choice was based on the following reasons: Firstly, the region is one of the remotest regions in the country. It is located in the Southern Periphery (about 1000 km from Dar es Salaam - the biggest market in the country and a major port to international markets). This distance has made economic and market integration too complicated for most of the communities in the region. Secondly, the road network in Ruvuma region is not only poorly developed to allow access to outside markets but also inadequate to cater for the existing requirements of the internal market. Thirdly, the region borders Malawi, Mozambique and Lake Nyasa (or Lake Malawi). Thus potentials for livelihood diversification are very high (non-farming activities such as fishing and cross boarder trade).

_____________________________________________________________________
MOVING OUT OF POVERTY: Understanding Growth and Democracy from the Bottom Up - Regional Synthesis Report
3
1.2 The Key Policy Issues Addressed The study focused on three major policy issues namely, economic growth, access to markets, and governance. Thus, the study aimed at informing policy on trends in growth in the study area, access to markets, and the role of good governance in moving people out of poverty and impending governance issues and constraints. 1.2.1 Economic Growth and Poverty The country’s economic performance has been satisfactory following implementation of the ongoing economic reforms. The improving economic performance is reflected in a number of macroeconomic indicators such as the inflation rate, GDP growth rate, per capita growth rate and other fiscal indicators. However, one of the disquieting trends has been the widespread mismatch between the achievements at macro level and the resulting impacts at the local community level: very little, if any, has been trickling down to the grassroots. This has been a national policy concern. Thus, Economic Growth and Reduction of Income Poverty has become one of the major components of the Tanzanians second generation PRSP, renamed the National Strategy for Growth and Reduction of Poverty. The major hypothesis under growth was that Ruvuma Region being marginalized relative to other regions in Tanzania has not experienced the desired growth given it agricultural and other economic potentials. 1.2.2 Local Governance Performance
In simple terms, “governance” means the process of decisions making and the process by which decisions are implemented (or not implemented). Governance can be used in several contexts such as corporate governance, international governance, national governance, and local governance. At the local level, it involves actors such as village government, ward, and district councils, and the civil society organizations. Bad governance is being increasingly regarded as one of the root causes of poor social, economic and political development. For instance, government sometimes acts as obstacle to growth either through “sins of omission” for example if services are not delivered or “sins of commission” when the government interferes where it should not. Major donors and international financial institutions are increasingly basing their aid and loans on the condition that “good governance” is guaranteed. The motto for the third phase government that was in power from 1995 to 2005 and the 4th phase government have been promotion of “good governance.” Cluster III of MKUKUTA reiterates the same priority. Thus, one of the policy focuses for this study is performance of the local council. This performance is distinguished as either “poor” or “good” local governance performance (District, Ward, and Village Councils). Indicators for measuring the quality of governance include; Participation, Rule of Law, Transparency, Responsiveness, Consensus orientation, Equity and inclusiveness, Effectiveness and efficiency, and Accountability. The major assumption here is that poor governance is one of the major impediments to poverty reduction.

_____________________________________________________________________
MOVING OUT OF POVERTY: Understanding Growth and Democracy from the Bottom Up - Regional Synthesis Report
4
1.2.3 Access to Markets As mentioned earlier, the road network in Ruvuma region is not only poorly developed as a connection to the outside world, but also inadequate to cater for the existing requirements of the internal market. For the smallholder producers, the main means of transport are head loading and bicycles. Ox-carts and donkeys are not commonly utilized. There is very little use of motorized transport. The motorized road transport is expensive and railways and waterways are not used a great deal because they are under-developed. Unless the situation of rural road network is considerably improved, farmers will continue facing serious bottlenecks in transporting their produce to the external markets, and getting farm inputs and other farm supplies necessary for increasing agricultural productivity. Likewise, traders and other commodity dealers will continue to find it difficult to access local markets if the infrastructure is not in place and if it is not usable all the year round. The major hypothesis is that poor access to agricultural markets is another major impendent to poverty reduction in the study area.

_____________________________________________________________________
MOVING OUT OF POVERTY: Understanding Growth and Democracy from the Bottom Up - Regional Synthesis Report
5
CHAPTER 2.0: GROWTH AND POVERTY REDUCTION: EVIDENCE FROM NATIONAL AND REGIONAL STATISTICS
2.1 National Trends in Growth Tanzania experienced weak economic growth in the early 1990s when the GDP growth rate was lower than that of the population. Since the mid 1990s, however, the country has experienced a higher growth rates, increasing from the average of 4.0 percent in the period 1995-1999 to 5.8 percent in the period 2000-2004. In 2004 the growth rate was 6.7 percent compared to 5.7 percent in 2003. This exceeded the targeted level of an annual increase of 6 percent (URT, 2005b). However, as mentioned earlier, the major challenge facing the country is how to sustain this growth rate and at the same time ensure that the benefits of growth are broadly shared. Furthermore, after taking account of the population growth rate, per capita economic growth rates are very modest and therefore not yet sufficient to generate significant poverty reduction. Table 2.1 shows the income poverty indicators, baseline, and targets.
Table 2.1: Income Indicators, Baseline and Targets
Baseline Trends Targets Indicator Estimate Year 2001 2002 2003 2004 PRS 2003 MKUKUTA
2010 % of the population below the basic needs poverty line
36 2000-01 30 19
% of the population below the food poverty line
19 2000-01 15 10
GDP Growth rate (%) 4.9 2000 5.7 6.2 5.7 6.7 6 6-8
Agricultural growth rate (%) 3.4 2000 5.5 5.0 4.0 6.0 5 10
Inflation rate (%) 5.9 2000 5.2 4.5 3.5 4.1 4 4
% of working age population not currently employed
13 2000-01 7
Source: URT (2005b). The observed increase in growth rate was mainly attributed to increase in growth of the agriculture sector; trade, hotels and restaurants (including tourism); and transport and communication. The growth rate for manufacturing and construction sectors remained the same as in 2003. Also, the growth rates of the financial and business services sector; and public administration and other services, increased slightly. The growth rate of mining and quarrying and water and electricity sectors however declined (URT, 2005c).

_____________________________________________________________________
MOVING OUT OF POVERTY: Understanding Growth and Democracy from the Bottom Up - Regional Synthesis Report
6
The agriculture sector grew by 6.0 percent in 2004 compared to 4.0 percent in 2003. The increase in growth rate was due to increase in production of crop the sub-sector by 6.2 percent and fishing sub-sector by 6.9 percent in 2004 compared to 3.6 and 6.4 percent in 2003, respectively. The growth rate of forestry and hunting sub-sector declined from 4.2 percent in 2003 to 4.0 percent in 2004. Livestock sub-sector maintained the same growth rate of 5 percent as in 2003. Despite an increase in the growth rate of agriculture, its contribution to GDP declined slightly from 46.7 percent in 2003 to 46.4 percent in 2004 (URT, 2005c). 2.2 Regional Status of Poverty using Growth and Non-Income indicators Judging from the growth in related indicators, the Ruvuma regional economy has been recording positive growth rate overtime, but has not matched the national average. Table 2.2 shows the regional per capita income in Tanzania for 1997 and 2001. The region’s per capita income has grown by 17 percent in real terms between 1997 and 2001 from TZS 157,749 to TZS 930,0101. However, in relation to other regions Ruvuma ranks 10th from the bottom. In terms of position, the region was ranking better in 1997 (at 16th position from the bottom) than it was in 2001, as all but four other regions grew more quickly in the intervening period.
Table 2.2: Regional Per Capita Income in Tanzania (1997 and 2001)
Sn Region Per Capita Income in TZS (1997)
Rank2 (1997)
Per Capita Income in TZS (2001)
Rank (2001)
Real Growth (%)
1 Kagera 95,623 1 860,288 6 21 2 Kigoma 98,961 2 814,044 4 19 3 Singida 133,565 13 591,180 2 8 4 Dodoma 100,763 3 968,035 11 24 5 Kilimanjaro 101,457 4 926,323 9 22 6 Tanga 112,777 5 820,512 5 18 7 Mara 118,591 6 971,447 12 22 8 Coast 124,188 7 1,070,748 16 25 9 Morogoro 125,739 8 1,060,186 14 25 10 Mtwara 126,873 9 1,060,291 15 25 11 Lindi 126,949 10 761,342 3 14 12 Mbeya 129,449 11 872,474 7 18 13 Tabora 130,943 12 1,002,002 13 22 14 Mwanza 134,335 14 1,306,910 17 32 15 Shinyanga 148,404 15 1,362,298 19 33 16 Ruvuma 157,749 16 930,010 10 17 17 Iringa 157,895 17 897,952 8 16 18 Arusha 161,802 18 1,309,906 18 30 19 Rukwa 192,642 19 555,466 1 2 20 Dar 371,811 20 2,103,577 20 38 Source: URT (1999) and URT (2002a)
1 The exchange rate was $ 1=TZS 1080 at the time of survey and $ 1=TZS 1300 on September 2006. 2 Rank 1 depicts the most deprived region while rank 20 depicts the least deprived one.

_____________________________________________________________________
MOVING OUT OF POVERTY: Understanding Growth and Democracy from the Bottom Up - Regional Synthesis Report
7
Assessment using non-income poverty indicators reveals a mixed picture as Ruvuma is relatively performing better than most other regions on some of these dimensions while faring worse in others. Ruvuma, for example, has more individuals who are below the food poverty line (27 percent of the total regional population) compared to Dar es Salaam (18 percent), Arusha (25 percent), and Rukwa (19 percent) regions. However, in terms of percentage of households located within 1 kilometers of drinking water during the dry season Ruvuma appears to be the best among the 6 regions (Table 2.3)3.
Table 2.3: Non Income Indicators based on 2000/01 Household Budget Survey
Indicator Ruvuma Singida DSM Rukwa Arusha Lindi % of Adults Without Education 15 27 8 30 20 44 % of Household using Piped or Protected Source of Drinking Water 53 61 94 55 59 24
% of Households Within 1 km of Drinking Water in the Dry Season 90 51 84 63 49 47
Mean distance to secondary school 9.2 9.5 2.5 21.3 6.4 25.1 % of Households Within 6 km of Dispensary and/or Health Center 85 82 98 82 73 68
% of Individuals below the Food Poverty Line 27 27 8 19 25 33
% of Individuals below the Basic Needs Poverty Line4 41 55 18 31 39 53
Source URT (2002a); DSM=Dar es Salaam 2.3 Regional Status of Poverty 2.3.1 Poverty Status using Single PRSP Indicators The single indicator approach is based on the PRSP, which defined poverty as a function of income and non-income human development attributes. Using this definition poverty is measured and monitored through indicators grouped in 7 clusters which are: Income Poverty; Human Capabilities; Survival; Social well being; Nutrition; Extreme Vulnerability; and Conducive development environment. A total of 28 indicators have been included in the analysis. Examples include; Basic needs poverty headcount; Food poverty headcount; Primary school enrollment; Population with access to safe water etc. Regional poverty status using single PRSP indicators reveals that 4 regions (Kilimanjaro, Dar es Salaam, Tabora and Mbeya) are the best performers. The 4 best performers are followed by 12 regions that are categorized under Moderately Performing Regions and last category with 4 regions under Poor Performing Regions. Ruvuma region is in the Moderately Performing Regions category (Table 2.4).
3 There is no basis for selecting these regions. They only represent the high performing and low performing regions in
comparison to Ruvuma performance. 4 District figures: Tunduru (38.7 percent); Songea Rural (40.8 percent); Mbinga (28.0 percent); Songea Urban (31.6
percent); Namtumbo (54.8 percent) [URT, 2005b).

_____________________________________________________________________
MOVING OUT OF POVERTY: Understanding Growth and Democracy from the Bottom Up - Regional Synthesis Report
8
Table 2.4: Summary of Regional Performance by Single PRSP Indicators
Region Best Worst Balance Status of Performance
Kilimanjaro 22 2 20 Best Dar es Salaam 15 4 11 Best Tabora 14 6 8 Best Mbeya 10 3 7 Best Ruvuma 10 5 5 Moderate Iringa 12 9 3 Moderate Arusha 6 4 2 Moderate Tanga 7 5 2 Moderate Morogoro 6 5 1 Moderate Mtwara 4 5 -1 Moderate Singida 7 8 -1 Moderate Kigoma 5 6 -1 Moderate Mwanza 6 8 -2 Moderate Mara 7 10 -3 Moderate Dodoma 2 5 -3 Moderate Shinyanga 6 9 -3 Moderate Kagera 5 10 -5 Poor Lindi 5 12 -7 Poor Rukwa 3 10 -7 Poor Pwani 1 9 -8 Poor
Source: URT (2002b). 2.3.2 Human Development Index Another measure of poverty is the Human Development Index (HDI), which is a summary measure of human development. The HDI measures the average achievements in three basic dimensions of Human Development, in this case by region:
• A long and health life, measured by life expectancy at birth5.
• Knowledge, measured by adult literacy rate (with two thirds weight) and the combined primary, secondary and tertiary gross national enrollment (with one third weight). And,
• A decent standard of living, as measured by GDP per capita.
Using HDI, the findings are slightly different, as 5 regions appear to record Human Development Indices that are higher than Ruvuma’s (Table 2.5). These are Dar es Salaam, Kilimanjaro, Arusha, Mbeya and Iringa. Ten regions with Medium Human Development Index follow, and lastly there are 5 regions with Low Human Development Index. Ruvuma scored best out of those regions categorized as moderate performers with a score of 5, as opposed to the 0.495 average HDI for Tanzania mainland.
5 For life expectancy the latest data available is from the 1988 census. It is believed that regional differences in life
expectancy have changed since particularly because of the uneven spread of HIV/AIDS.
_____________________________________________________________________
MOVING OUT OF POVERTY: Understanding Growth and Democracy from the Bottom Up - Regional Synthesis Report
9
Table 2.5: Human Development Index by Region
HDI Rank Region HDI Value Status of Performance
1 Dar es Salaam 0.746 High 2 Kilimanjaro 0.620 High 3 Arusha 0.555 High 4 Mbeya 0.551 High 5 Iringa 0.524 High 6 Ruvuma 0.514 Medium 7 Tabora 0.500 Medium 8 Mtwara 0.499 Medium 9 Singida 0.483 Medium 10 Morogoro 0.473 Medium 11 Pwani 0.461 Medium 12 Tanga 0.459 Medium 13 Mara 0.458 Medium 14 Dodoma 0.435 Medium 15 Kigoma 0.432 Medium 16 Kagera 0.426 Low 17 Mwanza 0.426 Low 18 Lindi 0.418 Low 19 Shinyanga 0.406 Low 20 Rukwa 0.400 Low
Source: URT, (2002b) 2.3.3 Human Poverty Index The third approach in measuring poverty is the Human Poverty Index. While the HDI measures average achievement, the Human Poverty Index (HPI) measures deprivations in the three basic dimensions of human development captured by HDI.
• Lack of a long and healthy life: vulnerability to death at a relatively early age, as measured by probability at birth of not surviving to age 40.
• Lack of knowledge: exclusion from the world of learning and communications, as measured by the adult illiteracy rate.
• Lack of a decent standard of living: lack of access to overall economic provisioning, as percentage of the population not using improved water sources and percentage of children under five who are underweight (combined in an un-weighted average).
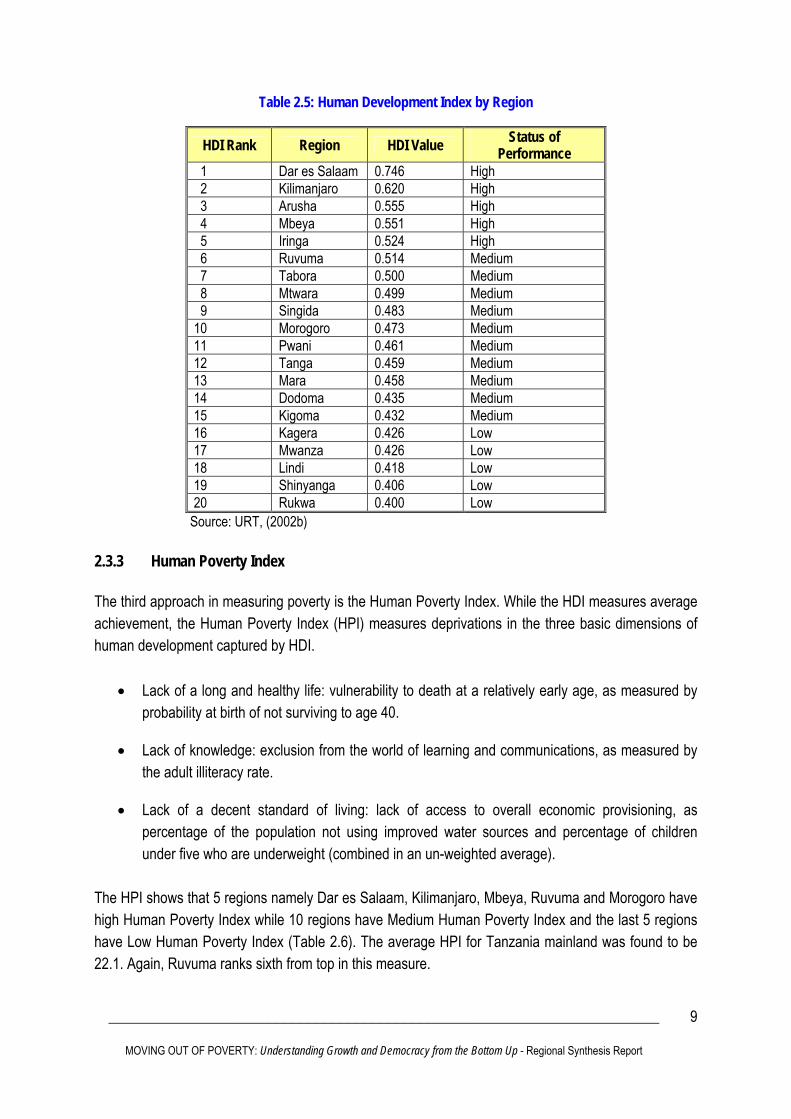
The HPI shows that 5 regions namely Dar es Salaam, Kilimanjaro, Mbeya, Ruvuma and Morogoro have high Human Poverty Index while 10 regions have Medium Human Poverty Index and the last 5 regions have Low Human Poverty Index (Table 2.6). The average HPI for Tanzania mainland was found to be 22.1. Again, Ruvuma ranks sixth from top in this measure.

_____________________________________________________________________
MOVING OUT OF POVERTY: Understanding Growth and Democracy from the Bottom Up - Regional Synthesis Report
10
One important lesson can be drawn from the statistics presented in this section: There is notable evidence of correlation between growth and grassroots changes in welfare and overall living standards, judging from individual indicators of growth and poverty, and combined indicators. This study goes further to establish household, economic and demographic characteristics, and social, political and institutional conditions that operate at the community level to shape the observed trends.
Table 2.6: Human Poverty Index by Region
HPI Rank Region HPI Value Status of Performance
1 Dar es Salaam 7.9 High 2 Kilimanjaro 12.4 High 3 Mbeya 14.8 High 4 Ruvuma 18.2 High 5 Morogoro 19.0 High 6 Arusha 20.1 Medium 7 Kigoma 21.0 Medium 8 Mara 21.2 Medium 9 Singida 21.3 Medium 10 Iringa 22.2 Medium 11 Dodoma 22.9 Medium 12 Rukwa 23.5 Medium 13 Mwanza 24.1 Medium 14 Mtwara 24.9 Medium 15 Tanga 26.2 Medium 16 Tabora 26.7 Low 17 Kagera 29.4 Low 18 Pwani 29.7 Low 19 Shinyanga 29.8 Low 20 Lindi 34.4 Low
Source: URT, (2002b).

_____________________________________________________________________
MOVING OUT OF POVERTY: Understanding Growth and Democracy from the Bottom Up - Regional Synthesis Report
11
CHAPTER 3.0: THE STUDY METHODOLOGY 3.1 Data Sources for Sampling Frame Two major national data sets were used in designing the sampling frame. These are the Household Budget Surveys (HBS 1991/92 and HBS 2000/01), the Demographic and Health Survey (DHS) 1991/92, and the 1999 Tanzania Reproductive and Child Health Survey [TRCHS], which is a variant of DHS. Both data sets are cross sectional (not panel). HBS data are statistically representative at national, regional, and urban/rural levels only, whereas the DHS data are representative at national, urban and rural/level only. Given that both HBS 1991/92 and HBS 2000/01 data were not designed to be districts representative, stratifying these data at district level would have resulted into high standard errors such that no meaningful inferences could have been drawn from analyses done using the disaggregated data. To overcome these caveat poverty variables from HBS 2000/01 were used to estimate district poverty correlates from Census 2002 data through a Poverty Mapping process (See URT, 2005b). These poverty correlates were then used to inform the sampling frame for this study. 3.2 Growth Variables Measures of poverty in particular the headcount ratio (% of households below poverty line) and standard of living indicators have been used to gauge the direction of growth under the major assumption that a district ranking high on several indicators experienced a high growth in the past ten years6. The conclusions drawn about growth based on this assumption were confirmed in interviews at the district level. Table 3.1 presents the statistics on the variables presented below: Household Characteristics
• If the household had electricity (% of households having electricity) • Type of floor material (% of households having earth floor) • Source of drinking water (% of households using piped or protected water source)
Household Durable Goods
• If a household had a radio/cassette (% of households owning a radio) • If a household had a telephone (% of households owning a telephone) • If a household had a bicycle (% of households owning a bicycle)
Social Services • Population per health facility • Number of health facilities per kilometer • Literacy rate (% of people 15 years and older who are literate)
6 Note that in the absence of direct measures of income, standard of living indicators can be used to proxy for income
(Montgomery et al., 1999).

_____________________________________________________________________
MOVING OUT OF POVERTY: Understanding Growth and Democracy from the Bottom Up - Regional Synthesis Report
12
Table 3.1: Growth Variables in Individual Districts in Ruvuma
Poverty Variables in 2002 Tunduru Songea Rural Mbinga Songea
Urban Namtumbo
1. % of households with Electricity 2.3 0.5 0.3 24.1 0.2
2. % of households having earth floor 92 83 82 37 88
3. % of households using piped or protected water source
49 77 42 85 79
4. % of households having a radio 37 54 42 72 51
5. % of households having a telephone 0.5 0.3 0.6 4.5 0.4
6. % of households having a bicycle 29 39 21 37 40
7. Population per health facility 5,615 5,411 6,730 4,674 6,252
8. Number of health facilities per kilometer 0.002 0.002 0.007 0.080 0.001
9. % of people 15 years and older who are literate 59 83 84 90 72
10. Headcount ratio (%) 38.7 40.8 28.0 31.6 54.8
3.3 Sampling Frame 3.3.1 Stage 1 - Sampling Based on the growth variables presented in Table 3.1 and local stakeholders perceptions echoed during the inceptions workshop two districts were sampled for this study—one with high growth (Mbinga District) and one with low growth rate (Tunduru District). Another factor that qualified Tunduru is isolation, that is, distance from the District Headquarters. Namtumbo, Songea Urban, and Songea Rural districts were not considered in the sampling exercise. Namtumbo was left out because it is a new district that used to be part of Tunduru district, while Songea Urban was not considered because the study aimed at capturing factors for moving out of poverty from a rural perspective. As for Songea Rural, different indicators revealed that its performance was in many aspects comparable to that of Mbinga district, which made it an equal candidate for the sampling exercise. However, Songea rural has a very big proportion of its population below the poverty line in comparison to Mbinga. Based on this fact and additional information from key informants at the inception workshop that Mbinga has experienced considerable growth compared to Songea Rural District, Mbinga was chosen over Songea Rural in an attempt to elicit understanding of why its development path have diverged from that of its counterpart.

_____________________________________________________________________
MOVING OUT OF POVERTY: Understanding Growth and Democracy from the Bottom Up - Regional Synthesis Report
13
3.3.2 Stage 2 - Sampling This stage involved sampling of the 8 communities7 for this study. At this stage, other two variables were introduced; isolation and proximity to the main centers in the district/district headquarters and population size of the community. In Mbinga, a community within more than 50 km from the District Headquarters was considered isolated while in Tunduru communities located within more than 100 km from the District Headquarters were considered isolated. In Ruvuma region, 2 districts (Tunduru and Namtumbo) have sparsely distributed population where as the other 3 (Songea Urban, Songea Rural, and Mbinga) are fairly densely populated. The 2 sparsely populated districts are the ones which have also experienced lowest growth and thus one was sampled for our study (Tunduru District). The Probability Proportion to Size (PPS) sampling methodology was used to select villages/communities from Tunduru and Mbinga districts. The lowest sampling unit in Tanzania has always been the village. However, at the time of survey, the census data had only been disaggregated to Ward level. Thus, 8 Wards were selected using PPS approach from which 8 villages were randomly selected. A total of 5 and 3 villages/communities were randomly selected from the sampled Wards (Table 3.2). Over-sampling of communities from the high growth district was done purposively to capture the movers and drivers of growth.
Table 3.2: Stage 2 Sampling
High Growth (Mbinga District)
Low Growth (Tunduru District) Variable
Low Population High Population Low Population High Population
NONE 1. Liuli Ward (Liuli Village)
1. Namwinyu Ward (Ndenyende Village)
NONE Isolated from the main centers 2. Tingi Ward
(Luhindo Village)
1. Nyoni Ward (Nyoni Village)
1. Mbangamao Ward (Kikolo Village)
NONE
1. Mtima Ward (Muungano Village)
Close to the main centers
2. Linda Ward (Mkalanga Village)
2. Muhuwesi Ward (Muhuwesi Village)
3.3.3 Stage 3 - Sampling Selection of households that filled in household questionnaires was based on sorting done by members of the focus group. Random sampling was done to capture households from each category that is: upward movers, downward movers, chronically poor, and those that have remained consistently rich. All the 4 categories were represented in the sample. Table 3.3 provides a summary of fieldwork activities.
7 In this report, words community and village are used interchangeably.

_____________________________________________________________________
MOVING OUT OF POVERTY: Understanding Growth and Democracy from the Bottom Up - Regional Synthesis Report
14
Table 3.3: Summary of Fieldwork Activities
Total Number of Informants per Village Data Collection Method Kikolo Liuli Luhindo Mkalanga Muhuwesi Muungano Ndenyende Nyoni Total
Key Informant Interview: Community Profile 4 5 4 4 8 5 5 6 41
Key Informant Interview: Community Timeline 4 5 4 4 5 4 5 6 37
Focus Group Discussion: Ladder of Life (Male FGD) 12 12 12 12 9 9 10 5 81
Focus Group Discussion: Ladder of Life (Female FGD) 12 10 11 10 8 8 7 8 74
Focus Group Discussion: Freedom, Power, Democracy and Local Governance (Male FGD)
12 10 12 10 13 9 8 8 82
Focus Group Discussion: Freedom, Power, Democracy and Local Governance (Female FGD)
12 11 12 10 14 7 7 8 81
Focus Group Discussion: Aspirations of Youth 10 9 10 9 12
13 12 8 83
Two Mini Case Studies: Community-Wide Events and Factors Affecting Mobility
4 4 5 6 5 4 5 8 41
Household Questionnaire 45 42 45 40 41 41 41 41 336
Open Ended Interviews: Individual Life Histories 10 9 10 10
10 10
10 10 79

_____________________________________________________________________
MOVING OUT OF POVERTY: Understanding Growth and Democracy from the Bottom Up - Regional Synthesis Report
15
CHAPTER 4.0: MOVEMENT OUT OF POVERTY: EXPLAINING GENERAL TRENDS
4.1 Major Livelihood Sources Villagers in the eight surveyed wards indicated that the primary activity in the village is agricultural production, but that a number of other sources of income also exist. These include: animal husbandry (keeping cattle, pigs, goats, and chicken), fishing (particularly in the village of Liuli), mining particularly in Muhuwesi and Nyoni villages, operating local brew bars, commerce, transportation, lumbering, masonry, cross boarder trade between Malawi, Mozambique and Tanzania, bread baking, operating restaurants and slaughtering pigs.8 Unskilled work is most commonly wage labor for farmers operating a milling machine or coffee pulping machine. Due to the fact that the study area was purely rural, agriculture was found to be the mainstay economic activity for both men and women. The majority of respondents were farmers (88 percent). Every household owns land and produces a large portion of its food requirements especially rice, maize, cassava, and beans. About three percent of men indicated trade as their main occupation. Majority had no secondary job (48 percent) but a few engage in private sector as unskilled laborers (12 percent). Thus, investment in agriculture was mentioned to be the major pillar for movement out of poverty and people have been able to accumulate assets and build houses using income acquired from selling agricultural produce. In Mbinga district, coffee is a major cash crop where as cashew nut is a major cash crop in Tunduru district (Table 4.1). Fishing is mostly practiced in the villages along the lake shore (Lake Nyasa), and was found to be the major non-agricultural income generating activity and the major protein source for the majority of Liuli households. However, the industry has deteriorated following a ban imposed on kokolo fishing gear (see section 8.4.6).
8 Slaughtering pigs is mentioned separately, not as an entity of running a restaurant, because this is a business that
stands on its own due to Religious beliefs. Pig meat cannot be sold in usual restaurants lest the owner risks away a big proportion of customers who are Moslems.

_____________________________________________________________________
MOVING OUT OF POVERTY: Understanding Growth and Democracy from the Bottom Up - Regional Synthesis Report
16
Table 4.1: Major Crops Grown in the Study Area
Name of the Village Major Food Crops Major Cash Crops Other Crops
Kikolo (M) Maize, beans, Coffee Sweet potatoes, cassava, bananas, millet, finger millet
Nyoni (M) Maize, beans, cassava Coffee, wheat Banana Luhindo (M) Maize, beans, paddy Coffee Groundnuts, finger millet, cassava Liuli (M) Cassava Mkalanga (M) Maize, beans, cassava Coffee Banana
Ndenyende (T) Maize, paddy, cassava, millet, beans
Cashew nuts, Coconut Groundnuts, simsim
Muhuwesi (T) Maize, paddy, cassava, beans Cashew nuts Groundnuts, simsim
Muungano (T) Maize, paddy, cassava groundnuts, simsim Cashew nuts Groundnuts, simsim
Note: M=Mbinga District; T=Tunduru District Mining is a new economic activity practiced in Muhuwesi and Nyoni villages from the mid 1990s. However, it is mostly done by people from other villages and from other districts and regions of Tanzania, and outside Tanzania (people from Thailand were found in the village). These immigrants form about 60 percent of the people doing mining along Muhuwesi River. The gemstones business has had both positive and negative impacts in these villages. Positive impacts include money earned by some villagers from the mines which they use to build houses with corrugated iron sheets, establish businesses (like trade in agricultural products) and buying of productive assets for instance milling machines and non-productive assets such as furniture. The negative impacts include decline in agricultural production as more people are attracted to mining activities and therefore abandon farming; increasing school drop outs as pupils leave school prematurely to go into mining activities; and increased chances of HIV infection due to more new men with money coming into the village from other areas. Since incoming miners had more money, money circulation has increased and pleasure in form of sex is no longer uncommon. Reportedly, leisure in terms of sex was not uncommon among this group. Therefore, unsafe sex might have increased, and with it, the chances of infection by HIV/AIDS. 4.2 Factors Underpinning Movement In understanding factors for upward or downward mobility in the studied communities, both community wide and idiosyncratic factors were sought using key informant interview and focus group discussions and individual life stories respectively. Table 4.2 presents the top two events/factors in each village that had a positive effect on the economy or prosperity of the community and movements out of poverty, and the top two negative events that harmed the prosperity of the community as indicated by the members of focus group discussions. The information in Table 4.2 presents the perceptions of both men and

_____________________________________________________________________
MOVING OUT OF POVERTY: Understanding Growth and Democracy from the Bottom Up - Regional Synthesis Report
17
women. It is worth noting that, respondents consistently repeated some factors but they were not necessary mentioned among the top two. For example, although the lack of agricultural inputs was not mentioned as one of the top two factors for decline in well being in some communities, it has consistently been reported as one factor for downward mobility and stagnation in all the communities surveyed. Idiosyncratic factors for upward or downward movement were pointed out in the focus group discussions and individual life stories. Factors for downward movement include: Ill health; theft; large number of dependents in some households; unwise spending by some villagers (e.g. excessive drinking); low bargaining power of artisanal miners; lack of “development jealousy,” that is lacking the spirit of competition for development; lack of sufficient capital for expansion of production activities; low efforts in farming activities; and investment failures. Factors for movement up the ladder include: hard work; business expansion and diversification of economic activities. The linkage between the community wide factors presented in Table 4.2 and idiosyncratic factors drawn from the focus group discussions and individual life stories is made in subsequent chapters.
Table 4.2: Community Wide Factors for Upward and Downward Mobility
Community/Village Positive and Negative Factors KI LI MK LU NY ND MN MH Events/factors that had a positive effect on the economy or prosperity of the community and movements out of poverty 1. Availability of markets for agricultural produce, for
example, coffee, cashew nuts, maize, rice, groundnuts, √ √ √ √ √
2. Construction of a health facility √ √ 3. Availability of water services √ 4. Discovery of gold deposits √ √ 5. Road construction/rehabilitation √ √ 6. Construction of classrooms under the Primary Education
Development Plan (PEDP) √ √
7. Abolition of levy √ 8. Formation of crop marketing unions √ Events/factors that had a negative effect on the economy or prosperity of the community and movements out of poverty 1. Lack of agricultural inputs √ √ 2. Wild animals/vermin √ √ √ 3. Human diseases √ 4. Lack of markets/Collapse of MBICU √ √ √ 5. Crop diseases √ √ √ 6. Insecurity √ 7. Floods/El Niño rains √ 8. Abolition of kokolo fishing √ 9. Decline in gemstone mining activities √ Note: KI=Kikolo; LI=Liuli; MK=Mkalanga; LU=Luhindo; NY=Nyoni; ND=Ndenyende; MN=Muungano;
MH=Muhuwesi.

_____________________________________________________________________
MOVING OUT OF POVERTY: Understanding Growth and Democracy from the Bottom Up - Regional Synthesis Report
18
4.3 Movement out of Poverty across Transitory Groups 4.3.1 The Summary Statistics Movement out of or into poverty was considered across four transition groups. These groups include those who have moved out of poverty (upward movers); those who have fallen into poverty (downward movers/fallers); those who have remained chronically poor over the period under study (chronically poor); and those that have remained chronically rich consistently. These groups were established based on the poverty line figures derived by community members in focus groups discussions. Table 4.3 provides the summary of status of the sorted households per community, whereas Figure 4.1 shows the average figure for each transition group.
Table 4.3: Household’s Status of Movement on the Ladder of Life (Female Ladder of Life)
Community Number of Households Sorted
Movers (%) Fallers (%) Chronically
Poor (%) Chronically
Rich (%) Kikolo 100 18 8 56 18 Liuli 100 3 7 83 7 Luhindo 100 16 9 63 12 Mkalanga 105 11 2 86 1 Muhuwesi 126 17 4 59 26 Muungano 129 36 4 53 10 Ndenyende 106 10 2 79 9 Nyoni 124 16 22 53 10
Figure 4.1: Mean Transition Groups
Fallers 7%
Movers 17%
Chronic Poor 66%
Chronic Rich 10%
% Movers % Fallers % Chronic Poor % Chronic Rich

_____________________________________________________________________
MOVING OUT OF POVERTY: Understanding Growth and Democracy from the Bottom Up - Regional Synthesis Report
19
On average, majority of the households in the surveyed communities have stagnated in poverty over the period under study with all communities having more than 50 percent of its households in the chronically poor category. On a more positive note, most communities (excepting Liuli and Nyoni) had more people moving out of poverty than moving into poverty (Table 4.3). Muhuwesi community had the highest number of chronically rich households. This could possibly be explained by intensive mining opportunities that emerged in the community in the late 1990s. In an attempt to compare findings from several mobility matrices, simple summary statistics that allow for comparison of findings from the Mobility Matrices across communities have been calculated. Five major summary statistics have been used to explain the general movement in and out of poverty in Ruvuma Region. These are: Net Prosperity Index [NPI]
Households ofNumber TotalLife) ofLadder on (Falling-Life) ofLadder on (RisingNPI =
Net Prosperity of the Poor Index [NPP]
HouseholdsPoor Initially ofNumber TotalPoor) Starting Households (Falling-Poor) Starting Households (RisingNPP =
Net Prosperity of the Rich Index [NPR]
HouseholdsRich Initially ofNumber TotalRich) Starting Households (Falling-Rich) Starting Households (RisingNPR =
Moving out of Poverty Index [MOP]
HouseholdsPoor Initially ofNumber TotalLinePoverty theAcross Rising HouseholdsMOP =
Churning Index [CI]
Households ofNumber TotalLife) ofLadder on (FallingLife) ofLadder on (RisingCI +
=
Tables 4.4- 4.6 and Figure 4.2 present general findings and comparisons across different communities. Note that in subsequent sections, these summary statistics have been referred to in discussing each specific mobility factor.

_____________________________________________________________________
MOVING OUT OF POVERTY: Understanding Growth and Democracy from the Bottom Up - Regional Synthesis Report
20
In general;
• During the last ten years, the people Ruvuma Region have experienced net gains in well-being as defined by the overall improvement in households on the ladder of life as measured by a positive Net Prosperity Index (Table 4.4).
• The Net Prosperity Index indicates that all of the villages surveyed, with the exception of Liuli,
have increased their net prosperity over the last ten years (Table 4.4). • The poor have also been gaining ground (except in Liuli), as demonstrated by the Net
Prosperity of the Poor Index (Table 4.5, 4.5 and 4.6). • The initially rich households, however, have been losing ground, as demonstrated by the Net
Prosperity of the Rich Index (Table 4.4, 4.5 and 4.6). • Based on the Churning Index about 70 percent of the population has moved up or down by at
least one step in the last 10 years (Table 4.4). • Based on the Moving out of Poverty Index, one fifth of the poor were able to climb out of poverty
(Table 4.4).
Table 4.4: Measuring Prosperity: Average of Selected Indices
Index Mean Median 1. Net Prosperity 0.22 0.29 2. Moving Out of Poverty 0.20 0.21 3. Net Prosperity of the Poor 0.37 0.47 4. Churning Index 0.71 0.81 5. Net Prosperity of the Rich -0.36 -0.33
Table 4.5: Measuring Prosperity: Community Indices (Shifting Index)
Village NPI NPP NPR MOP (Shifting) Liuli -0.530 -0.562 -0.400 0.000 Muhuwesi 0.063 0.200 -0.355 0.221 Nyoni 0.218 0.724 -0.583 0.342 Ndenyende 0.302 0.611 -0.333 0.102 Kikolo 0.310 0.432 -0.038 0.243 Luhindo 0.380 0.736 -0.500 0.181 Muungano 0.403 0.571 -0.333 0.438 Mkalanga 0.743 0.774 -0.333 0.009

_____________________________________________________________________
MOVING OUT OF POVERTY: Understanding Growth and Democracy from the Bottom Up - Regional Synthesis Report
21
Table 4.6: Measuring Prosperity: Community Indices (Fixed Index)
Village NPI NPP NPR MOP (Fixed) Liuli -0.530 -0.562 -0.400 0.137 Muhuwesi 0.063 0.200 -0.355 0.221 Nyoni 0.218 0.724 -0.583 0.342 Ndenyende 0.743 0.774 -0.333 0.118 Kikolo 0.310 0.432 -0.038 0.243 Luhindo 0.390 0.736 -0.500 0.444 Muungano 0.302 0.432 -0.333 0.477 Mkalanga 0.403 0.571 -0.333 0.571
Figure 4.2: Rich versus Poor Prosperity
Rich vs. Poor Prosperity, Sorted by NPI
-0.8-0.6-0.4-0.2
00.20.40.60.8
1
Liuli
Muhuw
esi
Nyoni
Ndeny
ende
Kikola
Luhin
do
Muung
ano
Mkalan
ga
NPI NPP NPR MOP (shifting)
From Table 4.5 and 4.6, again with the exception of Liuli, the poor have gained ground seemingly at the expense of the rich. This is counter to expected results that an increase in prosperity of the poor would increase the general prosperity of the village and improve the overall economic situation, leading to increases in prosperity for all groups. In Ruvuma, while nearly a fifth of the population was able to move out of poverty, 50 percent of the chronic rich report having declined on the ladder of life, with 23 percent stagnating and only 27 percent recording improvement. In contrast, among the chronic poor 27 percent report a decline in well-being, 23 percent report stagnation, while 50 percent report an improvement in prosperity. Liuli is the main outlier in the data, having experienced a decline of both the rich and the poor. Ironically, Liuli is the most developed and diversified of all the survey villages, with piped water, a small police station, post office, telephones, and a comparatively good transportation system. There are also a number of vocational training programs and external NGOs active in the area.

_____________________________________________________________________
MOVING OUT OF POVERTY: Understanding Growth and Democracy from the Bottom Up - Regional Synthesis Report
22
The decline is mainly attributed to the collapse of the fishing industry following the banning of beach net (‘kokolo’) fishing by the government for environmental reasons. This decimated one of the main livelihood sources of the town and had far reaching effects for all sectors. The situation is further exacerbated by the encroachment of migrants from neighboring villages on the Liuli villagers’ farm and watershed lands despite government orders to vacate these lands. The migrants are of a different ethnic group and the growing distrust between locals and migrants, and frequent attacks by migrants have destabilizes the climate for investment. However, the major motive for the conflicts is not ethnic differences but access to resources. The general results seem to run contrary to what one would expect given the circumstances of Ruvuma. The region is isolated, over 1,500 kilometers from the economic capital of the country Dar es Salaam. The infrastructure is limited and there are very few public services. The area is also prone to natural disasters, such as floods, earthquakes, hurricanes, hail, crop diseases and there is a constant danger in many parts of attack of people and crops by wild animals. Also diseases such as malaria and cholera are endemic in the area and the proximity to international borders and mining operations have increased infection levels of HIV.
“Many return [from working abroad] with HIV infection, we take care of them and finally they die. A few days ago we buried one.”
Women’s Focus Group Discussion, Liuli In addition to the physical characteristics of the region, life in Ruvuma has become more unpredictable in the past ten years due to the market liberalization in the cashew and coffee growing industries. Competition from private buyers caused the collapse of government-sponsored cooperatives thus making commodity prices more volatile and access to necessary agricultural inputs more difficult. It has also given rise to powerful village moneylenders and middlemen that are seen as controlling the markets for cash crops. 4.3.2 Idiosyncratic Factors for Movement into and Out of Poverty Hard Work The term “hard work” is admittedly vague, and can stand in for a number of concepts ranging from entrepreneurial savvy to plain good luck. It is most likely to be related to the concept of frugality and cooperation within a household. Through hard work and savings from agriculture, households are able to expand their family plots and income-generating activities. Hard work is also associated with ambition and “development jealousy,” or wivu wa maendeleo in Swahili, which can spur increased individual and community efforts in areas that would have otherwise be susceptible to resignation and stagnation.

_____________________________________________________________________
MOVING OUT OF POVERTY: Understanding Growth and Democracy from the Bottom Up - Regional Synthesis Report
23
Those who were able to move out of poverty did so primarily by saving a small portion of the money they earned from agriculture, particularly in the years of good harvests and high commodity prices, and re-investing it into either expanding agricultural endeavors or diversifying their income-generating activities. These poor, not used to a lavish lifestyle and not burdened by obligations to support other family members, are able to steadily expand their asset base, and by extension, their income. They then attribute their success to hard work and frugality. Household data indicates that movers cite hard work as most important for upward mobility, followed by increased crop production and income diversification. These trends are also reflected among those who were able to move up within the stagnant groups. Of the chronic rich whose position improved, 30.8 percent attributed this to hard work, 19.2 percent attributed it to income diversification, and 11.5 percent attributed it to crop diversification. The rising poor report increasing their fortunes through hard work, 20 percent, increased crop production, 18.6 percent, crop diversification, 18.6 percent and diversifying sources of income, 12.9 percent. There may come a point where the spending habits of the poor may adjust to their higher level of wealth. Similarly to the rich, if they are no longer practicing precautionary saving or buying assets that may be sold to smooth consumption in the event of a shock, they are vulnerable to falling back down the ladder of life or completely into poverty. Shocks can occur if groups have overextended themselves in risky investments, for example, mining, there is a poor harvest, commodity prices fall or there is a major illness or death in the family. Also, spending lavishly on consumption and not adequately investing in productive assets have been cited by a number of people as reasons for falling into poverty. The fallers would not attribute their misfortune to their spending habits, however, blaming instead the fall in crop prices or the poor harvest for their failure. With regard to health shocks, or sudden expenses such as a death in the family, people can dis-save and sell assets to cover expenses. If they are unable to do this, they must borrow money. If households are able to borrow at reasonable rates, they are unlikely to suffer significant lasting damage by the event. If they are, however, forced to borrow at high rates, they are very likely to experience a decline in prosperity.
“Inequality is decreasing due to “development jealousy.” For example, if a villager earns TZS 300,000 by selling cashew nuts or rice, other villagers try hard during the next agricultural season to earn more than that amount from the same activity.”
Waziri Siani, 42 years old man, Muhuwesi “I did not sit idle; I started the business of baking bread and selling it in the village market. To increase our [household] income we were also selling extra food crops from our harvest and selling coffee from the farm we inherited from my father-in-law. Sometimes I worked in the factory as a casual laborer.”
Altenzia Ndunguru, 42 years old woman, Nyoni
“From agriculture I bought ten used bicycles and a sewing machine. I then repaired them myself and sold them. Then I bought a radio, fifteen goats and pigs. I also bought a car, though an old one, to make my life better, but my ambition is not fulfilled.”
Odwin Severin Lupogo, 52 years old man, Nyoni

_____________________________________________________________________
MOVING OUT OF POVERTY: Understanding Growth and Democracy from the Bottom Up - Regional Synthesis Report
24
Hard work also represents the antithesis of excessive spending on consumption, a theme found repeatedly in survey interviews. A large number of people indicate that a major reason for falling back into poverty is drunkenness, spending money on women and other lavish spending behaviors.
“In [the trading village of] Lindi mothers send their daughters to receive guests at the bus stand regardless of whether they know the guests or not. These girls invite the guests to their mothers’ houses where the mothers and girls entertain them in return for cash. This has caused loss of business among many young business people from this village.”
Hassan Rashid, 60 years old man, Former Trader, Ndenyende “We have been so much cheated by alcohol – most of us have fallen into this trap. When someone feels that he is successful he starts drinking too much.”
Joseph Kayuni, 68 years old man, Village Elder, Mkalanga “In 2004 one man of Muhuwesi Village sold 3 bags of cashew nuts for about TZS 175,000. He did not go back home; he went to a local brew club and drank for three consecutive days. After three days his wife, having learnt of her husband drinking excessively, went to the bar and asked him about the money from sales of cashew nuts and about going back home with her. “I have no money, go back home alone.” Said the man to his wife!!! …They squander even more than that amount of money by offering drinks and chicken meat to easy-going women. They sleep with them in bushes; they do not sleep with them in the Guest House that is in the village lest they are seen by their relatives.”
Asha Baina, 35 year old woman, Muhuwesi Business Expansion/Diversification The poor whose prosperity has increased over the past ten years report a number of reasons all involving the expansion of and diversification from their main source of livelihood, agriculture. Many respondents indicated that diversification from agriculture was a necessary step for moving out of poverty although diversification within agriculture (number and type of crops grown) is supported by the data from the household questionnaire through explicitly using land as a proxy for agricultural diversifications. Non-agricultural activities include commerce, transportation and mining activities. Table 4.7 presents household level correlates of poverty status now and 10 years ago. Hectares of land owned now and 10 years ago have a significant impact on the poverty status of the poor and non poor groups. The household size has also showed a significant impact on the poverty status, being poor or non poor. This could be translated as “more members of household, more labor to work on the farms,” or can also be taken as a sign that richer people feel able to have and support more children.
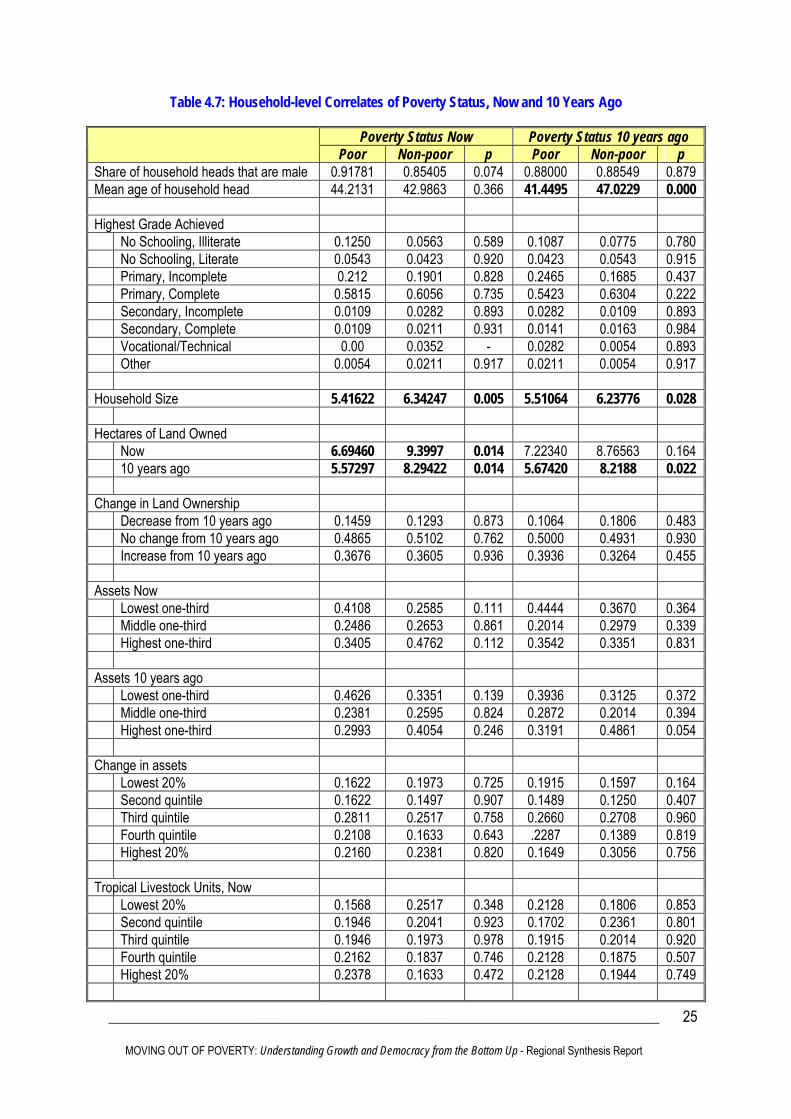
_____________________________________________________________________
MOVING OUT OF POVERTY: Understanding Growth and Democracy from the Bottom Up - Regional Synthesis Report
25
Table 4.7: Household-level Correlates of Poverty Status, Now and 10 Years Ago
Poverty Status Now Poverty Status 10 years ago Poor Non-poor p Poor Non-poor p Share of household heads that are male 0.91781 0.85405 0.074 0.88000 0.88549 0.879 Mean age of household head 44.2131 42.9863 0.366 41.4495 47.0229 0.000 Highest Grade Achieved No Schooling, Illiterate 0.1250 0.0563 0.589 0.1087 0.0775 0.780 No Schooling, Literate 0.0543 0.0423 0.920 0.0423 0.0543 0.915 Primary, Incomplete 0.212 0.1901 0.828 0.2465 0.1685 0.437 Primary, Complete 0.5815 0.6056 0.735 0.5423 0.6304 0.222 Secondary, Incomplete 0.0109 0.0282 0.893 0.0282 0.0109 0.893 Secondary, Complete 0.0109 0.0211 0.931 0.0141 0.0163 0.984 Vocational/Technical 0.00 0.0352 - 0.0282 0.0054 0.893 Other 0.0054 0.0211 0.917 0.0211 0.0054 0.917 Household Size 5.41622 6.34247 0.005 5.51064 6.23776 0.028 Hectares of Land Owned Now 6.69460 9.3997 0.014 7.22340 8.76563 0.164 10 years ago 5.57297 8.29422 0.014 5.67420 8.2188 0.022 Change in Land Ownership Decrease from 10 years ago 0.1459 0.1293 0.873 0.1064 0.1806 0.483 No change from 10 years ago 0.4865 0.5102 0.762 0.5000 0.4931 0.930 Increase from 10 years ago 0.3676 0.3605 0.936 0.3936 0.3264 0.455 Assets Now Lowest one-third 0.4108 0.2585 0.111 0.4444 0.3670 0.364 Middle one-third 0.2486 0.2653 0.861 0.2014 0.2979 0.339 Highest one-third 0.3405 0.4762 0.112 0.3542 0.3351 0.831 Assets 10 years ago Lowest one-third 0.4626 0.3351 0.139 0.3936 0.3125 0.372 Middle one-third 0.2381 0.2595 0.824 0.2872 0.2014 0.394 Highest one-third 0.2993 0.4054 0.246 0.3191 0.4861 0.054 Change in assets Lowest 20% 0.1622 0.1973 0.725 0.1915 0.1597 0.164 Second quintile 0.1622 0.1497 0.907 0.1489 0.1250 0.407 Third quintile 0.2811 0.2517 0.758 0.2660 0.2708 0.960 Fourth quintile 0.2108 0.1633 0.643 .2287 0.1389 0.819 Highest 20% 0.2160 0.2381 0.820 0.1649 0.3056 0.756 Tropical Livestock Units, Now Lowest 20% 0.1568 0.2517 0.348 0.2128 0.1806 0.853 Second quintile 0.1946 0.2041 0.923 0.1702 0.2361 0.801 Third quintile 0.1946 0.1973 0.978 0.1915 0.2014 0.920 Fourth quintile 0.2162 0.1837 0.746 0.2128 0.1875 0.507 Highest 20% 0.2378 0.1633 0.472 0.2128 0.1944 0.749
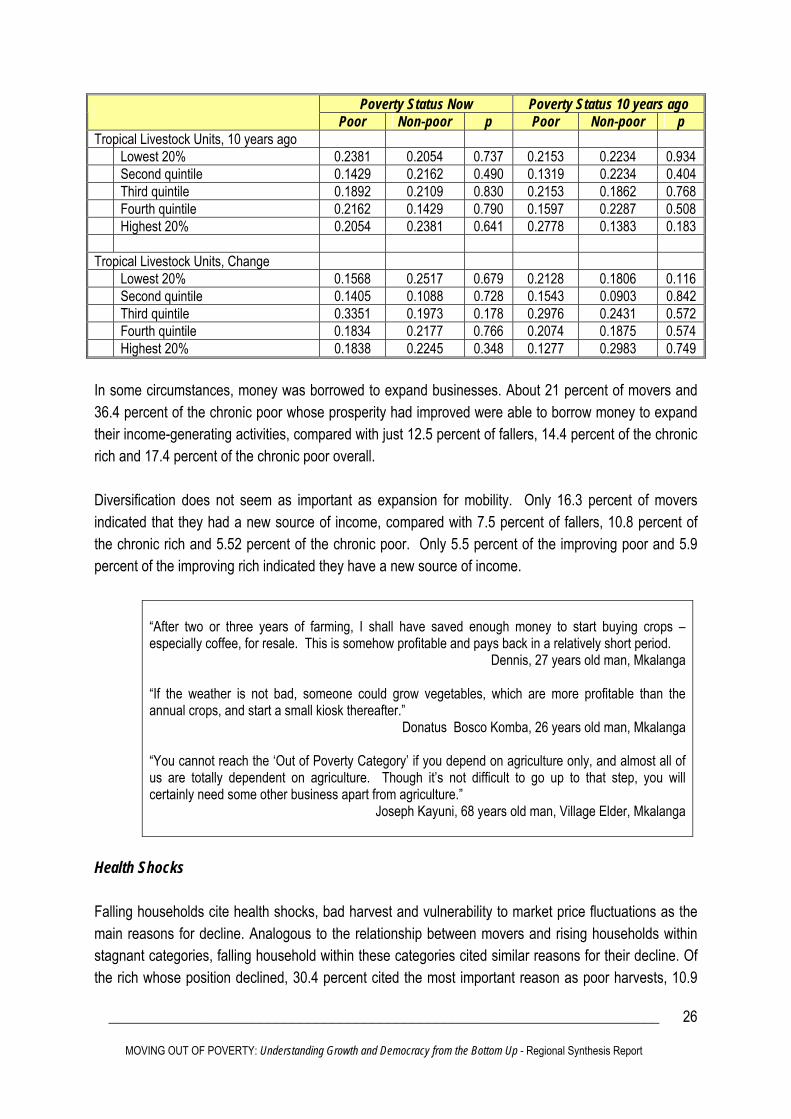
_____________________________________________________________________
MOVING OUT OF POVERTY: Understanding Growth and Democracy from the Bottom Up - Regional Synthesis Report
26
Poverty Status Now Poverty Status 10 years ago Poor Non-poor p Poor Non-poor p Tropical Livestock Units, 10 years ago Lowest 20% 0.2381 0.2054 0.737 0.2153 0.2234 0.934 Second quintile 0.1429 0.2162 0.490 0.1319 0.2234 0.404 Third quintile 0.1892 0.2109 0.830 0.2153 0.1862 0.768 Fourth quintile 0.2162 0.1429 0.790 0.1597 0.2287 0.508 Highest 20% 0.2054 0.2381 0.641 0.2778 0.1383 0.183 Tropical Livestock Units, Change Lowest 20% 0.1568 0.2517 0.679 0.2128 0.1806 0.116 Second quintile 0.1405 0.1088 0.728 0.1543 0.0903 0.842 Third quintile 0.3351 0.1973 0.178 0.2976 0.2431 0.572 Fourth quintile 0.1834 0.2177 0.766 0.2074 0.1875 0.574 Highest 20% 0.1838 0.2245 0.348 0.1277 0.2983 0.749 In some circumstances, money was borrowed to expand businesses. About 21 percent of movers and 36.4 percent of the chronic poor whose prosperity had improved were able to borrow money to expand their income-generating activities, compared with just 12.5 percent of fallers, 14.4 percent of the chronic rich and 17.4 percent of the chronic poor overall. Diversification does not seem as important as expansion for mobility. Only 16.3 percent of movers indicated that they had a new source of income, compared with 7.5 percent of fallers, 10.8 percent of the chronic rich and 5.52 percent of the chronic poor. Only 5.5 percent of the improving poor and 5.9 percent of the improving rich indicated they have a new source of income.
“After two or three years of farming, I shall have saved enough money to start buying crops – especially coffee, for resale. This is somehow profitable and pays back in a relatively short period.
Dennis, 27 years old man, Mkalanga
“If the weather is not bad, someone could grow vegetables, which are more profitable than the annual crops, and start a small kiosk thereafter.”
Donatus Bosco Komba, 26 years old man, Mkalanga
“You cannot reach the ‘Out of Poverty Category’ if you depend on agriculture only, and almost all of us are totally dependent on agriculture. Though it’s not difficult to go up to that step, you will certainly need some other business apart from agriculture.”
Joseph Kayuni, 68 years old man, Village Elder, Mkalanga
Health Shocks Falling households cite health shocks, bad harvest and vulnerability to market price fluctuations as the main reasons for decline. Analogous to the relationship between movers and rising households within stagnant categories, falling household within these categories cited similar reasons for their decline. Of the rich whose position declined, 30.4 percent cited the most important reason as poor harvests, 10.9
_____________________________________________________________________
MOVING OUT OF POVERTY: Understanding Growth and Democracy from the Bottom Up - Regional Synthesis Report
27
percent to fluctuations in prices for market goods, and 10.9 percent to a health shock. Of the declining poor, 35.1 percent attribute the fall to poor harvests and decreasing yields and 18.9 percent attribute it to a health shock. In a region where access to health care is limited and disease is common, unexpected expenditure when a family member falls ill or dies can have a serious impact on the well-being of a household. In the past ten years, 58.9 percent of movers, 61.1 percent of fallers, 71.9 percent of the chronic rich and 64.9 percent of the chronic poor reported experiencing a health shock (illness, injury or death) that created a crisis for the household. Of the movers and chronic rich, 73.3 percent and 58.8 percent respectively, were able to cope with the crisis through dis-saving and the sale of assets. Of those two groups who were forced to borrow money, a vast majority was able to borrow at favorable interest rates. Less than five percent in each group (movers and chronic rich) reported being forced to borrow at high interest rates or inability to cope with the crisis at all. Of the fallers, only half were able to meet the necessary expenses by dissaving or selling assets. Of the remainder, most were able to borrow at favorable interest rates, but nearly 20 percent were forced to borrow money at high interest rates a major factor in their decline in well-being. A majority of individual life stories mention households falling back into poverty due to illness of one of its members. Most mention selling assets or borrowing from friends and relatives as the main way they were able to deal with the crisis. Of the chronic poor, slightly more than 50 percent were able to sell assets and dissave to meet expenses. Surprisingly, however, most of the poor were able to borrow at good interest rates. Less than five percent reported having been forced by circumstances to borrow money at high rates of interest.
“When our eldest son fell sick, we had to sell roofing metals that we had already purchased, so as to meet part of the treatment costs. This was a set back in terms of plans to re-built our house.”
Silila Mbunda, 35 years old woman, Luhindo
“I can’t forget how I was tortured by the sickness of my daughter Grace.” John Lawrence Shega, 60 years old man, Muungano
“I closed the shop due to health problems, I was sick and most of the money from the shop was used in meeting my health costs. The introduction of license charges at a rate of TZS 10,000 made it further difficult for me to continue with business as my capital was very small.”
Rashidi Kazembe, 60 years old man, Ndenyende

_____________________________________________________________________
MOVING OUT OF POVERTY: Understanding Growth and Democracy from the Bottom Up - Regional Synthesis Report
28
Theft One of the major reasons for decreases in the prosperity of wealthier households in the Ruvuma region has been an increased incidence of theft and violence. These stories are feature prominently in many of the focus group discussions and in the individual life stories. With the exception of Liuli, none of the villages have a police station and rich households are often the targets of theft. In the absence of any method of insurance, these incidents are often seriously detrimental to the well-being of affected household. Box 1 narrates the theft problems in Mkalanga village in the 1990s.
Box 1: Case Study I: Insecurity due to Incidences of Theft Theft was a major problem in the village of the Mkalanga during the 1990s. One villager had developed a network of thieves and bandits that operated in the region but was centered in the village. Crops were illegally harvested and stolen from fields and animals were taken from farms. These incidents were frequently reported to officials at the Mbinga police station but no action was taken. The village feared the head of the ring and consequently bought him drinks at the village bar and brought gifts to his home in hopes of reducing their chances of being robbed. During the 1999 coffee season the thieves hijacked the car of a private buyer and stole the money meant for the coffee farmers. Though the village recovered their losses from the private buyer they decided that they would no longer tolerate the prescience of the criminals. The leader’s home was attacked and though he escaped two of his associates were captured and turned over to police. The family was then ordered to move away and the home was burned. The leader was arrested about two months later following an armed robbery and murder.
Narrated by 4 Community Informants, Mkalanga
After the arrest of the robbers, the positive welfare of the community members was restored as echoed below. This brought to an end the era of horror and insecurity in Mkalanga. People resumed their normal lives. Premature harvesting of maize was no more in this village – “At least now we can sleep peacefully in our houses while our crops are still in the farms awaiting the proper harvesting season”, reported one of the key informant. A part from the evidence from Mkalanga village as reported in Box 1, a number of other testimonies below indicate that insecurity was also a major problem in other communities such as Liuli, Luhindo, Muhuwesi and Nyoni.
“The community is no longer secure as crime rates have tended to increase with time. This has been associated with decreased sources of livelihood.”
Michael Nyirenda, 61 years old man, Farmer and Fisherman, Liuli “People do steal maize and beans during harvest, they go to sell in the mining area and this habit has contributed to the poverty facing many people in the village… Compared to ten years ago, theft has increased three times.”
Sophia Ndunguru, 54 years old woman, Luhindo “Mr. Mgongo does not have much freedom because he is the richest man in the village; he is afraid he can be

_____________________________________________________________________
MOVING OUT OF POVERTY: Understanding Growth and Democracy from the Bottom Up - Regional Synthesis Report
29
overtaken anytime wealth wise. Moreover, thieves can attack him.” Abubakar Kitalo, 46 years old man, Primary School Head Teacher, Muhuwesi
“Improvement in my well-being has decreased because of theft persisting in the village. In 1999 I found my entire maize farm harvested by thieves. Also in 1994 I found my bean farm had been harvested; and my hens were stolen during the same period.”
Altenzia Ndunguru, 42 years old woman, Nyoni Investment Failures Because the rich have more capital, they generally undertake more substantial investment. They are also less risk-averse than the poor who do not have assets they can sell in case of a failed investment. As a result, a number of wealthy individuals have declined a number of steps on the ladder of life due to failure of risky investments they undertook. For example, Mr. Adorat Narsis Komba of Mkalanga relates the story of his purchase of a motor vehicle in 1995. He believes it was the worst economic decision he has ever made because he did not have sufficient funds to maintain it. He believes this poor decision led to a substantial decline in his prosperity. Another example is of Mr. Yokim Thilia of Nyoni village. The respondent was found to be a beggar at the time of survey despite having being a respectable rich person in the village in the past. Investment in the transport business was a major culprit for his fall. Other causes include: his relatives boarding his business cars without paying fare; an accident of one of his cars in 1990 that drained much of his savings; and theft of his vehicle spares after thieves broke into his house on one night that not only brought him substantial loss but also cost him much money and time pursuing the case in the district court. The thieves were nevertheless not found. Other factors that caused his downfall were costly borrowing for his household; taking his daughter to a secondary school but the daughter went back home with pregnancy without completing school; and having two dumb daughters who cannot marry, remaining dependent on him forever. A number of other respondents indicate similar experiences with high value investments, particularly in the transportation industry, and mining sector. Mining business was associated with downward movement for some community members who engaged in the business. Because minerals are in the soil and artisanal miners are unable to detect what is underneath, mining is a speculative business fraught with risks and potential for losses. Some people hoping to hit it big in mining diverted their resources by moving some capital from other businesses into mining. In some cases it worked out and they became richer. Yet in some other instanced it never paid back so these people experienced a sharp decline in prosperity. For example, Mr. Ally Hassan Mgongo, 54 years old, who used to own a shop and about TZS 20 million in a bank is sometimes forced to go without food because of a heavy investment he undertook in mining failed and he couldn’t recover from his losses.

_____________________________________________________________________
MOVING OUT OF POVERTY: Understanding Growth and Democracy from the Bottom Up - Regional Synthesis Report
30
Despite being lucrative, selling of gemstones is a big challenge with many hurdles. The bargaining power of artisanal miners was found to be affected by their lack of information about the value of gemstones. They just bargain over the price with buyers on site or in Tunduru town who seldom give them fair value for the stones. Respondents pointed a finger at the government regarding regulation of gemstone prices. Mining activities were also mentioned to have started dwindling from 1998 and the life of the community members started worsening.
“If a rich person has borrowed much money to boost up his business and it happens that he gets a big loss in his business, he has to sell his assets in order to repay the debts he has; hence his level of well-being may substantially decline.”
Dunia Zuberi, 40 years old man, Muungano “We just bargain with local buyers for any price and we sell to them. We do not know where the market of minerals is, nor do we know where they sell them”
Mwanjala Rashid, 37 years old man, Muhuwesi “Jupilasiki juoto kutajilika; ujootajiliki juotokufilisika,” meaning: “Someone who has nothing can get wealth; someone who is rich can become bankrupt.”
Yokim Romanus Thilia, 48 years old man, Nyoni
Middlemen The inability of farmers to get what they consider is a fair price for their crops is a major concern for all households involved in the agricultural sector, and is often listed by respondents as a cause for increased inequality in the village. Nearly 70 percent of those surveyed believed that they were not usually dealt fairly with buyers and sellers. About 63.4 percent believe that their ability to get a fair deal has deteriorated over the last ten years. The rise of the middlemen, called masomba in the local language, is discussed in more detail in section 6.2.2

_____________________________________________________________________
MOVING OUT OF POVERTY: Understanding Growth and Democracy from the Bottom Up - Regional Synthesis Report
31
CHAPTER 5.0: MOBILITY AND ACCESS TO FINANCIAL SERVICES AND AGRICULTURAL INPUTS
5.1 Access to Agricultural Inputs The major production hurdle facing the principal local livelihoods in the area as pointed out by FGD respondents and key informants include poor access to and high prices of inputs like fertilizer and pesticides. As a consequence crop production has been declining over time. Mbinga and Tunduru being coffee and cashew nuts producers respectively have been the most deeply affected as described in sections 5.1.1 and 5.1.2 respectively. 5.1.1 Coffee Market Liberalization In the coffee growing regions of the Ruvuma district, access to fertilizer and pesticides can make a huge difference in the annual yield of the crop. This is of particular importance to the four coffee growing villages included in the study (Kikolo, Luhindo, Mkalanga and Nyoni). Unfortunately, access to these inputs is limited by the remote location of many villages and the budgetary constraints of the villagers. Prior to the liberalization of the coffee markets in 1994, villagers in the region were dependent on the Mbinga Cooperative Union (MBICU) both to sell their crops and for inputs. Following liberalization, villagers had to sell their output directly to buyers and initially they were able to secure relatively high prices from private buyers. Competition from private buyers led to the collapse of the admittedly bloated and inefficient government-sponsored cooperative union in 1998. A number of farmers that had sold their crop to the MBICU and were awaiting payment never received the full value they were owed. Following the collapse of the MBICU, farmers in Luhindo joined a new coffee-growers cooperative, the Mbinga Farmers Cooperative Union (MBIFACU). This new union however also collapsed again failing to pay producers for their crops. The initially high coffee prices from private buyers did not last though. An increase in the activities of middlemen eroded profit margins. Farmers in remote areas were unable to pay to transport their crops to regional centers for sale. Therefore they had to rely on middlemen, who paid lower prices than private buyers. Middlemen also have been accused of the practice of masomba, or using unfair measures particularly in the village of Nyoni. Masomba means sunflower in the local language, and the practice takes this name because even a large number of sunflower seeds weigh very little (See Box 2, Section 6.2.2). Villagers believe that by using unfair measures, middlemen make their coffee as weightless as a sunflower. Traders say that a tin that is universally accepted as two kilograms in the village, a dumla, actually only weighs one. They also overfill 50 kilogram sacks to nearly 60 kilograms, but only pay the farmers for 50. But because the middlemen control the market, villagers have no choice but to accept their claims.

_____________________________________________________________________
MOVING OUT OF POVERTY: Understanding Growth and Democracy from the Bottom Up - Regional Synthesis Report
32
Without MBICU, the market price for inputs increased rapidly, which coupled with falling coffee prices, left farmers unable to purchase the necessary inputs. In addition, where the MBICU had held part of the money from the harvest in a forced-savings account for the next season, private buyers just paid at the time of purchase. They also did not provide any training to improve coffee quality, or assistance in procuring inputs. The collapse of the MBICU and the resulting decline in available inputs has been cited as a major reason for the decline in coffee production and a general decline in community well-being by the residents of Kikolo, Luhindo and Mkalanga. Only Nyoni, which is part of a specialty coffee growing program funded by the NGO Technoserve, currently sees the deregulation of the coffee market as an overall positive for the community. Residents initially had similar experiences to those in the other coffee growing villages but following the arrival of the Technoserve program in the village in 2002, there have been a revitalization of the local economy. Villagers credit the program as being the main reason for the recent increases in prosperity.
“We can’t afford the price for inputs; take an example, now a bag of 25 kg of Urea is TZS 20,000 while Ammonium Sulphate is TZS 24,000. Ten years back the price was TZS 5,000 and TZS 8,000 for Urea and Ammonium Sulphate respectively and they were easily available on credit provided by MBICU. Because the fertility of land has started to deteriorate, application of fertilizers is very important, but the affordability is a problem.”
Isabela Mbangula, 35 years old woman, Luhindo “This is a problem, because to many of us it is unaffordable. There is a timing problem here: when the inputs are needed, we do not have enough money to buy them; during the harvesting season we have money but the inputs are not needed this time, and the money ends up being spent on food, clothes and sending the children to school.”
Aidan Romanus Haule, 49 years old man, Head Primary School Teacher, Mkalanga “Private traders do not provide any agro-inputs to us, and as a result, we have not been able to maintain our coffee trees. There is no way you can have good coffee yields without chemicals. This has been the major stumbling block. Prices in the market are too high, and we definitely cannot afford them. I really don’t see how we can get out of the poverty trap in the absence of agro-inputs for coffee. ”
Silila Mbunda, 35 years old woman, Luhindo “When the private coffee buyers came we were happy because, on selling our crops, we received all the money at once. But this was not without a price- there was no room for agriculture input credit any more. And with rising fertilizer prices, the cost became unbearable to most of us. Previously we had been receiving fertilizer on credit from our cooperative union, but now it is all different.”
Florian Ongasute Komba, 74 years old man, Village Elder, Mkalanga “Do we see a FREE MARKET after liberalization or a DISORGANIZED MARKET? The traders and/or buyers have killed the coffee industry in our community. Traders are neither for the interest of farmers nor think of committing some of their resources to improve the quality of coffee so that they are sure they buy good coffee during the successive crop seasons. Nowadays, somebody comes and says I will buy your produce at price X! There are hardly any negotiations. It is now more difficult for people to earn a living.”
Jyazint Komba, 38 years old man, Kikolo

_____________________________________________________________________
MOVING OUT OF POVERTY: Understanding Growth and Democracy from the Bottom Up - Regional Synthesis Report
33
Technoserve was mentioned as a redeemer of the villagers in terms of provision of inputs and markets for coffee. The access is made through the “Specialty Coffee Growers Groups”.Villagers attribute this predominantly to the presence of a specialty-coffee growing program funded by the NGO Technoserve. Though based in the coffee-growing region of Kilimanjaro, Technoserve has expanded membership in the program to villages outside the region, recently opening a chapter of their Association of Kilimanjaro Specialty Coffee Growers (AKSCG) in Mbinga. In 2002, 74 of the 700 coffee producing households in Nyoni became members of the program. In order to qualify, farmers must self-form groups of 25, and develop a business plan. Groups are then selected into the program based on group size, location, and local interest. Accepted groups are given training in best-practice methods to increase output and quality of coffee production. Following the completion of their training, farmers become members of AKSCG and train another group of 25 farmers. As members, they are given access to credit to purchase agricultural inputs, as well as visits from agricultural extension officers from the NGO to inspect their farms to ensure good husbandry practices. Following the harvest, the farmers are guaranteed a market for their crops. Generally the prices for specialty coffee are higher than those for other coffee; for example in 2004, specialty coffee from group members sold at TZS 1900 per kilogram, while other coffee produced in the village by non-group members sold at only TZS 1190 per kilogram. Member farmers also receive additional payments if the price at which the coffee is actually sold on the international market is higher than what the farmers were paid. Being a member of the specialty coffee growers association is seen as a sign of pride and growing prosperity for a farmer. Common boasting in local drinking establishments often includes the claim “You cannot be as well-off as I am. I am a member of Specialty Coffee Growers!” However, judging from the Net Poverty Index (NPI) indicator, Nyoni village does not seem to be one of the communities in the region where residents were more prosperous as the index shows that the Nyoni village is third from the bottom in all 8 communities. The village has a positive NPI of 0.218 and MOP index of 0.342 (See Section 4.3). This is most likely due to the fact that the index is based on a sample of 124 out of 4,282 individuals. 5.1.2 Access to Inputs in Cashew Nuts Production Three of the villages included in the study listed cashews as their main cash crop, Muhuwesi, Muungano and Ndenyende. All three villages experiences similar difficulties to coffee farmers in finding access to pesticides and fertilizers for their crops. Again, due to failures of government sponsors, the local cooperatives failed to provide agricultural inputs to farmers. Again, middlemen limited the profits of those in small villages without reliable access to markets. The Tunduru District Authority established the Tunduru Inputs Trust Fund (TITF) in 2001 to assist farmers with these challenges. Through collaboration with private buyers, the TITF withheld a certain
_____________________________________________________________________
MOVING OUT OF POVERTY: Understanding Growth and Democracy from the Bottom Up - Regional Synthesis Report
34
percentage of the price when the cashew harvest was sold to purchase inputs for the next season. This new system is not, however, without its limitations. In the Muungano village, farmers organized themselves into a ward-level cooperative society to be eligible for TITF. They were then forced to sell their crops to the cooperative society at a set price. Many farmers did not want to do this because the ward cooperative did not pay on time. Also, though a percentage of the price was deducted to purchase sulfur, a necessary input for cashew production, for the next year’s crop, it arrived in the village two months late, after disease had already spread through the cashew farms. Therefore, many people prefer to sell to private buyers, even if they are excluded from the government input funds.
“Last year we received sulfur when the disease had already attacked our cashew nut trees. Instead of getting sulfur in May we received it in July while our money was deducted in October of the previous year.”
Mohamedi Alli Mraima, 38 years man, Muungano “The government through the sin of omission has caused the death of our co-operative unions which used to buy our agricultural products. We sometimes used them as our saving organization. We used to get farm inputs in time and at reasonable price. They gave us inputs on a loan, which is unthinkable of today. I am now far back compared to where I was ten years ago.”
Sita M. Sita, 51 years old man, Ndenyende
5.2 Access to Credit 5.2.1 Access to Credit by Transition Groups Examining the relationship between the percentage of villagers who reported receiving a loan in the last twelve months, and the Net Prosperity Index [NPI] of the village, we see a weak correlation between the two variables. This is also removing Liuli from the analysis, as the decline of the fishing industry causes its NPI to be an outlier in the data (Figure 5.1).
Figure 5.1: Percentage of Villagers who Received Credit

_____________________________________________________________________
MOVING OUT OF POVERTY: Understanding Growth and Democracy from the Bottom Up - Regional Synthesis Report
35
Kikola
Luhindo
Mkalanga
Muhuwesi
Muungano
Ndenyende
Nyoni
0
0.1
0.2
0.3
0.4
0.5
0.6
0.7
0.8
15 20 25 30 35 40 45
NPI
of t
he V
illag
e
Examining the household statistics, the majority of people did not receive credit, with 15.69 percent of movers receiving credit in the last twelve months, 27.78 percent of fallers, 29.17 percent of the chronic rich, and 31.08 percent of the chronic poor. These numbers increase somewhat as the timeframe is extended to the past ten years, with 27.45 percent of movers receiving credit, 30.56 percent of fallers, 44.79 percent of the chronic rich, and 38.51 percent of the chronic poor.
“Getting credit in our village is a dream. If you want credit, you have to go to Tunduru town that is far from our village. Even there, the terms of acquiring the credit are difficult to meet.”
Sita M. Sita, 51 years old man, Ndenyende
“We hear from other places like Mbinga that there are credit facilities but we do not know how to access them and nobody has come to explain this to us.”
Yusta Kayungu, 46 years old woman, Kikolo
Despite this, however, 21 percent of movers, 36.4percent of the chronic poor whose prosperity had improved, and 36.1 percent of the chronic rich whose prosperity had improved borrowed money to expand their income-generating activities, compared with just 12.5 percent of fallers, 14.4 percent of the chronic rich and 17.4 percent of the chronic poor overall. This would indicate that access to credit at reasonable interest rates was important to those that were able to move out of poverty. This is particularly well illustrated by the village of Nyoni, who prosperity has increased in the last ten years. In Nyoni, 60 percent of movers received credit in the past year, likely due to membership in the specialty coffee growers association. These numbers suggest that credit itself is not a necessary criterion for moving out of poverty, but rather the reason that people borrow money is more important. Those who are forced to borrow money to meet expenses after a shock, such as illness, death in the family or poor harvest, are likely to be fallers or those whose prosperity declined. Those who borrow for commercial purposes are not guaranteed success, but there activities are likely to be more profitable than the overall credit numbers would suggest.
_____________________________________________________________________
MOVING OUT OF POVERTY: Understanding Growth and Democracy from the Bottom Up - Regional Synthesis Report
36
The main sources of credit, according to the household questionnaires, are generally either friends or family members. This is less true among movers where only 37.5 percent of loans came from these sources, while the rest came from other sources, such as local moneylenders, traders or shops in the village, community lending groups or formal banks. Fallers received about 60 percent of their loans from friends and family, with only 40 percent coming from other institutions. The chronic rich, which would seem to be in the best position to take advantage of commercial banks and lending groups, did not receive any loans from these organizations. The vast majority of their loans – nearly 80 percent, came from friends and family. The results are similar for the chronic poor, which also received nearly 80 percent of their loans from family and friends. About 30 percent of those who borrow money in the past ten years still owned a portion, with the majority of these (60 percent of total outstanding loans) owed by the chronic poor. The average amount still owed was TZS 27,125 for the movers, TZS 26,700 for the fallers, TZS 53,783 for the chronic rich and TZS 18,705 for the chronic poor. 5.2.2 Lack of Understanding of Credit Schemes Some respondents cited a lack of understanding of the essence of credit schemes as a hindrance to acquiring the necessary inputs. Lending institutions do not see a positive track record in the region and this coupled with the fluctuations in the price for agricultural commodities, means that they are unwilling to make loans. In Liuli, microfinance schemes are ineffective because oftentimes villagers do not properly understand the concept and refuse to pay back loans. This is a particular problem in areas with a history of NGOs providing services for free to villagers. In 1993, the UN Habitat Project provided 10-year loans to improve housing conditions in the village. This was listed by villagers as one of the main reason for an increase in well-being in the village. Now, however, villagers are very upset about plans to confiscate and auction homes of owners that have not repaid their loans.
“HABITAT is good ideologically, because it aims at making people improve their settlements but a thorn to poor people as it raises its price according to the current market price. Many people are now regretting registering for the HABITAT loan.”
Beatrice S. Ndunguru, 55 year old woman, Liuli
In Muungano, however, farmers understand the essence of credit from their experiences with the International Fund for Agricultural Development (IFAD), which had programs in the area from 1998 to 2004, and assert that IFAD did not have any problems with non-repayment from farmers. The focus group expressed that those who did not repay their loans should have their property auctioned if necessary to recover money lent to them.
“If financial institutions do provide credit to business people, why not farmers?… Whoever fails to pay, sell his properties.”
Issa Maviliga, 56 years old man, Sub-Village Chairman, Muungano

_____________________________________________________________________
MOVING OUT OF POVERTY: Understanding Growth and Democracy from the Bottom Up - Regional Synthesis Report
37
This sentiment is echoed by farmers in Ndenyende, who acknowledged that many farmers had sold their cashew crops to private buyers to avoid paying back loans to the local cooperative. They believe that appropriate measures to recover debts should be taken against people who do not pay, or else the cooperative will not be able to provide inputs to the larger community. 5.2.3 Savings and Credit Cooperative Societies Other possible sources of credit in the village include membership in Savings and Credit Cooperative Societies (SACCOS). These are small group lending associations that assist group members in securing agricultural inputs or start-up capital for other small-scale income-generating activities. SACCOS act as an alternative to more formal credit institutions that are lacking on the village level. Despite this, the general lack of understanding of micro-finance and a community lending have limited the scope of these institutions.
We do know of institutional sources that offer loans/credits such as National Micro-finance “Bank (NMB), Mbinga community Bank (MCB) and Equal Opportunity Trust Fund (EOTF) run by First lady. But the problem is that all of these institutions have no branches in our village. We are currently using alternative ways by forming and organizing SACCOS. But the indigenous people here at Liuli are very difficult in joining these SACCOS because they have not yet been sensitized and trained on financial services… Many institutions like banks are well developed in towns and cities where there are better services like water, electricity, security etc than in villages. The government has not yet provided us with experts and/or specialist in advocacy, promotion and education related to microfinance such as SACCOS.”
Alex Chiwenda, 50 years old man, Farmer and Fisherman, Liuli
Nevertheless, those that do understand the SACCOS process have been able to make use of these and the benefits are not only limited to those who have invested in large amount of formal education.
“I am a primary school teacher living in Muhuwesi and I use my membership in the teacher’s SACCOS to take loans. Our Government helps us much; my salary is TZS 167,000, and we have a Teachers’ Savings and Credit Cooperative Society where one can borrow even TZS 500,000 at the interest rate of only 2 percent per year. The SACCOS started in 2002. The entry fee is TZS 13,000 and every month TZS 1,000 are deducted from our salaries.”
Abubar Kitalo, 46 years old man, teacher, Muhuwesi “I am a lifetime farmer with only a primary school education. I am currently a member of the SACCOS in Luhindo, where I also have a small amount of savings. Last year (2004) I was able to obtain a loan of TZS. 50,000 from the society, which I used in purchasing fertilizer. This boosted production levels particularly for maize.”
Silila Mbunda, 35 years old woman, Luhindo 5.2.4 Money Lending/Emergency Credit One of the major limitations of the lack of village-level formal credit institutions is the inability of people to borrow in emergencies. Sudden illness or death in the family can force already vulnerable people to

_____________________________________________________________________
MOVING OUT OF POVERTY: Understanding Growth and Democracy from the Bottom Up - Regional Synthesis Report
38
sell their limited assets, or to borrow from family members or village moneylenders to meet expenses. Also livestock are sold in order to meet agricultural input expenses.
“If you have livestock – like pig, cow, or goats, you can just sell the animal to purchase fertilizer or other important farm implements. These animals are very helpful in this case because when fertilizer and other implements are needed in our farms, we have no crops to sale at that particular time – it is usually not the harvesting season. And because there is no input credit, there has to be something to sell, to raise the money for the inputs – and in most cases, it is livestock.”
Hysant Komba, 25 year old male youth, Mkalanga
The rates charged by moneylenders are generally very high, and considered to be usurious by the villagers. Also, many are forced to borrow against their anticipated cash crop production. They therefore are not left with a sufficient level of crops to make it to the next harvest, and are forced to borrow again. This creates a self-propitiating cycle that forces households deeper into poverty, and has been cited by a number of villagers as a source of increased inequality and a general fall in well-being. Additionally, as noted in the village of a Muhuwesi, it is becoming even more difficult to borrow from moneylenders. As yields and commodity prices decline, lending to small farmers becomes more uncertain. Therefore villagers find it more difficult to borrow and are forced to pay higher interest rates. This is also an issue in the village of Nyoni, where more prosperous villagers lend to poor villagers during the months of December and June, the off-season for coffee buying. They charge very high interest rates and expect payment in cash following the next harvest, with the amount eventually paid sometimes reaching three times the initial value of the loan.
“I borrowed a bull worth TZS 50,000 for the ceremony to end the mourning period of my late mother, but I had to pay TZS 80,000 three months later.
Yokim Thilia, 48 years old man, Nyoni
The practice of borrowing against future yields is called kangomba in the village of Muhuwesi. Despite its detrimental effects on profits, it has become a part of life for many villagers. Although leaders always shout against selling by kangomba, villagers pointed out that sometimes it is inevitable as there may not be any other alternative.
“When one is sick and hence needs cash urgently, when one has no kerosene or when one has no salt, one has to sell one’s cashew nuts by kangomba, if one has the nuts. We know kangomba pushes one down the ladder but it is inevitable if one is in urgent need of cash. In fact about 50 percent of the cashew nuts are sold by kangomba, and about 25 percent of the middlemen
_____________________________________________________________________
MOVING OUT OF POVERTY: Understanding Growth and Democracy from the Bottom Up - Regional Synthesis Report
39
(wachambikaji) who buy crop products by kangomba for selling them on profit later are women.”
Amina Thabiti, 40 years old woman, Muhuwesi
It is interesting to note that lending rates for coping with health shocks were reasonable but usurious for other types of needs, for instance, buying agricultural inputs. This may be implicating the idiosyncratic nature of the health shocks which means that credit markets are more easily available while lending for crops is needed across the community exhausting the credit market. Another explanation could be social aspect of health shocks; friends and relatives are somehow obliged to assist according to the prevalent norms and values.

_____________________________________________________________________
MOVING OUT OF POVERTY: Understanding Growth and Democracy from the Bottom Up - Regional Synthesis Report
40
CHAPTER 6.0: INFRASTRUCTURE DEVELOPMENT AND MOBILITY 6.1 Introduction This chapter deals with availability and accessibility of public services, which include physical, social, and communications infrastructure and access to information. The services covered include: roads and transport infrastructure; presence of electricity; education; health; water; telephone; post office; and access to information through library, and media. Important aspect covered is Access to Services, under which the following issues are addressed:
Availability of the services to the community members, and the major changes over the past
decade. Proximity of the services to the community members—how far the communities are from the
particular services, and how serious a hindrance the distance problem is in accessing the services.
Affordability—how costly are the services to the community members—both financially and in
terms of other barriers to access, for instance, distance (and therefore transport cost), administrative barriers, for instance, lengthy bureaucratic procedures or corrupt practices if any, in service delivery.
Quality of services over time, that is, whether there has been improvement or deterioration of
public services over time.
Gender dimensions in services—whether there are any gender differentials in the above aspects, for instance, whether access is biased against women or any disadvantaged groups in the communities.
6.2 Economic Infrastructure 6.2.1 Rural Roads as a Driver of Growth Broadly speaking there is general agreement by researchers that a positive relationship exists between rural roads investment and pro-poor growth and that growth is associated with falling poverty (Weiss, 2003). The results from the Ruvuma region, however, are mixed. Despite consensus among surveyed groups that roads were essential to economic growth in the region, the quantitative data from household and community level surveys does not strongly support this conclusion. This can be explained by a number of mitigating factors, as well as a small sample size, with only 8 villages surveyed.

_____________________________________________________________________
MOVING OUT OF POVERTY: Understanding Growth and Democracy from the Bottom Up - Regional Synthesis Report
41
Historically, the consensus of researchers working in developing world, particularly India, China, Vietnam, Indonesia and Tanzania indicates that greater impact on poverty reduction would be reached if there were more and efficient government spending in rural roads (Weiss, 2003; Wobst, 1999; Fan et al., 1999). The Commission for Africa Report (2005) also emphasizes channeling aid towards infrastructure development, particularly rural roads. The report notes "...roads put in place in colonial times were primarily designed to transport minerals and other raw materials from Africa interior to its ports for shipping to Europe. They were not designed to link one part of the continent to another and generate more links to the East...." The report further notes, while "...Asia invested in rural roads and power, new crops, science and technology, Africa fell back." Spurring Africa growth requires agriculture and that will not happen without investment in rural roads (Commission for Africa, 2005, cited from Chacha, 2005). Fan et al., (1999) when examining the effects of rural roads on the poor, note that roads improve rural productivity though greater access to markets and provide income directly through wages as causal laborers on construction projects. Studies from Morocco tell us that beneficiaries of improved roads are users of services, especially villagers accessing clinics and other health facilities, students attending schools and people accessing community services. Providers of services benefits because they can introduce new services, save in operational costs, and increase frequency of services. Farmers’ benefit both from better access to fertilizers, pesticides and extension services and better conditions from marketing their produce. Health and education benefit because better accessibility makes it easier to recruit and retain personnel, and to get supplies of medicines and school materials (Chacha, 2005). In Tanzania although rural roads accounts for more than 60 percent of the official road network, they remain underdeveloped and under utilized as only an insignificant portion of the district roads has been paved and all feeder roads remain unpaved (Table 6.1). Rural roads, once constructed, can greatly reduce travel time to regional capitals. In Mkalanga village construction of the Longa – Matiri road was mentioned as a major contributor to upward mobility observed in the past ten years. In 2001, a 17 kilometer long district road was constructed through Mkalanga, connecting Longa and Mapipiri villages. This road reduced the travel time to the district headquarters as the new road was of better quality, more direct (17 kilometers as opposed to 33 kilometers), and did not require passengers to change cars along the route. In Liuli the rehabilitation of the Songea-Liuli road reduced the roundtrip travel time from five to seven days to just one day.
Table 6.1: Tanzania Road Network Condition
Category Paved (km) Unpaved (km) Total (km) Trunk roads 3,830 6,470 10,300 Regional roads 100 24,600 24,700 District roads 30 19,970 20,000 Feeder roads 0 27,550 27,550 Urban roads 470 1,980 2,450 Total 4,430 80,570 85,000 Source: Chacha, (2005).

_____________________________________________________________________
MOVING OUT OF POVERTY: Understanding Growth and Democracy from the Bottom Up - Regional Synthesis Report
42
The qualitative evidence generally supports the findings of the literature. Many respondents list isolation from markets and high transportation costs due to poor road condition as major hindrances to growth. It is therefore surprising that the quantitative data seems to contradict both the literature and the qualitative data. The two communities that were part of road building and rehabilitation programs over the last ten years, Mkalanga and Liuli, showed the highest and lowest values, respectively, for both the overall Net Prosperity Index and the Net Prosperity Index of the Poor (See Tables 4.5 and 4.6). Furthermore, comparison of the mean values of the four indicators do not show any statistical difference for villages that have roads which are passable all year as compared to those which are not. This analysis, in fact, shows that villages that do not have year-round passable roads have higher mean averages of the indices. There are many reasons that could be hypothesized about the seemingly counterintuitive implications of the quantitative data regarding passable roads. The most general argument centers on the fact that high levels of rainfall are correlated both with increased agricultural yields and with impassable roads. In that case, more prosperous higher yield villages would be much more likely to have impassable roads. With regard to the opposite experiences of Mkalanga and Liuli after the building of the new road, it should be noted that the base characteristics of the two communities are completely different. The newly completed road was able to compliment the already positive economic climate of Mkalanga. Profits from coffee liberalization provided villagers with a capital base from which to capitalize on new opportunities. While only a small fraction of people moved across the poverty line, the Net Prosperity of the Poor increased more dramatically than in any other study community. Also, villagers participated in road construction, which provided an additional source of income.
“I have been working with this project as casual laborer almost through out its lifetime. To me the 55 pieces of corrugated iron sheets I managed to purchase from the savings I made from this job is a very important memory, of which I am proud off to mention to people… I thank the project for offering me this job. Today, the roof of my house is made of corrugated iron sheets.”
Alphonce Komba, 25 years old male, Mkalanga
Liuli, on the other hand, experienced a major income shock with the ban of beach seine in 1997. Other sectors, such as commercial agriculture and livestock-keeping were underdeveloped in the village, so a decrease in fishing income had large and far-reaching effects. Additionally, land encroachment into protected areas further strained the economy. In this situation, the downturn of economy reduced the capital available to villagers to capitalize on new opportunities. It would also overpower any upward movement that may have been experienced by Liuli due to the new road.
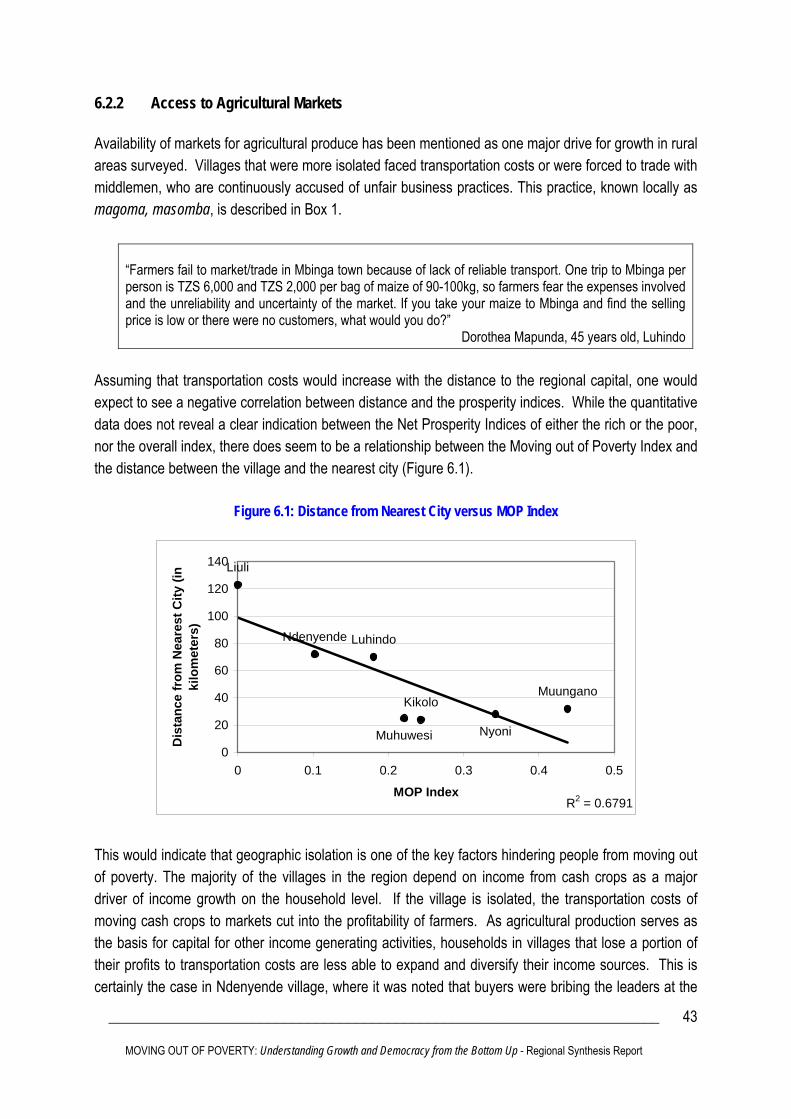
_____________________________________________________________________
MOVING OUT OF POVERTY: Understanding Growth and Democracy from the Bottom Up - Regional Synthesis Report
43
6.2.2 Access to Agricultural Markets Availability of markets for agricultural produce has been mentioned as one major drive for growth in rural areas surveyed. Villages that were more isolated faced transportation costs or were forced to trade with middlemen, who are continuously accused of unfair business practices. This practice, known locally as magoma, masomba, is described in Box 1.
“Farmers fail to market/trade in Mbinga town because of lack of reliable transport. One trip to Mbinga per person is TZS 6,000 and TZS 2,000 per bag of maize of 90-100kg, so farmers fear the expenses involved and the unreliability and uncertainty of the market. If you take your maize to Mbinga and find the selling price is low or there were no customers, what would you do?”
Dorothea Mapunda, 45 years old, Luhindo
Assuming that transportation costs would increase with the distance to the regional capital, one would expect to see a negative correlation between distance and the prosperity indices. While the quantitative data does not reveal a clear indication between the Net Prosperity Indices of either the rich or the poor, nor the overall index, there does seem to be a relationship between the Moving out of Poverty Index and the distance between the village and the nearest city (Figure 6.1).
Figure 6.1: Distance from Nearest City versus MOP Index
Liuli
Luhindo
Nyoni
Ndenyende
Muungano
Muhuwesi
Kikolo
R2 = 0.6791
0
20
40
60
80
100
120
140
0 0.1 0.2 0.3 0.4 0.5
MOP Index
Dis
tanc
e fr
om N
eare
st C
ity (i
n ki
lom
eter
s)
This would indicate that geographic isolation is one of the key factors hindering people from moving out of poverty. The majority of the villages in the region depend on income from cash crops as a major driver of income growth on the household level. If the village is isolated, the transportation costs of moving cash crops to markets cut into the profitability of farmers. As agricultural production serves as the basis for capital for other income generating activities, households in villages that lose a portion of their profits to transportation costs are less able to expand and diversify their income sources. This is certainly the case in Ndenyende village, where it was noted that buyers were bribing the leaders at the

_____________________________________________________________________
MOVING OUT OF POVERTY: Understanding Growth and Democracy from the Bottom Up - Regional Synthesis Report
44
Ward and District levels to make sure that they are not allocated responsibility for buying cashew nuts due to its isolated location. The role of markets and market failure on growth is narrated in Box 2. Information in Box 2 also recounts the case where the middlemen and the rich exploit the poor, resulting in vicious cycle of poverty.
Box 2: Case Study II: MAGOMA, MASOMBA
In Nyoni Village, coffee is grown by about 75 percent of households. Coffee production and marketing in the district, like elsewhere in Tanzania, used to be closely supervised by the Government through parastatal cooperative societies, which supplied farmers with inputs, including pesticides and fertilizers, on credit for coffee production and bought coffee from farmers. Until 1994, this was the practice in the village. However, following trade liberalization policies in the mid-1980s, private coffee buyers were allowed to start buying coffee during the 1994/1995 coffee buying season (July to November). Various companies came to the village to buy coffee. Unlike Mbinga Cooperative Union (MBICU), a parastatal organization that had been buying coffee on credit and at low prices, the private buyers started buying coffee on cash for a higher price of TZS 1,300 per kilo in 1994 while MBICU was buying coffee for TZS 1,000 per kilo in the same year. Coffee growers started scorning MBICU and preferring private buyers to MBICU. Although private coffee buyers were praised for good price of coffee, they were later blamed for: too much fluctuation in coffee prices; buying coffee before it was well processed or dried, not lending inputs to farmers; and not having any mechanism to help farmers save their income for buying inputs.
The first two years of coffee free market had strong positive financial effect on people engaged in coffee growing. After getting the income, many people built better houses and bought livestock, while others started trading activities such as shops and milling machines. Most of the villagers who grabbed the opportunity of the early years of coffee market liberalization rose out of poverty. Men and women benefited almost equally from the increase in income from coffee. This was so because most men built better family houses and some married additional wives. The youth benefited less because only a few of them owned coffee trees.
However, the prosperity brought about by the coffee market liberalization in the village did not last long. Two years later, magoma, which is otherwise called masomba in the Matengo Language, eroded farmers’ efforts to earn much income from coffee. The phenomenon was “born” with the liberalization of coffee market. The term magoma is somehow a plural form for ing’oma, which is a drum in the Matengo Language. Traditionally, among the Matengo, and in many other Tanzanian ethnic groups, when a drum is beaten, everyone is automatically invited and allowed to either dance or watch. Now that private coffee buyers were ubiquitous in the village, the villagers viewed the practice as a drum dance in which every one was free to dance according to the tunes of the drum’s beats (Band Wagon Effect). The practice is also called masomba. In the Matengo Language, masomba is common sunflower. According to the Matengo people, sunflower is weightless. It is the weightlessness that was applied to the practice of agents of coffee buyers using local measurements with deliberate intent to cheat coffee farmers by buying from them more kilograms of coffee for less money. Villagers of Nyoni village complained that one plastic container locally known as dumla, which when is full contains four liters of liquid or two kilos of dried coffee beans, was being equated to only one kilo of coffee by the agents. A bag of 50 kg of coffee was been overfilled so much that it weighed at least 60 kilograms. The farmer got money for only 50 kg while the agent

_____________________________________________________________________
MOVING OUT OF POVERTY: Understanding Growth and Democracy from the Bottom Up - Regional Synthesis Report
45
got 10 kg free after selling the 50 kg to the actual coffee buyer. Thus, the agents were making coffee weightless as sunflower. However, the government intervened and abolished it in 2001, but exploitative practices persisted while changing their style. Now, better-off villagers exploit worse-off villagers by lending money to them or materials, especially food. Before giving them the money or materials, they force them to sign an agreement reading that they have borrowed more money or more valuable materials; thus they add some interest on borrowed cash or item. For instance, if one wants to borrow TZS 10,000 one is forced to sign that she/he has borrowed TZS 30,000. One respondent lamented “I borrowed a bull worth TZS 50,000 for the ceremony to end the mourning period of my late mother, but I had to pay TZS 80,000 three months later” (Yokim Thilia, 48 years, formerly rich but poor during the research). This practice is further enriching the well-off while impoverishing the poor. The lending is normally done when there is food shortage and during coffee buying off-season when the poor hardly have food and money (between December and June). Just after harvesting and during coffee selling season, normally between July and November, even before the prices for crop products are good, the better-off “harvest” from the worse-off what they had lent to them. This practice creates a vicious circle of poverty among worse-off villagers. First, they borrow cash to solve their social and economic problems, such as taking their sick relatives to hospital, getting food, or starting petty trade. Then, when it comes to repaying the loans in cash or in kind, normally just after they harvest, they have to pay about three times what they borrowed. They may remain with too little food to eat until the next harvest, before which they are compelled to borrow again. If a borrower fails to repay in a timely fashion, some of his/her assets are taken away or he/she is arraigned in the primary court. This sometimes results in imprisonment. Magoma benefits the better-off villagers, but this makes other villagers hate the better-off villagers who got wealth illegally through magoma. This was evident during the research: when the researchers were outside the village office in which focus group discussions had been taking place, Suzuki Escudo car passed by. Villagers were heard saying: “Lipeta ligali la magoma”, meaning: “A car that was obtained through “magoma” has just passed by. This implies that coffee buyers’ agents are blamed for exploiting coffee producers.
Narrated by a group of 5 key informants, Nyoni Village, Mbinga District, Tanzania, March 2005 6.2.3 Access to Clean Water The major problem in all the studied communities was access to clean water. Water problems were cited at Muungano, Ndenyende, and Mkalanga communities. However, access to water was mentioned vividly as one of the important factors for growth by Muungano community members (See Table 4.2). One of the major problems that had been disturbing the people of Muungano village was water scarcity. The village is situated far from rivers. Villagers tried to solve the water problem by digging shallow wells but these wells were only a partial solutions as majority of villagers still had to walk long distances to fetch water. Drinking unsafe water from the wells resulted to several outbreaks of water borne diseases such as dysentery and cholera. Many villagers lost their lives due to cholera out breaks. The water problem went on until 1994 when the Danish International Development Agency (DANIDA) came to their rescue. DANIDA helped the villagers by paying the costs of drilling ten (10) deep wells distributed evenly in all locations of Muungano village. The work was completed in 1995. Village leaders

_____________________________________________________________________
MOVING OUT OF POVERTY: Understanding Growth and Democracy from the Bottom Up - Regional Synthesis Report
46
took the advantage of the water project to mobilize villagers to build burnt brick houses, as enough water for making bricks was available. Since people in the village have been building burnt brick houses, the image of the village has been brighter. The problem of water in these communities had explicit gender dimension to it, since the burden was largely born by women and children. Shortage of water affects other important economic activities in the communities, especially agriculture, by using many hours of the important labor force in the households. Thus, another great achievement as reported by the informants in Muungano village was that the time which women and girls used in fetching water has greatly been reduced due to the water project that DANIDA funded. However, it was pointed out that, due to the expansion of the village and the increase in population, the village needs some other ten water wells. The quotes below are voices of the community members regarding the water project:
“After the completion of the water project, the problem of water came to an end, and development in our village increased.”
Adija Sanane, 23 years old female Sub-village Secretary, Muungano.
“People started to live in good brick-walled houses, although some villagers still live in thatch-roofed houses.”
Daimu Kupea, 54 years old male Sub-village Chairman Muungano “Although all the villagers in Muungano village have benefited from the water project it is women that have benefited most from the reduction of time formerly required in fetching water.”
Adija Sanane, 23 years old female Sub-village Secretary, Muungano
In Mkalanga village, lack of clean water was among the factors contributing to the problems of diseases, particularly typhoid fever. The most stubborn disease in Mkalanga community is typhoid fever, which is partly a result of poor sources of water. There is no tap-running water in the village, and the main water source is “shallow wells” which are usually easily contaminated. A typical case of serious shortage of water was found in Ndenyende village (See Box 3). The problem in Ndenyende has contributed to death of some community members who resorted to searching for water sources in the game reserve.

_____________________________________________________________________
MOVING OUT OF POVERTY: Understanding Growth and Democracy from the Bottom Up - Regional Synthesis Report
47
Box 3: Mini Case Study III: Water Crisis in Ndenyende Village
Ndenyende village is faced by a number of bad circumstances that are associated with its geographical location, water being the second in importance after the wild animals. Due to its location, the village has got neither operating shallow wells nor natural streams passing through the village. The closest natural river to the center of the village, where almost all the villagers are clustered, is called Nanyungu which passes to the north of the community and is about 27 kilometers from the village. The water problem causes a number of deaths due to the fact that people have to walk a long distance in search of clean water in the game reserve where they are competing with wild animals for water sources. Those who can not risk their lives in search for water in the game reserve resort to fetching water from the ponds. This water is neither clean nor safe for human uses. As a result, community members are always suffering from dirty water associated diseases like cholera, worms, typhoid and dysentery which is the most prevalent of these medical conditions. The government took an initiative to curb the problem by constructing three shallow wells. However, these wells only worked for two months and they dried out. This is because of poor workmanship. These wells were dug during the rain season when the water table was high. During the dry season, they all dried out. Further, there was a German Non Governmental Organization (NGO) which came with the intention of pursuing a tap water project but they ended by surveying the area only; nothing was done after the survey. It made the villagers thinks that the NGO came to mock them and leave them with their problems. Water scarcity hinders innovation and implementation of some development activities in the village. For instance, members of the community cannot practice irrigational agriculture. Additionally, they cannot build burnt bricks houses, as these activities need a significant amount of water. Water that is being used in the community dispensary is not very clean although the health workers try their level best to sterilize it. According to informants, the case of clean water is ranked as an important cause of negative trends in their well being. Women and girls lose precious productive hours in search of water from the ponds in the shrubs of the community outskirts and in the game reserve.
Narrated by Key Informants, Ndenyende Village, Tunduru District, Tanzania, May 2005 6.3 Social Infrastructure 6.3.1 Access to Primary and Secondary Education Generally, there has been very little improvement in access to social services in the studied communities over the past decade. In some aspects deterioration was noted due to closure of services which used to be provided 10 years ago (Table 6.2). A notable improvement as indicated by 61.4 percent of households is in relation to quality of education and this is attributed to Primary Education Development Plan (PEDP). With regard to basic education, there was a primary school in each community, and one village actually hosted a secondary school. It is worth noting however that, the number of primary schools has not increased over the decade.

_____________________________________________________________________
MOVING OUT OF POVERTY: Understanding Growth and Democracy from the Bottom Up - Regional Synthesis Report
48
Generally, distance is a problem in accessing secondary education, due to the fact that there are no secondary schools in the proximity. Only Liuli community hosted a secondary school at the time of survey. Another important aspect with regard to secondary education is affordability. It was noted during the study that, some households couldn’t afford the cost of sending their young ones to the secondary especially due to failure to pay the school fees. In some cases, the poor parents have failed to pay school fees even for the pupils selected to join secondary school. Due to poor capacity of secondary education in absorbing a big number of pupils who finish primary school (and in particular after the inception of PEDP), the role of vocational training can not be emphasized. It was noted that only one community had a technical and vocational training 10 years ago but it was not functioning at the time of survey. This means that a pool of pupils has nowhere to turn to for further education after finishing primary education. Though, in general, there are no gender disparities in access to education in the studied communities, the high truancy rate of girls deserve attention. For instance, in 2004, a total of 400 girls dropped from primary school in Ruvuma Region and out of these, 201 absconded possibly due o early marriages and 199 dropped due to pregnancy (URT, 2004). Thus, early pregnancies and marriages are major culprit for girls’ dropout.
Table 6.2: Infrastructure Development over the Decade
Infrastructural Attribute Number of Community (10 years ago)
Number of Community (2005)
(A) Physical Infrastructure Daily or weekly markets 1 2 Bus terminal 0 1 Electricity 0 0 (B) Social Infrastructure Community Centre 5 4 Clean water 2 3 Education Primary school 8 8 Lower secondary school 1 1 Upper Secondary school 0 0 Technical or vocational school 1 0 College or University 0 0 Health Doctor 2 2 Nurse 6 6 Public Health Clinic 3 6 Private Health Clinic 1 1 (C) Communications Infrastructure

_____________________________________________________________________
MOVING OUT OF POVERTY: Understanding Growth and Democracy from the Bottom Up - Regional Synthesis Report
49
Infrastructural Attribute Number of Community (10 years ago)
Number of Community (2005)
Public place to use telephone 1 1 Public place to access internet 0 0 (D) Access to Information Public Library 0 1 Post Office 3 2 National Radio 7 8 Community bulletin board 2 4 Local newsletter 0 0 National newspaper 0 1 Television 1 1
6.3.2 Access to Health Services With regard to health, there have also been major improvements over the past decade with regard to establishment of public facilities, but there are some gaps still to be worked out. Six communities had a health facility (dispensary) within their villages at the time of the survey, while only 3 had dispensary 10 years ago. Although Liuli has no public health facility, it is served by a private faith based clinic. The remaining 2 villages (Mkalanga and Luhindo) had no health facilities located in the village. Traditional healers still play an important role in the communities, and traditional birth attendants are still popular in these communities as well. The major gap identified with regard to health services in the studied communities is the issue of proximity, and affordability, which entails, not only the medication costs, but also the other related costs – particularly transport, especially where the patient has to be taken to a hospital – and not a dispensary or a health centre. In the FGDs and life stories, it was pointed out that it was difficult to access medical services because the services are too expensive. This is portrayed by quote from one respondent:
“Hernia, which needs a “simple” surgical operation, weakens men and women who then can hardly work for a long time. Sometimes people commit suicide for lack of cash to pay for such an operation. This happened in 2003 in Chingulungulu Village where a young man hangs himself due to the problem. In his pocket, the following message was found.” “Mshipa huu unaniuma sana kiasi kwamba siwezi kupona. Kwa kuwa baba yangu hataki kunitibisha afadhali nife haraka” meaning: “I am suffering so much from hernia and I cannot recover. Since my father does not want to take me to hospital I better die now.”
Narrated by a group of 8 key informants, Muhuwesi Village, Tunduru District, Tanzania, April 2005
Respondents indicated no improvement in the quality of health services over a decade. The quality was perceived to be bad in half of the surveyed communities, just as it was 10 years ago. Although malaria is a stubborn disease in Muungano, the village dispensary did not have the laboratory services even for malaria testing.
_____________________________________________________________________
MOVING OUT OF POVERTY: Understanding Growth and Democracy from the Bottom Up - Regional Synthesis Report
50
Transport cost was noted as another significant barrier to accessing health services in all communities. Respondents in FGDs indicated that, even in the cases where the household was not supposed to bear much of the treatment costs – as for the case of TB for instance, transport costs and other related costs were very significant, and were hampering access to health services. In Ndenyende for instance, one has to travel to Tunduru (70km), Mbesa (100 km), Ndanda (200 km) or Peramiho (250km) for hospital services. As such, construction and establishment of village health facility was pointed out as one of the two important factors for mobility at Kikolo village. Women FGD agued that life has become easier somehow compared to ten years ago. One of the respondents lamented:
“In the past we walked long distances to reach the hospital in Mbinga or Mbangamao but today we have a Mother and Child Health clinic at the village, family planning facilities, and normal deliveries are done her.”
Jervada Nombo, 36 years old female, Kikolo
In general, no gender disparities were observed with respect to accessing health services, but there is still a gap in maternal and child health in the studied communities. No efforts have been made to introduce mobile MCH (Maternal and Child Health) clinics in the communities, but many women are still relying on dispensaries and traditional providers, which are sometimes costly also. An important point to note is that, even the previously conventional traditional mechanisms dealing with maternal health in the rural communities are actually becoming commercial and thus unaffordable to the most of the households in the communities, and the poorest sections are becoming more and more vulnerable. 6.4 Access to Information Services Poor access to information was noted in the surveyed communities although improvements have been noted in availability of community bulletin board. There is no local newspaper and the national newspaper was accessible to only one village. Another improvement in this area is publication of prices for cash crops and in particular cashew nuts. This is important because in its absence, middle men rip of the farmers. Villagers mentioned that, before this system was introduced, during the harvesting season, most farmers were selling their crops at low prices to the buyers who used to visit them at their farms directly, or home places, taking advantage of information gap to keep the buying prices down. Only one of the surveyed communities had access to public telephone services at the time of survey. A follow up information has reveled that Liuli village has mobile telephone services of late and thus affluent individuals have started the business of charging mobile phones at a fee. The major source of energy for this endeavor is power generators. It must noted that although Liuli was sampled as one of the villages which is isolated from the main district centers it had advantage of been inhabited by Missionaries. Thus, a localized infrastructure was developed by Missionaries. It is worth noting however that, despite the low use of the modern information and communication systems, the interviewed households indicated that friends, relatives and neighbors are the most important source of information about market issues, government programs and other matters pertaining to their livelihoods of the villagers.

_____________________________________________________________________
MOVING OUT OF POVERTY: Understanding Growth and Democracy from the Bottom Up - Regional Synthesis Report
51
CHAPTER 7.0: SOCIAL FACTORS AFFECTING MOBILITY 7.1 Social Stratification Despite some variations in prosperity levels, the social structures in the studied communities in Ruvuma Region do not portray any degree of social divisions. There are no divisions in any of the studied communities due to differences in ethnicity, religion, or social status. The only notable aspects describing social stratification are the characterizations of the different groups as placed by the community members on the ladder of life. The key feature in the characterization across the communities is household wealth, and ability to diversify economic activities. Characteristically, all the eight communities are predominantly agricultural societies. But in these communities, well-off households also engage in other non-farm income generating activities, including trade, while the poorest category (at the lowest step on the ladder) solely depends on crop production and animal keeping for survival. 7.1.1 Wealth as a Stratifying Factor In all communities, the poorest category is the most difficult to move up. This is partly because of lack of productive resources, which in most cases would imply inability to engage effectively in agriculture. The most important asset to the many households in the communities is land, and in the event of a big problem or a shock, the poorest households would resort to selling land, which supports livelihoods. In such cases, the land is bought not by someone from outside the community, but by a community member who belongs to the much higher (wealthier) category in the village. At the onset, this would appear to reinforce inequality in the communities, since due to differential impact of shocks some members in the community are likely to become poorer by giving up their most valuable asset - land – to the wealthier individuals, who consolidate their position. But this was not singled out as a source of division among the community members in any of the communities. The top one or two steps on the ladder of life in all communities are occupied by perceived as wealthier according to the communities’ perspectives. Also, over the study period there was little mobility into these two steps of the ladder of life, as indicated by ladder of life summary statistics. The summary statistics indicate that only about 17 percent of the households moved out of poverty over the study period, while about 66 percent of the households who were poor ten years ago have actually remained poor. Of the households which moved out of poverty, very few in all communities moved into the upper two steps on the ladder over the study period. In Mkalanga, Luhindo, Muungano, Muhuwesi and Nyoni, out of all those who crossed the community poverty line, only one individual in each community managed to move up to the top two steps on the ladder over the past ten years. In Liuli and Kikolo, none of the households, which crossed the community poverty line, managed to move up to the top two steps on the ladder. Despite these little movements to the upper steps of the ladder of life, there are no any divisions resulting from wealth, or social status in any of the communities.

_____________________________________________________________________
MOVING OUT OF POVERTY: Understanding Growth and Democracy from the Bottom Up - Regional Synthesis Report
52
7.1.2 Ownership of Assets and Livestock Small asset base possessed by the majority of the households in the respective communities could explain the little impact that ‘wealth’ has on social stratification in these communities. Out of the 332 households sampled from the 8 communities, only 6 (about 1.8 percent) possessed a car or a tractor during the survey period. This was a slight decline from 10 individuals (about 3 percent) who had a car or a tractor ten years ago. Also, only 5 households (about 1.5 percent) owned motorcycles – down from 7 (about 2.1 percent) ten years ago. Apparently, it appears that very few individuals owned these assets in the communities, yet these assets ownership stand out to be an important characteristic for those households occupying the top steps in the ladder of life. Other assets such as milling machines (diesel engine type), coffee curing machines, generators and water pumps were also mentioned be characteristic of people in the top steps on the ladder of life, but less than one percent of the sampled households had at least one of these assets. Ownership of livestock is also regarded as an important aspect in the community, but few households had animals in these communities. Out of the sampled 332 households, 285 households (about 85.8 percent) did not have a single cow during the study period, and maximum number of cows owned was 28 by only one household in the eight studied communities. In these communities, livestock is a very important form of asset, and it is sometimes seen as some form of “insurance,” providing a fallback position during the difficult times. For this reason, the few individuals with large number of cattle (usually from 4 cows and above as per characterization in the ladder of life) are respected as wealthy in these communities. Although in the FGDs, ownership of any livestock was seen as important, and about 60 percent of the interviewed households own at least a goat or a pig, the statistics on livestock as a correlate of poverty expressed as tropical livestock units do not support the qualitative findings (Table 4.7). This may be explained by the fact that although each household owned at least a small animal, very few households owned cattle (superior type of livestock). 7.1.3 Ownership of Land These assets were cited as indicators of wealth in the focus group discussions, with the owners being placed at higher steps on the ladder of life. But the most important asset in all communities is agricultural land, which is owned by the majority of households. The coefficient on land has a significant positive impact on the poverty status of both poor and non poor groups (Table 4.7). These findings are also supported by the statistics on the household poverty correlates (Table 4.7). The main difference is the size of the farm owned and cultivated, with the wealthier families owning large farms. However, except for the case of Liuli and Kikolo, not all households involved in farming own agricultural land in the communities. In four communities – Luhindo, Mkalanga, Muhuwesi, and Muungano; up to 10 percent of the households work in agriculture but do not own any land. In Ndenyende and Nyoni, between 10 and 20 percent of households work in agriculture but do not own any land. Effectively, this means work as casual laborers in other people’s farms in these communities, and according to the characterization of the transitional groups in the ladder of life, these households fall under the poorest category, and it is difficult for them to move up the ladder.

_____________________________________________________________________
MOVING OUT OF POVERTY: Understanding Growth and Democracy from the Bottom Up - Regional Synthesis Report
53
7.2 Extent of Social Capital Being predominantly rural societies, social capital is very important in shaping people’s livelihoods in the villages that were studied. This is particularly the case due to absence of formal institutions such as credit and insurance institutions. Under such circumstances, networks that bring together relatives, friends and neighbors have a significant role to play in mobility – both of the households and the community at large. Since the villagers know each other very well, cooperation among them is an important aspect shaping their daily lives. Organizations, informal networks, and collective action are the most common forms of social capital that exist in the studied communities. Except for the case of Luhindo, which had no any organization, in all the remaining communities there exist at least one formal or informal group, association or organization that deals with communities’ main economic activity, credit, religious issues, or other social aspects. Only few organizations dealt with the communities’ main economic activities. 7.2.1 Organizations and Informal Networks The responses from community profile indicate that during the study period, 5 communities – Nyoni, Muhuwesi, Kikolo, Ndenyende and Muungano had one organization or association dealing with the main economic activity, which is agriculture. In Nyoni, Technoserve, which is an NGO, brings together farmers, and train them on improved coffee production. NGO encourage farmers to form Specialty Coffee Growers Groups, and supplies the groups with inputs. Also, to ensure market to the coffee growers in Nyoni, Technoserve buys their coffee at good prices. The other three communities Kikolo, Luhindo and Mkalanga communities – had no groups or associations that relate to the communities’ main economic activity. Ten years ago, there were no any groups or associations in 4 communities – Kikolo, Luhindo, Mkalanga and Muhuwesi, while the remaining four communities had one group or association that relate to the main economic activity. Therefore, there has not been very significant change in this type of bonding among the members of the studied communities during the study period, focusing on the main economic activity, which in all communities was agriculture (including crop farming and livestock keeping). This seems to indicate that there is just modest cooperation among the members of the studied communities in carrying out the farming activities, which are the main sources of livelihoods in these communities. The findings from the household interviews also seem to point to the same direction. About 65.1 percent of the households indicated that they do not belong to any organization or association dealing with the main economic activity in their community, whereas 34.2 percent of the households belong to at least one organization dealing with the main economic activity in the community. In all eight communities, only 2 households (about 0.6 percent) belong to 3 organizations dealing with the main economic activity. This is largely a result of the nature of farming activities in these communities, which is usually carried

_____________________________________________________________________
MOVING OUT OF POVERTY: Understanding Growth and Democracy from the Bottom Up - Regional Synthesis Report
54
out at very small scale, and in most cases for subsistence. In this regard, household resources (in terms of manpower and other resources) are in most cases sufficient to meet the needs to perform these activities. A notable type of economic groups is the Ngoro groups famous in Mbinga district. These are made up of 5 to 15 men or women with the objective of helping each other in farming activities. Group members work together in their farms. All of them would work in one member’s farm for agreed days and when complete, they would go to another member’s farm until all of their farms are cultivated. Matengo pits farming system (Ngoro farming) is a famous Matengo traditional land use system, which is known to be effective in checking soil erosion and maintaining soil fertility, thus conserving natural environment. Box 4 describes the Ngoro Farming System.
Box 4: The Celebrated Ngoro Farming System (Matengo Pits) Ngoro farming is a common system used by Matengo tribe in Mbinga District. Due to the existing physical feature in this district the fields are mainly located on steep slopes. It is reported that invasion by other tribes in the past, particularly the Ngonis forced Matengos to surrender the fertile lowland and settle on the mountain tops where gradually land was becoming scarce and infertile. With no cattle to provide manure the Matengos had no choice except continue with their farming on steep slopes. The severity of water run off and other forms of land degradation necessitated the direction of people’s efforts in working out how soil erosion could be contained so as to maintain soil fertility in the new hilly and fragile farmland. Eventually, the Matengos evolved an admirable Matengo pit system, which provide for crop rotation and maintenance for soil fertility by composting grass, weeds and crop residues. The Matengo pit land use system requires only local tools namely, a sickle, hand hoe and an axe. It is performed through a number of stages. Firstly, land is prepared by clearing grass, which is left to dry before it is collected in rows making a grid all over the field. The grid runs across each other such that one set is laid across the slope while the other set runs perpendicular to the slope forming right-angled squares. During the second stage the grass is covered with topsoil, which is exhumed from the square area surrounded by the grass grid and the resulting basins, or depressions are what they call ngoro (pits). After covering grass with soil, sowing is done during the third stage. The fourth stage is performed during weeding where weed rests are placed into ngoro to form compost with accumulating silt. At the end of the season crop residues are also thrown in the pits. The old ridges are split and new ones constructed over the old pits utilizing the composted grass. The new pits are then positioned where the old ridges were crossing. This system is applied until soil fertility start to decline normally measured by declining yields then land is fallowed to natural grass for 1 to 3 years depending on supply of land. The water run off and/or overflow in the respective fields is easily trapped by successive pits thus facilitating soaking as well as effectively controlling soil erosion.
Narrate by Female FGD, Mkalanga, March 2005
Most groupings in the studied communities seemed to have occurred in other aspects of social life, rather than economic aspects. The most prevalent forms of groupings and associations are religious groups, political groups, and women groups. There are few organizations dealing with credit and savings. Also, very few organizations deal with education and health issues in these communities.

_____________________________________________________________________
MOVING OUT OF POVERTY: Understanding Growth and Democracy from the Bottom Up - Regional Synthesis Report
55
Currently, each community had an average of about 5 associations most of which relate to political, social, or religious issues in the respective communities. With the exception of Luhindo, which had no any organization, the community with the minimum number of organizations had 4, while the community with the maximum number had 16 organizations of some form. Nyoni had 8 organizations Liuli had 16, Kikolo had 5, Muungano and Ndenyende had 4, Muhuwesi had 7, and Mkalanga had 6 groupings, and Luhindo had none at all. During the past ten years, the average number of associations per community was 3 and the community with the least number had 2 while the community with the maximum number had 14. This points to increase in the importance of cooperation in economic and social issues during the study period. The most prevalent forms of groupings and associations are religious groups, political groups, and women groups. There are few organizations dealing with credit and savings. Also, very few organizations deal with education and health issues in these communities. It should also be noted that, in most of the surveyed communities the key informants for the community questionnaire did not take in to account the smaller groups and temporary formed groups. For example, there are groups, which are formed on ad hoc basis to cater for emerging problems. Such groups do not last very long. They disappear as soon as the problem has been addressed. Others are so small and localized for the key informants to take note and record. In Mkalanga village for example, there are no big economic organizations that are very popular. However there are many small community based groups, mostly women groups, which seemed to be economically and socially very important. These are usually groups of ten to fifteen women (sometimes four to eight members), contributing TZS 1,000 or 500 each every week for every group member. “Nsango” is the local name for such groups – meaning contributions. Its members help each other on a number of activities, for instance when a member makes local brew others will come and help her carry the product to the sales point. These groups form an important social fabric for the members:
“The aim of the groups is to raise money for daily up keeping of group members’ families such as buying soaps, cosmetics and many others. The money enables us to help one another in case of an emergency. For example, when one of the group members has a problem, she would be the first to receive the contributions.”
Salome Kapinga, 39 years old woman, Mkalanga
The contributions are used to buy clothes for group members and their children, start up small businesses such as buying wheat for bread baking and making buns, buying sorghum for making local brew etc. Once the business has kicked off, one is then able to contribute for others, save and buy important household items for daily upkeeping. Such groups are common amongst women. Although in lion stricken villages (Muhuwesi, Muungano, and Ndenyende) villagers do move together to the farms as a way of protecting themselves against lions attack, each farmer works on his/her own farm after reaching there. No collective action is seen beyond walking together to and from the farms.

_____________________________________________________________________
MOVING OUT OF POVERTY: Understanding Growth and Democracy from the Bottom Up - Regional Synthesis Report
56
7.2.2 Collective Action The responses from all communities indicate that the community members are very likely to come together for collective action in case of any problem in their communities. In the studied communities, there have been at least 2 occasions where the community members came together for communal activity or a meeting. In three communities, the members had come together for about 12 times or more, which is an average of one occasion per month. In the community with the most frequent meetings, people had come together 48 times, which points to an average of 1 occasion per week. The main reason for this trend is the participation by the community members in the collective activities for implementing projects under the Primary Education Development Plan (PEDP). The program was at the peak of implementation countrywide during the year preceding the study. The main activities that the villagers participated include the meetings to plan the implementation of the projects at village level, and construction activities – including fetching water, brick making, etc. The responses in two communities showed that all the eligible members of the community - which is 100 percent, participated in these meetings. Only in one community was the participation about 40 percent, while in the remaining communities the participation exceeded 55 percent. Also, response from 5 communities indicated that the community members would very likely participate in collective work to solve a particular community problem (such as a water problem in the village), while the responses in two communities indicated that it is unlikely that the community members would participate. In one community it was pointed out that the community members are very unlikely to participate in such activities. These findings match to some degree with the responses from the household interviews, which indicated that about 62.7 percent of the interviewed households believe that the community members would come together to solve a community problem such as water problem. Only about 7.8 percent of the households indicated that they thought people in the village would not come together to solve such problem. Collective action was also found to be high in combating wild animals’ problems. Hunting for human eater lions, and crop destructing animals such as monkeys was also done collectively. Another important aspect of collective action is the spirit of helping each other in the community in case of a major problem. About 41 percent of the 332 interviewed households agreed strongly that someone would get help from the community if he/she needed it. In general, about 84.3 percent of the interviewed households thought that someone could get help, while there was a strong disagreement by about 10.5 percent of the respondents regarding this aspect. Also, more about 40 percent of the respondents indicated that there is some degree of mistrust among the community members, and that is why assistance in form of cash may be forthcoming. 7.3 Social Capital and Mobility One aspect of social capital that directly links to mobility is the bonding that links the relatives and friends in the communities. This plays an important role especially in dealing with emergencies such as illness, death and other major shocks. Also, these networks are important in provision of informal credit

_____________________________________________________________________
MOVING OUT OF POVERTY: Understanding Growth and Democracy from the Bottom Up - Regional Synthesis Report
57
in the communities to meet both consumption needs and other needs particularly in meeting education and health costs. At community level, friends and relatives are actually the most important source of credit in all communities. Friends and relatives are the major sources of credit in Mkalanga, Ndenyende, Muungano, and Muhuwesi. In Nyoni, there is also a trader who provides informal credit to the community members, while in Luhindo, Liuli, and Kikolo there are also community credit group/associations. Although only about 28 percent of the households indicated that they had borrowed for regular consumption purposes over the past ten years, the most important source of credit was relatives and friends, and informal moneylenders. With the absence of formal financial services in the respective communities, the informal networks are particularly important in bridging the gap. The networks are particularly important in helping the household to move out of poverty, and in providing a cushion to prevent the household from falling down in case of a major shock. Also, information flow in the studied communities is largely through friends and relatives. As pointed out earlier, the interviewed households indicated that the most important source of information about market issues, government programs and other matters pertaining to their livelihoods are actually friends, relatives and neighbors.

_____________________________________________________________________
MOVING OUT OF POVERTY: Understanding Growth and Democracy from the Bottom Up - Regional Synthesis Report
58
CHAPTER 8.0: EFFECTS OF GOVERNACE ON MOBILITY 8.1 Introduction Local democracy and governance were among the key political factors investigated by this study. The objective was to find evidence on whether or not the two political factors are important for mobility at the community or household level. Thus, this section presents an analytic narrative on effects of local democracy and governance and/or political factors on mobility. Local democracy refers to presence and fairness of elections at the lowest level of governance. Conditions and processes surrounding nomination of political candidates, election campaigns and election of political leadership are therefore relevant. It also encompasses the voice and participation and influence in the election and political process. On the other hand, governance refers to the legitimate exercise of authority for public good. Good local governance is characterized by lower corruption and more equal access for all. 8.2 The Functioning of Local Democratic Institutions 8.2.1 Elections The analysis of community data reveals that all the 8 surveyed villages acknowledge that elections for leadership were conducted in the neighboring villages. However, while 7 of the villages noted that elections in the neighboring communities were fair, respondents in one village believed the elections in the neighborhood were not fairly conducted. Regarding elections for representation of community at next higher level of the administrative structure, that is, the wards and divisions, the findings show that 7 surveyed villages confirm that elections were conducted, but only 5 of the villages acknowledge that they were fair. The remaining 2 villages noted some irregularities during the elections at this level of the administrative structure thus categorizing the process as unfair. The community members perceive that they are living in a more democratic society today than 10 years ago as exemplified by a more pronounced campaigning during the election period. For example, it was evident in all the surveyed villages that the villages are more democratic today than in the past. In Liuli and Kikolo villages, participation in decision-making was seen as an important attribute for democracy to work out. Members indicated that in their community politicians and other leaders are elected democratically through voting and they consider candidates of good character. During the campaigns the contestants have to convince voters on what they shall do for their community. People are more active today in terms of participation in elections despite the fact that attempts to influence the results through both legal as well as illegal means are also common. In many cases influential individuals at community levels are used by contesting candidates to influence results in their respective constituencies. Despite these anomalies, in most cases, people vote for the candidates that

_____________________________________________________________________
MOVING OUT OF POVERTY: Understanding Growth and Democracy from the Bottom Up - Regional Synthesis Report
59
they wish to vote for. At village level, people also participate in village assembly and other village committee meetings to make important decisions for the community. All the 8 surveyed villages acknowledged that there has always been an elected leadership in their neighboring villages whose elections were generally fair. They also noted that elections for representation of community at next level of the administrative structure, that is, the wards and divisions are fairer toady than they were in the past. This was unanimous sentiment held by all the 8 surveyed villages. Overall, 297 out of 332 households (95 percent of respondents), which responded to the question on perception of fairness of the last election, felt that last elections were fairer and freer. Only 5 percent thought the elections were unfair and not free. In terms of the process for selecting neighborhood leadership by election, there has been no change over the last ten years. Regarding the election process at the next administrative level, however, the findings show that election and therefore democratic institutions at higher levels have experienced some improvement in the ten-year period. Judging from the last election process, there is more democracy today than 10 years before. Two more important policy issues can be drawn from the election processes in the surveyed communities. Firstly, it is important to note that the process of election (from the election of candidates within one party to the general election) is to a certain extent influenced by influential individuals who have interest in and who are somehow linked to the respective (contesting) candidates. In other words, a contesting candidate will start by identifying strong and influential individuals within communities. Afterwards, efforts will be made to win their confidence and support with the intention to use them during campaigns for mobilization of votes or voters. In many cases such networks are associated with flow of financial resources from contestants to facilitate campaign strategies. Obviously, financial resources become a significant factor influencing voters. Some of the candidates are subsequently overwhelmed by supporters and therefore votes while others with weak strategies may find themselves starving for votes. To a certain extent, such campaigns tend to distort the real choice of the people as voters are sometimes forced to elect leaders who are not really their first preference. There is therefore a need to improve performance of the electoral institutions by scaling up voters education. 8.2.2 Voice and Participation Voice and participation of the members of the community has been captured by several variables in the survey instruments. These include representation in the village councils, access to different forms of media, membership in various groups and associations and the degree of freedom. The findings generated through community questionnaire show that, all governments in the surveyed villages and the neighboring communities were running through councils 10 years before conducting this survey. This was verified by 7 out of 8 communities which were interviewed. One community did not respond to the question. The women representation in the village councils however was insignificant as

_____________________________________________________________________
MOVING OUT OF POVERTY: Understanding Growth and Democracy from the Bottom Up - Regional Synthesis Report
60
all responses by 7 surveyed villages show that, women representation in the village councils was between 0 and 28 percent. This implies that, there were villages with no representation of women. Judging from the responses by 7 villages, there was a fair representation by religions, ethnic groups as well as the major languages in the respective communities, despite the fact that only 30 percent of the council represented the poor according to responses by the key informants of the respective villages. In terms of accessibility to various forms of media, the findings show that there is an insignificant improvement. There almost used to be no form of media available in the 8 surveyed communities 10 years before this survey was conducted. The only notable media out of the 6 forms of media mentioned during this enquiry was the National Radio Station which was broadcasting in 7 out of the 8 surveyed villages (See Table 6.2). In addition, a total of 18 political groups and associations existed in the surveyed communities 10 years before the survey, out of which the political groups were the most important ones. Regarding peoples’ freedom to voice their views and beliefs as well as their freedom to media, the findings through information generated by the household questionnaire show that, there was limited freedom 10 years before the survey. Opinion and perception by approximately 60 percent of the 332 sampled households in the surveyed communities show that, people in Tanzania did not feel free to express their views and/or criticize the government. Only 40 percent of the household felt Tanzanians had freedom to criticize the government and say what they wanted. Likewise, about 55 percent of the 332 household feel that people could not openly talk about problems that they believe affected their communities. However, about 79 percent of the households believe people felt free to openly express their religious beliefs in the country. The households’ opinion about freedom of media reveals that in the past (10 years before the survey), there was limited freedom of media. The findings show that about 60 percent of the 332 households supported this claim. These were not the only limitations during this period, the freedom to form and participate in groups and associations was also limited as more than 60 percent of the 332 households do not think people were free to form groups or associations without prior government approval. There has been a notable change in terms of participation in important community decisions between the two reference periods. In Nyoni Village for example, members of men and women FGDs agreed that democracy had increased compared to 10 years previously. Women gave an example of the number of women councilors in the village government that had increased. Men gave an example of the multiparty system that had so developed that people of different political parties in the village were discussing together plans for development activities without quarreling. During the next ten years they hoped that democracy would increase even more. Compared to 10 years ago people in the community have more access to local networks, groups and associations. Over the past 10 years, the ability of community members to contact the local government authorities and influence its actions has increased. One of the policy drives in the 1990s is the

_____________________________________________________________________
MOVING OUT OF POVERTY: Understanding Growth and Democracy from the Bottom Up - Regional Synthesis Report
61
introduction of multiparty. This has been linked to greater freedom, democracy and even power at community level. People are now involved in decisions pertaining to their own development. However, personal freedom was found to be unevenly distributed on account of male predominance in household decision-making and the increased inequality in wealth. In Liuli village, the key decisions are made by the people through village meetings and village committees. Decisions made by the people have always been respected by the village government. Leaders are democratically elected after they have campaigned and convinced people that they have realistic plans and policies for the community. Membership to all community organizations operating in the village is open to all. The project coordinators have been promoting and sensitizing members of the community to join the programs through groups. Thus, members of the community are encouraged to actively participate in different networks and therefore they have access to important organizations and networks in the village. Over years the decision making process has gradually been changing in favor of participatory decision making approach. The findings show that out of the 8 surveyed villages, 6 villages feel that decisions on important community affairs are made with the participation of majority community members. In terms of participation and involvement of the community in design and implementation and management of important development projects, the findings indicate that only 1 village out of 8 surveyed villages and the neighboring communities have once been involved in design, implementation and management of important development projects in the respective villages over the past 10 years. The changes in the performance of democratic institutions over the past 10 years have had a notable impact. At least 5 out 8 villages confirmed that the changes in local democratic functioning had good impact on the community, and the ability to contact the local government machinery and influence actions has changed significantly judging from the responses of the 8 interviewed communities (5 out 8 supports this claim). The findings are also supported by a qualitative analysis made earlier. For example, the perception of Liuli members of the FGD shows that the three attributes most important for democracy to work are corruption, voters’ education on electoral process, democracy, and transparency. People are aware on the existing link between democracy and development (and/or welfare of the people). Where democracy does not exist they believe, chances for social as well as economic crisis are higher, because there will be no interaction (and/or networking or contact or communication) between the leadership and people (who are the key stakeholders and implementers of different plans and strategies). Villagers in Liuli gave an example of the successful implementation of the Primary Education Development Plan (PEDP). According to Women FGD in Liuli, the local government is closer to the people today than it used to be 10 years ago. There are no serious or complicated steps to accomplish to get a permit to start a business. As far as the village government is concerned, one does not need to go through the village government office to be able to start or expand the business. Thus, one can start business on his own. This is partly the outcome of the Local Government Reform Program where there is a gradual decentralization and efforts to build capacity and empower the local level actors.

_____________________________________________________________________
MOVING OUT OF POVERTY: Understanding Growth and Democracy from the Bottom Up - Regional Synthesis Report
62
Table 8.1 presents changes over the span of 10 years in relation to presence of village councils and representations of women, the poor, religious denominations, ethnic groups as well as the major languages used in the communities. As can be depicted from Table 8.1, 7 governments of the surveyed villages and the neighboring communities were running through councils 10 years before this survey, while by 2005 all the 8 villages and the village governments in the neighborhood were running the village councils. The women representation in the village councils however was insignificant as all responses by 7 surveyed villages show that, women representation in the village councils was between 0 and 28 percent 10 years before the survey. This implies that, there were villages with no representation of women in the past. The women representation improved significantly by 2005 where between 12 and 32 percent of the council members were women.
Table 8.1: Change Over the Study Period: Voice and Participation
Attributes and/or Indicators 10 Years Before the Survey The Survey Period (2005)
Presence of the Village or Neighborhood Council 7 8 % of Council Women Council Members 0 to 28 12 to 32 Communities with representation of Religious, Ethnic and Language groups 5 7
Representation of the Poor (%) 32 to 40 48 to 90
About 5 villages felt to have a fair representation by religions, ethnic groups as well as the major languages in the respective communities in the past, while during the period of survey the number of villages with fair representation went up to 7. Likewise, the representation of the poor has changed from the range of 32 – 40 percent to 48 – 90 percent between the two periods, which is also a significant improvement.
Table 8.2: Political Parties and Associations
No of Political Parties and Associations No of Villages No of Political Parties and
Associations No of Villages 10 Years Prior to the Survey Currently (2005) 3 4 3 1 4 1 4 1 5 1 5 2 6 2 6 2 7 0 7 2 Total = 18 8 Total = 21 8 The total number of political parties and associations in the 8 surveyed villages has increased by nearly 20 percent from 18 in the past (10 years before the survey) to 21 in 2005 despite the fact that many communities in the district have witnessed closure of many primary societies in their localities following the collapse of the cooperative movement in the country and particularly the dissolution of Mbinga Cooperative Union (MBICU) in Mbinga District. The increase in number of political parties and

_____________________________________________________________________
MOVING OUT OF POVERTY: Understanding Growth and Democracy from the Bottom Up - Regional Synthesis Report
63
associations is partly the outcome of political pluralism (Table 8.2), which allows formation of more political parties. Regarding the importance of political parties and associations, Table 8.3 reveals that throughout the 10 years period the ruling party Chama cha Mapinduzi (CCM) has been the most important party as it has members in all the surveyed villages. The ruling party is followed by Primary Cooperative Societies, which reportedly used to operate in 4 out of the 8 surveyed villages. Obviously, the number of active primary societies declined to 2 by the time this survey was conducted, following the dissolution of MBICU. Obviously, the number of primary cooperatives was expected to decline as most of the cooperative unions collapsed as a result of liberalization of the agricultural marketing.
Table 8.3: Important Associations in the Surveyed Communities
Sn Political Parties and Associations
No of Villages
Political Parties and Associations No of Villages
10 Years Prior to the Survey Currently (2005) 1 CCM 8 CCM 8 2 Primary Cooperative Societies 4 Primary Cooperative Societies 2 3 BAKWATA 1 BAKWATA 1 4 Liuli Anglican Church Dioceses 1 Msasi Chama 1 5 Youth Religious Group 1 Mungi Fishing Group 1 6 SACCOS 1 SACCOS 2 7 NCCR-MAGEUZI 1 SAMA 1 8 TADEA 1 CHADEMA 1 9. NCCR-MAGEUZI 1 10. TADEA 1 11. CUF 1 12. TLP 1 Respondents were also asked whether the village and the neighborhood have access to different forms of media during the two reference periods. The response shows that, there has been a little improvement overtime as only accessibility to a few media has changed favorably. For example, while only 2 villages had community bulletin board 10 years before the survey, in 2005 more villages had the bulletin board. About 80 percent of the interviewed households are generally confident that Tanzania is governed for the interests and benefits of all the people and, 93 percent of the households are generally satisfied with the way democracy works in the country in general as well as at local government level. The households’ confidence levels against different types of authorities in terms of serving the interests of all the people rather than in their own narrow self-interest are reportedly equally high. The percentages of households which felt confident with the respective types of officials in bracket are 96 (Local Government Officials), 85 (State/National Government Officials), 74 (Local Politicians), 79 (Traditional Village Leaders), 85 (Doctors and Nurses in the Health Clinic), 64 (Police), 59 (Judges and the staff of Courts and 54 (the staff of NGOs).
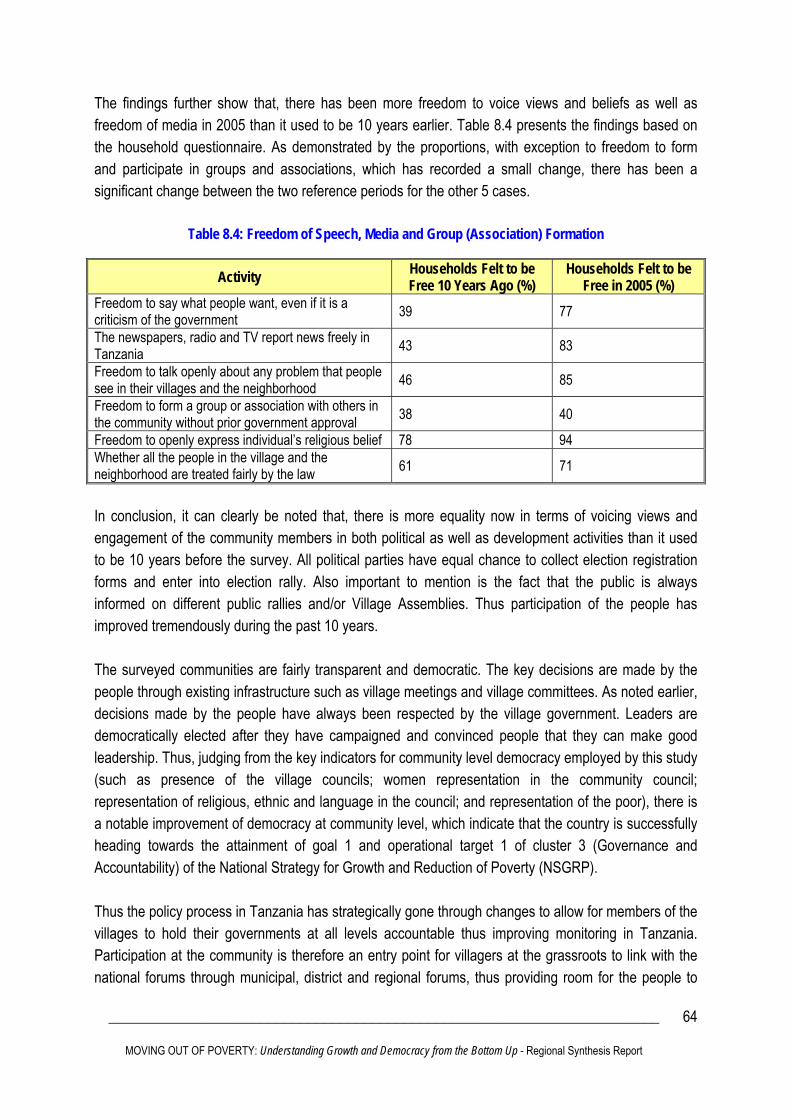
_____________________________________________________________________
MOVING OUT OF POVERTY: Understanding Growth and Democracy from the Bottom Up - Regional Synthesis Report
64
The findings further show that, there has been more freedom to voice views and beliefs as well as freedom of media in 2005 than it used to be 10 years earlier. Table 8.4 presents the findings based on the household questionnaire. As demonstrated by the proportions, with exception to freedom to form and participate in groups and associations, which has recorded a small change, there has been a significant change between the two reference periods for the other 5 cases.
Table 8.4: Freedom of Speech, Media and Group (Association) Formation
Activity Households Felt to be Free 10 Years Ago (%)
Households Felt to be Free in 2005 (%)
Freedom to say what people want, even if it is a criticism of the government 39 77
The newspapers, radio and TV report news freely in Tanzania 43 83
Freedom to talk openly about any problem that people see in their villages and the neighborhood 46 85
Freedom to form a group or association with others in the community without prior government approval 38 40
Freedom to openly express individual’s religious belief 78 94 Whether all the people in the village and the neighborhood are treated fairly by the law 61 71
In conclusion, it can clearly be noted that, there is more equality now in terms of voicing views and engagement of the community members in both political as well as development activities than it used to be 10 years before the survey. All political parties have equal chance to collect election registration forms and enter into election rally. Also important to mention is the fact that the public is always informed on different public rallies and/or Village Assemblies. Thus participation of the people has improved tremendously during the past 10 years. The surveyed communities are fairly transparent and democratic. The key decisions are made by the people through existing infrastructure such as village meetings and village committees. As noted earlier, decisions made by the people have always been respected by the village government. Leaders are democratically elected after they have campaigned and convinced people that they can make good leadership. Thus, judging from the key indicators for community level democracy employed by this study (such as presence of the village councils; women representation in the community council; representation of religious, ethnic and language in the council; and representation of the poor), there is a notable improvement of democracy at community level, which indicate that the country is successfully heading towards the attainment of goal 1 and operational target 1 of cluster 3 (Governance and Accountability) of the National Strategy for Growth and Reduction of Poverty (NSGRP). Thus the policy process in Tanzania has strategically gone through changes to allow for members of the villages to hold their governments at all levels accountable thus improving monitoring in Tanzania. Participation at the community is therefore an entry point for villagers at the grassroots to link with the national forums through municipal, district and regional forums, thus providing room for the people to

_____________________________________________________________________
MOVING OUT OF POVERTY: Understanding Growth and Democracy from the Bottom Up - Regional Synthesis Report
65
participate in the policy process in Tanzania. The quality of exchanges between the community members and their governments at different levels has reached a higher platform recently as the two sides appreciates the attitude and effort by each other. Community members are starting to appreciate local government efforts in widening the participative process in generating plans and programs so as to make them more effective. Reciprocal recognition by local government of local members’ positive attitude and contribution is enhancing and building the mutual trust and confidence. Openness by people is gradually not taken as a hostile stance as it used to be in the past. It is also worthy noting that still there is ample room for improving and strengthening democracy and democratic institutions in the communities of Tanzania despite of the notable improvement in the past. As we shall see later, among the critical areas for policy intervention are voters’ education on democracy and electoral process, improve local level functioning of governance because it is not only inter-related to democracy, but has also been conflicting and therefore undermining the positive impacts achieved through improved indicators of democracy at local level (See section 6.3). 8.3 Presence of Governance and its Functioning at Local Level The concept of governance appears to have been taking roots in recent years in most communities of Tanzania. It is generally translated around the government’s competence in governing the society. Governance issues that feature prominently in FGDs and life stories include human rights, security, theft, corruption and high tax rates. In some cases, village governments have been blamed for embracing corruption and failing to eradicate theft in the communities and failing to institute a fair and anti-corruption mechanism. Sometimes, village governments have been blamed for charging too much tax from the business community than necessary. These factors have contributed to downfall or stagnation of well fare of respective community members. In assessing the extent of functioning of local governance a number of indicators have been considered. They include service delivery, law and order, corruption and availability and access of coping mechanism as well as safety nets in the respective communities. Generally, a number of indicators, which were employed in testing the functioning and effectiveness of governance, also indicate unsatisfactory results (Table 8.5). In Liuli Village for example, the hospital services during the past 5 years have been deteriorating drastically due to poor management and poor governance. A number of heath workers are leaving the place. Majority of the workers are almost in desperation due to poor working conditions, poor governance and lack of incentives. One member of the key informants in Liuli Village wrapped it all by saying:

_____________________________________________________________________
MOVING OUT OF POVERTY: Understanding Growth and Democracy from the Bottom Up - Regional Synthesis Report
66
“Decision making process is too bureaucratic and takes too long unnecessarily. Higher authorities ignore our voice. Nobody wants to take action and/or investigate on our complaints. The services at the Liuli Missionary Hospital, which is under the management of the Diocese, are extremely poor and have deteriorated very fast in the past 5 to 10 years due to conflicts of interests of some members in the management. The poor people at the lower class are the ones who suffer most. Just to give you a few examples of what has transpired! This hospital used to operate 5 motor vehicles – but today there is only 1 car. There was a Vocational Training Center where carpentry and fishery courses used to be offered and graduates were awarded a Full Technical Certificate (FTC). The courses are no longer running and the buildings are almost collapsing now. Likewise, Liuli hospital used to offer a one year nursing course in the past. The course is no longer running and all tutors have joined other more serious employers. A number of efforts have been made to reach and inform the higher authorities since 2003 when the situation began to worsen. However, since then neither a response nor action has been taken to address these anomalies.”
John Nyirenda, 58 years old man, Liuli
In addition, when people were asked about safety from crime and violence in their homes, 4 out of the total sampled villages confirmed that, it is very safe while 2 villages said it is moderately safe and the remaining 2 indicated that it isn’t safe in their communities and the neighborhood. On security and safety when walking down the streets alone after dark, 5 out of 8 villages confirmed that it is safe while 3 villages were not optimistic about peoples’ safety. In terms of crime and violence against girls and women, majority feels they are uncommon and unpopular events in most of the communities. Note also that more than 61 percent of the population in the sampled communities was treated fairly by law. Initially, there was low level of trust on local as well as central government officials as only 29 and 33 percent of the households had trusted the local and central government officials respectively, despite the fact that 5 out of the total sampled villages were running public works that also hired residents in need of work. The functioning and therefore impact of governance between the two reference periods in the surveyed villages have more or less remained the same, despite the fact that other indicators show some improvement. Put it differently, there has been an insignificant change and/or improvement in terms of governance judging from some indicators employed by the study to assess the efficacy of governance in the local communities. A notable improvement is only seen in delivery of educational services. Four communities indicated the quality of education to be very good compared to none 10 years ago. Quality of education was termed to be bad by five communities 10 years ago. These achievements have been attributed to the Primary Education Development Plan.

_____________________________________________________________________
MOVING OUT OF POVERTY: Understanding Growth and Democracy from the Bottom Up - Regional Synthesis Report
67
Table 8.5: Change in the Functioning of Governance
Selected Governance Indicator 10 Years Ago 2005 Rating the quality of Education Available in the Village and the Neighborhood Very Good 0 4 Good 1 3 Okay 2 1 Bad 5 0 Rating the quality of Health Care Available in the Village and the Neighborhood Very Good 2 0 Good 1 3 Okay 1 0 Bad 2 3 Safety of the Community Very Safe 1 1 Safe 4 5 Neither Dangerous Noir Safe 2 1 Very Dangerous 1 1 The Extent of Corruption of Government Officials/Civil Servants Almost None 2 0 A few 1 6 Most 3 1 Almost All 3 1 Proportion of Government Officials/Civil Servants who Take or Demand Bribes Almost None 2 3 A few 3 5 Most 2 0 Almost All 1 0 Crime, Violence and Safety Very peaceful 4 4 Moderate Peaceful 1 3 Moderately Violent 3 1 As we shall see in the succeeding section, the governance structure in Mkalanga village for example, has directly been suppressing voices of the people deliberately to protect and hide the evils. The vertical integration and/or relationship of governance are poorly structured, as it does not allow the smooth flow of information in the governance chain. A huge governance gap existing at local level between Mkalanga village and District Council is a clear testimony to this claim. 8.4 Governance and Community Prosperity As noted earlier, measures of governance have generally indicated a poor functioning of governance at community level in Tanzania. The changes overtime have also been insignificant. The Local Government plays a critical role in the day-to-day administration of the community. In case of disputes, stages to be followed are from the Chairman of the hamlet, then to the Village Executive Officer (VEO), all the way to the Ward Council. However, in many cases there have been breakdown of the

_____________________________________________________________________
MOVING OUT OF POVERTY: Understanding Growth and Democracy from the Bottom Up - Regional Synthesis Report
68
government administrative machinery in responding the voices of the people, and several malpractices have bee cited. The following cases substantiate these claims. 8.4.1 Collection of Levies Despite the abolition of levy on petty businesses, bicycles, livestock, development tax etc since 2003/04, tax collectors have sometimes been a hindrance rather than a motivation towards business expansion in some of the surveyed communities. When tax evaders are captured in Liuli village, an arbitrary cumulative tax (which is relatively high) will be imposed against them. There are cases where such punishment is applied to all other businesses on the pretext that they also practice tax evasion. In addition, the business community in the village is unhappy with the current flat rate of TZS 35,000 against each business entity regardless of the size as such tax structure has tended to discourage small businesses and favor large scale businesses. Unfortunately, there are no clear rules and regulations when it comes to imposing levies. Decisions on levels and multiplicity of levies have not been consistent over time. In most cases, the levels of levies are perceived as being substantially high. 8.4.2 Embezzlement of PEDP Funds Political factors namely democracy, governance, voices and participation have played a significant role in fostering productivity and growth indirectly towards community prosperity. However, it is important to note that, the link is not a one to one relationship. The study findings show that, there are cases where political factors have helped to attain community prosperity. However, in other few cases bad governance has hindered the initiatives towards attainment of community prosperity. Demolition of a building hosting 2 classrooms and 1 staff room on the pretext that a new modern building will be constructed under Primary Education Development Plan (PEDP) in Mkalanga village is a typical example of governance factors impeding prosperity of the community. A poorly instituted administration of the PEDP finances permitted a Mkalanga Primary School Head teacher to forcefully dominate the show, thus, the PEDP resources were embezzled openly while the voices of the people through Mkalanga Primary School Committee are suppressed. Reaction of the head teacher when committee members reminded him to convene meetings and abide to the financial regulations was discouraging.

_____________________________________________________________________
MOVING OUT OF POVERTY: Understanding Growth and Democracy from the Bottom Up - Regional Synthesis Report
69
“Meetings do not help us at all. How many meetings have you attended in the past? How many classrooms did you get out of those meetings??? Nothing! Literally Nothing! Why should we continue to meet when nothing comes out of such meetings? We have PEDP in place and our classroom is under construction. That is what we need. Let us wait and finish this important work. I am the head teacher and the only one in the village. No one can go beyond the authority and powers I have. I am your expert—you have to listen to me. When the project fund is remitted it comes to me. No one else is supposed to know except myself and my inspectors and I am the one who talk to them and answer their questions!!!!.”
Narzis Komba, 57 years old man, Chairman of the Village Primary School Committee, Mkalanga Thus, there are growing apathy, disappointments and loss of confidence following such factors and poor response of higher authority especially the District Council to such sensitive issues, which are repeatedly reported. Demolition of such classrooms and failure to construct others means that fewer children will be able to join primary school. A number of times, the new Mkalanga Primary School Committee members have documented the two cases and take them to the higher authorities including the District Education Officer (DEO) and the District Executive Director (DED) so that they can intervene by way of following up the matter without any success. The response of higher authority has frustrated and discouraged the villages particularly because issues which villagers believe they are serious – they are treated as minor issues at district level. There is therefore a huge governance gap at local government between Mkulanga village and District Council. The village has other cases which are for the District Council but villagers feel they will waste a lot of time to communicate and travel without getting feedback. 8.4.3 Theft Incidences The growing incidences of theft in the mid-1990s, failure of governance machinery to act and peoples decision to deal with the culprit are also clear evidence of hindrance and catalyst of political factors towards community prosperity. One major event in Mkalanga village is the insecurity due to theft incidences that persisted almost throughout 1990s. The leader of these illegal activities was known – a native of the same village, and most of his allies were also very familiar faces in this community:
“When ever they learned that you have sold large amount of coffee they would invade your house the same evening or the next day – It was horrible!”
Narzis Komba 57 years old man, Chairman of the Village Primary School Committee, Mkalanga In December 1999, the thieves stole goats from the neighboring village, which they brought to Mkalanga for slaughtering and “feasting.” Some villagers saw them and communicated the information to neighboring villagers and village government. The villagers mobilized themselves and attempted to arrest the leader and his gang. But the leader escaped, and it was only other members of the gang who

_____________________________________________________________________
MOVING OUT OF POVERTY: Understanding Growth and Democracy from the Bottom Up - Regional Synthesis Report
70
were arrested and handed over to the police in Mbinga. But the villagers took a step further. They stormed into the leader’s home, and ordered the wives and children out of the house. They then demolished and set fire to the houses owned by him to make sure that this thief does not return back to his headquarters again. Fortunately, two months later, the leader was arrested by the police force in Mbinga following armed robbery incidence, which was also associated with murder. This brought to an end the era of horror and insecurity in Mkalanga. People resumed their normal lives. Premature harvesting of maize is no more in this village. This is an example of a positive link between democratic factors and members’ participation on one hand and community prosperity on the other, as security and peace are important factors for a favorable investment climate in the community and therefore productivity and growth. The findings clearly indicate that people are aware on the existing link between democracy and development (and/or welfare). Where democracy does not exist the chances for social as well as economic crisis are higher, because there will be no interaction/social coherence (and/or networking or contact or communication) between the leadership and people who are the key stakeholders and implementers of different plans and strategies. 8.4.4 The Threat of Wild Animals In the three villages surveyed in Tunduru District (Ndenyende, Muhuwesi, and Muungano), the major threat to security and life of the villagers was neither theft nor assaults but wild animals and in particular lions. The two villages are located near the Selous Game reserve. Interferences from wild life are very common in these villages. People lose their lives and tamed animals like goats and even dogs are frequently killed. Wild life invasions have had a negative affect on the welfare of the community members and have made life very uncertain. One is not sure of seeing the sun the next day because at any particular time one may be attacked by a lion and be killed. The crop harvests are also uncertain. Wild animals like elephants, wild pigs (warthogs) and baboons destroy crops such as paddy, maize, bananas, etc., which are the major source of food and among the major sources of income to the community members. Further, the problem of wild animals can make an individual stay idle because one can not go to the farm alone. Villagers can’t go to the farms early in the morning as the farms are far from the village and they are afraid of being attacked by the wild animals along the way.
_____________________________________________________________________
MOVING OUT OF POVERTY: Understanding Growth and Democracy from the Bottom Up - Regional Synthesis Report
71
“Look here! We have to organize for the journey to our farms although everybody has got his own plot, you can not go alone and if it happens that you want to go to the farm while your neighbor has planned for another economic activity like brewing you have to cancel the trip and stay home idle for the whole day. That means one can’t plan for his/her own activities but rather needs to liaise with other community members for accompaniment walking to the farms.”
Iweni Rashid, 60 years old man, Ndenyende “Threat of the wildlife especially from lions is a major problem in Ndenyende village. Several cases of lions hurting and killing people and livestock have been reported to the district authorities at Tunduru District headquarters but nothing has been done. In our village a man was killed by a lion in February 2004. In Namakungwa Ward a lion also killed another person in 2004. In 2004, in Matemanga Ward, a lion was killed by angry villagers who eventually ate its meat although under normal circumstances we do not eat lions.”
Hassan Shaibu, a male farmer, Ndenyende
As a result of wild animals’ threat:
• Able-bodied men and women that would go on working to reduce poverty are killed. • Financial and time resources are spent on funerals and mourning relatives and neighbors killed
by lions. • Following the death of a person by a lion, many villagers are afraid that the lion is just nearby
and hence do not go to farm. • There is no independent planning, that is, people have to walk together, go to farm together etc.
This results to idleness in case one can not get someone to accompany him/her in performing the intended activity.
• Lions and leopards are killing tamed animals such as goats and thus reduce the precautionary
savings of the affected households. What is disappointing is that district leaders and wild life authorities are not acting to cub the situation because villagers are seen as the one who had invaded the wild life territory. 8.4.5 Road Network to the Village: Investor as a Barrier Among the most disturbing problem of Ndenyende village is the road facility. In the years before 1995 there was a good road that was a connection to the main road along Songea Tunduru road. There was a logo/signboard bearing the name of the village including the name of the village primary school. The people of Ndenyende were proud of having that road and they were able to transport their farm products to the nearby townships, carry their sick to the hospitals, etc.

_____________________________________________________________________
MOVING OUT OF POVERTY: Understanding Growth and Democracy from the Bottom Up - Regional Synthesis Report
72
However, at a latter stage, the local investor known as KIUMA Community who bought the land on the road junction closed the road. He fenced-in all the land including the road without considering that there were people who were benefiting from using this road. Furthermore he demolished the two logos that were indicating the location of the village and the primary school. In addition to the fact that the village has been denied the infrastructure that they badly need, they are also very unhappy that, if it happened that a government leader/official were on his/her way along the highway, he/she would never know that there is a village trapped far away from the highway. In the past, whenever government leaders/officials passed along the Songea-Tunduru highway, they used to read the logo and know that there is a village in the interior parts of that place.
“Look here! We have been cut from the government. Even if the District Education Officer wants to visits our school he will never find it as there is no sign showing where the school is located. There is no signboard to our school and no road to our village.”
Mohamedi Bwanali, 48 years old man, Village Chairman, Ndenyende
The informants clarified that they are not against what that investor is doing because he has built a hospital, vocational school and a secondary school, which are of benefit to their community, as the people who are using these facilities are from that area. What they don’t understand is: if the road is closed and fenced, how will they go there to access those facilities? The village administration made some follow-ups to solve the problem but have only received promises, which have not been fulfilled. The investor promised to construct a new road to the village and provide clean water to the village, but these promises have not been kept. The current road to the village is terrible, as one has to go round in dirty bushes with steep slopes, which are difficult for the villagers to pass through. The investor is still constructing other facilities including an airstrip that lies on the road towards the village. The informants concluded that they see the danger of their village been excluded from accessing services outside the village including crop buyers because no body will take the trouble of traveling through the long dirty road they are using now. Their main puzzle concerns the silence of the district authority in acting against the matter. 8.4.6 Fishing Industry in Liuli Village The major setback in development process as mentioned by Liuli community members is the bas of beach seine fishing (Kokolo fishing) technique. Community members clearly demonstrated the extent at which members of the Liuli community substantially depend on Lake Nyasa fishing activities for nutrition, income earnings and livelihood in general. Yet in 1997 a regulation on Fishery Act was enacted to restrict the use of beach seine. The regulation aims at protecting the environment especially the fish breeding sites, which are normally on shallow waters, according to officials of the fisheries

_____________________________________________________________________
MOVING OUT OF POVERTY: Understanding Growth and Democracy from the Bottom Up - Regional Synthesis Report
73
department. Formally such fishing style was used to fish in shallow waters. Fishermen prefer to do the fishing in shallow waters due to different reasons, including:
• It is less expensive in terms of size and number of canoes used. Respondents noted that only one canoe is enough to carry all required equipments and fishermen into the water.
• Security of fishermen: With beach seine technology the lives of fishermen are not endangered.
The alternative fishing technology requires getting into deep waters several kilometers in the lake. Most fishermen do not have big canoes, which can stand strong waves. As a result some fishermen have lost their lives in their struggle to reach and fish in deep waters, which was not the case in the past. In Nkali, Njambe, Tumbi and Tawi villages 5 people died in 2004, leave alone in other Lake shore villages. In many cases villagers are not able to locate the bodies of the deceased after such accidents have happened.
Economic Effect: Why has the Effect been so Big? Unlike Matengo, in Lake Shore communities, agriculture is not intensively practiced. Among other reasons is the fact that climatic condition does not favor growth of cash crops, like coffee. Thus in the past, even widows would make a living out of fishing; by cooking/boiling dagaa and selling it in Mbinga or Songea. By so doing she could support her family and send her children to school. Today, things have changed, particularly after the ban of kokolo. Since the ban of beach seine, the community economic performance has dropped significantly. People who used to depend on fishing for children’s education, heath and other social services can not afford any more. In addition, majority of community members depend on fish for food (mainly as a source of protein). However, with declining catch, nutrition of the people is going to be affected. Effects on Men versus Women The key informants were of the views that men and women were equally affected by the changing of fishing technology. While mostly men sold fish outside their locality, that is, Mbinga, Songea, Tunduru and Dar es Salaam, women raised income in their unique way. Fishermen who normally own nets and canoes normally hired women for processing of fish. When dagaa for example are caught in large quantities, fishermen cannot manage to process them all without external assistance. Therefore women are hired to assist in the drying process. Respondents indicated that although most of women do not have fishing nets, by participating in fish drying process they were able to support their families. They were paid as mush as 5 buckets of dagaa as wage for a single day work, which could sell about TZS 3000. Other women brought firewood for processing dagaa, and they were also paid in kind for the services.

_____________________________________________________________________
MOVING OUT OF POVERTY: Understanding Growth and Democracy from the Bottom Up - Regional Synthesis Report
74
Pertinent Policy Issues The findings have shown that a ban on beach seine is affecting the people at both household as well as community levels. Majority of fishermen can only afford simple and cheap fishing gears (kokolo) which are now prohibited. People are therefore denied incomes. Other members of the community who used to benefit from kokolo fishing technology are also affected. A number of pertinent questions can be raised at this juncture. Firstly, what is the rationale of the ban when the breeding sites have always been in the rough coral reefs, shrubs and mangroves where kokolo cannot be applied? Secondly, what alternative options are given to fishermen when such ban is imposed? Thirdly, why does the Fisheries Department impose a full ban when there is a possibility of periodic ban (which allows breeding of fish)? Fourth, does such a ban have any meaningful impact when others in the neighborhood, for instance, Malawi and Mozambique are practicing counter acting fishing technologies and/or methods such as kokolo? Since this is linked to national broader policy on fisheries, there is a need to revisit the 1997 regulation on Fishery Act which was enacted to restrict the use of beach Seine. There is also a need to learn from neighboring countries whom they also border Lake Nyasa and where possible ensure that the fisheries policies and strategies are harmonized.

_____________________________________________________________________
MOVING OUT OF POVERTY: Understanding Growth and Democracy from the Bottom Up - Regional Synthesis Report
75
CHAPTER 9.0: GENDER AND MOBILITY 9.1 Mobility and Gendered Economic Opportunities 9.1.1 Agriculture As mentioned earlier, villagers in the eight surveyed communities indicated that the primary activity in the village is agricultural production, but that a number of other sources of income also exist. Agricultural production and animal husbandry are gender-neutral activities, performed by men, women, and youth, though men generally are more active in the production of cash crops while women focus on food crops. Nevertheless, although men and women do collaborate, there are men and women’s crops. Both men and women cultivate maize, which is the most important food crop. The main men’s crops are coffee and cashew nuts, which are cash crops. Women’s crops are beans and wheat, which are for food but the surplus is sold. Men, both as adults and youth, are primarily responsible for cross boarder trade, transportation, lumbering, and masonry. Mining is mainly done by the youth. Bread making and the making of local brew are traditionally women’s activities. Over the 10 years period, youths’ activities had changed more relatively compared to men and women’s activities. Some villagers indicate a tendency by the youth to avoid more labor-intensive activities. For example, there has been a shift away from agriculture by youth in some areas during the time period from 1995 to 2005, towards areas which are perceived as faster paying, such as mining and the raising of pigs. Bread and brew making activities for women have also expanded over the period. 9.1.2 Fishing Fishing is mostly practiced in the villages along the lake shore (Lake Nyasa). Fishing was found to be a major non-agricultural income generating activity and a major protein source for majority of Liuli households. Both men and women participate in the fishing business, though in different aspects. Men participate in actual fishing in the lake and wholesale, while women are involved in fish retailing, and processing. In the past fishing was a lucrative business because the catch was high. Although, very few people owned the fishing gear, it was easy for other members of the community to obtain fish (kuvambalila) provided one is present at the lake shore when the fishermen arrives with the catch9. When fishermen come back with the catch, they first apportion bigger portion of the catch for the owner of the fishing gear than for the fishermen, reserving some for the traditional practices of kuvambalila, where those who meet the returning boat on the beach receive a small portion of the catch.
9 Kuvambalila is a local term and it is an act of acquiring a small proportion of the catch free of charge from the
fishermen or the owner of the fishing gear.

_____________________________________________________________________
MOVING OUT OF POVERTY: Understanding Growth and Democracy from the Bottom Up - Regional Synthesis Report
76
Kuvambalila was very important for women because traditionally, women do not go fishing. So women previously earned income by selling fish they get through kuvambalila. Thus, in the past fishing was very beneficial not only to people who had capital to invest in it, that is, owners of the fishing gear, but also to the poor, the vulnerable and those who were single (divorced). Today, things have changed completely. Fishing is a very difficulty business. The catch is very low. The tradition of kuvambalila is rarely practiced and even people with money find it difficult to buy fish. Even if fish are available, their scarcity has priced them out of the range of most households. Reasons for current poor catch and performance of the fishing industry include the government ban of beach seine, over-fishing and disruption of fish reproduction and lack of modern fishing equipment. 9.1.3 Mining Mining is the most notable new area of income generating activity that has opened in the study area between 1995 and 2005 Muhuwesi village) and in 2003 (Nyoni village). In 1994-1995, gold was discovered in Muhuwesi Village and immediately afterwards, intensive small scale mining activities began in the region. A significant segment of the population is involved in mining process both directly and indirectly. These activities include actual mining, trading of gemstones, and conducting business around the mining sites. Although women do not participate in actual mining, they benefit from mining activities by providing grass to thatch miners’ houses, fetching water for sale, and food vending. The gemstones business was mentioned to have both positive and negative impacts. Positive impacts included higher incomes from mining activities, which were used to build and improve houses with corrugated iron sheets roofs and new furnishings. The additional income has also been used for commercial opportunities and to purchase productive assets, such as milling machines. Mining in Muhuwesi has generated positive externalities for the women of the village. While men believe it is more difficult to earn an income now than 10 years ago, women believe that it is easier. They attribute this to the new income-generating activities created by the opening of the mining sector. These include food vending to miners and a practice locally known as mchoromchoro. Women collect soil discarded by the miners and use a sieve to examine it for any remaining particles of gemstone. Though this is generally not exceptionally lucrative, it has opened another area of income to women that was not available ten years ago. The negative impacts included decline in agricultural production as people were attracted more to mining than to farming; a decline in school attendance rates as students left school to work at the mining sites (truancy among boys was reported to be as high as 296 in 2004 [URT, 2004]; this is 35 percent of the total drop out cases in that year); and increased chances of HIV infection due to more new men in the village from various areas with disposable income. Table 9.1 shows the HIV prevalence rate in Ruvuma Region by Districts. Since money circulation increased and the incoming miners had money, leisure in terms of sex was not uncommon. Therefore, unsafe sex might have been practiced, increasing chances of infection by HIV/AIDS.

_____________________________________________________________________
MOVING OUT OF POVERTY: Understanding Growth and Democracy from the Bottom Up - Regional Synthesis Report
77
Table 9.1: Prevalence of HIV Infection among Blood Donors by District, Ruvuma Region
2001 2002 2003 2004 District/Region Total
Donors % Total Donors % Total
Donors % Total Donors %
Mbinga 3,646 11.4 5,370 10.1 3,950 8.8 4,155 8.8 Songea 5,678 14.3 6,919 13.7 6,003 13.5 5,965 9.4 Tunduru 2,863 4.8 2,663 5.3 2,365 4.4 3,007 4.4 Ruvuma 12,187 11.2 14,965 10.9 12318 10.3 13127 8.1 Source: URT, (2005d) HIIV/AIDS deserve more attention as a cause of decline in prosperity to some households. The decline results from several angles. First, the providers/bread earners of households are eroded by the pandemic; second meagre resources of the household are used to take care of the sick person; and lastly the time of household members in particular women and the individual living with HIV/AIDS is diverted from productive activities to care taking. Leah Chale shared her experience on how her first daughter, who was a very important provider, suffered and eventually died of HIV/AIDS. Her daughter was a qualified nurse employed in Mbinga town. The daughter assisted her mother by providing resources to educate her younger sisters and brothers, and to meet basic family needs. The daughter developed symptoms of HIV and her health deteriorated gradually for a period of three years. Leah had to take care of her daughter both at home and sometimes when she was admitted at the hospital. She used all her savings to support her daughter and paid all the treatment related bills. After three year of serious illness, the daughter died and by then, Leah’s savings had been depleted, plunging her deeper into poverty. A disturbing finding is with regard to information and awareness about HIV/AIDS. Although national figures are showing high awareness (Table 9.2), still, in those communities, AIDS related deaths are linked to witchcraft beliefs. Further, change of behavior has been minimal as portrayed by the following quote from Liuli community. This quote is on one of songs sang at traditional dances which are normally done late in the evening (1900 to midnight or beyond) and which attracts mostly the youth:
“Lets come closer and closer in pairs; even if HIV/AIDS is threatening; let me shoulder it!!! Let me shoulder it!!! Let me shoulder and let HIV/AIDS messy me up! Even if I will be infected; let me shoulder it!!! Let me shoulder it!!! Let me shoulder and let HIV/AIDS messy me up! Even if I will fall sick; let me shoulder it!!! Let me shoulder it!!! Let me shoulder and let HIV/AIDS messy me up! After all I will have enjoyed already; Let me shoulder it!!! Let me shoulder it!!! Let me shoulder and let HIV/AIDS messy me up!”
Narrated by Male and Female Youth, Liuli, May 2005
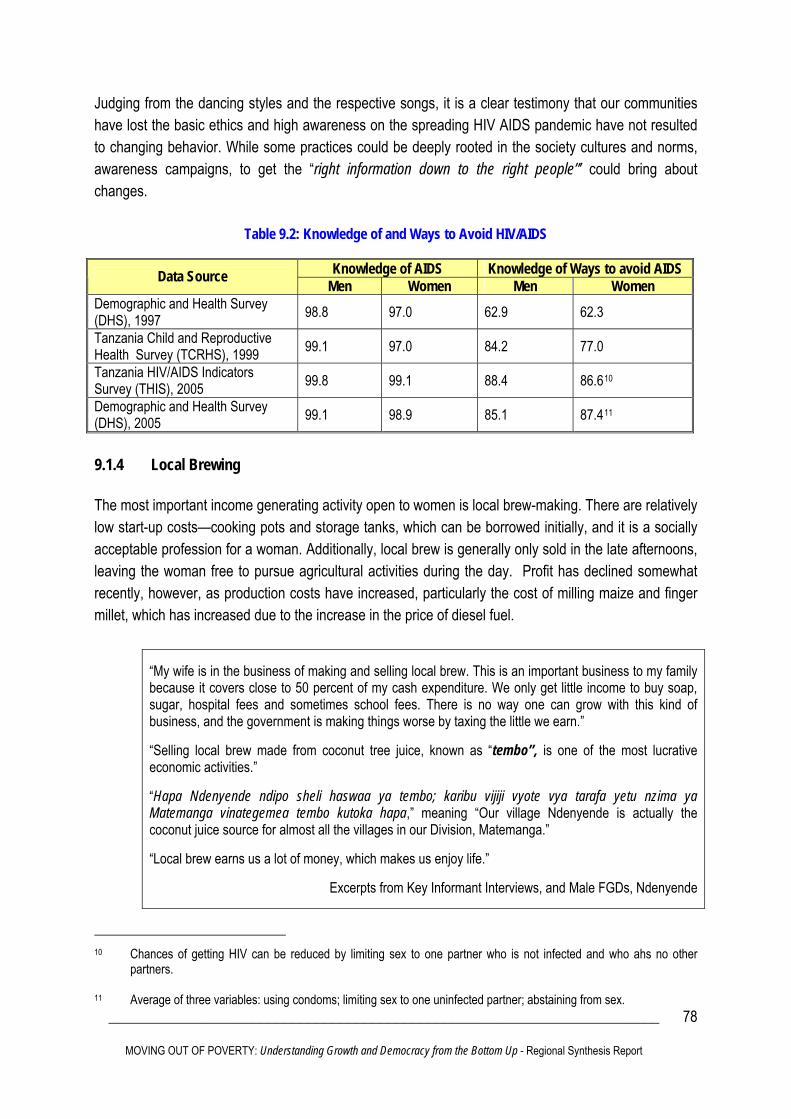
_____________________________________________________________________
MOVING OUT OF POVERTY: Understanding Growth and Democracy from the Bottom Up - Regional Synthesis Report
78
Judging from the dancing styles and the respective songs, it is a clear testimony that our communities have lost the basic ethics and high awareness on the spreading HIV AIDS pandemic have not resulted to changing behavior. While some practices could be deeply rooted in the society cultures and norms, awareness campaigns, to get the “right information down to the right people”’ could bring about changes.
Table 9.2: Knowledge of and Ways to Avoid HIV/AIDS
Knowledge of AIDS Knowledge of Ways to avoid AIDS Data Source Men Women Men Women Demographic and Health Survey (DHS), 1997 98.8 97.0 62.9 62.3
Tanzania Child and Reproductive Health Survey (TCRHS), 1999 99.1 97.0 84.2 77.0
Tanzania HIV/AIDS Indicators Survey (THIS), 2005 99.8 99.1 88.4 86.610
Demographic and Health Survey (DHS), 2005 99.1 98.9 85.1 87.411
9.1.4 Local Brewing The most important income generating activity open to women is local brew-making. There are relatively low start-up costs—cooking pots and storage tanks, which can be borrowed initially, and it is a socially acceptable profession for a woman. Additionally, local brew is generally only sold in the late afternoons, leaving the woman free to pursue agricultural activities during the day. Profit has declined somewhat recently, however, as production costs have increased, particularly the cost of milling maize and finger millet, which has increased due to the increase in the price of diesel fuel.
“My wife is in the business of making and selling local brew. This is an important business to my family because it covers close to 50 percent of my cash expenditure. We only get little income to buy soap, sugar, hospital fees and sometimes school fees. There is no way one can grow with this kind of business, and the government is making things worse by taxing the little we earn.” “Selling local brew made from coconut tree juice, known as “tembo”, is one of the most lucrative economic activities.” “Hapa Ndenyende ndipo sheli haswaa ya tembo; karibu vijiji vyote vya tarafa yetu nzima ya Matemanga vinategemea tembo kutoka hapa,” meaning “Our village Ndenyende is actually the coconut juice source for almost all the villages in our Division, Matemanga.” “Local brew earns us a lot of money, which makes us enjoy life.”
Excerpts from Key Informant Interviews, and Male FGDs, Ndenyende
10 Chances of getting HIV can be reduced by limiting sex to one partner who is not infected and who ahs no other
partners. 11 Average of three variables: using condoms; limiting sex to one uninfected partner; abstaining from sex.

_____________________________________________________________________
MOVING OUT OF POVERTY: Understanding Growth and Democracy from the Bottom Up - Regional Synthesis Report
79
“My main activity is farming but apart from farming activities I make and sell local brew known as Ngelenge. I learned the skills of making local brew from my mother and in 1974 I started my own business on local brewing.” I was able to get a profit of between TZS 500 to TZS 600 a day in 1974 and TZS 5, 000 a day in 1995 by preparing the local brew two to three times a month. Now I am making a profit of between TZS 10,000 to TZS 15,000 a day. Through local brewing I have been able to send one of my children to secondary school, support myself, care for my children and my ailing mother, and save a small amount of money in case of sudden illness or other adverse shock.”
Sarah Kiwili, 52 years old woman, Nyoni Brew-making is therefore a viable means for female headed households to earn a living. However, excessive drinking of alcohol is one of the critical factors that pull households down the ladder as portrayed in life stories (for example life story 10.9, Muungano village). This is because it erodes the resource base of the consumer and the cereal base of producer. Yet, local brewing has been cited as a major source of income to some households as portrayed by the above quotes. 9.1.5 Other Gendered Activities The weaving of traditional mats or “mkeka” is another source of women’s income mentioned by respondents from two communities (Luhindo and Liuli). In Luhindo, Mikeka are used in the drying process of maize and coffee. They are made using a type of plant known as “malulu” which is normally grown on the banks of local streams. Women come together in a group of ten to fifteen to make a single mkeka of about five meters long. The price for a five-meter long mkeka is TZS 5,000 and the price increases by TZS 1,000 for every additional meter. Overall, due to the nature of the agrarian system in place on the region, women’s economic activities are generally closely tied to their spouses. In traditional practices, there is a strict division of labor between men and women. The responsibility for digging and weeding are generally shared by both parties, while men charged with the scaring off of wild animals, while women are more involved in the harvest, particularly of beans. On coffee farms, pruning and spraying is done by men but the picking of the coffee is a shared responsibility. Women may earn independent income by selling crops harvested from household farms or by selling traditionally female crops, such as beans. Local brewing, wage labor, and the making of traditional mats are non-agrarian options open to women. Generally, women have not been permitted to join cooperative societies, though recently some exceptions have been made for widows. 9.2 Gendered Prohibitive Traditions and Customs 9.2.1 Polygamy Gender relations in the Ruvuma region, similar to the majority of the rural developing world, are unequal. Both men and women in the focus group discussions in all surveyed communities agree that men have more freedom, power and self-determination than women. They also agree that men control

_____________________________________________________________________
MOVING OUT OF POVERTY: Understanding Growth and Democracy from the Bottom Up - Regional Synthesis Report
80
the finances and investment decisions in the vast majority of households. There have in the past ten years, however, been advances in some communities in access of women to income generating activities. The largest issue for the majority of women in the Ruvuma region, however, is polygamy. Many women believe that it is a significant contributor to the downward mobility of a household, as resources are stretched over a larger number of wives and children. There is, however, some debate, centered particularly on agrarian households. Some believe that a larger number of working adults in the household is a source of upward mobility, while others believe that the household friction resulting from multiple wives is a reason for downward mobility.
“This is Biblical that men will have power over women, and man is the first one to come in this world. The bride price paid to her parents allows a man to overpower her. A woman can stop her husband from marrying another woman but he will marry anyway, is there a freedom for woman?”
Waziri Siani, 42 year old man, Muhuwesi “If a Yao woman tells her husband: Please let’s us build a better/modern house, the normal reply is: “Are you more intelligent than me? Are you another man in this household so that we are two men? I am feeding you, do you want to rule me?” Once he utters such words, and at the same time he has a good sum of money, it is evident that he has got a secret woman he may marry anytime, even without informing his wife.”
Habibi Kamba, 55 years old woman, Ndenyende Despite the claims of many women about the detrimental effects of polygamy on prosperity, it does not appear that it has any significant village level effects. From the household questionnaires, some households reported having two or more wives in the home: Liuli 0 percent, Kikolo 2.38 percent, Mkalanga 5 percent, Luhindo 16.28 percent, Muhuwesi 17.08 percent, Muungano 19.51 percent, Nyoni 21.95 percent and Ndenyende 26.83 percent. However, polygamy cases were mentioned several times in the life stories. The two villages with the largest changes in net prosperity in both the positive and negative directions, Mkalanga and Liuli respectively, have very low levels of polygamy (Figure 9.1). None of the four major indicators (NPI, NPP, NPR, MOP) show a correlation between the level of polygamy and the overall mobility of the community.

_____________________________________________________________________
MOVING OUT OF POVERTY: Understanding Growth and Democracy from the Bottom Up - Regional Synthesis Report
81
Figure 9.1: Polygamous Households versus Net Prosperity Index
Kikola
Liuli
Luhindo
Mkalanga
Muhuwesi
MuunganoNdenyende
Nyoni
-0.6
-0.4
-0.2
0
0.2
0.4
0.6
0.8
1
0 5 10 15 20 25 30
Percentage of Polygamous Household
Net
Pro
sper
ity In
dex
The debate about polygamy centers on workload and effort in agrarian households. Those who believe that polygamy increases prosperity contend that an additional wife is an additional laborer for the farm. As long as there is sufficient land and diminishing returns have not set in, the additional labor provided by the new wife will offset or overcome any dilution of household resources by her or her children. Opponents of polygamy argue that an additional wife can bring discord into the household. The other wife or wives will not exert the same effort because they believe they are working for the well-being of another woman and her children. Sometimes, the husband also becomes lazy hoping that the wives will work hard for him. Therefore productivity decreases and overall output decreases. Both men and women in Nyoni cite polygamy as a cause for a decline in well-being, and villagers in Muungano list it as a poverty trap. Household level analysis also does not support polygamy as being detrimental to prosperity. Of the movers, 80 percent had only one wife, with roughly ten percent each being single parent households or polygamists. About 60 percent of fallers had only one wife, though roughly the same amount of polygamists. This would indicate that the death or divorce of a spouse was detrimental, rather than the taking of an additional spouse. The chronic poor had similar numbers, with 70 percent having one spouse and about ten percent being polygamist. The only group to show larger numbers of polygamist households was the chronic rich. About 60 percent again had one wife, but only 15 percent were single parent households. The remaining 25 percent were polygamist, with five percent having three or more wives. This would indicate that households that take on additional wives do so with the knowledge that they can afford the additional costs of a larger family. This is partially explained by respondents in Ndenyende, who noted that it was not polygamy that caused a decline in prosperity, but rather extravagance. For the poor, an additional wife means additional labor, increasing prosperity and moving the household up the ladder of life. The rich do not

_____________________________________________________________________
MOVING OUT OF POVERTY: Understanding Growth and Democracy from the Bottom Up - Regional Synthesis Report
82
need to marry multiple wives for labor, but they are vulnerable to a decline in well-being if they spent too much money to “marry many additional wives for hours in guest houses.” In Ndenyende, villagers credit the intervention of the former Regional Commissioner Mr. Kalembo, in 2000, for reducing polygamy rates. Upon arriving in the village he commented that people should focus on improving their homes rather than accumulating more wives. Villagers believe this caused a shift from investments in additional wives to investment in the physical infrastructure of the household, though Ndenyende’s polygamy rate remains high. In Nyoni it was pointed out that the culture of the community, which is the culture of the Matengo people in general, encourages the marriage of more than one wife, hence creates large families. Although divorce rates are high, they hardly contribute to female household headship because a divorced woman goes back to her parents and lives in her father or mother’s household.12
“Polygamy makes us refuse farming and leave all agricultural activities to the husband. No woman is willing to produce food for another woman’s child.”
Asha Waiti, 45 year old woman, Muungano
“It happened that one man had two wives who were very co-operative. The man married a third wife prior to informing his first and second wives. The two previous wives said going to farm would be working for the third wife and her child. They did not go to farm the whole agricultural season; hence crop harvests that year declined tremendously.”
Stawa Mwidadi, 45 years old woman, Ndenyende
“People marry many wives without expanding their farming activities. Families are becoming too big, villagers seem not to change and thus remain trapped in poverty.”
John Shega, 59 year old man, Muungano
“This habit of having more than one wife has adverse effects on household well being if additional wives are not hard-working; lazy new wife discourages the first wife to work hard, making the household poorer. Sometimes, the husband also becomes lazy hoping that the wives will work hard. But if all the wives and the husband work hard, the habit helps increase well being levels because there are more adults working.”
Rehema Ndunguru, 30 year old female farmer, married to a man who had 3 wives, Nyoni “You Yao people are getting money but you are almost entirely using it on marrying additional wives. From now refrain from marrying too many wives; use your income to build better houses with brick walls and iron sheets roofs.”
Fatu Yassin, 41 year old woman, Ndenyende
. “About 95 percent of men in this village have more than one wife.”
Gasper Maluwaita, 60 years village traditionalist who had three wives, Nyoni
12 Although majority of the villagers are Catholics, polygamy is high in such a way that on Sunday many individuals do
not take the Holly Communion.

_____________________________________________________________________
MOVING OUT OF POVERTY: Understanding Growth and Democracy from the Bottom Up - Regional Synthesis Report
83
“This habit of having more than one wife has adverse effects on household well being if additional wives are not hard-working; lazy new wife discourages the first wife to work hard, making the household poorer. Sometimes, the husband also becomes lazy hoping that the wives will work hard for him. But if all the wives and the husband work hard, the habit helps increase well being levels because there are more adults working.”
Rehema Ndunguru, 30 years woman married to a man who had 3 wives, Nyoni
9.2.2 Female Headed Households Inheritance and divorce laws are still not functional in this part of Tanzania. Some relatives are still bearing the burden of caring for the children after the death of a husband and confiscation of the family wealth by husband’s relatives (See life stories 10.8 and 10.10 Muhuwesi village). In urban areas like Dar es Salaam there are institutions, for instance, Tanzania Women Lawyers Association (TAWLA), which fight for women’s inheritance rights but most rural areas have not been reached. From life histories, some husbands have fled away from home because of polygamy, marrying and living with another woman but others have left in pretext of looking for income earning opportunities. A case at hand is that of a husband who moved but he never came home and the main reason was hunger in his homestead. Traditionally, men are supposed to fend for their households and when this obligation is not fulfilled, a man may flee home in search of income. However, a man may flee because he sees the wife as not performing her role of securing food for the household. Thus, abandoning the wife and marrying another woman. Thus divorced and abandoned women are not given any means of support, and are generally forced to move in with parents’ or sibling’s, increasing the resource strain on the existing household. Therefore, the number of female-headed households is limited because of the opportunity to live with the parents or siblings though these groups are particularly vulnerable to a decline in prosperity, often have to rely on support from distant family members.
“I started to experience economic and social hardships after separating with my husband. He left me for another woman because I could no longer conceive after my fallopian tubes were cut during an operation. The business we owned jointly remained with him and the new wife. Our marriage was purely traditional and there was no division of matrimonial property.”
Filbertha Ndunguru, 31 years old, Kikolo
9.2.3 Early Pregnancies and Marriages Early pregnancies and marriages are common problems in the rural villages. This decreases school female school attendance, especially in the later years of primary school and early years of secondary school. These two behaviors are related to stagnation in poverty in three major ways: First, girls who do

_____________________________________________________________________
MOVING OUT OF POVERTY: Understanding Growth and Democracy from the Bottom Up - Regional Synthesis Report
84
not get basic education and higher level education remain with underdeveloped human capital, and thus can not efficiently participate in agriculture and other livelihood avenues. Secondly, scarce resources of poor households are lost in paying for their school fees; thirdly, these women become submissive and less empowered to take charge of their own life including deciding for family planning. Early pregnancies contributed 24 percent of all the primary school dropouts in the region in 2004 (URT, 2004). 9.2.4 Bride Price Often traditional cultural or religious reasons are cited as the basis for male domination. In the Ruvuma region, there is the tradition of the groom or the groom’s family paying a “bride price” to the woman’s household. This is then employed as the basis for male control of the new future household. Men control the finances and the production decisions, as well as having the final say in matters relating to household expenditures and decisions affecting the upbringing of children. There are numerous examples from both the female focus group discussions and individual life stories of men receiving large amounts of money from the sale of cash crops, then proceeding to spend the money on alcohol and other women. This has a significant impact on the well-being of the entire household, but women have little recourse. Similarly, due to poor knowledge of legal system by women, men do not seek for legal consent from his current spouse before taking another wife, and women have done nothing about it. The practice of paying bride price also is a contributing factor to the levels of prosperity of households. The case at point is from Mr. Gotan Johane Mbunda (respondent, Luhindo village) who has paid bride price for his 3 sons. In 1982, he paid the bride price for his first son, giving away 3 cows, 8 goats, 2 umbrellas, 2 blankets, and TZS 20,000 cash. In 1998, he paid the bride price for his second son giving away 2 cows, 8 goats, 2 sheep and TZS 40,000 cash. Again in 2000, he paid the bride price for his third son, giving away 1 cow, 4 goats and TZS 30,000 cash. This practice to a large extent depleted his wealth, and hence his level of prosperity. 9.2.5 Women in Traditional Male Activities On a positive note, women were also found to have penetrated men’s domain in areas such as money brokering. A notable case in Muhuwesi village is a woman money broker who has been lending money for profit, especially in the months of January to April. During these months the majority of people are broke, as this is a period before harvest. She lends to them and she gets agricultural produce in return (depending on agreed terms). Such moneylenders are essential, especially during agricultural season, as they could be approached for funds for accessing agricultural inputs.
_____________________________________________________________________
MOVING OUT OF POVERTY: Understanding Growth and Democracy from the Bottom Up - Regional Synthesis Report
85
CHAPTER 10.0: INEQUALITY AND MOBILITY 10.1 The Understanding Perceptions of Inequality and its Dimensions Inequality in all the communities was mostly defined in economic terms whereby households differ in income, productive resources, and asset ownership. Households had different farm sizes, crop yields, livestock numbers, types and sizes of houses and other household assets. In some cases, inequality was perceived to be linked to lifestyles including how people eat and dress. However, in most cases, eating and dressing properly is a function of income or wealth.
“While others in the community have good clothes and are always smart and eat balanced diets, others wear worn-out clothes and eat poor quality meals. That is also inequality.”
Rashidi Ndauka, 55 years old man, Muungano
According to local perceptions, households also differ in terms of access to education (both primary and secondary schools), heath services and safe and clean water, and to economic opportunities including credit, economic networks and associations. Other major dimension of inequality which were mentioned by local communities themselves include participation in decision making in the communities, membership to community organizations, and political parties and gender inequality whereby there was a difference between a man and woman in social aspects. 10.2 Trends in Inequalities over the last 10 years 10.2.1 Economic Inequality From the Focus Group Discussions, perceptions in most of the communities revealed that economic inequality had remained more or less the same over the last ten years. Summary statistics from the community questionnaires also indicate that it was perceived by 37.5 percent of the respondents that the gap between the poorest or worst off households and the richest had stayed about the same. Only 12.5 percent perceived it to have increased. However, it was perceived by 50 percent of the respondents that more people in the communities had access to new economic opportunities. However, selected indices, derived from the mobility matrices revealed a somewhat different picture. The average Net Prosperity of the Poor (NPP) for all 8 communities was 0.37. Hence, for every 3 poor households that moved down, there were 7 that moved up. The Net Prosperity of the Rich (NPR) was –0.36, indicating that for every 7 rich households that moved down there were only 3 that moved up. These indices would imply that on average, economic inequality has been reduced (i.e. the gap between the poor and the rich has been narrowed.

_____________________________________________________________________
MOVING OUT OF POVERTY: Understanding Growth and Democracy from the Bottom Up - Regional Synthesis Report
86
Despite increased economic opportunities, Focus Group Discussions revealed that, people had different views on whether there is more or less inequality in the communities surveyed. While some said there is less inequality, others were of the opinion that inequality has increased.
“Currently the number of houses roofed with iron sheets has increased; no one is wearing a sack which means less inequality.”
Daimu Kupea, 54 years old man, Muungano
“There is more inequality now compared to 10 years ago. While others are watching TV drinking tea with milk everyday eating meat whenever they want I have not managed to buy fertilizer for 3 years and I have never drunk tea for 2 years what are you talking about?”
Rashidi Ndauka, 55 years old man, Muungano
It was generally agreed that the poor still faced economic obstacles including lack of capital for expansion of productive activities, lack of access to markets, which resulted into the decline/fall in agricultural production, lack of agro-inputs, large numbers of dependents in some households, poor health and unwise spending by some villagers (e.g. excessive drinking). Those who were better off took advantage of economic opportunities including trade, credit facilities, economic networks and associations, which cannot be accessed by the poor. The better off have greater access to social services including education and health facilities most of which are far from the communities and which the poor cannot afford. They also possess more productive resources particularly land and more household assets. Table 10.1 shows the general characteristics of the very rich and the very poor categories developed in the Ladders of Life.
Table 10.1: Characteristics of the Very Rich and the Very Poor in Communities The Very Rich The Very Poor
• Nice/decent houses • Export crop (coffee, cashew) farms of at least one acre • Many livestock (including cattle) • Major non-farm entity (e.g. milling machines, shops) • At least 2 acres of food crops (including maize, beans,
cassava) • Other major assets (e.g. cars, tractors, motorbikes) • Able to send their children to both public and private
secondary schools • Able to pay for medical treatment in hospitals.
• No house of their own • No farm/land • No livestock • Sell labor to earn a living • No assets • Unable to send children to secondary
schools • Unable to afford medical treatment in
hospitals.
Households in the communities that have benefited most from changes in economic opportunities are those, which did well in the production of cash crops like coffee and cashew nuts despite the underlying constraints. With income obtained, they were able to accumulate and build nice houses, increase the number of livestock, or establish a business entity (e.g. shops) and live a modest life. Food crop production apart from ensuring food security was not considered as an important factor bringing about inequality.

_____________________________________________________________________
MOVING OUT OF POVERTY: Understanding Growth and Democracy from the Bottom Up - Regional Synthesis Report
87
10.2.2 Other Types of Inequality In most of the communities, households do not have significant diverse ethnic, religious, political and caste dimensions, rather they differ more on possession of economic assets (including houses, farm area, number/type of livestock, and business entities). It was perceived by 75 percent of the respondents from the community questionnaire that important networks and associations are open to many in the community. About 50 percent of the respondents also perceived that compared to 10 years ago, people in the community have more access to networks and associations. It can therefore be argued that community networks and associations have not been very effective in transforming the economic status of the majority of the people. On the other hand, more people are participating in important community decisions now because communities have been sensitized on participation and involvement. In most communities, meetings are held and important decisions on community issues are made during these meetings. On the political front, people are allowed to join different political parties, and nowadays members of opposition political parties can easily voice their political opinions, challenging the ruling party. Membership to community organizations operating in the village is open to all. Thus, in terms of participation, there is a decline in inequality. Perceptions from the community questionnaire indicate that about 75 percent of the respondents thought that decisions on important community affaires are made with the participation of many people in the community. Again, 50 percent of the respondents thought that more people participate now in important community decisions than was the case 10 years ago. However, a notable feature is that in most communities, those people who inhabited the communities much earlier, usually considered themselves to be superior, and often wanted to have a greater voice in decision-making. Many of the young people (less than 40 years old) perceive themselves as having less say in the community. 10.3 Inequality and Mobility It does not come out very clearly that economic inequality emerges as an important factor hindering community mobility in the surveyed communities. However, in some areas, it could be argued that it does impact significantly on community prosperity. Most importantly, there could be some correlation between community prosperity and educational inequalities. Inequalities in education directly impacts prosperity via lowering the average quality of human capital in the communities. Lack of access to education by the poor also implies that most of them will remain in the vicious cycle of poverty. An example was given in Muungano village whereby a pupil known as Hassan Mohamed Mtimbuka passed standard seven examinations and was selected to join a secondary school in 1993. Instead, the son of a village dispensary worker, who had not passed the examinations, joined a secondary school using the same name of Hassan Mohamed Mtimbuka. This happened after Hassan’s parents failed to secure funds to pay for school fees and meet various other associated costs for their son to join secondary school.

_____________________________________________________________________
MOVING OUT OF POVERTY: Understanding Growth and Democracy from the Bottom Up - Regional Synthesis Report
88
Inequalities in education also seems to influence other factors impeding prosperity, such as fertility and child mortality rates, thus indirectly lowering economic progression of the community. Thus, wide income disparities tend to coexist with underinvestment in human capital that translates into lower long-run economic growth. Inequality may also have a crime inducing effect by reducing the individual’s moral threshold through a so-called ‘‘envy effect’’, whereby inequality will have a positive impact on individuals’ propensity to commit a crime. However, in this study, despite the fact that there were a few perceptions (12.5 percent) of communities being unsafe from crime and violence, it could not be established that crimes committed were correlated to inequalities. Inequality matters both within and across communities especially within communities, where people are more likely (and justifiably) to see in it signs of injustice, insider privilege, and unequal opportunities. Inequality can also be economically destructive when it interacts with underdeveloped markets, ineffective government programs, and slow growth resulting into slows progress in reducing poverty. Economic theory suggests that with weak credit markets and inadequate public education, only the rich can exploit investment opportunities. The poor households cannot borrow and miss out on potentially high returns on their own farms and small business ventures. The most able children from poor households miss out on the education and skills that would maximize their own economic prospects and that of the community at large. Most of the people in the surveyed communities are farmers. However, they differ to some extent in wealth and access to resources. To narrow down gaps in capital possession, it is necessary though difficult to break the vicious circle existing in capital formation. This calls for development of rural financial markets, for which policy support in this area is needed.

_____________________________________________________________________
MOVING OUT OF POVERTY: Understanding Growth and Democracy from the Bottom Up - Regional Synthesis Report
89
CHAPTER 11.0: FREEDOM, POWER AND DEMOCRACY 11.1 Understanding Perceptions of Freedom, Power and Democracy Communities attached the same meaning to the terms freedom, power and democracy but expressed differently. Freedom was defined in general terms to include, the ability to go or live anywhere, do anything, to express oneself, and to make decisions over one’s life. Some of the definitions were related to demographic characteristics especially age and gender. For example, living out of the custody of parents was perceived by some youth to be freedom. Divorcing a woman was also perceived by some men as acquiring freedom. People also perceived power differently. In some cases it was associated with authority and responsibility, whereby leaders such as the village chairmen, schoolteachers, clinical officers were seen as having greater power in the community. In some cases it was associated with prosperity whereby people with more wealth were regarded as being more powerful in the community. Power was also in rare cases associated with education levels, with those having higher levels of education perceived to have greater understanding of things outside the community and hence more power. In the past, traditional leaders had a lot of powers (through mere respect). However, this type of power is gradually loosing ground in most of the communities, especially to the younger generation (See Box 5).
Box 5: Power and Traditional Leadership
Traditional leaders in Tunduru District are called Mwene, Sultan or chief. Almost all villagers know their Mwene, but beliefs in his power vary greatly. In Muhuwesi Village, the discussants believe much in Mwene Kwitanda Kampanga’s ability to foretell impending fortunes and misfortunes, and he himself testified before discussants of his abilities and how it helps him get income and respect. However, in Ndenyende village, belief in Mwene is waning, and most people do not like to hear about him. The last Mwene was Mwene Chemataka. He used to be carried by strong young men in an armed chair. But a long time ago (in 1964), protesting against his chiefdom the young men that were carrying him threw him, together with the chair into Nampungu River. Fortunately, he survived, but he was not carried any more, and his fame declined much. Facilitator: Where does Mwene live now? Fatu Issa: He lives far from here, on Katumbo Hill. Facilitator: What power does he have? Fatu Issa: He has no power, and we no longer believe that he has power. We are modernized; he cannot help
us in anything. Zainabu: You are very wrong Fatu; what people have done to undermine Mwene is very bad; we are now
missing his assistance and that is why we are even getting fevers13 and our cashew nuts have died. (It is worth noting that Zainabu had about 2 years old child who was blind. The child was wearing a charm in a black piece of cloth in the neck, presumably believed to protect the child against infant diseases, like measles, whooping cough, etc.)
Other women: Silent. They were shy to disclose their positions pertinent to Fatu’s and Zainabu’s quite opposed contentions. But it is definite from Fatu and Zainabu that they were divided, some of them supporting Fatu, others supporting Zainabu.
Narrated by Women FGD, Ndenyende, May 2005
13 Lay people in Tunduru District call almost every disease fever.

_____________________________________________________________________
MOVING OUT OF POVERTY: Understanding Growth and Democracy from the Bottom Up - Regional Synthesis Report
90
Democracy was perceived to be associated with participation in decision-making, freedom to lead oneself, and freedom to choose leaders they want, and also the ability to communicate or interact with leaders at various levels. Features, which portray the level of democracy in this community include, number of meetings and elections held. 11.2 Community Stratification Age and gender were key elements perceived by many to be directly linked with community stratification when it comes to freedom. It was perceived by most of the people in the communities surveyed that at household level, men had the most freedom because traditionally, they have authority and are decision makers in the household. As pointed out earlier, it was considered Biblical that men will have power over women, and man is the first one to come in this world. The power over a woman is also connected to the bride price paid to her parents allows a man to control her. Most critical is issue of access and use of household resources. In all the communities, men were free to use family income without being held accountable. Women had the least freedom at household level. Their economic activities and their movements were all decided upon by their husbands. The youth were also perceived to have a lot of freedom, since most of them had no family obligations.
“Some husbands deprive their wives freedom by objecting to them doing certain economic activities especially trade that involves traveling.”
Hadija Aridi, 32 years old woman, Muungano On the political front, it was perceived that some groups of people in the communities still had an edge when it comes to elections. These include the wealthy, the elderly, and religious leaders. These groups command more respect in the communities, and had slightly more influence in decision-making compared to younger men and women. 10.3 Trends in Freedom, Power and Democracy From the discussions it was evident that democracy has increased over the period of ten years in all the communities. Most decisions are made in a participatory manner and consensus is reached through voting in which a majority of votes from community members is needed to pass a decision. This increase in democracy has had a positive impact in most of the communities, as leaders are now democratically elected and development activities are planned in a participatory manner through the village machinery with involvement of community members. It was revealed that in most cases, elections were free and fair. Summary statistics indicate that in all the surveyed communities, there were elected village leaders, the elections were free and fair, and there was a council in the village. There are rigorous campaigns before any election. Information about the contestants is displayed at public places in the community such as village notice boards. See Table 8.4
_____________________________________________________________________
MOVING OUT OF POVERTY: Understanding Growth and Democracy from the Bottom Up - Regional Synthesis Report
91
for the trends in freedom (now compared to ten years ago), as perceived by households in all the communities surveyed. It is obvious that the degree of freedom has increased in many ways, now compared to ten years ago. It was also perceived by 71 percent of the respondents that it is less difficult now to set up a business in the village compared to ten years ago. About 50 percent of the respondents thought that they had about the same amount of control over making personal decisions that affect their everyday activities. In terms of power in the society, the Ladder of Life indicated that the majority 62 percent are still on the bottom half of the ladder (below step six). However, this is a slight improvement compared to ten years ago where 72 percent were on the bottom half of the ladder. Some of the main reasons given by respondents for the slight upward movement in “power” had to do with the economic achievements and social status of the respondents. These include gaining leadership positions, increased respect within community, marriage, acquiring land, and establishing new businesses. In terms of happiness the Ladder of Life indicated that the majority 65 percent are still on the bottom half of the ladder (below step six). Again, this is a slight improvement compared to ten years ago where 68 percent were on the bottom half of the ladder. Reasons given by respondents for the slight upward movement in “happiness” include increased household income, marriage or having children, better health, and establishing new businesses. 11.4 Freedom, Power and Democracy, and their Link with Community and
Household Prosperity It was observed from the communities studied that there is a democracy-poverty nexus. Within democratic systems of the communities, where a greater proportion of people participate through political institutions at the community level in development debates through political meetings, campaigns and elections, they can influence the economic system. The poor have at least the chance to try and bring about economic changes that can lead to the reduction of poverty and inequalities. However, it was also noted that some of the problems that still influence the degree of participation in all the communities include poor voter education and registration exercises; poor infrastructural support for elections; electoral influencing through monetary incentives and other means; poor voting arrangements; and lack of resources and logistics. These are problems typical to most developing countries, and it is therefore not surprising that they also featured in the communities surveyed.
Poverty not only arises from a lack of resources, but it may also arise from a lack of access to resources, information, opportunities, power and mobility. Generally, in the communities, it was never perceived that the poor experience social exclusion, isolation, alienation, discrimination, and inequality. This feeling of being looked down upon often arises from a combination of economic deprivation and in some cases socio-cultural factors, such as ethnicity, social hierarchy and gender. In Muungano village, it was argued that those in leadership positions had access to information, and opportunities. They were also paid wages and allowances and were therefore better off the other community members. Women in
_____________________________________________________________________
MOVING OUT OF POVERTY: Understanding Growth and Democracy from the Bottom Up - Regional Synthesis Report
92
Muhuwesi village attributed their low economic status to the fact that they were very few in leadership positions. Discrimination may intensify poverty just as poverty may intensify discrimination. In conclusion, communities surveyed have witnessed important democratic achievements over the past 10 years, including credible elections with relatively high participation rates and consequently a high degree of local government legitimacy, and the establishment of the basic framework for democratic governance. On the other hand, communities face a key challenge of the overwhelming need for sustained economic growth whose benefits will reach the increasing number of poor. This will inevitably be the key to the communities’ ability to maintain and improve the quality of democratic governance in the future. The impact of democracy and governance in the communities would be greater if they are closely linked to programs in sectors such as health, education, or economic growth. Emphasis should be on community participation in local decision making as this affects health care, schools and livelihoods. Hence democracy and governance should focus on promoting community participation, encouraging greater transparency and accountability in local government and in productivity of small producers. Government should promote better governance by providing training and technical assistance to members of local government, local non-governmental organizations (NGOs) and community groups. This assistance will support decentralization and devolution of authority to local communities to strengthen the fight against corruption, improve the productivity of small farmers and producers, and reinforce the capacities of local institutions in the communities.

_____________________________________________________________________
MOVING OUT OF POVERTY: Understanding Growth and Democracy from the Bottom Up - Regional Synthesis Report
93
CHAPTER 12.0: ASPIRATIONS OF YOUTH 12.1 Occupational Aspirations of the Youth Most of youth in the communities surveyed showed a strong will to get out of poverty. In achieving their goals, they mentioned several key activities, which they intend to pursue. These include; active involvement in petty business - setting up kiosks, buying crops from farmers and selling them in towns, increasing production of commercial crops such as coffee and cashew, and livestock keeping. With livestock they prefer to keep pigs because they reproduce quickly compared to other livestock and that the value of pigs is relatively high. Some had plans of attending vocational training schools to enable them acquire skills such as carpentry, motor vehicle mechanics, and driving. These would enable them to employ themselves in the non-agricultural sector. They mentioned farming as the chief strength of their community especially in the past years. They noted that while production of coffee and cashew nuts has been a major source of income and prosperity, food crops have enabled them and their families maintain good health. They also keep livestock (including goats, chickens, pigs and sheep) in small quantities. When these reproduce, they can become a source of capital for starting up a business. Livestock keeping is also a form of saving. They noted that while goats are long-term assets, chickens are assets for emergency because it is easy to sell them when one has an emergency. Summary statistics revealed that out of the 332 households that were sampled, only 33 were headed by youth below 30 years of age (approximately 10 percent). When we considered youth below 25 years, then they headed only 11 households (0.3 percent). This shows that adults headed most of the households in the communities surveyed. If we take the youth headed households (below 30 years), then 97 percent of them indicated that farming (in their own farms) was their customary main occupation. The majority (42 percent) had agricultural wage labor as their secondary occupation. Statistics from youth (between age 15 and 25) who participated at the end of the household interviews revealed that they) seemed to be optimistic about the future, and 78 percent of them believed that they would be on the upper half (above step 5) of the ladder of life when they reach 30 years. When asked on the occupation they wanted to have when they were 30 years, while 37 percent indicated that they preferred to have their own business, 23 percent said they preferred salaried jobs, and 22 percent preferred engaging in agricultural activities. A good proportion of them (48 percent) were fairly sure that they would fulfill their ambitions of having those occupations. Others said they were completely sure (38 percent) and those who were not at all sure were about 22 percent.
12.2 Gender Differences within Youth Generally, the attitudes of youth towards differences in gender roles are reflective of their parents and community beliefs. They believe that men have more freedom than women, both in the economic and lifestyle choices that are open to them. This applies to relations before and after marriage, and is a

_____________________________________________________________________
MOVING OUT OF POVERTY: Understanding Growth and Democracy from the Bottom Up - Regional Synthesis Report
94
reflection of traditional practices. For example, in Luhindo, the youth focus group noted that the spread of HIV AIDS in the household could be reduced as a result of men restricting their wives from going out of their homes. The main difference between the beliefs of male and female youth concerns economic aspirations. Both groups recognize that agriculture was the basis of the economy in the region, and it was likely a necessary starting point for any economic endeavour. Men, however, aspired to non-agricultural activities and often mentioned plans that extended beyond the confines of the village. Of the youth surveyed in the communities of Kikolo, Liuli, Luhindo and Mkalanga, 55 percent of men aspired to agricultural careers in ten years, while 31 percent hoped to pursue commerce or trade and 14 percent were interested in other activities such a salaried employment, teaching or fishing. Women tended to focus more on agriculture and other activities on the household level, with 72 percent in the same communities saying they envisioned themselves in agriculture in ten years. Only a very small percentage aspired to commercial activities or teaching. Where women listed the major impediments to development to be extreme poverty and inadequate supply of inputs, men listed more external obstacles such as poor roads and transportation to markets. In Muhuwesi, the men said that while agriculture was important, trade was much more important. The male youth in Muungano had similar believes, but were not as adamant. There is also a certain sentiment among female youth that aspiring to future occupations other than farming was unrealistic. Traditionally, the role of women is within the household. In Nyoni, women believed that once they are married their fate is tied to their husbands. In Ndenyende, almost all young women mentioned that their tendency to envision a future in agriculture reflects the fact that women are the main food producers and the fact that getting capital for trade is more difficult for young women than it is for young men.
12.3 Constraints/Problems Facing Youth It was perceived by most of the youth that obstacles they face in realizing their goals include their low levels of education, lack of business skills, and lack of capital. All of these hinder them from participating effectively in non-farm activities such as trade. Table 12.1 provides summary statistics for reasons perceived by the youth as obstacles to their aspirations of working in the occupation they want at age 30.
Table 12.1: Obstacles for Working in Chosen Occupations
Reason Percentage Response Cannot get the necessary education 16 Family circumstances and responsibilities 13. Financial problems 43 Health problems 14 Overall shortage of jobs 1 Bad luck 8 Other reasons 2 Nothing will interfere 1

_____________________________________________________________________
MOVING OUT OF POVERTY: Understanding Growth and Democracy from the Bottom Up - Regional Synthesis Report
95
Other problems, which are also common to the rest of the community members, include low producer prices for agricultural produce, lack of credit for agricultural activities, high prices of agricultural inputs, poor transport to marketing centers, plant pests and diseases, poor health coupled with lack of access to health services, high prices of consumable goods (e.g. soap, sugar, kerosene etc.) and in some communities wild animals devouring their crops. Irrespective of their socio-economic status and gender, all young people should have the right to participate in policy formulation, decision making, leadership and national development; freedom of lawful expression; protection from all forms of abuse, coercion, violence, exploitation and degradation; access to all benefits of citizenship such as education (including opportunities for life-long learning), training, employment, housing, health care, and recreation; and a secure future through policies and practices ensuring sustainable development. As future adults, rural youth need to be prepared in improving their capabilities to produce both food and cash crops, to conserve productive resources in the rural environment, improve their skills and abilities in carrying out income generating activities, relieve population pressure and improve nutrition and the well being of farming families and develop leadership and the ability to work well with others in groups and community situations. As such, their knowledge, skills, attitudes, and behavior are of vital importance for their future. The government therefore has to initiate projects that would assist the youth to take up the challenges they face. Examples of rural youth projects in development which could be initiated include:
• Non-formal education projects for out-of-school youth. Generally these can be introduced as special training programs in literacy improvement, leadership development, vocational and productive skill training, youth cooperatives, and population education.
• Income generating projects that allow individuals and groups to build on the training received,
with supervision through youth group activities and credit facilities.
• Provision of rural services that include youth as beneficiaries. These services may include supervised credit for young farmers and rural youth, making available learning and production resources, health care and recreation activities.
• Organized community development programs that challenge and satisfy the energies and
aspirations of rural youth. Examples of these include reforestation, community development and community agricultural shows.
• Organization and guidance of rural youth for leadership development, skill training, service and
production purposes. This includes the formation of youth clubs such as young farmers, religious organizations, sports clubs etc

_____________________________________________________________________
MOVING OUT OF POVERTY: Understanding Growth and Democracy from the Bottom Up - Regional Synthesis Report
96
CHAPTER 13.0: INTERACTION ACROSS FACTORS 13.1 The Nature of Factors for Mobility Due to the nature of economic activities in the communities that were studied, there was not much variation in the factors responsible for mobility. In general, the most frequently cited factors for upward mobility were the ability to diversify to other non-farm economic activities that are less susceptible to shocks such as weather vagaries and poor crop prices. The interactions among different factors for mobility are not very clear, though some cases could be drawn from the focus group discussions and life stories, pointing to some kinds of interactions. Downward mobility was largely associated with inability to diversify economic activities (hence, dependence on crop farming alone as the only source of livelihood), shocks (both at community and individual level), inadequate or lack of productive resources – such as land, and lack of access to important services such as credit and infrastructure. 13.2 Mobility Factors The most commonly cited factors for upward mobility by many of the households that were below the community poverty line during the past decade were improved prices, which resulted from policy reforms that liberalized agricultural crop market, eliminating the monopoly of the cooperative unions. The ability to cultivate large farm size for higher farm output therefore, had to be matched with the availability of crop markets and good prices to move the household out of poverty. Though sequencing is important here – in the sense that agricultural output has to be in place first for good prices and markets to be useful to the household, the interaction of these factors is apparent. Most households that managed to cross the community poverty lines had sizeable farms, and farm outputs – particularly cash crops were reasonably good during the early days of crop marketing liberalization. Since farmers received cash payments in return for their crops, they transformed their farm wealth into a number of assets – including the construction of good houses, roofing (using iron sheets) of their houses and purchase of bicycles, which saw them crossing the community poverty lines. Among the factors that inhibit upward mobility are poor crop prices and high prices for agricultural inputs. At the onset, there appear to be a combination of poor agricultural output, (largely a result of weather vagaries and inability to use better inputs), and poor crop prices, working together to impact negatively on the households’ income. Poor agricultural produce and prices affected the prosperity of majority of households. This is because all the studied communities are heavily dependent on agriculture for livelihoods. But at higher steps on the larder of life, the most important factors for upward mobility were mostly linked with the ability to diversify to other non-farm activities. However, even at these steps, farming and livestock keeping and the factors affecting these activities still remained important for upward mobility. On the same score, the major factors underlying inequalities and mobility in the communities seem to spin around agriculture and ability to supplement it with other non-farm activities. These could well be put to light by the following reflections from Ndenyende community.

_____________________________________________________________________
MOVING OUT OF POVERTY: Understanding Growth and Democracy from the Bottom Up - Regional Synthesis Report
97
The gap between the very worse off and the very well off over the previous 10 years was said to have increased because:
• The very worse off no longer had access to agricultural inputs while the very well off still had the access;
• The very well off were using casual laborers in their farms while the very worse off couldn’t afford hiring labor;
• The very well off also have other income generating activities from which they were getting capital to inject into agricultural production;
• The very poor of 1995 had cashew nuts to sell, but the very poor of 2005 had nothing to sell; • Casual labor employment opportunities that the very worse off depend on were more available in 1995
than in 2005. These kinds of employment were available in farm activities, which have been badly hit by a number of factors including drought and high input prices.
Excerpts from Male and Female FGDs, Ndenyende
13.3 Multiplicity of Factors at Household Level One of the difficulties in identifying the interactions between factors lies in the nature of the shocks that underpin mobility in general. In some cases multiple shocks were found to be the cause of downward fall for some people. This is exemplified by a drastic fall by one rich person in Nyoni community. The respondent was once a very rich person in the village but at the time of the survey he was among the poorest/destitute. As pointed out earlier, Mr Yokim Thilia was one of the richest persons in the village. However, at the time of survey, he was destitute! His economic downfall was caused by the following multiple factors: His relatives were boarding his business cars without paying fare (free riding); an accident of one of his cars in 1990 that drained much of his savings; and theft of his vehicle spare parts after thieves broke into his house at night. Other factors that caused his downfall include: borrowing food for his household then repaying more than what he borrowed (this happened when his businesses were shaking); taking his daughter to a secondary school but the daughter went back home with pregnancy without completing school; and having two dumb daughters who could not marry, thus remaining dependent on him for ever. The above information points to a number of factors that led to a significant downfall by an individual who was considered to be one of the richest in the past in Nyoni village. Most factors seemed to have impacted separately, and little can be inferred in terms of interaction among the responsible factors. In the first place, the social networks have acted negatively against the person because of free riding by the relatives, and failure to help him out during the difficult times when his vehicle got accident. The other factors seemed to have occurred separately, and there were little interactions among the factors that caused the downfall. Interaction between diseases such as HIV/AIDS and other factors could be inferred from the focus group discussions and life histories. The burden to the household is unbearable when a member contracts the virus and falls seriously ill for a long time. In the first place, as the person gets sick, it

_____________________________________________________________________
MOVING OUT OF POVERTY: Understanding Growth and Democracy from the Bottom Up - Regional Synthesis Report
98
amounts to reduced workforce in the farm. And the situation is even worse when the victim is the household’s breadwinner. With the absence of proper social protection mechanisms, and inability of the traditional social protection mechanisms (help from relatives, friends and neighbors) to meet the challenge, the household is easily plunged into perverse poverty. The main concern is the pressure exerted on family resources and time taken to care for the sick, thus reducing significantly the time spent on farm activities. Other important factors that caused downward mobility include: increasing number of dependents in many households, health related problems, lack of access to markets, lack of access to credit, lack of access to social services (such as hospitals and secondary schools), poor road network which impedes transportation of crop produce, destructive animals (monkeys), and harsh climatic conditions in some seasons. Large families due to polygamy were cited as an important factor affecting mobility in some communities in Ruvuma region in the focus group discussions. The traditions and culture of the Matengo people in general, encourage men two wives or more. This in turn creates large families. The outcome on the household mobility depends on a number of factors. On one hand, if the many wives are “squeezed” in a small piece of land, the resulting large family will be plunged into poverty and in most cases, the household members end up working as casual laborers in other people’s farms to earn something for subsistence. On the other hand, if the household has large size of farms, the introduction of an extra wife simply translates into increased labor force for the household. Polygamy was also cited as an important factor for downward mobility in Ndenyende and Muungano villages. However, the generalizations from the focus group discussions give little insight into the ways in which polygamy interacts with other factors to cause downward mobility.
13.4 Policy Related Factors and Mobility The focus group discussions in Liuli community revealed that there have been serious stagnation and downward mobility in the community, a result of interaction of number factors, notably – lack of access to livelihood opportunities, poor prices and lack of access to social services. “Liuli has less rich people today than it used to be 10 years ago. The reasons given for having fewer prosperous individuals include: decline of fishing activities in the community and high living costs. Currently people’s ability to access basic services is very low. People are poorer today than in the past because the purchasing power in very low with exception of a few at the top of the ladder. Those formally engaged in fishing have turned into poverty because there is no alternative source of income in this community. There are very few and/or limited sources of livelihood in the community. The price of produce is also constantly going down.”
Excerpt from Women FGD, Liuli, April 2005 Some of the factors however, do not occur in isolation. For instance, the issue of lack of access to markets, and high prices for agricultural inputs are to a large extent linked to the collapse of cooperative unions – the best example being Mbinga Cooperative Union (MBICU), as pointed out in Mkalanga and
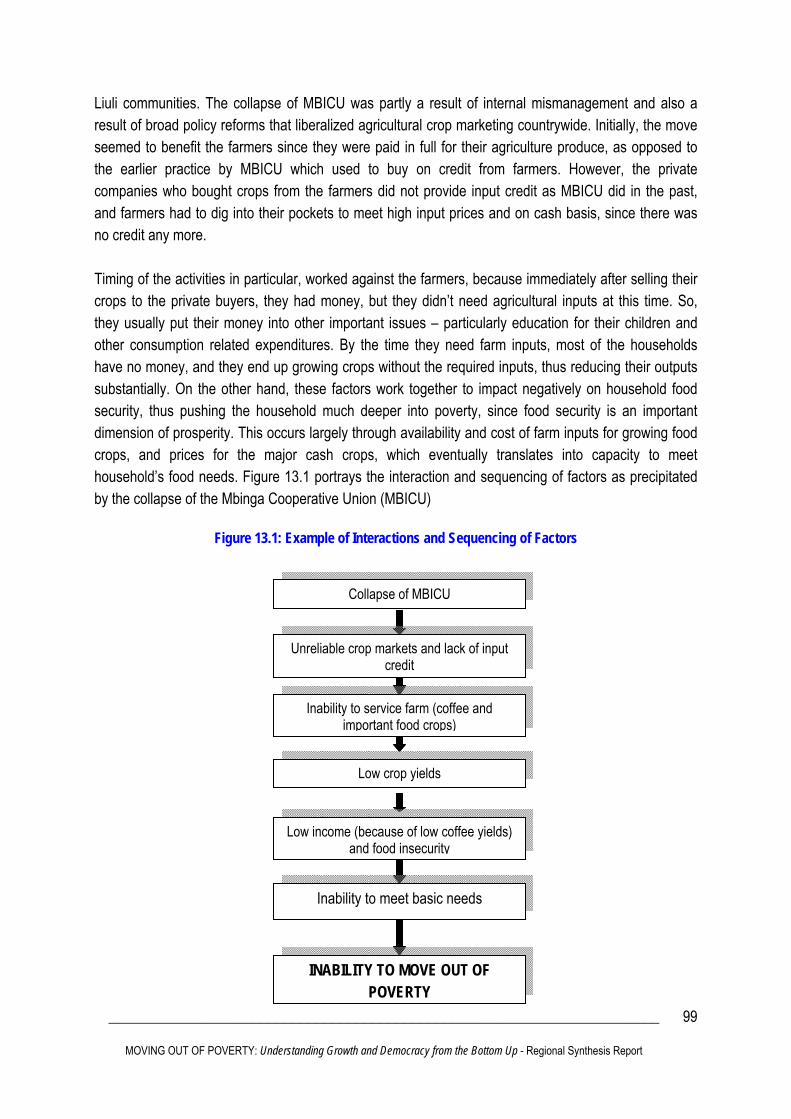
_____________________________________________________________________
MOVING OUT OF POVERTY: Understanding Growth and Democracy from the Bottom Up - Regional Synthesis Report
99
Liuli communities. The collapse of MBICU was partly a result of internal mismanagement and also a result of broad policy reforms that liberalized agricultural crop marketing countrywide. Initially, the move seemed to benefit the farmers since they were paid in full for their agriculture produce, as opposed to the earlier practice by MBICU which used to buy on credit from farmers. However, the private companies who bought crops from the farmers did not provide input credit as MBICU did in the past, and farmers had to dig into their pockets to meet high input prices and on cash basis, since there was no credit any more. Timing of the activities in particular, worked against the farmers, because immediately after selling their crops to the private buyers, they had money, but they didn’t need agricultural inputs at this time. So, they usually put their money into other important issues – particularly education for their children and other consumption related expenditures. By the time they need farm inputs, most of the households have no money, and they end up growing crops without the required inputs, thus reducing their outputs substantially. On the other hand, these factors work together to impact negatively on household food security, thus pushing the household much deeper into poverty, since food security is an important dimension of prosperity. This occurs largely through availability and cost of farm inputs for growing food crops, and prices for the major cash crops, which eventually translates into capacity to meet household’s food needs. Figure 13.1 portrays the interaction and sequencing of factors as precipitated by the collapse of the Mbinga Cooperative Union (MBICU)
Figure 13.1: Example of Interactions and Sequencing of Factors
INABILITY TO MOVE OUT OF POVERTY
Inability to meet basic needs
Low income (because of low coffee yields) and food insecurity
Low crop yields
Collapse of MBICU
Unreliable crop markets and lack of input credit
Inability to service farm (coffee and important food crops)

_____________________________________________________________________
MOVING OUT OF POVERTY: Understanding Growth and Democracy from the Bottom Up - Regional Synthesis Report
100
CHAPTER 14.0: CONCLUSIONS AND POLICY OPTIONS 14.1 The Policy Focus The Moving out of Poverty study sought to understand from the bottom-up the range of factors that helps or hinders movement out of poverty or prosperity over time at the individual, household, and community levels. The study has strong relevance for policy design and monitoring of poverty reduction strategies and policies in Tanzania because starting from the bottom up, it provides policy insights based on the experiences of those who have actually moved out of poverty and stayed out of it over time, those who have maintained their wealth over time, and those who have fallen down and/or stayed trapped in chronic poverty. The study explored a wide range of social, political, institutions, and economic mechanism that hinder or facilitate poor people’s access to economic opportunity and movement out of poverty. The study further provides insights on how freedom, power and aspirations contribute in building assets or wealth creation. The study focused on three major policy issues namely economic growth; governance; and access to markets. The study was conducted with the understanding that the country’s economic performance has been satisfactory following implementation of the ongoing economic reforms, but there is widespread mismatch between the achievements at macro level and the resulting impacts at the local community level. Secondly, bad governance is being increasingly regarded as one of the root causes of poor social, economic and political development. Governments sometimes acts as obstacle to growth either through “sins of omission” for example if services are not delivered or “sins of commission” when the government interferes where it should not. Lastly access to markets in the liberalized economy has been a major contemporary policy issue given the dissolution/failure of crop cooperative unions. Three hypotheses were tested under this study:
1. Ruvuma Region, being marginalized relative to other regions in Tanzania has not experienced the desired growth given its agricultural and other economic potentials.
2. Poor access to agricultural markets is another major impendent to poverty reduction in the
study area. 3. Poor governance is one of the major impediments to poverty reduction.
14.2 Factors for Upward and Downward Mobility Idiosyncratic factors for upward or downward movement were pointed out in the household questionnaire, focus group discussions and individual life stories. Factors for downward movement include: Ill health; theft; large number of dependants in some households; unwise spending by some villagers (e.g. excessive drinking); low bargaining power of artisanal miners; lack of “development

_____________________________________________________________________
MOVING OUT OF POVERTY: Understanding Growth and Democracy from the Bottom Up - Regional Synthesis Report
101
jealous,” that is lacking the spirit of competition for development; lack of sufficient capital for expansion of production activities; low efforts in farming activities; and investment failures. Factors for movement up the ladder include: hard work; business expansion; and diversification of economic activities. Community level factors and processes which are important in terms of moving out of poverty, maintaining wealth or keeping people trapped in the community include access to markets, access to credit, access to social services (such as hospitals, schools, water), road network, destructive and killer animals (monkeys and lions), disruption of sources of livelihood like the case of kokolo banning in Liuli, and insecurity like the case of the wave of robbery in Mkalanga and killer animals in Muhuwesi, Ndenyende and Muungano. The policy options for this study are based on the following conclusions drawn from the study. These conclusions are clustered under two themes: growth and poverty; improving livelihoods sources; and good governance. 14.3 Growth and Poverty Judging from the growth related indicators, one notices that Ruvuma region has been recording positive growth rate overtime. The region’s per capita income has grown by 17 percent in real terms between 1997 and 2001 from TZS 157,749 to TZS 930,010. However, in relation to other regions Ruvuma ranks 10th from the bottom. Thus, in terms of position, the region ranked better in 1997 (at 16th position from the bottom) than it did in 2001. Assessment using non-income growth indicators reveal a mixed picture as quite a number of them show that Ruvuma is relatively performing better than other regions while other indicators give a different trend. Ruvuma for example has more individuals who are below the food poverty line (27 percent of the total regional population) compared to Dar es Salaam (18 percent), Arusha (25 percent), and Rukwa (19 percent) regions. However, in terms of percentage of households located within 1 kilometers of drinking water during the dry season Ruvuma appears to be the best of the 6 regions (Singida, Dar es Salaam, Rukwa, Arusha and Lindi). Using Human Development Index (HDI), a summary measure of human development measuring the average achievements in three basic dimensions of human development (a long and health life, measured by life expectancy at birth; Knowledge, measured by adult literacy rate and the combined primary, secondary and tertiary gross national enrollment; and a decent standard of living, as measured by GDP per capita, Ruvuma is categorized under Medium Human Development Index (0.514) against the national average of 0.495 for Tanzania. While the HDI measures average achievement, the Human Poverty Index (HPI) measures deprivations in the three basic dimensions of human development captured by HDI: Lack of a long and healthy life/vulnerability to death at a relatively early age as measured by probability at birth of not surviving to

_____________________________________________________________________
MOVING OUT OF POVERTY: Understanding Growth and Democracy from the Bottom Up - Regional Synthesis Report
102
age 40; Lack of knowledge/exclusion from the world or learning and communications, as measured by the adult illiteracy rate; Lack of a decent standard of living/ lack of access to overall economic provisioning, measures as a percentage of the population not using improved water sources and percentage of children under five who are underweight (combined in an un-weighted average). Ruvuma Region shows a high HPI (18.2), against an average of 22.1 for Tanzania. One important lesson drawn from these statistics is that there is notable evidence of correlation between growth and grassroots changes in welfare and overall living standards, judging from individual indicators of growth and poverty, and combined indicators. 14.4 Improving Livelihood Sources 14.4.1 Access to Markets One of the major policy drives in the 1990s that have resulted to a temporary positive impact on the well-being of community members is the liberalization policy. This resulted to a short-run increase in prices as private buyers were allowed to buy from the villagers, but in return it has resulted to severe lack of agricultural inputs, and decreased prices as the middle men and middle women spouted. As liberalization progresses, the agricultural marketing has become haphazardly organized. Since liberalization, the market is neither stable nor reliable. Private traders are dictators of prices and farmers are losers because they are negotiating producer prices from a very weak position. To a larger extent market liberalization and collapse of cooperatives are the major factors which have led to the disintegration of the coffee industry in Mkalanga village and Matengo area in general, and cashew nut in Tunduru District. Farmers have lost completely the favorable marketing arrangements which used to be practiced by MBICU and the Cashew nut Board which had a provision of servicing the coffee and cashew plants and providing agricultural extension services such as demonstration farms where farmers used to learn plant husbandry etc. In relation to access to agricultural markets, the following are recommended:
(i) The procedure of allocating crop products buyers to each village in Tunduru District is commended as it reduces the marginalization of isolated villages. The District Authority should maintain this at the same time imposing strict conditions on middlemen.
(ii) The re-establishment of primary societies that are meant to solve the markets and agricultural inputs hurdles should be supported in both coffee and cashew producing areas. This should be spearheaded by the Ministry of Agriculture, Food Security and Cooperatives. In Muhuwesi village, some farmers have organized themselves and transport their agricultural produce, in particular cashew nuts, to neighboring regions for better prices.
_____________________________________________________________________
MOVING OUT OF POVERTY: Understanding Growth and Democracy from the Bottom Up - Regional Synthesis Report
103
(iii) Since cashew nut is the only cash crop in Tunduru, the Cashew nut Board is urged to ensure that the price of cash nuts that is announced every year is enjoyed by all cashew nut producers, unlike the current situation where only some producers in few areas where the crop is produced get good prices. In order for this to be realized, road construction for the development of the Mtwara corridor should be speeded up because some buyers lower the prices of crop products to compensate for high transport costs.
(iv) The Specialty Coffee Growers initiative in Nyoni has not only increased the coffee
production and quality of exported coffee but has also created a reliable and favorable market for the members. Efforts have to be made to get other coffee growing villages in Mbinga District aboard. However, NGO activities are programmatic and Technoserve should not be seen as replacing the role of government in employing Agricultural Extension Officers. Efforts have to be made by the Local Government Authority to employ Agricultural Extension Officers as per need.
14.4.2 Access to Agricultural Inputs Poor access to agricultural inputs has been cited as another impediment to increased agricultural production. In relation to this problem, three recommendations are put forward:
(i) Establishing effective credit facilities to assist with farm inputs purchase. This could be addressed through access to rural micro finance services for subsistence farmers, and promoting and sustaining community based savings and credit schemes such as Saving and Credit Cooperative Societies (SACCOS)
(ii) Promote the formation of groups, associations and cooperatives, which would act as a
conduit for community empowerment. This goes in line with strengthening the current Cooperative, that is, Crop Unions and Crop Societies to conduct the role of inputs provision by agreed mechanisms.
(iii) Facilitating the informal moneylenders to become formal. The high interest rate charged
might be related to the risk associated with the type of customers these moneylenders are serving.
(iv) Targeting access to agro-inputs by subsistence farmers through targeted inputs-subsidy to
selected food and cash crops 14.4.3 Promotion of the Cross Boarder Trade The importance of cross boarder trade was echoed in this study. This is due to the fact that being isolated from Dar es Salaam (the main imports center) villages in Ruvuma Region has comparative advantage in importing consumer goods from neighboring countries such as Malawi and Mozambique.

_____________________________________________________________________
MOVING OUT OF POVERTY: Understanding Growth and Democracy from the Bottom Up - Regional Synthesis Report
104
The need to workout mechanisms that will facilitate the cross boarder trade is pressing. Construction of the bridge across River Ruvuma to Mozambique is one step ahead. Recently the government of Tanzania and Mozambique signed a memorandum to construct a bridge across river Ruvuma. This is a commendable move, as it will ease cross boarder trade and thus impact positively on the welfare of villagers in Tunduru and Mbinga Districts. Likewise, the ongoing “Mtwara Corridor” initiative which entails construction of a trunk road from Mtwara to Mbamba Bay in Mbinga and a port linking Tanzania and Malawi is another commendable initiative that needs to be supported. 14.4.4 Access to Education and Entrepreneurial Skills The role of non-farm income generating activities in upward movement has been underscored. However, lack of innovativeness to explore new opportunities was mentioned as one of the poverty traps in the villages surveyed. Many villagers lack adequate formal education and vocational training. This makes them fail to come up with alternative income sources and thus remain trapped in poverty. Due to poor capacity of secondary education in absorbing a big number of pupils who finish primary school (and in particular after the inception of PEDP), the role of vocational training can not be emphasized. Unfortunately, it was noted that only one community had a technical and vocational training 10 years ago but it was not functioning at the time of survey. This means that a pool of pupils has nowhere to turn to for further education after finishing primary education. Thus, it is imperative to:
(i) Facilitate access to vocational training as a major move towards innovativeness, and reduction of theft resulted from idleness.
(ii) Develop programs for imparting entrepreneurial and business skills especially to the youth
who aspire to couple agricultural production with off farm activities.
(iii) Strengthening the National Education Fund and introduce the Education Credit Schemes for accessing secondary schools so that a big number of poor communities get access to these facilities.
14.4.5 Access to Health Services The major gap identified with regard to health services in the studied communities is the issue of proximity, and affordability, which entails, not only the medication costs, but also the other related costs – particularly transport, especially where the patient has to be taken to a hospital – and not a dispensary or a health centre. Respondents indicated no improvement in the quality of health services over a decade. The quality was perceived to be bad in half of the surveyed communities, just as it was 10 years ago. In relation to this we recommend for:

_____________________________________________________________________
MOVING OUT OF POVERTY: Understanding Growth and Democracy from the Bottom Up - Regional Synthesis Report
105
• Elimination of all forms of barriers to health care by exempting the very poor, pregnant women, older persons and disabled persons, and children, including reducing distance to health centers, and improving the service delivery system and treatment.
14.4.6 Access to Water In order to save lives of the villagers and in particular women from the threat of wild animals, save the time used in fetching water for productive activities, and speed up development process by constructing brick houses, a water project should be given top priority by the government and any other organization having interest on development of Ndenyende village. 14.4.7 Programs for Vulnerable Groups Programs to assist people with disability are not widespread in Tanzania. The situation is even worse in the rural areas. This makes it hard for disabled person to live a decent life in the rural areas if he/she doesn’t have extended family to lean on. Although in this study we had only one case at hand, there could be several other cases that need attention. It is imperative therefore to:
• Strengthen the ability of local authorities to identify and provide support (including access to government services) to the most vulnerable persons in the community including the old, the disabled, women and children.
14.4.8 Youth and Development As future adults, rural youth need to be prepared in improving their capabilities to produce both food and cash crops, to conserve productive resources in the rural environment, improve their skills and abilities in carrying out income generating activities, relieve population pressure and improve nutrition and the well being of farming families and develop leadership and the ability to work well with others in groups and community situations. As such, their knowledge, skills, attitudes, and behavior are of vital importance for their future. The government therefore has to initiate projects that would assist the youth to take up the challenges they face. Examples of rural youth projects in development which could be initiated include:
• Non-formal education projects for out-of-school youth. Generally these can be introduced as special training programs in literacy improvement, leadership development, vocational and productive/specialized skill training, youth cooperatives, and population education.
• Income generating projects that allow individuals and groups to build on the training received, with supervision through youth group activities and credit facilities.
• Provision of rural services that include youth as beneficiaries. These services may include supervised credit for young farmers and rural youth, making available learning and production resources, health care and recreation activities.

_____________________________________________________________________
MOVING OUT OF POVERTY: Understanding Growth and Democracy from the Bottom Up - Regional Synthesis Report
106
• Organized community development programs that challenge and satisfy the energies and aspirations of rural youth. Examples of these include reforestation, community development and community agricultural shows.
• Organization and guidance of rural youth for leadership development, skill training, service and production purposes. This includes the formation of youth clubs such as young farmers, religious organizations, sports clubs, etc.
14.4.9 HIV/AIDS The HIV/AIDS prevalence stands at 6.8 percent in Ruvuma region (TACAIDS et al., 2005). Yet both from the focus group discussions and life stories HIV/AIDS did not feature strongly as a major threat to prosperity of the villagers. This is perhaps due to the fact that the culture and community norms allow men to marry unlimited number of women (and maintain others – unofficial ones outside (concubines). In a situation where there is HIV/AIDS pandemic, women do not have any right to protect themselves from the disease. Thus, women and therefore their respective children are exposed to a very high risk of being infected. We recommend that:
• Series of campaigns on the devastating impacts of the pandemic need to be conducted in the Region in order to keep the prevalence rate low and avoid new infections.
14.5 Good Governance On average more people were found to be currently participating in important community decisions compared to ten years ago implying improvement in conduct democracy. This is exemplified by campaigning during the election period. People vote for the candidates that they wish to vote for. At village level, people participate in village assembly and other village committee meetings to make important decisions for the community. Furthermore, women have also gained voice over the year and are now also included in village decision-making machinery. This has mainly been attributed to political pluralism. It was also noted that there is more equality now in terms of voicing views and engagement of the community members in both political as well as development activities than there used to be 10 years before the survey. All political parties have equal chance to collect election registration forms and enter into election rally. Also, the public is always informed on different public rallies and/or Village Assemblies. Thus participation of the people in politics has improved tremendously during the last 10 years. The surveyed communities were found to be fairly transparent and democratic. The key decisions are made by the people through existing structure such as village meetings and village committees. However, despite these achievements, indicators on the extent of functioning and effectiveness of local governance including service delivery, law and order, and corruption indicate unsatisfactory results. In

_____________________________________________________________________
MOVING OUT OF POVERTY: Understanding Growth and Democracy from the Bottom Up - Regional Synthesis Report
107
many cases there have been breakdown of the government administrative machinery in responding to the voices of the people, and several malpractices have been cited. 14.5.1 Business Levies Despite the abolition of the levy on petty businesses, bicycles, livestock, development tax etc since 2003/04, tax collectors have sometimes been a hindrance rather than a motivation towards business expansion in some of the surveyed communities. When tax evaders are captured in Liuli village, an arbitrary cumulative tax (which is relatively high) will be imposed against them. There are cases where such punishment is applied to all other businesses on the pretext that they also practice tax evasion. In addition, the business community in the village is unhappy with the current flat rate of TZS 35,000 against each business entity regardless of the size as such tax structure has tended to discourage small businesses and favor large scale businesses. Unfortunately, there are no clear rules and regulations when it comes to imposing levies. Decisions on levels and multiplicity of levies have not been consistent over time. In most cases, the levels of levies are perceived as being substantially high. 14.5.2 Combating Wild Animals Threats The threat of lions in the three villages surveyed in Tunduru District and in particular during the farming season deserves a mention. Contrary to the conventional types of assaults people are used to, these villages are devastated by the threat of “human eater” lions. This has contributed to the poverty situation through decreased agricultural productivity. Others like elephants, monkeys and wild pigs destroy the crops in the field thus causing villagers to sink into poverty even when they had worked very hard in their farms. Nevertheless, the government has not responded to people’s endless cries. In relation to this we recommend for the following:
(i) The wild life authority should devise ways to combat this threat as it is impoverishing communities all over Tunduru District. One way could be strengthening of the wildlife harvesting system by provision of a gun to the village authority.
(ii) The Local Government Authority should explore the possibility of supporting the formation
of social/economic/farming groups. These groups will not only speed up the agricultural activities but also will also act as security guards against wild animals that are a threat to villagers especially when one is in the farm alone and when the crops have advanced to form a bushy cover.
(iii) The wild life authority should organize and assist in the implementation of comprehensive
hunting campaigns so as to address the problem of destructive monkeys.

_____________________________________________________________________
MOVING OUT OF POVERTY: Understanding Growth and Democracy from the Bottom Up - Regional Synthesis Report
108
14.5.3 Theft From the studies, it became apparent that communities are not safe. Theft cases were reported at household level, where thieves break in the house and steal valuables. Theft of ripe produce that is still in the farm waiting for harvesting is also common, yet there response to combat it has remained ineffective. This is a governance issue that needs to be resolved by devising a long lasting and effective mechanism to combat theft. 14.5.4 Mining Activities Mining activities are an opportunity that can help the community move quickly out of poverty, if the villagers are empowered to take part actively in mining and doing income-generating activities that complement mining. However, the government was hardly monitoring exploitation of the minerals and controlling prices of the gemstones. The major constraints facing the small miners/artisanal miners was in relation to access to sophisticated mining equipment, corruption in the provision of title deeds for ownership of mining sites, and lack of regulatory mechanism for regulating the mining procedures, and selling gemstones. Thus;
(i) The government should explore the possibility of protecting the small miners and collecting taxes from all parties involved in mining activities.
(ii) The Tunduru District Authorities should facilitate timely availability of title deeds for small miners; educate them on gemstones and how best to mine them; control price of the gemstones; and empower the artisanal miners to access capital, especially basic tools and equipment for modern mining practices
(iii) The government should develop a system to ensure safe and sustainable small-scale
mining including introducing safety awareness campaigns in the mining area and monitoring visits of prospecting and mining activities to ensure both safety and sustainability of activities.
14.5.6 Fishing Industry The findings have shown that a ban on beach seine is affecting the people at both household as well as community levels. A majority of fishermen can only afford simple and cheap fishing gears (kokolo) which are now prohibited. People are therefore denied incomes. In the spirit of Public-Private-Partnership (PPP), there is an urgent need for a dialogue between fishery authority and community members to bridge the existing gap between the two sides. Thus;
(i) Since this issue is linked with national broader policy on fisheries, there is a need to revisit the 1997 regulation on Fishery Act which was enacted to restrict the use of beach Seine. There is also a need to learn from neighboring countries whom they also border Lake Nyasa and where possible ensure that the fisheries policies and strategies are harmonized.

_____________________________________________________________________
MOVING OUT OF POVERTY: Understanding Growth and Democracy from the Bottom Up - Regional Synthesis Report
109
(ii) Investment in modern fishing gear does not seem to be a priority in this industry. The fishermen at Liuli can not fish in deep water because they don’t have modern equipment. Thus, the catch has always tended to be low. To remove such hindrances two measures need to be implemented one after another. These are Fisheries Skills and extension of credit to fishermen to enable them procure fishing gears.
14.5.7 Responsiveness to the Voices of the Poor There is a serious abuse of the governing rules and regulations by the higher authorities in the community, which need to be addressed. The governance structure in Mkalanga for instance has directly been suppressing voices of the people deliberately to protect and hide the evils. The vertical governance integration and/or relationship are poorly structured, as it does not allow the smooth flow of information in the governance chain. A huge governance gap that exists at the local level between Mkalanga village and District Council is a clear testimony to this claim. Policy needs to address this gap. In Ndenyende village, the government has not intervened in solving the road dispute. The closure of the road has cut the village from the rest of the world (such as cashew buyers) and excluded them from accessing social services available in the neighboring areas. A new road to the village must be built; either by making KIUMA fulfills their promise of constructing a new road to the village, or by government road building programs. Also, a new signboard pointing to the direction of the village and the primary school should be installed. The Head Teacher of Mkalanga Primary School who was reported to the District Council by the School Committee for embezzlement and poor governance of the PEDP funds was not made accountable to the subsequent collapse of the project. He was instead transferred to a nearby primary school in the same position (Head Teacher). The concerns raised by the people of Mkalanga village through the trusted organ (School Committee) were therefore not heard by higher authorities.
_____________________________________________________________________
MOVING OUT OF POVERTY: Understanding Growth and Democracy from the Bottom Up - Regional Synthesis Report
110
REFERENCES Bureau of Statistics (NBS) [Tanzania] and ORC Macro. (1997). Tanzania Demographic and Health Survey 2004-05. Dar es Salaam, Tanzania: National Bureau of Statistics and ORC Macro. Chacha, L. (2005). “Tanzanian Rural Roads in Poverty Reduction: Is the Government Spending Wisely in the Sector?” Final Research Paper Submitted to ESRF/REPOA/ISS as Partial Fulfillment for Postgraduate Diploma In Poverty Analysis, June 2005. Fan, S., P. Hazell, and S. Thorat. (1999): Linkages between Government Spending, Growth and Poverty in Rural India, International Food Research Institute, Research Report 110 Montgomery, M. R., M. Gragnolati, K. Burke and E. Paredes. 1999. “Measuring Living Standards with Proxy Variables.” Living Standards Measurement Study Working Paper No. 129. Washington D.C.: The World Bank. National Bureau of Statistics (NBS) [Tanzania] and Macro International Inc. (2000). Tanzania Reproductive and Child Health Survey 1999. Dar es Salaam, Tanzania and Calverton, Maryland: National Bureau of Statistics and Macro International Inc. National Bureau of Statistics (NBS) [Tanzania] and ORC Macro. (2005). Tanzania Demographic and Health Survey 2004-05. Dar es Salaam, Tanzania: National Bureau of Statistics and ORC Macro. URT. (1999). “Poverty and Welfare Monitoring Indicators.” Dar es Salaam: Vice Presidents Office. URT. (2002a). “Household Budget Survey – 2000/2001.” Dar es Salaam: National Bureau of Statistics, and President’s Office-Planning and Privatization (PO-PP). URT. (2002b). Poverty and Human Development Report 2002. Dar es Salaam: Mkuki na Nyota Publishers. URT. (2004). “Basic Statistics in Education—Regional Data 2004.” Dar es Salaam: Ministry of Education and Culture. URT. (2005a). “National Strategy for Growth and Reduction of Poverty (NSGRP).” Dar es Salaam: Vice President’s Office. URT. (2005b). Poverty and Human Development Report 2005. Dar es Salaam: Mkuki na Nyota Publishers.

_____________________________________________________________________
MOVING OUT OF POVERTY: Understanding Growth and Democracy from the Bottom Up - Regional Synthesis Report
111
URT. (2005c). “The Economic Survey.” Dar es Salaam: President’s Office-Planning and Privatization and Bank of Tanzania. URT. (2005d). “HIV/AIDS/STI Surveillance Report for January –December 2004, No.19. Dar es Salaam: National Control Program. Tanzania Commission for AIDS (TACAIDS), National Bureau of Statistics (NBS), and ORC Macro. (2005). Tanzania HIV/AIDS Indicator Survey 2003-04. Calverton, Maryland, USA: TACAIDS, NBS, ORC. Weiss, J. (2003): Infrastructure Investment for Poverty Reduction: A Survey of Key Issues, ADB Institute of Research Policy. Wobst, P. (1999): Structural Adjustment and Income Distribution in Tanzania: A Computable General Equilibrium (CGE) Analysis using a 1992 Social Accounting Matrix: PhD Thesis.