economic and human loss empirical models for … · article economic and human loss empirical...
TRANSCRIPT
ARTICLE
Economic and Human Loss Empirical Models for Earthquakesin the Mediterranean Region, with Particular Focus on Algeria
Abdelheq Guettiche1,2 • Philippe Gueguen3 • Mostefa Mimoune2
Published online: 8 December 2017
� The Author(s) 2017. This article is an open access publication
Abstract In this study, loss estimation models were
developed for reasonably accurate assessment of economic
and human losses from seismic events in the Mediterranean
region, based on damage assessment at an urban scale.
Data were compiled from existing worldwide databases,
and completed with earthquake information from regional
studies. Economic data were converted to a single common
currency unit (2015 USD value) and the wealth of the areas
affected by 65 earthquakes of the region from 1900 to 2015
was assessed. Reduced-form models were used to deter-
mine economic and human losses, with earthquake mag-
nitude and intensity as hazard-related variables, and gross
domestic product of the affected area and the affected
population as exposure-related variables. Damage to
buildings was also used as a hazard-related variable to
predict economic and human losses. Finally, site-specific
regression models were proposed for economic and human
losses due to earthquakes in the Mediterranean region, and
more specifically, in Algeria. We show that by introducing
the damage variable into the models, prediction error can
be reduced, and that accuracy of loss model estimation is
site dependent and requires regional data on earthquake
losses to improve. A case study for Constantine, Algeria
shows the improvements needed for increased accuracy.
Keywords Algeria � Earthquake loss
estimation � Mediterranean region � Reduced-formmodels � Seismic intensity � Seismic magnitude
1 Introduction
Modeling the economic consequences of natural hazard-
induced disasters has gained importance in recent years. In
the Mediterranean region, earthquakes are one of the most
critical natural hazards, and they can cause considerable
economic and social losses. Coupled with the vulnerability
of buildings and high social and economic exposure,
earthquakes are a regular and serious threat to communi-
ties, particularly in Greece, Italy, Turkey, Morocco, and
Algeria.
Between 1900 and 2015, the Mediterranean region
experienced thousands of damaging earthquakes, some of
which were major disasters, such as the earthquakes of
Messina, Italy, in 1908 (Barbano et al. 2005), Chios-
Cesme, Greece, in 1949 (Altinok et al. 2005), Agadir,
Morocco, in 1960 (El Alami et al. 2004), El-Asnam,
Algeria, in 1980 (Bertero and Shah 1983), Izmit, Turkey, in
1999 (Barka 1999), and more recently, Boumerdes, Alge-
ria, in 2003 (Laouami et al. 2006). These six damaging
earthquakes resulted in over 150,000 deaths and caused
direct losses of more than USD 26.5 billion.
Magnitude and distance are the two key parameters that
control the impact of an earthquake in an urbanized area.
From 1900 to 2015, even moderate earthquakes (for
example, the Agadir, Morocco, M 5.7 earthquake in 1960)
have caused considerable economic loss and numerous
fatalities, due to the vulnerability of traditional building
stock. Although the number of potentially damaging
earthquakes per year has neither increased nor decreased in
& Philippe Gueguen
1 Centre Universitaire Abdelhafid Boussouf, Mila 43000,
Algeria
2 Civil Engineering Department, Universite des Freres
Mentouri, Constantine 25017, Algeria
3 Institut des Sciences de la Terre (ISTerre), Universite de
Grenoble Alpes/CNRS, IFSTTAR, 38058 Grenoble, France
123
Int J Disaster Risk Sci (2017) 8:415–434 www.ijdrs.com
https://doi.org/10.1007/s13753-017-0153-6 www.springer.com/13753

recent decades, the vulnerability and exposure of commu-
nities have changed. According to the World Health
Organization (WHO 2016), the urban population will
continue to grow by approximately 1.5–1.6% per year from
2015 to 2030. As a result, about 2.8 million causalities due
to earthquakes can be expected worldwide by 2100 (Holzer
and Savage 2013). Because of the long return periods of the
largest and most severe consequence earthquakes, and
because few urban areas have yet to suffer such major
events in their current configuration, Jackson (2006) noted
that the greatest earthquake disasters appear to lie in the
future.
The benefits of natural hazard mitigation programs have
been fully recognized (Benson and Twigg 2004; White-
head and Rose 2009), and earthquake loss models can
provide relevant information for decision makers and pol-
icymakers (Gueguen et al. 2016). Moreover, the benefits of
rapid and effective economic and human loss estimation
modeling can be of utmost importance in the immediate
aftermath of earthquake disasters (Erdik et al. 2011; Jais-
wal and Wald 2013). Developing relevant earthquake loss
models is challenging, because most economic and human
loss models are based on post-earthquake interpretations,
and the empirical relationships are derived from field
observations that include substantial uncertainties (Brook-
shire et al. 1997). Before developing our earthquake loss
models, the key questions that had to be addressed were:
(1) how to represent the losses from the wealth of the
region via a macroeconomic indicator; (2) how to express
the economic losses by a homogeneous monetary value
over the period of the earthquakes; (3) how to express the
magnitude of the seismic hazard; and (4) which functional
form of the loss model needed to be used?
There are various models in the literature for rapid
assessment of earthquake losses based on economic and
human predictors, such as gross domestic product (GDP)
and population (Chen et al. 1997; Cha 1998; Chen et al.
2001; Dunbar et al. 2002; Heatwole and Rose 2013). Most
of the models are reduced-form models, which consider
only one or two parameters. Using a theoretical model,
Schumacher and Strobl (2011) showed that economic loss
(per capita) due to disasters increases with the size and
density of the population in the affected area, and that GDP
per capita and its squared value can show statistical sig-
nificance for loss models. Chen et al. (1997) proposed a
model for losses as a function of the occurrence probability
of the intensity and a vulnerability function derived
empirically by correlating reported losses from past
earthquakes with the GDP of the affected area. Using only
29 earthquakes, Cha (1998) developed a log–log relation-
ship between economic losses and GDP for each intensity.
Heatwole and Rose (2013) proposed a specific reduced-
form model based on U.S. earthquakes that considered a
linear regression model of predictor variables to predict
losses. Their study examined the population of the affected
area, the magnitude of the earthquake, and the total eco-
nomic losses adjusted to 2011 values using the Consumer
Price Index. Jaiswal et al. (2011) published a worldwide
model to predict economic impacts for any earthquake.
They examined earthquakes that occurred between 1980
and 2007 in 119 countries through a combination of seis-
mic intensity, spatial distribution of the population, and
total GDP, as scaled using an exposure correction factor—
ratio of wealth per capita to GDP per capita. The wealth
estimate per capita was adjusted to the year 2000 value
using values derived from the World Bank website.1
Based on the observation that economic and social
losses are generally related to physical damage caused to
buildings (D’Ayala et al. 1997; Bommer et al. 2002;
Coburn and Spence 2002; So and Spence 2013), models
require a detailed inventory of buildings. Several such
models have been developed to forecast socioeconomic
losses; for example, the U.S. Federal Emergency Man-
agement Agency (FEMA) methodology (HAZUS) for the
estimation of potential losses from disasters (FEMA 2016),
and the Norwegian Seismic Array (NORSAR) methodol-
ogy of seismic loss estimation (SELENA) that uses a logic
tree approach (Molina et al. 2010). For these models,
economic losses and casualties were computed based on
building vulnerability and damage for a given seismic
hazard. The requirement for a detailed building inventory
can be a major drawback for extending loss models to
specific areas because of the sheer number of different
buildings and the complications involved in accurately
assessing their seismic resistance (Gueguen 2013). But
recent studies have shown the efficiency of data mining-
based vulnerability assessment methods on a large scale
that use elementary building characteristics, such as the
number of floors and the roof shape. These structural fea-
tures can easily be assessed by remote sensing or are
contained in national databases (Riedel et al. 2014, 2015).
There are relatively few studies on human casualties in
the literature. Samardjieva and Oike (1992), Samardjieva
and Badal (2002), and Badal et al. (2005) analyzed and
tested a model to estimate the (log value of the) number of
casualties as a function of the magnitude and population
density for earthquakes worldwide. Nichols and Beavers
(2003) established a simple equation between fatalities and
magnitude for U.S. earthquakes. Jaiswal and Wald (2010)
developed a specific empirical model for estimation of
earthquake fatalities based on the shaking intensity and the
number of people exposed to earthquakes recorded
between 1973 and 2007. Post-earthquake observations
consistently show that there is strong correlation between
1 http://www.worldbank.org.
416 Guettiche et al. Economic and Human Loss Empirical Models
123

fatalities and damage to buildings. After the Armenian
earthquake in 1988, Armenian et al. (1997) reported that
being inside a building at the time of the earthquake was
the most efficient predictor for fatality, which was related
to the damage grade. Coburn and Spence (2002) developed
an empirical fatality model that considers the European
Macro Scale damage grade (EMS98) as a predictor vari-
able (that is, D4 for extensive damage and D5 for total
collapse).
A consensus emerges with regard to the importance of
building damage as a contributing factor for losses and the
need to consider regional models based on regional earth-
quake data. Since it appears that losses are directly related
to the amount of damage, construction quality will be a key
factor, which requires limiting the model to a specific
region wherein the structural design is comparable.
Moreover, in our dataset, many moderate earthquakes—for
example, the 1960 Agadir earthquake—caused significant
economic and human losses associated with severe build-
ing damage. Consequently, earthquake characteristics—for
example, magnitude, intensity—alone are not sufficient to
derive earthquake loss models. Moreover, to help earth-
quake crisis management and the prediction of the recovery
period, the number of people who lost their homes is
another key piece of information.
The main objective of this study is to consider damage
as a hazard-related parameter and to show improvement in
the accuracy of loss estimation obtained in empirical
models by using this parameter instead of intensity and/or
magnitude alone as hazard-related parameters. We devel-
oped empirical models for economic losses and human
losses (home loss, injuries, fatalities) from earthquakes as
applied to the Mediterranean region through the compila-
tion of data from different databases and countries. Par-
ticular attention has been paid to Algeria—a high exposure,
seismic-prone region—to show the benefit of reducing
uncertainties by considering regional events for loss mod-
els. Several models and exposure variables were also tested
(population, GDP). In the following section, we present the
data on seismological features (magnitude, location) and
economic, social, and physical consequences. When the
regression models are developed, the results and their
interpretations are discussed. Finally, these models are
applied to a case study of Constantine, Algeria using data
from a large-scale vulnerability assessment that was carried
out previously using data mining-based methods.
2 Mediterranean Earthquakes and Losses Data
To develop a seismic loss model for a specific region with
any degree of reliability, historical data of earthquake
impact must be carefully considered and compiled in a
comprehensive way. This involves the review of existing
earthquake catalogs, engineering damage reports, and
databases of losses reported after earthquakes, among other
sources. The objective of the present study was not to offer
a comparative analysis of data quality, and the selection of
the data sources here was based on their international use
and dissemination, or considered as being authoritative at
the national scale. For this study, hundreds of reports and
publications were consulted, but only a few reports that
described losses in detail were ultimately used.
The region considered is the Mediterranean region
(Fig. 1), which includes several earthquake-prone countries
and is exposed to both strong (for example, Italy, Algeria,
Greece) and moderate (for example, France, Morocco,
Libya) seismic hazard. The data are drawn from the period
of 1900–2015, and are for earthquakes for which detailed
loss reports were available. Following a scientific
approach, only accessible, public documents were consid-
ered, and these are referenced to allow the traceability of
the information used.
The characteristics of the earthquakes are given in
Tables 1 and 2. Magnitude and intensity (the Mercalli
modified intensity) are from the U.S. Geological Survey
earthquake search catalog2 for earthquakes after 1980, and
from public reports or peer-reviewed articles for others. As
an example, Benouar (1994) completed a database of the
strongest Algerian earthquakes for the 1900–1980 period,
the Algerian Technical Office (Azzouz 2002; Azzouz and
Rebzani 2005) provided information on specific earth-
quakes, and on behalf of the French ministry in charge of
natural disaster management, Payany (1983) provided
information on the damaging earthquakes that occurred in
France in 1909. The final dataset consisted of 65 earth-
quakes that occurred between 1908 and 2014, with maxi-
mal epicentral intensities C VI (Table 1), and located in
nine countries: Algeria (24), Italy (12), Greece (11), Tur-
key (11), Morocco (2), Spain (2), France, Libya, and Egypt
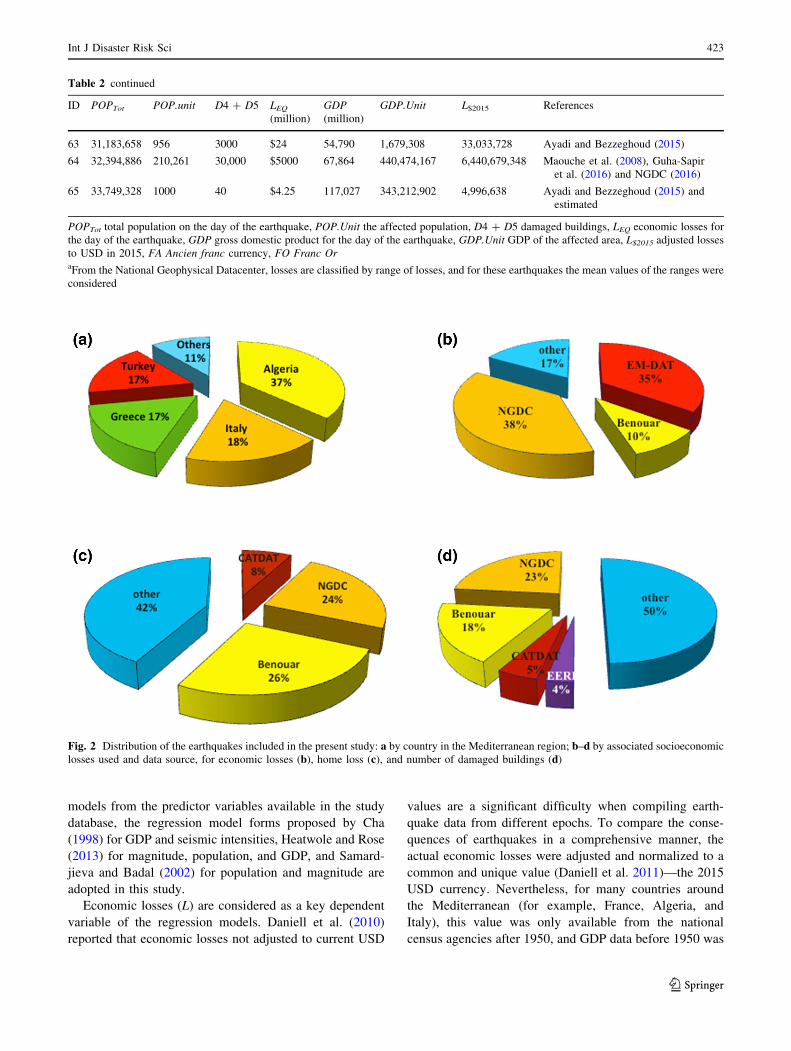
(1 each). Figure 2a shows the distribution of the earth-
quakes per country. This study does not include all the
damaging earthquakes in the Mediterranean region over
this period, mainly because either no data or only data from
largely uncertain sources were available for some in terms
of economic and human losses.
The Earthquake Engineering Research Institute (EERI)
reports (EERI 1986, 1992, 1995, 1998, 1999, 2004, 2012)
provided a lot of post-earthquake descriptions that were
collected in the field soon after the events, and these were
used to complete the seismological information in our
study. In terms of damage and economic and human losses,
the EERI reports are often limited to information available
immediately after the event. Several months, or even years,
2 https://earthquake.usgs.gov/earthquakes/search/.
Int J Disaster Risk Sci 417
123

can pass after an earthquake before this information can be
considered to be comprehensive, and definitive missing
information on total socioeconomic losses is never updated
in these reports. Additional official databases were there-
fore examined to gather the missing information for this
study: the International Disaster Database EM-DAT
(Guha-Sapir et al. 2016), the Damaging Earthquakes
Database CATDAT (Daniell et al. 2011; CATDAT 2016),
and the Significant Earthquake Database of the National
Geophysical Datacenter (NGDC 2016). In these databases,
no information was available on the reliability and accu-
racy of the data that they contained, related to, for instance,
the exposed populations, economic losses, and fatalities, as
these databases consisted only of compilations of reports.
The EM-DAT database was created in 1998 and is
maintained by the Centre for Research on the Epidemiol-
ogy of Disasters in Brussels, Belgium. This database con-
tains comprehensive data related to the occurrence and
effects of over 18,000 natural disasters throughout the
world, from 1900 until the present day. The EM-DAT data
were cross-checked with other sources of information, such
as UN agencies, nongovernmental organizations, and
reinsurance companies. The NGDC database that was
developed by the National Center for Environmental
Information is similar to EM-DAT. It contains data on over
5700 destructive earthquakes from 2150 B.C. to the pre-
sent, including information related to socioeconomic los-
ses. CATDAT was created in 2010, and it contains over
20,000 sources of information that provide data on losses
from over 12,000 historical damaging earthquakes (Daniell
et al. 2011). In the present study, we considered informa-
tion from CATDAT for earthquakes that occurred between
2011 and 2014. Finally, additional sources of information,
such as public and official reports and peer-reviewed
articles completed the loss databases used in this study
(Table 2). Figure 2b–d shows the distribution of the
earthquakes considered in the present study for each data
source, in terms of economic losses (Fig. 2b), home loss
(Fig. 2c), and number of damaged buildings (Fig. 2d).
The earthquakes were mainly located in the most seis-
mically active countries of the Mediterranean region (Italy,
Greece, Turkey, and Algeria), which represent 90% of the
dataset. As particular attention was given to the Algerian
region in the present study, 37% of the selected earth-
quakes were in Algeria. This proportion is not representa-
tive of the seismicity rate over this period, but is due to the
information that was available to the authors. As shown in
Fig. 2, more than 60% of the data for socioeconomic losses
was drawn from the EM-DAT (Guha-Sapir et al. 2016) and
NGDC (2016) databases. Because our objective was to
construct the most comprehensive and traceable dataset
possible, the data sources were cross-referenced according
to their international audience or dissemination and vali-
dation at the international level, and references for the
preferred source of information for earthquake occurrence
were included in Tables 1 and 2.
3 Method
Based on data from the Mediterranean earthquake and loss
database developed for this study, and using regression
analysis between economic and human losses and hazard
and exposure factors, empirical loss models for earth-
quakes in the Mediterranean region are developed in this
study and their accuracy is examined. These models are
then applied in a case study of Algeria for earthquake loss
prediction. As a first step to develop empirical seismic loss
Fig. 1 The 65 earthquakes
(circles) in the Mediterranean
region considered in this study,
during the period 1900–2015
418 Guettiche et al. Economic and Human Loss Empirical Models
123

Table 1 Mediterranean earthquakes from 1900 to 2015 compiled in the database, with the Algerian earthquakes listed separately at the end
ID location Date Country Lat
(�)Long
(�)M MMI H I F References
1 Messina 28.12.1908 Italy 38.08 15.41 7.2 XI 10,000 – 85,925 RMS (2008), Barbano et al. (2005)
and Baratta (1910)
2 Lambesc 11.06.1909 France 43.70 5.40 6.2 IX – 250 46 Payany (1983)
3 Avezzano 13.01.1915 Italy 42.18 13.59 6.7 XI 13,000 – 29,978 NGDC (2016) and Storchak et al.
(2013)
4 Chios 23.07.1949 Greece 38.71 26.45 6.5 IX – 435 7 Altinok et al. (2005) and NGDC
(2016)
5 Lixouri 12.08.1953 Greece 38.18 20.94 6.8 X 10,000 2412 476 NGDC (2016) and Guha-Sapir et al.
(2016)
6 Agadir 29.02.1960 Morocco 30.45 - 9.62 5.7 X 20,000 25,000 12,000 NGDC (2016) and Guha-Sapir et al.
(2016)
7 Barce 21.02.1963 Libya 32.66 20.99 5.6 IX 8500 375 300 NGDC (2016)
8 North. Sporades 09.03.1965 Greece 39.40 24.00 6.3 VIII – 253 38 NGDC (2016)
9 Belice 15.01.1968 Italy 37.70 13.03 6.4 X – 563 216 NGDC (2016)
10 Gediz 28.03.1970 Turkey 39.17 29.55 7.4 VIII 80,000 1200 1086 NGDC (2016) and Mitchell (1976)
11 Tuscania 06.02.1971 Italy 42.50 11.80 5.0 VIII 5000 150 24 NGDC (2016)
12 Lice 06.09.1975 Turkey 38.52 40.77 6.7 IX 100,000 4500 2386 NGDC (2016) and Yanev (1975)
13 Friuli 06.05.1976 Italy 46.38 13.27 6.5 X 157,000 2400 978 NGDC (2016) and US Geological
Survey (2016)
14 Salonica 20.06.1978 Greece 40.74 23.23 6.2 VIII – 100 50 NGDC (2016) and Psycharis (1978)
15 Irpinia 23.11.1980 Italy 40.79 15.31 6.9 X 235,000 7700 4689 NGDC (2016)
16 Athens 24.02.1981 Greece 38.16 22.98 6.6 VIII 100,000 400 22 NGDC (2016) and Berz and Hettler
(1981)
17 Erzurum 30.10.1983 Turkey 40.33 42.18 6.6 VIII 25,000 1142 1330 NGDC (2016) and Erdik (1984)
18 Kalamata 13.09.1986 Greece 37.07 22.18 5.9 X – 300 20 NGDC (2016)
19 Carlentini 13.12.1990 Italy 37.29 15.40 5.6 VII 2500 200 19 NGDC (2016) and Psycharis (1978)
20 Erzincan 13.03.1992 Turkey 39.73 39.65 6.6 VIII 36,000 3850 653 NGDC (2016) and Turkish Red
Crescent Society (2006)
21 Cairo 12.10.1992 Egypt 29.73 31.16 5.8 VIII 50,000 9900 557 NGDC (2016) and EERI (1992)
22 Dinar 01.10.1995 Turkey 38.08 30.14 6.4 VIII – 240 96 NGDC (2016) and Turkish Red
Crescent Society (2006)
23 Kozani 13.05.1995 Greece 40.15 21.71 6.6 VIII – 25 0 NGDC (2016) and Hatzfeld et al.
(1997)
24 Egion 15.06.1995 Greece 38.44 22.31 6.5 VII – 60 26 EERI (1995) and NGDC (2016)
25 U.-Marche 26.09.1997 Italy 43.05 12.84 5.7 X – 100 14 NGDC (2016)
26 Adana 27.06.1998 Turkey 36.90 35.33 6.3 VIII – 1041 145 EERI (1998), NGDC (2016) and
Turkish Red Crescent Society
(2006)
27 Duzce 12.11.1999 Turkey 40.80 31.22 7.1 IX – 4948 845 NGDC (2016) and Turkish Red
Crescent Society (2006)
28 Mula 02.02.1999 Spain 38.06 - 1.54 4.8 VII 3500 327 9 NGDC (2016) and CATDAT (2016)
29 Kocaeli 17.08.1999 Turkey 40.77 30.00 7.6 X 600,000 43,953 17,127 NGDC (2016) and Turkish Red
Crescent Society (2006)
30 Athens 07.09.1999 Greece 38.12 23.60 6.0 IX 25,000 1600 143 EERI (1999) and NGDC (2016)
31 Molise 31.10.2002 Italy 41.74 17.85 5.7 VI 2295 100 30 NGDC (2016) and Protezione Civile
(2002)
32 Palermo 06.09.2002 Italy 38.34 13.73 5.9 VI – 20 2 NGDC (2016)
33 Bingol 01.05.2003 Turkey 39.01 40.46 6.4 IX – 520 176 NGDC (2016) and Turkish Red
Crescent Society (2006)
Int J Disaster Risk Sci 419
123

Table 1 continued
ID location Date Country Lat
(�)Long
(�)M MMI H I F References
34 Al Hoceima 24.02.2004 Morocco 35.18 - 3.98 6.4 IX 15,600 926 629 EERI (2004), Akoglu et al. (2006),
NGDC (2016) and Cherkaoui
(2004)
35 L’Aquila 06.04.2009 Italy 42.33 13.33 6.3 VIII 30,000 1500 306 NGDC (2016)
36 Simav 19.05.2011 Turkey 39.15 29.10 5.8 VIII 10,000 94 3 NGDC (2016)
37 Lorca 11.05.2011 Spain 37.70 - 1.67 5.1 VII – 300 9 Martınez-Dıaz et al. (2012) and
NGDC (2016)
38 Van 23.10.2011 Turkey 38.69 43.50 7.1 VIII 125,400 2608 644 NGDC (2016), Daniell et al. (2011)
and CATDAT (2016)
39 Medolla 29.05.2012 Italy 44.82 11.07 5.8 VIII 14,000 350 17 NGDC (2016)
40 Kefalonia 26.01.2014 Greece 38.21 20.45 6.1 VIII – 6 0 NGDC (2016)
41 Aegean Sea 24.05.2014 Greece 40.29 25.39 6.9 VIII – 266 3 NGDC (2016)
42 Constantine 04.08.1908 Algeria 36.41 6.61 5.2 VIII – 12 Benouar (1994)
43 Aumale 24.06.1910 Algeria 36.23 3.44 6.6 VIII – – 81 Benouar (1994)
44 Bordj hassan 25.08.1922 Algeria 36.40 1.20 5.4 VIII – – 4 Benouar (1994)
45 Mac-Mahon 16.03.1924 Algeria 35.42 5.90 5.3 VIII – – 4 Benouar (1994)
46 Chlef 24.08.1928 Algeria 35.90 0.90 5.4 VIII – – 4 Benouar (1994)
47 Carnot 07.09.1934 Algeria 36.20 1.60 5.1 VII – 11 0 Benouar (1994)
48 Guelma 10.02.1937 Algeria 36.40 7.20 5.2 VIII 28 16 2 Benouar (1994)
49 Mansoura 16.04.1943 Algeria 35.90 4.00 5.3 VIII 900 11 9 Benouar (1994)
50 Mont Hodna 12.02.1946 Algeria 35.70 5.00 5.5 VIII 7500 118 277 Benouar (1994)
51 Constantine 06.08.1947 Algeria 36.31 - 6.68 5.0 VIII – 8 3 Benouar (1994)
52 Kheratta 17.02.1949 Algeria 36.52 5.24 4.7 VII 350 16 2 Benouar (1994)
53 Chlef 09.09.1954 Algeria 36.27 1.59 6.7 X 60,000 5000 1243 Benouar (1994), NGDC (2016) and
Ayadi and Bezzeghoud (2015)
54 Bou Medfaa 07.11.1959 Algeria 36.26 2.60 5.3 VIII 500 2 0 Benouar (1994) and NGDC (2016)
55 M’sila 21.02.1960 Algeria 36.04 4.17 5.0 VIII 4900 129 47 Benouar (1994)
56 M’sila 01.01.1965 Algeria 35.71 4.49 5.4 VIII 25,000 25 5 Benouar (1994)
57 Bordj 24.11.1973 Algeria 36.14 - 4.41 5.1 VII 14,922 43 4 Benouar (1994) and NGDC (2016)
58 Chlef 10.10.1980 Algeria 36.14 1.41 7.1 X 400,000 8369 2633 Bertero and Shah (1983), Benouar
(1994), NGDC (2016) and Ayadi
and Bezzeghoud (2015)
59 Constantine 27.10.1985 Algeria 36.46 6.76 5.8 VIII – 300 10 Benouar (1994) and NGDC (2016)
60 Dj.Chenoua 29.10.1989 Algeria 36.79 2.45 5.7 VIII 50,000 700 35 Benouar (1994) and NGDC (2016)
61 Mascara 18.08.1994 Algeria 35.52 - 0.11 5.9 VII 10,000 295 172 NGDC (2016), Ayadi et al. (2002)
and Ayadi and Bezzeghoud (2015)
62 Ain 22.12.1999 Algeria 35.32 - 1.28 5.6 VII 25,000 174 26 NGDC (2016), Ayadi and
Bezzeghoud (2015) and Yelles-
Chaouche et al. (2004)
63 Beni-Ourtilane 10.11.2000 Algeria 36.61 4.77 5.7 VII – 50 2 Ayadi and Bezzeghoud (2015)
64 Boumerdes 21.05.2003 Algeria 36.88 3.69 6.8 X 182,000 11,450 2278 NGDC (2016), Ayadi and
Bezzeghoud (2015), AFPS (2003)
and JAEE (2004)
65 Laalam 20.03.2006 Algeria 36.62 5.33 5.2 VII – 68 4 NGDC (2016) and Ayadi and
Bezzeghoud (2015)
The ID (first column) is used to reference earthquakes in other tables
Lat latitude, Long longitude, M magnitude, MMI Mercalli modified intensity, H homeless, I injuries, F fatalities
420 Guettiche et al. Economic and Human Loss Empirical Models
123

Table 2 Population and damage for the Mediterranean for the 1900–2015 earthquakes compiled in the database, with the Algerian earthquakes
listed separately at the end
ID POPTot POP.unit D4 ? D5 LEQ
(million)
GDP
(million)
GDP.Unit L$2015 References
1 35,899,000 150,000 110,000 $116 82,140 343,212,902 2,853,877,661 Guha-Sapir et al. (2016), CATDAT
(2016), Baratta (1910) and NGDC
(2016)
2 41,109,000 15,000 2648 15.5 FO 130,180 47,500,547 66,530,937 Payany (1983)
3 37,982,000 120,000 6000 $60 106,730 337,201,832 1,408,021,782 NGDC (2016)
4 7,475,335 47,715 6035 $25 14,680 93,702,269 248,967,437 Altinok et al. (2005) and NGDC (2016)
5 7,779,457 74,400 27,773 $100 18,053 172,653,864 887,704,119 NGDC (2016)
6 12,328,534 50,000 3650 $120 2037 8,262,134 960,879,729 Strauss (1974) and Guha-Sapir et al.
(2016)
7 1,499,000 30,000 2000 $5 1000 20,013,342 38,728,267 Minami (1965), Guha-Sapir et al.
(2016) and NGDC (2016)
8 8,534,252 30,253 1101 $8 7601 26,943,304 227,611,563 Rothe (1969), Guha-Sapir et al. (2016)
and NGDC (2016)
9 52,802,703 55,563 20,000 $320 87,940 92,537,122 2,179,466,667 Guha-Sapir et al. (2016) and NGDC
(2016)
10 34,772,031 128,061 9528 $55.6 17,087 62,929,516 339,642,917 Mitchell (1976) and NGDC (2016)
11 53,891,946 13,900 1718 $41 124,300 32,059,892 239,943,135 NGDC (2016)
12 39,185,637 160,000 5518 $17 44,640 182,270,457 30,838,643 Yanev (1975) and NGDC (2016)
13 55,539,118 500,000 43,000 $3600 224,100 2,017,496,929 14,995,803,163 Goretti and Di Pasquale (2002) and
Guha-Sapir et al. (2016)
14 9,388,188 600,100 3245 $250 44,433 2,840,203,383 908,807,515 Guha-Sapir et al. (2016) and NGDC
(2016)
15 56,336,446 4,641,620 120,000 $20,000 475,900 39,209,909,656 57,528,398,058 Guha-Sapir et al. (2016), Goretti and Di
Pasquale (2002), Ferrer et al. (2004)
and NGDC (2016)
16 9,704,947 80,400 8000 $900 52,539 435,259,230 2,117,247,569 Guha-Sapir et al. (2016) and NGDC
(2016)
17 47,072,603 834,137 3241 $100 61,677 1,092,939,025 59,492,219 Guha-Sapir et al. (2016), Aysan (1984)
and Erdik (1984)
18 9,945,576 45,300 1825 $745 56,587 257,743,666 1,611,110,082 EERI (1986) and Guha-Sapir et al.
(2016)
19 57,007,577 10,000 1500 $500 1,178,000 206,639,198 906,721,500 NYT (1990) and Guha-Sapir et al.
(2016)
20 55,811,134 348,850 8057 $750 159,095 994,430,443 675,743,407 NGDC (2016) and Guha-Sapir et al.
(2016)
21 58,922,018 12,000,000 9350 $1200 41,855 8,524,249,797 3,378,717,035 EERI (1992), Guha-Sapir et al. (2016)
and NGDC (2016)
22 58,522,320 35,000 5100 $205.8 169,486 101,363,146 388,807,415 NGDC (2016) and EERI (1998)
23 10,641,169 86,471 12,000 $450 137,383 1,116,391,580 699,853,346 NGDC (2016) and Guha-Sapir et al.
(2016)
24 10,641,169 13,900 4301 $660 137,383 179,456,064 1,026,451,575 Guha-Sapir et al. (2016) and NGDC
(2016)
25 57,044,614 112,412 27,000 $4520.49 1,240,000 2,443,541,471 6,675,594,880 Guha-Sapir et al. (2016) and Goretti
and Di Pasquale (2002)
26 61,344,874 1,589,600 1700 $550 269,287 6,977,906,160 1,454,092,025 Guha-Sapir et al. (2016) and NGDC
(2016)
27 62,295,617 714,668 26,704 $1000 249,751 2,865,198,627 1,422,671,068 Turkish Red Crescent Society (2006)
and Guha-Sapir et al. (2016)
28 40,392,585 60,109 161 $60.109 633,194 942,268,591 85,515,335 Ferrer et al. (2004)
29 62,295,617 1,358,953 20,000 $20,000 249,751 5,448,225,197 22,762,737,095 Aydan et al. (2000) and Guha-Sapir
et al. (2016)
Int J Disaster Risk Sci 421
123

Table 2 continued
ID POPTot POP.unit D4 ? D5 LEQ
(million)
GDP
(million)
GDP.Unit L$2015 References
30 10,910,741 115,139 53,000 $4200 142,998 1,509,028,919 4,268,013,205 NGDC (2016) and Guha-Sapir et al.
(2016)
31 57,655,677 330,900 300 $796 1,267,000 18,659,930,045 395,247,916 Protezione Civile (2002), EERI (2003)
and NGDC (2016)
32 57,655,677 30,402 400 $500 1,267,000 668,107,905 658,746,526 NGDC (2016)
33 66,060,121 68,900 718 $290.52 303,005 316,031,288 374,229,233 NGDC (2016), Turkish Red Crescent
Society (2006) and Guha-Sapir et al.
(2016)
34 30,093,109 239,235 2539 $400 56,948 452,727,354 501,888,830 NGDC (2016) and Guha-Sapir et al.
(2016)
35 59,467,196 56,000 15,000 $2500 2,186,000 2,058,546,699 2,761,959,476 NGDC (2016) and Guha-Sapir et al.
(2016)
36 73,517,002 41,000 2208 $244 774,754 432,075,864 257,101,472 Daniell et al. (2011), CATDAT (2016)
and Guha-Sapir et al. (2016)
37 46,708,366 150,000 1164 $332.5 774,754 2,488,058,135 1,264,433,469 Guha-Sapir et al. (2016) and Valcarcel
et al. (2012)
38 73,517,002 291,000 28,650 $1500 744,800 2,948,118,042 1,580,541,836 Daniell et al. (2011), CATDAT (2016)
and Guha-Sapir et al. (2016) and
NGDC (2016)
39 59,737,717 1,000,000 16,900 $1433.2 2,075,200 34,738,522,063 1,479,536,766 Daniell et al. (2011) and CATDAT
(2016)
40 11,000,777 35,800 1700 $178 237,592 773,200,323 178,211,281 CATDAT (2016) and NGDC (2016)
41 11,000,777 75,002 300 $450 237,592 1,619,876,276 450,534,139 KOERI (2014), Guha-Sapir et al.
(2016) and NGDC (2016)
42 4,850,000 – – 0.4 FA 450 – 1,716,927 Benouar (1994)
43 5,200,000 50,000 $1 470 451,923 24,129,270 Benouar (1994) and NGDC (2016)
44 5,450,000 – 50 – – – – Benouar (1994)
45 5,500,000 – – – – – – Benouar (1994)
46 5,650,000 603 100 0.4 FA 473 50,467 272,202 Benouar (1994)
47 6,170,000 800 100 – – – – Benouar (1994)
48 6,700,000 13,000 – 5 FA – – 3,170,176 Benouar (1994)
49 7,700,000 4000 250 – – – – Benouar (1994)
50 7,750,000 51,000 1000 $13.5a 3,520 23,163,870 60,773,589 Ayadi and Bezzeghoud (2015) and
NGDC (2016)
51 7,850,000 10,000 50 $3a 3480 4,433,121 26,571,412 Benouar (1994) and NGDC (2016)
52 8,730,000 4603 50 300 FA 1,180 622,267 18,334,846 Benouar (1994)
53 9,609,507 129,250 20,000 $6 1689 22,716,079 52,866,245 Ayadi and Bezzeghoud (2015) and
NGDC (2016)
54 10,848,971 915 100 300 FA 2,000 168,750 5,457,943 Benouar (1994)
55 11,124,892 10,000 600 500 FA 2037 1,831,208 8,778,887 Benouar (1994)
56 12,626,953 49,350 3145 $2 3,136 12,257,621 15,048,698 Benouar (1994) and NGDC (2016)
57 15,804,428 – 2000 – 8715 – – Benouar (1994) and Maouche et al.
(2008)
58 19,337,723 930,317 60,000 $5200 42,345 2,037,186,718 14,957,383,495 Benouar (1994), Guha-Sapir et al.
(2016), Azzouz (2002) and NGDC
(2016)
59 22,565,908 20,000 – $1 57,938 – 2,202,760 Benouar (1994) and NGDC (2016)
60 25,257,671 150,000 8000 $5 55,631 330,383,787 9,557,137 Benouar (1994) and NGDC (2016)
61 28,362,015 30,000 2806 $128 42,543 44,999,553 204,711,039 Azzouz and Rebzani (2005) and World
Bank (1994)
62 30,766,551 30,731 2708 $112.84 48,640 48,584,622 160,534,203 CGS (2000) and World Bank (2000)
422 Guettiche et al. Economic and Human Loss Empirical Models
123
models from the predictor variables available in the study
database, the regression model forms proposed by Cha
(1998) for GDP and seismic intensities, Heatwole and Rose
(2013) for magnitude, population, and GDP, and Samard-
jieva and Badal (2002) for population and magnitude are
adopted in this study.
Economic losses (L) are considered as a key dependent
variable of the regression models. Daniell et al. (2010)
reported that economic losses not adjusted to current USD
values are a significant difficulty when compiling earth-
quake data from different epochs. To compare the conse-
quences of earthquakes in a comprehensive manner, the
actual economic losses were adjusted and normalized to a
common and unique value (Daniell et al. 2011)—the 2015
USD currency. Nevertheless, for many countries around
the Mediterranean (for example, France, Algeria, and
Italy), this value was only available from the national
census agencies after 1950, and GDP data before 1950 was
Table 2 continued
ID POPTot POP.unit D4 ? D5 LEQ
(million)
GDP
(million)
GDP.Unit L$2015 References
63 31,183,658 956 3000 $24 54,790 1,679,308 33,033,728 Ayadi and Bezzeghoud (2015)
64 32,394,886 210,261 30,000 $5000 67,864 440,474,167 6,440,679,348 Maouche et al. (2008), Guha-Sapir
et al. (2016) and NGDC (2016)
65 33,749,328 1000 40 $4.25 117,027 343,212,902 4,996,638 Ayadi and Bezzeghoud (2015) and
estimated
POPTot total population on the day of the earthquake, POP.Unit the affected population, D4 ? D5 damaged buildings, LEQ economic losses for
the day of the earthquake, GDP gross domestic product for the day of the earthquake, GDP.Unit GDP of the affected area, L$2015 adjusted losses
to USD in 2015, FA Ancien franc currency, FO Franc OraFrom the National Geophysical Datacenter, losses are classified by range of losses, and for these earthquakes the mean values of the ranges were
considered
Fig. 2 Distribution of the earthquakes included in the present study: a by country in the Mediterranean region; b–d by associated socioeconomic
losses used and data source, for economic losses (b), home loss (c), and number of damaged buildings (d)
Int J Disaster Risk Sci 423
123

provided by Maddison (2006). Inflation was allowed for,
with the use of the Consumer Price Index inflation calcu-
lator from the Bureau of Labor Statistics, U.S. Department
of Labor3 to update the economic loss value adjusted from
the year of the earthquake (LEQ) to the present-day value
(L$2015). For the Algerian earthquakes and the single
French earthquake of Lambesc (1909), LEQ was given in
currencies that no longer exist. Here, the French Institute of
Statistics and Economic Studies converter4 was used to
convert LEQ into current currency in Euros on the date of
the earthquake, which was then adjusted to the L$2015
(Table 2).
Home loss (H), injury (I), and fatality (F) are used as
dependent variables of the regression models for human
(social) losses, and their statistics came directly from the
EM-DAT and NGDC databases for most of the earthquakes
considered in the present study, or from referenced reports
(Table 1).
Earthquake intensity and magnitude and building dam-
age are selected as hazard variables. Damage (D) is usually
reported as the total number of buildings that suffer dam-
age. The present study determined the total number of
buildings based on those having suffered heavy to strong
damage, as classified by the damage grades D4 and D5
(Table 2), according to the EMS98 damage scale.
Population affected by the earthquakes (POP.Unit) is
considered an important exposure variable, and these data
came either from direct reports or other references
(Table 2):
POP:Unit ¼ POPTot
AAff
ATot
ð1Þ
where AAff is the size of the affected area, ATot is the surface
area, and POPTot is the population of the country, on the
date of the earthquake. POPTot was provided by the
Fig. 3 Economic damage
adjusted to 2015 USD value
(L$2015) versus GDP.Unit with
the regression models for
seismic intensities VII–X of the
Mediterranean earthquakes
examined in this study,
compared with the Cha (1998)
empirical model results
Table 3 Regression of the economic losses adjusted to 2015 USD value (L$2015) considering GDP.Unit as the exposure-related variable for
seismic intensities between VII and X (Eq. 3)
Seismic intensity Log10(L$2015) regression RMSE Adjusted R2 R2 Observation
VII 0.53G ? 4.02 0.55 0.57 0.62 9
VIII 0.59G ? 3.40 0.55 0.71 0.72 24
IX 0.88G ? 1.03 0.43 0.68 0.72 8
X 0.69G ? 3.51 0.39 0.74 0.76 13
G: log10(GDP.Unit)
3 http://www.bls.gov/data/inflation_calculator.htm.4 http://www.insee.fr/fr/service/reviser/calcul-pouvoir-achat.asp.
424 Guettiche et al. Economic and Human Loss Empirical Models
123

Population City database,5 taking into account the popu-
lation growth rate. AAff was obtained either from references
or through estimation from seismic intensity maps.
GDP per capita on the date of the earthquake (GDPPC),
as another key exposure variable, is scaled by the popu-
lation (POP.Unit), and GDP of the affected area
(GDP.Unit) is then estimated by multiplying GDPPC by
POP.Unit, as follows and is presented in Table 2:
GDP:Unit ¼ GDP
POPTot
� POP:Unit ¼ GDPPC � POP:Unit
ð2Þ
The GDP values adjusted to the USD 2015 values were
obtained from the World Bank website.6 For Algeria before
1960, this information was provided by Clerc (1975).
Because of the lack of information, earthquake-induced
losses were not distinguished between those directly caused
by the earthquake and those due to tsunamis and/or fires
that accompanied the Messina earthquake in 1908. Indeed,
Bird and Bommer (2004) reported a small contribution of
secondary events to the total losses (except for mega-
earthquakes, such as Indonesia 2004 and Japan 2011,
which were not in the present study).
4 Results
Empirical relationships between loss variables and hazard
and exposure factors are presented in this section. The
accuracy of the relationships derived from the database
information is estimated using the standard error (RMSE),
the coefficient of determination (R2), and the adjusted R2.
4.1 Economic Losses (L$2015) Versus GDP
and Intensity
The linear regression model proposed by Cha (1998) that
considers the GDP of the country on the date of the
earthquake, is as follows:
log10LEQ ¼ a MMIð Þ þ b MMIð Þ:log10 GDPð Þ þ e ð3Þ
where log10 indicates the decimal logarithmic function,
a(MMI) and b(MMI) are the regression coefficients that
depend on seismic intensity, e is the RMSE, and LEQ and
GDP are given in million USD.
In the Cha (1998) study, 29 earthquakes worldwide over
the 1980–1995 period, of seismic intensities VIII, IX, and
X were considered when deriving a loss empirical model.
Figure 3 shows the log10 values of the losses in USD
adjusted to the 2015 value (L$2015) versus the GDP.Unit
predictor variable of the selected Mediterranean earth-
quakes and according to seismic intensities given in
Table 1 and exposure-related variable in Table 2. Only 54
Table 4 Regression of the economic losses adjusted to 2015 USD value (L$2015) considering POP.Unit as the exposure-related variable for
seismic intensities between VII and X
Seismic Intensity Log10(L$2015) regression RMSE Adjusted R2 R2 Observation
VII 0.79P ? 4.90 0.64 0.43 0.50 9
VIII 0.76P ? 4.53 0.73 0.49 0.51 24
IX 0.77P ? 4.60 0.69 0.17 0.29 8
X 0.94P ? 4.52 0.55 0.51 0.55 13
P: log10(POP.Unit)
Table 5 Regression of the economic losses adjusted to 2015 USD value (L$2015) considering magnitude (M) as the hazard-related variable and
GDP.Unit or POP.Unit as the exposure-related variable, and the coefficients of the regression models (Eq. 4)
Predictor variables RMSE Adjusted R2 Observation
Type Name Coefficient Value
Log10(L$2015) c - 0.00 0.60 0.65 57
Exposure Log10(GDP.Unit) b 0.54
Hazard Log10(M) a 5.18
Log10(L$2015) c 0.92 0.70 0.53 57
Exposure Log10(POP.Unit) b 0.65
Hazard Log10(M) a 5.72
5 http://population.city/country.6 http://data.worldbank.org/indicator/.
Int J Disaster Risk Sci 425
123

observations with VI\MMI\XI and with L$2015 and
GDP.Unit information available are considered. Compared
with Cha (1998), the linear regression models are different
for seismic intensities (MMI) of VIII to X, which confirms
the differences between the worldwide and regional mod-
els, and the need to derive a loss-prediction model for any
specific area using the appropriate data (Heatwole and
Rose 2013). For moderate seismic-prone regions, loss-
prediction models for weak seismic intensity (VII) are also
relevant, as shown by the moderate earthquake-induced
losses referenced in the present dataset (Tables 1, 2).
Table 3 summarizes the results of the regression models
for intensities VII–X using Eq. 3. Considering R2, the
model fits are relatively good, at 0.62–0.76, and is as good
as for the models provided by Cha (1998). Regression for
losses was also performed considering the exposed popu-
lation as a predictor variable and using the same regression
model form as Eq. 3. Table 4 gives the results of the
regression models. As expected and reported by most
previous studies, POP.Unit is not as relevant as GDP.Unit
for the economic loss models. In this case, the fits of the
R2-based models fall around 0.5, which is notably lower
than the values obtained by considering GDP.Unit.
4.2 Economic Losses (L$2015) Versus Earthquake
Magnitude, GDP, and Affected Population
Heatwole and Rose (2013) used the magnitude of U.S.
earthquakes as a hazard-related predictor variable for loss
prediction, and considered the population of the affected
area and GDP as exposure-related variables. Assuming a
non-normal distribution of the variables, they considered a
natural-log model using a conventional form, as follows:
log L$2015ð Þ ¼ a log X1ð Þ þ b log X2ð Þ þ c þ e; ð4Þ
where log indicates the natural log; a, b, and c are the
regression coefficients; e is the RMSE; X1 is the hazard-
related variable—magnitude or intensity; and X2 is the
exposure-related variable—GDP.Unit or POP.Unit. The
sparse nature of the data and the minimum number of
predictor variables means that these variables are not nor-
mally distributed and are considered logged variables.
Table 5 summarizes the regression model coefficients
following the original presentation by Heatwole and Rose
(2013) using POP.Unit and GDP.Unit to predict the L$2015
losses. Only 57 observations with VI\MMI\XI and
with L$2015 and GDP.Unit and POP.Unit information
available are considered. As Heatwole and Rose (2013)
reported, the regression fit coefficient (adjusted R2) is
higher for GDP.Unit (0.653) than for POP.Unit (0.527),
because GDP.Unit is a macroeconomic variable that rep-
resents the wealth of the affected region, whereas the
population is not. Compared with using the regression
forms of Cha (1998) (Tables 3, 4), the same results are
observed, which confirms the relevance of GDP rather than
population for prediction of economic damage. For
GDP.Unit, the coefficient of the regression fit (adjusted R2)
is of the same order of magnitude (0.610 versus 0.653) as
for the regional U.S. earthquake-based model (Heatwole
and Rose 2013), which also confirms the advantage of
using regional earthquake loss databases. However, the
magnitude characterizes the actual earthquake and does not
take into account any seismic wave attenuation with dis-
tance, whereas the macroseismic intensity does. It is
therefore reasonable to assume that intensity is a more
relevant hazard-related predictor than magnitude. Table 6
gives the economic loss predictions with intensity as the
hazard-related predictor variable, in the same manner as
the formulation by Cha (1998). The fit model parameters
(R2, adjusted R2) are higher with intensity than with mag-
nitude, with values comparable to those from Eq. 3 con-
sidering GDP.Unit (Table 3), and R2 close to 0.7. This
result shows that intensity is a better hazard-related pre-
dictor variable for relevant loss assessment.
4.3 Human Losses Considering Building Damage
Extensive studies have been carried out using building
damage as a predictor variable for loss assessment
(D’Ayala et al. 1997; Bommer et al. 2002; Goretti and Di
Table 6 Regression of the economic losses adjusted to 2015 USD value (L$2015) considering intensity (MMI) as the hazard-related variable and
GDP.Unit or POP.Unit as the exposure-related variable, and the coefficients of the regression models (Eq. 4)
Predictor variables RMSE Adjusted R2 Observation
Type Name Coefficient Value
Log10(L$2015) c - 1.16 0.56 0.70 57
Exposure Log10(GDP.Unit) b 0.61
Hazard Log10(MMI) a 5.09
Log10(L$2015) c 1.93 0.72 0.51 57
Exposure Log10(POP.Unit) b 0.75
Hazard Log10(MMI) a 3.25
426 Guettiche et al. Economic and Human Loss Empirical Models
123

Pasquale 2002; Kappos et al. 2006; So and Spence 2013;
FEMA 2016), on the premise that damage to structures
produces direct and indirect economic losses and fatalities.
Damage can indeed be considered as a proxy of intensity,
as macroseismic surveys completed after earthquakes are
mainly derived from the observed damage for the strongest
shaking ([VII). The amount of damage also affects the
costs related to reconstruction and business interruption
because of loss of use of damaged buildings.
In the present study, extensive data allowed the devel-
opment and testing of regression models, with the loss
estimation based on reduced forms, like those proposed by
Heatwole and Rose (2013), but considered on a log10 scale.
The human loss variables are the number of homeless and
injured people, and the fatalities, while considering the
affected population (POP.Unit) as an exposure-related
variable. The hazard-related predictor variables are seismic
intensity and number of damaged buildings classified as
D4 ? D5, according to EMS98. In our dataset, the quality
of the data is relatively heterogeneous, with some refer-
ences indicating the numbers of casualties with accuracy to
the unit, while others indicating rounded quantities, and
thus introducing uncertainty into the regression models.
The primary objective of the present study was also to
develop prediction models for the Mediterranean region,
with special focus on Algeria, and here the Algerian
earthquakes are defined separately from the total dataset in
each analysis.
Figure 4 shows as an example the distribution of human
losses versus damage (Fig. 4a) and intensity (Fig. 4b) for
all of the earthquakes. Exposed population is not consid-
ered here.
Table 7 summarizes all of the analysis results related to
the regression fits, with RMSE and adjusted R2. Table 7
and Fig. 4 show that for injuries (I) and fatalities (F), the
models show low fits compared to those for home loss (H).
Considering the whole dataset of earthquakes and intensi-
ties as the predictor variables (Fig. 4b, Table 7), low-fit
models were derived, with adjusted R2 of 0.23, 0.34, and
0.42 for the H, I, and F human loss variables, respectively.
These values were significantly improved to become 0.72,
0.49, and 0.44, respectively when the damage was used as
the predictor variable (Fig. 4a, Table 7). These models
show the lowest RMSE values, which confirm the rele-
vance of damage as a predictor of casualties. Furthermore,
a reduced-form model that considered simultaneously
intensity and damage was tested (Table 7), and the fits did
not improve significantly (0.73, 0.53, and 0.54,
Fig. 4 Human losses (home loss, injuries, fatalities) versus damage (a) and intensity (b) as hazard-related predictor variables. The black lines
correspond to the best-fit regression models
Int J Disaster Risk Sci 427
123

respectively). Despite the significant relevance of damage
as a hazard-related variable, the fits remained low, which
resulted in imprecise assessment when using these models.
However, when considering the Algerian earthquakes only
(Table 7), the fits are considerably improved, reaching
0.98, 0.72, and 0.57, respectively, although this is based on
a small amount of data and is not sufficiently representative
statistically. This does suggest that regional data-based
models that integrate urban features (regional typology,
building design, and quality of construction) can improve
loss prediction models that consider building damage,
which is not the case for the reduced-form regression
model that considers intensity and the Algerian earth-
quakes only (Table 7; with adjusted R2 of 0.43, 0.28, and
0.37, respectively).
The relevance of building damage as a predictor vari-
able is also confirmed for economic losses. Table 8 gives
the economic losses adjusted to 2015 USD value (L$2015)
considering GDP.Unit and damage as the exposure-related
and hazard-related variables of the reduced-form model.
Compared with the fits given in Table 6, which consider
intensity as the hazard-related variable, the adjusted R2
Table 7 Regression of the home loss (H), injuries (I), and fatalities
(F) variables as human loss parameters using damage (D4 ? D5),
intensity (MMI), and population affected (POP.Unit) as the predictor
variables for the earthquakes included in the Mediterranean database
and for the Algerian earthquakes
Variables Regression model RMSE Adjusted R2 R2 Observation
All earthquakes: intensity (MMI)
Home loss H = 7.36 MMI - 2.63 0.81 0.23 0.25 38
Injuries I = 9.88 MMI - 6.52 0.78 0.34 0.35 58
Fatalities F = 12.80 MMI - 9.85 0.89 0.42 0.43 61
All earthquakes: Damage (D)
Home loss H = 0.78 D ? 1.45 0.44 0.72 0.72 36
Injuries I = 0.81 D - 0.27 0.69 0.48 0.49 56
Fatalities F = 0.92 D - 1.25 0.88 0.43 0.44 55
Algerian earthquakes: Intensity (MMI)
Home loss H = 12.22 MMI - 7.14 0.78 0.43 0.48 13
Injuries I = 11.57 MMI - 8.44 0.83 0.28 0.33 17
Fatalities F = 13.64 MMI - 10.91 0.83 0.37 0.40 16
Algerian earthquakes: Damage (D)
Home loss H = 0.98 D ? 1.94 0.16 0.98 0.98 13
Injuries I = 0.91 D - 0.75 0.59 0.71 0.72 17
Fatalities F = 0.85 D - 1.09 0.77 0.54 0.57 16
All earthquakes: Damage (D) ? Intensity (MMI)
Home loss H = 0.84 D - 1.26 MMI ? 2.39 0.44 0.71 0.73 36
Injuries I = 0.62 D ? 4.34 MMI - 3.60 0.67 0.52 0.53 55
Fatalities F = 0.56 D ? 7.71 MMI - 7.07 0.80 0.53 0.54 55
All earthquakes: Damage (D) ? Population (P)
Home loss H = 0.55 D ? 0.32 P ? 0.67 0.39 0.77 0.78 36
Injuries I = 0.49 D ? 0.45 P - 1.38 0.62 0.58 0.60 55
Fatalities F = 0.67 D ? 0.39 P - 2.20 0.84 0.48 0.49 55
Algerian earthquakes: Damage (D) ? Intensity (MMI)
Home loss H = 1.02 D - 1.03 MMI ? 1.64 0.16 0.98 0.98 13
Injuries I = 0.75 D ? 4.64 MMI - 4.43 0.57 0.73 0.76 17
Fatalities F = 0.60 D ? 7.54 MMI - 7.07 0.71 0.61 0.66 16
Algerian earthquakes: Damage (D) ? Population (P)
Home loss H = 0.77 D ? 0.25 P ? 0.40 0.15 0.98 0.98 13
Injuries I = 0.63 D ? 0.39 P - 1.50 0.56 0.75 0.78 16
Fatalities F = 0.40 D ? 0.64 P - 2.35 0.66 0.67 0.71 15
H log10(Home loss), I log10(Injuries), F log10(Fatalities), D log10(D4 ? D5), P log10(POP.Unit), MMI log10(MMI)
428 Guettiche et al. Economic and Human Loss Empirical Models
123

increases to 0.72 (from 0.70) and the RMSE decreases a
little to 0.55 (compared with 0.56).
As human losses depend on the exposed population, as
suggested by Samardjieva and Badal (2002) for a world-
wide model, here a Mediterranean model was also derived
that considered the exposed population (POP.Unit) and
damage. Table 7 presents the results of the regression, with
significant improvements to the fits given previously in
Table 7, whereby R2 reached 0.77, 0.58, and 0.48, for H, I,
and F, respectively. These values were further improved
when only the Algerian earthquakes were considered
(Table 7), with values of 0.98, 0.75, and 0.67, respectively,
which is also the case when damage is used instead of
intensity (Table 7).
The relevance of damaged buildings in models of eco-
nomic and human losses is confirmed by this analysis as
well as the evident needs to consider exposed population
for human losses. Combining damage as hazard-related
variable and GDP or exposed population as exposure-re-
lated variables improve the accuracy of the prediction.
Nevertheless, damage prediction is more challenging than
intensity or magnitude for real-time predictions and espe-
cially for regions with no available building inventory or
large-scale vulnerability models. New, rapid methods for
large-scale damage estimation are becoming more readily
available. These practices are based on statistical analysis
or data mining of urban data derived from satellite remote
sensing (Saito and Spence 2011) or national census data-
bases (Pittore and Wieland 2013; Riedel et al. 2014, 2015;
Guettiche et al. 2017).
5 The Constantine (Algeria) Case
In this section, the loss models developed in this study are
applied to the city of Constantine, Algeria. We considered
the Constantine environment to be suitable for testing the
empirical relationships derived in the previous section,
without having as an objective a full and extended seismic-
risk analysis that includes a site-specific hazard assessment.
Constantine is the third largest city in Algeria in terms of
population and economic activities. It is located in Alge-
ria’s most seismically active region (acceleration, 0.129 g
in the Algerian Seismic Hazard Map), and it has suffered
several earthquakes in the past (Benouar 1994), including
the strongest felt historical earthquake in 1985 of intensity
VIII. Guettiche et al. (2017) performed a seismic vulner-
ability analysis of this area based on methods developed by
Riedel et al. (2014) and Riedel et al. (2015), which were
validated by comparing classical in situ engineering survey
results. The elementary information provided by remote
sensing and the national census (for example, period of
construction, number of stories) was used to assess seismic
vulnerability. We used the EMS98 damage matrix for
intensities VII–X to compute seismic damage (D4 ? D5)
for each intensity. Our study is not focused primarily on the
Constantine loss assessment for a realistic earthquake
scenario, but more as a case study to provide insights on
the uncertainties of the loss model related to the database.
Only the damage-related scenarios given in Guettiche et al.
(2017) were considered for testing the loss models for
intensities VII–X.
The population of Constantine in 2008 was around 1
million, according to the National Office of Statistics.7 The
area considered in the present study is highly populated and
is characterized by dense neighborhoods composed of old
residential buildings. In terms of the urban surface area
affected by the scenario earthquake defined by Guettiche
et al. (2017), there is an exposed population (POP.Unit) of
100,000 inhabitants. The GDP per capita of Algeria is USD
4152.778 and for the area considered, GDP.Unit can be
defined as follows:
GDP:Unit ¼ POP:Unit � USD4152:77¼ USD415; 277; 000 ð5Þ
The reduced-form models defined in Table 6 for the eco-
nomic losses and Table 7 for the human losses (home loss,
injuries, fatalities) were applied to the area considered for
Constantine. Table 9 summarizes the result for the seismic
intensities of VII–X. It provides information related to
building damage and economic and/or human impact,
which are also key elements in performance-based, earth-
quake-engineering approaches. In Constantine the total
number of damaged buildings was between 195 (VII) and
1654 (X), which produced mean loss indicators for home
loss, injured persons (injuries), and fatalities of 6067, 157,
and 91, respectively, and economic losses of about USD
200 million.
Table 8 Regression of the economic loss adjusted to 2015 USD value (L$2015) considering GDP.Unit and damage (D4 ? D5) as the exposure-
related and hazard-related variables, respectively, and all of the earthquakes having these information (56 from Tables 1, 2)
Log10(L$2015) regression model RMSE Adjusted R2 R2 Observation
0.47 D ? 0.46 G ? 3.07 0.55 0.71 0.72 56
D log10(D4 ? D5), G log10(GDP.Unit)
7 http://www.ons.dz/.8 http://www.tradingeconomics.com/algeria/gdp-per-capita.
Int J Disaster Risk Sci 429
123

It is worth noting that the uncertainty here is relatively
high, which results from the uncertainties related to the
information in the database. However, decision makers are
not directly concerned with magnitude, building damage,
or intensity, but rather pay attention to performance indices
for loss and injuries to occupants, or the homeless people
that need to be sheltered in the event of a seismic disaster.
Compared with previous studies, this integration of build-
ing damage as a hazard-related parameter improves the
prediction, and should thus be incorporated into the anal-
ysis of earthquake losses. Furthermore, data collection after
earthquakes should be improved.
6 Conclusions
This study provided a compilation of data and empirical
models to estimate the economic and human impacts of
earthquakes in the Mediterranean region. Earthquakes are
complex and rare events, and post-earthquake information
has to be carefully scrutinized before regression models
can be developed. But there is the need to define perfor-
mance metrics that are relevant for decision makers and
seismic risk mitigation. Generally speaking, these metrics
relate to the risks of casualties for anticipation of the short-
term responses to an emergency, such as home loss and
personal injuries, and anticipation of economic losses and
fatalities for the long-term recovery processes. In this
study, data related to 65 earthquakes in the Mediterranean
region were compiled in a comprehensive database, with
particular attention paid to Algeria. Reduced-form models
were then derived, based on hazard-related and exposure-
related variables. Because building damage is a key indi-
cator related to losses, we have demonstrated that the
integration of such information into regional models
improves the loss assessment by reducing the computed
regression errors R2. These parameters require extensive
analysis of the area considered in terms of building vul-
nerability, but new data sources such as remote sensing and
national census information, when coupled with data
mining algorithms, promise to provide new perspectives
for cost-effective and relevant ways to determine seismic
damage to buildings.
Vulnerability of buildings is an essential element, since
damage seems to be the critical element to define the
hazard-related parameters. Riedel et al. (2014, 2015), and
Guettiche et al. (2017) have shown that large scale-based
methods for vulnerability assessment can provide relevant
forecasting of damage (D4 ? D5) for a given seismic
intensity. These methods are based on information that
describes the general characteristics of the regional typol-
ogy of structures and their particular attributes, such as
those that might be obtained by satellite imagery. In this
way, loss models can be improved everywhere by inte-
grating the spatial variability of local vulnerability in the
concerned regions. Efforts to study additional predictor
variables, such as population mobility during the day (ex-
posure-related) and physical characterization of the hazard
Table 9 Home loss, injuries, fatalities, and economic losses (L$2015) computed in Constantine for macroseismic intensities VII–X using
D4 ? D5 as a hazard-related variable and POP.Unit or GDP.Unit as exposure-related variable, respectively
Regression model Intensity D4 ? D5 POP.Unit Variables
Min Mean Max
Home loss D4 ? D5 VII 195 100,000 (Algerian) 1834 2590 3659
POP.Unit VIII 589 4925 6067 8570
(Table 7) IX 1133 7108 10,041 14,183
X 1654 9512 13,436 18,979
Injured persons (injuries) D4 ? D5 VII 195 100,000 (Algerian) 22 78 283
POP.Unit VIII 589 43 157 569
(Table 7) IX 1133 65 236 859
X 1654 83 300 1091
Fatalities D4 ? D5 VII 195 100,000 (Algerian) 13 58 267
POP.Unit VIII 589 20 91 415
(Table 7) IX 1133 26 118 539
X 1654 30 137 627
Economic losses (L$2015) $ D4 ? D5 VII 195 415,277,000 (all) 36,370,702 129,048,122 457,880,018
GDP.Unit VIII 589 61,149,035 216,964,966 769,820,749
(Table 8) IX 1133 83,161,723 295,068,930 1,046,944,070
X 1654 99,345,251 352,490,252 1,250,682,610
Data sources for D4 ? D5 were from Guettiche et al. (2017)
430 Guettiche et al. Economic and Human Loss Empirical Models
123
that use ground-motion parameters, are necessary in further
research.
Acknowledgements The MAIF Foundation supported this work.
Institute nationale de la statistique et des etudes economique
(INSEE—National Institute of Statistics and Economic Studies) data
were prepared and provided by the Centre Maurice Halbwachs
(CMH). This study was sponsored by the Urban Seismology project at
the Institute of Earth Science ISTerre of the University of Grenoble-
Alpes and by a grant from the Observatoire des Sciences de Univers
de Grenoble (The Grenoble Observatory for Sciences of the Uni-
verse—Labex OSUG@2020) (Investissements d’avenir, ANR10-
LABX56). We thank the two anonymous reviewers for their con-
structive remarks and comments and the editors of the journal for the
editing work.
Open Access This article is distributed under the terms of the
Creative Commons Attribution 4.0 International License (http://crea
tivecommons.org/licenses/by/4.0/), which permits unrestricted use,
distribution, and reproduction in any medium, provided you give
appropriate credit to the original author(s) and the source, provide a
link to the Creative Commons license, and indicate if changes were
made.
References
AFPS (Association Francaise de Genie Parasismique). 2003. Prelim-
inary report of the survey done after the Algerian, 21/05/2003
earthquake (Rapport preliminaire de la mission du seisme du 21
mai 2003 en Algerie). http://www.afps-seisme.org/Publications/
Rapports-de-missions/Algerie-2003/. Accessed Jul 2016.
Akoglu, A.M., A.Z. Cakir, M. Meghraoui, S. Belabbes, S.O. El
Alami, S. Ergintav, and H.S. Akyuz. 2006. The 1994–2004 Al
Hoceima (Morocco) earthquake sequence: Conjugate fault
ruptures deduced from InSAR. Earth and Planetary Science
Letters 252(3): 467–480.
El Alami, S.O., B. Tadili, L.A. Brahim, and I. Mouayn. 2004.
Seismicity of Morocco for the period 1987–1994. Pure and
Applied Geophysics 161(5–6): 969–982.
Altinok, Y., B. Alpar, N. Ozer, and C. Gazioglu. 2005. 1881 and 1949
earthquakes at the Chios-Cesme Strait (Aegean Sea) and their
relation to tsunamis. Natural Hazards Earth System Science
5(5): 717–725.
Armenian, H.K., A. Melkonian, E.K. Noji, and A.P. Hovanesian.
1997. Deaths and injuries due to the earthquake in Armenia: A
cohort approach. International Journal of Epidemiology 26(4):
806–813.
Ayadi, A., and M. Bezzeghoud. 2015. Seismicity of Algeria from
1365 to 2013: Maximum observed intensity map (MOI2014).
Seismological Research Letters 86(1): 1–9.
Ayadi, A., F. Ousadou-Ayadi, S. Bourouis, and H. Benhallou. 2002.
Seismotectonics and seismic quietness of the Oranie region
(western Algeria): The Mascara earthquake of August 18th 1994,
Mw = 5.7, Ms = 6.0. Journal of Seismology 6(1): 13–23.
Aydan, O., R. Ulusay, H. Kumsar, and E. Tuncay, 2000. Site
investigation and engineering evaluation of the Duzce-Bolu
earthquake of November 12, 1999. Technical report, Turkish
Earthquake Foundation, TDV/DR 09–51. http://www.turkiyede
premvakfi.org.tr/pdf/deprem_raporlari_sirali/TDV-DR_09-51.
pdf. Accessed Jul 2016.
Aysan, F.Y. 1984. The Erzurum-Kars earthquake of Eastern Turkey
(1983). Disasters 8(1): 21–32.
Azzouz, H., and B. Rebzani. 2005. Practices of post-seismic
evaluation of buildings from El Asnam 1954 to Boumerdes
2003 earthquakes (Evaluation des interventions post-sismiques
sur les constructions, D’El-Asnam 1954 a Boumerdes 2003).
Report CTC Chlef, Algerie (in French).
Azzouz, H. 2002. History of the 10/10/1980 Chlef (El Asnam)
earthquake (Historique du seisme de Chlef, ex-El Asnam du
10/10/1980). In 3eme forum des assurances sur les CAT-NAT,
El-Aurassi, 13–15 October 2002, 120–137 (in French).
Badal, J., M. Vazquez-Prada, and A. Gonzalez. 2005. Preliminary
quantitative assessment of earthquake casualties and damages.
Natural Hazards 34(3): 353–374.
Baratta, M. 1910. The Calabrian seismic catastrophe of Messina
(December 28, 1908) (La catastrofe sismica calabro messinese
(28 dicembre 1908)). Relazione alla Societa Geografica Italiana,
2 vol., Roma (riproduzione integrale nel DVD-Rom allegato a Il
terremoto e il maremoto del 28 dicembre 1908). INGV
resources. https://ingvterremoti.wordpress.com/2015/12/28/i-ter
remoti-del-900-la-catastrofe-sismica-del-28-dicembre-1908/.
Accessed Jul 2016.
Barbano, M.S., R. Azzaro, and D.E. Grasso. 2005. Earthquake
damage scenarios and seismic hazard of Messina, north-eastern
Sicily (Italy) as inferred from historical data. Journal of
Earthquake Engineering 9(6): 805–830
Barka, A. 1999. The 17 August 1999 Izmit earthquake. Science
285(5435): 1858–1859
Benouar, D. 1994. Material for the investigation of the seismicity of
Algeria and adjacent region during the twentieth century. Annals
of Geophysics 37(4): 860.
Benson, C., and J. Twigg. 2004. Measuring mitigation: Methodolo-
gies for assessing natural hazard risks and the net benefits of
mitigation—A scoping study. International Federation of Red
Cross and Red Crescent Societies/the ProVention Consortium.
http://www.preventionweb.net/publications/view/1065. Acces-
sed Jul 2016.
Bertero, V., and H. Shah. 1983. El-Asnam, Algeria, earthquake of
October 10, 1980: A reconnaissance and engineering report.
https://www.eeri.org/lfe/pdf/algeria_el_asnam_eeri_prelimin
ary_report_1.pdf. Accessed Jul 2016.
Berz, G., and E. Hettler. 1981. Earthquakes in Greece, Februray/
March 1981. EERI report. https://www.eeri.org/lfe/pdf/Greece_
AlcionidesIsles_Berz&Hettler_Nov81.pdf. Accessed Jul 2016.
Bird, J.F., and J.J. Bommer. 2004. Earthquake losses due to ground
failure. Engineering Geology 75(2): 147–179.
Bommer, J., R. Spence, M. Erdik, S. Tabuchi, N. Aydinoglu, E.
Booth, D. del Re, and O. Peterken. 2002. Development of an
earthquake loss model for Turkish catastrophe insurance.
Journal of Seismology 6(3): 431–446.
Brookshire, D., S. Chang, H. Cochrane, R. Olson, A. Rose, and J.
Steenson. 1997. Direct and indirect economic losses from
earthquake damage. Earthquake Spectra 13(4): 683–701.
CATDAT (Damaging earthquake database). 2016. Earthquake-Re-
port.com. http://earthquake-report.com/. Accessed Jul 2016.
CGS (National Center for Applied Research in Earthquake Engineer-
ing). 2000. The 1999/12/22 Ain-Temouchent earthquake (Seisme
de Ain-Temouchent du 22 decembre 1999). Report n�2, CentreNational de Recherche Appliquee en Genie Parasismique (CGS),
Algier (Algeria) (in French).
Cha, L.S. 1998. Assessment of global seismic loss based on
macroeconomic indicators. Natural Hazards 17(3): 269–283.
Chen, Q.F., Y. Chen, and L. Chen. 1997. Earthquake loss estimation
with GDP and population data. Acta Seimologica Sinica 10(4):
791–800.
Chen, Y., Q.F. Chen, and L. Chen. 2001. Vulnerability analysis inearthquake loss estimate. Natural Hazards 23(2–3): 349–364.
Int J Disaster Risk Sci 431
123

Cherkaoui, T., and M. Harnafi. 2004. Field survey from the 3rd to 7th
March 2004 (Rapport preliminaire de mission du 3 au 7 mars
2004). Universite Mohammed V—Agdal, Departement de
Physique du Globe. http://ashabarter.free.fr/Basedocuments/Seis
meAlHoceima.pdf. Accessed 28 Nov 2017.
Clerc, D. 1975. Economics of Algeria (Economie de l’Algerie).
Ministere de l’interieur, France (in French).
Coburn, A., and R. Spence. 2002. Earthquake protection, 2nd edn.
Chichester: John Wiley & Sons.
Daniell, J.E., B. Khazai, F. Wenzel, and A. Venvaeck. 2011. The
CATDAT damaging earthquakes database. Natural Hazards and
Earth System Science 11(8): 2235–2251.
Daniell, J.E., A. Vervaeck, and F. Wenzel. 2010. The cost of historic
earthquakes today—Economic analysis since 1900 through the
use of CATDAT. In Proceedings of Australian Earthquake
Engineering Society 2010 Conference, 26–28 November 2010,
Perth, Western Australia.
Dunbar, P., R. Bilham, and M. Laituri. 2002. Earthquake loss
estimation for India based on macroeconomic indicators. In Risk
science and sustainability: Science for reduction of risk and
sustainable development of society, ed. T. Beer, and A. Ismail-
Zadeh, 163–180. Dordrecht: Kluwer Academic Publishers.
D’Ayala, D., R. Spence, C.S. Oliveira, and A. Pomonis. 1997.
Earthquake loss estimation for Europe’s historic town centres.
Earthquake Spectra 13(4): 773–793.
EERI (Earthquake Engineering Research Institute). 2012. The Mw 7.1
Ercis-Van, Turkey earthquake of October 23, 2011. EERI
Special earthquake report. https://www.eeri.org/wp-content/
uploads/Van_Turkey_eq-report.pdf. Accessed Jul 2016.
EERI (Earthquake Engineering Research Institute). 1986. The
September 13, 1986 earthquake—Kalamata, Greece. EERI
special earthquake report. https://www.eeri.org/lfe/pdf/Greece_
Kalamata_Insert_Oct86.pdf. Accessed Jul 2016.
EERI (Earthquake Engineering Research Institute). 1992. The Cairo,
Egypt, earthquake of October 12, 1992. EERI special report.
https://www.eeri.org/lfe/pdf/Egypt_Cairo_Insert_Dec92.pdf.
Accessed Jul 2016.
EERI (Earthquake Engineering Research Institute). 1995. The Egion,
Greece, earthquake of June 15, 1995. EERI special report.
https://www.eeri.org/lfe/pdf/Greece_Egion_Insert_Jul95.pdf.
Accessed Jul 2016.
EERI (Earthquake Engineering Research Institute). 1998. Turkish
earthquakes: Two reports; lessons from Adana—Ceyhan quake
and Dinar aftershock. EERI special earthquake report. https://
www.eeri.org/lfe/pdf/Turkey_Adana_Ceyhan_Insert_Sep98.pdf.
Accessed Jul 2016.
EERI (Earthquake Engineering Research Institute). 1999. The Athens,
Greece, earthquake of September 7, 1999. EERI newsletter.
https://www.eeri.org/lfe/pdf/Greece_Athens_Article_Oct99.pdf.
Accessed Jul 2016.
EERI (Earthquake Engineering Research Institute). 2003. Preliminary
observations on the October 31–November 1, 2002 Molise, Italy,
earthquake sequence. EERI special earthquake report. https://
www.eeri.org/lfe/pdf/italy_molise_eeri_report.pdf. Accessed Jul
2016.
EERI (Earthquake Engineering Research Institute). 2004. Preliminary
observations on the Al Hoceima, Morocco, Earthquake of
February 24, 2004. https://www.eeri.org/lfe/pdf/morocco_alho
ceimaeeripreliminary_report.pdf. Accessed Jul 2016.
Erdik, M. 1984. Report on the Turkish earthquake of October 30,
1983. Earthquake Spectra 1(1): 151–172.
Erdik, M., K. Sesetyan, M.B. Demircioglu, U. Hancilar, and C.
Zulfikar. 2011. Rapid earthquake loss assessment after damaging
earthquakes. Soil Dynamics and Earthquake Engineering 31(2):
247–266.
FEMA (Federal Emergency Management Agency). 2016. Hazus-MH
MR5 earthquake loss estimation methodology. Technical and
user’s manual. Washington, DC: Federal Emergency Manage-
ment Agency. http://www.fema.gov/plan/prevent/hazus. Acces-
sed Jul 2016.
Ferrer, M., L.G. de Vallejo, J.C. Garcıa, A. Rodrıguez, and H.
Estevez. 2004. Seismic and flood risk evaluation in Spain from
historical data. In Engineering geology for infrastructure plan-
ning in Europe: A European perspective, ed. R. Hack, R. Azzam,
and R. Charlier, 727–737. Berlin: Springer.
Goretti, A., and G. Di Pasquale. 2002. An overview of post-
earthquake damage assessment in Italy. EERI workshop on an
action plan to develop earthquake damage and loss data
protocols, 19–20 September 2002, Pasadena, California.
https://www.eeri.org/lfe/pdf/italy_molise_goretti_pasadena_
paper.pdf. Accessed Jul 2016.
Guettiche, A., P. Gueguen, and M. Mimoune. 2017. Seismic
vulnerability assessment of a typical Algerian urbanization using
association rule learning—Application to the city of Constantine,
Algeria. Natural Hazards 86(3): 1223–1245.
Guha-Sapir, D., R. Below, and P. Hoyois. 2016. EM-DAT: Interna-
tional disaster database. Universite Catholique de Louvain,
Belgium. http://www.emdat.be. Accessed Mar 2016.
Gueguen, P., H. Yepes, and I. Riedel. 2016. On the value of
earthquake scenario: The Kathmandu recent lesson. Frontiers in
Built Environment. https://doi.org/10.3389/fbuil.2015.00026.
Gueguen, P. 2013. Seismic vulnerability of structures. Civil Engi-
neering and geomechanics series. Hoboken, US: Wiley–ISTE
(International Society for Technology in Education).
Hatzfeld, D., V. Karakostas, M. Ziazia, G. Selvaggi, S. Leborgne, C.
Berge, R. Guiguet, A. Paul, P. Voidomatis, D. Diagnourtas, I.
Kassaras, et al. 1997. The Kozani-Grevena (Greece) earthquake
of 13 May 1995 revisited from a detailed seismological study.
Bulletin of the Seismological Society of America 87(2): 463–473.
Heatwole, N., and A. Rose. 2013. A reduced-form rapid economic
consequence estimating model: Application to property damage
from US earthquakes. International Journal of Disaster Risk
Science 4(1): 20–32.
Holzer, T.L., and J.C. Savage. 2013. Global earthquake fatalities and
population. Earthquake Spectra 29(1): 155–175.
JAEE (Japan Association of Earthquake Engineering). 2004.
Boumerdes earthquake, May 21, 2003. Japanese Reconnaissance
Team, Japan Association of Earthquake Engineering report,
151 pp. http://www.jsce.or.jp/library/eq_repo/Vol2/04/algeriare
port.pdf. Accessed Jul 2016.
Jackson, J. 2006. Fatal attraction: Living with earthquakes, the growth
of villages into megacities, and earthquake vulnerability in the
modern world. Philosophical Transactions of the Royal Society
A 364(1845): 1911–1925.
Jaiswal, K.S., and D.J. Wald. 2010. An empirical model for global
earthquake fatality estimation. Earthquake Spectra 26(4):
1017–1037.
Jaiswal, K.S., and D.J. Wald. 2013. Estimating economic losses from
earthquakes using an empirical approach. Earthquake Spectra
29(1): 309–324.
Jaiswal, K.S., D.J. Wald, P.S. Earle, K.A. Porter, and M. Hearne.
2011. Earthquake casualty models within the USGS Prompt
Assessment of Global Earthquakes for Response (PAGER)
system. In Human casualties in earthquakes, Series Advances in
Natural and Technological Hazards Research, ed. R. Spence, E.
So, and C. Scawthorn, 83–94. Dordrecht: Springer.
KOERI (Kandilli Observatory and Earthquake Research Institute).
2014. Earthquake report, 24 May 2014 northern Aegean Sea.
KOERI report. http://www.koeri.boun.edu.tr/sismo/2/wp-con
tent/uploads/2014/05/KOERI_Press_Bulletin_NAn_EQ_
24May2014_v7.pdf. Accessed Jul 2016.
432 Guettiche et al. Economic and Human Loss Empirical Models
123

Kappos, A.J., G. Panagopoulos, C. Panagiotopoulos, and G. Penelis,
2006. A hybrid method for the vulnerability assessment of R/C
and URM buildings. Bulletin of Earthquake Engineering 4(4):
391–413.
Laouami, N., A. Slimani, Y. Bouhadad, J.-L. Chatelain, and A. Nour.
2006. Evidence for fault-related directionality and localized site
effects from strong-motion recordings of the 2003 Boumerdes
(Algeria) earthquake: Consequences on damage distribution and
the Algerian seismic code. Soil Dynamics and Earthquake
Engineering 26(11): 991–1003.
Maddison, A. 2006. The world economy: A millennial perspective.
Paris: Organisation for Economic Co-operation and Develop-
ment (OECD).
Maouche, S., A. Harbi, and M. Meghraoui. 2008. Attenuation of
intensity for the Zemmouri earthquake of 21 May 2003 (Mw
6.8): Insights for the seismic hazard and historical earthquake
sources in northern Algeria. In Historical seismology: Interdis-
ciplinary studies of past and recent earthquakes, ed. J. Frechet,
M. Meghraoui, and M. Stucchi, 327–350. Dordrecht: Springer.
Martınez-Dıaz, J.J., M. Bejar-Pizarro, J.A. Alvarez-Gomez, F. de Lis
Mancilla, D. Stich, G. Herrera, and J. Morales. 2012. Tectonic
and seismic implications of an intersegment rupture: The
damaging May 11th 2011 Mw 5.2 Lorca, Spain earthquake.
Tectonophysics 546: 28–37.
Minami, K. 1965. Relocation and reconstruction of the town of Brace,
Cyrenaica, Libya damaged by the earthquake of 21 February
1963. UNESCO report, WS/0865.76-AVS, Paris. http://unesdoc.
unesco.org/images/0000/000077/007706EB.pdf. Accessed Jul
2016.
Mitchell, A.W. 1976. Reconstruction after disaster: The Gediz
earthquake of 1970. Geographical Review 66(3): 296–313.
Molina, S., D.H. Lang, C.D. Lindholm, and F. Lingvall. 2010. User
manual for the earthquake loss estimation tool: SELENA. http://
selena.sourceforge.net/selenamanual.pdf. Accessed Jul 2016.
NGDC (National Geophysical Data Center). 2016. Significant earth-
quake database. National Oceanic and Atmospheric Administra-
tion (NOAA). http://www.ngdc.noaa.gov/nndc/struts/form?t=
101650&s=1&d=1. Accessed Jul 2016.
NYT (New York Times). 1990. 18 dead in quake in Eastern Sicily.
New York Times, December 14. http://www.nytimes.com/1990/
12/14/world/18-dead-in-quake-in-eastern-sicily.html. Accessed
Jul 2016.
Nichols, J.M., and J.E. Beavers. 2003. Development and calibration
of an earthquake fatality function. Earthquake Spectra 19(3):
605–633.
Payany, M. 1983. The earthquake of 1909 according to the documents
of the time (Le Seisme de 1909 d’apres les documents de
l’epoque). Document technique A: Simulation du seisme
provencal de 1909, Centre d’Etudes Techniques de l’Equipement
d’Aix-en-Provence. http://observatoire-regional-risques-paca.fr/
sites/default/files/biblio/SEI_EVT_1909_SEISME_DOSSIER_
TECH_A.pdf. Accessed Jul 2016 (in French).
Pittore, M., and M. Wieland. 2013. Toward a rapid probabilistic
seismic vulnerability assessment using satellite and ground-
based remote sensing. Natural Hazards 68(1): 115–145.
Protezione Civile. 2002. Molise earthquake 2002, Italy. http://www.
protezionecivile.gov.it/jcms/en/terremoto_molise_2002.wp.
Accessed Jul 2016.
Psycharis, I. 1978. The Salonica (Thessaloniki) earthquake of June
20, 1978. Caltech report EERL78-03. http://authors.library.
caltech.edu/26430/1/7803.pdf. Accessed Jul 2016.
RMS (Risk Management Solutions). 2008. The 1908 Messina
earthquake: 100-year retrospective. Special report. http://
forms2.rms.com/rs/729-DJX-565/images/eq_1908_messina_eq.
pdf. Accessed Jul 2016.
Riedel, I., P. Gueguen, M. Dalla Mura, E. Pathier, T. Leduc, and J.
Chanussot. 2015. Seismic vulnerability assessment of urban
environments in moderate-to-low seismic hazard regions using
association rule learning and support vector machine methods.
Natural Hazards 76(2): 1111–1141.
Riedel, I., P. Gueguen, F. Dunand, and S. Cottaz. 2014. Macro-scale
vulnerability assessment of cities using association rule learning.
Seismological Research Letters 85(2): 295–305.
Rothe, J.P. 1969. The seismicity of the Earth, 1953–1965. Paris:
United Nations Educational, Scientific and Cultural Organization
(UNESCO). http://unesdoc.unesco.org/images/0001/000145/
014503mo.pdf. Accessed Jul 2016.
Saito, K., and R. Spence. 2011. Mapping urban building stocks for
vulnerability assessment—Preliminary results. International
Journal of Digital Earth 4(Supplemental Issue 1): 117–130.
Samardjieva, E., and J. Badal. 2002. Estimation of the expected
number of casualties caused by strong earthquakes. Bulletin of
the Seismological Society of America 92(6): 2310–2322.
Samardjieva, E., and K. Oike. 1992. Modelling the number of
casualties from earthquakes. Journal of Natural Disaster Science
14(1): 17–28.
Schumacher, I., and E. Strobl. 2011. Economic development and
losses due to natural disasters: The role of hazard exposure.
Ecological Economics 72: 97–105.
So, E., and R. Spence. 2013. Estimating shaking-induced casualties
and building damage for global earthquake events: A proposed
modelling approach. Bulletin of Earthquake Engineering 11(1):
347–363.
Storchak, D.A., D. Di Giacomo, I. Bondar, E.R. Engdahl, J. Harris,
W.H.K. Lee, A. Villasenor, and P. Bormann. 2013. Public
release of the ISC-GEM global instrumental earthquake cata-
logue (1900–2009). Seismological Research Letters 84(5):
810–815.
Strauss, J. 1974. If you were the judge. Reading Eagle, April 1974.
https://news.google.com/newspapers?nid=1955&dat=
19740414&id=LAQrAAAAIBAJ&sjid=x5cFAAAAIBAJ&pg=
6853,1396218&hl=en. Accessed Jul 2016.
Turkish Red Crescent Society. 2006. 1999-Marmara earthquake case
study. International disaster response law report. http://www.ifrc.
org/PageFiles/93724/report-turkey.pdf. Accessed Jul 2016.
US Geological Survey. 2016. Prompt assessment of global earth-
quakes for response. PAGER system. http://earthquake.usgs.gov/
data/pager/. Accessed Jul 2016.
Valcarcel, J.A., G.A. Bernal, and M.G. Mora. 2012. Lorca earthquake
May 11 2011: A comparison between disaster figures and risk
assessment outcomes. In Proceedings of the 15th World
Conference on Earthquake Engineering, 24–28 September,
Lisboa, Portugal, 14075.http://www.iitk.ac.in/nicee/wcee/arti
cle/WCEE2012_2371.pdf. Accessed 1 Dec 2017.
WHO (World Health Organization). 2016. Global health observatory
data: Urban population growth. http://www.who.int/gho/urban_
health/situation_trends/urban_population_growth_text/. Acces-
sed Nov 2017.
Whitehead, J., and A. Rose. 2009. Estimating environmental benefits
of natural hazard mitigation with data transfer: Results from a
benefit-cost analysis of Federal Emergency Management Agency
hazard mitigation grants. Mitigation Adaptive Strategy for
Global Change 14(7): 655–676.
World Bank. 1994. Memorandum and recommendation of the
president of the IBRD to the executive directors on a proposed
loan in the amount equivalent to US$51.0 million to the
Democratic and popular Republic of Algeria for an emergency
reconstruction project. World Bank report No. P-6455-AL,
Washington, DC. http://documents.worldbank.org/curated/en/
217981468192267567/Algeria-Emergency-Reconstruction-Pro
ject. Accessed Jul 2016.
Int J Disaster Risk Sci 433
123
World Bank. 2000. Algeria—Ain Temouchent Emergency Earthquake
Recovery Project. World Bank report No. 20297-AL, Washing-
ton DC. http://documents.worldbank.org/curated/en/
961911468742560729/Algeria-Ain-Temouchent-Emergency-
Earthquake-Recovery-Project. Accessed Jul 2016.
Yanev, P.I. 1975. The Lice, Turkey, earthquake of September 6
(reconnaissance report), Technical communication. EERI
newsletter 9:6B, URS/Blume San Francisco, California. https://
caltech.tind.io/record/597790. Accessed Jul 2016.
Yelles-Chaouche, A., H. Djellit, H. Beldjoudi, M. Bezzeghoud, and E.
Buforn. 2004. The Ain Temouchent (Algeria) earthquake of
December 22nd, 1999. Pure and Applied Geophysics 161(3):
607–621.
434 Guettiche et al. Economic and Human Loss Empirical Models
123