economic and environmental benefits of improving uae ... · pdf fileeconomic and environmental...
TRANSCRIPT

1Economic and Environmental Benefits of Improving UAE Building Stock Energy Efficiency
Economic and Environmental Benefits of Improving UAE Building Stock Energy EfficiencyKankana Dubey and Moncef KrartiJune 2017 / KS-2017--DP13
2Economic and Environmental Benefits of Improving UAE Building Stock Energy Efficiency
About KAPSARC
Acknowledgement
Legal Notice
The King Abdullah Petroleum Studies and Research Center (KAPSARC) is a non-profit global institution dedicated to independent research into energy economics, policy, technology and the environment, across all types of energy. KAPSARC’s mandate is to advance the understanding of energy challenges and opportunities facing the world today and tomorrow, through unbiased, independent, and high-caliber research for the benefit of society. KAPSARC is located in Riyadh, Saudi Arabia.
This paper has been prepared as part of the joint KAPSARC-UNESCWA project ‘Energy Productivity in the GCC’ and we would like to thank our UNESCWA colleagues for their helpful input and advice. The paper will be used as input to a joint report on improving energy productivity in the GCC region.
© Copyright 2017 King Abdullah Petroleum Studies and Research Center (KAPSARC). No portion of this document may be reproduced or utilized without the proper attribution to KAPSARC.

3Economic and Environmental Benefits of Improving UAE Building Stock Energy Efficiency
In the United Arab Emirates (UAE), buildings consume almost 90 percent of the total electricity used in the country, mostly in Dubai and Abu Dhabi. We undertook a study to explore available opportunities to improve the energy efficiency of the UAE building sector. This paper assesses the best combinations of
energy efficiency measures that can be adopted at a minimal cost. In our simulation, we evaluated a series of energy efficiency options for both existing and new buildings. Our optimization analysis is based on the sequential search technique, applied to a wide range of applications, including combinations of energy efficient measures (EEMs) and retrofitting existing buildings. Our findings are:
Any level of energy efficiency retrofit to existing UAE building stock would achieve significant savings. It is estimated that deep retrofits have the potential to reduce the energy consumption of existing buildings by up to 50 percent.
It is estimated that a basic energy retrofit program applied to existing UAE building stock could achieve savings of 7,550 GWh/year in electricity consumption, 1,400 MW in peak electricity demand and reduce carbon emissions by 4.5 million tons/year. The scheme would have an average payback period of less than six months for the UAE government.
Our optimization analyses reveal that deployment of a large-scale energy retrofit program for the UAE building stock would be cost-effective for the government. A deep retrofit of the entire building stock would have a payback period of just 2.3 years, yielding significant benefits: saving about 47,200 GWh/year in electricity consumption together with 8,802 MW in peak power demand and reducing 28.5 million tons/year of carbon emissions.
Realizing this value, Dubai has already created a super ESCO (Etihad Energy Services) to finance and jump-start retrofit projects of existing buildings using the performance contracting concept, a means of financing energy efficiency investments that is based on future savings. In March 2017, the Abu Dhabi Water and Electricity Authority and the UAE Ministry of Economy launched an ESCO in Abu Dhabi. This scheme could be extended to the other emirates.
Key Points
4Economic and Environmental Benefits of Improving UAE Building Stock Energy Efficiency
Executive Summary
The United Arab Emirates (UAE) is a federated country established in 1972. It consists of seven emirates: Abu Dhabi, Ajman,
Al-Fujayrah, Dubai, Sharjah, Ummal Qaywayn and Ras Al Khaymah. The country’s electricity sector underwent significant development during the 1990s, especially in Abu Dhabi, the state’s largest emirate and holder of more than 90 percent of its oil reserves.
The Abu Dhabi Water and Electricity Authority (ADWEA) was created in 1998 to oversee and manage water and electricity generation and distribution. The power sector was divided into seven specialized electricity companies, including four generation companies (gencos), one transmission company (transco) and two distribution companies (discos). At the same time, the Abu Dhabi Water and Electricity Company (ADWEC) was established to maintain a monopoly over wholesale trading. It acts as a central buyer of all electricity and water produced, which it sells to the discos. In addition, the Regulation and Supervision Bureau (RSB), Abu Dhabi’s regulatory body, was established to oversee technical regulations including grid codes, safety standards, technical and performance standards. Today, most of the electricity and water produced come from independent water and power providers (IWPPs) under long-term power and water purchase agreements (PWPAs). Even after the privatization of a few IWPPs, the government still retains full ownership of the monopoly businesses of procurement, transmission and distribution.
In addition to ADWEA, there are three other water and electricity authorities in the UAE, including
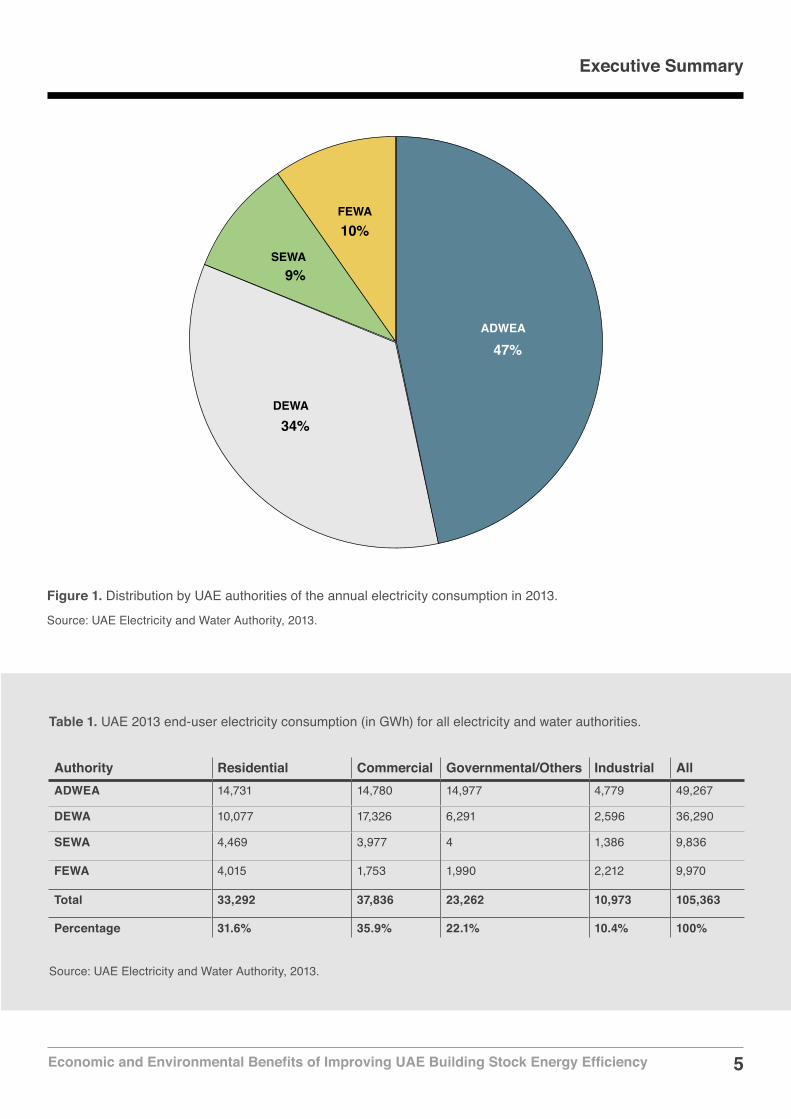
DEWA serving mostly Dubai, FEWA (Federal Electricity and Water Authority) serving northern emirates Ajman, Al-Fujayrah, Ummal Qaywayn and Ras Al Khaymah, and SEWA for Sharjah. Most of the UAE’s electricity is generated and consumed by two authorities, Abu Dhabi’s ADWEA and Dubai’s DEWA. These two authorities account for more than 80 percent of the total annual electricity used in the country in 2013, as shown in Figure 1.
Residential and commercial buildings in the UAE consumed 32 percent and 36 percent, respectively, of total electricity in 2013 (DoE 2014). The proportion varies significantly depending on the emirate, as shown in Table 1.
Using the sequential search technique, our analysis showed that improving the energy efficiency of the UAE’s building stock can provide cost-effective reductions in electricity consumption, peak power demand and carbon emissions, while creating a sizable number of employment opportunities. We also found that any level of energy retrofit to buildings would be highly cost-effective, even if the UAE government has to subsidize all the implementation costs of the program for the entire existing stock.
A deep retrofit of the entire building stock (i.e., based on a Level-3 audit) would have an average payback period of just 2.3 years. It would produce significant benefits: saving 47,200 GWh/year in electricity consumption and 8,800 MW in peak power demand and reducing carbon emissions by 28 million tons/year. The Level-3 program would also create as much as 56,000 job-years.
5Economic and Environmental Benefits of Improving UAE Building Stock Energy Efficiency
Authority Residential Commercial Governmental/Others Industrial AllADWEA 14,731 14,780 14,977 4,779 49,267
DEWA 10,077 17,326 6,291 2,596 36,290
SEWA 4,469 3,977 4 1,386 9,836
FEWA 4,015 1,753 1,990 2,212 9,970
Total 33,292 37,836 23,262 10,973 105,363
Percentage 31.6% 35.9% 22.1% 10.4% 100%
Table 1. UAE 2013 end-user electricity consumption (in GWh) for all electricity and water authorities.
Source: UAE Electricity and Water Authority, 2013.
Executive Summary
Figure 1. Distribution by UAE authorities of the annual electricity consumption in 2013. Source: UAE Electricity and Water Authority, 2013.

6Economic and Environmental Benefits of Improving UAE Building Stock Energy Efficiency
We summarize the results of our analysis in Table 2. Three levels of energy efficiency investments are considered for existing UAE building stock from basic through deep retrofits. In Table 2, we also
highlight the results for residential buildings and for the entire building stock, including commercial and government buildings.
Retrofit Program Investment Level 1 (Basic retrofit: lighting and weatherization)
Investment Level 2 (Standard retrofit: Level 1 with A/C and insulation)
Investment Level 3 (Deep retrofit: Level 2 with windows and controls)
Residential building stock
Total building stock
Residential building stock
Total building stock
Residential building stock
Total building stock
Total Investments Required (USD Bn)
0.13 2.0 1.25 10.7 2.5 21.4
Avoided Electricity Consumption (GWh/year)
2,660 7,550 7,650 21,700 16,600 47,200
Value of Avoided Electricity Consumption $0.05–$0.15/kWh (USD Billion/year)
0.13-0.4 0.4-1.1 0.4-1.2 1.1-3.3 0.8-2.4 2.4-7.1
Avoided Electricity Generation Capacity (MW/year)
500 1,400 1,450 4,000 3,100 8,800
Value of Avoided Electricity Capacity (USD Billion)
0.6 1.7 1.8 4.8 3.7 10.6
Investment Simple Payback Period $0.05-$0.15/kWh (Years)
0 0.3–0.8 0 1.8–5.4 0 1.5–4.5
Jobs Created (per year for a 10-year period)
300 900 1,000 2,500 2,000 5,600
Reduced Carbon Emissions (Million Metric Ton/year)
1.60 4.568 4.633 13.134 10.071 28.553
Table 2. An evaluation of building energy efficiency retrofit investments for the UAE.
Source: KAPSARC analysis (assumes avoided costs of electricity ranging from $0.05/kWh to $0.15/kWh and a generation capacity valued at $1,200 for reduced CAPEX per kW).
Executive Summary

7Economic and Environmental Benefits of Improving UAE Building Stock Energy Efficiency
Overview of Energy Demand and the Building Sector
Retrofit Program Investment Level 1 (Basic retrofit: lighting and weatherization)
Investment Level 2 (Standard retrofit: Level 1 with A/C and insulation)
Investment Level 3 (Deep retrofit: Level 2 with windows and controls)
Residential building stock
Total building stock
Residential building stock
Total building stock
Residential building stock
Total building stock
Total Investments Required (USD Bn)
0.13 2.0 1.25 10.7 2.5 21.4
Avoided Electricity Consumption (GWh/year)
2,660 7,550 7,650 21,700 16,600 47,200
Value of Avoided Electricity Consumption $0.05–$0.15/kWh (USD Billion/year)
0.13-0.4 0.4-1.1 0.4-1.2 1.1-3.3 0.8-2.4 2.4-7.1
Avoided Electricity Generation Capacity (MW/year)
500 1,400 1,450 4,000 3,100 8,800
Value of Avoided Electricity Capacity (USD Billion)
0.6 1.7 1.8 4.8 3.7 10.6
Investment Simple Payback Period $0.05-$0.15/kWh (Years)
0 0.3–0.8 0 1.8–5.4 0 1.5–4.5
Jobs Created (per year for a 10-year period)
300 900 1,000 2,500 2,000 5,600
Reduced Carbon Emissions (Million Metric Ton/year)
1.60 4.568 4.633 13.134 10.071 28.553
Over the last decade, UAE electricity consumption has increased in tandem with population growth, as shown in Figure 2. It
should be noted that per capita energy consumption has, however, decreased slightly over the past few years, mostly due to a significant increase in population following the influx of foreign workers, as shown in Figure 3. This population growth, combined with steady energy use per person, has increased demand for power generation, especially in the
residential sector. In 2013, the UAE had a combined generation capacity of 27,374 MW that was fully used to meet the country’s demand. To generate its electricity in 2013, the UAE operated 40 power plants, including 28 combined water desalination and power generation plants. Peak electricity demand for various authorities is summarized in Table 3 for 2011 through 2013 (MoE 2014). Total peak power demand for 2013 was 19,651 MW, representing 72 percent of overall installed capacity.
Figure 2. Variation of population and electricity consumption, 2000-2012. Source: IEA data.

8Economic and Environmental Benefits of Improving UAE Building Stock Energy Efficiency
Overview of Energy Demand and the Building Sector
Figure 3. Variation of population and per capita electricity consumption, 2000-2012. Source: Ministry of Energy, UAE, 2012.
Authority 2011 2012 2013ADWEA 7,863 8,278 8,599
DEWA 6,206 6,637 6,857
SEWA 1,958 2,087 2,150
FEWA 1,840 2,060 2,045
Total 17,867 19,062 19,651
Table 3. UAE electricity and water authorities’ peak demand (in MW) 2011-2013.
Source: Ministry of Energy, UAE, 2014.

9Economic and Environmental Benefits of Improving UAE Building Stock Energy Efficiency
Overview of Energy Demand and the Building Sector
Figure 4. Annual electricity consumption and peak demand, 2008 - 2013. Source: KAPSARC analysis based on data from Ministry of Energy, UAE, 2014.
Figure 4 illustrates the annual electricity consumption and installed generation capacity variations from 2008 to 2013 in the UAE (MOE 2014). A regression analysis of the data indicates that there has been consistent power demand growth over the last decade, with an annual increase of 5,600 GWh for electricity consumption and 1,730
MW for installed generation capacity. During the period 2008-2013, the UAE’s electricity consumption increased by 6 percent annually. If this growth rate continues, annual electricity consumption and installed generating capacity are forecast to rise by 2030 to 200,700 GWh and 57,780 MW, respectively, almost doubling current demand.
0
20,000
40,000
60,000
80,000
100,000
120,000
201320122011201020092008
Ann
ual e
lect
ricity
con
sum
ptio
n an
d in
stal
led
capa
city
GWhMWYear
GWh = 5557 (year-2007) + 72916R² = 0.9963
MW = 1730 (year-2007) + 17992R² = 0.9363

10Economic and Environmental Benefits of Improving UAE Building Stock Energy Efficiency
Due to the Emirates’ arid climate, a significant portion of electricity demand and consumption comes from the air conditioning of buildings. Figures 5 (a) and (b) correlate monthly total electricity consumption for Abu Dhabi during 2014. It is expressed as a function of the respective monthly cooling degree days and monthly average ambient air temperature, using 2-parameter and 3-parameter inverse modeling approaches (Krarti 2011). The monthly baseload energy consumption associated with electricity demand for operating industrial facilities, as well as the plug loads, appliances and lighting in buildings, is estimated at 1,750 GWh. Air conditioning energy consumption, on the other hand, increases with rising outdoor temperature during the summer months. Both Figures 5 (a) and (b) show that monthly electricity consumption more than doubled from 1,700 GWh in February to 3,600 GWh in August (ADWEC 2016).
Only limited studies have been carried out on improvements to the energy performance of new and existing UAE buildings. For example, the addition of thermal insulation was found to reduce energy consumption by up to 30 percent for a residential villa in Dubai (Weiss et al. 2011). An analysis of common lighting retrofit options in government buildings has shown that the installation of occupancy sensors can result in a 10 percent reduction in energy use, while, daylighting sensors with dimming controls can achieve 25 percent savings (AlKhateeb et al. 2016).
As noted previously, most new UAE buildings have to comply with specific energy efficiency requirements under the mandatory regulations of the building rating systems applied in Abu Dhabi and Dubai (Pearl Rating System and Green Building Regulations, section to follow). In addition, to jump-start improvements in the energy efficiency of its existing building stock, DEWA created Etihad Energy Services (EES) in 2013. EES used an energy performance contracting approach by developing energy efficiency projects, which target more than 30,000 buildings in Dubai. The aim for EES is to achieve 1.7 TWh in energy savings from building retrofits by 2030.
As part of its first initiative, EES retrofitted all DEWA buildings with over 50 energy conservation measures (EES 2015). Among these measures were replacement of old chillers, installation of variable frequency drives (VFDs) for pump motors, use of CO2 sensors for demand ventilation controls, fitting of solar film to windows, installation of occupancy sensors for lighting systems and installation of water efficient fixtures. It is estimated that the retrofit has a payback period of six years and has reduced the annual energy consumption of DEWA buildings by 31 percent, which represents 5 GWh of electricity use per year. Other retrofit projects for commercial buildings in Dubai have shown a reduction in annual energy consumption of 23 percent (AlKhateeb 2016).
Overview of Energy Demand and the Building Sector

11Economic and Environmental Benefits of Improving UAE Building Stock Energy Efficiency
Figure 5. Monthly 2014 electricity consumption against (a) monthly cooling degree days, (b) monthly average ambient temperature.
Source: KAPSARC analysis based on data from Ministry of Energy, UAE, 2014.
Overview of Energy Demand and the Building Sector

12Economic and Environmental Benefits of Improving UAE Building Stock Energy Efficiency
Description of current building energy efficiency policiesOver the last decade, the UAE has led the Gulf Cooperation Council (GCC) region in promoting energy efficiency and sustainability, especially in the building sector. Indeed, the Emirates Green Building Council (Emirates GBC) was formed in 2006 to promote green buildings and advance sustainability principles. Two rating systems were also developed:
The Pearl Rating System (PRS) is a green building rating certification system developed by the Abu Dhabi Urban Planning Council as part of its sustainable development initiative Estidama. Meaning sustainability in Arabic, Estidama is seen as a model of sustainable urbanization for Abu Dhabi and the entire Middle East region which targets four areas: environmental, economic, social and cultural (Estidama 2016). Similar to the LEED standards, devised by the United States Green Building Council, PRS has several rating levels that depend on a scoring system with mandatory and optional credit points ranging from one pearl to five pearls. PRS was developed specifically for designing buildings in hot and arid climates, with several categories covering: ‘‘designing and operating sustainable buildings and communities including natural systems, resourceful energy, precious water, stewarding materials, livable villa/building/community, integrating development process and innovating practice’’ (Estidama 2015). PRS requires a minimum energy performance of buildings to be assured using either prescriptive or performance approaches. Any additional improvements from the minimum can be awarded credit points. Since 2010, a minimum certification of one pearl is required for all new construction in Abu Dhabi. For new government buildings, a level of two pearls is required.
A set of green building regulations were developed and required for all new buildings in Dubai. The green building regulations set out requirements and compliance approaches similar to LEED (GBR 2015). In particular, the green building specifications foster energy efficiency, water management and use of recycled materials while maximizing indoor environment quality and minimizing outdoor environmental impacts.
Currently, the UAE has the lion’s share of sustainable building projects in the GCC region, with 70 percent of LEED-rated buildings. For example, the Sustainable Dubai City project, which is spread over 46 hectares, was begun in 2013 and will comprise more than 500 villas, educational facilities and organic farms (Grozdanic 2013). A zero energy residential city to house over 160,000 people is also planned to be completed in 2020 as part of this project, with a more than 200 MW solar PV system to meet electricity needs (Saseendran 2014; Asif 2015;). It should be noted that after Saudi Arabia, the UAE has the highest share of GCC construction, accounting for 29 percent of total investment in the region’s new building projects. The vast majority of new projects are commercial and hospitality facilities (Asif 2015).
In addition to a wide range of energy efficiency and demand side management programs and initiatives, the UAE is also promoting the use of solar energy to meet its growing electricity demand. Abu Dhabi and Dubai, for example, have a target to obtain 7 percent and 5 percent of their energy needs through renewable resources by 2020, respectively (ReCREMA 2013).
Overview of Energy Demand and the Building Sector

13Economic and Environmental Benefits of Improving UAE Building Stock Energy Efficiency
Overview of Energy Demand and the Building Sector
Appliances and labeling standardsThe UAE has, since 2013, introduced a regulation on Energy Efficiency Standardization and Labeling (EESL) for domestic appliances. Minimum energy performance standards (MEPS) for air conditioners were first implemented by the Emirates Authority for Standardization and Metrology (ESMA). Subsequently, MEPS for washing machines and refrigeration products were introduced. Table 4 outlines the minimum energy requirements for small air conditioning systems (ESMA 2013a). In addition, the energy efficiency labels implemented in 2014 for refrigerators and freezers as well as washing machines and dryers are listed in Table
5 (ESMA 2013b, 2013c). Please refer to Table A1 (Appendix A), which summarizes the MEPS for larger cooling systems set by ESMA.
Lighting standardsSince June 2014, the UAE, through ESMA, has enacted a comprehensive energy efficiency lighting standard to prevent low quality, unsafe and less energy efficient lighting fixtures from entering the UAE market. In particular, the sale and manufacture of incandescent lamps and low efficiency CFLs have been banned since January 1, 2015. The energy efficiency lighting regulation is expected to reduce peak electricity demand by 340-500 MW and save 2,050 GWh in energy use annually (RTI, 2012).
Table 4. Minimum energy efficiency requirements for small air conditioners.
Source: ESMA, 2013.
Star Rating Window Air Conditioners Non-Ducted Split AC Units
5 EER > 8.51 EER > 9.01
4 8.50 < EER<8.01 9.00 < EER<8.31
3 8.00<EER<7.51 8.30<EER<7.71
2 7.50<EER<6.81 7.70<EER<7.11
1 6.80<EER<6.30 7.10<EER<6.80

14Economic and Environmental Benefits of Improving UAE Building Stock Energy Efficiency
Star Rating Refrigerators/Freezers
(EEI: Energy Efficiency Index)1
Washing Machines EER: Energy Efficiency Ratio)2
Electric Tumble Driers
(EER: Energy Efficiency Ratio)2
Drum Type Top Load Washer-Drier
5 EEI < 33 % EER < 45 EER < 13 EER < 70 EER < 250
4 33 % <EEI< 44 % 45<EER<55 13<EER<15 70<EER<85 250<EER<375
3 44 % <EEI<7 5 % 55<EER<65 15<EER<17 85<EER<100 375<EER<500
2 75 % <EEI<110 % 65<EER<75 17<EER<19 100<EER<115 500<EER<625
1 110 % <EEI<125 % 75<EER<85 19<EER<22 115<EER<130 625<EER<750
Table 5. Labels for energy performance for refrigerators/freezers, washing machines and driers.
Source: ESMA, 2013. Notes: 1- EEI is defined as the ratio in percent of annual energy consumption over a standard or reference annual energy use. 2- EER is defined as the energy consumption per rated capacity and is expressed in Wh/kg.
Overview of Energy Demand and the Building Sector
15Economic and Environmental Benefits of Improving UAE Building Stock Energy Efficiency
Overview of Existing Building Stock
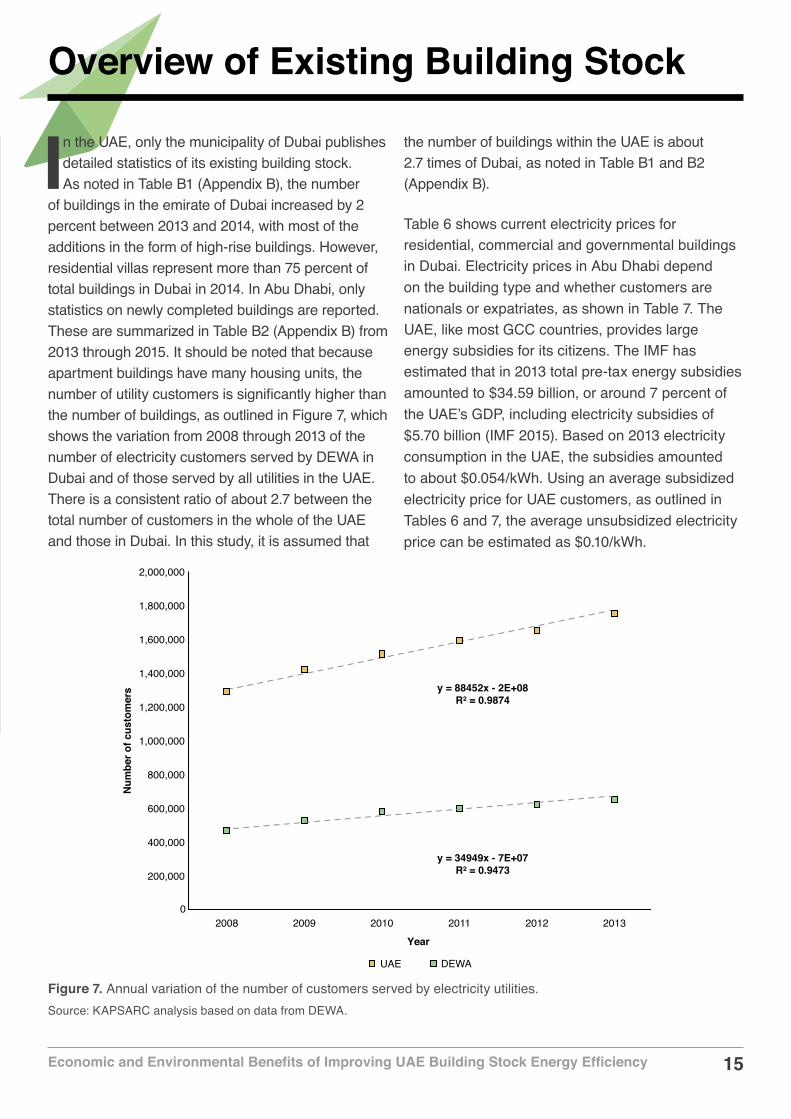
In the UAE, only the municipality of Dubai publishes detailed statistics of its existing building stock. As noted in Table B1 (Appendix B), the number
of buildings in the emirate of Dubai increased by 2 percent between 2013 and 2014, with most of the additions in the form of high-rise buildings. However, residential villas represent more than 75 percent of total buildings in Dubai in 2014. In Abu Dhabi, only statistics on newly completed buildings are reported. These are summarized in Table B2 (Appendix B) from 2013 through 2015. It should be noted that because apartment buildings have many housing units, the number of utility customers is significantly higher than the number of buildings, as outlined in Figure 7, which shows the variation from 2008 through 2013 of the number of electricity customers served by DEWA in Dubai and of those served by all utilities in the UAE. There is a consistent ratio of about 2.7 between the total number of customers in the whole of the UAE and those in Dubai. In this study, it is assumed that
the number of buildings within the UAE is about 2.7 times of Dubai, as noted in Table B1 and B2 (Appendix B).
Table 6 shows current electricity prices for residential, commercial and governmental buildings in Dubai. Electricity prices in Abu Dhabi depend on the building type and whether customers are nationals or expatriates, as shown in Table 7. The UAE, like most GCC countries, provides large energy subsidies for its citizens. The IMF has estimated that in 2013 total pre-tax energy subsidies amounted to $34.59 billion, or around 7 percent of the UAE’s GDP, including electricity subsidies of $5.70 billion (IMF 2015). Based on 2013 electricity consumption in the UAE, the subsidies amounted to about $0.054/kWh. Using an average subsidized electricity price for UAE customers, as outlined in Tables 6 and 7, the average unsubsidized electricity price can be estimated as $0.10/kWh.
Num
ber o
f cus
tom
ers
Year
0
200,000
400,000
600,000
800,000
1,000,000
1,200,000
1,400,000
1,600,000
1,800,000
2,000,000
DEWAUAE
201320122011201020092008
y = 88452x - 2E+08R² = 0.9874
y = 34949x - 7E+07R² = 0.9473
Figure 7. Annual variation of the number of customers served by electricity utilities. Source: KAPSARC analysis based on data from DEWA.

16Economic and Environmental Benefits of Improving UAE Building Stock Energy Efficiency
Overview of Existing Building Stock
Rate in Fils/kWh Customer Type
Consumption Block (kWh/month) Residential Commercial/Government
0-2,000 23 23
2,001-4,000 28 23
4,001-6,000 32 23
6,001-10,000 38 23
More than 10,000 38 38
Table 6. Electricity prices for customers in Dubai (DEWA).
Table 7. Electricity prices for customers in Abu Dhabi (ADWEA).
Source: DEWA, 2017.
Note: Additional fuel surcharge 6.5fils/kWh.
Source: ADWEA, 2017.
Rate in Fils/kWh
Customer Type
ConsumptionBlock (fils/kWh/day)
Residential (Nationals)
Residential (Expats)
Social Card Holders Commercial Governmental
Villa Flat Villa Flat Nationals Expats
0-20 6.7 6.7 26.8 26.8 0 0 20 29.421-30 6.7 6.7 26.8 30.5 0 0 20 29.431-79 6.7 7.5 26.8 30.5 0 0 20 29.480-200 6.7 7.5 26.8 30.5 0 26.8 20 29.4201-333 6.7 7.5 30.5 30.5 0 26.8 20 29.4334-400 6.7 7.5 30.5 30.5 6.7 26.8 20 29.4More than 400 7.5 7.5 30.5 30.5 6.7 26.8 20 29.4

17Economic and Environmental Benefits of Improving UAE Building Stock Energy Efficiency
Rate in Fils/kWh
Customer Type
ConsumptionBlock (fils/kWh/day)
Residential (Nationals)
Residential (Expats)
Social Card Holders Commercial Governmental
Villa Flat Villa Flat Nationals Expats
0-20 6.7 6.7 26.8 26.8 0 0 20 29.421-30 6.7 6.7 26.8 30.5 0 0 20 29.431-79 6.7 7.5 26.8 30.5 0 0 20 29.480-200 6.7 7.5 26.8 30.5 0 26.8 20 29.4201-333 6.7 7.5 30.5 30.5 0 26.8 20 29.4334-400 6.7 7.5 30.5 30.5 6.7 26.8 20 29.4More than 400 7.5 7.5 30.5 30.5 6.7 26.8 20 29.4
Analytical Approach
Our analysis is based on the energy and cost-effectiveness of selected energy efficiency measures that can improve the energy
performance of UAE buildings. The study focuses on the energy performance of residential buildings since they represent a significant portion of overall electricity consumption. Thus, a typical villa is considered in the analysis as shown in Figure 8. The characteristics of the villa energy model are defined using data collected from reported energy audit studies (Radhi et al. 2005 and Alaidroos and Krarti 2015). The building specifications for a villa energy model are provided in Table C1 (Appendix C). The study was carried out using a whole building simulation analysis based on hourly weather data for Dubai and Abu Dhabi (EnergyPlus 2015).
Discussion of selected analysis resultsBaseline energy performance
Based on a detailed simulation analysis, the estimated energy end use of a typical villa in the UAE is shown in Figure 9 (Alaidroos and Krarti 2015). As expected, space cooling is the main end use of total annual electricity consumption for such a villa in Abu Dhabi. In fact, air conditioning represents 79 percent of the total annual villa electricity consumption, which is estimated at 99,476 kWh, with a peak demand of 36.9 kW occurring at 5 p.m. on August 5. Similar results were obtained for a typical villa in Dubai.
Impact of individual EE measuresIn order to determine the impact of design and operating measures on annual energy consumption as well as peak electricity demand for the base case typical UAE villa model, a comprehensive parametric analysis is carried out, to cover a wide range of design and operating measures. Figures 10 and 11
show the maximum percentage reduction in both annual energy consumption and peak electricity demand, for all options, taking a specific design and operating measures for the base case Dubai villa model. As expected, installing an energy efficient air conditioning system has the most significant impact in terms of reducing both annual energy consumption and peak demand. The measure with the second biggest impact is decreasing the cooling temperature settings. Generally, the measures that can reduce annual energy consumption are also effective in reducing peak electricity demand.
Impact of combined EE measuresFigure 12 illustrates the results of our sequential search optimization analysis using design and operating measures when unsubsidized electricity costs of $0.10/kWh are considered for a villa in Dubai [Figure 12(a)] and in Abu Dhabi [Figure 12(b)]. The Pareto diagrams of Figure 12 indicate the percentage annual energy use savings relative to the base case villa model in the X-axis and the life cycle cost (LCC) values in the Y-axis for all the combinations of measures and their options. The optimum points, as shown in Figures 12 (a) and (b), highlight the optimal designs at which the LCC value is reduced while maximizing the villa’s annual energy use savings (Alaidroos and Krarti 2015). Similar life cycle cost optimization analysis showing savings in peak electricity demand is illustrated in Figures 13 (a) and (b) for a typical villa located in Dubai and Abu Dhabi, respectively.
Figures 12 and 13 show that optimal cost-effective designs can achieve significant reductions in total energy consumption and peak electricity demand for residential buildings located in both Dubai and Abu Dhabi. Reductions can amount to 70 percent of total electricity consumption and 78 percent of peak electricity demand.

18Economic and Environmental Benefits of Improving UAE Building Stock Energy Efficiency
Figure 8. Rendering of energy model for the typical villa. Source: KAPSARC analysis.
Figure 9. Annual energy end-use distribution for a typical villa. Source: KAPSARC analysis.
Fan
Equipment
Lighting
Cooling79%
11%
4%
5%1%
Heating
Analytical Approach

19Economic and Environmental Benefits of Improving UAE Building Stock Energy Efficiency
Figure 10. Impact of each EEM on energy savings for a villa in Dubai. Source: KAPSARC analysis.
-40% -20% 0% 20% 40% 60%
Wall ins
Roof ins
Glaz
Shad
Azim
WWR
Light
Infil
Cool-SP
Refreg
COP5.0
2.0
Class 1: 65% Reduction
Class 3: 30% Reduction
26°C (78.8°F)
22°C (71.6°F)
75% Reduction = 0.21 ACH
25% Reduction = 0.63 ACH
70% Reduction
30 % Reduction
40%
20%
180
45
Projection 1.0 m
Projection 0.2 m
Double Low-e
Double Clear
RSI-5.0 (R-28.4)
RSI-1.0 (R-5.7)
RSI-5.0 (R-28.4)
RSI-1.0 (R-5.7)
37.7%
-18.8%0.3%
0.1%
18.6%
-20.6%
18.9%
5.7%
7.1%
3.0%
-28.0%
-9.9%
0.0%
-1.2%
6.7%
3.1%
6.8%
2.8%
8.5%
5.3%
16.5%
11.2%
Max & min total energy savings - Dubai
Analytical Approach

20Economic and Environmental Benefits of Improving UAE Building Stock Energy Efficiency
-40% -20% 0% 20% 40% 60%
Wall ins
Roof ins
Glaz
Shad
Azim
WWR
Light
Infil
Cool-SP
Refreg
COP5.0
2.0
Class 1: 65% Reduction
Class 3: 30% Reduction
26°C (78.8°F)
22°C (71.6°F)
75% Reduction = 0.21 ACH
25% Reduction = 0.63 ACH
70% Reduction
30 % Reduction
40%
20%
180
45
Projection 1.0 m
Projection 0.2 m
Double Low-e
Double Clear
RSI-5.0 (R-28.4)
RSI-1.0 (R-5.7)
RSI-5.0 (R-28.4)
RSI-1.0 (R-5.7)
38.1%
-19.0%0.2%
0.1%
12.1%
-11.8%
17.9%
6.0%
9.7%
4.2%
-27.7%
-9.8%
0.0%
-1.6%
4.9%
2.2%
6.8%
3.2%
16.6%
11.3%
13.1%
9.0%
Max & min peak load savings - Dubai
Figure 11. Impact of each EEM on peak demand for a villa in Dubai. Source: KAPSARC analysis.
Analytical Approach

21Economic and Environmental Benefits of Improving UAE Building Stock Energy Efficiency
Life
cyc
le c
ost
Energy savings
Optimization runs Optimum
0% 10% 20% 30% 40% 50% 60% 70% 80%$100,000
$125,000
$150,000
$175,000
$200,000
$225,000
$250,000 UAE - Dubai
Life
cyc
le c
ost
Energy savings
UAE - Abu Dhabi
Optimization runs Optimum
10% 20% 30% 40% 50% 60% 70% 80% 90%$100,000
$125,000
$150,000
$175,000
$200,000
$225,000
$250,000
Figure 12. Optimization analysis showing energy savings against life cycle cost for a villa in (a) Abu Dhabi and (b) Dubai. Source: KAPSARC analysis.
Analytical Approach

22Economic and Environmental Benefits of Improving UAE Building Stock Energy Efficiency
Life
cyc
le c
ost
Peak demand savings
UAE - Abu Dhabi
Optimization runs Optimum
10% 20% 30% 40% 50% 60% 70% 80% 90%$100,000
$125,000
$150,000
$175,000
$200,000
$225,000
$250,000
Analytical Approach
Figure 13. Optimization analysis showing peak demand savings against life cycle costs for a villa in (a) Abu Dhabi and (b) Dubai. Source: KAPSARC analysis.
Life
cyc
le c
ost
Peak demand savings
Optimization runs Optimum
10% 20% 30% 40% 50% 60% 70% 80%$100,000
$125,000
$150,000
$175,000
$200,000
$225,000
$250,000 UAE - Dubai

23Economic and Environmental Benefits of Improving UAE Building Stock Energy Efficiency
Using the results of the optimization analysis illustrated in Figures 12 and 13, more stringent building energy efficiency code requirements can be developed for all new UAE residential, governmental and commercial buildings. Based on these results, at least an additional 40 percent in energy savings from current building energy efficiency requirements can be achieved cost-effectively. The impact of this stringent code on the new building stock can be
estimated using the analysis carried out by Krarti (2015) (see Table 8). Based on available data for 2013, carbon emissions from electricity generation are estimated at 0.605 kCO2/kWh for the UAE (IEA 2015). The costs of building new power plants are estimated at $1,200/kW (Krarti 2015). The economic benefits are estimated using the cost of 0.10/kWh for generating and distributing electricity rather than the subsidized rate.
Table 8. Economic and environmental benefits after insulation improvements.
Source: KAPSARC analysis.
Note: Results based on better insulated buildings in the UAE using 2013 building stock statistics.
Building Type Annual Energy Use Savings (GWh/yr)
Peak Demand Savings (MW)
Annual CO2 Emissions Savings (Million metric tons/yr)
Annual Energy Cost Savings ($Million/yr)
Peak Demand Savings ($Million)
Residential Buildings 799 149 0.483 80 179
Commercial Buildings 908 169 0.549 91 203
Governmental Buildings
558 104 0.338 56 125
Total 2,265 423 1.371 227 507
Analytical Approach

24Economic and Environmental Benefits of Improving UAE Building Stock Energy Efficiency
Economic and Environmental Impacts
Three levels of energy efficiency building retrofits are suggested for UAE with different economic and environmental benefits
(ASHRAE 2011; Hong et al. 2015; Krarti 2015):
Level-1 of energy efficiency retrofit: involving low-cost energy efficiency measures such as installation of programmable thermostats, use of LED lighting fixtures and weatherization of building shells to reduce air infiltration. The estimated average savings from a Level-1 retrofit program are 8 percent for all building types, based on documented studies and case studies reported for residential, commercial and governmental buildings.
Level-2 of energy efficiency retrofit: in order to improve the building envelope components as well as use of energy efficient cooling systems and appliances. Based on the analysis shown in Figure 11 as well as existing literature, average savings of 23 percent can be achieved for Level-2 retrofits for a typical residential villa.
Level-3 of energy efficiency retrofit: requiring the implementation of capital-intensive measures including cooling system replacement and installation of daylighting control systems. While deep retrofits are typically costly, they can provide significant energy use savings, which can exceed 50 percent, as noted in the study by Krarti and Ihm (2014).
Tables C2 through C4 (see Appendix C) summarize the annual CO2 emissions savings associated with the use of less fuel for power generation, annual energy cost savings associated with the use of less fuel for power generation and peak demand savings associated with the avoidance of new power plant construction using Level-1, Level-2 and Level-3 building energy efficiency retrofit programs. As shown in Tables C2 to C4, significant economic and environmental benefits can be achieved through the three levels of retrofits. Greater benefits can be obtained from Level-2 and Level-3 programs compared with Level-1. However, these programs require greater investment, which is discussed in the following section. The benefits are significantly higher for residential buildings than for commercial or government buildings at any retrofit level. In fact, 50 percent of total benefit can result from retrofitting only the UAE’s residential building stock.
The implementation and cost-effectiveness of national energy efficiency retrofit programs for different types of UAE buildings are discussed in the following section.

25Economic and Environmental Benefits of Improving UAE Building Stock Energy Efficiency
Program Implementation Considerations
First, the costs involved in fully implementing a building energy efficiency retrofit program are evaluated. These are, specifically, the capital
costs required to retrofit existing UAE buildings to meet energy savings potentials at various levels. Then, the cost-effectiveness of each energy efficiency program is determined for various building types and levels of energy efficiency retrofit. The job creation potential associated with each energy efficiency retrofit program is also discussed in this section.
Cost-effectiveness analysisA cost-effectiveness analysis was carried out of the investment needed to implement each of the three levels of the building energy efficiency retrofit program. It should be noted that this investment can be provided by the UAE government, at least in the first phase of implementation. The cost of the implementation for each level of building energy retrofit depends on several factors, including the building size and the physical condition of the building energy systems. As discussed earlier, Dubai has already set up a super ESCO (Etihad
Energy Services) to finance and jump-start retrofit projects of existing buildings using the performance contracting concept.
Based on various factors including cost of labor and materials in the UAE, the average costs of completing energy retrofit for buildings are estimated (Krarti 2011; Krarti and Ihm 2014; and Alaidroos and Krarti 2015). Table 9 summarizes the costs of implementation for the three levels of energy retrofit specific to residential, commercial and government buildings, including costs for carrying out energy audits as well as installing suitable energy efficiency measures. It should be noted that the costs provided in Table 9 are representative of average retrofit projects and that the actual costs may vary widely depending on the type of measures implemented and the size of the building, especially for commercial and government buildings.
The total costs of implementation for each level of the building energy efficiency retrofit program to upgrade the existing building stock in the UAE are provided in Table D1 (for Level-1), Table D2 (Level-2) and Table D3 (for Level-3) (see Appendix D).
Table 9. Average costs in USD for energy retrofits of buildings in the UAE.
Source: KAPSARC analysis.
Building Type Level-1 Level-2 Level-3
Residential Buildings 500 5,000 10,000
Commercial Buildings 20,000 100,000 200,000
Governmental Buildings 60,000 300,000 600,000

26Economic and Environmental Benefits of Improving UAE Building Stock Energy Efficiency
Table 10. Number of job-years that can be generated from a building energy retrofit programs.
Source: KAPSARC analysis.
Building Type Level-1 Level-2 Level-3
Residential Buildings 3,165 9,115 19,814
Commercial Buildings 3,606 10,353 22,515
Governmental Buildings 2,213 6,367 13,840
Total 8,985 25,835 56,168
Data from 2013 for the existing building stock was used to estimate the total implementation costs for various retrofit levels. To retrofit the entire building stock, investments of $2,014 billion, $10,696 billion and $21,392 billion are required for Level-1, Level-2 and Level-3 energy efficiency retrofit programs, respectively. While these amounts seem significant, the program can yield large energy consumption and peak demand savings, as noted in Table D4 (Appendix D), for the entire building stock.
The payback periods for the retrofit programs including all existing buildings are very attractive, at 0.4 years for Level-1, 2.7 years for Level-2 and 2.4 years for Level-3. When only residential buildings are targeted, the retrofit program can be extremely cost-effective, especially for Level-1 retrofit. Indeed, any level of retrofit does not effectively require any investment when implemented for residential buildings, especially private villas, since it yields sufficient savings from the reduction in peak electricity demand, which avoids the cost of building additional power plants.
Estimation of job creation and market potential of EE industryThe other economic impact of a building energy efficiency retrofit program is the potential to create
new jobs in the UAE. As outlined by Krarti (2015), the direct effects of retrofitting buildings include generating jobs necessary to implement the energy efficiency measures, while the indirect effects are associated with employment needed to produce and supply energy efficiency equipment and materials. Most of the jobs created in building retrofits are in construction and manufacturing, with a wide range of pay grades and technical specialization including electricians, HVAC technicians, insulation installers, energy auditors, building inspectors and construction managers.
Using the job creation model considered in the analysis of Krarti (2015), as many as 56,000 new job-years can be generated when the existing UAE building stock is retrofitted using Level-3 audit, as illustrated in Table 10. It should be noted that retrofitting commercial buildings can generate slightly more employment than the retrofit of residential buildings, regardless of the retrofit level. Also most of the jobs including energy auditors, HVAC technicians and electricians can be carried out by Emiratis instead of expatriates, if targeted national building capacity initiative is implemented as part of the retrofit program. However, further research is needed to assess the specific number of jobs that can be undertaken by Emiratis.
Program Implementation Considerations
27Economic and Environmental Benefits of Improving UAE Building Stock Energy Efficiency
Summary and Conclusions
The UAE has enormous potential to reduce its energy consumption in the building sector. This paper’s analysis shows that improving
the energy efficiency of the building stock in the country can provide cost-effective reductions in electricity consumption, peak power demand and carbon emissions while creating a sizable number of employment opportunities.
To assess the impact of current and more stringent energy efficiency options for the building sector in the UAE, we used the detailed whole building energy building simulation tool, Energy Plus. The analysis also includes a sequential search optimization technique for assessing the best combinations of energy efficiency measures at a minimal life cycle cost. In our simulation, a series of energy efficiency options for both existing and new buildings are evaluated.
We found that any level of energy retrofit of existing buildings is highly cost-effective, even if the UAE government has to subsidize all the implementation costs of the program for the entire existing stock. In fact, a deep retrofit of the entire building stock (i.e., based on Level 3 audit) requires a payback period of just 2.3 years, while yielding significant benefits:
saving 47,200 GWh/year in electricity consumption, 8,802 MW in peak electricity demand and reducing carbon emissions by 28 million tons/year. It will also lead to the creation of as much as 56,000 job-years. When a Level 1 energy retrofit program is applied to the existing residential building stock, savings of 7,550 GWh/year in electricity consumption, 1,400 MW in peak electricity demand and 4.5million tons/year in carbon emissions are achieved with an average payback period of less than six months.
Such savings are becoming clear across the UAE and some of the emirates have already come up with initiatives and programs to improve building energy efficiency. Dubai has created a super ESCO (Etihad Energy Services) to finance and jump-start retrofit projects of existing buildings using the performance contracting concept, a means of financing energy efficiency investments that is based on future savings. In March 2017, the Abu Dhabi Water and Electricity Authority and the UAE Ministry of Economy launched an ESCO in Abu Dhabi. That initiative will help building owners to obtain competitive bids from ESCOs to adopt energy improvements to fulfill the objective of improving energy efficiency in the Emirate.

28Economic and Environmental Benefits of Improving UAE Building Stock Energy Efficiency
References
Abu Dhabi Statistics Center. Accessed Feb. 3, 2016. https://www.scad.ae/en/pages/default.aspx.
Abu Dhabi Water and Electricity Company. Abu Dhabi Water and Electricity Company - ADWEC. Accessed Feb. 3, 2017. http://www.adwec.ae/.
Abu-Hijleh, Bassam, Abeer Manneh, Athari AlNaqbi, Wafaa AlAwadhi and Ayoub Kazim. "Refurbishment of public housing villas in the United Arab Emirates (UAE): energy and economic impact." Energy Efficiency 10, No. 2 (2016), 249-264. doi:10.1007/s12053-016-9451-x.
AECOM. Middle East Construction Handbook. AECOM, 2013.
Alaidroos, Alaa and Moncef Krarti. "Optimal design of residential building envelope systems in the Kingdom of Saudi Arabia." Energy and Buildings 86 (2015), 104-117. doi:10.1016/j.enbuild.2014.09.083.
Asif, M. "Growth and sustainability trends in the buildings sector in the GCC region with particular reference to the KSA and UAE." Renewable and Sustainable Energy Reviews 55 (2016), 1267-1273. doi:10.1016/j.rser.2015.05.042.
DEWA. "Dubai Electricity & Water Authority | Tariff." Dubai Electricity & Water Authority | For Generations to Come. Accessed May 7, 2017. https://www.dewa.gov.ae/en/customer/services/consumption-services/tariff.
Dubai Statistics Center. Statistical Year Book - Emirate of Dubai. Dubai: Dubai Statistics Center, 2016.
"Dubai to Have Sustainable Residential City for Emiratis - Khaleej Times." Khaleej Times - Dubai News. Accessed March 4, 2014. http://www.khaleejtimes.com/article/20140304/ARTICLE/303049893/1002.
"Dubai's Sustainable City Will Be Powered by 600,000 Square Feet of Solar Cells | Inhabitat - Green Design, Innovation, Architecture, Green Building." Inhabitat |
Design For a Better World!. Accessed June 16, 2013. http://inhabitat.com/dubais-sustainable-city-will-be-powered-by-600000-square-feet-of-solar-cells/.
Dyllick-Brenzinger, Ralf M., and Matthias Finger. "Review of electricity sector reform in five large, oil- and gas-exporting MENA countries: Current status and outlook." Energy Strategy Reviews 2, No. 1 (2013), 31-45. doi:10.1016/j.esr.2013.03.004.
Emirates Authority of Standardization and Metrology. Energy Efficiency labels for electrical appliances. UAE.S 5010-3:2013, Part 1 - 3, Domestic Air Conditioners, Washing Machines and Dryers Household Refrigerating Appliances. UAE: ESMA, 2013. https://etrans.esma.gov.ae/English/purchase-standards/pages/standard-details.aspx.
Estidama. "The Pearl Rating System of Estidama." Estidama. Accessed Jan. 20, 2016. http://estidama.upc.gov.ae/estidama-and-pearl-rating-system/pearl-rating-system.aspx.
Etihad Energy Services. "DEWA Buildings Retrofit." Etihad Energy Services. Accessed Dec. 17, 2015. http://www.etihadesco.ae/wpcontent/uploads/2015/07/EtihadEsco_ProjectSheet_Dewa_Bldg_Retrofit1.compressed.pdf.
Etihad Energy Services. "DEWA Buildings Retrofit." Etihad Energy Services. n.d. http://www.etihadesco.ae/wpcontent/uploads/2015/07/EtihadEsco_ProjectSheet_Dewa_Bldg_Retrofit1.compressed.pdf.
Federal Electricity Water Authority. "FEWA". Accessed April 2, 2016. http://www.fewa.gov.ae/en/AboutFEWA/Pages/AboutUs.aspx.
Friess, Wilhelm A., Kambiz Rakhshan, Tamer A. Hendawi, and Sahand Tajerzadeh. "Wall insulation measures for residential villas in Dubai: A case study in energy efficiency." Energy and Buildings 44 (2012), 26-32. doi:10.1016/j.enbuild.2011.10.005.
International Energy Agency. International Energy Agency. Accessed March 2, 2016. http://wds.iea.org.
29Economic and Environmental Benefits of Improving UAE Building Stock Energy Efficiency
International Monetary Fund. IMF Country Report No. 15/220. Washington, D.C.: International Monetary Fund, 2015. https://www.imf.org/external/pubs/ft/scr/2015/cr15220.pdf.
IMF. 2015. "www.imf.org." International Monetary Fund. July 17. Accessed May 7, 2017. https://www.imf.org/external/pubs/ft/survey/so/2015/NEW070215A.htm.
Krarti, Moncef. "Evaluation of large scale building energy efficiency retrofit program in Kuwait." Renewable and Sustainable Energy Reviews 50 (2015), 1069-1080. doi:10.1016/j.rser.2015.05.063.
Ministry of Energy, UAE. Statistical Annual Report Electricity and Water 2011-13. UAE: UAE: Ministry of Energy, 2014.
"New Tariff System for Power, Water in Sharjah." Emirates 24|7. Accessed Nov. 11, 2014.
http://www.emirates247.com/news/emirates/new-tariff-system-for-power-water-in-sharjah-2014-11-12-1.569744.
ReCREMA. The UAE Solar Atlas, Research Center for Renewable Energy Mapping and Assessment. Dubai: ReCREMA, 2013. https://recrema.masdar.ac.ae.
RTI International. Assessment of Technical, economic and achievable potential - Final Report. Abu Dhabi: RTI International, 2012. https://www.rti.org/impact/demand-side-management-abu-dhabi.
Sharjah Electricity Water Authority. "SEWA." Sharjah Electricity Water Authority. Accessed Feb. 4, 2014. https://www.sewa.gov.ae/en/.
References

30Economic and Environmental Benefits of Improving UAE Building Stock Energy Efficiency
Appendix A
Source: ESMA, 2013.
Table A1. Minimum energy efficiency requirements for commercial and central air conditioners systems in the UAE.
System Type Cooling Capacity, CC (Btuh or KW)
Minimum Energy Efficiency (EER)
Notes
Multiple Split Systems CC< 90,000 Btuh 90,000<CC<135,000 Btuh CC>135000 Btu
EER < 8.30 EER < 7.80 EER < 7.50
Rating for EER at outdoor temperature of 46oC
Split and Packaged Units CC< 135,000 Btuh 135,000<CC<240,000 Btuh 240,000<CC<760,000 Btuh CC>760,000 Btu
EER < 8.10 EER < 7.90 EER < 7.50 EER < 7.20
Rating for EER at outdoor temperature of 46oC
Water Source Heat Pumps All EER < 7.90 Water temperature at 30oC
Ground Source Heat Pumps All EER < 8.70 Fluid temperature at 25oC
Water Cooled Chillers CC < 528 kW 528 < CC < 1055 kW CC > 1055 kW
EER < 13.50 EER < 15.00 EER < 17.00
Rating at full load with condenser temperature of 35oC
Air Cooled Chillers CC < 620 kW CC > 620 kW
EER < 8.50 EER < 9.50
Rating at full load with condenser temperature of 35oC

31Economic and Environmental Benefits of Improving UAE Building Stock Energy Efficiency
Source: Abu Dhabi Statistics Center, 2016.
Source: Dubai Statistics Center, 2016.
Table B1. Type and number of buildings in Dubai 2013 and 2014.
Table B2. Statistics of completed buildings in Abu Dhabi 2013 through 2015.
Appendix B
Category 2013 2014 Percentage Increase
Private Villas 45,635 46,371 1.59
Investment Villas 32,094 32,737 1.96
Arabic Houses 8,416 8,434 0.21
Establishment Buildings 6,879 7,106 3.19
Industrial Buildings 836 850 1.65
One-story Buildings 1,910 1,920 0.52
Multistory Buildings 11,094 11,426 2.91
Floor Area Ratio Buildings 297 301 1.33
Others (sheds, warehouses) 5,321 5,443 2.24
Total 112,482 114,588 1.84
Building Type 2013 2014 2015
Residential Buildings 3,650 1,713 1,984
Residential/Commercial Buildings 43 46 33
Commercial Buildings 126 65 52
Public Facilities 82 65 65
Industrial Facilities 150 165 225
Total 4,051 2,054 2,359

32Economic and Environmental Benefits of Improving UAE Building Stock Energy Efficiency
Number of floor 2
Total height 7.0 m
Floor dimensions 15.0 m × 17.5 m
Gross floor area 525
Gross wall area 455
Window area 13.29 percent of gross wall area
Type of glass Single pane window
External walls 20 mm plaster outside + 200 mm concrete hollow block + 20 mm plaster inside
Roof 10 mm built-up roofing + 150 mm concrete roof slab + 12.7 mm plaster inside
Floor 150 mm slab on grade
Number of occupants 6
Lighting 3.0 kW (lower level), 2.0 kW (upper level)
Appliances 2.0 kW (lower level), 1.0 kW (upper level)
HVAC system type Constant volume DX air-cooled A/C system with electric heating
Temperature settings 22.2oC (72oF) for heating and 24.4oC (76oF) for cooling
COP 2.17
Appendix C
Source: KAPSARC analysis.
Table C1. Building construction specifications for the typical villa.
Source: KAPSARC analysis.
Table C2. Economic and environmental benefits for Level-1 building energy efficiency retrofit program for UAE, based on 2013 building stock.
Building Type Annual Energy Use Savings (GWh/yr)
Peak Demand Savings (MW)
Annual CO2 Emissions Savings (Million metric tons/yr)
Annual Energy Cost Savings ($Million/yr)
Peak Demand Savings ($Million)
Residential Buildings 2,663 497 1.611 266 596
Commercial Buildings 3,027 565 1.831 303 677
Government Buildings 1,861 347 1.126 186 416
Total 7,551 1,408 4.568 755 1,690

33Economic and Environmental Benefits of Improving UAE Building Stock Energy Efficiency
Appendix C
Source: KAPSARC analysis.
Source: KAPSARC analysis.
Table C3. Economic and environmental benefits for Level-2 building energy efficiency retrofit program for UAE, based on 2013 building stock.
Table C4. Economic and environmental benefits for Level-3 building energy efficiency retrofit program for UAE, based on 2013 building stock.
Building Type Annual Energy Use Savings (GWh/yr)
Peak Demand Savings (MW)
Annual CO2 Emissions Savings (Million metric tons/yr)
Annual Energy Cost Savings ($Million/yr)
Peak Demand Savings ($Million)
Residential Buildings 7,657 1,428 4.633 766 1,714
Commercial Buildings 8,702 1,623 5.265 870 1,948
Government Buildings 5,350 998 3.237 535 1,197
Total 21,710 4,049 13.134 2,171 4,859
Building Type Annual Energy Use Savings (GWh/yr)
Peak Demand Savings (MW)
Annual CO2 Emissions Savings (Million metric tons/yr)
Annual Energy Cost Savings ($Million/yr)
Peak Demand Savings ($Million)
Residential Buildings 16,646 3,105 10.071 1,665 3,726
Commercial Buildings 18,918 3,528 11.445 1,892 4,234
Government Buildings 11,631 2,169 7.037 1,163 2,603
Total 47,195 8,802 28.553 4,720 10,563

34Economic and Environmental Benefits of Improving UAE Building Stock Energy Efficiency
Appendix D
Building Type Number of Units Per Unit Retrofit Cost ($/Unit)
Total Retrofit Cost ($Million)
Residential Buildings 251,060 500 126
Commercial Buildings 36,847 20,000 737
Government Buildings 19,186 60,000 126
Total 307,093 2,014
Building Type Number of Units Per Unit Retrofit Cost ($/Unit)
Total Retrofit Cost ($Million)
Residential Buildings 251,060 5,000 1,255
Commercial Buildings 36,847 100,000 3,685
Government Buildings 19,186 300,000 5,756
Total 307,093 10,696
Source: KAPSARC analysis.
Source: KAPSARC analysis.
Table D1. Total implementation costs for Level-1 building energy efficiency retrofit program for UAE.
Table D2. Total implementation costs for Level-2 building energy efficiency retrofit program for UAE.

35Economic and Environmental Benefits of Improving UAE Building Stock Energy Efficiency
Appendix D
Building Type Number of Units Per Unit Retrofit Cost ($/Unit)
Total Retrofit Cost ($Million)
Residential Buildings 251,060 10,000 2,511
Commercial Buildings 36,847 200,000 7,369
Government Buildings 19,186 600,000 11,512
Total 307,093 21,392
Retrofit Level Total Retrofit Cost ($Million)
Peak Demand Savings ($Million)
Annual Energy Cost Savings ($Million/yr)
Simple Payback Analysis (Yrs)
Level-1 2,014 1,690 755 0.4
Level-2 10,696 4,859 2,171 2.7
Level-3 21,392 10,563 4,720 2.3
Source: KAPSARC analysis.
Source: KAPSARC analysis.
Table D3. Total implementation costs for Level-3 building energy efficiency retrofit program for UAE.
Table D4. Cost-effectiveness analysis of the energy retrofit programs in UAE for all building stocks.

36Economic and Environmental Benefits of Improving UAE Building Stock Energy Efficiency
Kankana Dubey
Kankana is a senior research associate at KAPSARC working on the Energy Productivity in the GCC Project. Her work focuses on economic growth, energy productivity, energy efficiency and developing energy policy toolkits for government action, particularly in the building sector. Kankana has an M.Sc. in Energy Management from the University of Stirling, U.K.
Moncef Krarti
Moncef is a visiting research fellow at KAPSARC with over 30 years of experience in designing, testing, and assessing innovative energy efficiency and renewable energy technologies applied to buildings. He is a professor and coordinator of the Building Systems Program, Civil, Environment and Architectural Department at the University of Colorado.
About the Authors
About the ProjectIncreasing energy productivity holds some of the greatest possibilities for enhancing the welfare countries get out of their energy systems. It also recasts energy efficiency in terms of boosting competitiveness and wealth, more powerfully conveying its profound benefits to society. KAPSARC and UNESCWA have initiated this project to explore the energy productivity potential of the Arab region, starting with the six GCC countries and later extending to other countries. Aimed at policymakers, this project highlights the social gains from energy productivity investments, where countries are currently at, and pathways to achieving improved performance in this area.

37Economic and Environmental Benefits of Improving UAE Building Stock Energy Efficiency
Notes

38Economic and Environmental Benefits of Improving UAE Building Stock Energy Efficiency
www.kapsarc.org