economic analysis to support marine spatial planning in
TRANSCRIPT

Economic Analysis to Support Marine Spatial Planning in Washington
Prepared for:
WASHINGTON COASTAL MARINE ADVISORY COUNCIL
Prepared by:
In association with:
TCW ECONOMICS NORTHERN ECONOMICS, INC.
June 30, 2015

COVER IMAGES (from left to right)
(cc) John Murphy, 2011. Washington Coast. Retrieved May 6, 2015, from: www.flickr.com/photos/kingair42/5652646278
(cc) pfly 2005 [screen name]. Olympic Coast. Retrieved May 6, 2015, from: www.flickr.com/ photos/pfly/35674252
(cc) Dimi Talen, 2011. Day 82: Rialto Beach, Olympic National Park, Washington, looking to the north. Retrieved May 6, 2015, from: commons.wikimedia.org/wiki/File:Rialto_Beach.jpg

Economic Analysis to Support
Marine Spatial Planning in Washington
Prepared for:
WASHINGTON COASTAL MARINE ADVISORY COUNCIL
Funded by:
WASHINGTON COASTAL MARINE ADVISORY COUNCIL
Prepared by:
Michael L. Taylor, Ph.D., Cascade Economics LLC (team lead)
Janet R. Baker, M.F., Cascade Economics LLC
Edward C. Waters, Ph.D., Cascade Economics LLC
Thomas C. Wegge, M.S., TCW Economics
Katharine (Trina) Wellman, Ph.D., Northern Economics, Inc.
With assistance from Gold Leaf Creative Solutions
June 30, 2015


Acknowledgements
This economic analysis project could only have been accomplished with the involvement and selfless assistance provided by dedicated stakeholders, coastal residents, industry participants, state agency and tribal staff, academic reviewers, and WCMAC members. The knowledge that was shared, the great interest demonstrated in the analysis—and indeed, the entire MSP process—is a tribute to their dedication to a protected and viable Washington coast.
We would especially like to acknowledge the following persons (in alphabetical order):
Dale Beasley Columbia River Crab Fishermen’s Association
David Beugli Willapa Grays Harbor Oyster Growers Association
Sara Breslow NOAA Northwest Fisheries Science Center
Mark Cedergreen Westport Charterboat Association
Cheryl Chen Director of Client Services, Point 97
Dan Crowther Project Manager, Point 97
Shannon Davis The Research Group
Kevin Decker University of Washington Sea Grant
Casey Dennehy Washington Coast Program Manager, Surfrider Foundation
Gus Gates Washington Policy Manager, Surfrider Foundation
Jennifer Hagen Biologist, Quileute Tribe
Katie Krueger Staff Attorney and Policy Analyst, Quileute Tribe
Jerry Leonard NOAA Northwest Fisheries Science Center
Mel Moon Natural Resources Director, Quileute Tribe
Corey Niles Washington Department of Fish and Wildlife
Melissa Poe University of Washington Sea Grant
Hans Radtke Natural Resource Economist
Mike Rainey Business Enterprise Manager, Makah Tribe
Michael Rogers Tribal Administrator, Shoalwater Bay Indian Tribe
Brian Sheldon Northern Oyster Company
Also: Anonymous respondents to our social impacts survey
Anonymous respondents to the shellfish aquaculture processing and distribution survey
Fishing vessel owners, charter boat operators, and seafood processors who participated in key informant interviews and focus group meetings
Washington Coastal Marine Advisory Council | i

We greatly appreciate the guidance, technical assistance, and dedication of Jennifer Hennessey and Kelsey Gianou of the Washington Department of Ecology, and Katrina Lassiter and Libby Whiting of the Washington Department of Natural Resources.
Lastly, we wish to thank the Washington Coastal Marine Advisory Council for its generous support in funding this project.
Washington Coastal Marine Advisory Council | ii
Table of Contents
CHAPTER 1. Introduction ................................................................................. 1-1 1.1 Marine Spatial Planning and Economic Analysis .............................................. 1-1 1.2 Purpose ............................................................................................. 1-3 1.3 Design of the Economic Analysis: Scoping Process ........................................... 1-3 1.4 Methodology for Topic Area Investigations .................................................... 1-5
1.4.1 Economic Profile of the Washington Coast .......................................... 1-5 1.4.2 Economic Profile of Tribal Communities ............................................. 1-6 1.4.3 Commercial Fisheries ................................................................... 1-6 1.4.4 Shellfish Aquaculture .................................................................... 1-9 1.4.5 Recreational Fishing ..................................................................... 1-9 1.4.6 Recreation and Tourism .............................................................. 1-11 1.4.7 Ecosystem Services .................................................................... 1-12 1.4.8 Social Impact Assessment ............................................................ 1-12 1.4.9 Risk and Vulnerability Assessment .................................................. 1-13 1.4.10 Qualitative Assessment of New Uses ................................................ 1-13
1.5 Economic Impact Modeling Approaches and Measures ..................................... 1-14 1.5.1 IMPLAN Models ......................................................................... 1-14 1.5.2 Estimating Industry Economic Contributions and Economic Impacts .......... 1-16 1.5.3 Regional Input-Output Analysis ...................................................... 1-16
CHAPTER 2. Economic Profile of the Washington Coast ............................................ 2-1 2.1 Clallam County ..................................................................................... 2-2
2.1.1 Population ................................................................................ 2-2 2.1.2 Employment and Income ............................................................... 2-2 2.1.3 Economic Development Goals and Plans ............................................. 2-3
2.2 Jefferson County .................................................................................. 2-5 2.2.1 Population ................................................................................ 2-6 2.2.2 Employment and Income ............................................................... 2-6 2.2.3 Economic Development Goals and Plans ............................................. 2-7
Washington Coastal Marine Advisory Council | iii

Economic Analysis to Support Marine Spatial Planning in Washington
2.3 Grays Harbor County .............................................................................. 2-8 2.3.1 Population ................................................................................ 2-8 2.3.2 Employment and Income ............................................................... 2-9 2.3.3 Economic Development Goals and Plans ........................................... 2-10
2.4 Pacific County .................................................................................... 2-11 2.4.1 Population .............................................................................. 2-11 2.4.2 Employment and Income ............................................................. 2-11 2.4.3 Economic Development Goals and Plans ........................................... 2-13
2.5 Wahkiakum County .............................................................................. 2-13 2.5.1 Population .............................................................................. 2-13 2.5.2 Employment and Income ............................................................. 2-13 2.5.3 Economic Development Goals and Plans ........................................... 2-14
2.6 Economic Impacts Associated with Shipping from Grays Harbor ......................... 2-15 2.6.1 Marine Cargo Impacts from the Port of Grays Harbor ............................ 2-16 2.6.2 Projections for Future Cargo ......................................................... 2-19
2.7 Economic Impacts Associated with the Port of Port Angeles ............................. 2-21 2.7.1 Impacts from Airports ................................................................. 2-21 2.7.2 Impacts from Marinas ................................................................. 2-22 2.7.3 Impacts from Marine Terminals ...................................................... 2-23 2.7.4 Impacts from Log Yard ................................................................ 2-24
CHAPTER 3. Economic Profiles of Washington Coast Tribes ....................................... 3-1 3.1 Makah ............................................................................................... 3-4
3.1.1 Population and Housing ................................................................. 3-4 3.1.2 Employment and Income ............................................................... 3-5 3.1.3 Current Reservation Businesses ........................................................ 3-6 3.1.4 Plans for the Future ................................................................... 3-11
3.2 Quileute ........................................................................................... 3-12 3.2.1 Population and Housing ............................................................... 3-12 3.2.2 Employment and Income ............................................................. 3-13 3.2.3 Current Reservation Businesses ...................................................... 3-14 3.2.4 Plans for the Future ................................................................... 3-19
3.3 Hoh ................................................................................................ 3-21 3.3.1 Population and Housing ............................................................... 3-22 3.3.2 Employment and Income ............................................................. 3-22 3.3.3 Natural Resources...................................................................... 3-23 3.3.4 Plans for the Future ................................................................... 3-24
iv | Washington Coastal Marine Advisory Council
Economic Analysis to Support Marine Spatial Planning in Washington
3.4 Quinault ........................................................................................... 3-24 3.4.1 Population and Housing ............................................................... 3-25 3.4.2 Employment and Income ............................................................. 3-25 3.4.3 Current Reservation Businesses ...................................................... 3-26 3.4.4 Plans for the Future ................................................................... 3-28
3.5 Shoalwater Bay .................................................................................. 3-31 3.5.1 Population and Housing ............................................................... 3-31 3.5.2 Employment and Income ............................................................. 3-32 3.5.3 Current Reservation Businesses ...................................................... 3-32 3.5.4 Plans for the Future ................................................................... 3-33
CHAPTER 4. Washington Coast Commercial Fisheries .............................................. 4-1 4.1 Non-tribal Commercial Fisheries Sectors ...................................................... 4-1
4.1.1 At-sea Pacific Whiting Fisheries ..................................................... 4-10 4.1.2 Shore-based Fisheries ................................................................. 4-12
4.2 Non-tribal Commercial Fisheries Participation by County and Port ..................... 4-27 4.2.1 Clallam County Ports .................................................................. 4-30 4.2.2 Jefferson County (West) Ports ....................................................... 4-31 4.2.3 Grays Harbor County Ports ........................................................... 4-31 4.2.4 Pacific County Ports ................................................................... 4-32 4.2.5 Wahkiakum County Ports ............................................................. 4-33
4.3 Tribal Fisheries .................................................................................. 4-34 4.3.1 Introduction ............................................................................ 4-34 4.3.2 Tribal Fisheries Management ........................................................ 4-34 4.3.3 Commercial Fisheries Profile of the Treaty Tribes ............................... 4-35
4.4 Economic Contributions of Commercial Fishing ............................................ 4-44 4.4.1 Introduction ............................................................................ 4-44 4.4.2 Contributions from Commercial Fisheries Harvesting and Primary
Processing ............................................................................... 4-45 4.4.3 Contributions from Distant Water Fisheries ....................................... 4-48 4.4.4 Other Economic Contributions from Commercial Fisheries ..................... 4-52
4.5 Trends and Outlook for the Washington Coast Commercial Fishing Industry .......... 4-53 4.5.1 Introduction ............................................................................ 4-53 4.5.2 Ocean Conditions ...................................................................... 4-53 4.5.3 Fishery Management................................................................... 4-54 4.5.4 Seafood Markets ........................................................................ 4-55 4.5.5 Vessel Safety ........................................................................... 4-55
Washington Coastal Marine Advisory Council | v

Economic Analysis to Support Marine Spatial Planning in Washington
CHAPTER 5. Shellfish Aquaculture ...................................................................... 5-1 5.1 Overview of Aquaculture in Willapa Bay and Grays Harbor ................................. 5-1 5.2 Previous Economic Assessments ................................................................. 5-9
5.2.1 Literature ................................................................................. 5-9 5.2.2 Northern Economics 2013 Report ...................................................... 5-9
5.3 Shellfish Aquaculture Processing and Distribution: Pacific and Grays Harbor Counties ................................................................................. 5-13 5.3.1 Pacific and Grays Harbor Focus Group ............................................. 5-13 5.3.2 Survey ................................................................................... 5-14 5.3.3 Interview Findings ..................................................................... 5-14 5.3.4 Survey Results .......................................................................... 5-16
5.4 Economic Contributions of Shellfish Aquaculture .......................................... 5-20 5.5 Other Contributions from the Aquaculture Industry ....................................... 5-22
CHAPTER 6. Recreational Fishing ....................................................................... 6-1 6.1 Recreational Fisheries along the Washington Coast ......................................... 6-1
6.1.1 Angler Characteristics ................................................................... 6-1 6.1.2 Fishing Levels of Effort (by Port Area and Species) .............................. 6-11 6.1.3 Sport Catch ............................................................................. 6-13
6.2 Fishing Regulations and Management ........................................................ 6-15 6.2.1 Halibut Recreational Fisheries ....................................................... 6-15 6.2.2 Bottomfish Recreational Fisheries .................................................. 6-16 6.2.3 Salmon Recreational Fisheries ....................................................... 6-17
6.3 Economic Contributions of Recreational Fishing ........................................... 6-18 6.3.1 Trip-related Expenditures Associated with Marine Angler Activities
in the Washington Coastal Study Area .............................................. 6-18 6.3.2 Employment and Labor Income Effects of Angler Expenditures in
the Washington Coastal Study Area ................................................. 6-22 6.4 Recreation Fishing Trends ...................................................................... 6-22
CHAPTER 7. Recreation and Tourism .................................................................. 7-1 7.1 Northern Washington Coast (Clallam and Jefferson Counties) ............................. 7-2
7.1.1 Neah Bay Area ............................................................................ 7-4 7.1.2 La Push Area .............................................................................. 7-5 7.1.3 Kalaloch Area (including Ruby Beach and Queets) ................................. 7-8
7.2 Southern Washington Coast (Grays Harbor Area, including the Coastal Portion of Grays Harbor County) ................................................................ 7-9 7.2.1 Taholah Area ........................................................................... 7-11 7.2.2 Moclips/Pacific Beach Area .......................................................... 7-12 7.2.3 Seabrook Area .......................................................................... 7-13
vi | Washington Coastal Marine Advisory Council

Economic Analysis to Support Marine Spatial Planning in Washington
7.2.4 Copalis Beach/Ocean City Area ...................................................... 7-13 7.2.5 Ocean Shores Area ..................................................................... 7-14 7.2.6 Grays Harbor Port Area (including Hoquiam, Aberdeen, and
Cosmopolis) ............................................................................. 7-16 7.2.7 Westport Area (including Markham, Ocosta, Bay City, and
Grayland) ................................................................................ 7-17 7.3 Southern Washington Coast (Willapa Bay/Long Beach Peninsula, including
the Coastal Portion of Pacific County) ....................................................... 7-20 7.3.1 North Cove/Tokeland Area ........................................................... 7-21 7.3.2 Raymond/South Bend/Bay Center Area ............................................ 7-22 7.3.3 Ocean Park/Nacotta Area ............................................................ 7-23 7.3.4 Seaview/Long Beach Area ............................................................ 7-24 7.3.5 Ilwaco Area ............................................................................. 7-25 7.3.6 Chinook Area ........................................................................... 7-26
7.4 Outdoor Recreation Visitation along the Washington Coast .............................. 7-26 7.5 Economic Contribution of Coastal Recreation and Tourism to the Coastal
Study Area and Statewide ...................................................................... 7-29 7.5.1 Trip-Related Expenditures Associated with Recreation and
Tourism Activities in the Coastal Study Area ...................................... 7-30 7.5.2 Employment and Labor Income Effects of Recreation and Tourism
Activities in the Coastal Study Area ................................................ 7-33 7.6 Trends Affecting Recreational and Tourism Activities in the Coastal Study
Area ................................................................................................ 7-37 7.6.1 Projected Population Growth in the Four-County Coastal Area and
Washington State ...................................................................... 7-37
CHAPTER 8. Ecosystem Services ........................................................................ 8-1 8.1 Concept of Ecosystem Services .................................................................. 8-2 8.2 Contemporary Consideration of Ecosystem Benefits ......................................... 8-6 8.3 Valuation of Ecosystem Services with Applicability to the Washington
Coast: A Summary of the Literature ............................................................ 8-8 8.3.1 A Community-based Approach for Evaluating Tradeoffs across
Marine Ecosystem Services in Oregon ................................................ 8-8 8.3.2 Deschutes Estuary Feasibility Study: Net Social and Economic
Benefits of Analysis ...................................................................... 8-9 8.3.3 Marine and Coastal Ecosystem Services ............................................ 8-10 8.3.4 Valuation of Ecosystem Services from Shellfish Restoration,
Enhancement and Management: A Review of the Literature ................... 8-10 8.3.5 An Assessment of the Value of Pacific County’s Nearshore
Ecosystems .............................................................................. 8-11 8.3.6 Valuing Nearshore Ecosystems in Grays Harbor County .......................... 8-11
Washington Coastal Marine Advisory Council | vii

Economic Analysis to Support Marine Spatial Planning in Washington
8.3.7 Protecting the Strait of Juan de Fuca Nearshore through Improved Understanding of Shoreline Erosion and Deposition Processes, Ecosystem Services Valuation, and Community Stewardship ................... 8-12
8.4 Data Requirements to Value Ecosystem Services ........................................... 8-12
CHAPTER 9. Social Impacts Assessment ............................................................... 9-1 9.1 Related Efforts ..................................................................................... 9-2
9.1.1 University of Washington Sea Grant: Integrated-based Social Indicators for Washington Marine Spatial Planning ................................. 9-2
9.1.2 Northwest Fisheries Science Center CCIEA: Social Well-being Indicators for Marine Management .................................................... 9-4
9.1.3 Northwest Fisheries Science Center CCIEA: Community Vulnerability Assessments .............................................................. 9-4
9.1.4 University of Washington Report Washington’s Working Coast: An Analysis of the Washington Pacific Coast Marine Resource-based Economy ................................................................................... 9-6
9.2 Social Assessment of New Potential Uses ...................................................... 9-7 9.3 Washington Marine Spatial Planning Social Impacts Survey ................................. 9-8
9.3.1 Participation .............................................................................. 9-9 9.3.2 Marine Product Extraction Impacts ................................................. 9-10 9.3.3 Offshore Aquaculture Impacts ....................................................... 9-12 9.3.4 Dredge Disposal Impacts .............................................................. 9-13 9.3.5 Gas Hydrate Impacts .................................................................. 9-14 9.3.6 Marine Sand and Gravel Mining Impacts ............................................ 9-16 9.3.7 Offshore Wind Energy Impacts ....................................................... 9-17 9.3.8 Wave Energy Impacts .................................................................. 9-18 9.3.9 Tidal Energy Impacts .................................................................. 9-19 9.3.10 Qualitative Impact Assessment ...................................................... 9-20
CHAPTER 10. Risk and Vulnerability of Marine-dependent Sectors ............................ 10-1 10.1 Commercial Fishing ............................................................................. 10-2
10.1.1 Economic and Regulatory Issues ..................................................... 10-2 10.1.2 Environmental Factors ................................................................ 10-6
10.2 Recreational Fishing ............................................................................ 10-6 10.2.1 Regulatory and Economic Issues ..................................................... 10-7 10.2.2 Environmental Issues .................................................................. 10-8
10.3 Shellfish Aquaculture ........................................................................... 10-8 10.3.1 Regulatory Issues....................................................................... 10-8 10.3.2 Economic Issues ....................................................................... 10-12
10.4 Recreation and Tourism ....................................................................... 10-13 10.4.1 Regulatory Conflicts .................................................................. 10-13
viii | Washington Coastal Marine Advisory Council

Economic Analysis to Support Marine Spatial Planning in Washington
10.4.2 Environmental Issues ................................................................. 10-14 10.4.3 Growth-Related Issues ............................................................... 10-14
10.5 Shipping .......................................................................................... 10-15 10.5.1 Uncertainties in Markets ............................................................. 10-15 10.5.2 Competition with Other Ports ...................................................... 10-15
10.6 Coastwide Issues ................................................................................ 10-15 10.6.1 Oil Trains ............................................................................... 10-15 10.6.2 Tsunami Threat ....................................................................... 10-19
CHAPTER 11. Qualitative Analysis of the Impacts of Proposed New Uses .................... 11-1 11.1 Potential New Uses on the Washington Coast ............................................... 11-2
11.1.1 Marine Product Extraction ............................................................ 11-2 11.1.2 Offshore Aquaculture ................................................................. 11-3 11.1.3 Dredge Disposal in New Locations ................................................... 11-4 11.1.4 Mining of Gas Hydrates ................................................................ 11-6 11.1.5 Mining of Marine Sand and Gravel ................................................... 11-6 11.1.6 Marine Renewable Energy ............................................................ 11-6
11.2 Interpretation of the Qualitative Analysis ................................................... 11-7 11.3 Potential Impacts of New Uses on Existing Uses ............................................ 11-8
11.3.1 Commercial Fishing .................................................................... 11-8 11.3.2 Shellfish Aquaculture ................................................................. 11-13 11.3.3 Recreational Fishing .................................................................. 11-17 11.3.4 Recreation and Tourism ............................................................. 11-22 11.3.5 Shipping ................................................................................ 11-27
CHAPTER 12. Additional Research and Study Needs .............................................. 12-1 12.1 Identified Additional Research Needs ........................................................ 12-2
APPENDICES
Appendix A – Comparison of Approaches
Appendix B – Shellfish Aquaculture Processing and Distribution Survey
Appendix C – Social Impacts Survey
Washington Coastal Marine Advisory Council | ix

List of Figures
Chapter 1
Figure 1-1 Washington Marine Spatial Plan Study Area .................................................... 1-2 Figure 1-2 Illustration of Regional Economic Impacts, Leakage, and Multiplier Effects ............ 1-17
Chapter 3
Figure 3-1 Indian Reservations in MSP Study Area .......................................................... 3-3
Chapter 4
Figure 4-1 Fishing Grounds and Main Ports in the Washington Coast MSP Region ..................... 4-2 Figure 4-2 Pacific Whiting (Hake) Fishing Activity in the Washington Coast MSP Region ........... 4-15 Figure 4-3 Total Groundfish Fishing Activity in the Washington Coast MSP Region .................. 4-17 Figure 4-4 Dungeness Crab Fishing Activity in the Washington Coast MSP Region ................... 4-21 Figure 4-5 Pink Shrimp Fishing Activity in the Washington Coast MSP Region ........................ 4-23 Figure 4-6 Pacific Sardine Fishing Activity in the Washington Coast MSP Region .................... 4-25
Chapter 5
Figure 5-1 Facility Location Map .............................................................................. 5-2 Figure 5-2 Grays Harbor Tidelands ............................................................................ 5-3 Figure 5-3 Willapa Bay Tidelands .............................................................................. 5-4 Figure 5-4 Relative Harvest (round pounds) of Farmed Shellfish Products in Pacific and
Grays Harbor Counties, 2013 ...................................................................... 5-6 Figure 5-5 Relative Value (dollars) of Farmed Shellfish Products in Pacific and Grays
Harbor Counties, 2013 ............................................................................. 5-6 Figure 5-6 Total Annual Harvest and Value of Pacific Oysters in Pacific and Grays
Harbor Counties ..................................................................................... 5-7 Figure 5-7 Total Annual Harvest and Value of Manilla Clams in Pacific and Grays
Harbor Counties ..................................................................................... 5-7 Figure 5-8 Washington Surveyed Shellfish Aquaculture Acreage and Employment by
County, 2010 ...................................................................................... 5-11 Figure 5-9 Shellfish Aquaculture Processed Production (pounds) ...................................... 5-16 Figure 5-10 Surveyed Shellfish Aquaculture Sales .......................................................... 5-17 Figure 5-11 Shellfish Aquaculture Expenditures ............................................................ 5-18 Figure 5-12 Regional Expenditure Distribution ............................................................. 5-19 Figure 5-13 Comparison of Expenditure Distribution by Region .......................................... 5-19
Chapter 6
Figure 6-1 Major Recreational Fisheries in Marine Waters along the Washington Coast .............. 6-2
Washington Coastal Marine Advisory Council | x

Economic Analysis to Support Marine Spatial Planning in Washington
Chapter 7
Figure 7-1 Regions and Community Areas along the Washington Coast ................................. 7-3 Figure 7-2 Washington State Counties ...................................................................... 7-30
Chapter 8
Figure 8-1 Linkage of Ecosystem Services and Human Well-being ....................................... 8-5 Figure 8-2 Direct and Indirect “Drivers of Change” and Relationship to Ecosystem
Services and Human Well-being .................................................................. 8-6
Chapter 9
Figure 9-1 Distribution of Participants by Affiliation ..................................................... 9-10 Figure 9-2 Marine Product Extraction Impacts ............................................................ 9-11 Figure 9-3 Offshore Aquaculture Impacts .................................................................. 9-12 Figure 9-4 Dredge Disposal Impacts ......................................................................... 9-14 Figure 9-5 Gas Hydrate Impacts ............................................................................. 9-15 Figure 9-6 Marine Sand and Gravel Mining Impacts ....................................................... 9-16 Figure 9-7 Offshore Wind Energy Impacts .................................................................. 9-17 Figure 9-8 Wave Energy Impacts ............................................................................ 9-18 Figure 9-9 Tidal Energy Impacts ............................................................................. 9-19 Figure 9-10 Qualitative Impact Assessment ................................................................. 9-20
Chapter 10
Figure 10-1 Distribution of Dungeness Crab Effort off the Washington Coast ......................... 10-4 Figure 10-2 Crude Oil by Rail Facilities ..................................................................... 10-18
Chapter 11
Figure 11-1 Dredge Disposal Placement Locations: Columbia River ..................................... 11-4 Figure 11-2 Dredge Disposal Placement Locations: Grays Harbor ....................................... 11-5 Figure 11-3 Shipping Lanes, Including Deep Draft Waterways .......................................... 11-28
Washington Coastal Marine Advisory Council | xi
List of Tables
Chapter 2
Table 2-1 Employment by Industry − Clallam County 2012 ............................................... 2-2 Table 2-2 Employment by Industry − Jefferson County 2012 ............................................ 2-6 Table 2-3 Employment by Industry − Grays Harbor County 2012 ........................................ 2-9 Table 2-4 Employment by Industry − Pacific County 2012 .............................................. 2-12 Table 2-5 Employment by Industry − Wahkiakum County 2012 ........................................ 2-14 Table 2-6 Economic Impacts Generated by the Port of Grays Harbor Marine Cargo
Activities ........................................................................................... 2-17 Table 2-7 Direct Jobs for the Port of Grays Harbor Cargo Activities .................................. 2-18 Table 2-8 Distribution of Revenues by Commodity ...................................................... 2-19 Table 2-9 Economic Impacts Generated by the Port of Port Angeles Airports ...................... 2-22 Table 2-10 Economic Impacts Generated by the Port of Port Angeles Marinas ....................... 2-23 Table 2-11 Economic Impacts Generated by the Port of Port Angeles Marine Terminals ........... 2-24 Table 2-12 Economic Impacts Generated by the Port of Port Angeles Log Yard ..................... 2-24
Chapter 3
Table 3-1 Makah Indian Reservation Age Distribution ..................................................... 3-5 Table 3-2 Employment − Makah Reservation, 2009-2013 ................................................. 3-5 Table 3-3 Charter Boat Angler Days − Neah Bay ........................................................... 3-8 Table 3-4 Quileute Indian Reservation Age Distribution ................................................ 3-12 Table 3-5 Employment − Quileute Reservation, 2009-2013 ............................................ 3-13 Table 3-6 Quileute Tribal Events ........................................................................... 3-14 Table 3-7 Charter Boat Angler Days − La Push ........................................................... 3-17 Table 3-8 Hoh Indian Reservation Age Distribution ...................................................... 3-22 Table 3-9 Employment − Hoh Reservation, 2009-2013 .................................................. 3-22 Table 3-10 Quinault Reservation Age Distribution ........................................................ 3-25 Table 3-11 Employment − Quinault Reservation, 2009-2013 ............................................ 3-25 Table 3-12 Shoalwater Bay Indian Reservation Age Distribution ........................................ 3-31 Table 3-13 Employment – Shoalwater Bay Reservation, 2009-2013 .................................... 3-32
Chapter 4
Table 4-1 PacFIN Landings Ports and Associated Communities in the Washington Coast Region ................................................................................................ 4-3
Table 4-2 Landings, Ex-vessel Revenues, and Participation by County for Washington Coast Non-Tribal Commercial Fisheries in 2014 ............................................... 4-5
Table 4-3 Counts and Total Non-Tribal Ex-vessel Revenue Landed in 2014 in Washington Coast Ports by Vessel Owner’s Address ........................................... 4-7
Washington Coastal Marine Advisory Council | xii

Economic Analysis to Support Marine Spatial Planning in Washington
Table 4-4 Annual Non-Tribal Landings in Washington Coast Ports by Species Management Group, 2004-2014 (thousands of round weight lbs) ........................... 4-8
Table 4-5 Annual Non-Tribal Ex-vessel Revenue Landed in Washington Coast Ports by Species Management Group, 2004-2014 (in thousands of 2014 inflation-adjusted dollars)* ................................................................................... 4-9
Table 4-6 Average Annual Non-Tribal Ex-vessel Revenue per Round Weight Pound Landed in Washington Coast Ports by Species Management Group (in 2014 inflation-adjusted dollars*) ..................................................................... 4-10
Table 4-7 Total Annual Catch and Estimated Catch off the Washington Coast* by Vessels Operating in the Non-tribal, At-sea Pacific Whiting Sector, 2005-2014. ................................................................................................ 4-11
Table 4-8 State of Registration by Year (2005-2014) for Vessels Operating in the Non-tribal, At-sea Pacific Whiting Sector .......................................................... 4-12
Table 4-9 Annual Landings in Washington Coast Ports by Shore-based, Non-tribal Fishery Sector, 2004-2014 (thousands of round weight lbs) ............................... 4-12
Table 4-10 Annual Ex-vessel Revenue Landed in Washington Coast Ports by Shore-based, Non-tribal Fishery Sector, 2004-2014 (in thousands of 2014 inflation-adjusted dollars)* ................................................................................. 4-13
Table 4-11 Average Annual Ex-vessel Revenue per Round Weight Pound Landed in Washington Coast Ports by Shore-based, Non-tribal Fishery Sector, 2004-2014 (in 2014 inflation-adjusted dollars)* .................................................... 4-13
Table 4-12 Estimated Total Annual Number of Recreational Angler Trips Taken on Charter Vessels from Washington Coast Ports by Type of Trip, 2004-2014 (thousands) ........................................................................................ 4-27
Table 4-13 Number of Fish Buyers Operating in Washington Coast Ports that Purchased at Least $10,000 from Vessels Delivering to the Port during Each Year, 2004-2014 .......................................................................................... 4-28
Table 4-14 Number of Commercial Vessels Making Deliveries to Buyers in Washington Coast Ports of at Least $1,000 in the Port during Each Year, 2004-2014 ................ 4-28
Table 4-15 Total Fish Purchases (thousands of current dollars) by Fish Buyers Operating in Washington Coast Ports that Purchased at Least $10,000 from Vessels Delivering to the Port during Each Year, 2004-2014 ............................... 4-29
Table 4-16 Estimated Annual Number of Recreational Angler Trips Taken on Charter Vessels from Washington Coast Ports, 2004-2014 (thousands) ............................ 4-30
Table 4-17 Average Annual Number of Charter Vessels by Washington Coast Area .................. 4-30 Table 4-18 Estimated Ex-vessel Value of Tribal Commercial Fishery Landings in Neah
Bay: 2007 to 2011 (in thousands of 2014 dollars) ............................................ 4-36 Table 4-19 Quileute Tribal Fisheries: Annual Harvests by Species for Selected Years
(thousands of lbs) and Total Annual Ex-vessel Revenue (thousands of 2014 dollars) ............................................................................................. 4-38
Table 4-20 Ex-vessel Revenue from Grays Harbor Treaty Gillnet Fisheries (thousands of 2014 dollars) ....................................................................................... 4-39
Table 4-21 Ex-vessel Revenue from Treaty Ocean Salmon Troll Fisheries (thousands of 2014 dollars) ....................................................................................... 4-40
Table 4-22 Ex-vessel Revenue from Treaty Marine Fisheries (thousands of 2014 dollars)* ............................................................................................ 4-41
Table 4-23 Ex-vessel Revenue from Treaty Dungeness Crab Fishery (thousands of 2014 dollars) ............................................................................................. 4-41
Table 4-24 Ex-vessel Revenue from Treaty Commercial Razor Clam Fishery (thousands of 2014 dollars) ................................................................................... 4-42
Washington Coastal Marine Advisory Council | xiii

Economic Analysis to Support Marine Spatial Planning in Washington
Table 4-25 2004-2013 Annual Average Ex-vessel Revenues from Quinault Treaty Commercial Fisheries (thousands of 2014 dollars) .......................................... 4-42
Table 4-26 Counts of Quinault Indian Nation Vessels by Fishery ........................................ 4-43 Table 4-27 Counts of Treaty Commercial Fishers and Helpers by Fishery by Year ................... 4-43 Table 4-28 Direct Effects and Total Contributions to the Five-County Coastal Region
Economy from 2014 Washington Coast Non-tribal Commercial Fishing and Seafood Processing by County of the Activity ................................................ 4-46
Table 4-29 Direct Effects and Total Contributions to the State of Washington Economy from Washington Coast Non-tribal Commercial Fishing and Seafood Processing by County of the Activity .......................................................... 4-47
Table 4-30 Direct Effects and Total Contributions to the State of Washington Economy from the Washington Coast Portion of the Non-tribal At-sea Pacific Whiting Fishery1 ............................................................................................. 4-49
Table 4-31 Direct Effects and Total Contributions to the Washington Coast and State of Washington Economies from Puget Sound Landings of Non-tribal Catch off the Washington Coast1 ....................................................................... 4-50
Table 4-32 Counts of Alaska Commercial Fisheries Permits by Species Group Showing Current (2015) Owners Residing in the State of Washington and on the Washington Coast* ................................................................................ 4-50
Table 4-33 Counts of Alaska Commercial Salmon Fisheries Permits1 with Current (2015) Owners Residing in the State of Washington and on the Washington Coast2 ............ 4-51
Chapter 5
Table 5-1 Summary of Harvest and Value of Aquaculture Products in Pacific and Grays Harbor Counties ............................................................................. 5-8
Table 5-2 Survey Response Rate by Acreage and County ............................................... 5-10 Table 5-3 Economic Impacts of Survey Non-respondents, 2010 ....................................... 5-11 Table 5-4 Economic Impacts of Respondents, 2010 ..................................................... 5-12 Table 5-5 Total Economic Impact of Shellfish Aquaculture to Washington State, 2010 ........... 5-12 Table 5-6 Washington Shellfish Aquaculture Multipliers ................................................ 5-12 Table 5-7 Economic Impact of Shellfish Aquaculture, by County (2010) ............................. 5-13 Table 5-8 Total Expenditures by Category ................................................................ 5-18 Table 5-9 Estimated Direct Regional Expenditures by the Aquaculture Industry in the
Pacific Coast Region and State of Washington ............................................... 5-21 Table 5-10 Estimated Economic Contribution of the Shellfish Aquaculture Sector to the
Washington Coast Region ........................................................................ 5-21 Table 5-11 Estimated Economic Contribution of the Shellfish Aquaculture Sector to
Washington State ................................................................................. 5-22
Chapter 6
Table 6-1 Sport Fishing Effort by Trip Type and Mode, 2004-2013: Westport Port Area ............. 6-4 Table 6-2 Sport Fishing Effort by Trip Type and Mode, 2004-2013: Ilwaco Port Area ................ 6-5 Table 6-3 Sport Fishing Effort by Trip Type and Mode, 2004-2013: Neah Bay Port Area ............ 6-6 Table 6-4 Sport Fishing Effort by Trip Type and Mode, 2004-2013: La Push Port Area .............. 6-7 Table 6-5 Sport Fishing Effort by Trip Type and Mode, 2004-2013: Chinook Port Area .............. 6-8 Table 6-6 Sport Fishing Effort by Trip Type and Mode, 2004-2013: North Bay Jetty
(Columbia River) .................................................................................... 6-8
xiv | Washington Coastal Marine Advisory Council

Economic Analysis to Support Marine Spatial Planning in Washington
Table 6-7 Sport Fishing Effort by Trip Type and Mode, 2004-2013: All Coastal Washington Port Areas (including Neah Bay) ................................................... 6-9
Table 6-8 Average Number of Ocean Private Boat Sportfishing Trips, 2004-2013 .................. 6-10 Table 6-9 Annual and Average Annual Sport Catch in Marine Waters along the
Washington Coast, 2007/08 through 2011/12 Sportfishing Seasons ...................... 6-13 Table 6-10 Profile of Sport Catch along the Washington Coast during the 2011/12 Sport
Fishing Season, by Catch Area .................................................................. 6-14 Table 6-11 Recreational Halibut Season in 2014, by Management Subarea ........................... 6-16 Table 6-12 Fishing Seasons and Restrictions for Key Bottomfish Species in 2014, by
Management Area ................................................................................. 6-17 Table 6-13 Marine Recreational Fishing Regulations for Salmon, by Management Area ............ 6-18 Table 6-14 Trip-related Expenditures Associated with Ocean Sportfishing Trips in 2014
from Charter Vessels in the Washington Coastal Region (2014 dollars) .................. 6-19 Table 6-15 Trip-related Expenditures Associated with Ocean Sportfishing Trips in 2014
from Private Vessels in the Washington Coastal Region (2014 dollars) .................. 6-20 Table 6-16 Trip-related Expenditures Associated with Ocean Sport Fishing Trips in
2014 from Shore and Jetties in the Washington Coastal Region (2014 dollars) ............................................................................................. 6-21
Table 6-17 Contribution of Trip-related Angler Expenditures in the Coastal Area to Coastal Employment and Coastal Labor Income ............................................. 6-23
Table 6-18 Contribution of Trip-related Angler Expenditures in the Coastal Area and Elsewhere in Washington to Statewide Employment and Labor Income ................. 6-24
Chapter 7
Table 7-1 Resident Employment in Tourist-Sensitive Industries, by Coastal Community ............ 7-5 Table 7-2 Key Recreation Sites in the Northern Washington Coast Region ............................ 7-7 Table 7-3 Key Recreation Sites along the Southern Washington Coast (Grays Harbor
County) ............................................................................................. 7-10 Table 7-4 Key Recreation Sites in the Willapa Bay/Long Beach Peninsula Region
(Pacific County) ................................................................................... 7-20 Table 7-5 Percentage of Single-county and Multiple-county Trips to the Coastal Study
Area, by Washington County of Origin ......................................................... 7-29 Table 7-6 Trip-related Expenditures by Washington Residents Associated with
Recreation and Tourism Activities in the Washington Coastal Area (2014 dollars) ............................................................................................. 7-31
Table 7-7 Trip-Related Expenditures by Out-of-state Visitors Associated with Recreation and Tourism Activities in the Washington Coastal Study Area (2014 dollars) ...................................................................................... 7-33
Table 7-8 Contribution of Trip-related Recreation and Tourism Expenditures in the Coastal Study Area to Coastal Employment and Coastal Labor Income .................. 7-34
Table 7-9 Contribution of Trip-related Recreation and Tourism Expenditures to Statewide Employment and Labor Income .................................................... 7-35
Table 7-10 10-Year Projections of Population Growth for Washington State and Coastal Counties, 2015-2025 .............................................................................. 7-37
Chapter 9
Table 8-1 Summary of Organizing Coastal Attributes into Benefit Categories ........................ 8-3
Washington Coastal Marine Advisory Council | xv

Economic Analysis to Support Marine Spatial Planning in Washington
Table 8-2 Aggregrate Survey Results for 11 Ecological Indicators in Three Oregon Coast Communities ................................................................................. 8-9
Chapter 10
Table 10-1 Number of Vessels Registered to Groundfish Trawl Permits by Vessel Owner’s Residence, Selected Years 1994−2015 .............................................. 10-3
Chapter 11
Table 11-1 Summary of Potential Impacts of New Uses on Commercial Fishing ..................... 11-10 Table 11-2 Summary of Potential New Uses on Shoreside Aquaculture ............................... 11-15 Table 11-3 Summary of Potential Impacts of New Uses on Recreational Fishing .................... 11-19 Table 11-4 Summary of Potential Impacts of New Uses on Recreation and Tourism ............... 11-24 Table 11-5 Summary of Potential Impacts of New Uses on Commercial Shipping ................... 11-29
xvi | Washington Coastal Marine Advisory Council
Acronyms and Abbreviations
ACS U.S. Census Bureau’s American Community Survey ANA Administration for Native Americans ATBA Area to Be Avoided B&B bed and breakfast inn BEA U.S. Department of Commerce, Bureau of Economic Analysis BEACH Washington Beach Environmental Assessment Communication & Health BIA U.S. Bureau of Indian Affairs BOEM U.S. Bureau of Ocean Energy Management CaCO3 calcium carbonate CBR crude by rail CCD Census County Division CCIEA California Current Integrated Ecosystem Assessment CCLME California Current Large Marine Ecosystem CDP Census Designated Place CEDS Comprehensive Economic Development Strategies CEQ Council on Environmental Quality CFEC Commercial Fisheries Entry Commission CFR Code of Federal Regulations Clallam EDC Clallam County Economic Development Council CO2 carbon dioxide ColPac Columbia Pacific Resource Conservation and Economic Development
District CPS coastal pelagic species DNR Washington Department of Natural Resources DOE U.S. Department of Energy DOH Washington Department of Health EBM ecosystem-based management Ecology Washington Department of Ecology EDA U.S. Economic Development Administration EDC Economic Development Council
Washington Coastal Marine Advisory Council | xvii
Economic Analysis to Support Marine Spatial Planning in Washington
EIS environmental impact statement EPA U.S. Environmental Protection Agency ESA Endangered Species Act ESU Environmentally Significant Unit EU European Union FMP Fishery Management Plan ft foot FY Fiscal Year GDP Gross Domestic Product GIS geographic information system HABs harmful algal blooms H.R. House Resolution ID identification IEA Integrated Ecosystem Assessment IEc Industrial Economics, Inc. IFQ individual fisheries quota IHS Indian Health Services ILWU International Longshore and Warehouse Union InVEST Integrated Valuation of Ecosystem Services Tradeoffs I-O input-output IPHC International Pacific Halibut Commission ITQ individual transferable quota lb pound m meter MA United Nations Millennium Ecosystem Assessment MRAC Marine Resource Advisory Council MRC Marine Resources Committee MSP Washington State Marine Spatial Plan NEI Northern Economics, Inc. NEPA National Environmental Policy Act NOAA National Oceanic and Atmospheric Administration NOAA Fisheries National Marine Fisheries Service NOEP National Ocean Economics Program NPDES National Pollutant Discharge Elimination System NWFSC Northwest Fisheries Science Center
xviii | Washington Coastal Marine Advisory Council

Economic Analysis to Support Marine Spatial Planning in Washington
OA ocean acidification OBA ocean beach approach OHV off-highway vehicle PacFIN Pacific Fisheries Information Network PCC Pacific Coast Council PDD Peninsula Development District PFMC Pacific Fishery Management Council P&G Principles and Guidelines Pncima Pacific North Coast Integrated Management Area PNW Pacific Northwest PSI Pacific Shellfish Institue PSP paralytic shellfish poisoning QDFi Quinault Department of Fisheries QHA Quileute Housing Authority QIN Quinault Indian Nation QTE Quinault Tribal Enterprises RCW Revised Code of Washington REIS U.S. Department of Commerce, Bureau of Economic Analysis, Regional
Economic Information System RFQ Request for Qualifications RV recreational vehicle SCA seashore conservation area SCORP State Comprehensive Outdoor Recreation Plan SEPA State Environmental Policy Act SLR sea level rise SMP Shoreline Master Program SR State Route SWIMM Social Well-being Indicators for Marine Management U&A usual and accustomed fishing grounds US 101 U.S. Highway 101 USDA U.S. Department of Agriculture USFS U.S. Forest Service USFWS U.S. Fish and Wildlife Service WBE Willapa Bay Enterprises WCMAC Washington Coast Marine Advisory Council
Washington Coastal Marine Advisory Council | xix

Economic Analysis to Support Marine Spatial Planning in Washington
WDFW Washington Department of Fish and Wildlife WGHOGA Willapa Grays Harbor Oyster Growers Association WRC Water Resources Council WSG Washington Sea Grant WSPRC Washington State Parks and Recreation Commission
xx | Washington Coastal Marine Advisory Council

CHAPTER 1. Introduction
1.1 MARINE SPATIAL PLANNING AND ECONOMIC ANALYSIS
The Pacific Coast of Washington has historically provided, and continues to provide, a diverse array of activities and resource uses. As the population increases, demographics change, and resource demands and uses evolve, conflicts among users are inevitable; however, coordinated planning can greatly minimize these conflicts. In addition, federal, state, local, and tribal governments have many overlapping missions and responsibilities that require expanded integration to provide more certainty in decision making and to maintain protection of resources. The State of Washington recognized the need for a non-regulatory framework to be established to share information and provide a mechanism for planning and decision making, which included development of a Marine Spatial Plan (MSP).
An MSP identifies current and potential future activities for the coastal marine area, the priority locations where these activities take place, and the cultural and aesthetic values of these locations. The planning process itself is, by state law, a “public process of analyzing and allocating the spatial and temporal distribution of human activities in marine areas to achieve ecological, economic, and social objectives” (RCW 43.372). Other aspects of the overall planning process are addressing both ecological and social objectives; a new effort is intended to address economic objectives as part of the ecosystem assessment. The Washington MSP study area is shown in Figure 1-1.
Washington Coastal Marine Advisory Council Introduction | 1-1

Economic Analysis to Support Marine Spatial Planning in Washington
Figure 1-1 Washington Marine Spatial Plan Study Area
1-2 | Introduction Washington Coastal Marine Advisory Council

Economic Analysis to Support Marine Spatial Planning in Washington
With an emphasis on characterizing existing economic activities, the planning process to date has included the development of information related to five categories: non-tribal commercial and recreational fishing, recreation and tourism, transportation, renewable energy, and aquaculture. These “sector analyses” provide contextual and background information needed for the MSP process to move forward to an economic analysis of existing and potential future uses and activities. As an overriding mission, the economic analysis is intended to “foster and encourage sustainable uses that provide economic opportunity without significant adverse environmental impacts” (RCW 43.372.040). This requires that the economic analysis consider not only baseline conditions for ocean uses and their important relationships to coastal communities, but also an analytical ability to evaluate the economic consequences of various proposals or planning options. The ultimate products of the economic analysis effort are this report, which details these conditions and relationships, and an operating regional impacts model supported by an updatable database. A key element of the economic model should be that it is dynamic, allowing for feedback responses to individual proposed uses or combinations of proposed uses, while considering and incorporating changing demographics and economic conditions.
1.2 PURPOSE
The purpose of this project is to develop the tools and data to characterize existing conditions on the Washington coast, and to evaluate the economic consequences of new proposed uses or planning options. In combination with social, ecological, and cultural considerations within the MSP process, the economic analysis contributes to a determination of the most appropriate locations for new uses while giving consideration to, and protecting, existing uses.
1.3 DESIGN OF THE ECONOMIC ANALYSIS: SCOPING PROCESS
In general, the components that make up an economic analysis will vary by the identified needs of the study, proposed initiatives being considered or investigated, required precision of output, industry sectors or affected groups of particular interest or emphasis, geographic locations being examined, data availability and delivery, timeline, and budget availability. Because so many elements must be balanced to frame an appropriate economic analysis, a scoping process was built into formulating the design of the study. This process involved the economics consultant team, the Washington Coast Marine Advisory Council (WCMAC), Washington Department of Natural Resources (DNR), Washington Department of Ecology (Ecology), and the Science Advisory Panel to WCMAC.
A several-step process was used to develop the scope for the Marine Spatial Planning Economic Analysis:
1. WCMAC Technical Committee Suggestions: The Technical Committee prepared an initial list of concepts, ideas, and components that were recommended to be addressed and included in an economic analysis.
2. Washington Department of Natural Resources Selects Consultant: DNR advertised for and requested proposals to scope and conduct an economic analysis. Representatives from DNR, Ecology, and WCMAC reviewed proposals, conducted interviews, and selected a consultant team.
Washington Coastal Marine Advisory Council Introduction | 1-3

Economic Analysis to Support Marine Spatial Planning in Washington
3. Initial Menu of Approaches: The consultant team prepared a menu of approaches to organizing and completing an economic analysis. The menu included three possible levels of study reflecting differing degrees of investigation, precision and accuracy, and involvement of local affected entities. Details are included as Appendix A to this report.
4. Public Scoping Workshop: The consultant team conducted an Economic Analysis Scoping Workshop on October 7, 2014, for WCMAC members and other interested parties, where team members presented information about approaches to the economic analysis. Participants were invited to ask questions and discuss their interests and needs in the study. The presentation was video-recorded and made available on-line for those unable to attend, and the presentation slides were made be available in a PDF format after the workshop.
5. Written Comments: In addition to set periods for discussion, comments, and recommendations during the workshop, an opportunity was provided for WCMAC members and other interested individuals to provide written comments or suggestions to the economics team after the workshop.
6. Proposed Scope of Work: The economics consultant team developed a proposed scope of work that incorporated suggestions and recommendations from the scoping workshop and written comments, and was based on knowledge of available information, previous and ongoing studies, and Marine Spatial Planning needs.
7. Science Panel Review: The team presented the proposed scope of work to the Science Advisory Panel in mid-October, then revised and refined the scope of work based on comments and input from the panel.
8. Consultant Presents Recommended Scope of Work: The economics consultant team leader presented the resulting scope of work, based on the process outlined above, to WCMAC at the October 22, 2014 meeting. Additional refinements based on comments from WCMAC were incorporated, and the final scope of work was approved by Ecology and DNR.
Based on the completed scoping process, the consultants developed a scope for the study that addresses data collection, organization, and topical issues, and in some cases quantitative modeling, within the following subject areas:
Economic Profile of the Washington Coast
Economic Profile of Tribal Communities
Washington Coast Commercial Fisheries
Shellfish Aquaculture
Recreational Fishing
Recreation and Tourism
Ecosystem Services
1-4 | Introduction Washington Coastal Marine Advisory Council

Economic Analysis to Support Marine Spatial Planning in Washington
Social Assessment
Risk and Industry Vulnerability Assessment
Qualitative Analysis of New Uses
The remainder of this chapter describes the methodology and approach used to address each of these topic areas. This is followed by a description of the economic impact modeling approach and construction.
1.4 METHODOLOGY FOR TOPIC AREA INVESTIGATIONS
1.4.1 Economic Profile of the Washington Coast
Current Conditions
An earlier effort in the MSP process developed reports focused on five significant industry sectors. While these sector reports provide useful details about five important sectors on the Washington coast—shipping, fishing, aquaculture, recreation, and marine energy—the total economy on the coast is larger than those five sectors. The goal of this economic profile is to draw from those sector reports, as well as other existing documents, and incorporate other socioeconomic data, pulling the information together in a cohesive fashion that provides a broad view of the coastal economic environment as it currently exists.
The initial step was to identify and review all relevant existing and ongoing economic research related to the Washington coast. This review included ongoing and completed MSP projects as well as research conducted outside the MSP process, such as port-sponsored studies and city and county economic development plans. In addition, much of the primary data for the profiles come from the following published government sources:
U.S. Census Bureau, including the American Community Survey (ACS), for data on housing, population by age class, employment, and ethnicity;
Bureau of Economic Analysis, Regional Economic Information System (REIS) data on sector-based production and personal income;
City-, county-, and state-level updates to the census data and, where available, more localized estimates of demographics and other social and economic statistics; and
U.S. Census Bureau’s County Business Patterns data.
New research conducted as part of this study also contributes to the economic profile, in particular economic data for commercial (non-tribal and tribal) fisheries, recreational fishing, recreation and tourism, and aquaculture.
© Frank Kovalchek, 2013
Marina at Neah Bay
Washington Coastal Marine Advisory Council Introduction | 1-5
Economic Analysis to Support Marine Spatial Planning in Washington
Trends Affecting the Coastal Economy
Given that the MSP covers a 20-year planning horizon, information is needed about economic and demographic trends for the Washington coast. Data on economic trends in key parts of the coastal economy were developed in part from the original sector reports, as well as other published reports and new sector research (presented in other parts of this study).
Published information was supplemented by a series of interviews with key players in different parts of the coastal economy, representatives in the fishing and aquaculture industries, and natural resource personnel at federal, state, and county agencies. This information was supplemented by examination of broader trends – demographic, technological, economic, and climatic—in the State of Washington and the United States as a whole that are likely to affect conditions in the coastal communities, at a scale beyond what those communities themselves can affect independently. In addition, planned capital improvements are identified for projected changes in public and private infrastructure that would result in changes to sales revenue and employment on the coast.
1.4.2 Economic Profile of Tribal Communities
Five Indian reservations are present on the Washington coast and within the MSP planning area: Quinault, Quileute, Hoh, Makah, and Shoalwater Bay. Considerable economic interaction takes place among the Tribes, tribal members, and the non-Indian communities, through shared commerce and employment and through co-management of natural resources by federal, state, and tribal entities. Important distinctions can be made about tribal communities, however, that merit developing a profile separate from that of the non-tribal communities of the coast.
As a first step, existing, available data and literature were used to prepare a socioeconomic profile of each of the five tribes. The U.S. Census provides information on a reservation-wide basis; ACS data were available for each of the five tribes. Additional demographic and economic information was obtained to assist in this process as provided voluntarily by the Tribes. This data-gathering effort involved direct contact by the economics consultants with tribal staff members who have been assigned to monitor and participate in the MSP. The economics consultants participated in a number of meetings on the various reservation, along with followup phone calls. In some cases, the Tribes provided Comprehensive Economic Development Strategies (CEDS) reports, which they prepare and provide to the U.S. Department of Commerce on a periodic basis.
1.4.3 Commercial Fisheries
Non-Tribal Fisheries
Commercial fishing is an important and historical component of the coastal Washington economy and warrants a detailed analysis. Landings and processing by commercial fisheries supply markets in the United States, in Canada, and overseas and provide income and employment in harvesting, processing, and support industry sectors, both in the coastal region and elsewhere in the state. Published data sources
1-6 | Introduction Washington Coastal Marine Advisory Council

Economic Analysis to Support Marine Spatial Planning in Washington
such as PacFIN (for shore-based fisheries) and Norpac (for at-sea Pacific whiting1) provide some idea of the scale of landings and ex-vessel revenue in these fisheries, but publicly available data likely underestimate activity for certain species and ports because of confidentiality constraints that limit the ability to disclose business information for fisheries aggregations with fewer than three participating harvesters or buyers/processors. Consequently, more detailed, vessel-level landing and ex-vessel revenue data, including activity in at-sea Pacific whiting fisheries operating off the Washington Coast, are required to adequately analyze contributions from all components of Washington’s Pacific commercial fisheries.
Tribal Fisheries
Vessel-level data may not be recorded with public agencies for tribal fisheries because tribal vessels need not be registered with state or federal authorities. These data may also exclude ex-vessel revenue estimates associated with landings. Therefore, the economics consultants worked directly with the Tribes to obtain fisheries data, including, but not limited to, activity in tribal crab, salmon, and at-sea Pacific whiting fisheries, to adequately analyze contributions from all components of Washington Coast tribal fisheries.
While Shoalwater Bay members do not have treaty-reserved fishing rights off-reservation, members of the other four tribes (Makah, Quileute, Hoh, and Quinault) do, and they fish under authority of their treaties, rather than by state license, in the open ocean. The federal courts have ruled that the treaty tribes have access to 50 percent of the harvestable fishery passing through their respective treaty areas (usual and accustomed fishing grounds and stations, sometimes called the U&A). For the above-mentioned four coastal treaty tribes, this includes a significant percent of Pacific Coast fish and shellfish.
Available Fisheries Data
The PacFIN fisheries database is a comprehensive repository of data on landings and ex-vessel revenue for vessels and fish buyers operating in commercial fisheries on the Pacific coast (including Washington inland waters and the Columbia River). PacFIN also includes data for landings made to Washington state-licensed fish buyers from distant ocean areas and from commercial-scale tribal fisheries operating on the coast and in the Columbia River. Detailed data on landings and vessel participation in Washington Coast ports were obtained from the Washington Department of Fish and Wildlife (WDFW).
The Northwest Indian Fisheries Commission maintains Norpac, a comprehensive database of landings made in tribal fisheries. This fishery observer database maintains data on Pacific whiting catch by catcher-processor vessels and deliveries to mothership floating processors participating in the at-sea Pacific whiting fishery, including deliveries made in the at-sea tribal fishery.
1 In this document, “Pacific whiting,” "whiting,” “Pacific hake,” and "hake” all refer to the same species, Merluccius productus.
Washington Coastal Marine Advisory Council Introduction | 1-7
Economic Analysis to Support Marine Spatial Planning in Washington
Although direct data on ex-processor (or “first wholesale”) sales of fisheries products in Washington are not generally available, these values were estimated from landings and revenue data and information from key industry informants using fairly standard assumptions about the value of inputs used in seafood processing.
In addition to reviewing existing, officially collected data, the economics consultants canvassed extant literature on relevant economic activities and reports produced by earlier-phase project contractors, government regulators, industry sources, and other experts to gather additional information and identify emerging trends. For example, the National Oceanic and Atmospheric Administration Fisheries (NOAA Fisheries, formerly the National Marine Fisheries Service or NMFS) IOPAC fisheries economic analysis models and Economic Data Collection reports for participants in West Coast groundfish trawl individual-quota fisheries were consulted to glean relevant information.
Data Confidentiality
Commercial fishing annual vessel summary data for recent years (2004-2013) for vessels landing in ports in Clallam, Jefferson, Grays Harbor, Pacific, and Wahkiakum Counties were needed to analyze economic contributions and impacts of commercial fisheries at the port level. Required variables were year, area of catch, PacFIN port code, state port code, gear, species, vessel identification (ID) (or proxy), processor ID (or proxy), round weight, landed weight, and ex-vessel revenue. Unfortunately, public reporting of data is heavily constrained by confidentiality concerns because the limited number of participants in certain ports. Therefore, the economics consultant team was required to obtain clearance from WDFW to view confidential data.
Primary Data Collection
A “key informant” approach to industry data collection was used to collect primary data on tribal and non-tribal
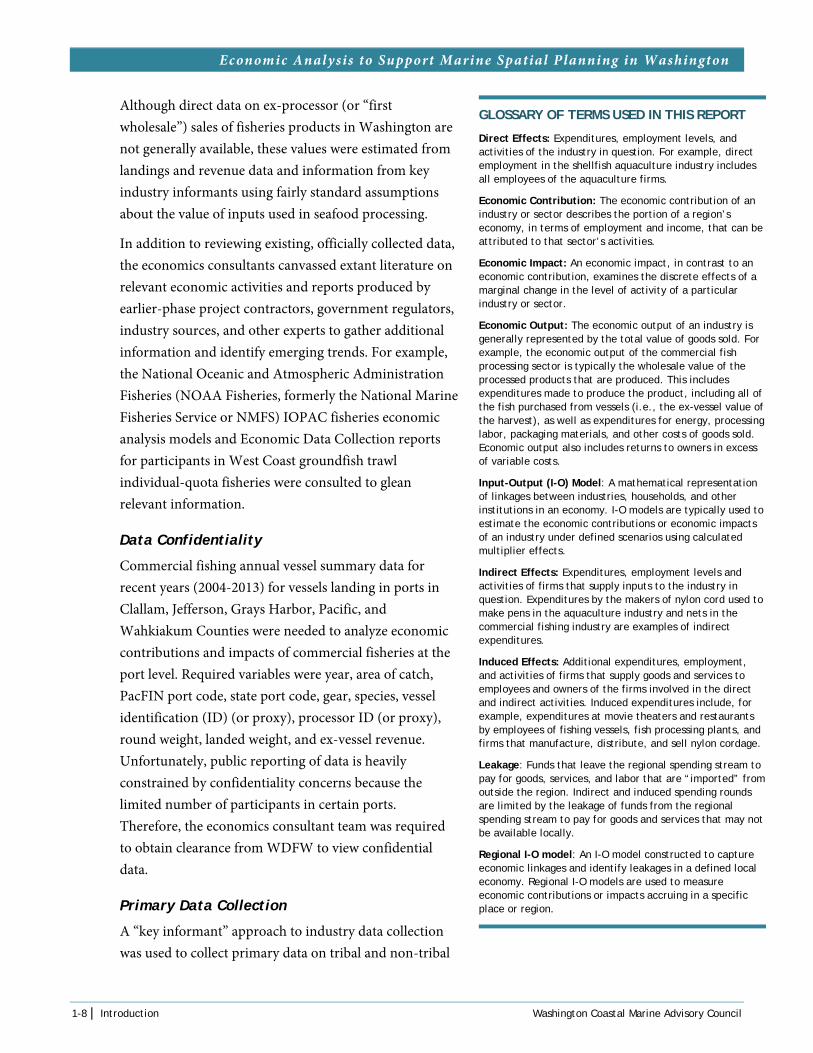
GLOSSARY OF TERMS USED IN THIS REPORT
Direct Effects: Expenditures, employment levels, and activities of the industry in question. For example, direct employment in the shellfish aquaculture industry includes all employees of the aquaculture firms.
Economic Contribution: The economic contribution of an industry or sector describes the portion of a region’s economy, in terms of employment and income, that can be attributed to that sector’s activities.
Economic Impact: An economic impact, in contrast to an economic contribution, examines the discrete effects of a marginal change in the level of activity of a particular industry or sector.
Economic Output: The economic output of an industry is generally represented by the total value of goods sold. For example, the economic output of the commercial fish processing sector is typically the wholesale value of the processed products that are produced. This includes expenditures made to produce the product, including all of the fish purchased from vessels (i.e., the ex-vessel value of the harvest), as well as expenditures for energy, processing labor, packaging materials, and other costs of goods sold. Economic output also includes returns to owners in excess of variable costs.
Input-Output (I-O) Model: A mathematical representation of linkages between industries, households, and other institutions in an economy. I-O models are typically used to estimate the economic contributions or economic impacts of an industry under defined scenarios using calculated multiplier effects.
Indirect Effects: Expenditures, employment levels and activities of firms that supply inputs to the industry in question. Expenditures by the makers of nylon cord used to make pens in the aquaculture industry and nets in the commercial fishing industry are examples of indirect expenditures.
Induced Effects: Additional expenditures, employment, and activities of firms that supply goods and services to employees and owners of the firms involved in the direct and indirect activities. Induced expenditures include, for example, expenditures at movie theaters and restaurants by employees of fishing vessels, fish processing plants, and firms that manufacture, distribute, and sell nylon cordage.
Leakage: Funds that leave the regional spending stream to pay for goods, services, and labor that are “imported” from outside the region. Indirect and induced spending rounds are limited by the leakage of funds from the regional spending stream to pay for goods and services that may not be available locally.
Regional I-O model: An I-O model constructed to capture economic linkages and identify leakages in a defined local economy. Regional I-O models are used to measure economic contributions or impacts accruing in a specific place or region.
1-8 | Introduction Washington Coastal Marine Advisory Council

Economic Analysis to Support Marine Spatial Planning in Washington
fisheries harvesting, processing, and distribution activities. Data collected from key informants were used to supplement data obtained from published sources to calibrate estimates of the economic contributions and impacts of fisheries-related activities.
Key informant contacts included government agency personnel, industry groups such as commercial harvesters’ and processors’ associations, tribal fisheries representatives, and other regional industry support and advocacy groups. The industry key informants or focus groups of several persons were asked to review and comment on estimates of economic data related to commercial fish harvesting and processing. These data, combined with official data on landings, were used to calibrate the analytical models.
1.4.4 Shellfish Aquaculture
Commercial shellfish production features prominently on the Washington coast but is a relatively uncommon industry from a national perspective. Thus, expenditure data are not generally available in published sources, and grower interviews are therefore extremely important in properly characterizing the relationship of expenditures to revenue, employment, and their role in the coastal economy.
In 2011-2013, Northern Economics, Inc. (NEI), and the Pacific Shellfish Institute developed an input/output (I-O) model of the shellfish aquaculture industry in Washington, Oregon, and California using 2010 data (NEI 2013). As a first step, the data obtained and developed in the NEI study were revisited, with emphasis on oyster aquaculture on the Washington Coast. Using a focus group format involving representatives of the coastal Washington shellfish aquaculture industry, data were reviewed on the numbers of acres in production, revenue, employment, and expenditures and economic impact estimates in Grays Harbor and Pacific Counties.
In addition, eight key informant interviews and a survey were conducted with members of the oyster and clam processing and distribution sectors to collect relevant data on their production levels, sales, revenues, and expenditures. These data were used to enhance the existing model parameters by accounting for the impact of these subsidiary producers in the aquaculture industry of Pacific and Grays Harbor Counties.
1.4.5 Recreational Fishing
Recreational fishing opportunities for salmon, Pacific halibut, groundfish, tuna, and sturgeon attract anglers from nearby urban areas in Washington and Oregon and also from across the United States. Recreational fishing in coastal waters off Washington includes participation in seasonal fisheries for finfish species, such as salmon, albacore, groundfish (lingcod and rockfish species) and Pacific halibut. The primary originating ports for Washington ocean anglers are Ilwaco and Chinook in Pacific County, Westport in Grays Harbor County, and La Push in Clallam County. Coastal Washington angler trips also originate from Neah Bay.2 In addition to finfish, recreational collection of shellfish is also a popular activity along the Washington Coast, particularly along the southern coast. The principal species collected
2 Ocean anglers also originate from Port Angeles on the Strait of Juan de Fuca, which is outside of the MSP planning area.
Washington Coastal Marine Advisory Council Introduction | 1-9

Economic Analysis to Support Marine Spatial Planning in Washington
is razor clam, and the primary areas for clam digging are sand beaches between the Columbia River north jetty and Quinault River mouth.
The key analytical objectives for the recreational fishing component are to construct an economic baseline that characterizes existing recreational fishing levels and associated angler spending in the coastal study area, and to identify potential impact mechanisms against which to assess the effects of future uses in the coastal study area on recreational fishing activities. This task included developing a database to characterize marine fishing activities, associated fishing-related expenditure profiles, and important economic impact mechanisms (e.g., potential links between resource conditions and recreational fishing activities) for assessing effects of potential changes in coastal uses.
The characterization of marine fishing activities involved the following tasks:
Researching and developing profiles of recreational fishing activity by species group, ports/marinas of fishing activity, and mode of fishing (shore, charter boat, and private boat), using NOAA Fisheries’ marine fishing statistical survey; U.S. Fish and Wildlife Service (USFWS) surveys of fishing, hunting, and wildlife−associated activities; and WDFW’s annual angler surveys for the Catch Record Card program. This research was supplemented with information on the origin and destination of coastal visitors from the Surfrider Foundation’s recreation study for the MSP (Point 97 and Surfrider Foundation 2015).
Researching and developing profiles of trip-related expenditures used for marine recreational fishing using the NOAA Fisheries and USFWS survey results identified above, trip-related spending information from the Surfrider Foundation’s study identified above, and from special studies commissioned by NOAA Fisheries, WDFW, and other state agencies and private consultants on the economics of marine recreational fishing in Washington State (ICF 1988, TCW Economics 2008).
Data on the estimated number of recreational angler trips by port or region, the stated target of the trips, and resulting catch by species group are generated and maintained by WDFW; these data were requested and obtained from WDFW. This information was used to provide localized characterization of recreational fishing participation.
Estimates of recreational angler trip expenditures were available from multiple sources, including regulatory impact documents produced by the Pacific Fishery Management Council (PFMC) and NOAA Fisheries for periodic groundfish and salmon fisheries management actions. In addition, key informant interviews of charter boat operators were conducted in Ilwaco and Westport. During these interviews, industry representatives reviewed and commented on the area of residence of their clients and the expenditure patterns of their operations; these data were incorporated in the economic models (discussed
© Lorrie Jo Williams, 2012
Sportfishing boat
1-10 | Introduction Washington Coastal Marine Advisory Council

Economic Analysis to Support Marine Spatial Planning in Washington
below in Section 1.5, “Economic Impact Modeling Approaches and Measures”) to more accurately reflect the actual behavior and operations of the charter boat fleet.
1.4.6 Recreation and Tourism
The key analytical objectives for the recreation and tourism assessment are to construct an economic baseline that characterizes existing recreation and tourism in the coastal study area, and to identify potential impact mechanisms against which to assess the effects of future uses in the coastal study area on recreation and tourism activities. Additionally, the assessment is intended to establish the relative importance of the recreation and tourism industry at the sub-county or community level along the coast.
A baseline was developed that details recreation and tourism activities, activity levels, and associated expenditures. First, the relative importance of recreation and tourism businesses in 30 communities in the MSP coastal study area was characterized. This characterization of community-specific recreation and tourism was developed in conjunction with other study team efforts to profile the Washington Coast economy (refer to Section 1.4.1, “Economic Profile of the Washington Coast”). Business and employment data were compiled from the U.S. Bureau of Economic Analysis and REIS, the U.S. Census Bureau’s ACS and County Business Patterns reports, and the Washington Employment Security Department.
The popularity of coastal recreational activities was identified based on information from the 2014-15 recreation survey conducted for the Surfrider Foundation (Point 97 and Surfrider Foundation 2015). In addition, the proportion of recreational trips to the MSP study area from different Washington State counties was estimated based on data compiled from the Surfrider Foundation study.
Per-trip expenditure profiles were developed for Washington State residents who visited the coastal study area based on information presented in the 2015 Point 97 and Surfrider Foundation study report. For out-of-state visitors to the coastal study area, recreation expenditure information available from reports prepared by Earth Economics (2015) and Dean Runyan Associates (2011) were used to develop spending profiles. (Note that the recreation survey conducted for the Point 97 and Surfrider Foundation study collected data from Washington residents only.) The per-trip spending profiles for both Washington State residents and out-of-state visitors included estimates of spending by business sector level (e.g., lodging, food stores, restaurants); this allowed for “mapping” the sector-specific estimates of recreation-related spending to IMPLAN sectors (refer to Section 1.5, “Economic Impact Modeling Approaches and Measures”) to estimate the direct effects generated by recreation and tourism spending in the coastal area.
Of particular importance to the modeling of economic effects is the derivation of the proportion of overall recreation and tourism activity that is attributable to residents and non-residents of the coastal counties. While the spending of non-residents generates new economic activity within each county, the spending of residents generally does not, as it typically represents a shift of spending from one good or service to another within the same county economy. Percentages of spending within different geographic regions by Washington State residents and out-of-state visitors were developed using information from a survey of Oregon anglers, conducted in 1988-89 (The Research Group 1991), in which survey participants were asked to estimate their trip-related spending within different geographical regions of their trip (i.e., home
Washington Coastal Marine Advisory Council Introduction | 1-11

Economic Analysis to Support Marine Spatial Planning in Washington
county, en route, and at trip destination). Even though this survey is obviously dated, the proportions of spending derived from the survey data and used for assigning spending to different regions on a trip are considered reasonable approximations.
1.4.7 Ecosystem Services
Natural resource planning requires an understanding of tradeoffs among resource uses, including recognition of the services provided by a natural landscape and a full understanding of its role in the economic environment of the region. This recognition reflects acknowledgment that the highest economic value for a natural or cultural resource base may be to maintain it in its undisturbed condition. This contemporary perspective and economic approach is referred to as “ecosystem services valuation.”
Various studies have attempted to estimate the value of ecosystem services in watersheds, small regions, or even particular land parcels. These studies have used a wide variety of site-specific physical and biological data to derive estimates. Such information is not generally available in uniform measure or degree of detail at the full scale that can be applicable to all counties.
For this study, the concepts of ecosystem services valuation are defined and discussed on a qualitative basis based on the types and forms of ecosystem services that are found within the area, with examples drawn from individual locations on the coast. This approach includes additional research on valuations from representative locations, as well as the identification of sites in the planning area that are likely to carry relatively high ecosystem service values.
1.4.8 Social Impact Assessment
To date, limited information has been gathered regarding the social and cultural systems of Washington coastal communities. Basic economic and demographic profiles of Coastal Washington counties were prepared as part of the “Economic Profile” sections of this report (Sections 1.4.1 and 1.4.2 above). The purpose of the social impact assessment is to address, at a minimum, the remainder of the basic social and cultural profiles information listed in the NMFS Guidelines and Principles for Social Impacts Analysis (U.S. Department of Commerce 1994). To maintain consistency of information collection and reporting, coordination took place with the following ongoing social and cultural assessments and human-wellbeing indicator development efforts:
Human Well-being Framework for Environmental Management—University of Washington Tacoma, Puget Sound Institute, and The Nature Conservancy
Social Well-being Indicators for Marine Management—National Oceanic and Atmospheric Administration (NOAA), Northwest Fisheries Science Center
Integrated Ecosystem Assessment (IEA) for Washington Marine Spatial Planning: Social Indicator Development Process—Washington Sea Grant
Community Profiles for West Coast and North Pacific Fisheries—NOAA, Northwest Fisheries Science Center
1-12 | Introduction Washington Coastal Marine Advisory Council
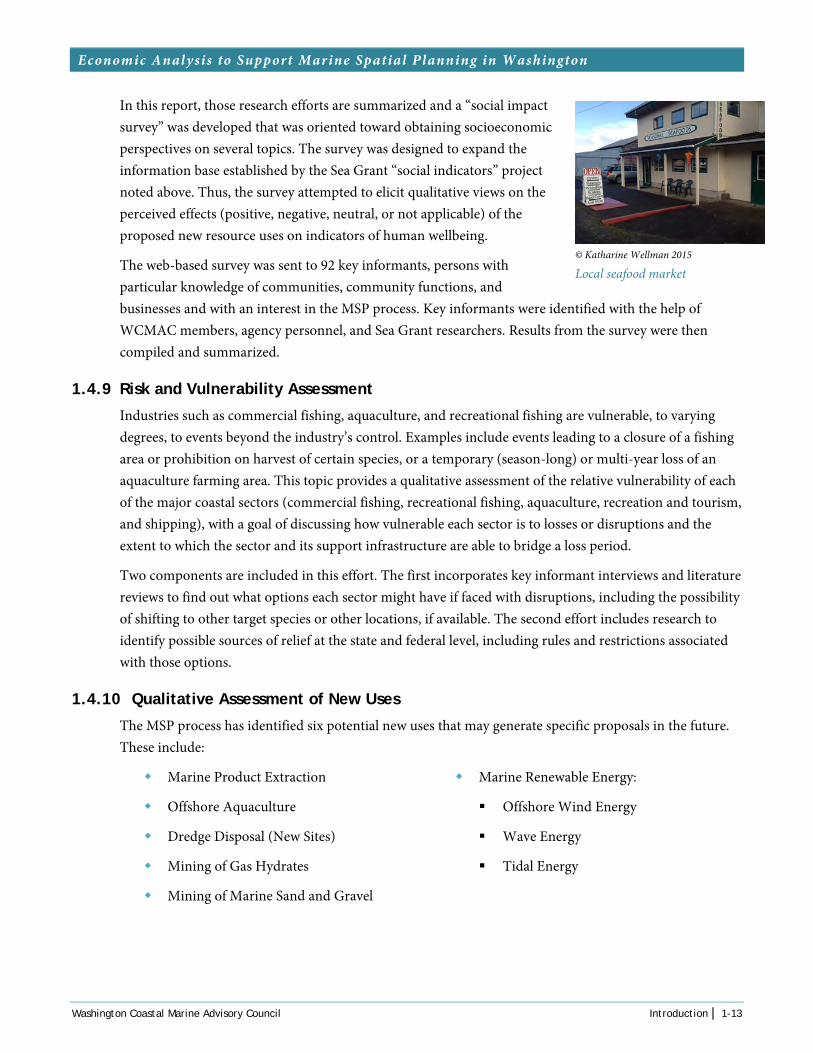
Economic Analysis to Support Marine Spatial Planning in Washington
In this report, those research efforts are summarized and a “social impact survey” was developed that was oriented toward obtaining socioeconomic perspectives on several topics. The survey was designed to expand the information base established by the Sea Grant “social indicators” project noted above. Thus, the survey attempted to elicit qualitative views on the perceived effects (positive, negative, neutral, or not applicable) of the proposed new resource uses on indicators of human wellbeing.
The web-based survey was sent to 92 key informants, persons with particular knowledge of communities, community functions, and businesses and with an interest in the MSP process. Key informants were identified with the help of WCMAC members, agency personnel, and Sea Grant researchers. Results from the survey were then compiled and summarized.
1.4.9 Risk and Vulnerability Assessment
Industries such as commercial fishing, aquaculture, and recreational fishing are vulnerable, to varying degrees, to events beyond the industry’s control. Examples include events leading to a closure of a fishing area or prohibition on harvest of certain species, or a temporary (season-long) or multi-year loss of an aquaculture farming area. This topic provides a qualitative assessment of the relative vulnerability of each of the major coastal sectors (commercial fishing, recreational fishing, aquaculture, recreation and tourism, and shipping), with a goal of discussing how vulnerable each sector is to losses or disruptions and the extent to which the sector and its support infrastructure are able to bridge a loss period.
Two components are included in this effort. The first incorporates key informant interviews and literature reviews to find out what options each sector might have if faced with disruptions, including the possibility of shifting to other target species or other locations, if available. The second effort includes research to identify possible sources of relief at the state and federal level, including rules and restrictions associated with those options.
1.4.10 Qualitative Assessment of New Uses
The MSP process has identified six potential new uses that may generate specific proposals in the future. These include:
Marine Product Extraction
Offshore Aquaculture
Dredge Disposal (New Sites)
Mining of Gas Hydrates
Mining of Marine Sand and Gravel
Marine Renewable Energy:
Offshore Wind Energy
Wave Energy
Tidal Energy
© Katharine Wellman 2015
Local seafood market
Washington Coastal Marine Advisory Council Introduction | 1-13
Economic Analysis to Support Marine Spatial Planning in Washington
The new uses are broad in scope and, with limited exceptions, are not specific in location, nor on scale of potential projects. As such, it is not possible to quantify the impacts of proposed new uses on existing uses of coastal resources. However, the nature of the proposed uses and what is known about their resource requirements and potential effects allows for general qualitative assessments (i.e., positive, negative, or neutral) of their effects on current uses.
The chapter contains a brief summary of the proposed use categories, followed by a qualitative assessment of the potential effects on the primary uses identified and analyzed elsewhere in this report. The potential effects are discussed and are also summarized in tables. The purpose of this information is to provide future guidance as to the manner and direction of effects new uses may potentially have on existing uses of the coast. Where negative impacts may be anticipated, proposals by proponents of the new uses should be required to analyze and address these potential effects.
1.5 ECONOMIC IMPACT MODELING APPROACHES AND MEASURES
1.5.1 IMPLAN Models
To estimate the economic contributions of the marine sectors, the economic models used rely on the IMPLAN I-O modeling system. IMPLAN is a proprietary data and modeling software system, originally designed by the U.S. Forest Service that enables users to construct input-output type economic impact models for virtually any defined region in the United States. In addition to being comprehensive and widely used and accepted, IMPLAN models can be modified by modelers to account for local conditions and characteristics.
Two separate regional economic models were constructed:
Coastwide Model: includes Clallam, Jefferson, Grays Harbor, Pacific, and Wahkiahkum Counties
Statewide Model: includes the entire state of Washington
The first model provides estimates of the economic contribution of identified sectors to the coastal-region economy. It can also be used to estimate the economic impact of proposed uses. The second model provides estimates of contributions by coastal sector to the economy of Washington State as a whole.
Much of the effort in building, verifying, and modifying regional economic models involves calibrating components
WHY MODEL THE COAST AS A COLLECTION OF COUNTIES AND NOT AS FIVE INDIVIDUAL ONES?
It is possible to generate a regional model to analyze any desired level of direct effects: state, county, sub-county region, port, or even individual business level (subject to confidentiality restrictions). It makes better sense, however, to model geographic areas that somewhat resemble “functional economic regions” that incorporate places where commuters live, work, and shop.
For an analysis of the Washington coast region, because the populations and economies of the five individual coastal counties are so small, it makes sense to explicitly capture the economic linkages between adjacent counties rather than to artificially isolate each county’s economy from the others. Furthermore, the small populations of the individual counties means that sales leakage rates for individual counties are high and the resulting economic multipliers are quite small.
This study strives to capture the interconnectedness of the Washington coast economy in order to achieve a scale and level of detail adequate to examine the variety of marine-based economic activities being analyzed.
1-14 | Introduction Washington Coastal Marine Advisory Council

Economic Analysis to Support Marine Spatial Planning in Washington
for the commercial fisheries, recreational fisheries, and aquaculture sectors. These models are used to estimate economic contributions and to draw inferences regarding the new use scenarios.
The economic models were constructed specifically from recent economic data and calibrated to represent economies in the coastal region. IMPLAN data for Washington counties were purchased and models were constructed of the Washington coast region, consisting of the five coastal counties, plus a statewide model. Basic verification of the data in the models was done by comparing industry employment and/or payroll totals underlying the IMPLAN models with other county-level employment and payroll estimates. Spending levels associated with current direct activity levels in the key marine sectors were estimated and distributed among receiving industries according to expenditure profiles (percentage distributions) adapted from other relevant economic impact studies. The resulting expenditure distributions were applied to the corresponding regional economic models to estimate the total economic contribution of the marine sectors to the coastal region and state-level economies.
Additional time and effort were spent validating and calibrating data in the basic models to more accurately capture actual economic conditions. Enhanced data on local supply, demand, and purchasing patterns were gathered from interviews with key industry informants engaged in marine sector activities in study-area communities. For example, participants in the commercial fishing sector were interviewed to identify the locations of their input suppliers and places of residence of their workforce. These factors are a key consideration in determining the locus of economic multiplier effects. Information from these contacts and interviews was used to adjust marine sector purchasing patterns in the economic models, including industry purchases of goods, services, and labor inputs. These adjustments improve the depth and accuracy of the resulting economic contribution estimates.
In addition to these expenditure questions, sector participants were asked for any information they may have on the place of residence of those participating in local recreational activities, including fishing. Of key interest is the proportion of recreational participants who are local residents, in which case expenditures on recreational activities may substitute for other spending in the local economy, versus the proportion who are visitors from outside the region, in which case spending is more like “new” money entering the local economy. Another important information collection effort entailed querying processors and distributors of aquacultural products and seafood caught in commercial and tribal fisheries for information regarding the end markets for their products. The proportion of seafood sales that flow to secondary processors or consumer markets located locally or in neighboring regions affects the magnitude and distribution of local economic contributions.
WHY DOESN’T THE COASTWIDE MODEL INCLUDE JUST THE COASTAL AREA?
Three of the five counties in the Coastwide Model contain major portions that are away from the coast. Clallam County’s largest city is Port Angeles, on the Strait of Juan de Fuca. Nearly all of Jefferson County’s population lives east of the Olympic Mountains, on Hood Canal or the northeast Olympic Peninsula. No part of Wahkiakum County contains Washington coastline.
The answer lies primarily in the fact that most of the relevant data are tabulated at the county level and not at smaller geographic units within counties. Furthermore, a significant component of the economy of Wahkiakum County (or Port Angeles in Clallam County) relies on or is tied to activities that occur on the coast. Using the larger functional economic region of the five counties in the Coastwide Model doesn’t compromise the ability to attribute economic impacts to the originating county or port (subject to confidentiality restrictions).
Washington Coastal Marine Advisory Council Introduction | 1-15
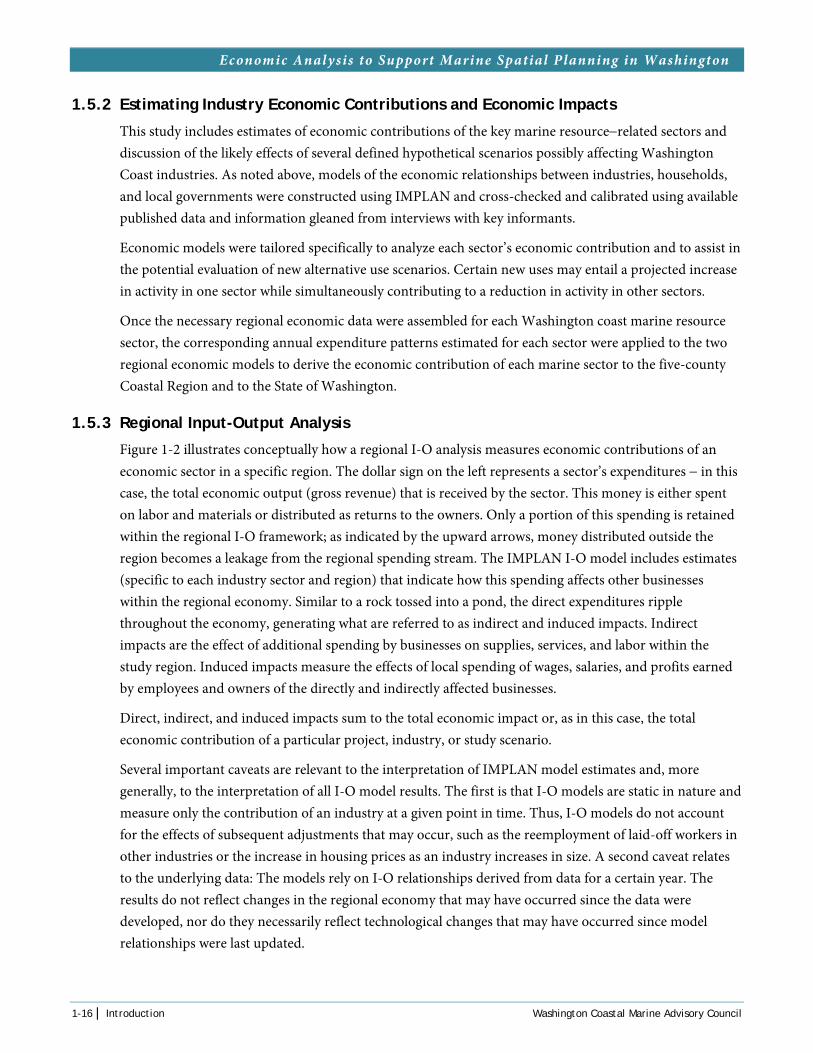
Economic Analysis to Support Marine Spatial Planning in Washington
1.5.2 Estimating Industry Economic Contributions and Economic Impacts
This study includes estimates of economic contributions of the key marine resource−related sectors and discussion of the likely effects of several defined hypothetical scenarios possibly affecting Washington Coast industries. As noted above, models of the economic relationships between industries, households, and local governments were constructed using IMPLAN and cross-checked and calibrated using available published data and information gleaned from interviews with key informants.
Economic models were tailored specifically to analyze each sector’s economic contribution and to assist in the potential evaluation of new alternative use scenarios. Certain new uses may entail a projected increase in activity in one sector while simultaneously contributing to a reduction in activity in other sectors.
Once the necessary regional economic data were assembled for each Washington coast marine resource sector, the corresponding annual expenditure patterns estimated for each sector were applied to the two regional economic models to derive the economic contribution of each marine sector to the five-county Coastal Region and to the State of Washington.
1.5.3 Regional Input-Output Analysis
Figure 1-2 illustrates conceptually how a regional I-O analysis measures economic contributions of an economic sector in a specific region. The dollar sign on the left represents a sector’s expenditures − in this case, the total economic output (gross revenue) that is received by the sector. This money is either spent on labor and materials or distributed as returns to the owners. Only a portion of this spending is retained within the regional I-O framework; as indicated by the upward arrows, money distributed outside the region becomes a leakage from the regional spending stream. The IMPLAN I-O model includes estimates (specific to each industry sector and region) that indicate how this spending affects other businesses within the regional economy. Similar to a rock tossed into a pond, the direct expenditures ripple throughout the economy, generating what are referred to as indirect and induced impacts. Indirect impacts are the effect of additional spending by businesses on supplies, services, and labor within the study region. Induced impacts measure the effects of local spending of wages, salaries, and profits earned by employees and owners of the directly and indirectly affected businesses.
Direct, indirect, and induced impacts sum to the total economic impact or, as in this case, the total economic contribution of a particular project, industry, or study scenario.
Several important caveats are relevant to the interpretation of IMPLAN model estimates and, more generally, to the interpretation of all I-O model results. The first is that I-O models are static in nature and measure only the contribution of an industry at a given point in time. Thus, I-O models do not account for the effects of subsequent adjustments that may occur, such as the reemployment of laid-off workers in other industries or the increase in housing prices as an industry increases in size. A second caveat relates to the underlying data: The models rely on I-O relationships derived from data for a certain year. The results do not reflect changes in the regional economy that may have occurred since the data were developed, nor do they necessarily reflect technological changes that may have occurred since model relationships were last updated.
1-16 | Introduction Washington Coastal Marine Advisory Council

Economic Analysis to Support Marine Spatial Planning in Washington
Figure 1-2 Illustration of Regional Economic Impacts, Leakage, and Multiplier Effects Source: Northern Economics, Inc. 2013.
Additional caveats are particular to IMPLAN. IMPLAN defines fairly detailed industry sectors (440 sectors in the 2012 data version), although not all may be represented in a given region. For each industry sector, IMPLAN has developed a “cost of production” function that utilizes, to varying degrees, the outputs of other sectors in the region. While an IMPLAN model includes a vast amount of economic information specific to the region in which an industry exists, a single average cost-of-production function for each industry sector is used across all regions of the United States. In other words, the cost-of-production function used to capture the economic effects of the fish harvesting industry is essentially the same, whether the sector is harvesting lobster in Maine, jigging for cod in Alaska, or trawling for Pacific whiting off the Washington Coast. This concern, in turn, drives the need to collect data that represent local fishing and seafood processing industries’ actual spending patterns in the study area in order to improve the accuracy and reliability of model results.
WHY USE ANNUAL IMPLAN DATA FOR 2012 RATHER THAN MORE RECENT 2013 DATA?
At the time the regional economic contribution modeling was conducted for this project, IMPLAN had recently released new economic data for year 2013. Normally, it’s considered best practice to either use the most recent economic data available or choose a data year that best represents the regional economy over the period being analyzed.
The 2013 IMPLAN data, however, include a transition by the data developers to a new sectoring format that was not fully “field-tested” and yielded some inconsistent data for certain industry sectors.
Therefore, for this project, the economic consultants decided to use 2012 data, which are based on a data format and estimation method that have been in use for the past 7 or 8 years.
Washington Coastal Marine Advisory Council Introduction | 1-17
Economic Analysis to Support Marine Spatial Planning in Washington
It should also be noted that, while the estimates of economic contribution or impact produced in this analysis are generally reliable enough for descriptive purposes, they are not designed to be used as decision variables to compare trade-offs between alternatives or industry sectors.
REFERENCES
Dean Runyan Associates. 2011. Washington State Travel Impacts 1991-2010. Prepared for Washington State Department of Commerce Tourism Office. Portland, OR.
Earth Economics. 2015. Economic Analysis of Outdoor Recreation in Washington State. Prepared for Washington State Recreation and Conservation Office. January 2015.
ICF Technology. 1988. Economic Impacts and Net Economic Values Associated with Non-Indian Salmon and Sturgeon Fisheries. Prepared for Washington Department of Community Development. March 8, 1988.
Industrial Economics. 2014. Marine Sector Analysis Report: Recreation and Tourism. Prepared for Washington Coastal Marine Advisory Committee. Cambridge, MA.
Northern Economics, Inc. 2013. Economic Impact of Shellfish Aquaculture in Washington, Oregon, and California. Prepared for the Pacific Shellfish Insitute. Available at: www.pacshell.org/pdf/ Economic_Impact_of_Shellfish_Aquaculture_2013.pdf.
Point 97 and Surfrider Foundation (2015). An Economic and Spatial Baseline of Coastal Recreation in Washington. Report to the Washington Department of Natural Resources. Portland, Oregon.
TCW Economics. 2008. Economic Analysis of the Non-Treaty Commercial and Recreational Fisheries in Washington State. December 2008. Sacramento, CA. With technical assistance from The Research Group, Corvallis, OR.
The Research Group. 1991. Oregon Angler Study. Prepared for the Oregon Department of Fish and Wildlife.
U.S. Department of Commerce/NOAA/NMFS. 1994. Guidelines and Principles for Social Impact Analysis. Prepared by Interorganizational Committee on Guidelines and Principles for Social Impact Analysis. Available at: www.nmfs.noaa.gov/sfa/social_impact_guide.htm. Accessed: January 2015.
IMAGES
Chapter 1 Header Image: (cc)Richard Wilson, Ph.D 2004, Another Morning on the Palix. Retrieved May 6, 2015, from: www.flickr.com/photos/76798465@N00/343173953
Page 1-5: Frank Kovalchek, 2013. Reflections in Neah Bay harbor. Retrieved July 6, 2015, from: www.flickr.com/photos/72213316@N00/9926729314
1-18 | Introduction Washington Coastal Marine Advisory Council
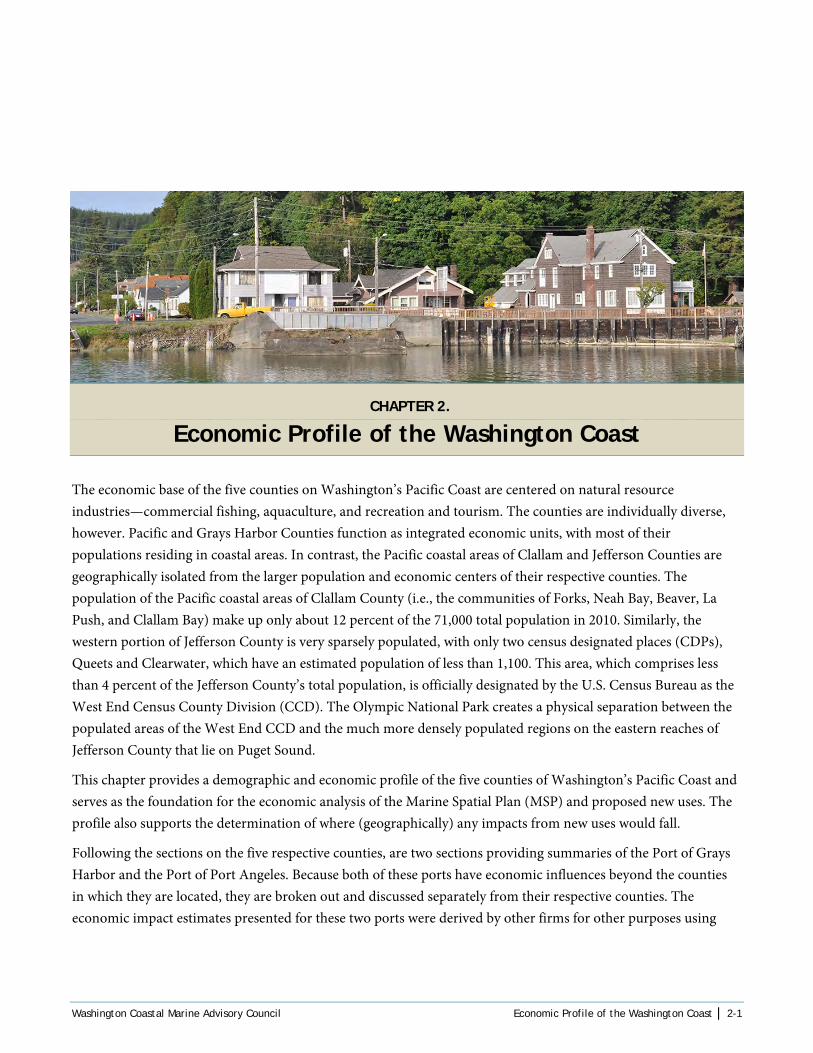
CHAPTER 2. Economic Profile of the Washington Coast
The economic base of the five counties on Washington’s Pacific Coast are centered on natural resource industries—commercial fishing, aquaculture, and recreation and tourism. The counties are individually diverse, however. Pacific and Grays Harbor Counties function as integrated economic units, with most of their populations residing in coastal areas. In contrast, the Pacific coastal areas of Clallam and Jefferson Counties are geographically isolated from the larger population and economic centers of their respective counties. The population of the Pacific coastal areas of Clallam County (i.e., the communities of Forks, Neah Bay, Beaver, La Push, and Clallam Bay) make up only about 12 percent of the 71,000 total population in 2010. Similarly, the western portion of Jefferson County is very sparsely populated, with only two census designated places (CDPs), Queets and Clearwater, which have an estimated population of less than 1,100. This area, which comprises less than 4 percent of the Jefferson County’s total population, is officially designated by the U.S. Census Bureau as the West End Census County Division (CCD). The Olympic National Park creates a physical separation between the populated areas of the West End CCD and the much more densely populated regions on the eastern reaches of Jefferson County that lie on Puget Sound.
This chapter provides a demographic and economic profile of the five counties of Washington’s Pacific Coast and serves as the foundation for the economic analysis of the Marine Spatial Plan (MSP) and proposed new uses. The profile also supports the determination of where (geographically) any impacts from new uses would fall.
Following the sections on the five respective counties, are two sections providing summaries of the Port of Grays Harbor and the Port of Port Angeles. Because both of these ports have economic influences beyond the counties in which they are located, they are broken out and discussed separately from their respective counties. The economic impact estimates presented for these two ports were derived by other firms for other purposes using
Washington Coastal Marine Advisory Council Economic Profile of the Washington Coast | 2-1
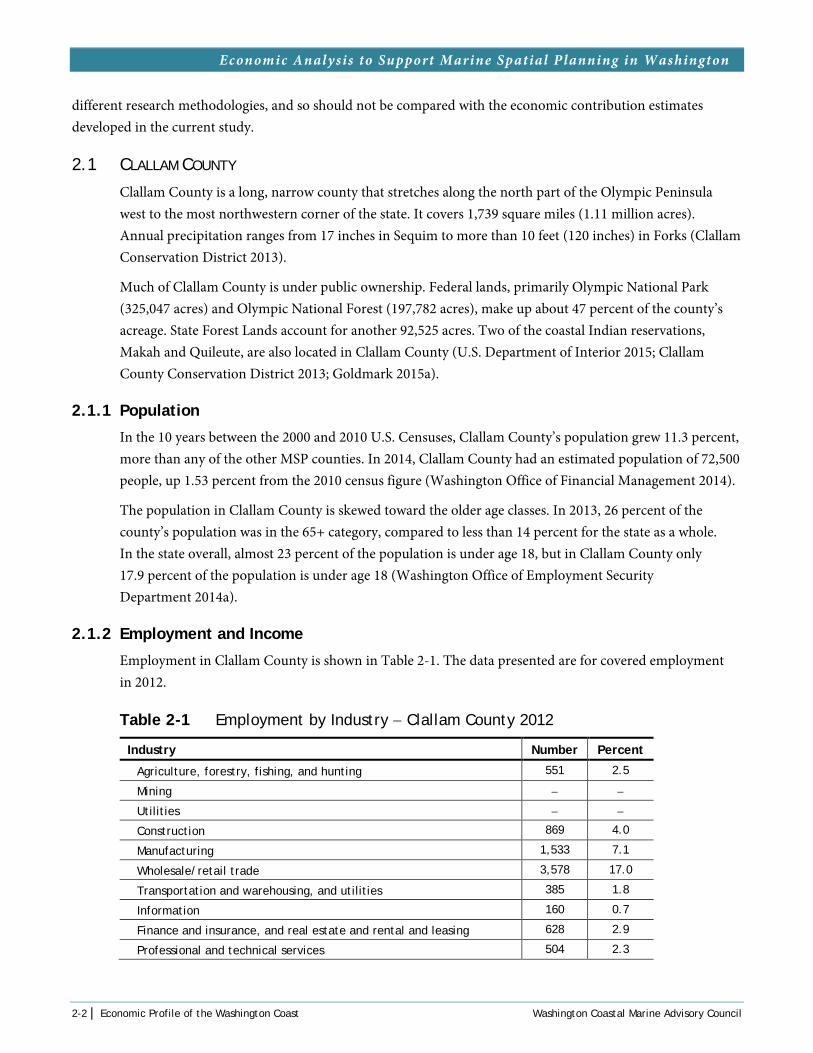
Economic Analysis to Support Marine Spatial Planning in Washington
different research methodologies, and so should not be compared with the economic contribution estimates developed in the current study.
2.1 CLALLAM COUNTY
Clallam County is a long, narrow county that stretches along the north part of the Olympic Peninsula west to the most northwestern corner of the state. It covers 1,739 square miles (1.11 million acres). Annual precipitation ranges from 17 inches in Sequim to more than 10 feet (120 inches) in Forks (Clallam Conservation District 2013).
Much of Clallam County is under public ownership. Federal lands, primarily Olympic National Park (325,047 acres) and Olympic National Forest (197,782 acres), make up about 47 percent of the county’s acreage. State Forest Lands account for another 92,525 acres. Two of the coastal Indian reservations, Makah and Quileute, are also located in Clallam County (U.S. Department of Interior 2015; Clallam County Conservation District 2013; Goldmark 2015a).
2.1.1 Population
In the 10 years between the 2000 and 2010 U.S. Censuses, Clallam County’s population grew 11.3 percent, more than any of the other MSP counties. In 2014, Clallam County had an estimated population of 72,500 people, up 1.53 percent from the 2010 census figure (Washington Office of Financial Management 2014).
The population in Clallam County is skewed toward the older age classes. In 2013, 26 percent of the county’s population was in the 65+ category, compared to less than 14 percent for the state as a whole. In the state overall, almost 23 percent of the population is under age 18, but in Clallam County only 17.9 percent of the population is under age 18 (Washington Office of Employment Security Department 2014a).
2.1.2 Employment and Income
Employment in Clallam County is shown in Table 2-1. The data presented are for covered employment in 2012.
Table 2-1 Employment by Industry − Clallam County 2012
Industry Number Percent
Agriculture, forestry, fishing, and hunting 551 2.5
Mining − −
Utilities − −
Construction 869 4.0
Manufacturing 1,533 7.1
Wholesale/retail trade 3,578 17.0
Transportation and warehousing, and utilities 385 1.8
Information 160 0.7
Finance and insurance, and real estate and rental and leasing 628 2.9
Professional and technical services 504 2.3
2-2 | Economic Profile of the Washington Coast Washington Coastal Marine Advisory Council

Economic Analysis to Support Marine Spatial Planning in Washington
Industry Number Percent
Management of companies and enterprises 147 0.7
Administrative and waste management services 379 1.8
Educational services 52 0.2
Health care and social assistance 2,309 10.7
Arts, entertainment, and recreation 132 0.6
Accommodation and food services 2178 10.1
Other services, except public administration 1,133 5.2
Government 7,061 32.7
Not classified elsewhere 24 0.1
Total Employed 21,621 100.0
Source: Washington Office of Financial Management 2014.
The report Washington’s Working Coast looked at location quotients1 to compare concentrations of jobs in the coastal counties relative to the state as whole (University of Washington 2013). Jobs in the accommodation and food service sector and in the government sector were more concentrated in Clallam County than in the state as a whole. In the other five industry groups used in that study (agriculture, forestry, and fishing; manufacturing; wholesale trade; transportation and warehousing; and arts, entertainment, and recreation), Clallam County jobs were less concentrated than those in Washington as a whole (University of Washington 2013).
In 2013, the average annual wage for jobs in Clallam County was $35,340, which is significantly below below the state average annual wage of $53,029 in that year (Washington Employment Security Department 2014a).
In 2012, per capita personal income, which includes earned income, investment income, and government payments (e.g., Social Security, Veterans Benefits), was $38,545 for Clallam County, again lower than the state average of $46,045 (Washington Employment Security Department 2014a).
2.1.3 Economic Development Goals and Plans
Clallam County has two primary economic development organizations. One is the Peninsula Development District (PDD), a nonprofit corporation formed in 1984 that includes representatives of Clallam and Jefferson Counties, tribes, cities, chambers of commerce, ports, and other economic
1 Location quotient is an economic measure that is particularly useful for quantifying the concentration of a specific job or industry in a geographic region. Specifically, the location quotient calculates how concentrated jobs are with respect to a larger comparison area (in this case, the state of Washington). The data are presented in percentage concentration terms; a 100-percent location quotient would mean that the industry’s job concentration is equal to that of the comparison area. A location quotient greater than 100 percent indicates that the industry is more concentrated than the comparison area.
Washington Coastal Marine Advisory Council Economic Profile of the Washington Coast | 2-3

Economic Analysis to Support Marine Spatial Planning in Washington
development organizations. The other group is the Clallam County Economic Development Council. Documents from both of these groups were reviewed for this chapter of the report.
The PDD’s stated vision is as follows (PDD n.d.):
The North Olympic Peninsula will become a region noted for its highly educated and trained workforce, healthy citizens who are positively engaged with their communities, a sound physical infrastructure, a diverse and dynamic economic base, and the local and regional capacity to be economically self-sustaining.
The PDD developed a Comprehensive Economic Development Strategy 2011-2015 (CEDS) that analyzes potential economic development strategies for the Olympic Peninsula. The report discusses the transition from the historical economy of this part of the Olympic Peninsula—one with a heavy reliance on the forestry, wood products, and fishing—to a more diverse economy. For Clallam County, the focus for the future economy is on these industry clusters:
Innovative Manufacturing
Marine Services
Natural Resources (Forestry and Agriculture)
Renewable Energy
Tourism
Education
Healthcare
Building and Construction.
In analyzing the economic strengths of the region, the PDD highlighted the following features:
Strong and growing infrastructure, including expansion of broadband.
Higher education and workforce training, which is considered a necessity to keep the local workforce employed in a changing economy. One example is the composite manufacturing program at Peninsula College (offered only at the Port Angeles campus).
Job retention and expansion by looking at new ways to use resources. One example was a biomass project using timber slash that previously would have been left in the forest or burned. While this was actually a Jefferson County project, it could have potential application to other counties in the MSP area.
Innovative and diverse workforce across the region.
(cc) Frank Kovalchek, 2013
Marina at Neah Bay
2-4 | Economic Profile of the Washington Coast Washington Coastal Marine Advisory Council

Economic Analysis to Support Marine Spatial Planning in Washington
Challenges to economic development were also identified in the CEDS document:
It has become more difficult for the small business sector to obtain loans. To help small business funding, the Olympic Finance Development Authority was formed; this organization uses micro-funding resources and partners with local banks.
Transportation issues were also identified as challenges to economic development. The region has limited access on roads, with U.S. Highway 101 being the only highway in the area. Seattle tourists are also dependent on the ferry service. Mudslides, bridge closures, and cancelled ferries were identified as barriers to development of the region’s economic resources. Various alternative transportation options (e.g., water transportation for supplies) are being explored by the PDD.
The Clallam County Economic Development Council (Clallam EDC) describes its mission as follows (Clallam EDC 2014):
The Clallam EDC’s mission is to “set the table” for economic growth; to identify, understand and align the economic drivers throughout the County; and to be the advocate for Clallam County commerce.
In its strategy report, the council identified what were considered to be the county’s assets and advantages. Recognizing that many of these assets and advantages apply more to the Strait of Juan de Fuca north coast, some apply to the west end as well:
Location and condition of the Port Angeles Harbor;
Well-established commercial and sport fishing industries;
Proximity to Olympic National Park and other tourism sites;
Climate and location are attractive to retirement sector of population; and
Good telecommunications infrastructure, which will improve with a project to extend better broadband service to the west side of the county.
The challenges to economic development identified in the Clallam EDC’s strategy document echoed many of those identified in the CEDS document (e.g., limitation of having a single highway, lack of financing) but also included lack of natural gas service and lack of rail service.
The Clallam EDC focuses on business retention and expansion. In its 2014 Annual Report, the council provided examples of accomplishments in 2014. Although the bulk of the examples were in Port Angeles and Sequim, a few examples were from locations in the more western part of the county. One was helping a company in Forks build a brewery that would use water from the Hoh Rain Forest (Clallam EDC 2015).
2.2 JEFFERSON COUNTY
Jefferson County is located on the Olympic Peninsula south of Clallam County. The county is slightly more than 1,800 square miles (1.15 million acres), with much of that land in public ownership. Federal lands, primarily Olympic National Park (538,849 acres) and Olympic National Forest (166,299 acres)
Washington Coastal Marine Advisory Council Economic Profile of the Washington Coast | 2-5

Economic Analysis to Support Marine Spatial Planning in Washington
make up for about 61 percent of the county’s total acreage. State Forest Lands account for another 14,703 acres. The Hoh Reservation and a small corner of the Quinault Reservation are also in Jefferson County (U.S. Department of Interior 2015; Goldmark 2015b).
2.2.1 Population
In the 10 years between the 2000 and 2010 U.S. Censuses, Jefferson County population grew 13.6 percent, the fastest growth during that period among the five MSP counties. In 2014, the county had an estimated population of 30,700, up 2.8 percent from the 2010 census figure. Again, this was the fastest-growing of the five counties during this 4-year period (Washington Office of Financial Management 2014).
The population in Jefferson County is skewed toward the older age classes more than any of the other four counties. In 2013, more than 30 percent of the county’s population was in the 65+ category, compared to less than 14 percent for the state as a whole. In the state overall, almost 23 percent of the population is under age 18, but in in Jefferson County less than 14 percent are under that age (Washington Office of Employment Security Department. 2014b).
2.2.2 Employment and Income
Table 2-2 shows covered employment in Jefferson County in 2012.
Table 2-2 Employment by Industry − Jefferson County 2012
Industry Number Percent
Agriculture, forestry, fishing, and hunting 128 1.7
Mining − −
Utilities 46 0.6
Construction 378 4.9
Manufacturing 624 8.1
Wholesale/retail trade 1,113 14.0
Transportation and warehousing, and utilities − −
Information 131 1.7
Finance and insurance, and real estate and rental and leasing 286 7.7
Professional and technical services 238 3.1
Management of companies and enterprises − −
Administrative and waste management services 139 1.8
Educational services 147 1.9
Health care and social assistance 832 10.7
Arts, entertainment, and recreation 87 1.1
Accommodation and food services 993 12.8
Other services, except public administration 462 6.0
Government 2,096 27.1
Not elsewhere classified 47 0.6
Total Employed 7,746 100.0
Source: Washington Office of Financial Management 2014.
2-6 | Economic Profile of the Washington Coast Washington Coastal Marine Advisory Council

Economic Analysis to Support Marine Spatial Planning in Washington
Looking at the Washington’s Working Coast location quotients to compare concentrations of jobs in Jefferson County relative to the state as whole, all but two sectors were less concentrated than in the state. The accommodations and food services sector and the government sector were significantly more concentrated in Jefferson County (University of Washington 2013).
In 2013, the average annual wage for jobs in Jefferson County was $34,497, which was far below the state average annual wage of $53,029 in that year (Washington Employment Security Department 2014b).
In 2012, per capita personal income, which includes earned income, investment income, and government payments (e.g., Social Security, Veterans Benefits), was $44,946 for Jefferson County, not far below the state average of $46,045 (Washington Employment Security Department 2014b).
2.2.3 Economic Development Goals and Plans
Jefferson County is part of the PDD, a nonprofit corporation formed in 1984 that includes representatives of Clallam and Jefferson Counties, tribes, cities, chambers of commerce, ports, and other economic development organizations.
In the PDD’s CEDS 2011-2015 for Jefferson County (PDD n.d.), the focus for the future economy is on the following industry clusters:
Innovative manufacturing,
Arts and culture,
Education,
Food and farm,
Forest industries,
Healthcare,
Marine trades,
Building and construction,
Tourism, and
Advanced technology and manufacturing.
As discussed above for Clallam County, the perceived strengths of the two-county region are a strong infrastructure, good education and workforce training designed to meet the needs of local industries, potential for biomass projects, and diversity and skills of the local workforce. Also as discussed previously, the challenges to economic development in this region tend to be lack of financing and transportation issues.
In Jefferson County, a volunteer organization called Team Jefferson plays a role in economic development. Team Jefferson is the state-designated EDC for Jefferson County. This group was involved in the $55-million green energy (biomass) project at Port Townsend Paper (EDC Team Jefferson 2015).
Team Jefferson is working to increase access to investment capital in the county. The Local Investment Opportunities Network has invested nearly $2 million into local projects. Another group, Landworks, invests in forest and farmland. Team Jefferson has also established the new Olympic Finance Development Authority as another means to funnel investment to the local economy.
Washington Coastal Marine Advisory Council Economic Profile of the Washington Coast | 2-7

Economic Analysis to Support Marine Spatial Planning in Washington
2.3 GRAYS HARBOR COUNTY
Grays Harbor County covers a land area of slightly more than 1,900 square miles (1.22 million acres), the largest of the five MSP counties. The county has diverse topography, with the Olympic Mountains on the northern border, the Pacific coastline on the west, and steep foothills in much of the rest of the area, except for river valleys of the Chehalis, Satsop, Wynoochee, Wishkah, Hoquiam, and Humptulips Rivers. At the mouth of the Chehalis River, the Grays Harbor Estuary covers 58,000 acres and extends inland about 25 miles.
Relative to the two more northern counties, Clallam and Jefferson, a much smaller share of Grays Harbor County is under public ownership. Federal lands, primarily Olympic National Forest (138,724 acres) and a small part of Olympic National Park (6,662 acres) make up about 12 percent of the county’s acreage. The Washington Department of Natural Resources (DNR) manages about 31,300 acres of State Forest Lands in Grays Harbor County (Goldmark 2015c).
Portions of two Indian reservations, the Quinault and Chehalis, are located in Grays Harbor County. Most of the Quinault Reservation is in Grays Harbor County, except for a small portion in Jefferson County. The reservation covers slightly more than 10 percent of the total county land area. The Chehalis, a small reservation, is divided among Grays Harbor, Lewis, and Thurston Counties.
Slightly more than 60 percent of the Grays Harbor County population lives in the incorporated parts of the county. There are nine municipalities: Aberdeen, Cosmopolis, Elma, Hoquiam, McCleary, Montesano, Oakville, Ocean Shores, and Westport.
2.3.1 Population
In the 10 years between the 2000 and 2010 U.S. Censuses, the Grays Harbor County population grew 8.3 percent. In 2014, Gray Harbor County had an estimated population of 73,300 people, up less than 1 percent from the 2010 census figure (Washington Office of Financial Management 2014).
The population in Grays Harbor is somewhat skewed toward the older age classes, but not as much as other MSP counties. A little more than 18 percent of the county’s population was in the 65+ category, compared to less than 14 percent for the state as a whole. In the state overall, almost 23 percent of the population is under age 18. Grays Harbor County comes close to mirroring the state profile with 21 percent of the population under age 18 (Washington Office of Employment Security Department. 2014b).
2-8 | Economic Profile of the Washington Coast Washington Coastal Marine Advisory Council

Economic Analysis to Support Marine Spatial Planning in Washington
2.3.2 Employment and Income
Employment in Grays Harbor County is shown in Table 2-3. The data presented are for covered employment in 2012.
Table 2-3 Employment by Industry − Grays Harbor County 2012
Industry Number Percent
Agriculture, forestry, fishing, and hunting 685 3.1
Mining − −
Utilities 34 0.2
Construction 793 3.6
Manufacturing 2,791 12.7
Wholesale/retail trade 3,139 14.0
Transportation and warehousing, and utilities 532 2.4
Information 215 1.0
Finance and insurance, and real estate and rental and leasing 753 3.4
Professional and technical services 431 2.0
Management of companies and enterprises 88 0.4
Administrative and waste management services 536 2.4
Educational services − −
Health care and social assistance 2,375 10.8
Arts, entertainment, and recreation 176 0.8
Accommodation and food services 1,966 8.9
Other services, except public administration 1,421 6.5
Government 6,028 27.4
Not elsewhere classified 44 0.2
Total Employed 22,007 100.0
Source: Washington Office of Financial Management 2014.
As discussed above, the report Washington’s Working Coast looked at location quotients to compare concentrations of jobs in the coastal counties relative to the state as whole. Jobs in Grays Harbor County had higher concentrations relative to the state in all but three sectors. Wholesale trade and arts, entertainment, and recreation were significantly less concentrated in Grays Harbor County. The transportation and warehousing sector was slightly less concentrated relative to state levels (University of Washington 2013).
In 2013, the average annual wage for jobs in Grays Harbor County was $35,884, which is significantly lower than the state average annual wage of $53,029 in that year (Washington Employment Security Department 2014c).
In 2012, per capita personal income, which includes earned income, investment income, and government payments (e.g., Social Security, Veterans Benefits), was $31,848 for Grays Harbor County, again lower than the state average of $46,045 (Washington Employment Security Department 2014c).
Washington Coastal Marine Advisory Council Economic Profile of the Washington Coast | 2-9

Economic Analysis to Support Marine Spatial Planning in Washington
2.3.3 Economic Development Goals and Plans
In 1996, an economic analysis was conducted for Grays Harbor, Mason, Pacific, and Wahkiakum Counties. Following that report, the Columbia Pacific Resource Conservation and Economic Development District (ColPac), which covers those same four counties, was created. The stated mission of the ColPac is as follows:
The Columbia-Pacific Resource Conservation and Economic Development District promotes and engages regional partnerships to preserve and enhance our communities by creating economic opportunity and advocating sustainability and revitalization of the diverse area we serve. Grays Harbor County benefits from a well-established history of multi-jurisdictional collaborative efforts. This cooperative environment has fostered the development of a countywide economic development team to jointly participate in a wide variety of projects.
A critical output of the Economic Development District Planning Program is the CEDS document. Since 1998, the ColPac has become the lead agency for developing the CEDS document for the region.
The 2009 CEDS analyzed four natural resource−related industrial clusters considered integral to the Columbia-Pacific’s economy:
Forest products;
Fishing, fish processing, and related aquaculture (including clams and oysters);
Agriculture; and
Food products.
Three other industry clusters were also identified in the CEDS document:
High technology and light industry;
Tourism; and
Healthcare and retirement.
Grays Harbor County and the other counties in the ColPac continue to develop projects in these respective clusters.
Grays Harbor County highlighted its success in the tourism cluster with its year-end review for 2014, documenting increased hotel/motel tax revenues and taxable retail sales (Greater Grays Harbor 2015).
The Port of Grays Harbor is the only deepwater port on the west coast of Washington and is 2 days closer to Asia than Puget Sound ports. This locational advantage, along with other advantages, has enabled the port to expand beyond traditional
(cc) Richard Wilson, PhD, 2009
Shellfish farming
2-10 | Economic Profile of the Washington Coast Washington Coastal Marine Advisory Council

Economic Analysis to Support Marine Spatial Planning in Washington
commodity shipments. Because the Port of Grays Harbor has economic impacts beyond the boundaries of Grays Harbor County, a separate section on economic impacts from the port is included at the end of this chapter.
2.4 PACIFIC COUNTY
Pacific County is 596,902 acres or about 933 square miles in size, bordered by the Pacific Ocean to the west and the Columbia River on the south. It borders Grays Harbor County to the north, Lewis County to the south, and Wahkiakum County to the southeast. Pacific County includes the Long Beach Peninsula, which wraps around Willapa Bay, a highly productive shellfish farming area. Cape Shoalwater, on the northwest part of Willapa Bay, is the most active erosion area on the west coast of Washington. The eastern part of the county is predominantly timberlands (Pacific County 2010; Washington Office of Employment Security Department. 2014d).
Nearly all of the county (98.8 percent) is unincorporated. There are four incorporated cities in the county: Ilwaco, Long Beach, Raymond, and South Bend.
Less than 1 percent of Pacific County is under federal ownership but DNR-managed State Forest Lands account for 23,340 acres, about 4 percent of the total county acreage (U.S. Department of Interior 2015; Goldmark 2015d).
More than 70 percent, or close to 420,000 acres, of Pacific County is forested. Approximately 85 percent of this forestland is managed as commercial timberland by a few private companies, including Weyerhaeuser. The other 15 percent of Pacific County forestland is managed by DNR (Pacific County 2010). There are no federal forestlands in Pacific County.
In addition to the timber industry, fishing, aquaculture, farming, and tourism are the major sources of employment.
2.4.1 Population
In the 10 years between the 2000 and 2010 U.S. Censuses, the population of Pacific County declined by 0.3 percent, the only one of the five MSP counties to see a decline during that period. In 2014, Pacific County had an estimated population of 21,100, an increase of slightly less than 1 percent from the 2010 census figure (Washington Office of Financial Management 2014).
As in many of the coastal counties, the population in Pacific County is skewed toward the older age classes. More than 27 percent of the county’s population was in the 65+ category, compared to less than 14 percent for the state as a whole. In the state overall, almost 23 percent of the population is under age 18, but in in Pacific County only 17.3 percent are under that age (Washington Employment Security Department 2014d).
2.4.2 Employment and Income
Employment in Pacific County is shown in Table 2-4. The data presented are for covered employment in 2012.
Washington Coastal Marine Advisory Council Economic Profile of the Washington Coast | 2-11
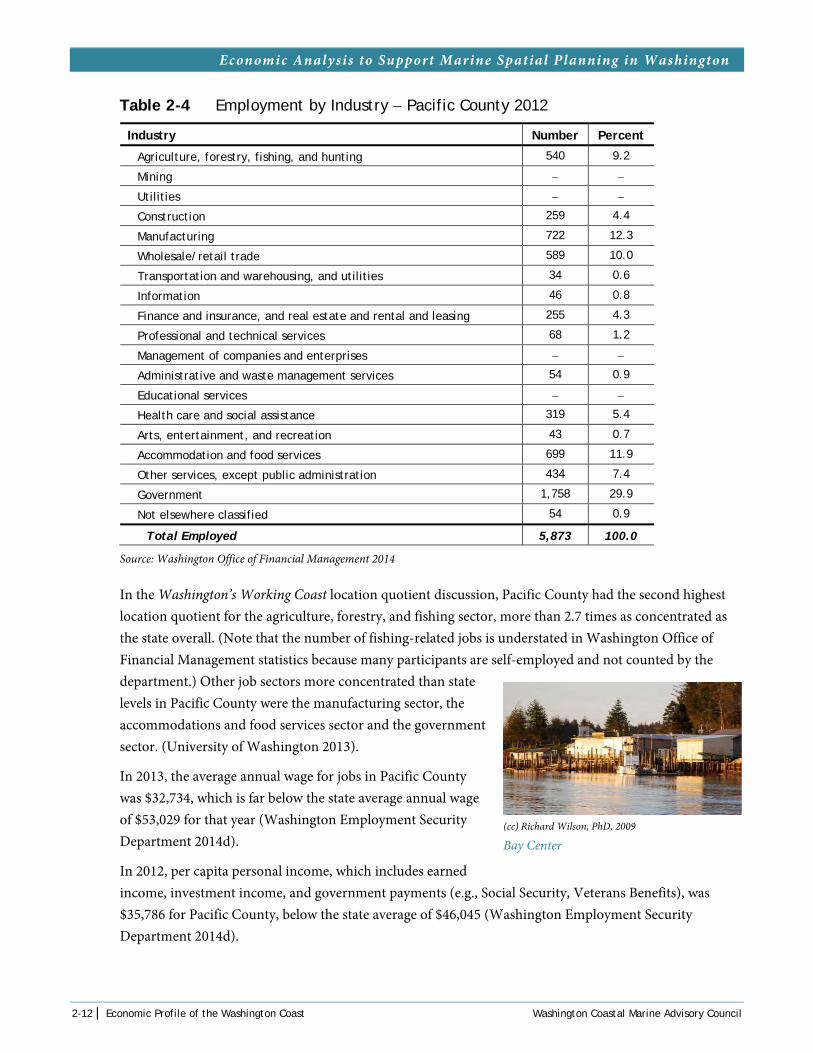
Economic Analysis to Support Marine Spatial Planning in Washington
Table 2-4 Employment by Industry − Pacific County 2012
Industry Number Percent
Agriculture, forestry, fishing, and hunting 540 9.2
Mining − −
Utilities − −
Construction 259 4.4
Manufacturing 722 12.3
Wholesale/retail trade 589 10.0
Transportation and warehousing, and utilities 34 0.6
Information 46 0.8
Finance and insurance, and real estate and rental and leasing 255 4.3
Professional and technical services 68 1.2
Management of companies and enterprises − −
Administrative and waste management services 54 0.9
Educational services − −
Health care and social assistance 319 5.4
Arts, entertainment, and recreation 43 0.7
Accommodation and food services 699 11.9
Other services, except public administration 434 7.4
Government 1,758 29.9
Not elsewhere classified 54 0.9
Total Employed 5,873 100.0
Source: Washington Office of Financial Management 2014
In the Washington’s Working Coast location quotient discussion, Pacific County had the second highest location quotient for the agriculture, forestry, and fishing sector, more than 2.7 times as concentrated as the state overall. (Note that the number of fishing-related jobs is understated in Washington Office of Financial Management statistics because many participants are self-employed and not counted by the department.) Other job sectors more concentrated than state levels in Pacific County were the manufacturing sector, the accommodations and food services sector and the government sector. (University of Washington 2013).
In 2013, the average annual wage for jobs in Pacific County was $32,734, which is far below the state average annual wage of $53,029 for that year (Washington Employment Security Department 2014d).
In 2012, per capita personal income, which includes earned income, investment income, and government payments (e.g., Social Security, Veterans Benefits), was $35,786 for Pacific County, below the state average of $46,045 (Washington Employment Security Department 2014d).
(cc) Richard Wilson, PhD, 2009
Bay Center
2-12 | Economic Profile of the Washington Coast Washington Coastal Marine Advisory Council
Economic Analysis to Support Marine Spatial Planning in Washington
2.4.3 Economic Development Goals and Plans
In Pacific County’s Comprehensive Plan Update 2010 to 2030, the county presented a vision statement that was developed through public workshops (Pacific County 2010):
Pacific County seeks to maintain and enhance a rural life-style by promoting long-term development of commercially viable agricultural, aquaculture, forest and fisheries resources; by reducing conflicts between residential, commercial, industrial, and farming activities; by conserving economic resources and promoting economic development that is compatible with the area's resources; and by promoting the safety, health and general welfare of all the residents.
2.5 WAHKIAKUM COUNTY
Wahkiakum County is small in size relative to the other MSP counties, encompassing only 263 square miles. The county, with a western boundary approximately 15 miles from the Pacific Ocean, is heavily forested, and logging is the major industry.
Wahkiakum County has no federal lands but DNR-managed State Forest Lands account for 12,841 acres or about 8 percent of the total acres (U.S. Department of Interior 2015; Goldmark 2015e).
The town of Cathlamet is not only the county seat but also the only incorporated community in the county.
2.5.1 Population
In the 10 years between the 2000 and 2010 U.S. Censuses, the population of Wahkiakum County grew 4 percent. In 2014, Wahkiakum County had an estimated population of 4,010, an increase of slightly less than 1 percent from the 2010 census figure but still the least populated county in the state. About 500 people live in Cathlamet; the rest of the population lives in the unincorporated parts of the county (Washington Office of Financial Management 2014).
The Wahkiakum County population is also skewed toward the older age classes. Almost 30 percent of the county’s population was in the 65+ category, compared to less than 14 percent for the state as a whole. In the state overall, almost 23 percent of the population is under age 18 but, in in Pacific County only about 18 percent are under that age (Washington Employment Security Department 2015e).
2.5.2 Employment and Income
Employment in Wahkiakum County is shown in Table 2-5. The data presented are for covered employment in 2012.
Washington Coastal Marine Advisory Council Economic Profile of the Washington Coast | 2-13

Economic Analysis to Support Marine Spatial Planning in Washington
Table 2-5 Employment by Industry − Wahkiakum County 2012
Industry Number Percent
Agriculture, forestry, fishing and hunting 144 20.9
Mining − −
Utilities − −
Construction 42 6.1
Manufacturing 28 4.1
Wholesale/retail trade 54 9.0
Transportation and warehousing, and utilities − −
Information 19 2.8
Finance and insurance, and real estate and rental and leasing 18 2.6
Professional and technical services 10 1.4
Management of companies and enterprises − −
Administrative and waste management services 24 3.5
Educational services − −
Health care and social assistance 4 6.4
Arts, entertainment, and recreation − −
Accommodation and food services 28 4.1
Other services, except public administration 24 3.5
Government 247 35.8
Not elsewhere classified 9 1.3
Total Employed 690 100.0
Source: Washington Office of Financial Management 2014.
In the Washington’s Working Coast location quotient discussion, Wahkiakum County had the highest location quotient for the agriculture, forestry, and fishing sector, more than five times as concentrated as the state overall. The only other job sector in Wahkikum County more concentrated than state levels was the government sector (University of Washington 2013).
In 2013, the average annual wage for jobs in Wahkiakum County was $33,690, which is far below the state average annual wage of $53,029 for that year (Washington Employment Security Department 2015).
In 2012, per capita personal income, which includes earned income, investment income, and government payments (e.g., Social Security, Veterans Benefits), was $33,374 for Wahkiakum County, below the state average of $46,045 (Washington Employment Security Department 2015).
2.5.3 Economic Development Goals and Plans
Wahkiakum County is part of the Southwest Washington Economic Development Commission, which also includes Cowlitz and Lewis Counties. A 2014-2018 CEDS report was prepared by this group. In the CEDS, Wahkiakum County was identified as having a competitive advantage in:
Forest and wood products,
Defense and security,
2-14 | Economic Profile of the Washington Coast Washington Coastal Marine Advisory Council

Economic Analysis to Support Marine Spatial Planning in Washington
Education and knowledge creation,
Energy (fossil and renewable),
Machinery manufacturing,
Printing and publishing,
Arts, entertainment, recreation and visitor industries, and
Fabricated metal product manufacturing.
In this same CEDS document it was noted that Wahkiakum County, which experienced economic setbacks in the past few year due to declines in timber sales, restrictions on commercial fishing and more generally the recent recession, is expanding efforts in the tourism sector. New tourism-oriented businesses in Cathlamet and along the river in Skamokawa were noted as recent efforts to increase tourism (Southwest Washington Economic Development Commission n.d.).
2.6 ECONOMIC IMPACTS ASSOCIATED WITH SHIPPING FROM GRAYS HARBOR
The Port of Grays Harbor and activities associated with that port play a major role in the economy of the Washington coast. The port also has economic impacts for non-coastal parts of Washington.
This summary of the economic impacts associated with the Port of Grays Harbor draws primarily from two recently completed port and shipping studies. The first study is The 2013 Economic Impact of the Port of Grays Harbor, completed by Martin Associates in October 2014. The second study is Washington Coast Marine Spatial Planning Assessment of Shipping Sector, completed by BST Associates in August 2014.
A third recently completed study, Washington State Maritime Cluster, prepared by Community Attributes, Inc., was also reviewed for this section. Their study focused more broadly on the importance of the maritime industry across Washington, without many specifics about the Port of Grays Harbor. The report demonstrates the interdependencies of companies within the marine cluster, and the broad range of occupations required to support this cluster (Community Attributes 2013).
The 2014 report by Martin Associates focuses specifically on the Port of Grays Harbor. The goal of the report was to measure economic impacts associated with three types of waterborne activity at the port:
Marine cargo activity, which includes waterborne cargo moving through Port of Grays Harbor facilities (i.e., facilities owned and operated by the Port of Grays Harbor and facilities leased to private operators);
Fishing activity at the Port of Grays Harbor Westport Marina, which includes the impacts generated by purchases of supplies, shipyard services, equipment and fishing gear, insurance, and legal services by fishing vessels using the Port of Grays Harbor Westport Marina; and
Marina activity, which includes recreational boats that are moored at Westport Marina, as well as transient recreational boating activity and charter fishing activity operated at Westport Marina (Martin Associates 2014).
Washington Coastal Marine Advisory Council Economic Profile of the Washington Coast | 2-15

Economic Analysis to Support Marine Spatial Planning in Washington
For purposes of this economic analysis to support MSP, only the economic impacts associated with marine cargo activities are presented from the Martin Associates report. Economic impacts associated with commercial fishing and recreational fishing are addressed elsewhere in this report.
The BST Associates report provides an overview of Pacific Northwest (PNW) trade patterns as well as changes expected in these trade patterns. It also presents cargo forecasts for container cargo, neobulk/breakbulk, grain, dry bulks, and liquid bulks for the PNW ports as a whole, with limited specific details about the Port of Grays Harbor. The report was developed to consider the potential conflicts between shipping along the coast of Washington and development of offshore energy in this same area. As such, it focuses on vessels shipping to and from a number of ports, not only Grays Harbor.
2.6.1 Marine Cargo Impacts from the Port of Grays Harbor
In the Martin Associates model, cargo moving through the Port of Grays Harbor generates state and local economic impacts in four business sectors:
Surface Transportation Sector: This sector includes railroads and trucking. Railroads are particularly important in moving grain and autos from the Midwest to the port for export. Trucks are used for moving wood products (logs and chips) and liquid bulk commodities. Trucks are also used for moving imported automobiles to California for auctions.
Maritime Service Sector: This sector includes a wide variety of services, including:
Cargo Marine Transportation: Firms that provide the logistics of overland and water transportation (e.g., freight forwarders);
Vessel Operations: Pilots to assist vessels, chandlers to provide supplies to the ships, towing firms for tug assist, bunkering firms that provide fuel, marine surveyors, shipyard repair companies and construction firms;
Cargo Handling: Longshoremen, stevedoring firms, and terminal operators; and
Government Agencies: Federal, state, and local agencies that provide services to the port.
Port of Grays Harbor: This sector includes employees of the port itself.
Shippers/Consignees: This sector includes shippers and consignees that use the port for import and export of cargo from their businesses. Because this business category can use other ports in lieu of Grays Harbor, employment in this sector is considered to be “port related” but not ”port generated” in the model developed by Martin Associates.
The Martin Associates methodology was, in part, designed to help with port development planning. Results from the model can help a port decide on the best allocation of port land and facilities. Different commodities require different types of port facilities, and port planners need to understand the economic impacts associated with shipping different commodities to make decisions about future development of their ports.
2-16 | Economic Profile of the Washington Coast Washington Coastal Marine Advisory Council

Economic Analysis to Support Marine Spatial Planning in Washington
In 2013, 2.38 million metric tons of cargo moved through facilities owned by the Port of Grays Harbor owned.2 Of that tonnage, 1.36 million tons (about 57 percent) was soy meal and other bulk commodities. Automobiles accounted for 177,529 metric tons or 92,270 auto units (each auto unit is about 1.9 tons). Another 412,122 metric tons of forest products (log exports and chips) moved through the port in 2013. The two liquid bulk terminals (Westway Terminal and Imperium Renewables) handled 433,981 tons in 2013.
For the Port of Grays Harbor, Martin Associates modelled five commodities: chips, grain, automobiles, logs, and liquid bulk. Based on 2013 cargo levels, Martin Associates estimated total employment, personal income, business revenue, local purchases, and state and local taxes resulting from activity at the Port of Grays Harbor (Table 2-6).
Table 2-6 Economic Impacts Generated by the Port of Grays Harbor Marine Cargo Activities
Category
Jobs (number)
Direct 574
Indirect 645
Induced 305
Total Jobs 1,524
Personal Income ($1,000)
Direct $36,239
Indirect $79,654
Induced $14,860
Total Income $130,754
Business Revenue ($1,000) $143,488
Local Purchases ($1,000) $31,513
State and Local Taxes ($1,000) $12,291
Source: Martin Associates 2014.
The 574 direct jobs shown in Table 2-6, were divided further into the business sector categories discussed above (Table 2-7).
2 The Martin Associates model uses 2013 data. More recent data on cargo tonnage from the Port of Grays Harbor are available now, but the 2013 data from the Martin Associates report are presented here to maintain consistency with the results of that study.
Washington Coastal Marine Advisory Council Economic Profile of the Washington Coast | 2-17

Economic Analysis to Support Marine Spatial Planning in Washington
Table 2-7 Direct Jobs for the Port of Grays Harbor Cargo Activities
Job Category Direct Jobs
Surface Transportation
Rail 128
Truck 57
Maritime Services
Terminal Employees 212
ILWU/Dockworkers 87
Towing 17
Pilots 3
Agents 5
Maritime Services 5
Government 12
Construction 15
Port of Grays Harbor 33
Total 574
Note: ILWU = International Longshore and Warehouse Uunion
Source: Martin Associates 2014.
Of those 574 direct jobs, 94 percent were held by Grays Harbor residents. Another 3.6 percent were held by residents of Pacific, Mason, and Thurston combined. Around 2 percent were from other parts of Washington.
Table 2-6 shows $143.5 million of direct business revenue generated; this is defined as “direct business revenue as received by the firms directly dependent on the Port and providing maritime services and inland transportation services to the cargo handled at the marine terminals and the vessels calling on the port.” The biggest share of this direct business revenue is received by railroads. The Port of Grays Harbor, the terminal services, and the trucking companies receive the next biggest share.
The Martin Associates study was able to allocate most of the direct revenues to specific commodity groups, as shown in Table 2-8.
2-18 | Economic Profile of the Washington Coast Washington Coastal Marine Advisory Council
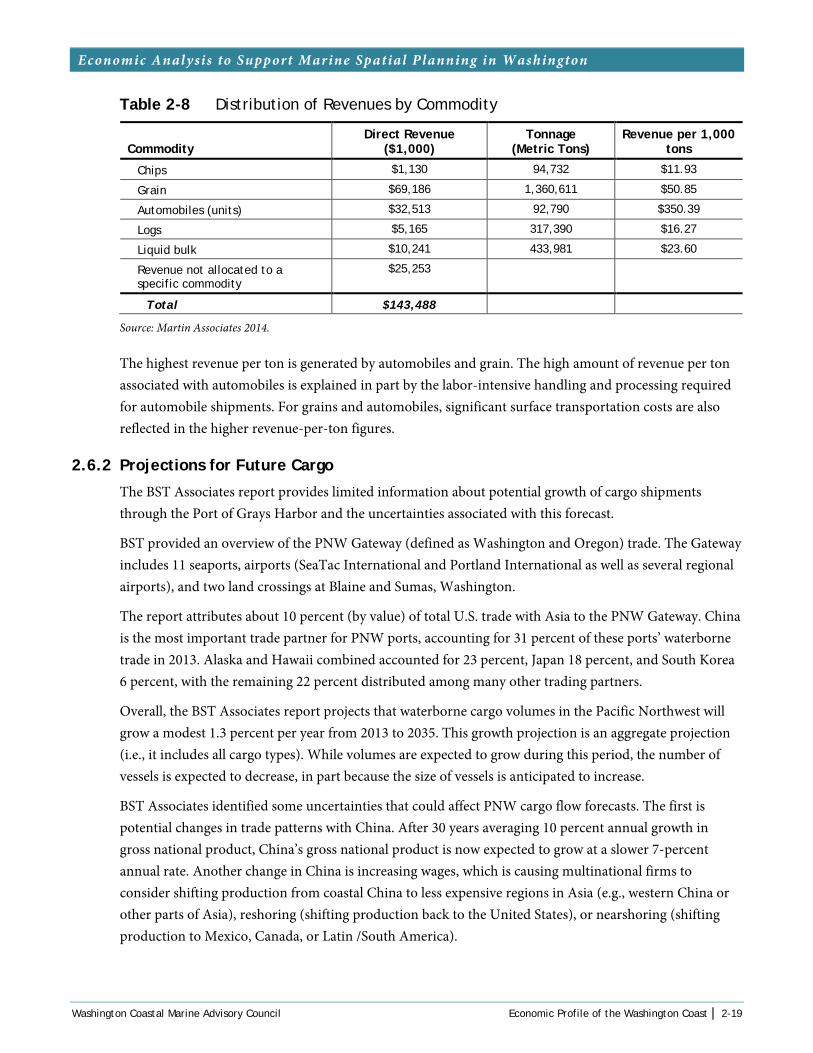
Economic Analysis to Support Marine Spatial Planning in Washington
Table 2-8 Distribution of Revenues by Commodity
Commodity Direct Revenue
($1,000) Tonnage
(Metric Tons) Revenue per 1,000
tons
Chips $1,130 94,732 $11.93
Grain $69,186 1,360,611 $50.85
Automobiles (units) $32,513 92,790 $350.39
Logs $5,165 317,390 $16.27
Liquid bulk $10,241 433,981 $23.60
Revenue not allocated to a specific commodity
$25,253
Total $143,488
Source: Martin Associates 2014.
The highest revenue per ton is generated by automobiles and grain. The high amount of revenue per ton associated with automobiles is explained in part by the labor-intensive handling and processing required for automobile shipments. For grains and automobiles, significant surface transportation costs are also reflected in the higher revenue-per-ton figures.
2.6.2 Projections for Future Cargo
The BST Associates report provides limited information about potential growth of cargo shipments through the Port of Grays Harbor and the uncertainties associated with this forecast.
BST provided an overview of the PNW Gateway (defined as Washington and Oregon) trade. The Gateway includes 11 seaports, airports (SeaTac International and Portland International as well as several regional airports), and two land crossings at Blaine and Sumas, Washington.
The report attributes about 10 percent (by value) of total U.S. trade with Asia to the PNW Gateway. China is the most important trade partner for PNW ports, accounting for 31 percent of these ports’ waterborne trade in 2013. Alaska and Hawaii combined accounted for 23 percent, Japan 18 percent, and South Korea 6 percent, with the remaining 22 percent distributed among many other trading partners.
Overall, the BST Associates report projects that waterborne cargo volumes in the Pacific Northwest will grow a modest 1.3 percent per year from 2013 to 2035. This growth projection is an aggregate projection (i.e., it includes all cargo types). While volumes are expected to grow during this period, the number of vessels is expected to decrease, in part because the size of vessels is anticipated to increase.
BST Associates identified some uncertainties that could affect PNW cargo flow forecasts. The first is potential changes in trade patterns with China. After 30 years averaging 10 percent annual growth in gross national product, China’s gross national product is now expected to grow at a slower 7-percent annual rate. Another change in China is increasing wages, which is causing multinational firms to consider shifting production from coastal China to less expensive regions in Asia (e.g., western China or other parts of Asia), reshoring (shifting production back to the United States), or nearshoring (shifting production to Mexico, Canada, or Latin /South America).
Washington Coastal Marine Advisory Council Economic Profile of the Washington Coast | 2-19

Economic Analysis to Support Marine Spatial Planning in Washington
Shifting production to other parts of Asia could shift vessel traffic to the Suez Canal. Reshoring and nearshoring would eliminate waterborne shipments to and from China. All of these changes would have potential negative impacts on container trade through the PNW ports, although so far only limited impacts on trade have been seen.
The BST Associates report also notes that rising income in Asia is creating demand for U.S. products, which would be an offsetting factor because more exports of containerized and non-containerized products would move to China and other parts of Asia.
Another area of uncertainty in forecasting cargo movements to and from PNW ports is the ever-changing energy sector. The BST Associates report addressed the growth of oil production in the Bakken region of North Dakota and Montana, which increased faster than expected. This growth took place in tandem with declining production in Alaska. Ten-year forecasts from the Alaska Department of Revenue show a continued decline in oil production (Alaska Department of Revenue 2013).
Recent changes in oil prices and production around the world have thrown additional uncertainty into even these recent forecasts.
BST Associates also provides PNW cargo forecasts by commodity handling group. Groups most relevant to the Port of Grays Harbor are summarized briefly below.
Grain and Oilseed
BST Associates reported that exports of grain and oilseed through PNW ports doubled between 2002 and 2010. Several factors account for this increase: Demand has increased in Asia, the Columbia River navigation channel was deepened to 43 feet, inland agricultural production of grains and oilseed increased, and ocean freight rates became more favorable.
BST Associates noted a significant increase in soybean exports from PNW ports as the demand for vegetable oil for foods, protein meal for animals, and biodiesel use increased. Soybeans are a relatively new export for the Port of Grays Harbor.
Overall, BST Associates forecasts a 2.2-percent increase in grain/oilseed exports between 2013 and 2035.
Liquid Bulk
The largest volumes of liquid bulk trade in the PNW are in crude oil and refined products. As crude oil production has shifted from Alaska to supplies from Canada and the Bakken region of the United States, Puget Sound refineries are receiving more crude oil by rail rather than by water.
This trend of declining waterborne shipments of petroleum products (mostly refined products) is projected to continue in the short term, then stabilize. BST Associates forecasts a negative 0.4-percent growth rate (a decrease of 0.4 percent) from 2013 to 2035. Proposed oil transfer (rail to vessel) projects in Portland, Vancouver, and Grays Harbor, however, could affect this forecast for those specific areas.
2-20 | Economic Profile of the Washington Coast Washington Coastal Marine Advisory Council

Economic Analysis to Support Marine Spatial Planning in Washington
Neobulk/Breakbulk
Neobulk, which includes automobiles and logs, is an important part of the Port of Gray Harbor trade. Automobile export is a recent trade activity for the port, while log export has a long tradition at the port.
Neobulk/breakbulk trade from PNW ports hit bottom in 2008 but is now above pre-recession levels. BST Associates projects an annual growth rate of 0.7 percent through 2035.
2.7 ECONOMIC IMPACTS ASSOCIATED WITH THE PORT OF PORT ANGELES
The Port of Port Angeles contracted for an economic impact study similar to that conducted for the Port of Grays Harbor. The study, conducted by BST Associates, analyzed the economic impacts associated with the port in calendar year 2012 (BST Associates November 2014).
In estimating the economic impacts, BST included all port properties and tenets operating on those properties. The port properties include:
Airports – William R Fairchild International Airport and Sekiu General Aviation Airport;
Marinas – Port Angeles Boat Haven, John Wayne Marina, the Boat Yard, and the Boat Ramp;
Marine Terminal – cargo operations, topside repair operations, and boat building and repair;
Log Yard; and
Rental properties including the Port’s industrial parks.
To estimate the direct impacts of business activities at the port, BST conducted a survey of tenants and users of the different port business identified above. They also contacted some firms in person to identify economic activities at the port. The survey and interview information combined with some other port records and employment data was used to develop estimates of direct and total impacts
The Boat Haven, the major marina at the port has both recreational and commercial vessels while the John Wayne marina is 100 percent recreational use. Because Chapter 6 Recreational Fishing does not extend as east to Port Angeles, the summary below of the BST Associates’ study includes impacts associated with the marina. Again, the methodologies used in the port studies, while similar in some ways, are different from the impact done in the current study. Therefore impact analysis in Chapters 4-8 should not be compare to that of the BST Associates study.
The next sections summarize BST findings for direct and total impacts by business. Only economic impacts in Clallam County are included here.
2.7.1 Impacts from Airports
Fairchild International airport is over 800 acres with 110 of that property in an industrial park. The airport is used by both commercial and private aircraft, and is considered critical to attract new economic
© Joseph Novak, 2008
Port Angeles
Washington Coastal Marine Advisory Council Economic Profile of the Washington Coast | 2-21

Economic Analysis to Support Marine Spatial Planning in Washington
development as well as sustain the existing businesses at Port Angeles. In addition to serving businesses it also plays a role in community services including as medical service flights and package and mail delivery.
The Sekiu airport which serves the west end of the county has nine hangar tenants but no other businesses. It is used for travelers coming to the Olympic Peninsula for recreational activities.
BST Associates estimated the direct jobs and income impacts in Clallam County and the total job and income impacts in Clallam County. They also estimated total job and income impacts in other parts of Washington but those are not included in Table 2-9.
Table 2-9 Economic Impacts Generated by the Port of Port Angeles Airports
Impact
Direct Jobs 86
Indirect and Induced Jobs 87
Total income (million $) 4.4
2.7.2 Impacts from Marinas
The Port of Port Angeles operates two marinas on the shores of the Strait of Juan de Fuca. There are only two other marinas in Clallam County—the Makah Tribe’s marina at Neah Bay and the Quileute Tribe’s marina at La Push.
The Boat Haven, located inside the Port of Port Angeles Harbor, has moorage space for 400 commercial and recreational boats. Boat slips range from 24 to 50 feet in length. A wide range of services are available at the Boat Haven including a boat yard with haul-out facilities. Private companies provide boat maintenance at the marina. In 2012 there were approximately 2,200 boat-nights at the Boat Haven.
A small number of commercial fishing vessels use moorage at the Boat Haven; BST Associates reported 26 commercial vessels at this marina in their 2014 report. The value of commercial fish landings at Port of Port Angeles/Sequim is small relative to the ports at Neah Bay and La Push. In 2013 Port Angeles/Sequim accounted for $8.6 million, 8 percent of overall commercial landings in Clallam County.
The John Wayne Marina, on Sequim Bay, has 300 permanent and 22 transient moorages for vessels up to 50 feet. In addition to the usual services (e.g., gas and diesel, pump-out, restrooms) the marina property includes a public meeting room, general store, clubhouse associated with the Sequim Bay Yacht Club, and a waterfront restaurant.
2-22 | Economic Profile of the Washington Coast Washington Coastal Marine Advisory Council

Economic Analysis to Support Marine Spatial Planning in Washington
Table 2-10 shows the economic impacts in Clallam County associated with the two marinas.
Table 2-10 Economic Impacts Generated by the Port of Port Angeles Marinas
Impact
Direct Jobs 421
Indirect and Induced Jobs 394
Total income (million $) 22.6
2.7.3 Impacts from Marine Terminals
The port has three primary deepwater marine terminals: T-1, T-2, and T-3.
Terminal 1 can accommodate vessels up to 1,200 feet and 125,000 deadweight tons. It is used for vessels under repair and also is often used by oil tankers transporting crude oil from Alaska to refineries in Anacortes, Cherry Point and Tacoma.
Terminal 2 is the ferry terminal, operated by Black Ball Ferry Line. Black Ball provides ferry service on the M/V COHO to Victoria, BC.
Terminal 3 is the main cargo terminal where forest products and other cargo is loaded for domestic and international deliveries. In 2012, 85 million board feet of timber, or approximately 32 percent of the overall timber harvest from Clallam County, moved through the Port of Port Angeles.
The port also owns several other terminals.
Terminal 4 is leased to High Tides Seafood Inc.
Terminal 5 is an unimproved facility used infrequently for transfer of chips and wood fiber.
Terminal 6, leased to Lakeside Industries, is an unimproved barge slip facility used for transferring aggregate rock.
Terminal 7 has not been used for 15 years. The uplands associated with this terminal are used for log yard operations.
Travel Lift Pier which supports the two marine Travelifts. These lifts are used by Platypus Marine, a recreational, commercial fishing, government and commercial vessel construction, repair, and maintenance facility (Platypus Marine website, 2015). The other Travelift is also used by Westport Shipyard, a Florida based company that builds and sells megayachts. Westport builds its 164 tri-deck model in Port Angeles.
Washington Coastal Marine Advisory Council Economic Profile of the Washington Coast | 2-23

Economic Analysis to Support Marine Spatial Planning in Washington
Table 2-11 shows the estimate economic impacts to Clallam County associated with the marine terminals.
Table 2-11 Economic Impacts Generated by the Port of Port Angeles Marine Terminals
Impact
Direct Jobs 924
Indirect and Induced Jobs 843
Total income (million $) 42.9
2.7.4 Impacts from Log Yard
The port owns and operates a log yard used by local mills to receive logs by truck or water and by log exporters. Table 2-12 shows the estimated impacts associate with the log yard operation.
Table 2-12 Economic Impacts Generated by the Port of Port Angeles Log Yard
Impact
Direct Jobs 88
Indirect and Induced Jobs 89
Total income (million $) 7.3
REFERENCES
Alaska Department of Revenue. 2013. Revenue Sources Book. Fall 2013.
BST Associates. 2014a. Washington Coast Marine Spatial Planning Assessments of Shipping Sector. August 2014.
BST Associates. 2014b. Port of Port Angeles 2012 Economic Impact Study Final Report. November 4, 2014.
Clallam Conservation District. 2013. 5-Year Plan (2013-2015). February 12, 2013.
Clallam County Economic Development Council. 2014. Strategic Direction 2014-2018. August 2014.
Clallam County Economic Development Council. 2015. 2014 Annual Report. January 2015.
Clallam EDC. See Clallam County Economic Development Council.
Columbia-Pacific Resource Conservation and Economic Development District. 2009. Comprehensive Economic Development Strategy for the Columbia-Pacific Region. June 2009.
Community Attributes, Inc. 2013. Washington State Marine Cluster, Economic Impact Study. November 2013.
2-24 | Economic Profile of the Washington Coast Washington Coastal Marine Advisory Council

Economic Analysis to Support Marine Spatial Planning in Washington
EDC Team Jefferson. Port Townsend Paper Mill Biomass Co-generation Facility. Available at: www.edcteamjefferson.com. Accessed May 14, 2015.
Goldmark, Peter. 2015a. Letter to Jim McEntire, Chair, Clallam County Board of Commissioners. April 28, 2015.
Goldmark, Peter. 2015b. Letter to David Sullivan, Chair, Jefferson County Board of Commissioners. April 28, 2015.
Goldmark, Peter. 2015c. Letter to Wes Cormier, Chair, Grays Harbor County County Board of Commissioners. April 28, 2015.
Goldmark, Peter. 2015d. Letter to Steve Rogers, Chair, Pacific County County Board of Commissioners. April 28, 2015.
Goldmark, Peter. 2015e. Letter to Mike Backman, Chair, Board of Wahkiakum County Commissioners. April 28, 2015.
Greater Grays Harbor, Inc. 2015. 2014 – Economic Vitality Index and Year in Review. May 15, 2015.
Martin Associates. 2014. The 2013 Economic Impact of the Port of Grays Harbor. October 2014.
Pacific County. 2010. Pacific County Comprehensive Plan Update 2010-2030. October 2010.
Peninsula Development District. n.d. Comprehensive Economic Development Strategy 2011-2015.
Platypus Marine. Company website. Available at: www.platypusmarine.com. Accessed May 2015.
Southwest Washington Economic Development Commission. n.d. Comprehensive Economic Development Plan, 2014-2018.
University of Washington. 2013. Washington’s Working Coast, An Analysis of the Washington Pacific Coast Marine Resource-Based Economy. Spring 2013.
U.S. Department of Interior. 2015. Payments in Lieu of Taxes, Fiscal Year 2014. Available at: www.doi.gov/pilt/county-payments.cfm. Accessed June 3, 2015.
Washington Office of Employment Security Department. 2014a. Clallam County Profile. Updated September 2014.
Washington Office of Employment Security Department. 2014b. Jefferson County Profile. Updated September 2014.
Washington Office of Employment Security Department. 2014c. Gray Harbor County Profile. Updated September 2014b.
Washington Office of Employment Security Department. 2014d. Pacific County Profile. Updated September 2014.
Washington Office of Employment Security Department. 2015. Wahkiakum County Profile. Updated January 2015.
Washington Coastal Marine Advisory Council Economic Profile of the Washington Coast | 2-25

Economic Analysis to Support Marine Spatial Planning in Washington
Washington Office of Financial Management. 2014. State of Washington 2014 Population Trends. Forecasting & Research Division. November 2014.
Washington Office of Financial Management. 2014. 2013 Data Book. January 2014.
IMAGES
Chapter 2 Header Image. (cc) Joe Mabel, 2009. Hoquiam River, Hoquiam, Washington, USA [Photograph]. Retrieved July5, 2015, from: https://commons.wikimedia.org/wiki/File:Hoquiam,_WA_-_river_02.jpg
Page 2-4: Joseph Novak, 2008. Logs float in the harbor near Port Angeles, Wa. awaiting transport to market or processing at the local paper mill. Nearby a fishing boat floats lazily by. Retrieved July 6, 2015 from: www.flickr.com/photos/josephleenovak/2569181581
Page 2-10: Richard Wilson, PhD, 2009. Picking and filling the 'tubs' with oysters for pickup at high tide. Retrieved July 6, 2015 from: www.flickr.com/photos/76798465@N00/4160183227
Page 2-12: Richard Wilson PhD, 2009. Morning sun on our dock at Bay Center. Retrieved July 6, 2015 from: www.flickr.com/photos/76798465@N00/4160174821
Page 2-22: Frank Kovalchek, 2013. Reflections in Neah Bay harbor. Retrieved July 6, 2015 from: www.flickr.com/photos/72213316@N00/9926729314
2-26 | Economic Profile of the Washington Coast Washington Coastal Marine Advisory Council

CHAPTER 3. Economic Profiles of Washington Coast Tribes
The Washington Marine Spatial Plan (MSP) Project planning area includes five Indian reservations shown in Figure 3-1:1
Makah,
Quileute,
Hoh,
Quinault, and
Shoalwater Bay
In many respects, there is considerable economic interaction among the tribes, tribal members, and the non-Indian communities on Washington’s coast. Commerce and employment are often co-mingled, as tribal members work and shop off-reservation, non-Indians are employed by the tribes, and many tourists and local residents alike visit tribally owned businesses. Furthermore, many natural resources off-reservation are co-managed by federal, state, and tribal entities through treaties between the United States and the respective tribes, executive orders, and federal court rulings. Yet important distinctions can be made about tribal communities that merit developing a profile separate from the non-tribal communities of the coast.
1 One other federally recognized tribal community is not included in this review. The Chehalis Reservation is on a watershed that drains to the ocean, but is not on the ocean, and is outside of the MSP study area.
Washington Coastal Marine Advisory Council Economic Profiles of Washington Coast Tribes | 3-1
Economic Analysis to Support Marine Spatial Planning in Washington
Tribal members and the communities in which they live are connected through culture and background. All federally recognized tribes have a government structure, with a constitution, government departments, and elected council or comparable body of different name. Additionally, tribal communities are organized around a structure and value system that focuses on the strength of their particular common culture and the benefits of community. Partly because of remote locations from business development, tribal government tends to be the largest employer, engaged in the well-being of tribal members through administrative services, natural resources management, health, education, housing, public utilities, and tribally owned or managed enterprises (such as a marina or resort). For the coastal tribes, for example, this includes, considerable investment in fish propagation facilities and fishery management programs, as well as coastal tourism facilities.
This chapter presents tribal profiles, describes economic development goals, and identifies future plans and challenges for each of the five reservations and their trust lands; as well as their treaty-reserved off-reservation lands and waters, which they co-manage. While some common themes can be noted—tribes are capitalizing on their scenic coastal environments to expand tourism business—many are focused on targeting education programs to better match employer needs or obtaining natural resource management grants to increase employment of tribal members, and many are facing flooding risks—each tribe has its unique resources and unique economic challenges. Furthermore, resource co-management responsibilities also require that the tribes survey, assess, monitor, and interact with their counterparts at the state and federal level, and thus a proportionally greater government role requiring additional staff resources.
Information presented in this chapter comes from a number of sources—published reports, census data, and personal interviews with tribal staff. Although each of the five tribes was contacted and invited to provide information, responses varied by tribe; the sections below are a reflection of each tribe’s “level of comfort” in terms of shared information. With respect to the census data, population and housing figures are from the 2010 U.S. Census (U.S. Census Bureau 2012). However the U.S. Census Bureau’s American Community Survey (ACS) is used for information on employment by industry (U.S. Census Bureau 2014). The ACS data include people over age 16 who are employed in civilian occupations on the respective reservation. Because of the small population, however, annual employment estimates do not provide a reliable perspective on long-term employment. Instead of providing annual data for small communities, the American Community Survey uses 60 months (5 years) of data. The 2009-2013 5-year figures are used to present employment by industry on the respective reservations.
3-2 | Economic Profiles of Washington Coast Tribes Washington Coastal Marine Advisory Council
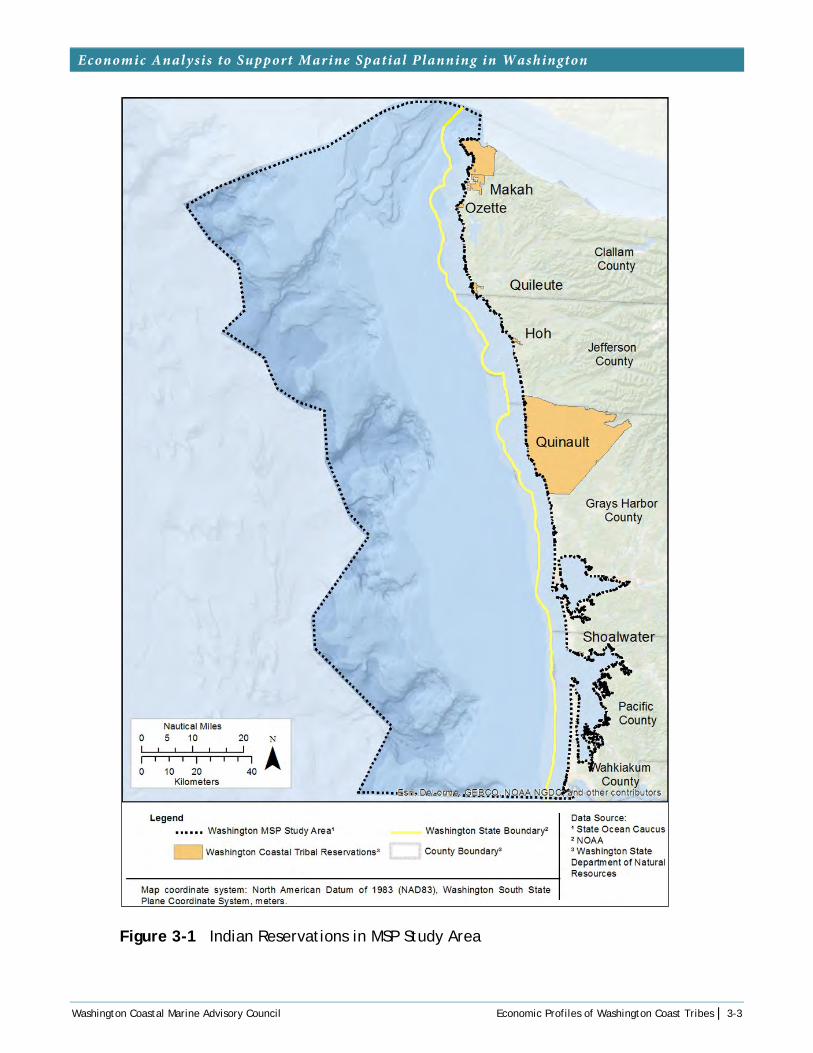
Economic Analysis to Support Marine Spatial Planning in Washington
Figure 3-1 Indian Reservations in MSP Study Area
Washington Coastal Marine Advisory Council Economic Profiles of Washington Coast Tribes | 3-3

Economic Analysis to Support Marine Spatial Planning in Washington
3.1 MAKAH
The Makah Reservation covers approximately 44 square miles (30,142 acres). All of this land except the 80 acres that are on Tatoosh and Waadah islands and the 740 acre Ozette Reservation 10 miles south of Neah Bay, are in one contiguous area at the northwest tip of the Olympic Peninsula (U.S. Department of Commerce 2015).
In addition to the land area, the 1855 Treaty of Neah Bay secured usual and accustomed fishing grounds rights (including whaling and sealing rights) for the Makah tribe, and the tribe’s usual and accustomed (U&A) fishing grounds were adjudicated in United States v. Washington, 626 F.Supp. 1405, 1467 (W.D. Wash. 1985). The boundaries of this U&A include United States waters in the western Strait of Juan de Fuca as well as open ocean areas of the Washington coast north of 48° 02′15″ latitude and east of 125° 22 44′00″ longitude (U.S. Department of Commerce 2015).
The reservation is physically isolated from the rest of Washington and even from other parts of Clallam County. The reservation has been accessible by road only since 1931. Neah Bay is the main community on the reservation and is located on the Strait of Juan de Fuca. Forks is 60 miles from Neah Bay. Port Angeles, the closest full service town, is 75 miles away and Seattle is 150 miles away (Northwest Portland Area Indian Health Board 2015b).
The area has harsh natural conditions; it receives more than 100 inches of rain a year and high winds. More than 40 percent of the reservation is on slopes exceeding 30 percent. The basic infrastructure for water and electricity is mostly within 5 miles of the main community, Neah Bay, and only about 6 percent of the roads are paved.
3.1.1 Population and Housing
According to the 2010 U.S. Census, there were 1,414 individuals living on the reservation (U.S. Census Bureau 2012). Tribal enrollment was 2,534 in 2005 (U.S. Department of Commerce 2015).
Table 3-1 shows the age distribution of the Makah Reservation population. The median age for the population on the reservation was 30.4 years in 2010.
Neah Bay is the only community on the Makah reservation with separate reported census data. In the 2010 census the Neah Bay Census Designated Place (CDP) had a population of 865 people, up almost 9 percent from its population of 794 in the 2000 census, but below the 919 reported in the 1990 census (U.S. Census Bureau 2012).
(cc) Sam Beebe, 2008
The Waatch River, Makah Reservation
3-4 | Economic Profiles of Washington Coast Tribes Washington Coastal Marine Advisory Council

Economic Analysis to Support Marine Spatial Planning in Washington
Table 3-1 Makah Indian Reservation Age Distribution
Age Group Number Percent
Under 5 years 128 9.1
5-19 years 363 25.7
19-64 years 790 55.9
65 and older 133 9.4
Total 1,414 100.00
Source: U.S. Census Bureau 2012.
The 2010 census reports a total of 497 occupied housing units on the reservation. Of these 347 (almost 70 percent) were identified as owner-occupied housing units. The average household size for owner occupied-housing was 2.87, slightly higher than that for rental units.
Since the 2010 census the Tribe has increased its housing stock. In 2014 the Makah Tribal Housing Department completed the Sail River Longhouse, a 21 unit housing project in Neah Bay targeting very low income families. The Longhouse Apartments provide housing to a population earning 30 percent or less of the area’s median income. Many in this population have had addiction problems in the past. After going through treatment they had no good housing situation to return to, which led to repeat addiction issues. According to the tribal housing director, a desire to break this link between addiction and homelessness was a major reason for developing the apartments (Serlin 2015).
The longhouse project is part of Sail River Heights, a larger mixed income project that began construction in 2010. The overall project covers 51 acres. The basic infrastructure for this acreage was completed in 2012 using funds from 13 different sources (Lawrence 2014).
In addition to the longhouse, the Salt River Heights project has 16 market-rate apartments and 72 lots for owner-occupied houses. As of July 2014, about 20 families were in the process of building or had completed building, houses on this property. Overall when the Sail River Heights project is completed it will increase the housing stock on the reservation by 25 percent.
3.1.2 Employment and Income
Table 3-2 provides the latest employment estimates for reservation employment by industry sectors. The figures are estimated from 60 months of data collected during the 2009-2013 period.
Table 3-2 Employment − Makah Reservation, 2009-2013
Industry Number Percent
Agriculture, forestry, fishing and hunting, and mining 100 18.6
Construction 12 2.2
Manufacturing 27 5.0
Wholesale Trade − −
Retail Trade 31 5.8
Transportation and warehousing, and utilities 17 3.2
Information 9 1.7
Washington Coastal Marine Advisory Council Economic Profiles of Washington Coast Tribes | 3-5

Economic Analysis to Support Marine Spatial Planning in Washington
Industry Number Percent
Finance and insurance, and real estate and rental and leasing 11 2.0
Professional, scientific, and management, and administrative and waste management services
25 4.6
Educational services, and health care and social assistance 95 17.7
Arts, entertainment, and recreation, and accommodation and food services
37 6.9
Other services, except public administration 9 1.7
Public administration 165 30.7
Total 538 100
Source: U.S. Census Bureau 2014.
The U.S. Census Bureau also estimates that, of the 538 jobs shown in the above table, 294 or almost 55 percent were government positions which includes tribal employees as well as other local, state and federal employees. Another 185 jobs or 34% were employed in the private sector. Self-employment, mostly in not incorporated businesses made up most of the remainder.
The ACS reports that the median earnings for workers on the Makah Reservation during the 2009-2013 period were $27,102.
While Table 3-2 provides information in a standard format similar to that provided for other tribes on the coast and for the county profiles, a better understanding of the Makah economy is found by looking at their current businesses and economic development goals for the future.
3.1.3 Current Reservation Businesses
Mike Rainey, Business Enterprise Manager for the Makah Tribe, described the economy of the Makah reservation as very dependent on two sectors: tourism and fishing. The current state of these two industries is discussed in the next sections.
Tourism
The Makah Reservation offers diverse opportunities to tourists. Neah Bay is said to offer some of the best saltwater fishing in the United States. The marina at Neah Bay serves as a base for one of Washington’s most important locations for charter halibut fishing. In 1995 a reported 85,000 people came to the reservation for sport fishing (Norman et al. 2007).
Other visitors come to hike the Cape Flattery Trail, a short 1.5-mile trail that takes hikers to the farthest most northwestern point in the continental United States and offers dramatic views of headlands, sea stacks and narrow coves (Washington Trail Association 2015).
The coastal waters around the reservation offer surfing, kayaking and diving opportunities. On its website, Emerald Sea Photography describes diving in Neah Bay: “While diving in Neah Bay is not for the feint of heart [sic] due to the serious currents and ocean swell it is without a doubt, some of the best diving in the
© Janet Baker, 2015
Cape Flattery
3-6 | Economic Profiles of Washington Coast Tribes Washington Coastal Marine Advisory Council

Economic Analysis to Support Marine Spatial Planning in Washington
Pacific Northwest. The visibility is usually fantastic and the diversity of life beneath the azure waters is simply stunning” (Emerald Sea Photography 2015).
The following sections discuss businesses associated with tourism, both tribal enterprises and other businesses on the reservation, and the opportunities to grow these businesses.
Tourist-Related Tribal Enterprises
There are currently four tourism-related tribal enterprises on the Makah Reservations:
Warmhouse Restaurant in Neah Bay
Cape Resort: The resort includes a recreational vehicle (RV) park and campground. There are 39 RV sites; 30 have electric hookups. There is also an undesignated campsite.2 In addition there are two bunkhouses that can each sleep eight people and 10 cabins.
Hobuck Beach Resort: The resort is at the west end of the reservation at the end of State Route (SR) 112. On the north end of the beach is a large meadow with an undesignated campsite; that area can accommodate 500 tents. There are also 10 cabins on the north end. The south end of the beach has 10 RV sites with full hookups. The resort also rents surfboards, paddleboards, kayak, and bikes.
Makah Mini-Mart: The tribe owns this market in Neah Bay. In addition to groceries, the market has a delicatessen and serves pizza.
According to Rainey, these four tribal enterprises currently employ 55 people but many of these are laid off during winter when the tourism business slows down. Many of the staff members need to find second or third jobs to survive the off season.
The tribe’s goal is to offer tourists more reasons to come to the reservation in the off season and broaden the tourist attractions to encourage visits of longer. This would this increase business revenues, create year-round job opportunities enabling the tribe to attract better employees for the tribal enterprises (M. Rainey, pers. comm., 2015).
The tribe is particularly interested in attracting more kayakers and divers because participants in these sports tend to spend more dollars on the reservation relative to surfers. In fall 2014, the tribe purchased kayaks and wetsuits for the resorts, hoping to attract more winter kayakers.
In addition, the tribe is trying to attract more diverse kinds of tourists, for example, birders during the off season. The Audubon Society’s Great Washington State Bird Trail, Olympic Loop, includes two sites on the Makah Reservation—Hobuck Beach and Cape Flattery. The guide to this loop discusses birds that can be seen in winter as well as birds other times of year (Audubon Society 2012).
2 The tent area is a grassy area without assigned sites, so there is no official number of sites. A contact at the resort said they once had as many as a couple hundred tents in May (F. Corpuz, pers. comm., 2015).
Washington Coastal Marine Advisory Council Economic Profiles of Washington Coast Tribes | 3-7

Economic Analysis to Support Marine Spatial Planning in Washington
The tribe is having some success with its efforts to expand tourism year round. The four tribal enterprises are generating 36 percent more revenue now compared to revenues 3 years ago. Occupancy rates at the two resorts are 100 percent during the April-September tourist season. During the off-season from October-March, however, they are 30 percent booked. Cape Resort used to be closed 7 months of the year; now it is open year round. The resort has visitors coming every weekend including birders, surfers, kayakers and divers.
Year-round business at the tribal resort-oriented enterprises would allow the tribe to increase revenues an estimated 30-40 percent from current levels (M. Rainey, pers. comm., 2015).
Other Tourist Businesses
In addition to the four tribal enterprises, there are other visitor attractions and services located on the reservation. The Makah Museum which is part of the Makah Cultural and Research Center, is another attraction for people visiting the reservation. The research center is funded by public and private grants, museum ticket sales, and museum store sales; only about 4 percent of the operating revenues come from the tribal council budget. The museum houses 300 to 500-year-old artifacts from the Ozette archaeological site as well as other pieces and photographs relating to tribal history. Between 2007 and 2011, the Makah Cultural and Research Center drew and average of 11,200 non-Makah visitors (U.S. Department of Commerce 2015).
Chartered fishing trips are another tourist draw for the reservation. The Makah Marina website lists three charter services listed: Big Salmon Resort, Snow Creek Resort, and Excel Fishing Charters.
Washington Department of Fish and Wildlife (WDFW) gathers information on charter boat angler days for Neah Bay shown in Table 3-3.
Table 3-3 Charter Boat Angler Days − Neah Bay
Year Halibut Bottomfish Salmon Dive Total 2009 1,091 388 503 41 2,023
2010 744 420 434 0 1,599
2011 714 484 01 4 1,703
2012 358 481 765 18 1,621
2013 131 576 970 0 1,677
Source: Washington Department of Fish and Wildlife 2015.
© Audubon Society, 2006
Audubon Birding Trail Map
3-8 | Economic Profiles of Washington Coast Tribes Washington Coastal Marine Advisory Council

Economic Analysis to Support Marine Spatial Planning in Washington
Charter boat fishing clients come local, statewide, national and international markets. Rainey estimated the following distribution:
Local (Olympic Peninsula): 40%
Seattle and rest of Washington: 40%
Rest of the United States: 15%
International (including Canada): 5%
Commercial Fishing
About 70 commercial fishing vessels (including three charter boats) operate out of Neah Bay. These vessels are owned by individual tribal members; they are not part of the tribal enterprises. (M. Rainey, pers. comm., 2015). Information provided to authors of the 2015 draft EIS for hunting gray whales indicated about 515 jobs were associated with these vessels owned and operated by Makah tribal members. This was a 2011 estimate and included vessel skippers, deckhands and river set-net fisherman (U.S. Department of Commerce 2015).
Although the tribe owns the marina property, it leases out individual slips but this is not counted as a tribal enterprise.
More information on the economic benefits of commercial fishing are described in Chapter 4, Washington Coast Commercial Fisheries.
Cape Flattery Fishermen’s Co-op
At the Cape Flattery Fishermen’s Co-op they recently set up a small processing plant. Many years ago the tribe had processing plant that failed. Many tribal members remember this failure and have been resistant to trying processing again so they are trying it again on a small scale (M. Rainey, pers. comm., 2015).
Port of Neah Bay – Commercial Fish Buyer Business
The Makah Tribe owns the commercial fishing dock in Neah Bay on the Strait of Juan de Fuca and recently completed major upgrades to this facility.3 In the application for the U.S. Economic Development Administration (EDA), which provided part of the funds to upgrade the dock, the tribe stated the upgrades would help retain 420 jobs. In addition to saving fishing- related jobs, the dock improvements are expected to improve oil response capabilities for the North Olympic Peninsula by providing a safe dock for response vessels (Gottlieb 2012).
In 2014 the old dock was demolished and a new concrete dock was built. In addition, the new dock facility has two offices, a hoist, and an ice plant capable of making 52 tons per day with ice storage capacity of 110
3 Makah tribal members use the facility to house vessels that operate in waters of the Pacific Ocean, the Strait of Juan de Fuca, or both.
Washington Coastal Marine Advisory Council Economic Profiles of Washington Coast Tribes | 3-9

Economic Analysis to Support Marine Spatial Planning in Washington
tons. There are two icing stations, one on the north face of the dock, one on the east face. Each can deliver 30 tons of flake ice per hour (Fisherman’s News 2015).
Before completion of the new fish dock and associated facilities at Neah Bay were completed, the tribe requested proposals for use of the fish buying stations with office space (Walker 2014).
Other Industries
Commercial Film Industry
Recently a new economic opportunity has emerged for the Makah Tribe—attracting film producers for television shows and movies who want to film their shows on the reservation. In 2014, eight films were made on the Makah Reservation.
The state media office fielded 22 requests for filming made in 2014; nine films were actually produced in other parts of Washington. These figures do not include the filming on the Makah Reservation. One stated advantage for filming on reservation lands is the relatively few regulatory restrictions. For example, a film crew wanting to film in a national park or on state lands, may take years to obtain all the necessary permits. The Makah Tribe has procedures for filming but the film industry is not required to go through the Washington state permit process. A producer can contact the tribal business manager directly and then the request goes to Council for permission to film (M. Rainey, pers. comm., 2015).
The film industry spends approximately $10,000-$20,000 per week when filming on the reservation. In 2014, eight films brought in a total of $100,000. In addition to lodging and meals, the film industry uses hired scouts and other support people. Given that many of the tribal members have a background in fishing and forestry, they have the skills needed to be scouts for the producers (M. Rainey, pers. comm., 2015).
Makah Forestry Enterprises
Makah Forest Enterprises is one of the tribe’s chartered enterprise. It focuses on sustainable timber harvests and marketing of the forest products. According to the Makah Living Forest Management Plan the goal is to harvest mostly second-growth timber, leaving old growth pockets intact. Average annual harvest levels of 8.5 million board feet are expected to be sustainable (U.S. Department of Commerce 2015).
The Makah are expanding their forestry resources using funds from the buy-back program. The U.S Department of the Interior’s Land Buy-Back Program for Tribal Nations came about from the Cobell case, a class action lawsuit about mismanagement of tribal trust assets. After the case was settled in 2009, part of the settlement was distributed to tribal plaintiffs and part was to repurchase lands allocated under the Dawes Act. Over a 10-year period, which started in 2014, the U.S. Department of the Interior will use $1.9 billion to buy back allotted lands that became fractionated over time (i.e., owned by multiple heirs of the original owner of the allotted parcel) (U.S. Department of Interior 2014).
3-10 | Economic Profiles of Washington Coast Tribes Washington Coastal Marine Advisory Council

Economic Analysis to Support Marine Spatial Planning in Washington
The Makah Reservation was the second Indian reservation in the United States to be part of the buy-back program. As part of that program, the Makah have been allocated $2.55 million to buy back parcels within their 30,000 acre reservation.
The Makah decided to use the buyback program to purchase lands that will enhance timber management opportunities as well as other economic development opportunities. The Makah Tribe also wants to purchase sacred grounds at Tsooes, south of Cape Flattery.
3.1.4 Plans for the Future
The Makah Tribe’s short term plan is to expand the four tourist-oriented enterprises as follows:
Add five more cabins to the Hobuck Beach Resort over the next 3 years.
Add a camp store; and
Add five more units to the Cape Resort over a 5 to 10-year time frame.
In the longer term (10-15 years), there has been some discussion about building a golf course. The Makah Tribe owns a parcel that could be used to build a 9-hole course that could employ two people. The goal for developing a golf course would be less about generating revenues from that facility and more about broadening the tourism opportunities on the reservation to encourage visitors to stay longer, hence generating more revenues from other enterprises (M. Rainey, pers. comm., 2015).
Another possible venture for the long term would be a high end resort or retreat center. Again this kind of development could create more year-round demand, which would increase tribal tourism-related revenues and create year-round employment opportunities.
There also has been some discussion about using Tatoosh Island for a high-end tourist development. Previously the island was used by the U.S. Navy but that use has ended. Some tribal members, however, do not want the island to be developed for tourism because it is sacred ground.
In addition to consideration of facilities to develop, the tribe is also evaluating personnel requirements associated with expanding tourism opportunities on the reservation. One concern is the risk of not having sufficient employees to meet the growing demand for tourism on the reservation. A local community college is considering adding a hospitality degree to meet a need not only on the reservation, but across the Olympic Peninsula for people with this kind of training (M. Rainey, pers. comm., 2015).
Overall there is a goal of creating jobs for younger tribal members who want to live on the reservation. Currently the tribe has about 60 people enrolled in college programs but not many of them will return to the reservation following graduation, in part because of a lack of opportunities to use skills acquired from their college degrees. The Makah Tribe’s business manager has been directed to create middle management job opportunities for tribal members with college degrees.
3.2 QUILEUTE
The Quileute Reservation encompasses 2,161 acres inclusive of La Push, the community center of the reservation. La Push is approximately 15 miles west of Forks, the nearest larger town. La Push itself is a
Washington Coastal Marine Advisory Council Economic Profiles of Washington Coast Tribes | 3-11
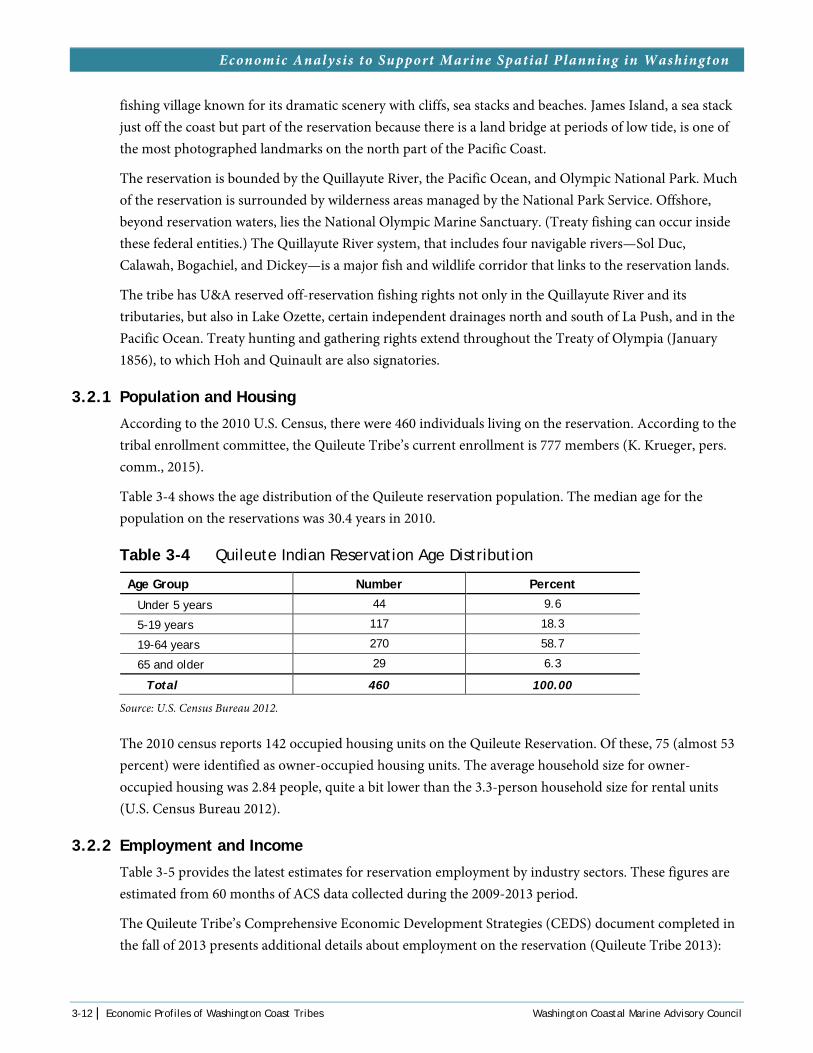
Economic Analysis to Support Marine Spatial Planning in Washington
fishing village known for its dramatic scenery with cliffs, sea stacks and beaches. James Island, a sea stack just off the coast but part of the reservation because there is a land bridge at periods of low tide, is one of the most photographed landmarks on the north part of the Pacific Coast.
The reservation is bounded by the Quillayute River, the Pacific Ocean, and Olympic National Park. Much of the reservation is surrounded by wilderness areas managed by the National Park Service. Offshore, beyond reservation waters, lies the National Olympic Marine Sanctuary. (Treaty fishing can occur inside these federal entities.) The Quillayute River system, that includes four navigable rivers—Sol Duc, Calawah, Bogachiel, and Dickey—is a major fish and wildlife corridor that links to the reservation lands.
The tribe has U&A reserved off-reservation fishing rights not only in the Quillayute River and its tributaries, but also in Lake Ozette, certain independent drainages north and south of La Push, and in the Pacific Ocean. Treaty hunting and gathering rights extend throughout the Treaty of Olympia (January 1856), to which Hoh and Quinault are also signatories.
3.2.1 Population and Housing
According to the 2010 U.S. Census, there were 460 individuals living on the reservation. According to the tribal enrollment committee, the Quileute Tribe’s current enrollment is 777 members (K. Krueger, pers. comm., 2015).
Table 3-4 shows the age distribution of the Quileute reservation population. The median age for the population on the reservations was 30.4 years in 2010.
Table 3-4 Quileute Indian Reservation Age Distribution
Age Group Number Percent
Under 5 years 44 9.6
5-19 years 117 18.3
19-64 years 270 58.7
65 and older 29 6.3
Total 460 100.00
Source: U.S. Census Bureau 2012.
The 2010 census reports 142 occupied housing units on the Quileute Reservation. Of these, 75 (almost 53 percent) were identified as owner-occupied housing units. The average household size for owner-occupied housing was 2.84 people, quite a bit lower than the 3.3-person household size for rental units (U.S. Census Bureau 2012).
3.2.2 Employment and Income
Table 3-5 provides the latest estimates for reservation employment by industry sectors. These figures are estimated from 60 months of ACS data collected during the 2009-2013 period.
The Quileute Tribe’s Comprehensive Economic Development Strategies (CEDS) document completed in the fall of 2013 presents additional details about employment on the reservation (Quileute Tribe 2013):
3-12 | Economic Profiles of Washington Coast Tribes Washington Coastal Marine Advisory Council
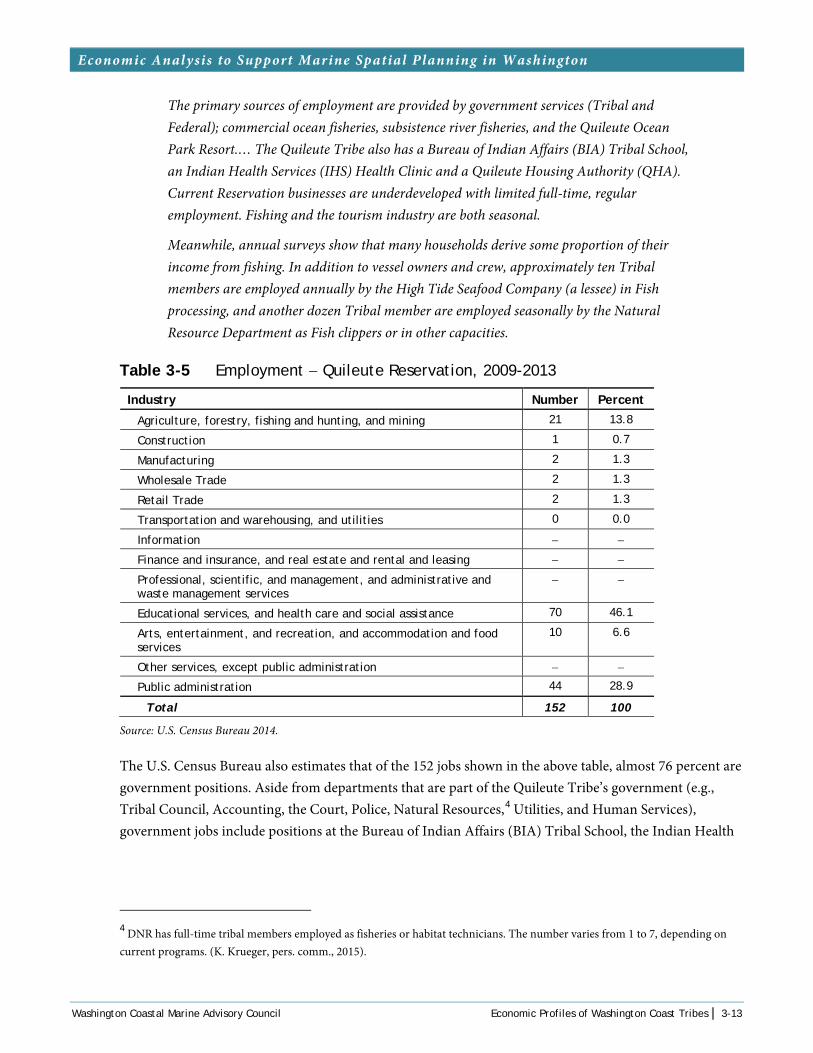
Economic Analysis to Support Marine Spatial Planning in Washington
The primary sources of employment are provided by government services (Tribal and Federal); commercial ocean fisheries, subsistence river fisheries, and the Quileute Ocean Park Resort.… The Quileute Tribe also has a Bureau of Indian Affairs (BIA) Tribal School, an Indian Health Services (IHS) Health Clinic and a Quileute Housing Authority (QHA). Current Reservation businesses are underdeveloped with limited full-time, regular employment. Fishing and the tourism industry are both seasonal.
Meanwhile, annual surveys show that many households derive some proportion of their income from fishing. In addition to vessel owners and crew, approximately ten Tribal members are employed annually by the High Tide Seafood Company (a lessee) in Fish processing, and another dozen Tribal member are employed seasonally by the Natural Resource Department as Fish clippers or in other capacities.
Table 3-5 Employment − Quileute Reservation, 2009-2013
Industry Number Percent
Agriculture, forestry, fishing and hunting, and mining 21 13.8
Construction 1 0.7
Manufacturing 2 1.3
Wholesale Trade 2 1.3
Retail Trade 2 1.3
Transportation and warehousing, and utilities 0 0.0
Information − −
Finance and insurance, and real estate and rental and leasing − −
Professional, scientific, and management, and administrative and waste management services
− −
Educational services, and health care and social assistance 70 46.1
Arts, entertainment, and recreation, and accommodation and food services
10 6.6
Other services, except public administration − −
Public administration 44 28.9
Total 152 100
Source: U.S. Census Bureau 2014.
The U.S. Census Bureau also estimates that of the 152 jobs shown in the above table, almost 76 percent are government positions. Aside from departments that are part of the Quileute Tribe’s government (e.g., Tribal Council, Accounting, the Court, Police, Natural Resources,4 Utilities, and Human Services), government jobs include positions at the Bureau of Indian Affairs (BIA) Tribal School, the Indian Health
4 DNR has full-time tribal members employed as fisheries or habitat technicians. The number varies from 1 to 7, depending on current programs. (K. Krueger, pers. comm., 2015).
Washington Coastal Marine Advisory Council Economic Profiles of Washington Coast Tribes | 3-13

Economic Analysis to Support Marine Spatial Planning in Washington
Services (IHS) Health Clinic and the Quileute Housing Authority (QHA) (K. Krueger, pers. comm., 2015).
About 13 percent of the jobs in Table 3-5 were in the private sector. Another 1.3 percent were with private not for profit employers and slightly less than 10% were from self-employment.
The ACS reports that the median earnings for workers on the Quileute Reservation during the 2009-2013 period were $24,205.
3.2.3 Current Reservation Businesses
Tourism
The remoteness of La Push combined with the natural beauty of the area has allowed the tribe to develop tourism as a source of employment and income.
The Quileute Reservation offers a wide range of recreational activities for visitors: wildlife viewing (including whale watching and bird watching), nature photography, coastal hiking, boating, fishing, kayaking, surfing at First Beach, camping, swimming and storm watching (Quileute Tribe 2014).
The Audubon Society’s Great Washington State Bird Trail, Olympic Loop, (mentioned above in the Makah profile) also passes through La Push. The Audubon Society has identified birds that can be seen in La Push in all four seasons. Two other bird watching stops on the Olympic Loop trail are close to the reservation, one to the north and one near Forks. In addition to resident birds, a number of migratory species visit the river mouth seasonally (for example, brown pelicans).
The Quileute also host a number of tribal events. The tribe has a full-time Events Director assisted by 5-7 people. Although some events are for tribal members only, many are open to the public and are posted on the tribe’s website (www.quileutenation.org). The tribe provided information about these events to Industrial Economics (IEc) for the MSP Phase I Recreation and Tourism Report (Table 3-6).
Table 3-6 Quileute Tribal Events
Event Description Estimated Attendance
Wednesday Night Drum Group
While the main attraction is the cultural aspect, this event is held one block from the beach and many people come for the joint benefit of beach and culture. Quileute welcomes the public to watch traditional drumming/singing and dancing. People can bring their own drum and participate in the drumming part, whether or not Quileute. This draws visitors from all over the world.
50-200
La Push Pummel (January/ February)(1)
A Seattle group comes out each year to surf the high waves of the winter storms at First Beach. This group used to come out in January but switched in 2009 to February because January weather was often too severe.
About 30 paddlers plus friends and family
Welcome the Whales (mid- April)
While designed to have the tribal school make offers to the whales, this is also a cultural event for the community and the public can attend. There are prayers, singing/drumming, and a meal later at Akakat Center.
200-300 people (varies with weather)
3-14 | Economic Profiles of Washington Coast Tribes Washington Coastal Marine Advisory Council

Economic Analysis to Support Marine Spatial Planning in Washington
Event Description Estimated Attendance
Halibut Opener (early May)
The marina draws a huge crowd of recreational anglers for the halibut season.
200 people
Surf Camp (June)
A Youth and Traditions Surf Camp is held at First Beach at the end of June, sponsored by Quileute Housing authority Youth Programs, Surfrider Foundation, and USCG.
Not available
July 4 fireworks Fireworks display on the night of July 4th, on the beach. 100 visitors
Quileute Days (3rd weekend in July)
This includes the canoe races, the Royalty parade, stick games, fish bake, adult and youth co-ed softball, street vendors, bingo, and an Elders Dance. People from around the area come to the reservation to buy from vendors, play games, watch canoe races, engage in the street dances, or just enjoy the scenery.
Several hundred at parade and over three days perhaps 2,000 total
Last Chance Coho Fishing Derby(2)
The fishing is offshore (ocean, not river) so people bring their boats. There are vendors on the reservation. It is a judged event with small prize money for the catches.
300 people a day for three days
The Paddle This is an event shared by Washington and Canadian Tribes and has a different destination/host each year. Depending on distances, canoes travel 2-4 weeks in late July-early August. While only tribal members paddle, the event draws the attention of the public. When a local coastal Tribe is hosting, it can draw a lot of public attention. For example, in 2013, Quinault was a final destination, and Quileute was a mini-stop before the final one. The event includes dancing/singing/drumming and food. Many people show up to see the painted canoes as well. Over 100 drums were counted during the Quileute Hosting celebration of the Paddle to Quinault.
Forks Chamber of Commerce and area businesses helped to host several thousand people from July 27- August 1. Our kitchen estimated serving 7,000 people.
Notes: 1. See www.canoekayak.com/photos/pummel-la-push-washington for more details. 2. In the Phase I report, this was identified as the “Labor Day Coho Fishing Derby” but it is actually called the Last Chance Coho Fishing Derby, according to the tribe.
Source: IEc 2014
The following sections discuss businesses associated with tourism activities on the Quileute Reservation and opportunities to expand tourism.
Tourism-related Businesses
Oceanside Resort The Quileute Oceanside Resort is a complex of facilities, owned and operated as a tribal enterprise. Based on recent information from the tribe (which is subject to updates), the resort includes:
Motel units: total of 28 units in two buildings. Peak season prices are $134-$189; off peak prices are $79-$109.
Individual units:
10 A-frame cabins providing limited amenities. Peak season prices are $99-$129; off peak prices are $69-$89.
Washington Coastal Marine Advisory Council Economic Profiles of Washington Coast Tribes | 3-15

Economic Analysis to Support Marine Spatial Planning in Washington
33 cabins with other amenities (15 have hot tubs and kitchens). Peak season prices are $139-$299; off peak prices are $99-$199.
42 RV/tent sites with hookups. Peak season price is $40; off peak price is $27.
26 tent sites without hookups (20 are in Lonesome Creek) Peak season price is $20; off peak is $15.
The resort also includes the Lonesome Creek store and a gas station. The building housing the store includes three furnished apartments on the second level (Quileute Tribe 2013). It also includes a branch of the U.S. Postal Service (98350).
In addition to tourists coming for tribal events, visitors come to the Quileute Oceanside Resort year-round for other recreational opportunities. The tribe indicates that rooms are generally sold out during peak periods including: Christmas/New Year, spring break (March), and July through September.
According to the IEc report, the resort employs 31 people. Fiscal year (FY) 2013 revenues for the resort were $2.6 million with about $2.3 million of that coming from motel and cabin rentals. The remaining $0.3 million was from RV and tent site rentals (IEc 2014).
River’s Edge Restaurant The tribe also owns and operates the River’s Edge Restaurant in La Push. The restaurant occupies a former U.S. Coast Guard boat house. Before the re-opening of the restaurant in July 2014, the tribe leased management of the restaurant and the managers struggled to keep the restaurant open year round. The tribe determined that the restaurant offered more potential for economic development purposes if it were managed as a tribal enterprise; in 2014 the tribe hired its own manager and re-opened the restaurant in July. The goal is to stay open year round (Talking Raven 2014a).
Charter Boat Fishing Charter boat fishing trips are a highlight for many recreationists on the Washington coast. Several charter companies offer trips from the tribal marina at La Push including Hooked on Fishing Ocean Charters LLC, Top Notch Ocean Charters and Always Fishing (Always Fishing 2015; B. Brux, pers. comm., 2015; Top Notch Ocean Charters 2015). All of the charter vessels operating from La Push are privately owned. Some charter companies also offer whale watching trips.
Data obtained from WDFW provide information on the number of angler days of charter boat fishing from La Push. Table 3-7 provides a 5-year history of angler days by trip target species.
© Janet Baker, 2015
La Push, Washington shoreline
3-16 | Economic Profiles of Washington Coast Tribes Washington Coastal Marine Advisory Council
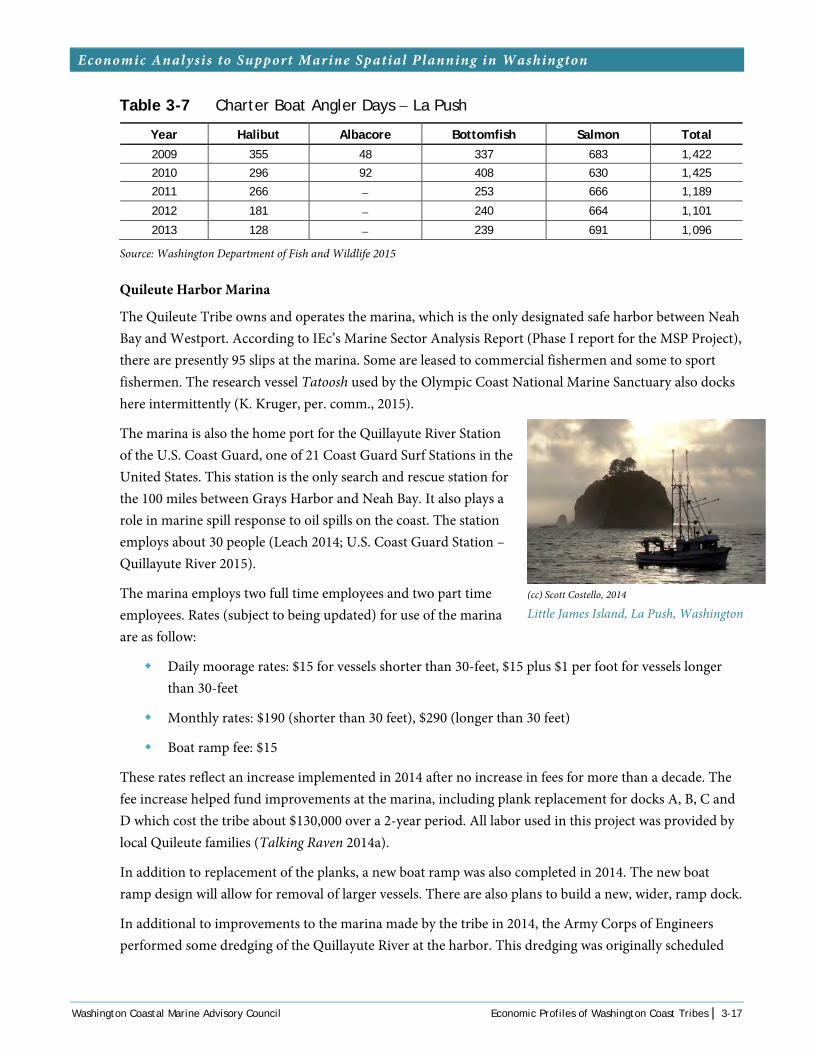
Economic Analysis to Support Marine Spatial Planning in Washington
Table 3-7 Charter Boat Angler Days − La Push
Year Halibut Albacore Bottomfish Salmon Total 2009 355 48 337 683 1,422
2010 296 92 408 630 1,425
2011 266 − 253 666 1,189
2012 181 − 240 664 1,101
2013 128 − 239 691 1,096
Source: Washington Department of Fish and Wildlife 2015
Quileute Harbor Marina
The Quileute Tribe owns and operates the marina, which is the only designated safe harbor between Neah Bay and Westport. According to IEc’s Marine Sector Analysis Report (Phase I report for the MSP Project), there are presently 95 slips at the marina. Some are leased to commercial fishermen and some to sport fishermen. The research vessel Tatoosh used by the Olympic Coast National Marine Sanctuary also docks here intermittently (K. Kruger, per. comm., 2015).
The marina is also the home port for the Quillayute River Station of the U.S. Coast Guard, one of 21 Coast Guard Surf Stations in the United States. This station is the only search and rescue station for the 100 miles between Grays Harbor and Neah Bay. It also plays a role in marine spill response to oil spills on the coast. The station employs about 30 people (Leach 2014; U.S. Coast Guard Station – Quillayute River 2015).
The marina employs two full time employees and two part time employees. Rates (subject to being updated) for use of the marina are as follow:
Daily moorage rates: $15 for vessels shorter than 30-feet, $15 plus $1 per foot for vessels longer than 30-feet
Monthly rates: $190 (shorter than 30 feet), $290 (longer than 30 feet)
Boat ramp fee: $15
These rates reflect an increase implemented in 2014 after no increase in fees for more than a decade. The fee increase helped fund improvements at the marina, including plank replacement for docks A, B, C and D which cost the tribe about $130,000 over a 2-year period. All labor used in this project was provided by local Quileute families (Talking Raven 2014a).
In addition to replacement of the planks, a new boat ramp was also completed in 2014. The new boat ramp design will allow for removal of larger vessels. There are also plans to build a new, wider, ramp dock.
In additional to improvements to the marina made by the tribe in 2014, the Army Corps of Engineers performed some dredging of the Quillayute River at the harbor. This dredging was originally scheduled
(cc) Scott Costello, 2014
Little James Island, La Push, Washington
Washington Coastal Marine Advisory Council Economic Profiles of Washington Coast Tribes | 3-17

Economic Analysis to Support Marine Spatial Planning in Washington
for 2013 but was put on hold because of the sequestration that resulted from the 2013 federal budget deal. (J. Hagen, pers. comm., 2015). The Corps endeavors to dredge at least every two years, as budgeting will provide (K. Krueger, pers. comm., 2015).
FY13 (October 2012–September 2013) gross revenues from the marina operation totaled $417,000. Of this diesel and gasoline sales contributed approximately $359,000, moorage and ramp fees were about $53,500 and the remaining $3,500 was from bait, tackle, oil and miscellaneous retail sales (IEc 2014).
High Tide Seafoods of Port Angeles leases from the tribe an area inclusive of a high dock with a lift, ice machine and space for a fish processing plant in La Push. It is located on the west end of the marina, near the river mouth, and serves tribal and non-tribal fishers alike. This facility is another source of employment.
Commercial Fishing
The Quileute tribal members currently operate six commercial fishing vessels, each with a captain and 2-3 crew members. The Quileute Tribe is self-regulatory, per requirements of demonstrated capacity for this, under United States v. Washington, and WDFW has acknowledged this capacity and status. The commercial fishing regulations (as well as ceremonial and subsistence) are public record and are seasonally posted at www.quileutenation.org/natural-resources (K. Krueger, pers. comm., 2015).
Hatcheries
The Quileute are involved in several fish hatchery operations. The tribe owns the Lonesome Creek hatchery on reservation, and co-manages the Bogachiel and Sol Duc Hatcheries with WDFW, off-reservation. The Quileute also lease the Bear Springs Rearing Pond from the Washington Department of Natural Resources (DNR). This facility is in the Sol Duc drainage basin. For Bear Springs, the state hatches the fish and the tribe raises them (M. Moon and K. Krueger, pers. comms, 2015).
The Quileute Tribe is now helping to fund the state hatchery operations for coho at the Sol Duc facility. When state budget issues threatened program reduction, the City of Forks and several sport fishing groups joined the Quileute Tribe in providing funds to subsidize raising coho at the Sol Duc Hatchery (K. Krueger, pers. comm., 2015).
The tribe, in cooperation with WDFW, also raises summer Chinook and winter steelhead stock. The reservation hatchery employs a full time hatchery manager and support staff (Quileute Tribe 2015).
The hatcheries are considered “supplemental”—that is, they add the hatchery raised fish to boost harvest levels (M. Moon, pers. comm., 2015).
3.2.4 Plans for the Future
The 2013-2018 CEDS document identifies creation of jobs as a major priority for the tribe (Quileute Tribe 2013). The population of the reservation is young; 44 percent under age 24 and the median age is only 30. The tribe and the tribal enterprises are currently the major employers. New opportunities will are needed to provide employment for the next generation.
3-18 | Economic Profiles of Washington Coast Tribes Washington Coastal Marine Advisory Council

Economic Analysis to Support Marine Spatial Planning in Washington
Some of the plans for expanding and improving existing enterprises as well as new ventures are discussed below.
Improvements to the Oceanside Resort
The 2013-2018 CEDS report noted that the resort is crucial to the reservation economy (Quileute Tribe 2013). Plans to expand and enhance the resort are expected to increase its value to the tribe as an economic driver. The CEDS report mentions additional lodging, enhanced guest services, improved retail support and the ability to host small conference or other events as ways to expand the resort operation, but the plan does not identify specific timeframes for these investments.
For the Lonesome Creek store, the CEDS document includes plans to expand the floor space, enhance the fuel services, and expand the grocery offerings to include more healthy alternatives but again these are not scheduled projects.
Other resort improvements are proposed for the Lonesome Creek resort, which is separated from the other resort facilities and attracts surfers and other beach-oriented visitors. These improvements include developing a fish and chips take-out bar using an existing clubhouse facility that is currently underutilized. Employment for this new bar would be 4-6 employees. A proposed open air market adjacent to the take-out bar would provide a place for tribal member to sell baskets, art, jewelry and other crafts. The market would provide self-employment to an estimated one to ten local tribal members.
Plans for enhancing the Lonesome Creek resort also include infrastructure improvements such as restrooms and shower facilities.
Cultural Center/Museum
Although two of the annual cultural events, Elder’s Week in May and Quileute Days in July, include traditional singing and dancing and offer meals of smoked fish and elk, there is a desire have a permanent facility to display the Tribe’s artifacts. A few artifacts and photographs are on display in tribal offices and at the resort but most are in storage. Other artifacts are in other museum collections including the Smithsonian Museum of the American Indian and the Burke Museum, or are in private collections (Quileute Tribe 2013).
Three grants (two from the Administration for Native Americans (ANA) and one National Park Service Historic Preservation grant have been used for this project, including preliminary design work. Unfortunately the original plan was to locate the facility on Harley’s Island; after the 1995-96 storms this is no longer a viable site. In the 2013 CEDS document the tribe says it may now consider a cultural center/museum in combination with a small conference center within the resort or within a senior center that would be developed near the resort.
The tribe received an economic development grant to prepare a feasibility study and business plan for the proposed conference facility. There is some potential for converting the existing school in La Push into a conference facility when the school is moved to higher ground.
Washington Coastal Marine Advisory Council Economic Profiles of Washington Coast Tribes | 3-19

Economic Analysis to Support Marine Spatial Planning in Washington
Ki′tla Business Park in Forks
In late 2014 the Quileute Tribe purchased the 110 Business Park in Forks from Bill Sperry. It has been renamed the Ki′tla Center. This was once the site of the Rosmond Brothers sawmill, which opened in the 1940s and operated under multiple owners until the 1980s. Sperry bought the site in 2008 and made improvements to the buildings. The wooden structure known as the Roundhouse has been used for event rentals. In an article in the Forks Forum, Sperry said that the tribe plans to hold its drum group and other ceremonies in the Roundhouse. Sperry also said that the tribe will continue to operate the U-Haul business and propane sales that are also part of the property purchased (Forks Forum 2014a).
Another Forks Forum article (2014b) reported that the tribe was developing a 10-year business plan for the property. While giving no specific details, the tribe indicated that the property purchase was part of its overall economic development plan to create jobs for tribal members.
Commercial Fisheries Projects
Given the importance of commercial fisheries to the economy of the tribe, the CEDS plan includes proposals to expand this industry. Proposals include development of a cooperative fishing operations, new processing facilities, and improved transportation capacity to deliver more catch to new markets.
Composite Construction
Clallam County considers advanced composite manufacturing as one of its main economic development clusters with a focus on aircraft and related industries. Composite construction is used by the Quileute for construction of cedar strip canoes. The tribe is considering a commercial enterprise to build canoes and other related products. Workforce development assistance would be available through Peninsula College and the Advanced Composites Center in Port Angeles.
Broadband Internet Service
Along with several other coastal tribes, the Quileute are working to acquire broadband internet service as a key component for economic development. The tribes have met with the governor and state representatives to strategize on how to make this happen (Talking Raven 2014b).
Move to Higher Ground
The Quileute occupy a small piece of land that sits between the Pacific Ocean and Olympic National Park and this land is threatened by tsunamis. For the northwest corner of the Peninsula, sea level change is actually not an immediate threat because Olympic Mountain uprise is exceeding the sea level increase (U.S. Department of Commerce 2013).
For many years the tribe wanted to move its schools and other buildings in the village to higher ground to get out of the tsunami flood zone. One key piece of land is a plateau above La Push that was part of the national park. The proposal was to return this land to the tribe. These returned lands would provide a safe location for the tribe to rebuild facilities.
3-20 | Economic Profiles of Washington Coast Tribes Washington Coastal Marine Advisory Council

Economic Analysis to Support Marine Spatial Planning in Washington
On February 27, 2012, President Obama signed into law Public Law 112-97. The bill returns to the tribe 785 acres from the Olympic National Park. Of this, 275 acres will be used as a site for the Quileute Tribal Council’s headquarters, tribal school, pre-school, senior center, and other facilities. The other 510 acres, north of La Push, was part of the traditional hunting grounds for the tribe. The law also provided for conversion of a Quileute fee property directly to the east to be combined with reservation trust lands after preliminary environmental assessments, which have now been completed (K. Kruger, pers. comm., 2015).
Currently the Quileute Tribe’s efforts are focused on the 275 acres that will provide tsunami protection for the tribe. Some of the remaining 510 acres could provide some timber harvesting opportunities but this is not a major focus at this time.
3.3 HOH
The Hoh Reservation is located on the Olympic Peninsula in Jefferson County, about 25 miles south of Forks and 80 miles north of Aberdeen. Until recently, the size of the reservation was about one square mile. The reservation land is bounded on the south by the Olympic Natural Park and on the north by the Hoh River. East of the reservation are private and state lands. The west side includes about 1 mile of ocean frontage at the mouth of the Hoh River. The Hoh Tribe has extensive reserved treaty rights - off-reservation, the U&A, in the Hoh drainage basin, some independent drainages, and coastally and offshore.
Over time, the changing course of the Hoh River eroded much of the usable area of the reservation. Given the limited size of the original reservation, no alternatives were available that would allow the tribe to move homes and tribal facilities to higher ground to avoid the annual flooding that resulted with the changed river course. As a result, the tribe purchased 260 acres of private land in 2008 and 2009. An additional 160 acres were transferred from DNR. This patchwork approach left a gap between the original reservation land and these acquired lands; the missing gap was a 37 acre parcel held by the National Park Service. In late 2010 President Obama signed House Resolution (H.R.) 1061, a bill to transfer these 37 acres to the Hoh Tribe. With these additional land purchases and land transfers, the reservation today encompasses more than 900 acres (Mapes 2010, Pacific Forest Management 2014a).
3.3.1 Population and Housing
According to the 2010 U.S. Census, there were 116 individuals living on the reservation. (U.S. Census Bureau 2012). There about 230 enrolled tribal members (Pacific Forest Management 2014a).
Table 3-8 shows the age distribution of the Hoh Reservation population. The median age for the population on the reservation in 2010 was 25.7 years, the youngest median age of any of the five reservations on the coast.
(cc) Sam Beebe, 2008
Hoh River Outlet
Washington Coastal Marine Advisory Council Economic Profiles of Washington Coast Tribes | 3-21
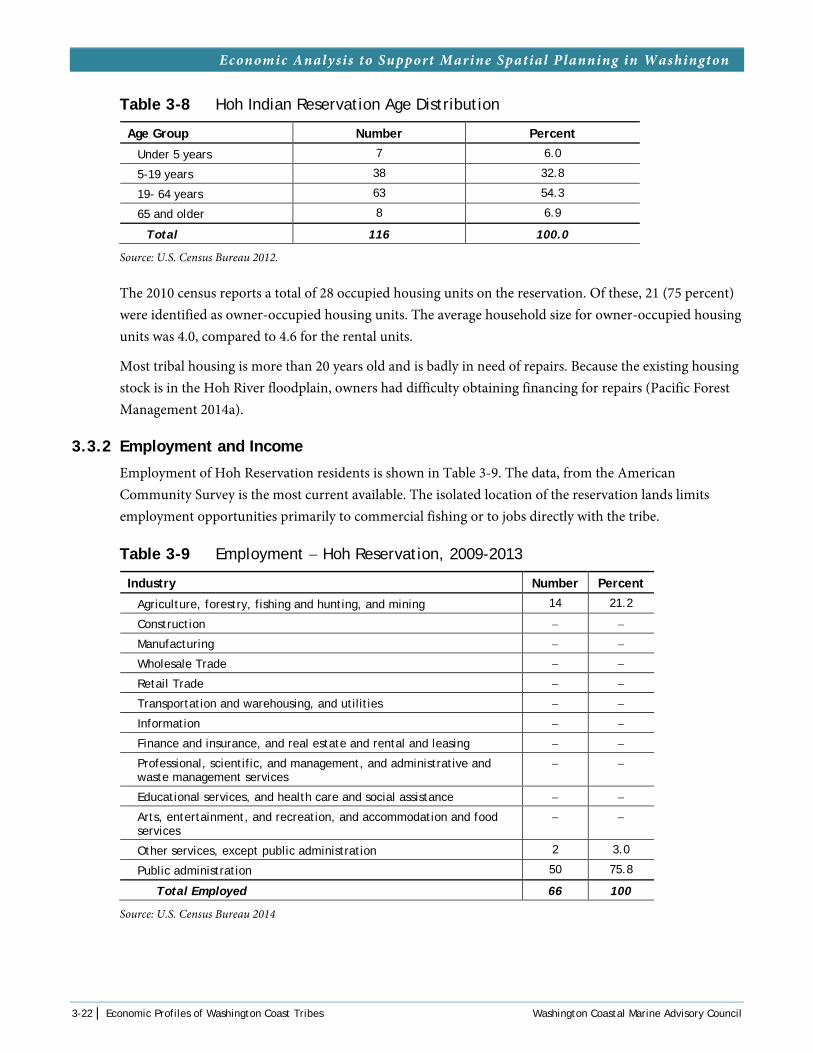
Economic Analysis to Support Marine Spatial Planning in Washington
Table 3-8 Hoh Indian Reservation Age Distribution
Age Group Number Percent
Under 5 years 7 6.0
5-19 years 38 32.8
19- 64 years 63 54.3
65 and older 8 6.9
Total 116 100.0
Source: U.S. Census Bureau 2012.
The 2010 census reports a total of 28 occupied housing units on the reservation. Of these, 21 (75 percent) were identified as owner-occupied housing units. The average household size for owner-occupied housing units was 4.0, compared to 4.6 for the rental units.
Most tribal housing is more than 20 years old and is badly in need of repairs. Because the existing housing stock is in the Hoh River floodplain, owners had difficulty obtaining financing for repairs (Pacific Forest Management 2014a).
3.3.2 Employment and Income
Employment of Hoh Reservation residents is shown in Table 3-9. The data, from the American Community Survey is the most current available. The isolated location of the reservation lands limits employment opportunities primarily to commercial fishing or to jobs directly with the tribe.
Table 3-9 Employment − Hoh Reservation, 2009-2013
Industry Number Percent
Agriculture, forestry, fishing and hunting, and mining 14 21.2
Construction − −
Manufacturing − −
Wholesale Trade − −
Retail Trade − −
Transportation and warehousing, and utilities − −
Information − −
Finance and insurance, and real estate and rental and leasing − −
Professional, scientific, and management, and administrative and waste management services
− −
Educational services, and health care and social assistance − −
Arts, entertainment, and recreation, and accommodation and food services
− −
Other services, except public administration 2 3.0
Public administration 50 75.8
Total Employed 66 100
Source: U.S. Census Bureau 2014
3-22 | Economic Profiles of Washington Coast Tribes Washington Coastal Marine Advisory Council

Economic Analysis to Support Marine Spatial Planning in Washington
The U.S. Census Bureau also estimates that, of the 66 jobs shown in the above table, almost 82 percent were government positions which includes tribal employees as well as other local, state and federal employees. Of the remainder, 4.5 percent were employed in the private sector, 3 percent were employed in private non-profits and the remaining 3% were self-employed.
The ACS reports that the median earnings for workers on the Hoh Reservation during that same 2009-2013 period was $38,462.
3.3.3 Natural Resources
With the additional land acquired through purchases and transfers, the reservation now includes about 650 acres of forestland held in trust. Western hemlock, Sitka spruce and red alder are the primary native forest species, with minor amounts of pacific silver fir, big leaf maple and red cedar. The tribe and BIA recently completed a draft Forest Management Plan that includes the new trust lands5 (Pacific Forest Management 2014b).
This draft plan describes the importance of natural resources to the Hoh Tribe:
Located at the mouth of the Hoh River, the Hoh Indian Tribe is dependent on the fish and wildlife of the Hoh River for their subsistence and commercial economy. The protection of the watershed’s function is key to preserving these important resources (Hoh Natural Resources newsletter 2014).
With this in mind it is contemplated that Hoh Tribal forestlands will be managed in a way that provides for a safe, healthy environment for Tribal members and protects basic watershed functions for the cultural and economic needs of the Tribe. Emphasis will be placed on maintenance and development of forestlands that provides clean water and habitat conditions that allow fish and wildlife species to thrive.
Direct economic benefits through timber harvesting will be minimal and infrequent. Harvest methods that will be employed include individual trees, commercial thinnings or small patch cuts (< 10 acres). Clear cut harvest methods will generally not be used but may be considered in cases where clearing is needed for housing or other Tribal infrastructure or in the case of a large scale disaster such as wind throw or fire.
The draft Forest Management Plan specifies regeneration after harvests or other disturbance events. This regeneration includes natural regeneration from existing trees and manual regeneration, that is, planting of seedlings. When planting seedlings, the plan specifies use of native species such as western hemlock, Sitka spruce, and red cedar. A goal of increasing the presence of red cedar, which is an important species for cultural use, was identified as one of the silvicultural and forest management principles (Pacific Forest Management 2014b).
5 The Hoh Tribe holds an additional 42.8 acres on non-trust or “fee status” lands. Fee status lands are subject to DNR’s Forest Practice Act and are not governed by the new Forest Management Plan (Pacific Forest Management 2014b).
Washington Coastal Marine Advisory Council Economic Profiles of Washington Coast Tribes | 3-23

Economic Analysis to Support Marine Spatial Planning in Washington
In addition to the trust lands and the fee lands, the Hoh Tribe depends on natural resources within their U&A hunting, fishing and gathering areas. The U&A area includes over 400 square miles of watershed and thousands of square miles of marine areas. The tribe has resource professionals to manage natural resources in their U&A areas (Hoh Tribe 2015).
3.3.4 Plans for the Future
The additional lands added to the reservation will provide higher ground for housing and government facilities, and it will also open up opportunities for economic development.
One recently completed project is a fire station that is operated as part of the Jefferson County Fire Protection District. The Tribe reportedly also has plans to build a store and gas station on U.S. Highway 101 (US 101) (Walker 2011).
3.4 QUINAULT
The 208,150 acre, mostly forested Quinault Reservation is in the southwestern corner of the Olympic Peninsula with the Pacific Ocean as its western boundary, Queets village to the north, Lake Quinault on the east side and Moclips on the south end. Most of the reservation is at low elevation, except for the northeast part which rises to almost 2,800 feet above sea level. Several major rivers cross the reservation – the Queets, Raft and Quinault Rivers. The rainforest climate brings 80 inches of precipitation on the coastal end and up to 150 inches of precipitation in the higher elevation northeast part (Quinault Indian Nation 2008).
A total of 173,000 acres of tribal and BIA-managed forestland; includes both trust and tribally owned fee land. The Quinault Reservation is the only majorly timbered reservation in the U.S. that was completely divided into 80-acre allotments. Over the course of time, the allotments were distributed to individuals and families from many different tribes. Land ownership on the reservation has become more complex as the land is fractionated due to inheritance by even more members of succeeding generations. Any development, road-building, timber harvest, restoration or other land management activity requires agreement from the majority of affected landowners. The Quinault Natural Resource Division is helping to consolidate the Nation's holdings by purchasing trust and fee lands. Consolidation will enable the Quinault Indian Nation (QIN) to manage the forestlands on a more holistic basis.
3.4.1 Population and Housing
According to the 2010 U.S. Census, there were 1,408 individuals living on the reservation. (U.S. Census Bureau 2012) As of February 27, 2015, total tribal enrollment of the QIN was 2,928 (Resource Dimensions 2015).
Table 3-10 shows the age distribution of the Quinault Reservation population. The median age for the population on the reservation was 28.7 years in 2010.
(cc) Sam Beebe, 2013
Paddling to Quinault
3-24 | Economic Profiles of Washington Coast Tribes Washington Coastal Marine Advisory Council

Economic Analysis to Support Marine Spatial Planning in Washington
Table 3-10 Quinault Reservation Age Distribution
Age Group Number Percent
Under 5 years 128 9.1
5-19 years 371 26.3
19-64 years 789 56.0
65 and older 120 8.5
Total 1,408 100.0
Source: U.S. Census Bureau 2012.
Individual community populations reported in the 2010 census are as follow:
Amanda Park 152 Queets 174 Qui-nai-elt Village 54 Santiago 42 Taholah 840
The 2010 census reports a total of 418 occupied housing units on the Quinault Reservation. Of these 265 (slightly more that 63 percent) were identified as owner-occupied housing units. The average household size for owner-occupied housing was 3.46 slight larger than the 3.16 household size for rental units (U.S. Census Bureau 2012). The Quinault are currently conducting an online housing authority survey that should provide updated housing information.
3.4.2 Employment and Income
Employment on the Quinault Reservation in 2009-2013 is shown in Table 3-11.
Table 3-11 Employment − Quinault Reservation, 2009-2013
Industry Number Percent
Agriculture, forestry, fishing and hunting, and mining 20 5.2
Construction 20 5.2
Manufacturing 17 4.5
Wholesale Trade − −
Retail Trade 9 2.4
Transportation and warehousing, and utilities 13 3.4
Information 2 0.5
Finance and insurance, and real estate and rental and leasing 7 1.8
Professional, scientific, and management, and administrative and waste management services
11 2.9
Educational services, and health care and social assistance 127 33.2
Washington Coastal Marine Advisory Council Economic Profiles of Washington Coast Tribes | 3-25

Economic Analysis to Support Marine Spatial Planning in Washington
Industry Number Percent
Arts, entertainment, and recreation, and accommodation and food services
42 11.0
Other services, except public administration 7 1.8
Public administration 107 28
Total 382 100
Source: U.S. Census Bureau 2014.
The U.S. Census Bureau also estimates that of the 382 jobs shown in the above table, 267 or almost 70 percent were government employees which includes tribal employees as well as other local, state and federal employees. Another 92 job or a little over 24 percent were employees of private companies. Self-employment accounted for 2.3 percent of the jobs.
The ACS reports that the median earnings for workers on the Quinault reservation during that same 2009-2013 period was $24,375.
3.4.3 Current Reservation Businesses
The Quinault’s 2008 CEDS report “represents the Nation’s current long-term strategy for developing its economy… [and] serves as a roadmap for the future economic prosperity of the Quinault Indian Nation while reflecting the values and beliefs of the Quinault people” (QIN 2008).
The CEDS provides a discussion of the economic environment surrounding the tribe, while also identifying specific projects and opportunities for the tribe to implement. These projects and activities met a defined set of criteria related to the tribe’s development strategy and assumptions associated with the tribe’s goals and objectives.
The 2008 CEDS highlights important aspects of the QIN economy, and their influence on defining the high priority projects. Three primary industry “clusters” are introduced as central to QIN: Forestry, Fisheries, and Hospitality and Tourism. Within each cluster are interrelated businesses that have a comparative advantage because of their proximity to their resource base complemented by a skilled local workforce, and specialized support businesses and suppliers. In addition, the high priority projects listed in the 2008 CEDS were dominated by those that would directly affect these primary industry clusters.
Information from the CEDS document and other sources provides detail on the following existing and planned projects.
Tourism-Related Businesses
Quinault Beach Resort and Casino
Opened in 2000, the hotel and casino are on 200 acres of trust property located off the reservation in Ocean Shores. According the resort’s website it include three restaurants, a spa, and a casino with 500 slot machines and 12 table games. According to the 2008 CEDS document the resort employs about 350 people, with about half of that being non-tribal (QIN 2008). According to financial reported reviewed by
3-26 | Economic Profiles of Washington Coast Tribes Washington Coastal Marine Advisory Council
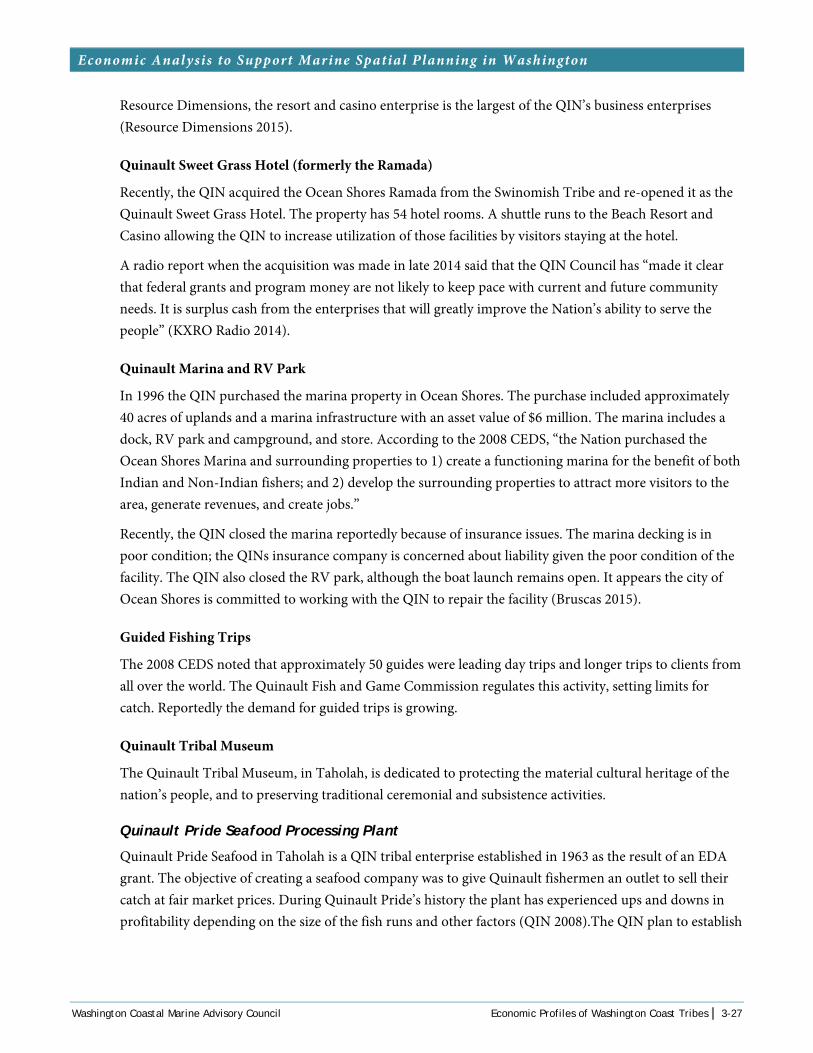
Economic Analysis to Support Marine Spatial Planning in Washington
Resource Dimensions, the resort and casino enterprise is the largest of the QIN’s business enterprises (Resource Dimensions 2015).
Quinault Sweet Grass Hotel (formerly the Ramada)
Recently, the QIN acquired the Ocean Shores Ramada from the Swinomish Tribe and re-opened it as the Quinault Sweet Grass Hotel. The property has 54 hotel rooms. A shuttle runs to the Beach Resort and Casino allowing the QIN to increase utilization of those facilities by visitors staying at the hotel.
A radio report when the acquisition was made in late 2014 said that the QIN Council has “made it clear that federal grants and program money are not likely to keep pace with current and future community needs. It is surplus cash from the enterprises that will greatly improve the Nation’s ability to serve the people” (KXRO Radio 2014).
Quinault Marina and RV Park
In 1996 the QIN purchased the marina property in Ocean Shores. The purchase included approximately 40 acres of uplands and a marina infrastructure with an asset value of $6 million. The marina includes a dock, RV park and campground, and store. According to the 2008 CEDS, “the Nation purchased the Ocean Shores Marina and surrounding properties to 1) create a functioning marina for the benefit of both Indian and Non-Indian fishers; and 2) develop the surrounding properties to attract more visitors to the area, generate revenues, and create jobs.”
Recently, the QIN closed the marina reportedly because of insurance issues. The marina decking is in poor condition; the QINs insurance company is concerned about liability given the poor condition of the facility. The QIN also closed the RV park, although the boat launch remains open. It appears the city of Ocean Shores is committed to working with the QIN to repair the facility (Bruscas 2015).
Guided Fishing Trips
The 2008 CEDS noted that approximately 50 guides were leading day trips and longer trips to clients from all over the world. The Quinault Fish and Game Commission regulates this activity, setting limits for catch. Reportedly the demand for guided trips is growing.
Quinault Tribal Museum
The Quinault Tribal Museum, in Taholah, is dedicated to protecting the material cultural heritage of the nation’s people, and to preserving traditional ceremonial and subsistence activities.
Quinault Pride Seafood Processing Plant
Quinault Pride Seafood in Taholah is a QIN tribal enterprise established in 1963 as the result of an EDA grant. The objective of creating a seafood company was to give Quinault fishermen an outlet to sell their catch at fair market prices. During Quinault Pride’s history the plant has experienced ups and downs in profitability depending on the size of the fish runs and other factors (QIN 2008).The QIN plan to establish
Washington Coastal Marine Advisory Council Economic Profiles of Washington Coast Tribes | 3-27
Economic Analysis to Support Marine Spatial Planning in Washington
a branch of Quinault Pride Seafood (called Quinault Pride Seafood II) in Westport at Firecracker Point (see below) (Resource Dimensions 2014).
Quinault National Fish Hatchery
The Quinault National Fish Hatchery, located 15 miles from the ocean on Cook Creek, a tributary of the Quinault River. Working with the U.S. Fish and Wildlife Service (USFWS) and BIA, the tribe selected the site in 1963 began producing fall–run Chinook and coho salmon in late 1968 (U.S. Fish and Wildlife Service 2015).
USFWS reports that the hatchery releases 660,000 Coho salmon, 1.5 million chum salmon, 400,000 fall-run Chinook, and 190,000 steelhead trout every year.
Firecracker Point Facility
In 2014, Quinault Tribal Enterprises (QTE) made an off-reservation investment when it purchased a marina, mooring and fishing support facility in Westport owned by RPMM, LLC. The Port of Grays Harbor originally leased uplands at Firecracker Point from RPMM, LLC in 2005. RPMM improved the site adding docks, a hoist, ice equipment, storage and fueling service. QTE assumed all terms of the RPMM, LLC lease with the port. QTE said the purchase would add jobs for both tribal members and non-tribal members (Water4fish 2014).
Miscellaneous and Small Retail
The QIN also own several retail businesses – Taholah Mercantile, the Amanda Park Trading Post the Queets Trading Post, and the Q-Mart in Oceans Shores. In 2015 the Tribe opened a new convenience store, Q Mart II, in Aberdeen.
Forest Products
The forestry cluster, as described in the tribe’s CEDS document includes the Quinault Department of Natural Resources, which manages not only the forests but fish, wildlife and lands as well. The Quinault Land and Timber Enterprises is a QIN enterprise formed in 1988 to consolidate and strengthen the QIN’s timberland acquisition efforts. Timber harvest revenues are used for reforestation and for acquisitions of additional timberlands.
3.4.4 Plans for the Future
Information on economic development projects being pursued by the QIN was compiled from a number of publicly available documents.
Upgrades to Queets Fish Processing Plant
In mid-2014 the U.S. Secretary of Commerce announced that the QIN was awarded a $1.5 million dollar EDA grant to upgrade the fish processing plant in Queets. Improvements to the fish processing plant are expected to add 30 full-time positions at the plant (U.S. Department of Commerce 2014).
3-28 | Economic Profiles of Washington Coast Tribes Washington Coastal Marine Advisory Council

Economic Analysis to Support Marine Spatial Planning in Washington
Proposed Development of Sand and Gravel Resources
According to a document prepared by BIA and QIN, the tribe owns “the only remaining uncommitted large near-shore sand and gravel source on the West Coast of the lower United States.” The tribe is looking for a partner to either lease or participate in a joint venture to mine this resource. This report identified potential local markets for the aggregate—the reservation itself, US 101, and the Aberdeen Hoquiam metropolitan area—but also noted major non-local domestic markets stretching from Seattle to San Diego. Japan, China, Korea, and the Pacific Islands were also identified as potential off shore markets (QIN and BIA n.d.).
Reconnaissance testing in 2005 showed high-quality deposits that would meet Washington State Department of Transportation (WSDOT) standards for use in roadway construction. The aggregate resources cover a major part of the reservation but the QIN identified an 80 acre tract on the east side of the reservation as the preferred location for initial development. This site is preferred because other commercial-grade production is located in the vicinity and infrastructure requirements—(e.g., power, water and transportation)—already exist.
This preferred parcel is estimated to have 214,000 tons of aggregate per foot of depth. Given the site is estimated to be at least 40 feet deep, the minimum estimated total volume is 8.4 million tons.
Biomass Project
The Quinault believe use of renewable energy must be pursued because it is consistent with their cultural beliefs in living in harmony with nature. In 2006 the U.S. Department of Energy (DOE) funded a renewable energy plan but financial difficulties have precluded implementation of that plan. The plan showed that the best opportunities for better energy management were energy efficiency upgrades and use of biomass.
The tribe used a U.S. Department of Agriculture (USDA) Rural Business Opportunity Grant to initiate the process of pursuing a biomass option. This project focused on assessing the volumes and kinds of biomass occurring on Quinault lands. Another grant, through the US Forest Service (USFS) Woody Biomass Utilization Grant Program funded an engineering and design plan for QIN’s biomass project.
In 2014, the QIN, in partnership with American Community Enrichment, presented its findings on energy opportunities and strategies associated with a potential biomass project. Given the availability of wood and wood products on the reservation, the proposed biomass project would primarily use wood chips as fuel for heat energy. The tribe has partnered with ColPac for this project. The project schedule from this document is shown below (QIN and American Community Enrichment 2014):
QIN Pellet Manufacturing Feasibility Study Project Task Timeline
Assessment of Bio-fuel available: February 1−April 1, 2014
Assessment of Biomass Components: February 1−August 1, 2014
Development of Operational Processes and Storage Requirements: February 1−June 1, 2014
Washington Coastal Marine Advisory Council Economic Profiles of Washington Coast Tribes | 3-29

Economic Analysis to Support Marine Spatial Planning in Washington
Analysis of Pellet Market: April 1−July 1, 2014
Project Community Outreach: February 1−August 1, 2014
Develop Business Model: July 1−August 1, 2014
Progress Reports: Midpoint May 1, 2014; Final September 22, 2014
Taholah Relocation Project
Taholah, the ancestral home of the Quinault people, is in the official tsunami hazard zone, as classified by the Washington Emergency Management Division. The village currently has more than 1,000 residents as well as the Taholah Mercantile, jail, courthouse, daycare facility, Head Start facility and a K-12 school (Montreuil 2014).
The increased risk of flooding has been known for some time by the tribe. The QIN did its own assessment of the coastline flooding risks. On March 25, 2014 the deteriorating seawall, built in the 1970s to protect the lower village, was breached and flooded the village. While the U.S. Army Corps of Engineers provided temporary reinforcement of the seawall, relocation of Taholah to higher ground is the long term plan (Esser 2014).
The QIN obtained a federal grant to develop a master plan for relocation of the Taholah village. Development of this plan is anticipated to occur over a 3-year time period. The tribe issued a Request for Qualifications (RFQ) for this work in January 2014; the project was awarded to Kaul Design Associates.
Another RFQ was issued in 2015 to design a recreation center that would be part of the relocated community. The RFP states: “The Quinault Indian Nation (QIN) is seeking an Architectural/Engineering Design firm or team to prepare a feasibility study for a recreation building to house a swimming pool, gymnasium, exercise/fitness rooms, showers and changing rooms, staff offices, and meeting rooms. This is one of the first of many projects to relocate the Village of Taholah beyond the tsunami zone” (QIN 2015).
3-30 | Economic Profiles of Washington Coast Tribes Washington Coastal Marine Advisory Council

Economic Analysis to Support Marine Spatial Planning in Washington
3.5 SHOALWATER BAY
The Shoalwater Bay Reservation is located in Pacific County on the north shore of Willapa Bay. The original reservation consisted of 335 acres of uplands. Subsequent legal decisions added some 700 acres of tidelands. The tribe also acquired another 105 acres of uplands to be held in trust. Today the reservation is slightly more than 1 mile square with 440 acres of uplands and 700 acres of salt marsh and tidal flats. Within the tidal portion of the reservation are small bays and intertidal marsh communities (Shoalwater Bay Indian Tribe 2008; M. Rogers, per. comm., 2015).
The upland portion of the reservation is mostly a steep ridge, leaving only a narrow piece of developable land along the shoreline. State Route 105 runs along this narrow strip. The Shoalwater Tribe has well maintained tribal facilities and housing along this strip but much of it is at risk for tsunami flooding.
Of the five coastal tribes, only the Shoalwater Bay Tribe did not treaty with the federal government. As such, it does not have a secured U&A treaty fishing area (Shoalwater Bay Tribe 2015).
3.5.1 Population and Housing
According to the 2010 U.S. Census, there were 82 individuals living on the reservation (U.S. Census Bureau 2012). The tribe has more than 300 enrolled members (Williams 2015).
Table 3-12 shows the age distribution of the Shoalwater Bay Reservation population. The median age for the population on the reservation was 28.5 years in 2010.
Table 3-12 Shoalwater Bay Indian Reservation Age Distribution
Age Group Number Percent
Under 5 years 5 6.1
5-19 years 22 26.8
19-64 years 50 60.1
65 and older 5 6.1
Total 82 100.0
Source: U.S. Census Bureau 2012.
The 2010 census reports a total of 30 occupied housing units on the reservation. Of these 19 (56 percent) were identified as owner-occupied housing units. The average household size for owner-occupied housing was 2.6, compared to 2.9 for rental units.
(cc) Sam Beebe, 2008
Aerial view of Shoalwater Bay and Tokeland
Washington Coastal Marine Advisory Council Economic Profiles of Washington Coast Tribes | 3-31
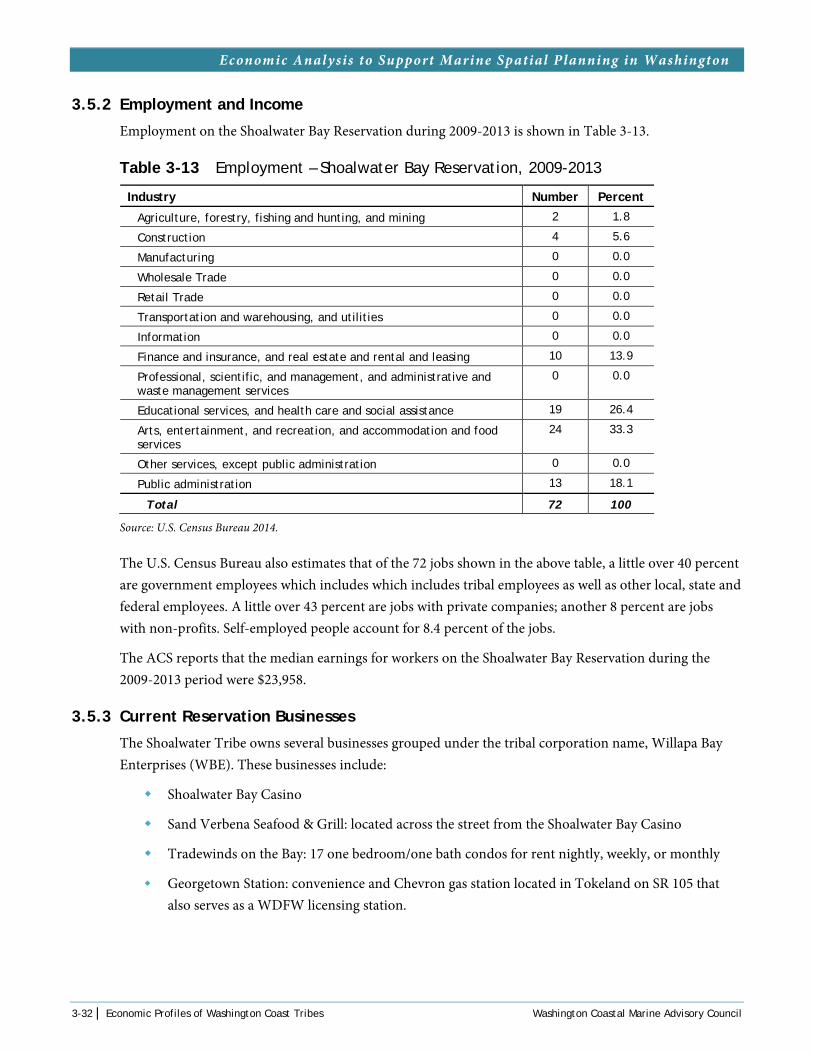
Economic Analysis to Support Marine Spatial Planning in Washington
3.5.2 Employment and Income
Employment on the Shoalwater Bay Reservation during 2009-2013 is shown in Table 3-13.
Table 3-13 Employment – Shoalwater Bay Reservation, 2009-2013
Industry Number Percent
Agriculture, forestry, fishing and hunting, and mining 2 1.8
Construction 4 5.6
Manufacturing 0 0.0
Wholesale Trade 0 0.0
Retail Trade 0 0.0
Transportation and warehousing, and utilities 0 0.0
Information 0 0.0
Finance and insurance, and real estate and rental and leasing 10 13.9
Professional, scientific, and management, and administrative and waste management services
0 0.0
Educational services, and health care and social assistance 19 26.4
Arts, entertainment, and recreation, and accommodation and food services
24 33.3
Other services, except public administration 0 0.0
Public administration 13 18.1
Total 72 100
Source: U.S. Census Bureau 2014.
The U.S. Census Bureau also estimates that of the 72 jobs shown in the above table, a little over 40 percent are government employees which includes which includes tribal employees as well as other local, state and federal employees. A little over 43 percent are jobs with private companies; another 8 percent are jobs with non-profits. Self-employed people account for 8.4 percent of the jobs.
The ACS reports that the median earnings for workers on the Shoalwater Bay Reservation during the 2009-2013 period were $23,958.
3.5.3 Current Reservation Businesses
The Shoalwater Tribe owns several businesses grouped under the tribal corporation name, Willapa Bay Enterprises (WBE). These businesses include:
Shoalwater Bay Casino
Sand Verbena Seafood & Grill: located across the street from the Shoalwater Bay Casino
Tradewinds on the Bay: 17 one bedroom/one bath condos for rent nightly, weekly, or monthly
Georgetown Station: convenience and Chevron gas station located in Tokeland on SR 105 that also serves as a WDFW licensing station.
3-32 | Economic Profiles of Washington Coast Tribes Washington Coastal Marine Advisory Council

Economic Analysis to Support Marine Spatial Planning in Washington
3.5.4 Plans for the Future
In late 2014 the Shoalwater Bay Tribe bought several hundred acres including a former golf course and some agricultural land that was no longer being farmed. This newest land purchase also adds about 300 acres of wetlands and tideland to the reservation which already included tidelands (M. Rogers, pers. comm., 2015).
According to a recent Daily Astorian article, at least 10 acres of this purchase may be developed for housing. Another potential development on this new property is a wastewater treatment plant (Williams 2015).
In this same article Tribal Chairman Douglas Davis said that the tribe has more than 300 enrolled members and is growing, in part due to declines in infant mortality in the past 10-15 years. He said, “We’ve had such growth on or near the reservation; the next logical step is to increase our land” (Williams 2015).
The tribe is also adding to its timberland holdings outside of the tsunami zone. A planned acquisition of 200 acres will bring the total to 1,000 acres of timberland. Some of this land may be used for housing because an estimated 86 percent of the Shoalwater Reservation population lives in the inundation zone identified by a recent assessment of tsunami risks to coastal communities (U.S. Geological Survey and Washington Military Department Emergency Management Division 2013).
REFERENCES
Always Fishing. 2015. La Push King Salmon Charters. Available at: www.worldwidefishing.com/ salt/UnitedStates/Washington/NeahBay/b297/index.html.
Audubon Society. 2012. The Great Washington State Birding Trail, Olympic Loop. Available at: wa.audubon.org/great-washington-state-birding-trail. August 7, 2012.
Bruscas, Angelo. 2015. “City Told Marina Closed by Quinault Nation.” North Coast News. April 15, 2015.
Emerald Sea Photography, LCC. Underwater Photography by Scott Boyd. Available at: www.boydski.com/default.htm. Accessed on May 16, 2015.
Esser, Doug. 2014. “Corps, Tribe Plan More Seawall Repair at Taholah.” The Columbian. Available at: www.columbian.com/news/2014/jun/03/corps-tribe-plan-more-seawall-repair-at-taholah. June 3, 2014.
Fisherman’s News. 2015. “The New Neah Bay Ice Plant: An Educational Tour.” January 1, 2015.
Forks Forum. 2014a. “Quileute Tribe to Purchase the 110 Business Park.” December 2, 2014.
Forks Forum. 2014b. “Quileute Tribal Council Statement on 110 Business Park Purchase.” Dec 11, 2014.
Gottlieb, Paul. 2012. “Makah Win $1 Million Federal Grant to Replace Aging Commercial Dock.” Peninsula Daily News. May 5, 2012.
Washington Coastal Marine Advisory Council Economic Profiles of Washington Coast Tribes | 3-33
Economic Analysis to Support Marine Spatial Planning in Washington
Hoh Indian Tribe. 2015. Tribal website. Available at: hohtribe-nsn.org. Accessed March 3, 2015.
IEc. See Industrial Economics, Incorporated.
Industrial Economics, Incorporated. 2014. Marine Sector Analysis Report: Recreation and Tourism. August 14, 2014. Prepared for Washington Coastal Marine Advisory Committee
KXRO Radio. 2014. “Quinault Nation Moving Forward with Plans to Buy Ramada.” Available at: www.kxro.com/quinault-indian-nation-moving-forward-with-plans-to-buy-ramada. Broadcast on October 8, 2014.
Lawrence, Wendy. 2014. My View: Native American Housing. July 2014. Available at: www.wshfc.org/newsletter/2014.07.print.pdf.
Leach, Leah. “Quillayute River Channel Dredging back on Track: Project at Harbor in La Push Expected to begin in September.” Peninsuladailynew.com. Available at: www.peninsuladailynews.com/article/20140307/NEWS/303079962March 6, 2014.
Mapes, Linda V. 2010. “Besieged by Water, Hoh Tribe Seeks 37 Acres of Olympic National Park.” Seattle Times. March 9, 2010.
Montreuil, Brandi. 2014. “Quinault’s Taholah Village to Relocate due to Ocean Threats.” TulaipNews.com. Available at: www.tulalipnews.com/wp/2014/06/04/quinaults-taholah-lower-village-to-relocate-due-to-ocean-threats. June 4, 2014.
Norman, K., et al. 2007. Community Profiles for West Coast and North Pacific Fisheries–Washington, Oregon, California, and Other U.S. states. U.S. Department of Commerce, National Oceanic and Atmospheric Administration. Tech. Memo. NMFS-NWFSC-85.
Northwest Portland Area Indian Health Board. 2015a. Hoh Tribe. Available at: www.npaihb.org/ member_tribes/tribe/hoh_tribe. Accessed on December 15, 2014.
Northwest Portland Area Indian Health Board. 2015b. Makah Tribe. Available at: www.npaihb.org/member_tribes/tribe/makah_tribe. Accessed on May 5, 2015.
Pacific Forest Management, Inc. 2014a. Draft Environmental Assessment for the Forest Management Plan. Hoh Indian Reservation, Washington. 2014.
Pacific Forest Management, Inc. 2014b. Draft Forest Management Plan. Hoh Indian Reservation, Washington. 2014.
Quileute Tribe. 2013. Comprehensive Economic Strategy (CEDS) – 2013-2018. September 25, 2013.
Quileute Tribe. 2014. Quileute Response to State Recreational Sector Analysis (MSP). June 16, 2014.
Quileute Tribe. 2015. Natural Resources. Available at: www.quileutenation.org/ government/natural-resources.
Quinault Indian Nation. 2008. Comprehensive Economic Strategy (EDS) 5-Year Plan – 2008-2012. Approved August 25, 2008.
3-34 | Economic Profiles of Washington Coast Tribes Washington Coastal Marine Advisory Council

Economic Analysis to Support Marine Spatial Planning in Washington
Quinault Indian Nation. 2015. Request for Qualifications – Recreation Building Feasibility Study – Quinault Indian Nation. January 22, 2015.
Quinault Indian Nation and U.S. Bureau of Indian Affairs, Division of Energy and Mineral Development. No title, no date. Available at: www.bia.gov/cs/groups/xieed/documents/text/idc008234.pdf.
Quinault Indian Nation and American Community Enrichment. 2014. Quinault Indian Nation 2014 Comprehensive Biomass for Heat Project Strategy Development. September 26, 2014.
Resource Dimensions. 2015. Economic Impacts of Crude Oil Transport on the Quinault Indian Nation and the Local Economy. April 0215.
Serlin, Christine. 2015. “Makah Tribe Builds Permanent Supportive Housing.” Roundhouse Talk. Updated January 15, 2015.
Shoalwater Bay Indian Tribe. 2008. Shoalwater Bay Tribal Hazard Mitigation Plan. Spring 2008. Available at: nwtemc.org/documents/SBIT_HMP/Shoalwater_Bay_Tribe_HMP_Final_6.08.pdf.
Shoalwater Bay Tribe. 2015. Shoalwater Bay Tribe History-Culture. Available at: shoalwaterbaytribe.com/shoalwter-bay-tribe-history-culture. Accessed June 28, 2015.
Talking Raven. 2014b. From Council Chambers. May 2014: Volume 8, Issue 5.
Talking Raven. 2014a. “River’s Edge Is Open for Business!” July 2014: Volume 8, Issue 7.
Top Notch Ocean Charters. 2015. Home Page. Available at: www.forks-web.com/jim/salt.htm.
U.S. Census Bureau. 2012. Washington: 2010: Population and Housing Unit Counts. Washington, DC. Issued August 2012.
U.S. Census Bureau. 2014. 2009-2013 5-year American Community Survey. Available at: www.census.gov/acs/www/data_documentation/geography/.
U.S. Coast Guard Station – Quillayute River. 2015. Home Page. Available at: www.uscg.mil/d13/ staquillayuteriver.
U.S. Department of Commerce. 2014. “U.S. Department of Commerce Invests $1.5 Million to Help Quinault Indian Nation Upgrade Critical Infrastructure.” DOC online press release. July 8, 2014.
U.S. Department of Commerce, National Oceanic and Atmospheric Administration, National Ocean Service, Office of National Marine Sanctuaries. 2013. Climate Change and the Olympic Coast National Marine Sanctuary: Interpreting Potential Futures. March 2013.
U.S. Department of Commerce, National Oceanic and Atmospheric Administration, National Marine Fisheries. 2015. Draft Environmental Impact Statement on the Makah Tribe Request to Hunt Gray Whales. February 2015.
U.S. Department of Interior. 2014. “Interior Sends Additional $1.2 Million in Purchase Offers to Nearly 600 Landowners with Fractional Interests at Makah Reservation.” DOI Online Press Release. April 15, 2014.
Washington Coastal Marine Advisory Council Economic Profiles of Washington Coast Tribes | 3-35

Economic Analysis to Support Marine Spatial Planning in Washington
U.S. Fish and Wildlife Service. Quinault National Fish Hatchery. Available online at: www.fws.gov/Quinaultnfh. Accessed on February 2, 2015.
U.S. Geological Survey and Washington Military Department, Emergency Management Division. How Vulnerable is the Shoalwater Bay Reservation to Tsunamis? Available online at: mil.wa.gov/uploads/pdf/emergency-management/haz_tfs_shoalwater.pdf. 2013.
Walker, Erin. 2014. Port of Neah Bay – Commercial Fish Buying Business Opportunity. June 30, 2014.
Walker, Richard. 2011. “Hoh Growth Will Lead to Prosperity.” Published in Indian Country, February 25, 2011.
Washington Department of Fish and Wildlife. Charter Boat Fishing data provided by Heather Reed to Dr. Edward Waters. January 22, 2015
Washington Trail Association. 2015. Cape Flattery. Available online at: www.wta.org/go-hiking/hikes/cape-flattery. Accessed on May 7, 2015
Water4fish. 2014. “Quinault Tribal Enterprises Purchases Westport Marina Tenant.” Published online, July 17, 2014.
Williams, Mike. “Shoalwaters Buy Elbow Room in Tokeland.” Daily Astorian. March 4, 2015.
PERSONAL COMMUNICATIONS
Brux, Billy. Owner, Hooked on Fishing Ocean Charters LLC. Personal communication with Janet Baker on February 23, 2015, regarding La Push charters.
Corpuz, Frank. Cape Resort Employee. Personal communication with Janet Baker on June 26, 2015, regarding the number of tent sites at Cape Resort.
Hagen, Jennifer. Marine Biologist, Quileute Tribe. Personal communication with Janet Baker and Michael Taylor February 24, 2015, regarding commercial fishing and other natural resource issues.
Krueger, Katie. Tribal Attorney, Quileute Tribe. Personal communication with Janet Baker and Michael Taylor on February 24, 2015; email communication on February 24, 2015, with 2014 Tribal Enrollment from Annual Report to Council dated January 2015. Email communication with Michael Taylor June 15, 2015 regarding comments and corrections to the draft economics report.
Moon, Mel. Natural Resource Director, Quileute Tribe. Personal communication Janet Baker and Michael Taylor on February 24, 2015, regarding Quileute forestry and fishery resources
Rainey, Mike. Business Manager, Makah Tribe Personal communication Janet Baker and Michael Taylor regarding Makah tribal enterprises and economic development plans.
Rogers, Michael, Tribal Administrator. Shoalwater Bay Indian Tribe, email communication with Michael Taylor regarding Shoalwater Bay tribal businesses and reservation acreage. June 8, 2015.
3-36 | Economic Profiles of Washington Coast Tribes Washington Coastal Marine Advisory Council

Economic Analysis to Support Marine Spatial Planning in Washington
IMAGES
Chapter 3 Header Image. (cc) John Murphy, 2011. Washington Coast near Kalalock. Retrived July 5, 2015 from: www.flickr.com/photos/kingair42/5652090829
Page 3-4: Sam Beebe, 2008. Makah Nation and Waatch River. Retrieved July 5, 2015, from: www.flickr.com/photos/sbeebe/2849069112
Page 3-17: Scott Costello, 2014. 02 February La Push. www.flickr.com/photos/23122882@N05/ 15715267907
Page 3-21: Sam Beebe, 2008. Hoh River Mouth. Retrieved July 5, 2015, from: www.flickr.com/photos/ sbeebe/2848235119
Page 3-24: Sam Beebe, 2013. Paddle to Quinault 2013. Retrieved July 5, 2015, from: www.flickr.com/photos/sbeebe/9469015650
Page 3-29: Sam Beebe, 2008. Shoalwater Bay Tribe and Tokeland. Retrieved July 5, 2015, from: www.flickr.com/photos/sbeebe/2848233215
Washington Coastal Marine Advisory Council Economic Profiles of Washington Coast Tribes | 3-37

Economic Analysis to Support Marine Spatial Planning in Washington
This page intentionally left blank.
3-38 | Economic Profiles of Washington Coast Tribes Washington Coastal Marine Advisory Council

CHAPTER 4. Washington Coast Commercial Fisheries
4.1 NON-TRIBAL COMMERCIAL FISHERIES SECTORS
Fishing is an important and historical component of the Washington coast economy. Commercial fisheries landings and seafood processing operations supply markets in the United States, Canada, and countries overseas and provide income and employment in the region. Important commercial fisheries operating on the Washington Coast include those for groundfish (including lingcod, rockfish, flatfish, sablefish or “black cod,” and Pacific whiting or “hake”), Dungeness crab, Pacific sardines, pink shrimp, albacore tuna, Pacific salmon species (including mostly Chinook, coho and chum salmon), and other fisheries for species such as Pacific halibut, and shellfish such as razor clams. Commercial net fisheries for salmon are also conducted in inside waters, in the Columbia River and tributaries of Willapa Bay and Grays Harbor. Large-scale fisheries for Pacific whiting are conducted in offshore waters by catcher-processors and “mothership” floating processors and associated catcher vessels.
Tribal fisheries for Pacific whiting, groundfish, and salmon, among other species, are also conducted in the region’s waters. Descriptions of those important fisheries are not included in this section but are discussed below in Section 4.3, “Tribal Fisheries.”1
1 The four treaty tribes on the Washington Pacific Coast have access as a matter of law to 50 percent of the harvestable fish passing through their respective treaty areas in the Pacific Ocean, and they conduct commercial as well as subsistence and ceremonial harvests. As discussed in Section 4.3, “Tribal Fisheries,” the tribes each promulgate their own regulations and develop management plans controlling these harvests along with the appropriate co-managers in the state and federal fishery management agencies.
4-1 | Washington Coast Commercial Fisheries Washington Coastal Marine Advisory Council

Economic Analysis to Support Marine Spatial Planning in Washington
Figure 4-1 Fishing Grounds and Main Ports in the Washington Coast MSP Region
4-2 | Washington Coast Commercial Fisheries Washington Coastal Marine Advisory Council

Economic Analysis to Support Marine Spatial Planning in Washington
Published data provide some idea of the scale of landings and ex-vessel revenue (i.e., revenue paid to the harvester by the purchaser receiving the landing) involved, but these data may underestimate activity for certain species and ports because of confidentiality constraints that limit disclosure of business information for aggregations with fewer than three participants.
For this project, non-tribal commercial fisheries landings and revenue data during 2004-2014 were obtained on request from the Washington Department of Fish and Wildlife (WDFW). In the data set, landings were identified at the county, vessel, buyer, and Pacific Fisheries Information Network (PacFIN) port code level. Coastal region ports where most commercial fisheries landings are made are La Push and Neah Bay in Clallam County, Westport in Grays Harbor County, Ilwaco and Willapa Bay ports in Pacific County, and Cathlamet and Skamokawa in Wahkiakum County. Table 4-1 lists PacFIN port codes in the Washington coast study region by county, along with the list of underlying ports or communities (PacFIN 2015).2
Table 4-1 PacFIN Landings Ports and Associated Communities in the Washington Coast Region
County Port Identifiers Ports / Communities Included
Clallam SEQ Sequim
PAG Port Angeles
NEA Neah Bay
LAP La Push
Jefferson (West) OWC Queets, Quillayute, Kalaloch, Hoh
Grays Harbor GRH Aberdeen, Bay City, Hoquiam, Oakville
WPT Westport
OWC Grayland, Grayland Beach, Taholah, Moclips
Pacific WLB Tokeland, South Bend, Raymond, Naselle, Nahcotta, Bay Center
LWC Ilwaco, Chinook
OWC Long Beach
OCR Megler, Frankfort, Other Pacific County
Wahkiakum LWC Skamokawa
OCR Gray’s Bay, Cathlamet
Source: PacFIN 2015.
While this level of data aggregation was more than adequate for describing activity in most Washington Coast ports, it was not sufficient to differentiate landings occurring in, for example, the individual ports associated with Willapa Bay (WLB), the smaller ports in Pacific County (OCR), or ports in the Grays Harbor County (OWC) port grouping.
2 Note that some of the ports listed in Table 4-1 are only open to landings by tribal vessels.
Washington Coastal Marine Advisory Council Washington Coast Commercial Fisheries | 4-3
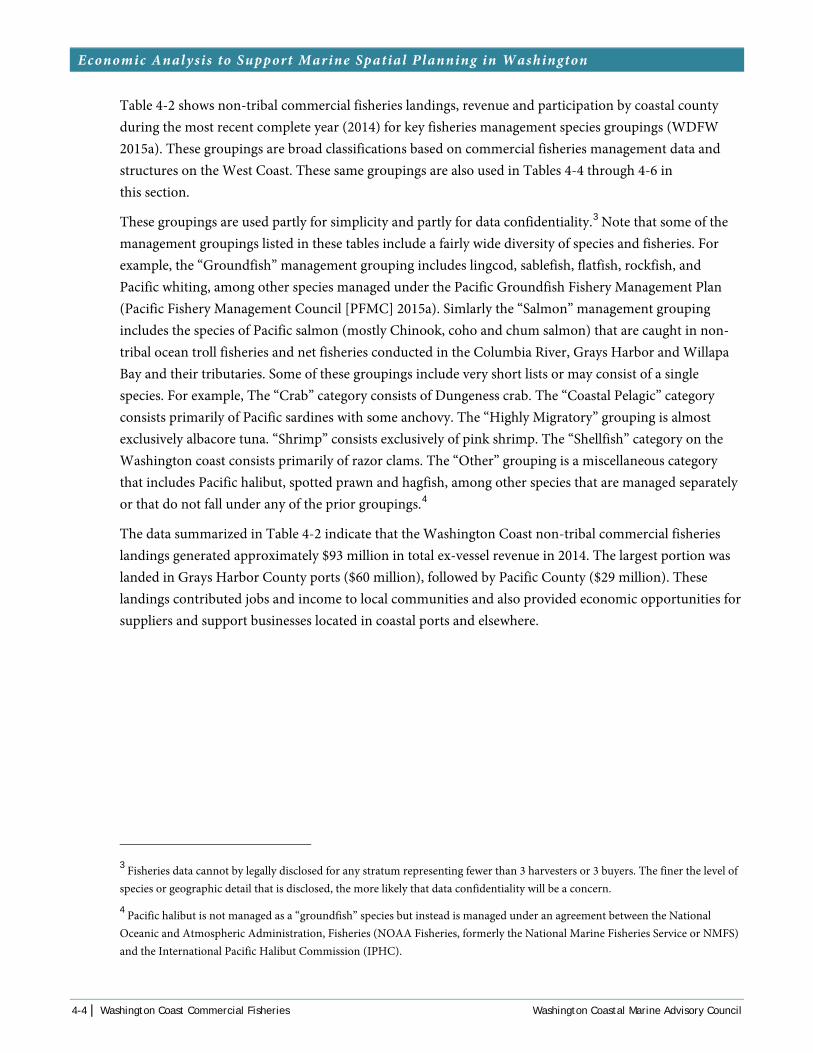
Economic Analysis to Support Marine Spatial Planning in Washington
Table 4-2 shows non-tribal commercial fisheries landings, revenue and participation by coastal county during the most recent complete year (2014) for key fisheries management species groupings (WDFW 2015a). These groupings are broad classifications based on commercial fisheries management data and structures on the West Coast. These same groupings are also used in Tables 4-4 through 4-6 in this section.
These groupings are used partly for simplicity and partly for data confidentiality.3 Note that some of the management groupings listed in these tables include a fairly wide diversity of species and fisheries. For example, the “Groundfish” management grouping includes lingcod, sablefish, flatfish, rockfish, and Pacific whiting, among other species managed under the Pacific Groundfish Fishery Management Plan (Pacific Fishery Management Council [PFMC] 2015a). Simlarly the “Salmon” management grouping includes the species of Pacific salmon (mostly Chinook, coho and chum salmon) that are caught in non-tribal ocean troll fisheries and net fisheries conducted in the Columbia River, Grays Harbor and Willapa Bay and their tributaries. Some of these groupings include very short lists or may consist of a single species. For example, The “Crab” category consists of Dungeness crab. The “Coastal Pelagic” category consists primarily of Pacific sardines with some anchovy. The “Highly Migratory” grouping is almost exclusively albacore tuna. “Shrimp” consists exclusively of pink shrimp. The “Shellfish” category on the Washington coast consists primarily of razor clams. The “Other” grouping is a miscellaneous category that includes Pacific halibut, spotted prawn and hagfish, among other species that are managed separately or that do not fall under any of the prior groupings.4
The data summarized in Table 4-2 indicate that the Washington Coast non-tribal commercial fisheries landings generated approximately $93 million in total ex-vessel revenue in 2014. The largest portion was landed in Grays Harbor County ports ($60 million), followed by Pacific County ($29 million). These landings contributed jobs and income to local communities and also provided economic opportunities for suppliers and support businesses located in coastal ports and elsewhere.
3 Fisheries data cannot by legally disclosed for any stratum representing fewer than 3 harvesters or 3 buyers. The finer the level of species or geographic detail that is disclosed, the more likely that data confidentiality will be a concern.
4 Pacific halibut is not managed as a “groundfish” species but instead is managed under an agreement between the National Oceanic and Atmospheric Administration, Fisheries (NOAA Fisheries, formerly the National Marine Fisheries Service or NMFS) and the International Pacific Halibut Commission (IPHC).
4-4 | Washington Coast Commercial Fisheries Washington Coastal Marine Advisory Council

Economic Analysis to Support Marine Spatial Planning in Washington
Table 4-2 Landings, Ex-vessel Revenues, and Participation by County for Washington Coast Non-Tribal Commercial Fisheries in 2014
Number of Vessels
County Management
Group
Round Weight
(1,000 lbs)
Ex-vessel Revenue ($1,000)
Number of Dealers
All Identified Vessels
Vessels > $1,000
Clallam
Crab 13 72
Groundfish 202 544
Highly Migratory 46 59
Salmon 219 853
Shrimp 1,077 865
Other 463 583
Clallam Totals 2,020 2,975 20 88 79
Grays Harbor
Coastal Pelagic 12,370 2,137
Crab 4,941 22,481
Groundfish 38,615 4,433
Highly Migratory 12,070 13,835
Salmon 268 988
Shrimp 28,133 14,796
Shellfish 29 79
Other 929 993
Grays Harbor Totals 97,355 59,742 45 354 349
Pacific
Coastal Pelagic 5,296 1,071
Crab 3,661 14,014
Groundfish 12,365 4,347
Highly Migratory 5,068 6,322
Salmon 1,304 2,347
Shrimp 1,333 738
Shellfish 128 253
Other 51 193
Pacific Totals 29,206 29,285 30 364 342
Wahkiakum Salmon 778 965
Other 1 1
Wahkiakum Totals: 779 966 7 80 72
Washington Coastal Marine Advisory Council Washington Coast Commercial Fisheries | 4-5

Economic Analysis to Support Marine Spatial Planning in Washington
Number of Vessels
County Management
Group
Round Weight
(1,000 lbs)
Ex-vessel Revenue ($1,000)
Number of Dealers
All Identified Vessels
Vessels > $1,000
WA Coast Totals:
Coastal Pelagic 17,666 3,208
Crab 8,615 36,567
Groundfish 51,182 9,324
Highly Migratory 17,184 20,216
Salmon 2,568 5,152
Shrimp 30,543 16,398
Shellfish 157 332
Other 1,444 1,769
Grand Total 129,360 92,967 98 700 672
Source: WDFW 2015a
Table 4-2 also shows participation by identified vessels and dealers in the non-tribal commercial fishery. Coastwide, 98 registered dealers took comercial deliveries in 2014. By county, the largest portion of them operated in Grays Harbor County (45), followed by Pacific County (30). Of the 700 identified commercial vessels making landings in Washington Coast ports, the greatest number (364) landed in Pacific County ports, followed by Grays Harbor County ports (354). If filtered to exclude vessels landing less that $1,000 ex-vessel revenue during the year, however, Grays Harbor County ports had the greatest number of vessels (349), followed closely by Pacific County (342) (WDFW 2015a).
In terms of ex-vessel revenue, coastwide landings of crab ($37 million), highly migratory species (albacore) ($20 million), and pink shrimp ($16 milion) were the largest species management groups. Crab made up the largest portion of landings revenue in Grays Harbor County ($22 million) and Pacific County ($14 million); in Clallam County, shrimp was the largest component, followed closely by salmon (both about $0.9 million). In Wahkiakum County ports, salmon was by far the largest portion of ex-vessel revenue ($1 million). In terms of coastwide total volume (round weight) landed, groundfish comprised the largest portion (51 million pounds [lbs], largely because Pacific whiting is included in this grouping), followed by shrimp (31 million lbs), coastal pelagic species (CPS) (mostly sardines ) (18 million lbs), and hHighly migratory species (albacore) (18 million lbs) (WDFW 2015a).
Another piece of the picture is the geographic distribution of ownership for vessels making deliveries in Washington Coast ports. Table 4-3 shows counts by region of owners’ residences for vessels recording commercial fisheries landings in the five-county Washington Coast region during 2014, along with the associated amounts of ex-vessel revenues. About 43 percent (299) of the 700 vessels making deliveries in 2014 were owned by Washington Coast residents. These vessels accounted for approximately that same share of total ex-vessel revenue. The 33 percent of vessels that were owned by residents of other places in Washington State (232) accounted for about 25 percent of total ex-vessel revenue. About 10 percent (72) of vessels making landings were owned by Oregon residents. These vessels accounted for about 14 percent of total ex-vessel revenue landed in Washington Coast ports (WDFW 2015a).
4-6 | Washington Coast Commercial Fisheries Washington Coastal Marine Advisory Council

Economic Analysis to Support Marine Spatial Planning in Washington
Table 4-3 Counts and Total Non-Tribal Ex-vessel Revenue Landed in 2014 in Washington Coast Ports by Vessel Owner’s Address
Vessel Owners’ Region No. of Vessels
Ex-vessel Revenue ($1,000)
Washington Coast* 299 40,439
Other Washington 232 23,657
Oregon 72 13,143
Elsewhere 90 13,326
Unknown 7 1,058
No vessel ID − 1,344
Total 700 92,967
*Vessel owner’s address is in one of the five Washington Coast counties.
Source: WDFW 2015a
Historically, the mix of commercial fishery species landed on the Washington Coast has varied according to the availability of the resource as well as vessels, processing capacity, and markets to catch, process, and sell the fish. For example, shrimp landings have more than tripled on the Washington Coast in the past 2 years, driven at least partly by a shifting of shrimp processing capacity northward into Washington.
Table 4-4 and Table 4-5 show annual landings in Washington Coast commercial fisheries for the seven main species management groups during 2004-2014 (WDFW 2015a). Table 4-4 shows total landing volumes in terms of round weight in pounds (lbs) delivered to Washington Coast ports each year during the period. Table 4-5 shows the total inflation-adjusted ex-vessel revenue earned by the vessels making those deliveries.
As Table 4-4 shows, total landing volumes reached a high point during the 2004-2014 period of approximately 167 million lbs in 2013, before dropping to approximately 129 million lbs in 2014. Although landings of shrimp and salmon were higher in 2014 than in 2013, these increases were more than offset by lower volumes of crab and CPS (sardines) landed (WDFW 2015a).
Table 4-5 shows the highest total ex-vessel value during the period (in terms of inflation-adjusted 2014 dollars) was approximately $97 million in 2013, falling to approximately $93 million in 2014. The 2014 value was the third highest total in inflation-adjusted terms during the period shown, after the 2013 value and the 2011 inflation-adjusted total of approximately $94 million (WDFW 2015a).
Table 4-6 displays average annual inflation-adjusted ex-vessel value per lb for fisheries species management groups landed on the Washington Coast. Several interesting trends are indicated in the table, including historic high average prices in 2014 for crab, and also recent above-average values for groundfish (although the average price in the groundfish fishery is largely determined by the relative volume of Pacific whiting landings), shrimp, coastal pelagic species, shellfish, and other species (which include Pacific halibut and hagfish, among others). In contrast, in 2014, average ex-vessel values per lb were below the 11-year average for landings of salmon and highly migratory species management groups.
Washington Coastal Marine Advisory Council Washington Coast Commercial Fisheries | 4-7
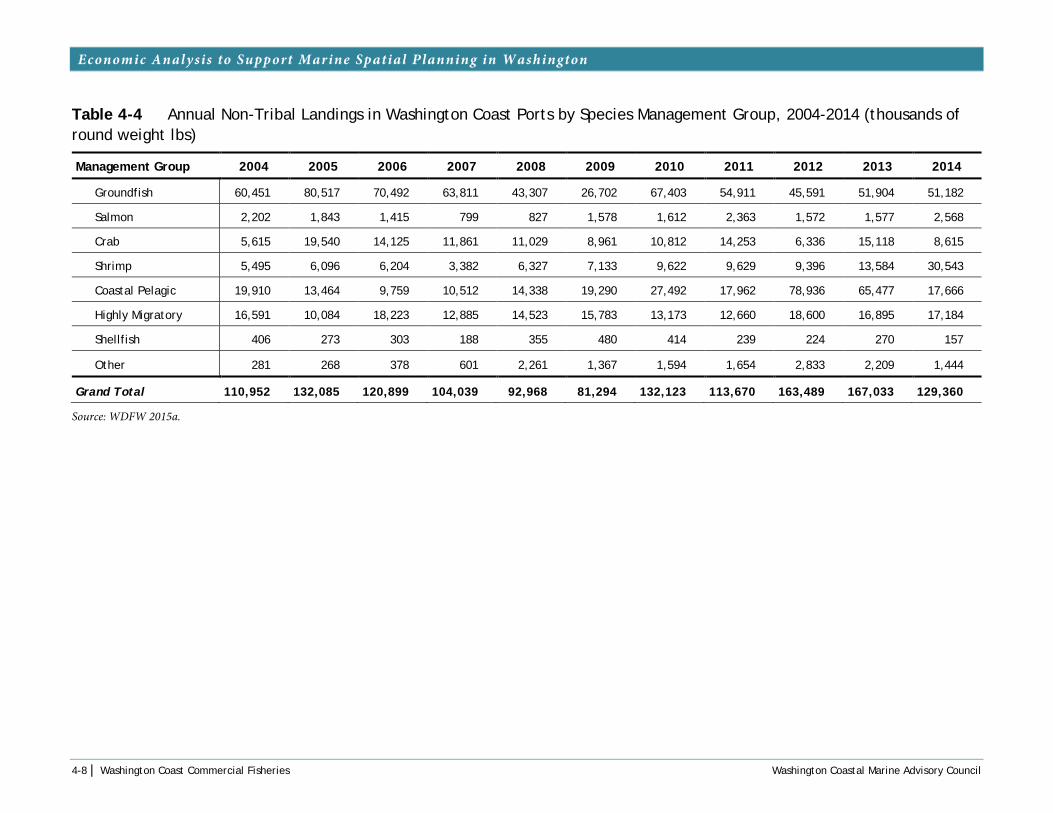
Economic Analysis to Support Marine Spatial Planning in Washington
Table 4-4 Annual Non-Tribal Landings in Washington Coast Ports by Species Management Group, 2004-2014 (thousands of round weight lbs)
Management Group 2004 2005 2006 2007 2008 2009 2010 2011 2012 2013 2014
Groundfish 60,451 80,517 70,492 63,811 43,307 26,702 67,403 54,911 45,591 51,904 51,182
Salmon 2,202 1,843 1,415 799 827 1,578 1,612 2,363 1,572 1,577 2,568
Crab 5,615 19,540 14,125 11,861 11,029 8,961 10,812 14,253 6,336 15,118 8,615
Shrimp 5,495 6,096 6,204 3,382 6,327 7,133 9,622 9,629 9,396 13,584 30,543
Coastal Pelagic 19,910 13,464 9,759 10,512 14,338 19,290 27,492 17,962 78,936 65,477 17,666
Highly Migratory 16,591 10,084 18,223 12,885 14,523 15,783 13,173 12,660 18,600 16,895 17,184
Shellfish 406 273 303 188 355 480 414 239 224 270 157
Other 281 268 378 601 2,261 1,367 1,594 1,654 2,833 2,209 1,444
Grand Total 110,952 132,085 120,899 104,039 92,968 81,294 132,123 113,670 163,489 167,033 129,360
Source: WDFW 2015a.
4-8 | Washington Coast Commercial Fisheries Washington Coastal Marine Advisory Council

Economic Analysis to Support Marine Spatial Planning in Washington
Table 4-5 Annual Non-Tribal Ex-vessel Revenue Landed in Washington Coast Ports by Species Management Group, 2004-2014 (in thousands of 2014 inflation-adjusted dollars)*
Management Group 2004 2005 2006 2007 2008 2009 2010 2011 2012 2013 2014
Groundfish 5,819 8,823 8,310 7,972 7,723 5,866 9,525 13,703 11,508 9,669 9,324
Salmon 3,009 3,116 2,965 2,022 2,188 3,154 5,071 4,605 3,997 4,656 5,152
Crab 12,503 33,075 26,154 29,664 29,923 21,072 26,483 43,511 23,778 42,554 36,567
Shrimp 2,625 3,032 2,371 1,868 3,740 2,776 4,145 5,220 4,764 5,928 16,398
Coastal Pelagic 1,525 844 521 566 1,489 1,926 2,934 2,299 8,212 6,771 3,208
Highly Migratory 16,349 11,625 16,045 11,333 18,403 17,320 15,570 22,091 28,216 24,086 20,216
Shellfish 349 252 238 170 326 1,204 2,145 570 513 388 332
Other 527 512 626 711 1,053 1,229 1,603 1,748 2,832 2,470 1,769
Grand Total 42,706 61,278 57,231 54,305 64,845 54,547 67,475 93,746 83,821 96,521 92,967
*Inflation-adjusted using the December 2014 Gross Domestic Product (GDP) deflator series (U.S. Department of Commerce, Bureau of Economic Analysis [BEA] 2015).
Source: WDFW 2015a.
Washington Coastal Marine Advisory Council Washington Coast Commercial Fisheries | 4-9

Economic Analysis to Support Marine Spatial Planning in Washington
Table 4-6 Average Annual Non-Tribal Ex-vessel Revenue per Round Weight Pound Landed in Washington Coast Ports by Species Management Group (in 2014 inflation-adjusted dollars*)
Management Group 2004 2005 2006 2007 2008 2009 2010 2011 2012 2013 2014
11-yr Average
Groundfish 0.10 0.11 0.12 0.12 0.18 0.22 0.14 0.25 0.25 0.19 0.18 0.16
Salmon 1.37 1.69 2.10 2.53 2.65 2.00 3.15 1.95 2.54 2.95 2.01 2.18
Crab 2.23 1.69 1.85 2.50 2.71 2.35 2.45 3.05 3.75 2.81 4.24 2.58
Shrimp 0.48 0.50 0.38 0.55 0.59 0.39 0.43 0.54 0.51 0.44 0.54 0.49
Coastal Pelagic 0.08 0.06 0.05 0.05 0.10 0.10 0.11 0.13 0.10 0.10 0.18 0.10
Highly Migratory 0.99 1.15 0.88 0.88 1.27 1.10 1.18 1.74 1.52 1.43 1.18 1.21
Shellfish 0.86 0.92 0.79 0.90 0.92 2.51 5.18 2.39 2.29 1.43 2.12 1.96
Other 1.87 1.91 1.66 1.18 0.47 0.90 1.01 1.06 1.00 1.12 1.23 1.01
*Inflation-adjusted using the December 2014 GDP deflator series (BEA 2015).
Source: WDFW 2015a.
4.1.1 At-sea Pacific Whiting Fisheries
Trawl groundfish fisheries off the Washington coast include an at-sea fishery for Pacific whiting conducted by trawl vessels that deliver to floating processors or “motherships,” and by catcher-processor vessels. The annual at-sea fishery for Pacific whiting is conducted offshore along the West Coast, moving during the season as the fishery resource migrates northward from Northern California toward Canada. The two sectors comprising the at-sea fishery are organized as co-ops to help control total catch, by-catch and area of effort. Annual total catch allowances and geographic areas where catch occurs can vary significantly from year to year. Participants in the at-sea Pacific whiting fisheries were not directly incorporated into the individual fisheries quota (IFQ) system; however, catcher vessels delivering to motherships were formed into cooperative groups (co-ops) and granted “catch history assignments,” based on their historic participation, that could be assigned to another vessel to harvest within a co-op. Pacific whiting catcher-processors have been organized as a co-op since the 1990s.
Table 4-7 summarizes estimated historical catch off the Washington Coast in the two sectors of he at-sea Pacific whiting fishery.
4-10 | Washington Coast Commercial Fisheries Washington Coastal Marine Advisory Council
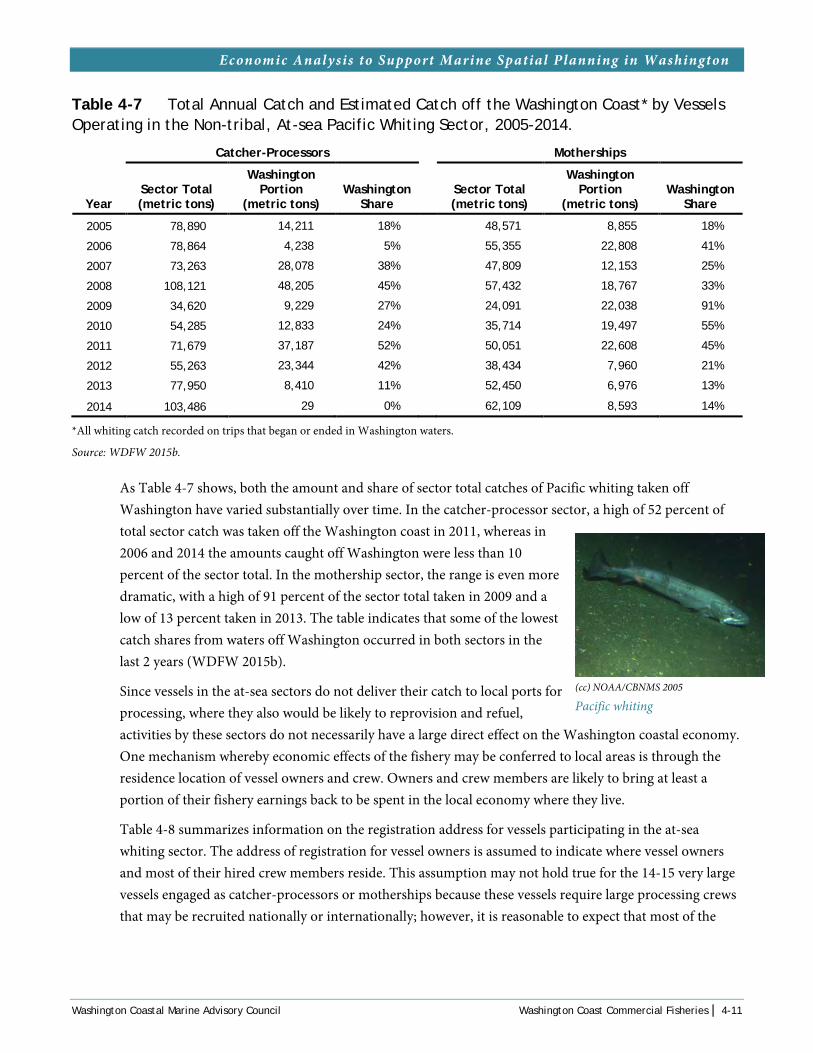
Economic Analysis to Support Marine Spatial Planning in Washington
Table 4-7 Total Annual Catch and Estimated Catch off the Washington Coast* by Vessels Operating in the Non-tribal, At-sea Pacific Whiting Sector, 2005-2014.
Catcher-Processors Motherships
Year Sector Total (metric tons)
Washington Portion
(metric tons) Washington
Share
Sector Total (metric tons)
Washington Portion
(metric tons) Washington
Share
2005 78,890 14,211 18% 48,571 8,855 18%
2006 78,864 4,238 5% 55,355 22,808 41%
2007 73,263 28,078 38% 47,809 12,153 25%
2008 108,121 48,205 45% 57,432 18,767 33%
2009 34,620 9,229 27% 24,091 22,038 91%
2010 54,285 12,833 24% 35,714 19,497 55%
2011 71,679 37,187 52% 50,051 22,608 45%
2012 55,263 23,344 42% 38,434 7,960 21%
2013 77,950 8,410 11% 52,450 6,976 13%
2014 103,486 29 0% 62,109 8,593 14%
*All whiting catch recorded on trips that began or ended in Washington waters.
Source: WDFW 2015b.
As Table 4-7 shows, both the amount and share of sector total catches of Pacific whiting taken off Washington have varied substantially over time. In the catcher-processor sector, a high of 52 percent of total sector catch was taken off the Washington coast in 2011, whereas in 2006 and 2014 the amounts caught off Washington were less than 10 percent of the sector total. In the mothership sector, the range is even more dramatic, with a high of 91 percent of the sector total taken in 2009 and a low of 13 percent taken in 2013. The table indicates that some of the lowest catch shares from waters off Washington occurred in both sectors in the last 2 years (WDFW 2015b).
Since vessels in the at-sea sectors do not deliver their catch to local ports for processing, where they also would be likely to reprovision and refuel, activities by these sectors do not necessarily have a large direct effect on the Washington coastal economy. One mechanism whereby economic effects of the fishery may be conferred to local areas is through the residence location of vessel owners and crew. Owners and crew members are likely to bring at least a portion of their fishery earnings back to be spent in the local economy where they live.
Table 4-8 summarizes information on the registration address for vessels participating in the at-sea whiting sector. The address of registration for vessel owners is assumed to indicate where vessel owners and most of their hired crew members reside. This assumption may not hold true for the 14-15 very large vessels engaged as catcher-processors or motherships because these vessels require large processing crews that may be recruited nationally or internationally; however, it is reasonable to expect that most of the
(cc) NOAA/CBNMS 2005
Pacific whiting
Washington Coastal Marine Advisory Council Washington Coast Commercial Fisheries | 4-11
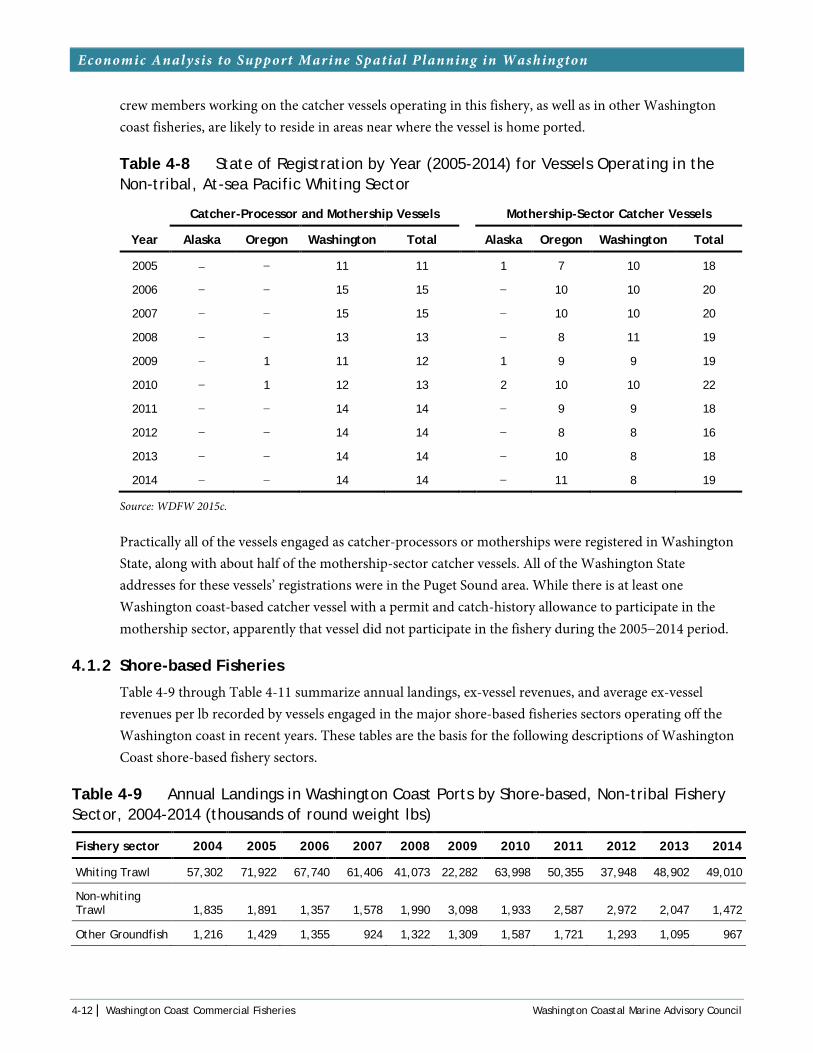
Economic Analysis to Support Marine Spatial Planning in Washington
crew members working on the catcher vessels operating in this fishery, as well as in other Washington coast fisheries, are likely to reside in areas near where the vessel is home ported.
Table 4-8 State of Registration by Year (2005-2014) for Vessels Operating in the Non-tribal, At-sea Pacific Whiting Sector
Catcher-Processor and Mothership Vessels
Mothership-Sector Catcher Vessels
Year Alaska Oregon Washington Total
Alaska Oregon Washington Total
2005 − − 11 11
1 7 10 18
2006 − − 15 15
− 10 10 20
2007 − − 15 15
− 10 10 20
2008 − − 13 13
− 8 11 19
2009 − 1 11 12
1 9 9 19
2010 − 1 12 13
2 10 10 22
2011 − − 14 14
− 9 9 18
2012 − − 14 14
− 8 8 16
2013 − − 14 14
− 10 8 18
2014 − − 14 14
− 11 8 19
Source: WDFW 2015c.
Practically all of the vessels engaged as catcher-processors or motherships were registered in Washington State, along with about half of the mothership-sector catcher vessels. All of the Washington State addresses for these vessels’ registrations were in the Puget Sound area. While there is at least one Washington coast-based catcher vessel with a permit and catch-history allowance to participate in the mothership sector, apparently that vessel did not participate in the fishery during the 2005−2014 period.
4.1.2 Shore-based Fisheries
Table 4-9 through Table 4-11 summarize annual landings, ex-vessel revenues, and average ex-vessel revenues per lb recorded by vessels engaged in the major shore-based fisheries sectors operating off the Washington coast in recent years. These tables are the basis for the following descriptions of Washington Coast shore-based fishery sectors.
Table 4-9 Annual Landings in Washington Coast Ports by Shore-based, Non-tribal Fishery Sector, 2004-2014 (thousands of round weight lbs)
Fishery sector 2004 2005 2006 2007 2008 2009 2010 2011 2012 2013 2014
Whiting Trawl 57,302 71,922 67,740 61,406 41,073 22,282 63,998 50,355 37,948 48,902 49,010
Non-whiting Trawl 1,835 1,891 1,357 1,578 1,990 3,098 1,933 2,587 2,972 2,047 1,472
Other Groundfish 1,216 1,429 1,355 924 1,322 1,309 1,587 1,721 1,293 1,095 967
4-12 | Washington Coast Commercial Fisheries Washington Coastal Marine Advisory Council

Economic Analysis to Support Marine Spatial Planning in Washington
Fishery sector 2004 2005 2006 2007 2008 2009 2010 2011 2012 2013 2014
Coastal Pelagic 19,895 13,429 9,730 10,505 14,311 18,898 27,358 17,902 77,565 64,168 17,430
Crab 5,352 19,292 13,982 11,697 10,979 8,953 10,756 14,190 6,312 15,104 8,575
Shrimp 5,380 6,039 6,183 3,345 6,290 7,011 9,470 9,524 9,353 13,511 30,527
Tuna 16,428 9,965 18,219 12,868 14,522 15,751 12,582 12,654 18,543 16,612 17,036
Salmon Troll 584 475 223 236 125 312 591 323 449 516 553
Salmon Net 1,503 1,287 1,157 544 695 1,245 969 1,981 1,064 1,022 1,954
Other 1,456 6,356 952 936 1,661 2,434 2,878 2,433 7,990 4,057 1,835
Grand Total 110,952 132,085 120,899 104,039 92,968 81,294 132,123 113,670 163,489 167,033 129,360
Source: WDFW 2015a.
Table 4-10 Annual Ex-vessel Revenue Landed in Washington Coast Ports by Shore-based, Non-tribal Fishery Sector, 2004-2014 (in thousands of 2014 inflation-adjusted dollars)*
Fishery sector 2004 2005 2006 2007 2008 2009 2010 2011 2012 2013 2014
Whiting Trawl 2,440 4,513 4,635 5,128 4,081 1,526 4,284 5,948 6,054 6,381 5,531
Nonwhiting Trawl 1,160 1,044 747 788 965 1,318 600 1,925 1,571 1,246 1,075
Other Groundfish 2,260 2,842 2,929 2,093 2,692 2,991 4,623 5,782 3,217 2,079 2,766
Coastal Pelagic 1,523 841 521 565 1,477 1,858 2,878 2,274 8,093 6,629 3,162
Crab 11,867 32,491 25,784 29,182 29,790 21,045 26,330 43,247 23,685 42,499 36,397
Shrimp 2,381 2,913 2,311 1,718 3,599 2,339 3,357 4,811 4,552 5,808 16,333
Tuna 16,159 11,439 16,041 11,321 18,401 17,281 14,759 22,079 28,136 23,478 20,005
Salmon Troll 1,232 1,307 988 973 716 1,142 3,069 1,410 2,025 2,670 2,378
Salmon Net 1,572 1,620 1,837 1,007 1,445 1,916 1,805 2,994 1,694 1,801 2,560
Other 2,112 2,268 1,437 1,529 1,678 3,133 5,771 3,274 4,794 3,931 2,761
Grand Total 42,706 61,278 57,231 54,305 64,845 54,547 67,475 93,746 83,821 96,521 92,967
*Inflation-adjusted using the December 2014 GDP deflator series (BEA 2015).
Source: WDFW 2015a.
Table 4-11 Average Annual Ex-vessel Revenue per Round Weight Pound Landed in Washington Coast Ports by Shore-based, Non-tribal Fishery Sector, 2004-2014 (in 2014 inflation-adjusted dollars)*
Fishery sector 2004 2005 2006 2007 2008 2009 2010 2011 2012 2013 2014 11-yr
Average
Whiting Trawl 0.04 0.06 0.07 0.08 0.10 0.07 0.07 0.12 0.16 0.13 0.11 0.09
Nonwhiting Trawl 0.63 0.55 0.55 0.50 0.48 0.43 0.31 0.74 0.53 0.61 0.73 0.55
Other Groundfish 1.86 1.99 2.16 2.27 2.04 2.28 2.91 3.36 2.49 1.90 2.86 2.41
Washington Coastal Marine Advisory Council Washington Coast Commercial Fisheries | 4-13

Economic Analysis to Support Marine Spatial Planning in Washington
Fishery sector 2004 2005 2006 2007 2008 2009 2010 2011 2012 2013 2014 11-yr
Average
Coastal Pelagic 0.08 0.06 0.05 0.05 0.10 0.10 0.11 0.13 0.10 0.10 0.18 0.10
Crab 2.22 1.68 1.84 2.49 2.71 2.35 2.45 3.05 3.75 2.81 4.24 2.57
Shrimp 0.44 0.48 0.37 0.51 0.57 0.33 0.35 0.51 0.49 0.43 0.54 0.47
Tuna 0.98 1.15 0.88 0.88 1.27 1.10 1.17 1.74 1.52 1.41 1.17 1.21
Salmon Troll 2.11 2.75 4.42 4.12 5.71 3.66 5.19 4.36 4.51 5.17 4.30 4.08
Salmon Net 1.05 1.26 1.59 1.85 2.08 1.54 1.86 1.51 1.59 1.76 1.31 1.51
Other 1.45 0.36 1.51 1.63 1.01 1.29 2.00 1.35 0.60 0.97 1.50 0.99
*Inflation-adjusted using the December 2014 GDP deflator series (BEA 2015).
Source: WDFW 2015a.
Shore-based Pacific Whiting Fishery
Large-scale trawl fisheries for Pacific whiting (hake), are conducted off the Washington Coast. Shore-based buyers in regional ports receive and process Pacific whiting landings.
Beginning in 2011, the shore-based portion of the Pacific whiting trawl fishery was rationalized under a transferrable IFQ system, in which federal permit holders were allocated individual quotas based on their historic participation in the fishery. Shore-based buyers were also allocated individual quota portions for Pacific whiting based on their buying history.
The shore-based Pacific whiting fishery is essentially a single-species fishery conducted offshore using midwater or pelagic trawl gear. The shore-based sector, along with the at-sea and tribal sectors, receives an annual allocation of Pacific whiting. Participants in the shore-based fishery use IFQs to account for their Pacific whiting catch, as well as bycatch (incidental catch of species other than the target species) of several groundfish species.
As Table 4-9 through Table 4-11 show, Washington Coast landings in the shore-based whiting fishery during 2004-2014 ranged from a low of approximately 22 million lbs in 2009 to a high of approximately 72 million lbs recorded in 2005. With the exceptions of 2012 and 2013, when landings of CPS (mostly sardines) were at an all-time high, Pacific whiting landings have consistently been the largest component of total landings volume by weight (WDFW 2015a).
In terms of ex-vessel revenue, Pacific whiting landings ranged from an inflation-adjusted low of approximately $1.5 million in 2009 to a high of approximately $6.4 million in 2013. The 2014 value of $5.5 million was the fourth highest during the period in inflation-adjusted terms. The annual average ex-vessel price for shore-based Pacific whiting in 2014 was about $0.11 per round weight lb, above the 11-year inflation-adjusted average of $0.09 but the lowest since an inflation-adjusted $0.07 was recorded in 2007 (WDFW 2015a).
In 2014, 10 vessels recorded Pacific whiting fishery landings on the Washington coast. Five of these received at least $250,000 in ex-vessel revenue from those landings (WDFW 2015a).
4-14 | Washington Coast Commercial Fisheries Washington Coastal Marine Advisory Council

Economic Analysis to Support Marine Spatial Planning in Washington
Figure 4-2 Pacific Whiting (Hake) Fishing Activity in the Washington Coast MSP Region
Washington Coastal Marine Advisory Council Washington Coast Commercial Fisheries | 4-15
Economic Analysis to Support Marine Spatial Planning in Washington
Non-whiting Trawl
Large-scale trawl fisheries for groundfish species, including sablefish, rockfish and flatfish, are conducted off the Washington Coast. Shore-based buyers in regional ports receive landings and process groundfish products.
Washington Coast trawl groundfish fisheries are a subset of those conducted along the West Coast from Southern California to the mouth of the Strait of Juan de Fuca. Beginning in 2011, the shore-based portion of the trawl fishery was rationalized using transferrable IFQs, in which federal permit holders were allocated individual quotas based on their historic participation in the groundfish fishery.
Since 2011, the numbers of vessels and buyers participating in the West Coast shore-based groundfish trawl fishery has tended to become fewer and more concentrated among a smaller number of ports, continuing a trend that began well before the trawl rationalization program.
The shore-based non-whiting trawl fishery pursues an array of bottomfish species, some of which co-occur during certain times of the year. The main groundfish landed in non-whiting trawl fisheries are sablefish, Dover sole, thornyheads, petrale sole, arrowtooth flounder, English sole, Pacific cod, lingcod, and several species of rockfish. Sablefish has the highest ex-vessel value per lb among trawl fishery species, although an increasing portion of the sablefish IFQ allocation is being landed by trawl-permitted vessels using non-trawl gear (WDFW 2015a).
As Table 4-9 through Table 4-11 show, Washington coast landings in the shore-based non-whiting trawl fishery during 2004-2014 ranged from a low of approximately 1.4 million lbs in 2006 to a high of approximately 3.1 million lbs in 2009. In terms of volume landed, the non-whiting trawl fishery accounted for between 1.1 percent and 3.8 percent of total annual Washington coast landings by weight during the period (WDFW 2015a).
In terms of ex-vessel revenue, non-whiting trawl fishery landings ranged from an inflation-adjusted low of approximately $0.6 million in 2010 to a high of approximately $1.9 million in 2011. The 2014 value of $1.1 million was the sixth highest during the period in inflation-adjusted terms but the lowest since 2010. The annual average ex-vessel price for non-whiting trawl fishery landings in 2014 was about $0.73 per round weight lb, well above the 11-year inflation-adjusted average of $0.55 and the second highest during the period (WDFW 2015a).
4-16 | Washington Coast Commercial Fisheries Washington Coastal Marine Advisory Council

Economic Analysis to Support Marine Spatial Planning in Washington
Figure 4-3 Total Groundfish Fishing Activity in the Washington Coast MSP Region
Washington Coastal Marine Advisory Council Washington Coast Commercial Fisheries | 4-17

Economic Analysis to Support Marine Spatial Planning in Washington
In 2014, only three vessels recorded non-whiting fishery landings using trawl gear on the Washington coast. Of these, two received at least $100,000 in ex-vessel revenue from those landings (WDFW 2015a).
Non-trawl Groundfish
The non-trawl groundfish fishery is conducted off the Washington coast primarily by vessels using fixed gear such as longlines and fishpots. The primary species caught is sablefish, which comprises about 86 percent of total landings by weight and about 95 percent of the total ex-vessel value landed in this sector. For purposes of this analysis, this sector consists of a mix of vessels operating in the federal limited-entry and open-access groundfish fisheries. Beginning in 2011, this fishery also includes participation by as many as seven vessels fishing trawl sablefish IFQs using fixed gear (WDFW 2015a).
As Table 4-9 through Table 4-11 show, Washington coast landings in the non-trawl groundfish fishery during 2004-2014 ranged from a low of approximately 0.9 million lbs in 2007 to a high of approximately 1.7 million lbs in 2011. In terms of volume landed, the non-trawl groundfish fishery accounted for between 0.7 percent and 1.6 percent of total annual Washington coast landings by weight during the period (WDFW 2015a).
In terms of ex-vessel revenue, non-trawl groundfish landings ranged from an inflation-adjusted low of approximately $2.1 million in 2013 and 2007 to a high of approximately $5.8 million in 2011. The 2014 value of approximately $2.8 million was the fifth lowest during the period in inflation-adjusted terms and the second lowest since 2008. The annual average ex-vessel price for non-whiting trawl fishery landings in 2014 was about $2.86 per round weight lb, above the 11-year inflation-adjusted average of $2.41 and the third highest during the period (WDFW 2015a).
In 2014, at least 37 vessels recorded at least $1,000 of non-trawl groundfish landings on the Washington coast, including seven vessels fishing trawl sablefish IFQs using fixed gear. Of these, 29 vessels received at least $10,000 from non-trawl groundfish landings on the Washington coast (WDFW 2015a).
Salmon Troll
The salmon troll fishery is conducted off the Washington coast mostly by smaller vessels trailing natural bait or artificial lures and targeting Chinook and coho salmon. The troll fishery is unique among West Coast fisheries in that salmon are usually landed already gutted and bled, that is, partially processed. In 2014, Chinook salmon constituted about 84 percent of landings by weight and about 94 percent of ex-vessel revenue in this sector (WDFW 2015a).
As Table 4-9 through Table 4-11 show, Washington coast landings in the salmon troll fishery during 2004-2014 ranged from a low of approximately 125 thousand lbs in 2008 to a high of approximately 590 thousand lbs in 2010. In terms of volume landed, the salmon troll fishery accounted for less than 1 percent of total annual Washington coast landings by weight each year during the period (WDFW 2015a).
In terms of ex-vessel revenue, salmon troll landings ranged from an inflation-adjusted low of approximately $0.7 million in 2008 to a high of approximately $3.1 million in 2010. The 2014 value of approximately $2.4 million was the third highest during the period in inflation-adjusted terms. The
4-18 | Washington Coast Commercial Fisheries Washington Coastal Marine Advisory Council

Economic Analysis to Support Marine Spatial Planning in Washington
annual average ex-vessel price for salmon troll fishery landings in 2014 was about $4.30 per lb, above the 11-year inflation-adjusted average of $4.08 but the lowest since 2009 (WDFW 2015a).
In 2014, at least 111 vessels recorded at least $1,000 of salmon troll landings on the Washington Coast, including 79 vessels that received at least $10,000 in ex-vessel revenue from those landings (WDFW 2015a).
Salmon Net
The salmon net fishery is unique among West Coast commercial fisheries in that it is not conducted in the ocean but rather in the inside waters of the Columbia River and tributaries of Willapa Bay and Grays Harbor. The main target species in this fishery are Chinook, coho, and chum salmon. In 2014, coho constituted about 57 percent of landings by weight and about 50 percent of ex-vessel revenue for this sector, although that proportion can vary greatly from year to year depending on the species’ relative availabilities. In most years, Willapa Bay accounts for the largest portion, about 50 percent of total landings and ex-vessel revenue in this sector (WDFW 2015a).
Recent policies enacted to phase out the use of tangle net gear on the main stem of the Columbia River have caused a considerable amount of uncertainty regarding the future of a major portion of this fishery. A number of participants in the Columbia River fishery reportedly also own permits to participate in the Willapa Bay and Grays Harbor fisheries, as well as in the major salmon gillnet fisheries in Alaska.
As Table 4-9 through Table 4-11 show, Washington coast landings in the salmon net fishery during 2004-2014 ranged from a low of approximately 0.5 million lbs in 2007 to a high of approximately 2 million lbs in 2011. In terms of volume landed, the salmon net fishery accounted for between 0.5 percent and 1.7 percent of total annual Washington coast landings by weight during the period (WDFW 2015a).
In terms of ex-vessel revenue, salmon net landings ranged from an inflation-adjusted low of approximately $1 million in 2007 to a high of approximately $3 million in 2011. The 2014 value of approximately $2.6 million was the second highest during the period in inflation-adjusted terms. The annual average ex-vessel price for salmon troll fishery landings in 2014 was about $1.31 per round weight lb, below the 11-year inflation-adjusted average of $1.51 and the lowest since 2005 (WDFW 2015a).
In 2014, 138 vessels recorded at least $1,000 of salmon net landings on the Washington Coast, including 72 vessels that received at least $10,000 in ex-vessel revenue from those landings (WDFW 2015a).
Dungeness Crab
Dungeness crab is harvested using pot gear off the Washington coast by a large number and wide variety of vessels. Crab harvests are notoriously volatile from year to year, for largely unexplained reasons. Recently, an increasing portion of the total crab harvest has been directed to live markets, including overseas, thereby raising the overall average ex-vessel value per lb reported for crab landings.
Washington Coastal Marine Advisory Council Washington Coast Commercial Fisheries | 4-19

Economic Analysis to Support Marine Spatial Planning in Washington
Commercial fishery regulations and the compressed nature of the crab market cycle push most of the effort and catch into the opening few weeks of the season (between Thanksgiving and Chinese New Year), fueling intense competition for the limited crabbing grounds off the southern Washington coast, especially during the early part of the season.5 Management agreements determine when the non-tribal Dungeness crab fishery in the Treaty U&A area north of Grays Harbor opens each year. Often the non-tribal fishery in this area does not open until after January 15.
As Table 4-9 through Table 4-11 show, Washington coast landings by Dungeness crab vessels during 2004-2014 ranged from a low of approximately 5.4 million lbs in 2004 to a high of approximately 19.3 million lbs in 2005, illustrating the volatile and somewhat cyclical nature of annual crab harvests. In terms of volume landed, the crab fishery accounted for between 3.9 percent and 14.6 percent of total annual Washington coast landings by weight during the period (WDFW 2015a).
In terms of ex-vessel revenue, crab vessel landings ranged from an inflation-adjusted low of approximately $11.9 million in 2004 to a high of approximately $43.2 million in 2011. The 2014 value of approximately $36.4 million was the third highest during the period in inflation-adjusted terms. The three highest ex-vessel revenue values have all occurred since 2010. The annual average ex-vessel price for crab fishery landings in 2014 was about $4.24 per round weight lb, 65 percent above the 11-year inflation-adjusted average of $2.57 and the highest value in the series (WDFW 2015a).
In 2014, 192 vessels recorded at least $1,000 of Dungeness crab landings on the Washington coast. This is the second highest participation level among the Washington coast fishery sectors. Of those, 117 vessels received at least $100,000 in ex-vessel revenue from Washington coast Dungeness crab landings (WDFW 2015a).
5 Evidence gleaned from Washington vessel logbooks suggests that during the early portion of the Washington coast crab season, the density of deployed crab pots is very high south of Point Chehalis (mouth of Grays Harbor), especially near the “Klipsan line” (46°28.00 North latitude) which delineates areas that are open at the very beginning of the Dungeness crab season each year (WDFW 2015e). The line can be clearly seen in Figure 4-4 as areas of high and elevated activity off central Long Beach Peninsula. Note that the logbook-based estimates of crab pot density are understated because they exclude vessels that fished in the area but landed their catch in Oregon.
(cc) David Parker, 2004
Dungeness crab pot
4-20 | Washington Coast Commercial Fisheries Washington Coastal Marine Advisory Council

Economic Analysis to Support Marine Spatial Planning in Washington
Figure 4-4 Dungeness Crab Fishing Activity in the Washington Coast MSP Region
Washington Coastal Marine Advisory Council Washington Coast Commercial Fisheries | 4-21

Economic Analysis to Support Marine Spatial Planning in Washington
Pink Shrimp
The fishery for pink shrimp is conducted by vessels towing trawl nets similar to the nets used in some groundfish trawl fisheries. Relatively high resource abundance, the use of excluder devices to reduce bycatch of overfished rockfish species, development of markets, and migration of processing capacity have allowed this fishery to expand in Washington in recent years.6
As Table 4-9 through Table 4-11 show, Washington coast landings by pink shrimp vessels during 2004-2014 ranged from a low of approximately 3.3 million lbs in 2007 to a high of approximately 30.5 million lbs in 2014, illustrating the recent surge in Washington coast pink shrimp landings. In terms of volume landed, the pink shrimp fishery accounted for between 3.2 percent and 23.6 percent of total annual Washington Coast landings by weight during the period (WDFW 2015a).
In terms of ex-vessel revenue, shrimp landings ranged from an inflation-adjusted low of approximately $1.7 million in 2007 to a high of approximately $16.3 million in 2014. The 2014 value was nearly triple the next highest annual value during the period (2013) in inflation-adjusted terms. The four highest ex-vessel revenue values have all occurred since 2010. The annual average ex-vessel price for shrimp landings in 2014 was about $0.54 per round weight lb, above the 11-year inflation-adjusted average of $0.47 and the second highest value in the series (WDFW 2015a).
In 2014, 32 vessels recorded at least $1,000 of pink shrimp landings on the Washington coast, including 26 vessels that received at least $100,000 in ex-vessel revenue from those landings (WDFW 2015a).
6 A fire at an Oregon processing plant 2 years ago likely contributed to the recent increase in the volume of pink shrimp landngs and processing in Washington coast ports(anecdotal).
4-22 | Washington Coast Commercial Fisheries Washington Coastal Marine Advisory Council

Economic Analysis to Support Marine Spatial Planning in Washington
Figure 4-5 Pink Shrimp Fishing Activity in the Washington Coast MSP Region
Washington Coastal Marine Advisory Council Washington Coast Commercial Fisheries | 4-23

Economic Analysis to Support Marine Spatial Planning in Washington
Coastal Pelagic Species
CPS landed on the Washington coast consist overwhelmingly of Pacific sardines, with relatively small amounts of northern anchovy and mackerel. CPS delivered to the Washington coast are caught in a fishery that has relatively high volumes but low value per lb, mostly by vessels using purse seine gear. Recent concerns over a projected low and possibly declining Pacific sardine biomass have placed this fishery in considerable doubt for the next few years (PFMC 2015).
As Table 4-9 through Table 4-11 show, Washington coast landings by CPS vessels during 2004-2014 ranged from a low of approximately 9.7 million lbs in 2006 to a high of approximately 77.6 million lbs in 2012. By 2014, landings were down to 17.4 million lbs, illustrating the volatility of this fishery. In terms of volume, the CPS fishery accounted for between 8 percent and 47.4 percent of total annual Washington Coast landings by weight during the period (WDFW 2015a).
In terms of ex-vessel revenue, CPS vessel landings ranged from an inflation-adjusted low of approximately $0.5 million in 2006 to a high of approximately $8.1 million in 2012. The 2014 value of $3.2 million was the third highest during the period but also the lowest recorded since 2011 in inflation-adjusted terms. (The three highest ex-vessel values have all occurred since 2011). The annual average ex-vessel price for CPS fishery landings in 2014 was about $0.18 per round weight lb, 77 percent above the 11-year inflation-adjusted average of $0.10 and the highest value by far during the period (WDFW 2015a).
In 2014, 10 vessels recorded at least $1,000 of CPS landings on the Washington coast, including seven vessels that received at least $100,000 in ex-vessel revenue from those landings (WDFW 2015a).
Photo courtesy NOAA Fish Watch 2006
Pacific sardines
4-24 | Washington Coast Commercial Fisheries Washington Coastal Marine Advisory Council

Economic Analysis to Support Marine Spatial Planning in Washington
Figure 4-6 Pacific Sardine Fishing Activity in the Washington Coast MSP Region
Washington Coastal Marine Advisory Council Washington Coast Commercial Fisheries | 4-25

Economic Analysis to Support Marine Spatial Planning in Washington
Tuna
The tuna fishery on the Washington coast is exclusively an albacore fishery. It is conducted in ocean waters, sometimes far offshore, by vessels using troll gear somewhat similar to the gear used by salmon trollers. Many vessels that participate in the salmon troll fishery also fish for albacore.
As Table 4-9 through Table 4-11 show, Washington coast landings by tuna vessels during 2004-2014 ranged from a low of approximately 10 million lbs in 2005 to a high of approximately 18.5 million lbs in 2012. 2014 landings of 17 million lbs were the third highest during the period. In terms of volume, the tuna fishery accounted for between 7.5 percent and 19.4 percent of total annual Washington coast landings by weight during the period (WDFW 2015a).
In terms of ex-vessel revenue, tuna vessel landings ranged from an inflation-adjusted low of approximately $11.3 million in 2007 to a high of approximately $28.1 million in 2012. The 2014 value of $20 million was the fourth highest during the period but also the lowest recorded since 2010 in inflation-adjusted terms. (The four highest ex-vessel values have all occurred since 2010). The annual average ex-vessel price for tuna fishery landings in 2014 was about $1.17 per round weight lb, below the 11-year inflation-adjusted average of $1.21 and the lowest value since $1.17 in 2010 (WDFW 2015a).
In 2014, 264 vessels recorded at least $1,000 of tuna landings on the Washington coast. This is the highest participation level among the Washington coast fishery sectors. Of these, 210 vessels received at least $10,000 in ex-vessel revenue from tuna landings on the Washington coast. There were 54 vessels that landed at least $1,000 of troll salmon and $1,000 of albacore on the Washington coast (WDFW 2015a).
Other Species
“Other species” in Table 4-9 through Table 4-11 is a miscellaneous category rather than a fishery sector per se. In the tables “Other species” miscellaneous species caught off in non-tribal fisheries off the Washington coast such as Pacific halibut, spotted prawn and razor clams, landings by unidentified vessels (virtually all razor clam landings were associated with “unidentified” vessels), and catch from Canadian waters that was delivered to Washington coast ports. In recent years, approximately half of the round weight and revenue totals associated with the other species category consisted of hagfish or slime eels (WDFW 2015a).
As Table 4-9 through Table 4-11 show, Washington coast landings of other species during 2004-2014 ranged from a low of approximately 0.9 million lbs in 2007 to a high of approximately 8 million lbs in 2012. In terms of volume, the other species fisheries accounted for between 0.8 percent and 4.9 percent of total annual Washington coast landings by weight during the period (WDFW 2015a).
In terms of ex-vessel revenue, landings of other species ranged from an inflation-adjusted low of approximately $1.4 million in 2006 to a high of approximately $5.8 million in 2010. The 2014 value of approximately $2.8 million was the sixth highest during the period in inflation-adjusted terms. The
© Washington Department of Fish and Wildlife, 2015
Albacore tuna
4-26 | Washington Coast Commercial Fisheries Washington Coastal Marine Advisory Council

Economic Analysis to Support Marine Spatial Planning in Washington
annual average ex-vessel price for landings of other species in 2014 was about $1.50 per round weight lb, well above the 11-year inflation-adjusted average of $0.99 (WDFW 2015a).
In 2014, 52 vessels recorded at least $1,000 of other species landings on the Washington coast, 32 of which received at least $10,000 in ex-vessel revenue from those landings. Note that landings and revenue totals may include landings by unidentified vessels, so vessel counts are less meaningful for this fishery category (WDFW 2015a).
Recreational Charters
Recreational charter vessels are considered to be an important component of the commercial fishing industry on the Washington coast. In 2014, an estimated total of approximately 54,400 recreational charter trips (angler trip-days) originated from Washington coast ports, the highest total since 2007 (Table 4-12). Of the trips made in 2014, 64 percent (34,800) were salmon trips, with 25 percent of total trips targeting bottomfish (13,700). Trips to catch albacore tuna have been a relatively small but increasing component of the total. Halibut trips appear to be on a reverse trajectory, with the number of estimated trips in 2014 (2,700) being the lowest observed during the time series (WDFW 2015d).
Table 4-12 Estimated Total Annual Number of Recreational Angler Trips Taken on Charter Vessels from Washington Coast Ports by Type of Trip, 2004-2014 (thousands)
Trip Type 2004 2005 2006 2007 2008 2009 2010 2011 2012 2013 2014
Salmon 37.1 31.8 25.0 27.5 15.0 29.9 26.7 22.6 25.2 24.8 34.8
Botttomfish 11.8 13.8 16.7 15.1 15.1 11.9 11.3 13.8 15.2 14.2 13.7
Albacore 1.2 1.0 1.8 1.7 1.5 1.6 2.1 1.6 2.0 2.4 3.0
Halibut 8.1 6.7 7.0 6.9 4.8 3.9 3.3 3.4 2.9 2.8 2.7
Sturgeon 5.6 8.4 6.7 7.6 6.9 5.5 5.4 2.7 2.2 1.3 0.1
Miscellaneous 0.1 0.2 0.1 0.1 0.1 0.0 0.0 0.0 0.0 - 0.1
Total 63.9 61.9 57.2 58.9 43.4 53.0 48.7 44.2 47.7 45.5 54.4
Source: WDFW 2015d.
The number of charter vessels operating from Washington coast ports has varied. Some vessels migrate into the region from elsewhere during the peak season, and some vessels operate in more than one Washington coast port. There are estimated to be about 60 recreational charter vessels operating from Washington coast ports (anecdotal).
4.2 NON-TRIBAL COMMERCIAL FISHERIES PARTICIPATION BY COUNTY AND PORT
Table 4-13 through Table 4-15 show counts of identified non-tribal commercial fishing vessels and fish buyers by Washington coast port during 2004-2014, and total ex-vessel revenues paid by fish buyers in those ports during the same period. Data in these tables are used in the following discussion of commercial fishing activities by port.
Washington Coastal Marine Advisory Council Washington Coast Commercial Fisheries | 4-27

Economic Analysis to Support Marine Spatial Planning in Washington
Table 4-13 Number of Fish Buyers Operating in Washington Coast Ports that Purchased at Least $10,000 from Vessels Delivering to the Port during Each Year, 2004-2014
County Port Code 2004 2005 2006 2007 2008 2009 2010 2011 2012 2013 2014
Clallam
Sequim c/ 4 4 3 3 3 3 c/ c/ c/ c/
Port Angeles 3 3 c/ c/ c/ c/ 5 4 3 4 5
Neah Bay 3 5 4 6 4 5 5 7 7 7 7
La Push c/ 3 c/ 3 c/ c/ 3 3 4 5 6
Jefferson Jefferson County Coast Ports
c/ c/ c/ c/ c/ c/ c/ c/ c/ c/ c/
Grays Harbor
Grays Harbor c/ c/ c/ c/ 3 c/ c/ c/ c/ c/ c/
Westport 30 29 29 30 33 29 31 25 26 27 30
Other Grays Harbor Ports
c/ c/ c/ c/ c/ c/ c/ c/ c/ c/ c/
Pacific
Willapa Bay 9 10 11 8 8 9 9 8 6 9 10
Ilwaco 10 10 12 11 11 15 12 14 11 15 13
Other Pacific County – Coast Ports
c/ c/ c/ c/ c/ c/ c/ c/ c/ c/ c/
Other Pacific County – Columbia River Ports
c/ c/ c/ c/ c/ c/ c/ c/ c/ c/ c/
Wahkiakum Wahkiakum County Ports
6 7 8 5 5 6 8 8 5 6 7
c/ Counts in cells representing fewer than three buyers are not disclosed for confidentiality reasons.
Source: (WDFW 2015a)
Table 4-14 Number of Commercial Vessels Making Deliveries to Buyers in Washington Coast Ports of at Least $1,000 in the Port during Each Year, 2004-2014
County Port Code 2004 2005 2006 2007 2008 2009 2010 2011 2012 2013 2014
Clallam
Sequim 8 8 19 12 5 c/ c/ c/ c/ 4 4
Port Angeles 52 27 14 7 11 11 7 9 11 15 24
Neah Bay 57 60 57 50 33 29 40 40 45 37 40
La Push 29 28 35 33 31 38 29 26 35 44 33
Jefferson Jefferson County Coast Ports
5 5 5 3 c/ c/ c/ c/ c/ c/ c/
Grays Harbor
Grays Harbor 15 26 22 22 19 28 c/ 4 4 6 3
Westport 291 284 275 274 248 278 301 309 324 306 346
Other Grays Harbor Ports
c/ c/ c/ c/ c/ c/ c/ c/ c/ c/ c/
4-28 | Washington Coast Commercial Fisheries Washington Coastal Marine Advisory Council

Economic Analysis to Support Marine Spatial Planning in Washington
County Port Code 2004 2005 2006 2007 2008 2009 2010 2011 2012 2013 2014
Pacific
Willapa Bay 106 115 116 99 111 131 117 139 109 114 126
Ilwaco 235 168 277 186 212 225 237 234 241 198 234
Other Pacific County – Coast Ports
c/ c/ c/ c/ c/ c/ c/ c/ 5 11 11
Other Pacific County - Columbia River Ports
c/ 9 14 16 17 c/ 17 c/ c/ c/ c/
Wahkiakum Wahkiakum County Ports
65 55 40 23 23 29 38 69 41 56 72
c/ Counts in cells representing fewer than three vessels are not disclosed for confidentiality reasons.
Source: WDFW 2015a
Table 4-15 Total Fish Purchases (thousands of current dollars) by Fish Buyers Operating in Washington Coast Ports that Purchased at Least $10,000 from Vessels Delivering to the Port during Each Year, 2004-2014
County Port Code 2004 2005 2006 2007 2008 2009 2010 2011 2012 2013 2014
Clallam
Sequim c/ 268 405 266 210 c/ c/ c/ c/ c/ c/
Port Angeles 738 307 c/ c/ c/ c/ 1,255 410 56 122 904
Neah Bay 928 1,486 1,677 1,170 891 860 1,054 1,237 1,499 1,514 1,094
La Push c/ 1,058 c/ 737 c/ c/ 1,021 1,814 1,243 1,447 924
Jefferson Jefferson County Coast Ports
c/ c/ c/ c/ c/ c/ c/ c/ c/ c/ c/
Grays Harbor
Grays Harbor c/ c/ c/ c/ 579 c/ c/ c/ c/ c/ c/
Westport 18,132 32,526 22,335 28,219 37,857 27,484 36,552 53,567 53,335 58,351 59,674
Other Grays Harbor Ports
c/ c/ c/ c/ c/ c/ c/ c/ c/ c/ c/
Pacific
Willapa Bay 1,851 3,863 4,096 3,283 3,427 3,308 4,408 4,340 2,841 3,624 4,828
Ilwaco 11,521 11,423 18,894 13,661 14,796 15,881 17,489 26,572 21,788 28,955 24,331
Other Pacific County – Coast Ports
c/ c/ c/ c/ c/ c/ c/ c/ c/ c/ c/
Other Pacific County - Columbia River Ports
c/ c/ c/ c/ c/ c/ c/ c/ c/ c/ c/
Wahkiakum Wahkiakum County Ports
748 532 584 301 270 233 416 947 306 563 966
c/ Data in cells representing fewer than three buyers or vessels are not disclosed for confidentiality reasons.
Source: WDFW 2015a
Washington Coastal Marine Advisory Council Washington Coast Commercial Fisheries | 4-29

Economic Analysis to Support Marine Spatial Planning in Washington
Table 4-16 and Table 4-17 show total numbers of charter trips taken by recreational anglers (angler trips) from Washington coast ports during 2004-2014, and estimates of the number of charter vessels operating from those ports.
Table 4-16 Estimated Annual Number of Recreational Angler Trips Taken on Charter Vessels from Washington Coast Ports, 2004-2014 (thousands)
Port 2004 2005 2006 2007 2008 2009 2010 2011 2012 2013 2014
Neah Bay 5.5 4.8 4.9 4.9 2.7 2.0 1.6 1.7 1.6 1.7 1.9
La Push 1.0 1.1 0.9 0.9 1.3 1.4 1.4 1.2 1.1 1.1 1.6
Westport 38.3 36.8 34.4 33.0 26.3 32.6 31.6 29.0 33.0 31.9 38.5
Ilwaco-Chinook 19.1 19.2 17.0 20.0 13.2 16.9 14.1 12.2 12.0 10.9 12.5
Totals 63.9 61.9 57.2 58.9 43.4 53.0 48.7 44.2 47.7 45.5 54.4
Note: Includes Columbia River salmon and sturgeon trips.
Source: WDFW 2015d.
Table 4-17 Average Annual Number of Charter Vessels by Washington Coast Area
Ports Number
Neah Bay/La Push 10
Westport 35
Ilwaco/Chinook 21
Source: Anecdotal.
Note that values in cells representing activity levels by fewer than three fish buyers or fewer than three non-tribal commercial fishing vessels have been suppressed for data confidentiality reasons. Attempting to increase the level of detail in these displays by including breakouts of vessel types and/or species landed by port would result in even greater limitations because of data confidentiality restrictions.
4.2.1 Clallam County Ports
The main Clallam County ports involved in Washington coast commercial fisheries are Neah Bay, and La Push. Both ports also host substantial tribal fisheries. Although not within the MSP study area, the relatively small Clallam County commercial fishing ports of Sequim and Port Angeles have been included in Table 4-13 through Table 4-15 and mentioned in the following discussion by way of comparison.
Sequim
Data confidentiality issues limit what can be reported regarding commercial fisheries activity in Sequim. Table 4-13 through Table 4-15 show relatively small numbers of buyers and vessels operating in the port each year. Since 2010, the number of buyers has remained below the reporting disclosure threshold (WDFW 2015a)
4-30 | Washington Coast Commercial Fisheries Washington Coastal Marine Advisory Council

Economic Analysis to Support Marine Spatial Planning in Washington
Port Angeles
Data confidentiality limits what can be reported regarding commercial fisheries activity in Port Angeles in some years. Table 4-13 through Table 4-15 show about five buyers and 24 vessels operating in the port recently. Total ex-vessel revenues from landings in the port exceeded $0.9 million in 2014, a large increase over the prior year (WDFW 2015a).
Neah Bay
Neah Bay has been the largest commercial fisheries port in Clallam County in terms of buyer participation, vessel participation, and landed ex-vessel revenues in most years. Table 4-13 through Table 4-15 show about seven buyers and 40 vessels operating in the port recently. Total ex-vessel revenues from landings in the port in 2014 were approximately $1.1 million, the fourth largest in terms of ex-vessel revenues landed in Washington coast ports (WDFW 2015a).
Approximately 1,900 recreational anglers took charter trips from Neah Bay in 2014. This number was more than in the recent past, but less than half the levels in Neah Bay before 2008. An estimated 10 charter vessels operated from Neah Bay and La Push in recent years (WDFW 2015d).
La Push
La Push is the only major port in Clallam County that is actually located on the Pacific Coast. Data confidentiality limits what can be reported regarding commercial fisheries activity in La Push in some years. Table 4-13 through Table 4-15 show about six buyers and 33 vessels operating in the port recently. Total ex-vessel revenues from landings in the port in 2014 were approximately $0.9 million, the second largest in Clallam County and the fifth largest in terms of ex-vessel revenues landed on the Washington coast (WDFW 2015a).
Table 4-16 and Table 4-17 show approximately 1,600 recreational charter angler trips originated from La Push in 2014. This was the largest number observed for La Push during the 2004-2014 period. An estimated 10 charter vessels operated from Neah Bay and La Push in recent years (WDFW 2015d).
4.2.2 Jefferson County (West) Ports
There have been no non-tribal commercial fisheries landings recorded in Jefferson County (West) ports (PCID = “OWC”) since 2007. In previous years, fewer than three buyers and fewer than six vessels were operating there (WDFW 2015a).
4.2.3 Grays Harbor County Ports
Grays Harbor County ports that reported commercial fisheries landings during 2004-2014 were Grays Harbor, Westport, and Other Grays Harbor Ports (PCID = “OWC”).
Grays Harbor
Fewer than three buyers were operating in Grays Harbor every year except 2008. The number of identified vessels operating in the port has fallen significantly from more than 20 before 2010. In 2014, only three vessels earned at least $1,000 in ex-vessel revenue from landings in the port (WDFW 2015a).
Washington Coastal Marine Advisory Council Washington Coast Commercial Fisheries | 4-31

Economic Analysis to Support Marine Spatial Planning in Washington
Westport
Table 4-13 through Table 4-15 show Westport is the largest port on the Washington coast in terms of number of buyers, number of vessels, and total ex-vessel revenues generated from landings in the port. Approximately 30 buyers and 300 vessels have been operating in the port in recent years. Total ex-vessel revenues paid for landings in the port in 2014 were $59.7 million, more than twice the level recorded in the next largest port, Ilwaco (WDFW 2015a).
In addition to commercial fisheries, Westport also has a large recreational fishing charter industry. Table 4-16 and Table 4-17 show approximately 35 vessels operated from the port in recent years, taking passengers fishing for salmon, groundfish, and tuna. In 2014, approximately 38,500 charter angler trips originated from Westport, the most among Washington coast ports and the highest annual total reported in Westport during the 2004-2014 period (WDFW 2015d).
Other Grays Harbor Ports
Data confidentiality issues limit what can be reported regarding commercial fisheries activity in the other Grays Harbor County ports. As Table 4-13 through Table 4-15 show, both the number of buyers and number of vessels remained below the reporting disclosure threshold every year during the 2004-2014 period (WDFW 2015a).
4.2.4 Pacific County Ports
A recent report on challenges facing the U.S. fishing industry notably listed Pacific County as the 4th most “fishing-intensive” county in the U.S. (measured by estimated earnings from commercial fishing as a share of total county earnings) (Kearney et al 2014). This ranking makes Pacific county the most fishing-intensive county in Washington. 7 Pacific County ports that reported commercial fishing landings during 2004-2014 include Willapa Bay, Ilwaco, and “Other Pacific County ports – Coast” (PCID = OWC), and “Other Pacific County ports -Columbia River” (PCID = OCR).
Willapa Bay
Willapa Bay ports include South Bend, Tokeland, and Bay Center, among others. Table 4-13 through Table 4-15 show approximately 10 buyers and more than 100 vessels were operating in Willapa Bay ports in recent years. Total ex-vessel revenues from landings in Willapa Bay ports in 2014 were approximately $4.8 million, the third largest in terms of ex-vessel revenues landed among Washington coast ports behind Ilwaco and Westport (WDFW 2015a).
7 Other counties listed in the report as the most fishing-intensive local economies include Curry County and Lincoln County. Oregon, at 10th and 11th positions, respectively, and Del Norte County, California, in 7th place.
4-32 | Washington Coast Commercial Fisheries Washington Coastal Marine Advisory Council

Economic Analysis to Support Marine Spatial Planning in Washington
Ilwaco
Ilwaco is the largest port in Pacific County and the second largest port on the Washington coast in terms of number of buyers, number of vessels, and total ex-vessel revenues generated from landings delivered to the port. Table 4-13 through Table 4-15 show approximately 13 buyers and more than 200 vessels have been operating in the port in recent years. Total ex-vessel revenue paid for landings in the port in 2014 were $24.3 million, less than half the amount reported in Westport but more than five times greater than the amount recorded in the next largest port, Willapa Bay (WDFW 2015a).
In addition to commercial fisheries, a large recreational fishing charter industry operates in Ilwaco and neighboring Chinook, Washington. Table 4-16 and Table 4-17 show up to 16 vessels operated from Ilwaco-Chinook in recent years during the recreational fishing seasons for salmon, groundfish, tuna, and sturgeon. Including trips conducted on the lower Columbia River, approximately 12,500 charter angler trips that originated from Ilwaco-Chinook in 2014, the second-most among Washington coast ports and the highest annual number of charter trips reported in the port since 14,100 in 2010 (WDFW 2015d).
Other Pacific County Ports
This category includes two port codes: “Other Pacific County ports – Coast” (PCID = OWC), and “Other Pacific County ports - Columbia River” (PCID = OCR). Data confidentiality issues restrict what can be reported regarding commercial fisheries activity in these ports. As Table 4-13 through Table 4-15 show, the number of buyers remained below the reporting disclosure threshold every year during the 2004-2014 period in both areas. In the most recent 2 years, the number of vessels landing in “Other Pacific County ports – Coast” was the highest it has been during the period (11), but before 2012 it was fewer than three. The number of vessels landing in “Other Pacific County ports – Columbia River” was as high as 17 as recently as 2010, but has been below the reporting disclosure threshold in every year since then (WDFW 2015a).
4.2.5 Wahkiakum County Ports
Landings and participation in the individual ports in Wahkiakum County were not available. The data show that between 5 and 8 buyers have been operating in these ports in recent years. A total of 72 vessels made landings in these ports in 2014, the largest number during the period, as was the nearly $1 million in total reported ex-vessel revenue (WDFW 2015a).
Photo courtesy Pacific Fishery Management Council
Jessie’s Ilwaco Fish Company
Washington Coastal Marine Advisory Council Washington Coast Commercial Fisheries | 4-33
Economic Analysis to Support Marine Spatial Planning in Washington
4.3 TRIBAL FISHERIES
4.3.1 Introduction
Ocean and river fisheries are central to the social, cultural, and spiritual livelihoods and traditions of each of the five Washington coast tribes. To an extent that varies by Tribe, fisheries are also a foundational component of the tribal economy and of subsistence for tribal members. The Makah, Quileute, Hoh, and Quinault Tribes each signed treaties with the United States that secured each respective tribe’s rights to hunt and gather resources at their “usual and accustomed fishing grounds and stations,” also called U&As.8 These U&As include inland waters, but also the waters of the Pacific Ocean. The Shoalwater Bay Tribe did not treaty with the United States, but is recognized as a sovereign nation (Shoalwater Bay Tribe 2015).
While Shoalwater Bay members do not have treaty-reserved fishing rights off-reservation, members of the other four tribes (Makah, Quileute, Hoh, and Quinault) do and fish under authority of their treaties, rather than by state license, in the open ocean. A series of federal court decisions established the right of the treaty tribes to half the harvestable surplus of salmon (United States v. Washington 1974 [Boldt decision]) and shellfish (United States v. Washington 1994 [Rafeedie decision]).9 In addition, in 1994, the United States formally recognized that the four treaty tribes have treaty rights to fish for groundfish in the Pacific Ocean, and that, in general terms, the quantification of those rights is 50 percent of the harvestable surplus of groundfish that pass through the tribes U&A fishing areas (50 Code of Federal Regulations [CFR] Section 660.50 2010; PFMC and NMFS 2006). Thus, in total, for the above-mentioned four coastal treaty tribes, this includes a significant percent of Pacific Coast fish and shellfish.
4.3.2 Tribal Fisheries Management
Tribal members participate in fisheries for Pacific whiting, salmon, groundfish, Pacific halibut, black cod/sablefish, and Dungeness crab, among others. Fisheries in the nearshore coastal waters are co-managed by the treaty tribes and WDFW. Ocean fisheries in United States waters (beyond three miles of the shore) are regulated by the PFMC with NOAA Fisheries oversight, and approval under the Magnuson-Stevens Act. Both state and tribal biologists participate in developing the scientific information that guides the decision-making and deliberative processes of the PFMC and NOAA Fisheries.
Each co-manager (federal, state, and tribal) is responsible for managing natural resources and regulating the fisheries within its jurisdiction, and collectively creates a coordinated and comprehensive approach to management. The State of Washington and the treaty tribes jointly determine optimal spawning
8 The Makah Tribe was a party to the Treaty of Neah Bay with the United States that was signed in 1855 (Washington State Historical Society 2004a). The Quileute Tribe, the Quinault Tribe, and members of other tribes including the Hoh, are signatories to the Treaty of Olympia (also known as the Quinault River Treaty) of 1856 (Washington State Historical Society 2004b).
9 In particular, the Rafeedie decision notes that because the right of taking fish is a reservation of the tribes’ pre-existing rights, and because the right to take any species, without limit, predated the Treaty of Neah Bay and Treaty of Olympia, the right of taking fish is without any species limitation (Intergovernmental Policy Council 2008, p. 3).
4-34 | Washington Coast Commercial Fisheries Washington Coastal Marine Advisory Council

Economic Analysis to Support Marine Spatial Planning in Washington
abundance and annual harvest levels, and each co-manager then adopts and enforces regulations for its fishers to harvest within these levels (Intergovernmental Policy Council 2008).
The treaty tribes participate in a variety of other fisheries management forums as well, including the 1985 Pacific Salmon Treaty, the IPHC, and (for the Makah Tribe) the Pacific Whiting Treaty Joint Management Committee (NOAA Fisheries 2015). The Federal government has accommodated these fisheries through a regulatory process described at 50 CFR 660.50. The Council works through the tribes’ representative on the Council to establish the formal allocation of groundfish, after accounting for the tribal treaty right. Since 1986, the tribes have received a direct halibut allocation from the IPHC. Since 1994, the tribes have received an allocation of black cod (sablefish) from the IPHC. That tribal allocation of both halibut and black cod is subsequently divided among the tribes by intertribal agreement. Pacific whiting, rockfish, and groundfish tribal harvest allocations are established on a year-to-year basis by the IPHC (NOAA Fisheries 2015, p. 3-263).
Commercial fishing seasons vary according to species, with seasons adjusted from year to year based on stock status and fishery management goals. For tribal commercial fishing, salmon fishing is generally open from early May until mid- to late June, and then again from early July until mid-September. Commercial groundfishing is generally open year-round for some species, with seasonal limits imposed on certain species. During the course of any year, periodic openings and closings for certain species may occur during the normal fishing season (PFMC 2014).
In addition to their co-management responsibilities, each treaty tribe regulates and coordinates its own fishery management program within its respective U&A. Details of each tribe’s fishery management programs are discussed below.
Vessel-level harvest data are generally not recorded with federal or state public agencies for tribal fisheries because tribal vessels need not be registered with state or federal authorities. These data may also exclude ex-vessel revenue estimates associated with landings. Therefore, the economics consultants contacted the tribes directly to obtain fisheries data, including, but not limited to, activity in tribal crab, salmon, groundfish, and at-sea Pacific whiting fisheries, to adequately analyze contributions from all components of Washington Coast tribal fisheries. Responses from the individual tribes varied, and the information contained below is a reflection of the data made available to the economic consultants.
4.3.3 Commercial Fisheries Profile of the Treaty Tribes
Makah
Fish harvested by commercial vessels include five species of salmon, groundfish, and shellfish (Dungeness crab and pink shrimp). Salmon fisheries, particularly the ocean troll fisheries for Chinook salmon and coho salmon, are managed by the IPHC to safeguard against overharvest of the least viable individual stocks. Salmon harvest restrictions have severely constrained harvest levels in some years. Makah tribal commercial fisheries include 20 different fisheries based on species, gear types, and seasons, (NMFS 2015, pp. 3-260 to 3-261), including:
Washington Coastal Marine Advisory Council Washington Coast Commercial Fisheries | 4-35

Economic Analysis to Support Marine Spatial Planning in Washington
Mid-water (Pacific whiting, yellowtail rockfish)
Bottom trawl (cod, flatfish)
Longline (halibut, black cod/sablefish)
Ocean troll (Chinook salmon and coho salmon)
Summer Strait (Chinook salmon and coho salmon)
Winter Strait (Chinook salmon)
Drift gill net (sockeye salmon, chum salmon, pink salmon)
Set gill net (Chinook salmon)
Dive fisheries (shellfish, sea cucumber, sea urchin)
Dungeness crab (ocean and Strait of Juan de Fuca)
River set net/hook-and-line (salmon)
Tuna
Hagfish (in development)
Commercial fishing is a primary component of the Makah Reservation economy. The Makah Tribe conducts a marine gillnet fishery along the shore near Cape Flattery and in the Strait of Juan de Fuca for Chinook salmon and sockeye salmon. The Makah also participate in a variety of bottomfish fisheries. Rockfish, sablefish, Pacific halibut, and whiting are the targeted species and are taken by trawl and longline gear. These fisheries occur year-round and are centered off the north coast of the Olympic Peninsula.
As of 2011, the most recent date available to the economic consultants, some 188 commercial vessels operated by Makah tribal members out of Neah Bay (NMFS 2015, p. 3-263). The ex-vessel values of tribal fishery landings in Neah Bay, in 2014 inflation-adjusted dollars, are presented in Table 4-18 for 2007−2011. The annual value ranged from $5.4 million to $8.2 million.
Table 4-18 Estimated Ex-vessel Value of Tribal Commercial Fishery Landings in Neah Bay: 2007 to 2011 (in thousands of 2014 dollars)
2007 2008 2009 2010 2011 Average
Groundfish 4,034 3,881 4,111 4,032 5,591 4,330
Salmon 1,470 1,561 1,184 3,003 2,218 1,887
Shellfish 342 264 24 21 333 197
Other 97 20 105 50 38 62
Total 5,943 5,726 5,424 7,107 8,180 6,476
Source: Adapted from NMFS West Coast Region 2015.
4-36 | Washington Coast Commercial Fisheries Washington Coastal Marine Advisory Council

Economic Analysis to Support Marine Spatial Planning in Washington
Note that the values shown in Table 4-18 exclude catch by tribal fishers other than that delivered to Neah Bay. The Makah Tribe participates in the Pacific whiting fishery, but virtually no whiting is landed and sold at the port of Neah Bay by tribal (or non-tribal) fishers. Some whiting (and other species) is delivered to Westport, but most of the Pacific whiting caught in the Makah tribal fishery is processed at sea. Because the whiting is processed at sea and not landed at a shore-based port, the value is not captured in the WDFW catch database (NMFS 2015, p. 3-264). Since the values shown in Table 4-18 exclude the value of landings in Wesport and Pacific whiting processed at sea, they understate the total Makah tribal fishery ex-vessel value.
Between 2000 and 2010, the whiting allocation to the tribe ranged from a low of 22,680 metric tons (25,000 tons) in 2002 to a high of 42,000 metric tons (46,297 tons) in 2009 and 2010 (76 Federal Register 18709, April 5, 2011).
Quileute
Commercial fishing is a mainstay of the economy of the Quileute Tribe; nearly every family on the Quileute Reservation has members involved in the commercial fishery (Quileute Tribe 2013, p. 15). Crab, salmon (coho and Chinook), blackcod, and Pacific halibut comprise the majority of the catch. Other species caught include tuna and other highly migratory species, sea cucumber, and other groundfish. Newly developing markets in Asia and elsewhere are presenting opportunities, and tribal interest has been growing in the prosecution of hagfish and Pacific whiting, including value-added processing and export (Quileute Tribe 2013).
High Tide Seafood of Port Angeles, a non-tribal processor, has maintainted an arrangement with the tribe that has provided fishers a ready buyer for their catch within La Push. In 2013, the tribe renewed a 5-year lease with High Tide for the operation of the facility (Quileute Tribe 2013, p. 20).
Table 4-19 provides a summary of annual harvests by species category and total annual combined ex-vessel revenue, in 2014 inflation-adjusted dollars, for the period 2005−2014. Total inflation-adjusted revenue in the period ranged from $1.1 million to $3.6 million per year.
Washington Coastal Marine Advisory Council Washington Coast Commercial Fisheries | 4-37

Economic Analysis to Support Marine Spatial Planning in Washington
Table 4-19 Quileute Tribal Fisheries: Annual Harvests by Species for Selected Years (thousands of lbs) and Total Annual Ex-vessel Revenue (thousands of 2014 dollars)
Species 2005 2006 2007 2008 2009 2011 2012 2013 2014
Crab 1,774 1,184 390 410 190 428 211 729 65
Blackcod 72 7 69 46 37 46 97 60 42
Halibut 41 38 54 47 27 6 15 3 12
Groundfish 1 5 20 58 36 13 26 10 33
Chinook 32 50 28 43 49 42 42 48 66
Coho 777 143 106 214 393 240 240 120 279
Steelhead 21 34 76 45 53 48 48 36 28
Other 12 1 0 0 0 1 1 1 0
Total weight (1,000 lbs) 2,730 1,462 743 865 785 824 680 1,006 525
Total revenue (1,000 2014$) 3,614 2,566 1,830 2,068 2,052 2,192 1,293 3,018 1,134
Source: Krueger 2015.
In 1998, the Quileute Tribe received recognition from WDFW that the tribe meets criteria under U.S. v. Washington, 384 F. Supp. 312 (W.D. Wa. 1974) to regulate its own fishery; only three tribes in Washington have this status (WDFW 1998). As a result, the tribe sets season length and catch or other restrictions, including management area, mesh size, and gear.
The Dungeness crab fishery is of particular importance to the tribe. The season typically begins in November and runs through the following October in most years, but this can vary (for example, the season began on October 17 in 2014 [Quileute Tribe 2014]). The fishery has a tribal exclusive zone from the beginning of the season through May 31 that runs from Cape Johnson to Destruction Island and out to 30 fathoms. The state opens its fishery in the area north of Destruction Island well after the tribe (e.g., on January 15, 2015, for the 2014/2015 season), the result of a management agreement stemming from a 2005 court case between WDFW and the Quileute Tribe. This gives the Quileute an opportunity to fish unhindered by the non-tribal fleet (Krueger 2015).
Hoh The Hoh Tribe is dependent economically, culturally, and spiritually upon fisheries within the tribe’s U&A area. The inland portion of its U&A is much larger than the ceded reservation lands, and for conservation purposes includes an area of more than 400 square miles of the Hoh River watershed, as well as an ocean U&A area of “over thousands of square miles” (Hoh Tribe 2015). The tribe places considerable emphasis and resources on the management and protection of its U&A fisheries.
Although the tribe does not have a port or marina on the reservation, a high proportion of tribal members participate in, and are dependent upon, the treaty commercial fishery through other ports along the Washington coast. No public information is available about the Hoh Tribe’s treaty commercial harvest or ex-vessel revenues.
4-38 | Washington Coast Commercial Fisheries Washington Coastal Marine Advisory Council

Economic Analysis to Support Marine Spatial Planning in Washington
Quinault Quinault commercial fishers harvest several tribal treaty fisheries in river and marine waters. These fisheries include gillnet (Chinook, coho and chum salmon, steelhead, and white sturgeon) on the Chehalis and Humptulips River sides of Grays Harbor; ocean troll (Chinook and coho salmon); marine (halibut, sablefish, lingcod, rockfish, and sardines); and Dungeness crab. Razor clams are also harvested from Pacific Coast beaches (Resource Dimensions 2015).
According to data developed by the Quinault Department of Fisheries (QDFi), the average number of QIN vessels and treaty fishers and helpers per fishery per year from 2004 to 2013 were as follows (Resource Dimensions 2015, p. ES-7):
13 ocean vessels for the ocean salmon, halibut, rockfish, sardine and sablefish fisheries and 22 crab vessels; and
123 treaty fishers in the Grays Harbor system gillnet fisheries; five treaty fishers and helpers in the ocean salmon fisheries; 13 treaty fishers and helpers in the halibut, rockfish, sardine and sablefish fisheries; and 23 treaty crab fishers and helpers.
The Quinault recently released a report on the economic impacts of crude oil transportion on the QIN and local economy, in response to proposed terminals in Grays Harbor (Resource Dimensions 2015). The following information on tribal commercial fisheries is derived from that report.
Table 4-20 displays the ex-vessel revenue, in thousands of 2014 inflation-adjusted dollars, from Grays Harbor treaty gillnet fisheries from 2004 to 2013. The largest source of revenue is from coho salmon, followed by Chinook salmon and white sturgeon. Revenue from white sturgeon has declined significantly since 2008.
Table 4-20 Ex-vessel Revenue from Grays Harbor Treaty Gillnet Fisheries (thousands of 2014 dollars)
Year Chinook Chum Coho Steelhead White
Sturgeon Total
2004 120 27 181 112 127 567
2005 60 13 281 86 204 644
2006 144 14 139 61 158 516
2007 120 3 138 81 101 443
2008 107 19 195 31 200 552
2009 75 20 335 14 86 529
2010 161 55 388 32 65 701
2011 259 140 475 71 74 1,019
2012 164 65 501 63 53 847
2013 115 66 429 45 68 723
Average 133 42 306 60 114 654
Source: Resource Dimensions 2015.
Washington Coastal Marine Advisory Council Washington Coast Commercial Fisheries | 4-39

Economic Analysis to Support Marine Spatial Planning in Washington
Table 4-21 displays the ex-vessel revenue from treaty ocean salmon troll fisheries (Chinook and coho salmon) for the same 2004−2013 period in thousands of 2014 inflation-adjusted dollars. Revenues have varied significantly from year to year, from a low of $5,000 in 2004 to a high of $186,000 in 2010.
Table 4-21 Ex-vessel Revenue from Treaty Ocean Salmon Troll Fisheries (thousands of 2014 dollars)
Year Chinook Coho Total
2004 3 2 5
2005 107 9 116
2006 12 3 15
2007 14 8 23
2008 36 10 46
2009 18 19 37
2010 146 40 186
2011 127 11 138
2012 87 10 97
2013 38 12 51
Average 59 13 71
Source: Resource Dimensions 2015.
Table 4-22 presents the ex-vessel revenue from treaty marine fisheries for 2004−2013 in thousands of 2014 inflation-adjusted dollars. The values represent an aggregate of revenue received from harvest of halibut, sablefish, lingcod, rockfish, and sardine fisheries. Average annual revenue for the 10-year period from treaty marine fisheries is about $1.1 million (2014 dollars).
In Table 4-23, the ex-vessel revenue is displayed for the QIN treaty Dungeness crab fishery for the period 2004−2013 in thousands of 2014 inflation-adjusted dollars. Although the value has ranged from $3.3 million to $10.8 million per year, the last three years of the period had the highest values, indicating a growing importance of the fishery to the QIN.
4-40 | Washington Coast Commercial Fisheries Washington Coastal Marine Advisory Council

Economic Analysis to Support Marine Spatial Planning in Washington
Table 4-22 Ex-vessel Revenue from Treaty Marine Fisheries (thousands of 2014 dollars)*
Year Total
2004 1,222
2005 906
2006 1,062
2007 797
2008 1,122
2009 1,248
2010 991
2011 1,233
2012 1,442
2013 637
Average 1,066
* Combined halibut, sablefish, lingcod, rockfish, and sardine fisheries.
Source: Resource Dimensions 2015.
Table 4-23 Ex-vessel Revenue from Treaty Dungeness Crab Fishery (thousands of 2014 dollars)
Year Total
2004 3,307
2005 5,341
2006 2,514
2007 7,379
2008 5,886
2009 7,742
2010 7,277
2011 9,296
2012 8,376
2013 10,826
Average 6,794
Source: Resource Dimensions 2015.
Table 4-24 contains the ex-vessel revenue from the treaty razor clam fishery in thousands of 2014 inflation-adjusted dollars. Average annual revenue is $637,000 but, similar to Dungeness crab, the last
Washington Coastal Marine Advisory Council Washington Coast Commercial Fisheries | 4-41

Economic Analysis to Support Marine Spatial Planning in Washington
three years were the highest of the period, indicating the fishery’s growing importance to the Quinault economy.
Table 4-24 Ex-vessel Revenue from Treaty Commercial Razor Clam Fishery (thousands of 2014 dollars)
Year Total
2004 580
2005 634
2006 432
2007 478
2008 550
2009 423
2010 618
2011 661
2012 656
2013 1,340
Average 637
Source: Resource Dimensions 2015.
The combined total ex-vessel revenue from Quinault treaty commercial fisheries is shown in Table 4-25. The value shown is an average for the 10-year period of 2004−2013, in 2014 inflation-adjusted dollars. The combined total is $9.2 million per year, with more than two-thirds coming from the Dungeness crab fishery.
Table 4-25 2004-2013 Annual Average Ex-vessel Revenues from Quinault Treaty Commercial Fisheries (thousands of 2014 dollars)
Year Total
Grays Harbor Gillnet 654
Ocean Salmon Troll 71
Marine Fish 1,066
Dungeness Crab 6,794
Razor Clam 637
Total Fisheries 9,223
Source: Resource Dimensions 2015.
The importance of commercial fishing to the Quinault can be further demonstrated by the number of vessels (Table 4-26) and commercial fishers and helpers (Table 4-27). The number of ocean vessels has averaged 13 per year, with a peak of 16 in 2009; crab vessels have averaged 22 during the 10-year period,
4-42 | Washington Coast Commercial Fisheries Washington Coastal Marine Advisory Council

Economic Analysis to Support Marine Spatial Planning in Washington
including 21 in each of the last four years shown. An average of 123 gillnetters, 23 crab fishers, 12 other ocean fishers, six ocean salmon fishers, and one sardine fisher operated in the treaty fishery.
Table 4-26 Counts of Quinault Indian Nation Vessels by Fishery
Year Ocean Vessels
Crab Vessels
2004 13 15
2005 12 26
2006 12 21
2007 10 22
2008 15 25
2009 16 24
2010 13 21
2011 13 21
2012 12 21
2013 9 21
Average 13 22
Source: Resource Dimensions 2015.
Table 4-27 Counts of Treaty Commercial Fishers and Helpers by Fishery by Year
Year Gillnet Fishers
Ocean Salmon Fishers
Other Ocean
Fishers* Sardine Fishers
Crab Fishers
2004 107 1 13 17
2005 123 12 25
2006 139 6 12 22
2007 111 4 10 24
2008 143 5 15 28
2009 111 3 16 26
2010 112 16 13 23
2011 111 6 13 23
2012 141 5 11 1 23
2013 132 4 8 1 23
Average 123 6 12 1 23
* Other Ocean Fishers – Halibut, Rockfish and Sablefish fisheries.
Source: Resource Dimensions 2015.
Washington Coastal Marine Advisory Council Washington Coast Commercial Fisheries | 4-43

Economic Analysis to Support Marine Spatial Planning in Washington
4.4 ECONOMIC CONTRIBUTIONS OF COMMERCIAL FISHING
4.4.1 Introduction
The total economic contribution of commercial fisheries to the Washington coast region includes the effects of fish landings and processing in the region’s ports, fish harvested off the Washington coast that are landed elsewhere (e.g., in Oregon or processed at-sea), and income earned by Washington coast residents involved in other regions’ fisheries.
The economic contribution of harvesting and primary processing serve as an indicator of the total level of jobs and income in a particular region that is attributable to a “basic” economic activity. For this analysis, the economic contribution includes the effects of all measurable economic linkages associated with direct expenditures by the commercial fishing and primary seafood processing industries, plus all indirect effects (jobs and income generated by businesses supplying inputs to the commercial fishing and seafood processing industries) and induced effects (jobs and income generated when employees and owners of directly affected and indirectly affected businesses spend their disposable income). The combined direct, indirect, and induced effects are termed “total effects,” and the process whereby direct expenditures are translated into total effects is known as the “economic multiplier.” Results of the analysis of the economic contribution of commercial fisheries harvests and landings to Washington coast shore-based processors are discussed below.
Total ex-vessel revenues from 2014 landings and estimated first wholesale revenues from primary processing were used as the direct effects for this analysis. The percentages of vessels’ and processors’ total revenues that were spent on a comprehensive (but summarized) list of operating expenditure categories were estimated from data developed for the Washington coast IO-PAC model and verified from key informant interviews with industry participants in Washington coast ports (Leonard and Watson 2011). Estimates of the regional distribution of expenditures by vessel operators and primary processors were also gleaned during the interviews.
Vessel owners’ addresses recorded in the landings database (WDFW 2015a) were also used to estimate the regional distribution of income payments to vessel owners and crews and to distribute certain fixed cost items that are normally associated with a vessel’s home port.
The expenditures by category were then mapped to the underlying IMPLAN industry sectors using distributions developed for the IOPAC model, and the resulting direct effects estimates were run using IMPLAN modeling software to generate the additional indirect and induced effects that together with the direct effects comprise the industry’s total regional economic contribution (IMPLAN 2015).
Industry economic contributions were measured in terms of total personal income and the numbers of jobs generated. For each scenario examined, two sets of regional impact estimates were analyzed: (1) effects confined to the five-county Washington coast region, and (2) effects in the State of Washington as a whole. Since the State-level regional economy is much larger than and actually includes the five county coast region’s economy, and since the State economy captures a greater portion of total expenditures, the
4-44 | Washington Coast Commercial Fisheries Washington Coastal Marine Advisory Council

Economic Analysis to Support Marine Spatial Planning in Washington
total effects estimated for the State of Washington are, without exception, larger than they are for the five-county coastal region.
In addition to these measurable contributions, there are also other effects that are less easily quantifiable. Fish harvested off the Washington coast may not necessarily be landed there, for example, landings delivered to Oregon ports or harvests in the at-sea Pacific whiting fisheries. Although data on landings made outside Washington State have been unavailable, the effects of the at-sea whiting fisheries are discussed below.
Many owners and crew members of fishing vessels operating on the Washington coast are also involved in commercial fisheries elsewhere, including other fisheries on the West Coast, in Puget Sound, or in Alaska. Since most regional fisheries are very seasonal, participation in fisheries in different regions is a means of economic diversification, helping to spread the inherent risk associated with involvement in any single fishery from year to year. While it is difficult to acquire sufficient information to perform a detailed economic analysis of the local effects of participation in so-called “distant water” fisheries, an example based on permit ownership in the Bristol Bay salmon fishery is presented below. It has also been pointed out by fisheries participants that the viability of many local fishing businesses would be threatened if key components of their Washington coast fishing portfolios (e.g., Columbia River or Willapa Bay salmon, Pacific Ocean albacore or Dungeness crab) or complementary opportunities in distant water fisheries (e.g., Bristol Bay or Prince William Sound salmon) were no longer available to them.
The economic contribution of recreational charters to the Washington coast are included in Chapter 7, Recreation and Tourism.
4.4.2 Contributions from Commercial Fisheries Harvesting and Primary Processing
Table 4-28 and Table 4-29 show estimated economic contributions of Washington coast non-tribal commercial fisheries landings and associated primary seafood processing by county, based on 2014 ex-vessel revenues reported in a database provided by WDFW (WDFW 2015a). Table 4-28 shows estimated total income and employment contributions confined to the five-county Washington coast region. Table 4-29 shows estimated total income and employment effects occurring in the State of Washington as a whole.
Totals in these tables include estimates of all income (employee compensation, crew shares, non-employee compensation, and proprietors’ income) and employment (total number of jobs) occurring in a given region (Washington coast or State of Washington) attributable to economic linkages associated with non-tribal commercial fisheries landings by identified vessels and primary processing by shore-based processors. For simplicity, estimates of state-level industry average income per job were used to translate income effects into employment contributions in both the coastal region and state-level analyses. To the extent that these state-level average income measures overstate the average earnings of coastal region jobs,
Washington Coastal Marine Advisory Council Washington Coast Commercial Fisheries | 4-45

Economic Analysis to Support Marine Spatial Planning in Washington
the associated employment effects in coastal region industries may be underestimated.10 The total income measures reported in Table 4-28 and Table 4-29 are not affected by this assumption.
These totals do not include additional impacts of secondary processing activities, include production of fishmeal or fish oil from primary-processing byproducts, secondary processing occurring inside or outside the five-county region, or effects from the downstream distribution and retailing of seafood products. It was beyond the scope of this project to collect sufficient information to estimate economic effects from downstream distribution, secondary processing, and retailing (although some of the impacts of local retailing of seafood products are included in the discussion of effects in Chapter 7).
Table 4-28 Direct Effects and Total Contributions to the Five-County Coastal Region Economy from 2014 Washington Coast Non-tribal Commercial Fishing and Seafood Processing by County of the Activity
Activity Coastwide Clallam County
Grays Harbor County
Pacific County
Wahkiakum County
Direct Expenditure Effects
Harvesting Income ($ mil.) 30.8 1.0 18.6 10.7 0.5
Employment (jobs) 1,120 50 610 410 50
Processing Income ($ mil.) 36.5 1.0 25.2 10.0 0.3
Employment (jobs) 470 10 330 130 5
Combined Income ($ mil.) 67.3 2.0 43.8 20.7 0.8
Employment (jobs) 1,600 60 940 550 55
Total Economic Contributions
Harvesting
Income ($ mil.) 35.6 1.2 21.5 12.3 0.5
Employment (jobs) 1,230 60 670 450 50
Processing
Income ($ mil.) 41.6 1.1 28.8 11.4 0.4
Employment (jobs) 600 20 410 160 10
Combined
Income ($ mil.) 77.2 2.3 50.3 23.7 0.9
Employment (jobs) 1,820 70 1,080 610 60
10 For example, $1 million in income could support either twenty $50,000-per-year jobs or forty $25,000- per-year jobs.
4-46 | Washington Coast Commercial Fisheries Washington Coastal Marine Advisory Council

Economic Analysis to Support Marine Spatial Planning in Washington
Table 4-29 Direct Effects and Total Contributions to the State of Washington Economy from Washington Coast Non-tribal Commercial Fishing and Seafood Processing by County of the Activity
Activity Coastwide Clallam County
Grays Harbor County
Pacific County
Wahkiakum County
Direct Expenditure Effects
Harvesting Income ($ mil.) 50.4 1.6 30.8 17.5 0.6
Employment (jobs) 1,770 90 990 640 50
Processing
Income ($ mil.) 38.4 1.0 26.5 10.5 0.4
Employment (jobs) 505 10 350 140 5
Combined Income ($ mil.) 88.8 2.6 57.3 27.9 0.9
Employment (jobs) 2,275 100 1,340 780 55
Total Economic Contributions
Harvesting
Income ($ mil.) 65.6 2.1 40.2 22.6 0.7
Employment (jobs) 2,060 100 1,170 740 50
Processing
Income ($ mil.) 51.4 1.3 35.6 14.0 0.5
Employment (jobs) 770 20 530 210 10
Combined
Income ($ mil.) 117.0 3.4 75.8 36.6 1.2
Employment (jobs) 2,830 120 1,700 950 60
As Table 4-28 and Table 4-29 show, the total economic contribution to the five-county Washington coast region from non-tribal commercial fishing and processing activities, based on 2014 landings, was estimated to be approximately $77.2 million in income and 1,820 jobs. Nearly two-thirds of the total was attributable to activity in Grays Harbor County, with most of the remainder (31 percent) attributable to Pacific County. Approximately 3 percent and 1 percent, respectively, of the total economic contributions were attributable to harvesting and processing activities in Clallam County and Wahkiakum County. An estimated 46 percent of total income and two-thirds of the total jobs contributed in the region are attributed to effects of harvesting sector activities.
The total economic contribution to the State of Washington from non-tribal commercial fishing and processing activities in the five-county coastal region in 2014 was estimated to be approximately $117 million in income and 2,830 jobs. These estimates incorporate additional direct and indirect spending effects resulting from economic linkages between the Washington coast economy and businesses elsewhere in Washington State outside the five-county coastal region. The combined contribution of Washington coast harvesting and processing activities to the entire State of Washington economy is more
Washington Coastal Marine Advisory Council Washington Coast Commercial Fisheries | 4-47

Economic Analysis to Support Marine Spatial Planning in Washington
than 50 percent larger, in terms of both income and employment effects, than the total economic contribution of those activities to the coastal region alone. Much of the difference is attributable to the effects of direct expenditures by vessels operating in Washington coast fisheries that are based in Puget Sound ports, with the remainder attributable to the additional indirect and induced effects captured in the larger state economy.
4.4.3 Contributions from Distant Water Fisheries
Contributions from distant water fisheries include income and employment derived from landings of Washington coast catch in ports other than on the Washington coast (e.g., Puget Sound), harvesting and processing of Pacific whiting in the at-sea fishery, and participation by Washington coast residents in fisheries in other regions, especially Alaska.
Washington Coast At-sea Pacific Whiting Fishery
Table 4-7 illustrated that the share of the at-sea sectors’ Pacific whiting catch taken in Washington waters has varied substantially over time, with some of the lowest catch shares from Washington waters occurring most recently. Because the at-sea Pacific whiting sectors do not deliver catch to local ports, their activities do not necessarily have a direct effect on the Washington coast economy. In addition, the apparent lack of participation by Washington coast-based vessels in the at-sea whiting fisheries indicates that spending of any earnings from these fisheries in the five county Washington coastal region is likely to be small.
However since many of the vessels engaged in this fishery are based in and/or operate from Puget Sound ports (Table 4-8), the activities of the at-sea whiting fishery sectors have a substantial effect on the economy of the State of Washington as a whole, particularly the Puget Sound region. Table 4-30
shows the estimated average annual contribution of the Washington coast portion of the at-sea Pacific whiting fishery to the Washington State economy in terms of direct and total income and employment. Average catch off the Washington over the period 2005-2014 was used for this analysis because the amounts have varied substantially from year to year (Table 4-7).
Table 4-30 shows the portion of the at-sea Pacific whiting fishery conducted off the Washington coast contributed an average of $15.8 million in total income and 220 total jobs to the Washington economy during 2005-2014.
4-48 | Washington Coast Commercial Fisheries Washington Coastal Marine Advisory Council

Economic Analysis to Support Marine Spatial Planning in Washington
Table 4-30 Direct Effects and Total Contributions to the State of Washington Economy from the Washington Coast Portion of the Non-tribal At-sea Pacific Whiting Fishery1
Income Contribution ($ million2)
Sector Direct Income Total Income
Mothership Sector3 3.2 4.2
Catcher-Processors 8.9 11.7
Total 12.0 15.8
Employment Contribution (Jobs)
Sector Direct
Employment Total
Employment
Mothership Sector3 40 60
Catcher-Processors 100 160
Total 140 220
1/ Based on average annual Pacific whiting catch in Washington waters during 2005-2014. 2/ Inflation-adjusted 2014 dollars. 3/ Includes only effects from mothership processors and catcher vessels registered to owners residing in Washington State.
Washington Coast Catch Landed in Puget Sound
In 2014, approximately 120 vessels landed catch from Washington coast catch areas in Puget Sound ports. The vast majority of these landings were Dungeness crab (WDFW 2015a). Approximately one-third of the vessels making these landings were registered to Washington coast residents. The estimated economic contributions of this activity is shown in Table 4-31. The total economic contribution to the five county Washington coast region was $2.3 million in income and approximately 60 jobs. The total contribution of this activity to State of Washington economy as a whole was $8.2 million in income and approximately 190 jobs.
Washington Coastal Marine Advisory Council Washington Coast Commercial Fisheries | 4-49

Economic Analysis to Support Marine Spatial Planning in Washington
Table 4-31 Direct Effects and Total Contributions to the Washington Coast and State of Washington Economies from Puget Sound Landings of Non-tribal Catch off the Washington Coast1
Total Coastal Region Economic Contributions
Total Washington State Economic Contributions
Direct Effects
Total Contribution
Direct Effects
Total Contribution
Harvesting
Income ($mil.) 2.1 2.3 4.8 6.3
Jobs 60 60 130 160
Processing
Income ($mil.) - - 1.4 1.9
Jobs - - 20 30
Combined
Income ($mil.) 2.1 2.3 6.3 8.2
Jobs 60 60 150 190
1 Based on 2014 landings.
Participation by Washington Coast Residents in Alaska Fisheries
Currently more than 18,000 permits have been issued for participation in fisheries regulated by the State of Alaska (Table 4-32).11 Table 4-32 shows that 239 current permits are owned by Washington coast residents. The vast majority (152, or 64 percent) of these permits are salmon fishery permits (Commercial Fisheries Entry Commission [CFEC] 2015). Table 4-33 details the distribution of ownership of those permits by individual salmon fishery.12 (CFEC 2015).
Table 4-32 Counts of Alaska Commercial Fisheries Permits by Species Group Showing Current (2015) Owners Residing in the State of Washington and on the Washington Coast*
Clams Crab Halibut Herring Sablefish Salmon Shrimp Misc. Total
Total Current Permits 112 878 1,705 1,882 696 10,924 415 1,837 8,449
Number Owned by WA State Residents 36 114 199 196 134 1,478 18 304 2,479
Number Owned by WA Coast Residents 11 12 17 18 11 152 4 14 239
% of Total Current Permits Owned by WA Coast Residents 9.8% 1.4% 1.0% 1.0% 1.6% 1.4% 1.0% 0.8% 1.3%
* Owners’ addresses in Clallam, Pacific, Grays Harbor, or Wahkiakum County or the coastal portion of Jefferson County. Source: CFEC 2015.
11 This total does not include pemits issued for federally managed groundfish and crab fisheries.
12 Only Alaska salmon fisheries that have permit owners residing on the Washington coast are included in the table.
4-50 | Washington Coast Commercial Fisheries Washington Coastal Marine Advisory Council

Economic Analysis to Support Marine Spatial Planning in Washington
Table 4-33 Counts of Alaska Commercial Salmon Fisheries Permits1 with Current (2015) Owners Residing in the State of Washington and on the Washington Coast2
Purs
e Se
ine,
So
uthe
ast
Purs
e Se
ine,
Pr
ince
Will
iam
So
und
Purs
e Se
ine,
Ko
diak
Purs
e Se
ine,
Ch
igni
k
Beac
h Se
ine,
Ko
diak
Dri
ft G
illne
t,
Sout
heas
t
Dri
ft G
illne
t,
Prin
ce W
illia
m
Soun
d
Dri
ft G
illne
t,
Cook
Inle
t
Dri
ft G
illne
t,
AK
Peni
nsul
a
Total Current Permits 317 268 373 92 31 475 538 570 164
Number Owned by WA State Residents 115 48 53 12 2 69 46 51 52
Number Owned by WA Coast Residents 3 1 2 1 1 3 7 24 3
% of Total Current Permits Owned by WA Coast Residents
0.9% 0.4% 0.5% 1.1% 3.2% 0.6% 1.3% 4.2% 1.8%
Table 4-23 (continued)
Dri
ft G
illne
t,
Bris
tol B
ay
Set
Gill
net,
Ya
kuta
t
Set
Gill
net,
Co
ok In
let
Set
Gill
net,
Ko
diak
Set
Gill
net,
Br
isto
l Bay
Han
d Tr
oll,
St
atew
ide
Pow
er T
roll,
St
atew
ide
All
Ala
ska
Salm
on
Perm
its3
Total Current Permits 1,867 168 735 189 975 983 962 10,924
Number Owned by WA State Residents
644 11 40 22 125 53 92 1,478
Number Owned by WA Coast Residents
60 1 2 3 21 4 16 152
% of Total Current Permits Owned by WA Coast Residents
3.2% 0.6% 0.3% 1.6% 2.2% 0.4% 1.7% 1.4%
Notes: 1 Only those salmon fisheries with permit owners residing on the Washington Coast are shown. 2 Owners’ addresses in Clallam, Pacific, Grays Harbor, or Wahkiakum County or the coastal portion of Jefferson County. 3 Permit counts for all Alaska salmon fisheries.
Source: CFEC 2015.
By far, the largest number of permits owned by Washington coast residents in any one distant waters fishery is the 60 permits in the Bristol Bay drift gillnet salmon fishery, representing 3.2 percent of the 1,867 total permits in the fishery. The next largest numbers of permits owned by Washington coast residents are 24 (4.2 percent of 570 permits) in the Cook Inlet drift gillnet fishery, 21 (2.2 percent of 975 permits) in the Bristol Bay set gillnet fishery, and 16 (1.7 percent of 962 permits) in the statewide power troll fishery.
Washington Coastal Marine Advisory Council Washington Coast Commercial Fisheries | 4-51

Economic Analysis to Support Marine Spatial Planning in Washington
A recent study estimated that in 2010, the Bristol Bay sockeye salmon fishery (drift gillnet and set gillnet) provided $72.7 million in net income to permit owners and $37.1 million in total payments to the fishing crews (Knapp et al. 2013). If the proportion of this income accruing to Washington coast residents is assumed to be the same as those residents’ ownership share of Bristol Bay gillnet permits, and that Washington coast permit owners utilize crew members who are also Washington coast residents, then the 81 (60 drift gillnet plus 21 set gillnet) of 2,842 (1,867 drift gillnet plus 975 set gillnet) total Bristol Bay gillnet permits that are owned by Washington coast residents would claim approximately 2.9 percent of total income earned by permit owners and vessel crews. In 2010, this amounted to approximately $3.2 million. Local spending in Washington coast communities of the disposable income portion of $3.2 million (adjusted for inflation) in 2014 is estimated to generate an additional $1.4 million induced income in the State of Washington as a whole, including $0.5 million induced income in Washington coast communities.
Ownership of permits and participation by Washington coast residents in the other fisheries off Alaska or elsewhere are expected to generate similar economic effects for Washington coast communities, albeit presumably on a smaller scale than the economic contribution of participation in Bristol Bay salmon fisheries.
Anther important contribution of distant-water fisheries is income earned by Washington coast residents from participation as crew members on vessels operating in fisheries off Oregon, Alaska, or elsewhere. Estimates of these effects are not included in this report, however, because there are no generally available data on the numbers or earnings of Washington coast residents employed as crew members in those fisheries.13
4.4.4 Other Economic Contributions from Commercial Fisheries
As the average age of participants in many West Coast fisheries increases over time, the need for “new blood” becomes ever more apparent. The increasingly high cost of entry into commercial fisheries was cited by participants as a significant impediment to new entrants. Most entrants need time and experience to learn the ropes and acquire the capital needed to purchase a boat and gear, along with the requisite permits and quota. Participation in Washington coast fisheries serves as a valuable source of training, experience, and income for those looking to operate in commercial fisheries. The onboard skills and business experience necessary to operate successfully in modern commercial fisheries, including large-scale West Coast groundfish and North Pacific fisheries, can be learned efficiently while working on vessels operating in the variety of fisheries conducted off the Washington coast.
Finally, the unique nature of regional fisheries fosters an unconventional source of savings and investment. Anecdotal examples describe participants in commercial fisheries insurance pools (an alternative to purchasing coverage from insurance companies) who were able to accumulate substantial savings from contributions to their insurance pools, accrue growth in value over time, and who, upon
13 The exception of the Bristol Bay salmon fishery is discussed above.
4-52 | Washington Coast Commercial Fisheries Washington Coastal Marine Advisory Council

Economic Analysis to Support Marine Spatial Planning in Washington
retirement from the fishery, were able to use their savings to reinvest in the local fishing industry. Insurance coverage acquired by paying premiums to companies in far-away places does not afford this type of opportunity to accumulate savings. The ability to accumulate savings from participating in locally based insurance pools is fairly unique to the commercial fishing industry.
4.5 TRENDS AND OUTLOOK FOR THE WASHINGTON COAST COMMERCIAL FISHING INDUSTRY
4.5.1 Introduction
In the future, commercial fisheries on the Washington coast will encounter opportunities and also face new challenges. Although what happens in the distant future may be so uncertain as to be almost anyone’s guess, there are several noteworthy issues that are likely to impact commercial fishing and seafood processing over the next few decades. Some are driven by the uncertain effects of changes in ocean conditions (e.g., temperature, circulation, and acidity), whether these changes are only cyclical or more permanent in nature. Other opportunities or challenges will be driven by changes in fisheries management regimes in response to calls to allow access to sustainable fisheries while simultaneously protecting vulnerable stocks. Some fisheries management changes will be in response to changing ocean conditions which affect the distribution of stocks. Finally, factors affecting world prices, international markets and demand for seafood products will continue to have both immediate and longer term impacts on the industry and on the Washington coast.
4.5.2 Ocean Conditions
The generally acknowledged trend toward warmer water temperatures in the world’s oceans is already seen as having effects on West Coast fisheries. Warmer water is less able to carry dissolved oxygen, and so warming has direct effects on species composition. Species that are sensitive to water temperature or dissolved oxygen levels will likely experience at least some redistribution along the West Coast.
For example, species such as salmon that require cooler water temperatures may be pushed further northward, but so will species that prefer warmer water, such as albacore. In the nearer-term future, this may mean that the Washington Coast benefits from both sides, as both salmon and albacore are more available during the year. But in the longer term it seems likely that salmon may become less available if the waters off the Washington coast become too warm. Likewise the effects of ocean warming may lead to smaller salmon runs if some of the regional streams and rivers that provide spawning and rearing habitat become too warm or the water levels too low to support healthy salmon runs.
Another climate-related issue with the potential for uncertain long term effects is ocean acidification due to increased absorption of carbon dioxide from the atmosphere. Acidification may negatively affect the health and/or survival of shellfish such as Dungeness crab, which is one of the main commercial fisheries on the West Coast. Pink shrimp is another important commercial shellfish species that may also be affected by ocean acidification. Concerns have also been expressed that increasing acidity may have a negative effect on the important Washington coast shellfish aquaculture industry.
Washington Coastal Marine Advisory Council Washington Coast Commercial Fisheries | 4-53

Economic Analysis to Support Marine Spatial Planning in Washington
The example of the Pacific sardine fishery also highlights the not well understood effects ocean conditions may have on the productivity of commercial fish stocks. The directed non-tribal sardine fishery was recently closed and may not reopen for several years. In addition to being a valuable commercial species in its own right, Pacific sardines may also be a key forage component for other species such as Pacific whiting and salmon. So the virtual disappearance of commercially-harvestable sardine stocks may presage additional negative effects on other fisheries and marine uses in the future (PFMC 2015b).
4.5.3 Fishery Management
Access to commercial fisheries is largely determined by managers’ interpretation of periodic assessments of the relative abundance of target species stocks as well as the abundance of certain co-occurring species. In order to reduce impacts on species considered as vulnerable, fishery managers may limit opportunities for commercial and recreational fishers to catch target species, even though those stocks are considered to be healthy. Examples include limits on seasons and allowable catch in Columbia River or Willapa Bay salmon fisheries in order to protect selected salmon runs or stocks; and the closure of marine areas at particular depths in order to reduce the likelihood of encountering certain groundfish species.
While these management moves have typically acted to restrict commercial fisheries access, sometimes in unexpected ways, there have been at least three recent examples of management actions that are likely to increase opportunities in commercial fisheries. Three widely-distributed groundfish species, petrale sole, widow rockfish and canary rockfish, have been recently declared rebuilt, meaning that these species are no longer subject to certain protections that were enforced in order to accelerate rebuilding of the stocks to more sustainable levels.
These species are key elements of groundfish fisheries but for different reasons. Petrale sole is the most valuable flatfish species per pound in the commercial groundfish fishery. A rebuilt petrale sole stock will lead directly to increased petrale sole landings and associated economic contributions to Washington coast communities. Increased access to widow rockfish, which has been a major target species in the past, will also leverage higher catches of co-occurring yellowtail rockfish. Canary rockfish has recently been more valuable in the commercial fishery as a constraint on access to other groundfish species than as a target species itself. Increased catch limits for canary rockfish should also leverage increased catches of a number of other commercial groundfish species, and also allow increased access for recreational groundfish fishers as well.
While rebuilding of petrale sole and widow rockfish was widely anticipated, the rebuilding of canary rockfish so far ahead of schedule was not expected. The main lesson to be drawn is that fisheries management decisions will continue to affect commercial fisheries in unexpected ways. Measures intended to restrict catch of certain vulnerable species will also limit access to other healthy stocks. The eventual relaxation of rebuilding measures, especially for several currently overfished rockfish species, will leverage increased ability to target and catch other co-occurring species. However the timing of when these watershed events occur may be very uncertain.
4-54 | Washington Coast Commercial Fisheries Washington Coastal Marine Advisory Council

Economic Analysis to Support Marine Spatial Planning in Washington
4.5.4 Seafood Markets
Disruption of world markets can have profound effects on the supply, demand and distribution of seafood products. World markets are likely to experience events that will have both immediate and longer term impacts on the commercial fishing industry.
Simple fluctuations in the rates of exchange between the U.S. dollar and the currencies of key trading partners such as Japan, China and the European Union (EU) can cause a profitable trade pattern to become unprofitable almost overnight. These effects can be particularly pronounced for species such as sablefish, for which the main markets are in Japan. Pacific whiting products face similar uncertainties, and since important recent growth markets for these products have been in Russia and Eastern Europe, the risks are exacerbated by political uncertainty. Product boycotts or punitive tariffs imposed by national
governments for political reasons can leave seafood distributors scrambling to move product for which the market suddenly disappeared. For example, earlier this year it was rumored that excess seafood supplies that were unable to be moved because of the Russian boycott were backing up in regional cold storage facilities affecting their ability to store new product. So the impacts from that one market failure were also having knock-on effects on product forms and prices of other products.
The combination of a relatively strong dollar and political turmoil along the Russia-Ukraine border seems likely to persist, at least in the near future. This will likely dampen demand for Washington coast sablefish, Pacific whiting and other seafood products that rely on foreign markets. In addition the emerging political and economic turmoil in the EU over the Greek debt crisis may serve to reduce demand for Washington coast seafood products by weakening the value of the Euro relative to the U.S. dollar and also contributing to general economic uncertainty in Europe.
The recent emergence of China as a consumer market for West Coast-caught Dungeness crab is another case in point. The Chinese may be able to radically influence markets for some goods and services just by exercising their burgeoning purchasing power. Shipment of live crabs to China significantly increased the average ex-vessel prices paid recently for Dungeness crab landed in Washington ports. It will be interesting to see whether this trend for Dungeness crab observed over the past couple of years continues, and whether it extends to other Washington coast seafood products. While higher ex-vessel prices may be a benefit to harvesters in the near term, some local processors and domestic consumers may be priced out of the market. So the net result of this emerging trend on Washington coast communities is somewhat uncertain.
4.5.5 Vessel Safety
Commercial fishery participants have expressed concern regarding the perceived declining trend in fishing vessel safety in recent years. High costs and year-round fishing activities have prompted some operators to defer maintenance, making vessels more susceptible to accidents at sea. Participants were particularly concerned about the direction of the Dungeness crab fishery, which by its nature is a “derby-
© Lorrie Jo Williams
Dungeness crab at seafood market
Washington Coastal Marine Advisory Council Washington Coast Commercial Fisheries | 4-55

Economic Analysis to Support Marine Spatial Planning in Washington
style” fishery, where the bulk of the annual catch is landed during a very short period between Thanksgiving and Chinese New Year at the beginning of the season. The need for participants to get out as many times as possible during what is normally the worst weather of the year, and the limited areas open to vessels off the Washington coast at the beginning of the season, exacerbate the safety issues.
A related safety issue involves channel dredging in coastal ports. Periodic dredging is needed to keep the river bar or port entrance as safe as possible for vessel passage. Federal dredging budgets and schedules, however, are determined by the vessel tonnage using a port or channel. As fishing vessel fleets using certain ports diminish, channel dredging becomes less frequent, threatening to further exacerbate navigational safety issues for those vessels remaining.
REFERENCES
50 CFR 660.50. 2010. Pacific Coast treaty Indian fisheries. 75 Federal Register 60897, October 1, 2010, as amended at 75 FR 75421, Dec. 3, 2010; 75 FR 82300, Dec. 30, 2010; 76 FR 27529, May 11, 2011; 76 FR 28903, May 19, 2011; 77 FR 28507, May 15, 2012.
76 Fed. Reg. 18709, April 5, 2011. Magnusen-Stevens Act Provisions; Fisheries off West Coast States; Pacific Coast Groundfish Fishery; 2011 Tribal Fishery for Pacific Whiting. Available at: www.pcouncil.org/wp-content/uploads/2011-8077.pdf. Accessed June 2015.
BEA. See U.S. Department of Commerce, Bureau of Economic Analysis.
CFEC. See Commercial Fisheries Entry Commission.
Commercial Fisheries Entry Commission. 2015. On-line query for Permits Yearly Download, Available at: www.cfec.state.ak.us/plook/#downloads. Accessed May 21, 2015.
Hoh Tribe. 2015. Hoh Tribe Natural Resources. Available at: hohtribe-nsn.org/?page_id=177. Accessed: June 2015.
IMPLAN Group, LLC, IMPLAN System (data and software. 16740 Birkdale Commons Parkway, Suite 206, Huntersville, NC 28078. Available at: www.IMPLAN.com.
Intergovernmental Policy Council. 2008. An overview of Tribal, state, and federal co-management relationships in Washington. Condition Report Addendum to the Olympic Coast 2008 Condition Report of the Olympic Coast National Marine Sanctuary. Available at: olympiccoast.noaa.gov/ library/docs/conditionreport_ocnms_ipc_addend.pdf. Accessed May 2015.
Kearney, M., et al. 2014. What’s the Catch? Challenges and Opportunities of the U.S. Fishing Industry. The Hamilton Project. 1775 Massachusetts Ave., NW Washington, DC 20036. Available at: www.hamiltonproject.org/papers/whats_the_catch_challenges_and_opportunities_of_the_u.s._ fishing_indus. Accessed June 29, 2015.
4-56 | Washington Coast Commercial Fisheries Washington Coastal Marine Advisory Council

Economic Analysis to Support Marine Spatial Planning in Washington
Knapp, G., M. Guettabi, and S. Goldsmith. 2013. The Economic Importance of the Bristol Bay Salmon Industry. Institute of Social and Economic Research. University of Alaska, Anchorage. April 2013. Prepared for Bristol Bay Regional Seafood Development Association. Available at: www.iser.uaa.alaska.edu/Publications/2013_04-TheEconomicImportanceOfTheBristolBay SalmonIndustry.pdf.
Leonard, J., P. Watson. 2011. Description of the input-output model for Pacific Coast fisheries. U.S. Dept. of Commerce, NOAA Tech. Memo., NMFS-NWFSC-111, 64 pp. Available at: www.nwfsc.noaa.gov/assets/25/1620_08012011_142237_InputOutputModelTM111 WebFinal.pdf.
NOAA Fisheries, West Coast Region. 2015. Draft Environmental Impact Statement on the Makah Tribe Request to Hunt Gray Whales. February. Available at: www.westcoast.fisheries.noaa.gov/ publications/protected_species/marine_mammals/cetaceans/gray_whales/makah_deis_feb_2015.pdf. Accessed June 25, 2015.
Pacific Fisheries Information Network. 2015. PacFIN Report: PCID Codes and Corresponding Agency Ports. Available at: pacfin.psmfc.org/pacfin_pub/data_rpts_pub/code_lists/agency_ports_pcid.txt. Accessed on May 29, 2015.
PacFIN. See Pacific Fisheries Information Network.
Pacific Fishery Management Council. 2014. Review of 2014 ocean salmon fisheries: stock assessment and fishery evaluation document for the Pacific Coast Salmon Fishery Management Plan. Document prepared for the Council and its advisory entities. Pacific Fishery Management Council, Portland, Oregon. Available at: www.pcouncil.org/salmon/stock-assessment-and fishery-evaluation-safe-documents/review-of-2014-ocean-salmon-fisheries. Accessed June 2015.
Pacific Fishery Managment Council. 2015a. The Pacific Groundfish Fishery Managment Plan and Amendments. Available at: www.pcouncil.org/groundfish/fishery-management-plan. Accessed June 29, 2015.
Pacific Fishery Managment Council. 2015b. The Line, Volume 4, Number 1, May 2015. Available at: www.pcouncil.org/wp-content/uploads/2009/12/The-Line-Spring-2015.pdf. Accessed June 10, 2015.
Pacific Fishery Management Council and NMFS. 2006. Proposed acceptable biological catch and optimum yield specifications and management measures for the 2007-2008 Pacific Coast Groundfish Fishery and Amendment 16-4: rebuilding plans for depleted Pacific Coast Groundfish Species, Final Environmental Impact Statement, October 2006.
PFMC. See Pacific Fishery Managment Council.
Quileute Tribe. 2013. Comprehensive Economic Strategy (CEDS) – 2013-2018. September 25, 2013.
Quileute Tribe. 2014. Dungeness Crab Regulations, 2014/2015. October 16, 2014.
Washington Coastal Marine Advisory Council Washington Coast Commercial Fisheries | 4-57

Economic Analysis to Support Marine Spatial Planning in Washington
Resource Dimensions. 2015. Economic impacts of crude oil transport on the Quinault Indian Nation and the local economy. April. Available at: earthjustice.org/sites/default/files/files/Letter%20 Maia%20Bellon%20at%20Ecology%20re%20Economic%20Report%20Attachment.pdf. Accessed June 25, 2015.
Shoalwater Bay Tribe. 2015. Shoalwater Bay Tribe History-Culture. Available at: shoalwaterbay tribe.com/shoalwter-bay-tribe-history-culture. Accessed June 28, 2015.
U.S. Department of Commerce, Bureau of Economic Analysis. 2015. Current-Dollar and “Real” Gross Domestic Product. Available at: www.bea.gov/national/xls/gdplev.xls. Accessed May 29, 2015.
U.S. Department of Commerce, National Oceanic and Atmospheric Administration, National Marine Fisheries Service, West Coast Region. 2015. Draft Environmental Impact Statement on the Makah Tribe Request to Hunt Gray Whales. February 2015. Available at: www.westcoast. fisheries.noaa.gov/publications/protected_species/marine_mammals/cetaceans/gray_whales/makah_deis_feb_2015.pdf. Accessed June 25, 2015.
Washington Department of Fish and Wildlife. 1998. Letter from Philip Anderson, Staff Director, to Mel Moon, Quileute Tribe. January 29, 1998.
Washington Department of Fish and Wildlife. 2015a. Landings and ex-vessel revenue data for non-tribal commercial fisheries during 2004-2014 (Excel dataset).
Washington Department of Fish and Wildlife. 2015b. Total annual catch and estimated catch off the Washington coast by vessels operating in the at-sea Pacific whiting Sector, 2005-2014 (Excel dataset).
Washington Department of Fish and Wildlife. 2015c. State of registration by year for Vessels Operating in the At-sea Pacific Whiting Sector, 2005-2014 (Excel dataset).
Washington Department of Fish and Wildlife. 2015d. Recreational angler trip counts by Washington coast área, 2004-2014 (Excel dataset).
Washington Department of Fish and Wildlife. 2015e. Dungeness crab catch and pot density by área (email from WDFW, June 2, 2015).
Washington State Historical Society. 2004a. Treaty of Neah Bay 1855. Available at: washingtonhistory online.org/treatytrail/treaties/timeline/treaty_4.htm. Accessed June 28, 2015.
Washington State Historical Society. 2004b. Treaty of Olympia 1856. Available at: washingtonhistory online.org/treatytrail/treaties/pdf/olympia-treaty.pdf. Accessed June 28, 2015.
WDFW. See Washington Department of Fish and Wildlife.
PERSONAL COMMUNICATIONS
Krueger, K. 2015. Annual Quileute Tribal fisheries reports, selected years.
4-58 | Washington Coast Commercial Fisheries Washington Coastal Marine Advisory Council

Economic Analysis to Support Marine Spatial Planning in Washington
IMAGES
Chapter 4 Header Image: (cc) Cory Barnes, 2009. Retrieved July 6, 2015, from: www.flickr.com/photos/ 1337n00b/3835502849
Page 4-11: NOAA/CBNMS 2005, photographer Rick Starr. Pacific whiting (Merluccius productus) on soft bottom habitat at 302 meters. Retrieved July 7, 2015, from: www.flickr.com/photos/ 51647007@N08/5020499898
Page 4-19: Dave Parker, 2004. Dsc_0073. Retrieved July 7, 2015, from: www.flickr.com/photos/ svdasein/348099912
Page 4-25: Washington Department of Fish and Wildlife 2015. Retrieved July 8, 2015, from: wdfw.wa.gov/fishing/tuna
Washington Coastal Marine Advisory Council Washington Coast Commercial Fisheries | 4-59

Economic Analysis to Support Marine Spatial Planning in Washington
This page intentionally left blank
4-60 | Washington Coast Commercial Fisheries Washington Coastal Marine Advisory Council

CHAPTER 5. Shellfish Aquaculture
As was outlined in the Marine Sector Analysis Report on Aquaculture (Industrial Economics, Inc. [IEc] 2014), the aquaculture industry on the Pacific Coast of Washington is concentrated primarily within Willapa Bay (Pacific County) and Grays Harbor (Grays Harbor County). Therefore, this analysis focuses solely on those two coastal counties. The communities of South Bend, Nahcotta, and Bay Center (all on Willapa Bay) serve as the primary centers of the industry’s activities. All but one of the shellfish farms operating within this region are family-owned businesses. They range in size from small operations that farm relatively small parcels of aquatic lands to vertically integrated industrial complexes engaged in production, processing, distribution, and marketing with thousands of acres of productive land.
5.1 OVERVIEW OF AQUACULTURE IN WILLAPA BAY AND GRAYS HARBOR
Data provided by Washington Department of Fish and Wildlife (WDFW) indicate that 20 farms in Pacific County and six farms in Grays Harbor County reported sales of shellfish products in 2012 (WDFW 2014). Hudson and Wellman (2012) and local growers report, however, that the WDFW numbers underestimate the true levels of participation. According to local growers, this number fluctuates on a regular basis; firms enter and exit the industry on a fairly regular basis, and some operate at such a small scale that their production levels are too insignificant a percentage of the total to be counted. The membership list for the Willapa Grays Harbor Oyster Growers Association (WGHOGA) in 2014 indicated 28 growers in Pacific and 7 growers in Grays Harbor counties. All of the reported shellfish farms are operated on privately owned tidelands or on tidelands that are owned by the state and leased through the Washington Department of Natural Resources (DNR) to shellfish growers. DNR reports that in 2010, shellfish farmers
Washington Coastal Marine Advisory Council Shellfish Aquaculture | 5-1

Economic Analysis to Support Marine Spatial Planning in Washington
Figure 5-1 Facility Location Map Source: Washington Department of Ecology 2014
5-2 | Shellfish Aquaculture Washington Coastal Marine Advisory Council

Economic Analysis to Support Marine Spatial Planning in Washington
Figure 5-2 Grays Harbor Tidelands Source: Washington Department of Ecology 2014
Washington Coastal Marine Advisory Council Shellfish Aquaculture | 5-3

Economic Analysis to Support Marine Spatial Planning in Washington
Figure 5-3 Willapa Bay Tidelands Source: Washington Department of Ecology 2014
5-4 | Shellfish Aquaculture Washington Coastal Marine Advisory Council

Economic Analysis to Support Marine Spatial Planning in Washington
held a total of 82 leases on the coast with 1,714 acres of leased tideland being actually farmed (IEc 2014, p. 9). Northern Economics, Inc. (NEI), (2013) report that in 2010, a total of 17,288 acres were commercially farmed in Pacific County, along with 2,288 acres in Grays Harbor. Growers suggest that these numbers may be overestimates (D. Wilson and B. Sheldon, pers. comms., 2015). There is great uncertainty about the actual number of acres in aquaculture production because acreage is continually being rotated and some percentage of each tract may or may not be usable ground (D. Wilson, pers. comm., 2015). Growers report that they typically farm between two-thirds and one-half of the acreage they own (D. Wilson and E. Hall, pers. comms., 2015).
According to IEc (2014) who based their estimates on WDFW harvest data, Pacific oysters account for the majority (82 percent) of shellfish farmed and harvested in the Pacific and Grays Harbor counties, followed by Manila clams (16 percent). In 2013, Pacific oysters comprised 83 percent ($16,235,000) of total farm gate value of shellfish harvsted in the region, while Manila clams accounted for 11 percent ($2,059,000) of total value. Small amounts of other species are grown by some growers (e.g., eastern oysters, 2 percent), and some growers are experimenting with geoduck and Kumomoto oysters. Most of the oysters harvested are shucked and canned or sold in-shell (singles). Clams are typically sold in the shell. More details relative to processing and distribution are reported in Section 5.3 of this chapter. IEc (2014) also present slightly conflicting data from the U.S. Department of Agriculture (USDA) (USDA 2014) who report that Pacific County ranked second among all Washington counties in shellfish aquaculture production, with sales of $21,304,000 in 2012 while Grays Harbor County ranked fourth statewide with shellfish aquaculture sales of $5,559,000.
The IEc Aquaculture Sector Analysis (2014) provides figures and tables that outline relative harvest (pounds and value) of farmed shellfish products in Pacific and Grays Harbor Counties, total annual harvest and value of Pacific oysters and Manila clams from 2004 through 2013, a summary of harvest and value of aquaculture products in Grays Harbor and Pacific Counties for 2004 through 2013 using 2014 WDFW data (IEc 2014, pp. 17-22). These are reproduced below as Figure 5-4 through 5-7 and Table 5-1.
While it is recognized that these data are not as realiable as one might prefer, they is the best available to illustrate trends in the industry. These data show that between 2004 and 2013 harvest (in round pounds) for manila clams in both counties ranges from 704,529 to 1,138,118 with the highest level production in 2007 at 1,153,198 pounds. The harvest value for clams ranges from $1,647,259 in 2004 to $2,007,529 in 2013 with the highest value in 2007 at $2,638,361. The production of Pacific oysters between 2004 and 2013 ranged from 7,559,398 to 5,842,470. The highest level of production for oysters was again 2007 with 8,274,431 pounds. The harvest value for Pacific oysters ranges between $16,591,771 to $16,381,505 with a high in 2007 at $24,067,685. These data suggest that there has been a general increase in Manila clam production and a general decrease in Pacific oyster over the last 10 years. While no forecast data exists for this industry one expects to see changes in shellfish aquaculture production and value over time.
© Katharine Wellman 2015
Washington Coastal Marine Advisory Council Shellfish Aquaculture | 5-5

Economic Analysis to Support Marine Spatial Planning in Washington
Figure 5-4 Relative Harvest (round pounds) of Farmed Shellfish Products in Pacific and Grays Harbor Counties, 2013 Source: IEc 2014
Figure 5-5 Relative Value (dollars) of Farmed Shellfish Products in Pacific and Grays Harbor Counties, 2013 Source: IEc 2014
The IEc aquaculture sector analysis list several exogenous varibles that negatively affect the industry including: invasive, noxious and nuisance species, regulatory structure and requirements, failure of natural set, climate change (sea level rise and ocean acidification), workforce availability, and space use conflicts. Given existing data one might expect to see a declining trend in oyster production due to impacts of burrowing shrimp, increased regulatory and Washington Department of Health sampling requirement costs, and ocean acidification. On the other hand if firms continue to develop their value
5-6 | Shellfish Aquaculture Washington Coastal Marine Advisory Council

Economic Analysis to Support Marine Spatial Planning in Washington
added markets the shellfish aquaculture industry could see future increases in overal revenues. In terms of clam production, there is a potential for increased growth in this sector of the industry especially if burrowing shrimp continues to negatively impact oyster grow out and production.
Figure 5-6 Total Annual Harvest and Value of Pacific Oysters in Pacific and Grays Harbor Counties Source: IEc 2014
Figure 5-7 Total Annual Harvest and Value of Manilla Clams in Pacific and Grays Harbor Counties Source: IEc 2014
Washington Coastal Marine Advisory Council Shellfish Aquaculture | 5-7

Economic Analysis to Support Marine Spatial Planning in Washington
Table 5-1 Summary of Harvest and Value of Aquaculture Products in Pacific and Grays Harbor Counties
Source: IEc 2014
The next section of this report provides a brief review of literature relevant to the economic impacts of shellfish aquaculture on the Pacific Coast of Washington. The most relevant piece of work is provided by NEI (2012). Details of that report relating to Pacific and Grays Harbor Counties are described in Section 5.2. Section 5.3 provides further information related directly to the processing and distribution sector of the Pacific and Grays Harbor County shellfish aquaculture sector. This information, as well as WDFW production data updated for inflation, is used to augment the work of NEI (2013) and include the
5-8 | Shellfish Aquaculture Washington Coastal Marine Advisory Council

Economic Analysis to Support Marine Spatial Planning in Washington
economic impacts of processing and distribution. These results are presented in Section 5.4. Section 5.5 offers suggestions of other contributions made by the shellfish aquaculture sector.
5.2 PREVIOUS ECONOMIC ASSESSMENTS
5.2.1 Literature
Numerous studies have conducted analysis of the economic impact of aquaculture industries on local or regional economies (Kaliba et al. 2004; Kaliba and Engle 2008; Deisenroth, Bond, and Loomis 2011), but few have addressed the coast of Washington in particular. One such study, conducted by TCW Economics (2006), assessed the economic impact and benefit of Washington’s non-treaty commercial and recreational fisheries. WGHOGA periodically surveys its members on production and revenues, but the response rate and input to these surveys do not allow for any form of statistical analysis (D. Beugli, pers. comm., 2015). With funding from the National Oceanic and Atmospheric Administration (NOAA), Pacific Shellfish Institute (PSI) and NEI conducted a revenue and expenditure survey of shellfish growers in Washington, Oregon, and California and completed an input-output (I-O) model in 2013 (NEI 2013). The analysis and results for Grays Harbor and Pacific Counties from this latter study are outlined below.
5.2.2 Northern Economics 2013 Report
As part of the 2013 study completed by NEI, the economic impact of shellfish aquaculture production in Washington State was analyzed using survey data collected for 2010. The survey was administered by PSI. Of the approximately 330 commercial shellfish growers in Washington, a total of 43 responded to the survey, with seven respondents supplying detailed expenditure data. Even though the response rate was only 13 percent, those 43 respondents accounted for 76 percent of the total permitted acreage in Washington.
Table 5-2 summarizes the survey response rate as a percentage of total commercially farmed acres by county. Pacific and Grays Harbor Counties are reported as being the two largest counties, by survey acreage, in Washington State at 14,681 and 3,278, respectively.
Washington Coastal Marine Advisory Council Shellfish Aquaculture | 5-9

Economic Analysis to Support Marine Spatial Planning in Washington
Table 5-2 Survey Response Rate by Acreage and County
County Survey Acreage Total Acreage Response Rate (%)
Grays Harbor 3,278 2,288 143*
Island 55 87 63
Jefferson 666 1,155 58
Kitsap 25 485 5
Mason 814 4,079 20
Pacific 14,681 17,288 85
Pierce 39 138 28
Skagit 2,233 3,018 74
Thurston 710 1,037 68
Other 0 88 0
Total 22,502 29,663 76 Note: Total acreage by county was supplied to NEI by PSI.
* Acreage reported for Grays Harbor County by survey respondents exceeds total acreage in the Washington Department of Health database. PSI confirmed with respondents that the survey total is likely correct and the difference is due to inaccuracies in the WDFW database.
Source: NEI 2013
Survey respondents reported 1,266 direct jobs in Washington, with individual firm responses ranging from 0 to more than 400 employees. The survey data indicate a minimum employment of 0.01 person per farmed acre (or 1 person per 100 farmed acres) and a maximum employment of 5 people per farmed acre (or 500 people per 100 acres). In all, Washington shellfish growers averaged 1 person per farmed acre. Reported employment varies significantly for different operation types.
Employment by shellfish producers is not specific to the county where growing operations take place. For instance, Pacific and Grays Harbor Counties report the largest number of shellfish farming acres; however, they represent only 27 percent and 2 percent, respectively, of total aquaculture farming employment in Washington. This indicates that employment activity generated by shellfish aquaculture farms affects the surrounding areas. Figure 5-8 summarizes employment and acreage by county.
5-10 | Shellfish Aquaculture Washington Coastal Marine Advisory Council
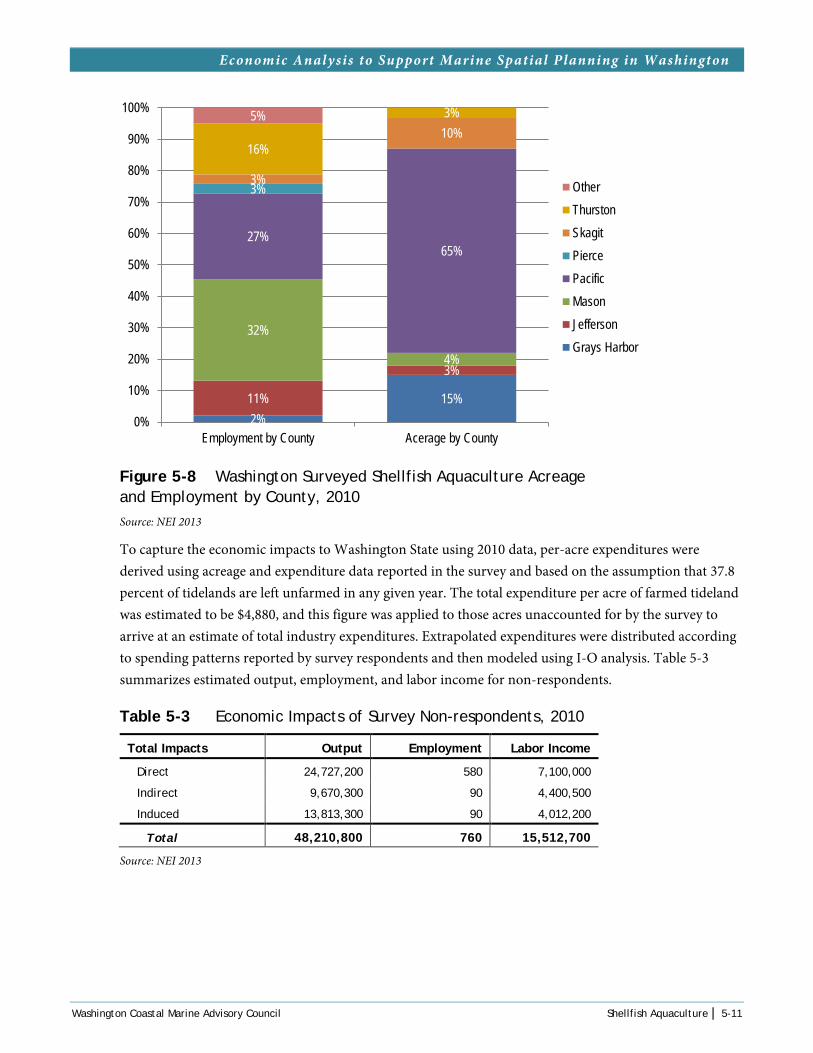
Economic Analysis to Support Marine Spatial Planning in Washington
Figure 5-8 Washington Surveyed Shellfish Aquaculture Acreage and Employment by County, 2010 Source: NEI 2013
To capture the economic impacts to Washington State using 2010 data, per-acre expenditures were derived using acreage and expenditure data reported in the survey and based on the assumption that 37.8 percent of tidelands are left unfarmed in any given year. The total expenditure per acre of farmed tideland was estimated to be $4,880, and this figure was applied to those acres unaccounted for by the survey to arrive at an estimate of total industry expenditures. Extrapolated expenditures were distributed according to spending patterns reported by survey respondents and then modeled using I-O analysis. Table 5-3 summarizes estimated output, employment, and labor income for non-respondents.
Table 5-3 Economic Impacts of Survey Non-respondents, 2010
Total Impacts Output Employment Labor Income
Direct 24,727,200 580 7,100,000
Indirect 9,670,300 90 4,400,500
Induced 13,813,300 90 4,012,200
Total 48,210,800 760 15,512,700
Source: NEI 2013
2% 15% 11%
3%
32%
4%
27% 65%
3% 3%
10% 16%
3% 5%
0%
10%
20%
30%
40%
50%
60%
70%
80%
90%
100%
Employment by County Acerage by County
OtherThurstonSkagitPiercePacificMasonJeffersonGrays Harbor
Washington Coastal Marine Advisory Council Shellfish Aquaculture | 5-11

Economic Analysis to Support Marine Spatial Planning in Washington
Total output, employment, and labor income for 2010 were modeled for survey respondents separately, as summarized in Table 5-4.
Table 5-4 Economic Impacts of Respondents, 2010
Total Impacts Output Employment Labor Income
Direct 76,690,900 1,320 30,190,600
Indirect 28,562,400 300 16,793,900
Induced 30,961,587 330 14,625,400
Total 136,214,887 1,950 61,609,900
Source: NEI 2013
Combining Table 5-3 and Table 5-4 provides total economic impacts of shellfish aquaculture production to Washington in 2010. The results are shown in Table 5-5.
Table 5-5 Total Economic Impact of Shellfish Aquaculture to Washington State, 2010
Multipliers per dollar Output Employment Labor Income
Direct 101,418,100 1,900 37,290,600
Indirect 38,232,700 390 21,194,400
Induced 44,774,900 420 18,637,600
Total 184,425,700 2,710 77,122,600
Source: NEI 2013
Based on Table 5-5, shellfish aquaculture growing operations are estimated to have spent $101.4 million in Washington and employed 1,900 people in 2010. This spending, in turn, generated approximately $184.4 million in total output and an additional 810 jobs through indirect and induced impacts. The economic multipliers generated through industry spending are shown in Table 5-6. Multipliers can be interpreted as relative dollar generation for each dollar spent. Therefore, for every dollar spent by the shellfish aquaculture industry, $1.82 worth of economic activity is generated. In addition, every dollar spent by the shellfish aquaculture industry generates $0.76 in labor income in Washington. Lastly, for every million dollars spent by the shellfish aquaculture industry, approximately 27 jobs are created.
Table 5-6 Washington Shellfish Aquaculture Multipliers
Output (per $) Employment Labor Income (per $)
Multiplier 1.82 26.72 0.76
Source: NEI 2013
The economic impact that each county contributes to the statewide impact as a whole is derived by assuming that total output, employment, and labor income are generated in proportion to the number of leased acres. Table 5-7 summarizes the acres and resulting economic impact of shellfish aquaculture by
5-12 | Shellfish Aquaculture Washington Coastal Marine Advisory Council
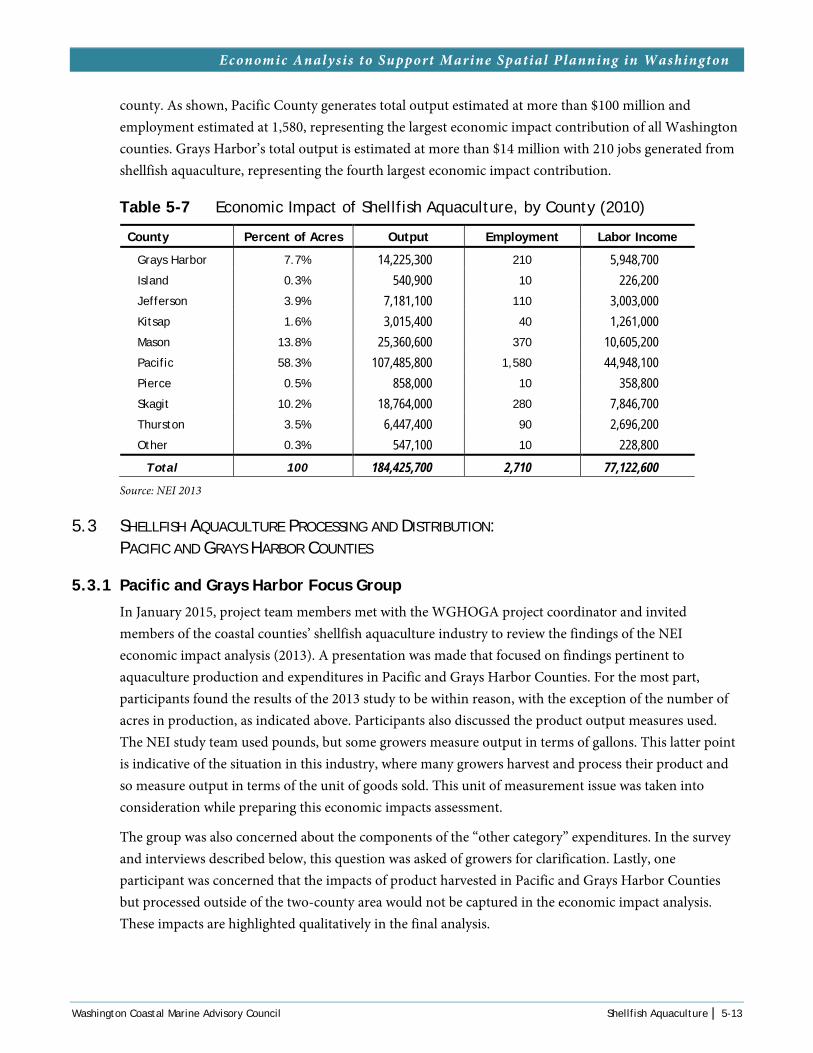
Economic Analysis to Support Marine Spatial Planning in Washington
county. As shown, Pacific County generates total output estimated at more than $100 million and employment estimated at 1,580, representing the largest economic impact contribution of all Washington counties. Grays Harbor’s total output is estimated at more than $14 million with 210 jobs generated from shellfish aquaculture, representing the fourth largest economic impact contribution.
Table 5-7 Economic Impact of Shellfish Aquaculture, by County (2010)
County Percent of Acres Output Employment Labor Income
Grays Harbor 7.7% 14,225,300 210 5,948,700
Island 0.3% 540,900 10 226,200
Jefferson 3.9% 7,181,100 110 3,003,000
Kitsap 1.6% 3,015,400 40 1,261,000
Mason 13.8% 25,360,600 370 10,605,200
Pacific 58.3% 107,485,800 1,580 44,948,100
Pierce 0.5% 858,000 10 358,800
Skagit 10.2% 18,764,000 280 7,846,700
Thurston 3.5% 6,447,400 90 2,696,200
Other 0.3% 547,100 10 228,800
Total 100 184,425,700 2,710 77,122,600
Source: NEI 2013
5.3 SHELLFISH AQUACULTURE PROCESSING AND DISTRIBUTION: PACIFIC AND GRAYS HARBOR COUNTIES
5.3.1 Pacific and Grays Harbor Focus Group
In January 2015, project team members met with the WGHOGA project coordinator and invited members of the coastal counties’ shellfish aquaculture industry to review the findings of the NEI economic impact analysis (2013). A presentation was made that focused on findings pertinent to aquaculture production and expenditures in Pacific and Grays Harbor Counties. For the most part, participants found the results of the 2013 study to be within reason, with the exception of the number of acres in production, as indicated above. Participants also discussed the product output measures used. The NEI study team used pounds, but some growers measure output in terms of gallons. This latter point is indicative of the situation in this industry, where many growers harvest and process their product and so measure output in terms of the unit of goods sold. This unit of measurement issue was taken into consideration while preparing this economic impacts assessment.
The group was also concerned about the components of the “other category” expenditures. In the survey and interviews described below, this question was asked of growers for clarification. Lastly, one participant was concerned that the impacts of product harvested in Pacific and Grays Harbor Counties but processed outside of the two-county area would not be captured in the economic impact analysis. These impacts are highlighted qualitatively in the final analysis.
Washington Coastal Marine Advisory Council Shellfish Aquaculture | 5-13
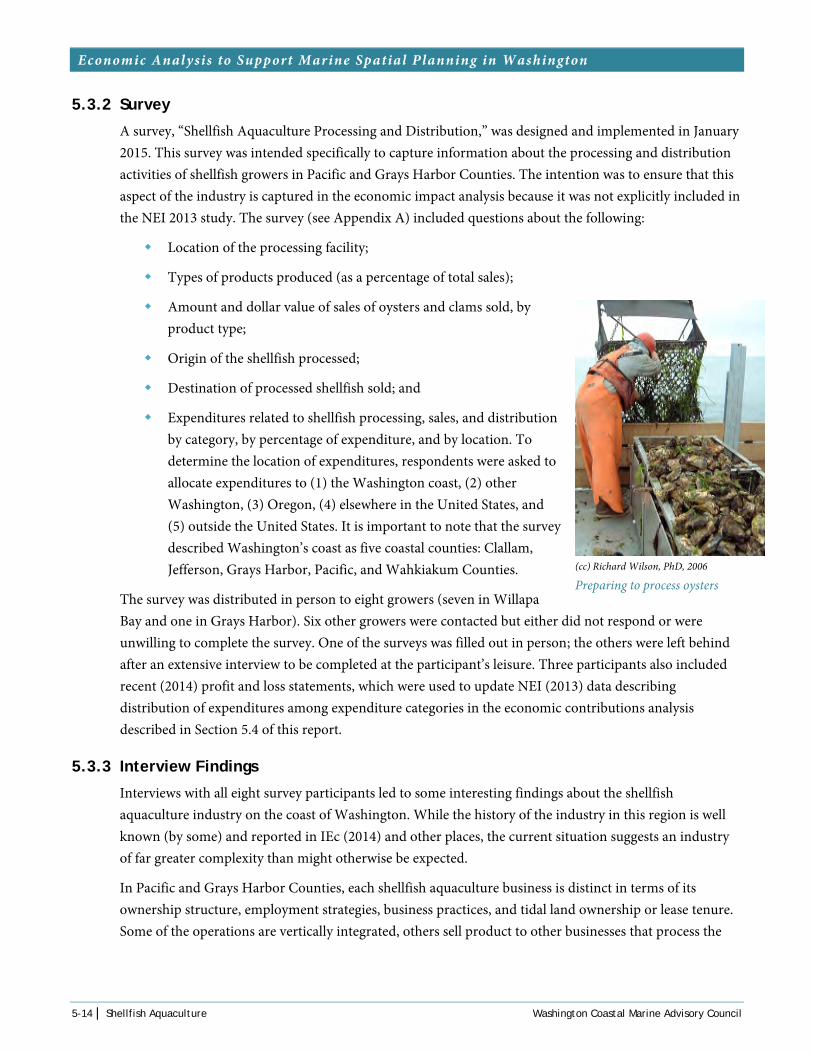
Economic Analysis to Support Marine Spatial Planning in Washington
5.3.2 Survey
A survey, “Shellfish Aquaculture Processing and Distribution,” was designed and implemented in January 2015. This survey was intended specifically to capture information about the processing and distribution activities of shellfish growers in Pacific and Grays Harbor Counties. The intention was to ensure that this aspect of the industry is captured in the economic impact analysis because it was not explicitly included in the NEI 2013 study. The survey (see Appendix A) included questions about the following:
Location of the processing facility;
Types of products produced (as a percentage of total sales);
Amount and dollar value of sales of oysters and clams sold, by product type;
Origin of the shellfish processed;
Destination of processed shellfish sold; and
Expenditures related to shellfish processing, sales, and distribution by category, by percentage of expenditure, and by location. To determine the location of expenditures, respondents were asked to allocate expenditures to (1) the Washington coast, (2) other Washington, (3) Oregon, (4) elsewhere in the United States, and (5) outside the United States. It is important to note that the survey described Washington’s coast as five coastal counties: Clallam, Jefferson, Grays Harbor, Pacific, and Wahkiakum Counties.
The survey was distributed in person to eight growers (seven in Willapa Bay and one in Grays Harbor). Six other growers were contacted but either did not respond or were unwilling to complete the survey. One of the surveys was filled out in person; the others were left behind after an extensive interview to be completed at the participant’s leisure. Three participants also included recent (2014) profit and loss statements, which were used to update NEI (2013) data describing distribution of expenditures among expenditure categories in the economic contributions analysis described in Section 5.4 of this report.
5.3.3 Interview Findings
Interviews with all eight survey participants led to some interesting findings about the shellfish aquaculture industry on the coast of Washington. While the history of the industry in this region is well known (by some) and reported in IEc (2014) and other places, the current situation suggests an industry of far greater complexity than might otherwise be expected.
In Pacific and Grays Harbor Counties, each shellfish aquaculture business is distinct in terms of its ownership structure, employment strategies, business practices, and tidal land ownership or lease tenure. Some of the operations are vertically integrated, others sell product to other businesses that process the
(cc) Richard Wilson, PhD, 2006
Preparing to process oysters
5-14 | Shellfish Aquaculture Washington Coastal Marine Advisory Council

Economic Analysis to Support Marine Spatial Planning in Washington
product. The percentage output between clam and oyster varies across all operations. There appears to be less competition between firms than would be expected because each business has its own niche.
Respondents expressed a great sense of pride for the work that is conducted in this sector while at the same time sharing a sentiment that the aquaculture industry in Washington coastal counties is viewed as a “step-cousin” to the often celebrated Puget Sound part of the industry, despite the fact that production and employment are highest in Pacific and Grays Harbor Counties (NEI 2013).
Most of the growers in these counties raise their product on bottom or use off-bottom techniques such as longlines, flip bags, and rack and bags. Between 85 and 90 percent of oyster culture in Willapa Bay and Grays Harbor uses bottom culture (IEc 2014). Most shellfish farmers rely on a mix of natural set and hatchery larvae production. Because of failures of the natural set beginning in 2005, most farmers have switched to the purchase of larvae from hatcheries to seed their beds. Three companies currently own their own hatcheries—two for their own use (Nisbet Oyster Company and Ekone of Bay Center) and the other for sale to other growers (Coast Seafoods Company of Bellevue, which operates a hatchery out of Quilcene). The Nesbit hatchery is located in Hilo, Hawaii, and Coast Seafoods’ second clam hatchery is in Kona, Hawaii. Many companies also purchase seed from Whiskey Creek Shellfish Hatchery of Netarts, Oregon, and Taylor Shellfish of Shelton, Washington, which has hatcheries and nursery facilities in California and Hawaii. Currently, the Washington coast aquaculture industry is enjoying strong demand for its product and, as described below, is working toward development of diverse product lines of goods.
In Pacific and Grays Harbor Counties, oyster processing generally takes one of two forms. Some oysters are sent to shucking houses, where the meat is removed from the shell and packaged in tubs and/or jars of various sizes. Shellfish may also be used for other value-added products, such as smoked oysters. Others are sold in the shell as “dozens” for cooking (e.g., on the grill) or to be consumed on the half shell (i.e., raw). Generally speaking, larger oysters are sent to Asia, medium and small oysters remain in the United States, and extra-small oysters are sent to local oyster bars. About half of respondents shuck most of their product. One respondent said that the shucked market with supermarkets has declined because of the desire for more processed food (from 80–90 percent of total sales to 15 percent). Clams are typically cleaned and bagged by the pound and sold to wholesalers or retail outlets. Three of the companies are vertically integrated in that they not only raise shellfish but process and distribute it, as well as provide a retail market. Those without distribution operations rely on a distributor to move their product. Ocean Beauty Group is used by some companies; others rely on purchasers who own their own trucks and pick up product for further distribution. Very little product (on a relative scale) is sold to local restaurants and stores. Finally, the number of processing employees (typically full time, year round) ranges from 4 to 200, depending on the size of the company. Those companies interviewed reported 380 direct processing and distribution jobs in Pacific and Grays Habor Counties.
“Every processor owns a farm; not every farm owns a processor.”
Washington Coastal Marine Advisory Council Shellfish Aquaculture | 5-15

Economic Analysis to Support Marine Spatial Planning in Washington
5.3.4 Survey Results
In 2015, there are 14 identified shellfish aquaculture companies that harvest and process shellfish products. Of these, eight companies filled out the NEI survey (a 57-percent response rate). All eight surveys were completed thoroughly with little followup needed. The data presented in this section reflect only the eight producers who completed the survey. The methodology to generate results for all 14 companies that process and deliver product is described below.
Production and Revenues
As indicated above, oysters and clams are the two most popular bivalve molluscs being produced in Pacific and Grays Harbor Counties. As summarized in Figure 5-9, results of the 2015 survey (providing 2014 data) indicate that oysters comprise the vast majority of processing, accounting for more than 97 percent of the total processing indicated by survey participants. Total processed production of Pacific oysters and clams reported by survey participants exceeded 30 million pounds.
Figure 5-9 Shellfish Aquaculture Processed Production (pounds) Note: Most respondents reported oyster production in bushels. One bushel is assumed to equal 8 gallons. One gallon of oyster meat is assumed to be equivalent to 8.25 pounds in meat weight.
0
5,000
10,000
15,000
20,000
25,000
30,000
35,000
Oysters Clams
Poun
ds (m
illion
)
5-16 | Shellfish Aquaculture Washington Coastal Marine Advisory Council
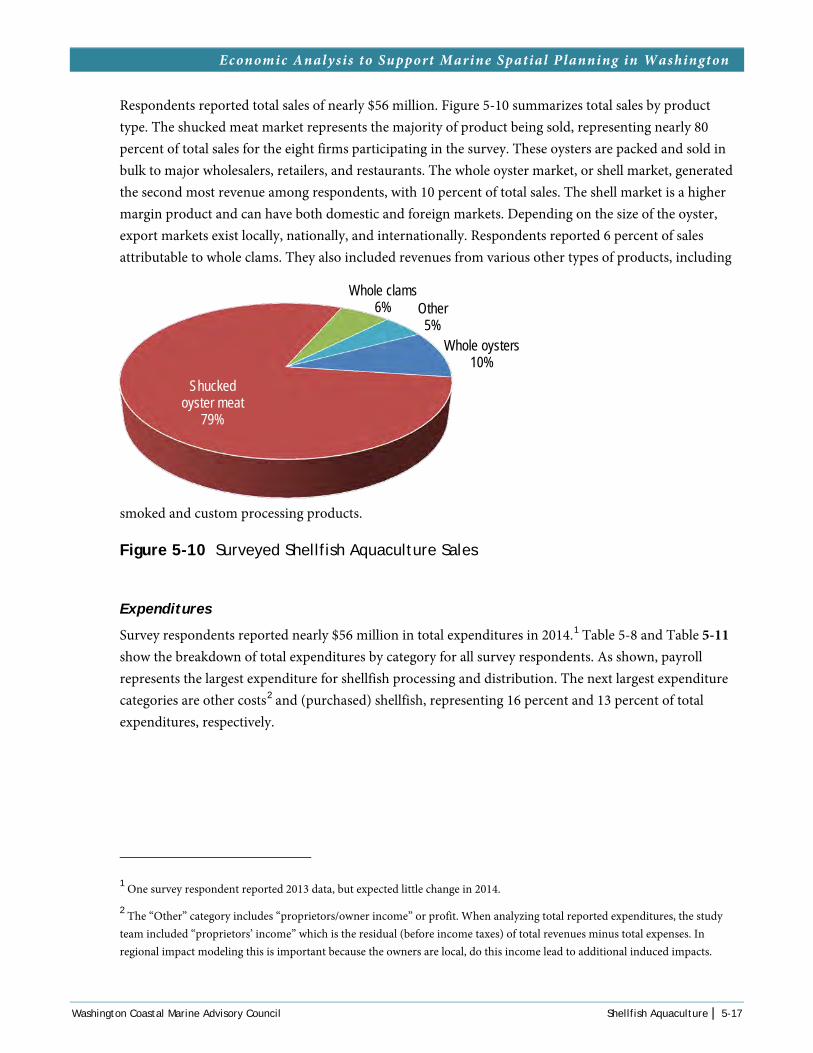
Economic Analysis to Support Marine Spatial Planning in Washington
Respondents reported total sales of nearly $56 million. Figure 5-10 summarizes total sales by product type. The shucked meat market represents the majority of product being sold, representing nearly 80 percent of total sales for the eight firms participating in the survey. These oysters are packed and sold in bulk to major wholesalers, retailers, and restaurants. The whole oyster market, or shell market, generated the second most revenue among respondents, with 10 percent of total sales. The shell market is a higher margin product and can have both domestic and foreign markets. Depending on the size of the oyster, export markets exist locally, nationally, and internationally. Respondents reported 6 percent of sales attributable to whole clams. They also included revenues from various other types of products, including
smoked and custom processing products.
Figure 5-10 Surveyed Shellfish Aquaculture Sales
Expenditures
Survey respondents reported nearly $56 million in total expenditures in 2014.1 Table 5-8 and Table 5-11 show the breakdown of total expenditures by category for all survey respondents. As shown, payroll represents the largest expenditure for shellfish processing and distribution. The next largest expenditure categories are other costs2 and (purchased) shellfish, representing 16 percent and 13 percent of total expenditures, respectively.
1 One survey respondent reported 2013 data, but expected little change in 2014.
2 The “Other” category includes “proprietors/owner income” or profit. When analyzing total reported expenditures, the study team included “proprietors’ income” which is the residual (before income taxes) of total revenues minus total expenses. In regional impact modeling this is important because the owners are local, do this income lead to additional induced impacts.
Whole oysters 10%
Shucked oyster meat
79%
Whole clams 6% Other
5%
Washington Coastal Marine Advisory Council Shellfish Aquaculture | 5-17

Economic Analysis to Support Marine Spatial Planning in Washington
Table 5-8 Total Expenditures by Category
Expenditure Category Total
Expenditures Percent of
Total
Payroll 19,021,157 34%
Other costs 8,822,815 16%
Shellfish 7,027,443 13%
Packaging 4,546,998 8%
Federal, State and Local 3,977,553 7%
Benefits 2,413,944 4%
Gas/Fuel 2,007,317 4%
Capital 1,894,751 3%
Utilities 1,790,649 3%
Interest 1,734,149 3%
Freight 1,686,901 3%
Insurance 987,554 2%
Total 55,911,230 100%
Figure 5-11 Shellfish Aquaculture Expenditures
Approximately 71 percent of expenditures made by the surveyed shellfish aquaculture firms engaged in processing and distribution in Pacific and Grays Harbor Counties are made locally in Washington’s coastal counties, as summarized in Figure 5-12. Combined with expenditures made in other areas of Washington, nearly 94 percent of expenditures by these firms are made in Washington State.
Payroll 34%
Benefits 4%
Government 7%
Capital 3%
Packaging 8%
Insurance 2%
Freight 3%
Gas/Fuel 4%
Utilities 3% Shellfish
13%
Interest 3%
Other costs 16%
5-18 | Shellfish Aquaculture Washington Coastal Marine Advisory Council
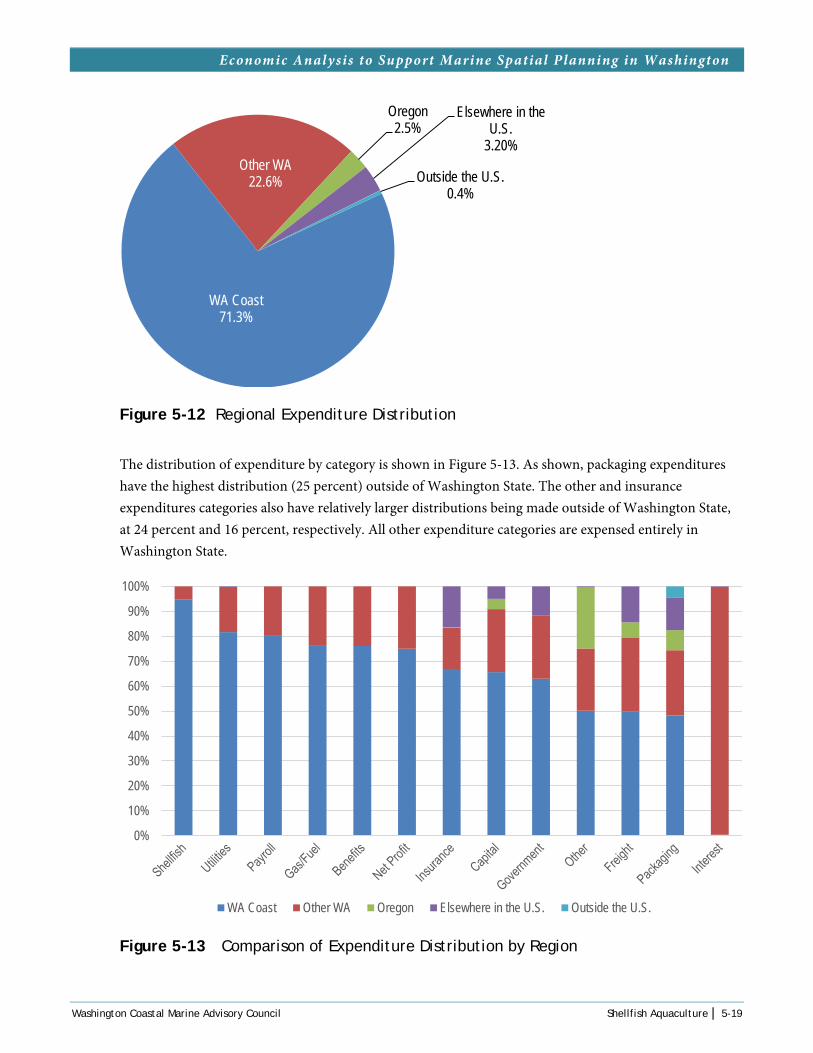
Economic Analysis to Support Marine Spatial Planning in Washington
Figure 5-12 Regional Expenditure Distribution
The distribution of expenditure by category is shown in Figure 5-13. As shown, packaging expenditures have the highest distribution (25 percent) outside of Washington State. The other and insurance expenditures categories also have relatively larger distributions being made outside of Washington State, at 24 percent and 16 percent, respectively. All other expenditure categories are expensed entirely in Washington State.
Figure 5-13 Comparison of Expenditure Distribution by Region
WA Coast 71.3%
Other WA 22.6%
Oregon 2.5%
Elsewhere in the U.S.
3.20%
Outside the U.S. 0.4%
0%
10%
20%
30%
40%
50%
60%
70%
80%
90%
100%
WA Coast Other WA Oregon Elsewhere in the U.S. Outside the U.S.
Washington Coastal Marine Advisory Council Shellfish Aquaculture | 5-19

Economic Analysis to Support Marine Spatial Planning in Washington
As reported earlier, 14 shellfish aquaculture companies that process and distribute shellfish products operated in 2015. To assess the economic impacts or contribution of all 14 firms, the study team estimated the expenditures for the missing 6 processors and distributors. To accomplish this, the weighted average of expenditures was calculated for a cohort of firms that participated in the survey and most closely resembled non-respondents. The representative expenditure estimate was then multiplied by the number of non-respondents (6) to derive total industry expenditures—$59.37 million. This estimate is used below in the analysis of economic contribution of the shellfish aquaculture industry, including harvesting, processing, and distribution.
5.4 ECONOMIC CONTRIBUTIONS OF SHELLFISH AQUACULTURE
This section describes the total economic contribution of the shellfish aquaculture industry (harvesting, processing, and distribution) in Pacific and Grays Harbor Counties to the Washington coast region and the state as a whole. The economic contributions of shellfish harvesting and processing serve as an indicator of the total number of jobs and total income in the coastal region that are generated from the shellfish aquaculture industry. For this analysis, commercial harvesting and processing of shellfish includes the effects of direct expenditures by the shellfish industry, along with all indirect effects (jobs and income generated by businesses supplying inputs to the shellfish industry) and induced effects (jobs and income generated when employees and owners of directly affected and indirectly affected businesses spend their disposable income). The combined direct, indirect, and induced effects represent the total economic contribution. The economic multiplier is the process whereby direct expenditures are translated into total effects. Further details about the methodological approach to this analysis can be found in Chapter 1 of this report. Results of the analysis of economic contribution of commercial shellfish harvesting and processing to the Washington coast region, and the state as a whole, are discussed below.
Total revenues (and expenditures) for shellfish growers in the two counties were estimated using 2013 WDFW aquaculture production data. This was considered the best data available for the purpose of the economic contribution analysis and, as such, is not directly comparable to the earlier analysis and results reported for Washington State by NEI (2013). Total revenues for shellfish growers in 2013 were estimated to be approximately $30 million, which includes the recorded values of oyster and clam sales plus the imputed value of 2.6 million pounds of reported but non-monetized oyster transactions. This total was combined with the estimated expenditures by shellfish processors to represent total direct expenditures by the shellfish aquaculture sector operating in Pacific and Grays Harbor Counties. Total estimated direct expenditures incurred in growing, processing, and distribution of shellfish were used to estimate the total economic contribution of the shellfish aquaculture industry in Washington’s Pacific Coast region (Pacific and Grays Harbor Counties) and Washington State as a whole. Table 5-9 below summarizes estimated direct regional expenditures by the different components of the sector.
5-20 | Shellfish Aquaculture Washington Coastal Marine Advisory Council

Economic Analysis to Support Marine Spatial Planning in Washington
Table 5-9 Estimated Direct Regional Expenditures by the Aquaculture Industry in the Pacific Coast Region and State of Washington
Direct Expenditures Pacific Coast Region WA State
Growers' direct regional expenditures 30,006,630 30,006,630
Processors' direct regional expenditures* 35,167,207 48,032,943
Combined direct regional expenditures 65,173,837 78,039,573
*To avoid double-counting, processors’ direct expenditures do not include shellfish purchases because these are already accounted for in the aquaculture growers’ production values.
IMPLAN data for 2012 representing all economic sectors within Washington’s Pacific Coast and Washington State were applied to generate coast-level and state-level estimates of employment and labor income shown in Table 5-10 and Table 5-11, respectively. As shown, the aquaculture sector in Pacific and Grays Harbor Counties is estimated to directly provide 572 jobs in shellfish growing and processing. An additional 275 jobs are generated in the coastal region through indirect and induced activity. The employment multiplier is 1.48 (i.e., one additional job is created for every approximately two jobs directly employed by the aquaculture sector). Similarly the labor income multiplier for the coastal region is 1.36. Total direct labor income in the coastal region from the aquaculture industry is estimated to be more than $36.7 million, with an additional $13.3 million generated through indirect and induced activity. The total estimated employment and labor income contributed by shellfish aquaculture and processing to the Washington coast regional economy were 847 jobs and $50 million, respectively.
Table 5-10 Estimated Economic Contribution of the Shellfish Aquaculture Sector to the Washington Coast Region
Total Effects Components Employment Labor Income ($ million)
Direct 572 36.7
Indirect 159 8.1
Induced 116 5.2
Total Effects 847 50.0
Multiplier (Total effect/Direct effect) 1.48 1.36
Table 5-11 shows the estimated statewide economic contribution of the aquaculture industry. As shown, both the employment and labor income effects are larger than shown for the Washington coast in Table 5-10. This is expected, as the statewide impacts include additional direct and indirect expenditures made to businesses outside the coastal counties. The additional economic contributions to the state are represented by the difference between corresponding values in Table 5-10 and Table 5-11. The tables indicate that an additional 383 total jobs and $23.2 million in total labor income were generated in Washington state outside the coastal region by the aquaculture sector’s activities. Again, it is important to note that caution should be taken when comparing the results in this section with those previously reported by NEI (2013) due to differences in scope and methodology.
Washington Coastal Marine Advisory Council Shellfish Aquaculture | 5-21

Economic Analysis to Support Marine Spatial Planning in Washington
Table 5-11 Estimated Economic Contribution of the Shellfish Aquaculture Sector to Washington State
Total Effects Components Employment Labor Income ($ million)
Direct 655 43.3
Indirect 265 14.5
Induced 311 15.4
Total Effects 1,230 73.2
Multiplier (Total effect / Direct effect) 1.88 1.69
5.5 OTHER CONTRIBUTIONS FROM THE AQUACULTURE INDUSTRY
While implicitly included in the analysis of the economic contributions the shellfish aquaculture sector makes to the coastal region and the State of Washington, some benefits that the shellfish aquaculture industry contributes to the state must be pointed out explicitly because they are sometimes unrecognized. While most aquaculture businesses in Pacific and Grays Harbor Counties own their lands, as indicated in the introduction to this chapter, others lease lands from DNR, providing revenues to the state. In addition, most growers in the coastal region personally finance burrowing shrimp management and control. Without their support, much of the industry would not exist, greatly affecting the production of a commodity in much demand by local consumers.
In addition to the regional and state economies, the shellfish aquaculture sector makes significant contributions to social, cultural, and environmental systems as well. For example, shellfish are viewed as integral components of the coastal ecosystem, so much so that some ecologists view oyster beds as outstanding communities of the estuary. Research suggests that shellfish provide several environmental benefits or ecosystem services, including water quality improvement through nitrogen removal. Filter-feeding shellfish not only remove nitrogen from the water column, they also incorporate a high proportion of it into their tissues. When shellfish are harvested, the nitrogen is removed from the system (NEI 2012). Using the replacement cost methodology, Burke (2009) estimated water quality benefits from shellfish harvest by multiplying the per-pound wastewater treatment facility life cycle costs by the estimate of the amount (in pounds) of nitrogen removed by shellfish harvesting, estimated at 25,787 pounds of nitrogen per year removed in Oakland Bay (Steinberg and Hampden 2009). Burke (2009) estimated water quality benefits to be in the range of $25,300−$815,400 annually. In general, because they are filter feeders, shellfish can greatly influence nutrient cycling in estuarine systems and maintain the stability of the ecosystem.
Shellfish beds also function as natural breakwaters that protect the shoreline against the erosive force of wind- and boat-generated waves, thereby reducing bank erosion, protecting fringing salt marsh, and decreasing loss of aquatic vegetation beds such as eelgrass. The literature also describes the functional role that shellfish play in estuaries (NEI 2012). Some species of bivalve shellfish, such as oysters and mussels, form complex structures that provide refuge or hard substrate for other species of marine plants and animals to colonize, thereby enhancing biodiversity. Shellfish are ecosystem engineers, creating
5-22 | Shellfish Aquaculture Washington Coastal Marine Advisory Council

Economic Analysis to Support Marine Spatial Planning in Washington
conditions that allow many other plant and animal species in estuaries and coastal bays to thrive. Perhaps most important from an ecosystem service perspective, certain types of shellfish offer the unique service of creating important habitats for other commercially or recreationally important species.
Shellfish production can also indirectly bring local environmental problems to the attention of nearby communities. U.S. public health standards under which shellfish fisheries and aquaculture operate demand clean waters, and commercial shellfish harvest can only take place in waters that have been certified under the National Shellfish Sanitation Program. The standards of this program fostered the first estuarine/marine monitoring programs and are the most stringent of all U.S. water quality classifications, far exceeding those required for swimming. As a result, the presence of shellfish fisheries and aquaculture often results in increased monitoring of environmental conditions in estuaries and coastal waters. Moreover, the economic hardships suffered by communities following closure of shellfish fisheries and culture operations due to water contamination have often provided the political impetus for improvement in sewage treatment plants or programs to fix local septic systems.
Finally, participation in the shellfish aquaculture sector serves as a valuable source of training, experience, and income for those looking to operate in commercial fisheries. The husbandry skills and business experience necessary to operate successfully in the modern shellfish aquaculture industry can be learned efficiently while working in local businesses.
REFERENCES Deisenroth, R., C. Bond, and J. B. Loomis. 2012. The Economic Contribution of the Private, Recreation-
based Aquaculture Industry in the Western United States. Aquaculture Economics and Management 16(1):1-21.
Burke, S. 2009. Estimating Water Quality Benefits from Shellfish Harvesting: A Case Study in Oakland Bay, Washington. Memorandum prepared for The Pacific Shellfish Institute.
Ecology. See Washington Department of Ecology.
Hudson, B., and K. Wellman. 2012. Economic Impact of West Coast Shellfish Aquaculture. Presentation at the National Shellfish Association 104th annual meeting, March 24-29, 2012, in Seattle, Washington.
IEc. See Industrial Economics, Inc.
Industrial Economics, Inc. 2014. Marine Sector Analysis Report: Aquaculture. Prepared for the Washington Coastal Marine Advisory Council, October 31, 2014.
Kaliba, A. R. and C. R. Engle. 2008. The Economic Impacts of the Catfish, Ictalurus punctatus, Industry on Chicot County, Arkansas. Journal of Applied Aquaculture Vol.15.
Washington Coastal Marine Advisory Council Shellfish Aquaculture | 5-23

Economic Analysis to Support Marine Spatial Planning in Washington
Kaliba, A. R., C. R. Engle, S. Pormerleau, J. M. Hinshaw, and D. Sloan. 2004. The Economic Impact of Salmon, Oncorhynchus mykiss, Industry on Transylvania County, North Carolina. Journal of Applied Aquaculture 15:1-2.
NEI. See Northern Economics, Inc.
Northern Economics, Inc. 2012. Valuation of Ecosystem Services from Shellfish Enhancement: A Review of the Literature. Prepared for NOAA National Ocean Services, EPA REServe Program.
Northern Economics, Inc. 2013. Economic Impact of Shellfish Aquaculture in Washington, Oregon, and California. Prepared for the Pacific Shellfish Insitute.
Steinberg, P. and J. Hampden. 2009. Nitrogen Removal with Shellfish Harvest in Oakland Bay and Puget Sound. Memorandum prepared for The Pacific Shellfish Institute.
TCW Economics. 2008. Washington Commercial Fisheries Economic Value in 2006. Washington Department of Fish and Wildlife. December 11, 2008. p. 28.
USDA. See U.S. Department of Agriculture.
U.S. Department of Agriculture. 2014. Census of Agriculture (2012) Volume I, Chapter 2, County Level Data, Washington, Table 22.
Washington Department of Ecology. 2014. Fact Sheet for Willapa Grays Harbor Oyster Growers Association NPDES Permit WA0039781. Available from: www.ecy.wa.gov/programs/ wq/pesticides/imidacloprid/WillapaGraysHarbor-OysterGrowers-Factsheet.pdf. Downloaded June 12, 2015.
Washington Department of Fish and Wildlife. 2014. Licensing and Permits Website. Commercial Licensing. Available at: wdfw.wa.gov/licensing/commercial/misc_additional_permits.html.
PERSONAL COMMUNICATIONS
Beugli, David. Project Coordinator, Willapa Grays Harbor Oyster Growers Association. Personal Communication with Katharine Wellman on March 4, 2015, regarding grower information.
Hall, Eric. Taylor Shellfish. Personal communication with Katherine Wellman on January 16, 2015, regarding NEI 2013 analysis.
Sheldon, Brian. 2015. Northern Oyster Company. Personal communication with Katherine Wellman on January 16, 2015, regarding NEI 2013 analysis.
Wilson, Richard. 2015. Bay Center Farms. Personal communication with Katherine Wellman on January 16, 2015, regarding NEI 2013 analysis.
5-24 | Shellfish Aquaculture Washington Coastal Marine Advisory Council

Economic Analysis to Support Marine Spatial Planning in Washington
IMAGES
Chapter 5 Header Image: (cc) Richard Wilson, PhD, 2009. Bringing the tubs on board. Retrieved May 6, 2015, from: www.flickr.com/photos/76798465@N00/4160937840
Page 5-13: Richard Wilson, PhD, 2006. Dredging the oysters from the bottom at high tide and filling baskets from where they will be processed. Retrieved May 6, 2015, from: www.flickr.com/photos/76798465@N00/346897549
Washington Coastal Marine Advisory Council Shellfish Aquaculture | 5-25

Economic Analysis to Support Marine Spatial Planning in Washington
This page intentionally left blank
5-26 | Shellfish Aquaculture Washington Coastal Marine Advisory Council
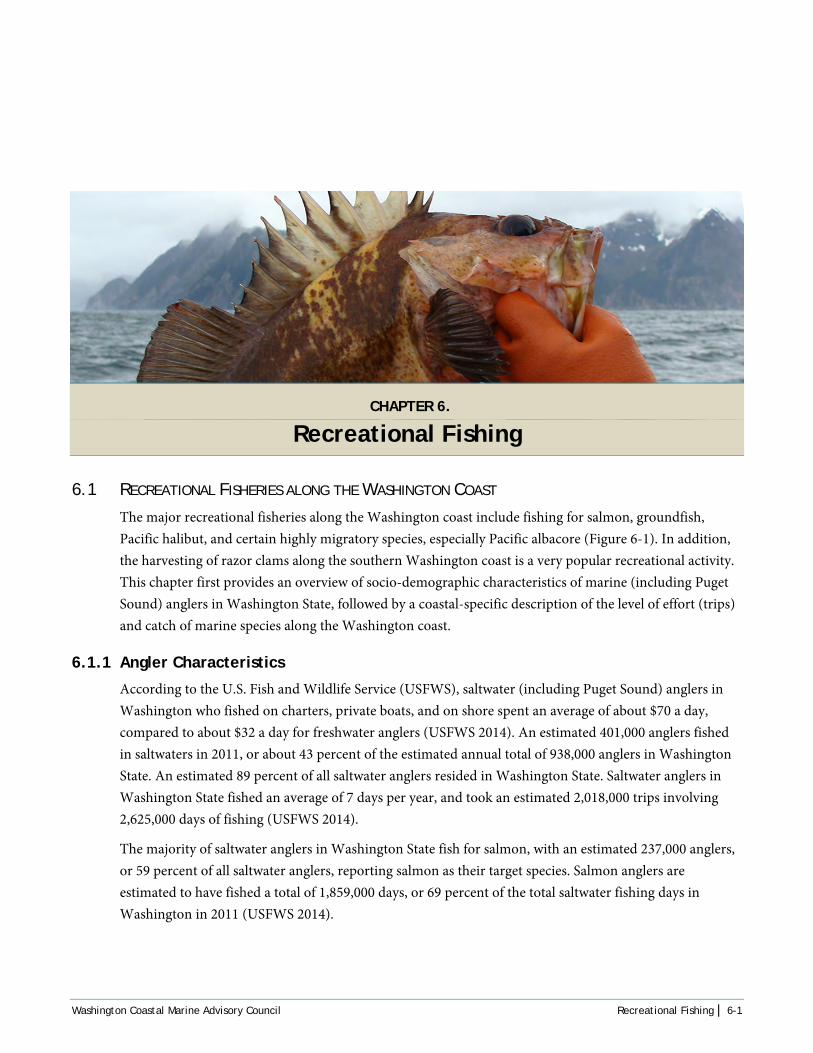
CHAPTER 6. Recreational Fishing
6.1 RECREATIONAL FISHERIES ALONG THE WASHINGTON COAST
The major recreational fisheries along the Washington coast include fishing for salmon, groundfish, Pacific halibut, and certain highly migratory species, especially Pacific albacore (Figure 6-1). In addition, the harvesting of razor clams along the southern Washington coast is a very popular recreational activity. This chapter first provides an overview of socio-demographic characteristics of marine (including Puget Sound) anglers in Washington State, followed by a coastal-specific description of the level of effort (trips) and catch of marine species along the Washington coast.
6.1.1 Angler Characteristics
According to the U.S. Fish and Wildlife Service (USFWS), saltwater (including Puget Sound) anglers in Washington who fished on charters, private boats, and on shore spent an average of about $70 a day, compared to about $32 a day for freshwater anglers (USFWS 2014). An estimated 401,000 anglers fished in saltwaters in 2011, or about 43 percent of the estimated annual total of 938,000 anglers in Washington State. An estimated 89 percent of all saltwater anglers resided in Washington State. Saltwater anglers in Washington State fished an average of 7 days per year, and took an estimated 2,018,000 trips involving 2,625,000 days of fishing (USFWS 2014).
The majority of saltwater anglers in Washington State fish for salmon, with an estimated 237,000 anglers, or 59 percent of all saltwater anglers, reporting salmon as their target species. Salmon anglers are estimated to have fished a total of 1,859,000 days, or 69 percent of the total saltwater fishing days in Washington in 2011 (USFWS 2014).
Washington Coastal Marine Advisory Council Recreational Fishing | 6-1

Economic Analysis to Support Marine Spatial Planning in Washington
Figure 6-1 Major Recreational Fisheries in Marine Waters along the Washington Coast
6-2 | Recreational Fishing Washington Coastal Marine Advisory Council

Economic Analysis to Support Marine Spatial Planning in Washington
A National Oceanic and Atmospheric Administration (NOAA) survey of Washington and Oregon saltwater anglers completed in 2013 indicated that saltwater anglers are mostly male, about 70 percent are between the ages of 40 and 69, 65 percent have completed at least some college, and 40 percent have an annual household income of $40,000-$80,000 per year. In 2011, about 58 percent of Washington saltwater anglers worked full time and an estimated 7 percent worked part time (U.S. Department of Commerce 2014).
Charter Boat Anglers
The two main ports for charter boat operations are Westport and Ilwaco along the southern Washington coast. A key informant survey of charter boat operators in Washington reported that 100 percent of the crew, owners, and guides/skippers resided along the Washington coast (E. Waters, pers. comm., 2015).
Among clients of charter boat operators in the Westport area, 85 to 95 percent are estimated to be from Washington State. Albacore brought in the highest percentage of anglers outside of the Pacific Northwest (14 percent). Anglers out of Westport took 31,882 charter boat trips in 2013, with 51 percent of trips targeting salmon, 38 percent targeting bottomfish, 7 percent targeting halibut and 4 percent targeting other species (Table 6-1). Charter operations in Ilwaco, farther south on the Washington coast, attracted more anglers from Oregon, with 45 percent of anglers estimated to be coming from that state, primarily
from the Portland area (E. Waters, pers. comm., 2015). The remainder of Ilwaco anglers came from inland Washington counties (45 percent), elsewhere on the Washington coast (5 percent), and elsewhere in the United States (5 percent). Between 2004 and 2013, charter boat anglers out of Ilwaco took on average an estimated 10,171 trips annually, with 82 percent targeting salmon, 7 percent targeting bottomfish, 6 percent targeting albacore, and 4 percent targeting halibut (Table 6-2).
The number of charter boat trips by targeted species taken out of Neah Bay, La Push, Chinook, and North Bay Jetty along the Columbia River between 2004 and 2013 are shown in Tables 6-3 through 6-6, respectively. Table 6-7 shows the distribution by port area of coast-wide charter boat trips taken between 2004 and 2013.
(cc) Erin Kohlenberg, 2011
Dawn charter leaving Ilwaco
Washington Coastal Marine Advisory Council Recreational Fishing | 6-3

Economic Analysis to Support Marine Spatial Planning in Washington
Table 6-1 Sport Fishing Effort by Trip Type and Mode, 2004-2013: Westport Port Area
Trip Type by Mode 2004 2005 2006 2007 2008 2009 2010 2011 2012 2013 Average
Charter Boat
Albacore 937 817 1,205 1,026 919 1,013 1,337 926 1,057 1,432 1,067
Bottomfish 10,987 12,480 15,390 13,931 13,462 10,882 9,788 11,836 13,474 12,290 12,452
Halibut 3,854 3,061 2,318 2,241 1,947 2,110 1,941 2,049 2,017 2,174 2,371
Salmon 22,447 20,403 15,491 15,779 9,900 18,632 18,550 14,220 16,443 15,986 16785
Other1 66 67 0 0 64 0 0 0 0 0 20
Charter Boat Total 38,291 36,828 34,404 32,977 26,292 32,637 31,616 29,031 32,991 31,882 32,695
Private Boat
Albacore 57 163 199 456 635 550 1,118 856 3,071 4,350 1,146
Bottomfish 1,548 1,577 1,662 1,509 1,176 1,637 1,483 1,928 1,874 2,195 1,659
Halibut 138 182 160 44 461 535 298 507 610 690 363
Salmon 17,583 15,091 10,310 10,957 8,918 19,942 20,927 20,038 23,378 21,287 16,843
Other1 26 0 11 2 65 0 0 0 0 0 10
Private Boat Total 19,359 17,013 12,342 12,968 11,255 22,664 23,826 23,329 28,933 28,522 20,020
Total Trips2 57,650 53,841 46,746 45,945 37,547 55,301 55,442 52,360 61,924 60,404 52,711 1 Includes trips targeting both salmon and halibut, and dive trips. 2 Values may not sum to 100 percent of the values due to rounding.
Source: Washington Department of Fish and Wildlife 2014 (file = 2004-13 WA Recreational Effort.xlsx).
6-4 | Recreational Fishing Washington Coastal Marine Advisory Council

Economic Analysis to Support Marine Spatial Planning in Washington
Table 6-2 Sport Fishing Effort by Trip Type and Mode, 2004-2013: Ilwaco Port Area
Trip Type by Mode 2004 2005 2006 2007 2008 2009 2010 2011 2012 2013 Average
Charter Boat
Albacore 264 185 556 637 516 568 696 681 965 914 598
Bottomfish 620 629 841 517 688 341 655 1,197 1,050 1,064 760
Halibut 566 374 432 459 458 375 303 397 384 372 412
Salmon 11,770 9,498 8,395 10,765 4,495 10,129 7,043 7,229 7,321 7,200 8,385
Other1 5 27 30 33 9 0 25 0 27 0 15
Charter Boat Total 13,225 10,713 10,254 12,411 6,166 11,413 8,722 9,504 9,747 9,550 10,171
Private Boat
Albacore 159 213 469 932 1,045 998 1,322 1,105 3,304 2,332 1,188
Bottomfish 398 547 405 669 676 583 672 815 955 1,044 676
Halibut 65 148 214 173 350 158 255 129 210 190 189
Salmon 41,297 27,063 17,493 22,247 10,706 37,405 24,316 19,271 20,673 20,103 24,057
Other1 6 108 14 37 49 165 112 78 77 51 70
Private Boat Total 41,925 28,079 18,595 24,058 12,826 39,309 26,677 21,398 25,219 23,720 26,181
Total Trips2 55,150 38,792 28,849 36,469 18,992 50,722 35,399 30,902 34,966 33,270 36,351 1 Includes trips targeting both salmon and halibut or both salmon and sturgeon. 2 Values may not sum to 100 percent of the values due to rounding.
Source: Washington Department of Fish and Wildlife 2014 (file = 2004-13 WA Recreational Effort.xlsx).
Washington Coastal Marine Advisory Council Recreational Fishing | 6-5
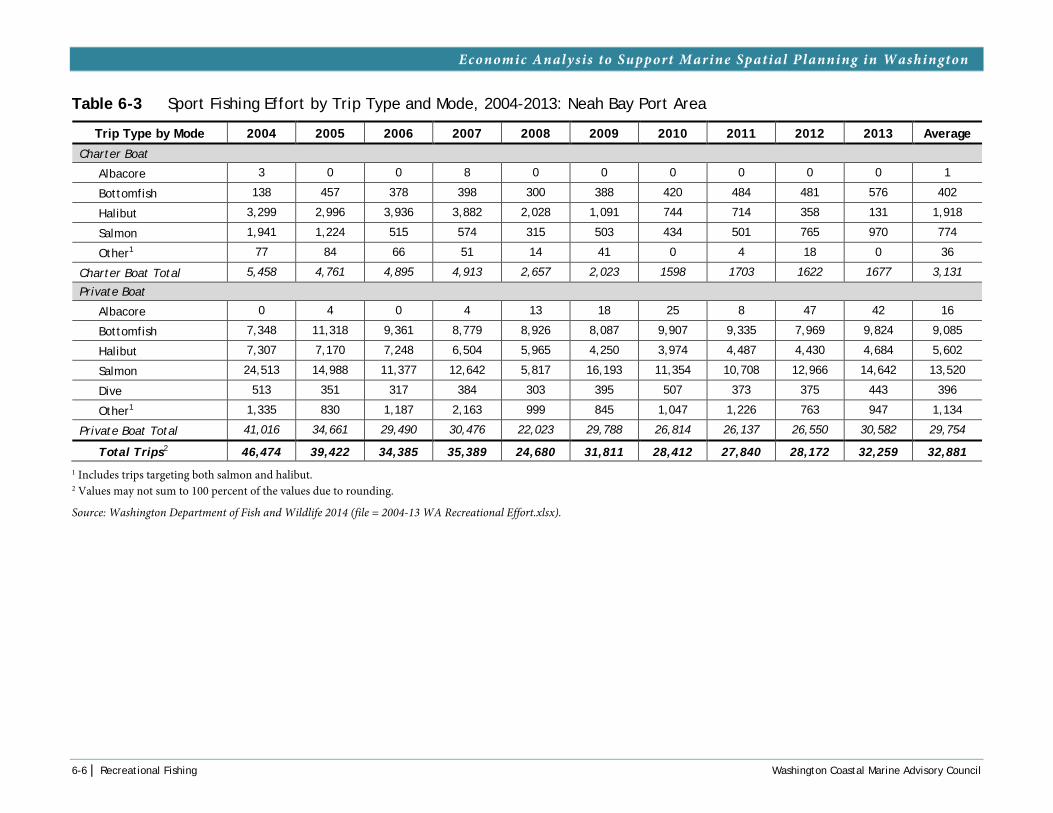
Economic Analysis to Support Marine Spatial Planning in Washington
Table 6-3 Sport Fishing Effort by Trip Type and Mode, 2004-2013: Neah Bay Port Area
Trip Type by Mode 2004 2005 2006 2007 2008 2009 2010 2011 2012 2013 Average
Charter Boat
Albacore 3 0 0 8 0 0 0 0 0 0 1
Bottomfish 138 457 378 398 300 388 420 484 481 576 402
Halibut 3,299 2,996 3,936 3,882 2,028 1,091 744 714 358 131 1,918
Salmon 1,941 1,224 515 574 315 503 434 501 765 970 774
Other1 77 84 66 51 14 41 0 4 18 0 36
Charter Boat Total 5,458 4,761 4,895 4,913 2,657 2,023 1598 1703 1622 1677 3,131
Private Boat
Albacore 0 4 0 4 13 18 25 8 47 42 16
Bottomfish 7,348 11,318 9,361 8,779 8,926 8,087 9,907 9,335 7,969 9,824 9,085
Halibut 7,307 7,170 7,248 6,504 5,965 4,250 3,974 4,487 4,430 4,684 5,602
Salmon 24,513 14,988 11,377 12,642 5,817 16,193 11,354 10,708 12,966 14,642 13,520
Dive 513 351 317 384 303 395 507 373 375 443 396
Other1 1,335 830 1,187 2,163 999 845 1,047 1,226 763 947 1,134
Private Boat Total 41,016 34,661 29,490 30,476 22,023 29,788 26,814 26,137 26,550 30,582 29,754
Total Trips2 46,474 39,422 34,385 35,389 24,680 31,811 28,412 27,840 28,172 32,259 32,881 1 Includes trips targeting both salmon and halibut. 2 Values may not sum to 100 percent of the values due to rounding.
Source: Washington Department of Fish and Wildlife 2014 (file = 2004-13 WA Recreational Effort.xlsx).
6-6 | Recreational Fishing Washington Coastal Marine Advisory Council

Economic Analysis to Support Marine Spatial Planning in Washington
Table 6-4 Sport Fishing Effort by Trip Type and Mode, 2004-2013: La Push Port Area
Trip Type by Mode 2004 2005 2006 2007 2008 2009 2010 2011 2012 2013 Average
Charter Boat
Albacore 13 36 44 55 63 48 92 4 16 38 41
Bottomfish 49 191 57 217 622 337 408 253 240 239 261
Halibut 347 274 269 271 359 355 296 266 181 128 275
Salmon 620 563 534 383 208 683 630 666 664 691 564
Other1 0 0 0 20 11 0 0 0 0 0 3
Charter Boat Total 1,029 1,064 904 946 1,263 1,423 1,426 1,189 1,101 1,096 1,144
Private Boat
Albacore 39 64 102 301 152 176 260 116 414 261 189
Bottomfish 799 1,384 1,181 1,001 980 1,037 1,766 2,728 3,453 3,057 1,739
Halibut 861 1,115 1,634 1,494 1,253 1,671 1,804 2,077 2,421 2,164 1,649
Salmon 3,941 4,356 3,609 2,724 1,757 4,394 3,178 3,571 3,262 3,564 3,436
Other1 2 0 0 141 94 21 28 84 5 12 39
Private Boat Total 5,642 6,919 6,526 5,661 4,236 7,279 7,036 8,576 9,555 9,058 7,051
Total Trips2 6,671 7,983 7,430 6,607 5,499 8,722 8,462 9,765 10,656 10,154 8,192 1 Includes trips targeting both salmon and halibut, both salmon and sturgeon, and jig fishing trips. 2 Values may not sum to 100 percent of the values due to rounding.
Source: Washington Department of Fish and Wildlife 2014 (file = 2004-13 WA Recreational Effort.xlsx).
Washington Coastal Marine Advisory Council Recreational Fishing | 6-7

Economic Analysis to Support Marine Spatial Planning in Washington
Table 6-5 Sport Fishing Effort by Trip Type and Mode, 2004-2013: Chinook Port Area
Trip Type by Mode 2004 2005 2006 2007 2008 2009 2010 2011 2012 2013 Average
Charter Boat
Albacore 0 0 0 0 0 0 0 0 0 0 0
Bottomfish 11 5 0 0 0 0 0 0 0 0 2
Halibut 0 0 0 0 0 0 0 0 0 0 0
Salmon 305 69 44 0 47 0 0 0 0 0 47
Other1 0 0 0 0 0 0 0 0 0 0 0
Charter Boat Total 316 74 44 0 47 0 0 0 0 0 48
Private Boat
Albacore 29 33 71 174 85 84 64 48 174 71 83
Bottomfish 61 83 70 122 45 46 109 160 184 68 95
Halibut 5 57 111 41 82 24 19 22 42 10 41
Salmon 21,088 15,855 10,241 11,862 7,719 22,655 16,415 13,274 15,344 17,165 15,162
Other1 0 90 21 38 6 93 41 12 26 16 34
Private Boat Total 21,183 16,118 10,514 12,237 7,937 22,902 16,648 13,516 15,770 17,330 15,416
Total Trips2 21,499 16,192 10,558 12,237 7,984 22,902 16,648 13,516 15,770 17,330 15,461
1 Includes trips targeting both salmon and halibut or both salmon and sturgeon. 2 Values may not sum to 100 percent of the values due to rounding.
Source: Washington Department of Fish and Wildlife 2014 (file = 2004-13 WA Recreational Effort.xlsx).
Table 6-6 Sport Fishing Effort by Trip Type and Mode, 2004-2013: North Bay Jetty (Columbia River)
Trip Type by Mode 2004 2005 2006 2007 2008 2009 2010 2011 2012 2013 Average
Jetty
Bottomfish 308 NA 862 NA 488 277 473 917 588 441 398
Salmon 3,166 NA 1,650 NA 421 2,634 128 2,207 2,662 3,026 1,385
Total Trips 3,474 NA 2,512 NA 909 2,911 601 3,124 3,250 3,467 1,783
NA = not available.
Source: Washington Department of Fish and Wildlife 2014 (file = 2004-13 WA Recreational Effort.xlsx).
6-8 | Recreational Fishing Washington Coastal Marine Advisory Council

Economic Analysis to Support Marine Spatial Planning in Washington
Table 6-7 Sport Fishing Effort by Trip Type and Mode, 2004-2013: All Coastal Washington Port Areas (including Neah Bay)
Trip Type by Mode 2004 2005 2006 2007 2008 2009 2010 2011 2012 2013 Average
Charter Boat
Albacore 1,217 1,038 1,805 1,726 1,498 1,629 2,125 1,611 2,038 2,384 1,707
Bottomfish 11,805 13,762 16,666 15,063 15,072 11,948 11,271 13,770 15,245 14,169 13,877
Halibut 8,066 6,705 6,955 6,853 4,792 3,931 3,284 3,426 2,940 2,805 4,976
Salmon 37,083 31,757 24,979 27,501 14,965 29,947 26,657 22,616 25,193 24,847 26,555
Other1 148 178 96 104 98 41 25 4 45 0 74
Charter Boat Total 58,319 53,440 50,501 51,247 36,425 47,496 43,362 41,427 45,461 44,205 47,188
Private Boat
Albacore 284 477 841 1,867 1,930 1,826 2,789 2,133 7,010 7,056 2,621
Bottomfish 10,154 14,909 12,679 12,080 11,803 11,390 13,937 14,966 14,435 16,188 13,254
Halibut 8,376 8,672 9,367 8,256 8,111 6,638 6,350 7,222 7,713 7,738 7,844
Salmon 108,422 77,353 53,030 60,432 34,917 100,589 76,190 66,862 75,623 76,761 73,018
Dive 513 351 328 384 303 395 507 373 377 443 397
Other2 1,369 1,031 1,222 2,381 1,226 1,103 1,228 1,400 868 1,026 1,285
Private Boat Total 129,118 102,793 77,467 85,400 58,290 121,941 101,001 92,956 106,026 109,212 98,420
Jetty
Bottomfish 308 NA 862 NA 488 277 473 917 588 441 398
Salmon 3,166 NA 1,650 NA 421 2,634 128 2,207 2,662 3,026 1,385
Jetty Total 3,474 NA 2,512 NA 909 2,911 601 3,124 3,250 3,467 1,783
Total Trips3 190,911 156,233 130,480 136,647 95,624 172,348 144,964 137,507 154,737 156,884 147,389
NA = not applicable. 1 Includes trips targeting both salmon and halibut or salmon and sturgeon, and dive and jig fishing trips. 2 Includes trips targeting both salmon and halibut or salmon and sturgeon, and jig fishing trips. 3 Values may not sum to 100 percent of the values due to rounding.
Source: Washington Department of Fish and Wildlife 2014 (file = 2004-13 WA Recreational Effort.xlsx).
Washington Coastal Marine Advisory Council Recreational Fishing | 6-9

Economic Analysis to Support Marine Spatial Planning in Washington
Private Boat Anglers
The marinas and port areas where anglers fishing from private boats launch are identified in Table 6-8. As shown, about 30 percent of private boat anglers (on average over the 2004-2013 period) launched from the Makah Marina in Neah Bay, 27 percent from the Port of Ilwaco, and 20 percent from Westport Marina in Grays Harbor. All of these ports cater to anglers working out of transient boats to rent slips during the fishing season. The smaller ports of La Push and Chinook have a limited number of slips for private boats. No data are currently available that identify the county of residence of private boat anglers in ocean waters of the Washington coast.
Table 6-8 Average Number of Ocean Private Boat Sportfishing Trips, 2004-2013
Port Marina No. of Private Boat Trips % of Private Boat Trips
Neah Bay Makah Marina 29,754 30%
La Push Quileute Harbor Marina 7,051 7%
Grays Harbor Westport Marina 20,020 20%
Ilwaco Port of llwaco 26,180 27%
Chinook Port of Chinook 15,416 16%
Source: Data from Tables 6-1 through 6-6 as provided by Washington Department of Fish and Wildlife (WDFW).
The 200-slip Makah Marina in Neah Bay caters mostly to private boats; as indicated above, this marina accounted for (on average) 30 percent of ocean sportfishing trips from private boats between 2004 and 2013. The Makah Tribal Council operates the marina at Neah Bay, which is open to recreational use from April through September. Temporary moorage is available, as well as long-term and short-term parking to serve private boat anglers (Makah Tribe 2015).
The Westport Marina, a 550-slip marina located in the Port of Grays Harbor, is currently home to about 94 annually moored recreational vessels, and 188 commercial fishing vessels. Daily, weekly, and monthly moorage is available as well as boat trailer parking and a boat launch for private boats (Port of Grays Harbor Moorage 2015).
The Port of Ilwaco is an 800-slip marina for both commercial and recreational boaters that has moorage for daily, monthly, and annual slips, as well as a 12-hour tour boat fee option (Port of Ilwaco 2015). Boat trailer parking is available for private boats, with a fee charged only for boats docked or stored for longer than 24 hours. In 2013, 23,720 private trips were launched from Ilwaco, with 84 percent of anglers fishing for salmon and about 10 percent of anglers fishing for albacore (Table 6-2).
The Port of Chinook has 300 slips with 10 reserved for transients with no reservations. In the 2004 to 2013 period, 98 percent of private boat anglers fished for salmon. Over the 2004-13 period, 99 percent of trips out of the Port of Chinook was conducted by anglers in private boats, with all charters ceasing operations in 2009 (Table 6-5).
6-10 | Recreational Fishing Washington Coastal Marine Advisory Council

Economic Analysis to Support Marine Spatial Planning in Washington
Shore/Jetty Anglers
The Columbia River Jetty, near Ilwaco, is the primary fishing spot for jetty anglers. In 2013, 3,467 trips were made by anglers here, the highest total since 2004. An estimated 87 percent of the fish caught by anglers were salmon, with rockfish making up the remainder (Table 6-6).
6.1.2 Fishing Levels of Effort (by Port Area and Species)
Overall, sport fishing trips out of all Washington ports increased by a total of 8,205 trips, or 6 percent, when comparing the 5-year averages of 2009-2013 and 2004-2008 (Table 6-7). Charter trips decreased by 3,366, or 8 percent, over the same period. Most of this decline occurred in trips for halibut, with 2,187 (60 percent) fewer trips in the most recent 5-year period. Salmon trips also declined by 801 trips (3 percent), as did trips for bottomfish, which were down by 711 trips (5 percent). Some of the decline in charter trips was offset by an increase of about 400 additional albacore trips, or 21 percent in the most recent 5-year period. Private boat trips increased by 10,496, an 11-percent increase over the same period. The species with the largest increase in trips was salmon, with 6,876 more trips (10 percent), followed by albacore, (2,687 trips, 66 percent) and bottom fish (1,847 trips, 13 percent).
La Push
Over the 2009-2013 period, salmon charter trips in the La Push area increased by 31 percent over the previous 5-year average (Table 6-4). Over the same period, growth in bottomfish fishing surpassed halibut, with a 24-percent decline in halibut and a 24-percent increase in bottomfish. Sportfishing effort for albacore was highly variable, with trips ranging from 92 in 2010 to 4 in 2011, a 96-percent decline in 1 year. Overall, charter trips increased by 17 percent between 2009 and 2013, aided by good years in 2009 and 2010 when charter trips were up 24 percent over the 10-year average.
Private boat trips increased 30 percent in the most recent 5-year period. Most of this sportfishing increase was for bottomfish, albacore, and halibut, which increased by 56 percent, 46 percent, and 37 percent, respectively, over the previous 5-year average. Total annual trips from the La Push area increased by 28 percent on average over 2009-2013 as compared to the previous 5 years.
Westport
Charter trips from the Westport area declined by about 3 percent when comparing the 5-year averages from 2009-2013 and 2004-2008 (Table 6-1). Trips targeting halibut and bottomfish declined by 11 percent and 9 percent, respectively, over the same period, but albacore trips slightly offset these declines with a 13-percent increase. The relative catch of most species fished by charter boat operators had little annual variability, with the exception of 2008, in which salmon trips accounted for about half of all charter trips.
© Lorrie Jo Williams, 2012
Sportfishing boat
Washington Coastal Marine Advisory Council Recreational Fishing | 6-11

Economic Analysis to Support Marine Spatial Planning in Washington
Total private boat trips from the Westport port area during the 2009-2013 period increased by about 36 percent when compared to the 2004-2008 period. The largest increase in sportfishing effort was for albacore, which had an 80-percent increase in the most recent 5-year average (2009-2013). In 2012, the number of albacore trips had increased by 98 percent compared to 2004. Private-boat salmon trips have more than recovered from a decline that started in 2006, with 34 percent more trips in 2009-2013. Private boat trips in the Westport area between 2009 and 2013 increased by 14 percent compared to annual averages during the 2004-2008 period.
Charter trips from the Westport area declined by about 3 percent when comparing the 5-year averages of 2009-2013 and 2004-2008. Halibut and bottomfish trips declined (11 percent and 9 percent, respectively) over the same comparison periods, whereas albacore trips slightly offset these declines with a 13-percent increase during the 2009-2013 period. The relative catch of most species fished for from charter boats had little annual variability, with the exception of 2008, in which almost half of the charter boat trips were for salmon.
Chinook
All charter boat trips from the Chinook port area ceased in 2009, while private boat angler trips increased notably (Table 6-5). Private boat trips were up 10 percent when comparing the 5-year averages of 2009-2013 and 2004-2008. Most of the additional trips were for salmon, with an average of about 1,500 more trips in the most recent 5-year period.
Ilwaco
From the Ilwaco area, total annual trip averages were down 3 percent in the 5-year period from 2009-2013 compared to the previous 5-year period average (Table 6-2). Charter boat trips were down 7 percent when comparing the two 5-year periods. Most of this decline was attributable to a reduction in salmon trips, with 1,167 fewer trips (a reduction of 16 percent) per year on average than in the most recent 5-year period. Increases in albacore and bottomfish charter trips out of Ilwaco somewhat offset this decrease, with 257 and 311 more trips, respectively, on average, or a 34-percent increase for each species.
Over the most recent 5-year period, private boat trips out of Ilwaco were down slightly, with a 1 percent decline in the average number of total trips (Table 6-2). Similar to charter trips in Ilwaco, private-boat salmon trips were down the most, with 1,514 fewer trips on average, or 7 percent. Private boat trips targeting albacore and bottomfish increased, with albacore increasing by 1,027 trips per year, or 58 percent.
6-12 | Recreational Fishing Washington Coastal Marine Advisory Council

Economic Analysis to Support Marine Spatial Planning in Washington
6.1.3 Sport Catch
This section highlights trends in the sport catch of marine species caught along the Washington coast over the 5-year period from the 2007/08 through 2011/12 fishing seasons (Table 6-9), and profiles the 2011/12 season by catch area (Table 6-10). As shown in Table 6-9, the salmon catch during the 2008/09 season was particularly weak, with a total catch that was only one third of the 5-year average catch. The catch peaked in 2009/10 at twice the average, only to fall 65 percent in the following year. During the 2008/09 catch year, when far fewer salmon trips were made, about one salmon was caught per trip along the coast. Neah Bay had the worst catch rate, with an average catch rate of about one half salmon per trip. In 2009/10, salmon catch rates in the Neah Bay region increased dramatically, with more than four salmon caught per trip. Historically, steelhead also has had annual catch variability, with the catch rate during the 2008/09 season declining to half the average, and then in 2011/12 almost doubling the 5-year average. Catch rates for all other species were relatively stable during the 2007/08 through 2011/12 5-year period.
The catch rates for razor clams, which are harvested along the southern portion of the Washington coast, have remained near the 5-year average except during the 2009/10 season, when the catch increased by about 700,000 clams, and during the 2011/12 season, when about 700,000 fewer clams were harvested as compared to the 5-year average (Table 6-9). Digger trips appeared to be the main difference between both of the years, with almost 800,000 more trips in 2009/10.
Table 6-9 Annual and Average Annual Sport Catch in Marine Waters along the Washington Coast, 2007/08 through 2011/12 Sportfishing Seasons
Species Group 2007/08 2008/09 2009/10 2010/11 2011/12 Average Annual
Salmon1 100,512 37,272 221,205 77,157 89,240 105,077
Steelhead2 7,268 4,451 10,603 11,271 19,124 10,543
Sturgeon3 330 475 473 349 262 378
Pacific Halibut 8,055 7,460 7,301 7,209 8,039 7,613
Bottomfish4 273,967 230,263 287,872 303,629 293,831 277,912
Razor Clams 3,030,840 3,216,167 3,805,228 3,158,886 2,436,288 3,129,482
Notes: Numbers represent the number of fish caught (finfish) or clams dug (razor clams). 1 Salmon totals include all species, including coho and Chinook. 2 Steelhead total includes winter and summer steelhead. 3 Sturgeon total include only fish caught in coastal streams. 4 Bottomfish include all rockfish species and other bottomfish.
Source: WDFW 2014.
Washington Coastal Marine Advisory Council Recreational Fishing | 6-13

Economic Analysis to Support Marine Spatial Planning in Washington
Table 6-10 Profile of Sport Catch along the Washington Coast during the 2011/12 Sport Fishing Season, by Catch Area
Species Group
Marine Catch Area
Area 1: Ilwaco
Area 2: Westport
Area 3: La Push
Area 4a: Neah Bay
Area 4b: Neah Strait
Total Marine Waters
Total Coastal Streams
Salmon1 26,948 43,710 5,558 13,024 89,240 5,996
Steelhead2 316 68 49 15 448 18,676
Sturgeon3 N/A 262
Pacific Halibut 3,025 5,014 8,039 N/A
Bottomfish4 29,336 154,636 42,035 46,628 21,196 293,831 N/A
Razor Clams 1,060,066 1,373,230 2,952 N/A 2,436,248 N/A
Notes: Numbers represent the number of fish caught or clams dug. 1 Salmon totals include all species, including coho and Chinook. 2 Sturgeon totals include only fish caught in coastal streams. 3 Bottomfish include all rockfish species and other bottomfish. 4 Steelhead totals include winter and summer steelhead
Source: WDFW 2014.
Ocean Salmon
During the 2011/12 fishing season, about half of the salmon catch in marine waters off the Washington coast occurred in Marine Catch Area 2 (Westport area), about 25 percent in Marine Catch Area 1 (Ilwaco area), and about 12 percent in Marine Catch Area 4a (Neah Bay area) (Table 6-10). Marine Catch Area 3 (La Push area) and coastal streams both recorded about 6,000 salmon being caught during the 2011/12 season. Coho were caught mostly in marine waters along the southern coast, with only about 5,000 (11 percent) caught north of Grays Harbor. Based on WDFW (2014) data, about half of all Chinook salmon were caught out of Westport; about three quarters of all pink salmon were landed in Neah Bay; and jack salmon were caught only in Marine Catch Area 2 (Westport area), with 472 caught. Ocean salmon catch rates per trip in 2011 were about double the statewide freshwater salmon catch rates (USFWS 2014).
Steelhead
Over the 5-year period of 2007/08 through 2011/12, about 2 percent of steelhead were caught in the ocean (Table 6-9). On average, the Quillayute River accounts for about 32 percent of the steelhead caught in coastal freshwaters, followed by the Chehalis River for about 39 percent, and the Queets River for about 11 percent, with the remainder of the steelhead catch occurring in other smaller river systems (WDFW 2014).
6-14 | Recreational Fishing Washington Coastal Marine Advisory Council

Economic Analysis to Support Marine Spatial Planning in Washington
Bottomfish
Most bottomfish caught during the 2011/12 season were black rockfish caught near Westport in Area 2, comprising about a third of all bottomfish caught (Table 6-10). Area 2 also had the most yellowtail rockfish and lingcod, comprising about 8 percent each of the total bottomfish catch on the Washington coast. Neah Bay had the largest variety of rockfish caught, with significantly more rare rockfish, including China rockfish, Quillback rockfish, and Copper rockfish. The catch of Pacific halibut is divided only into north and south coast; the 2011/12 catch on the north coast accounted for about 24 percent more than along the south coast (Table 6-10).
Razor Clams
Razor clam digging rates were similar throughout the southern Washington coast catch areas, with about 12 clams dug per trip in the fall and almost 14 in the spring (WDFW 2014). During the 2011/12 season, total harvest of razor clams was split between Catch Areas 1 and 2 (Table 6-10). Area 4, comprising only Kalaloch Beach in the La Push area, accounted for the remaining harvest.
6.2 FISHING REGULATIONS AND MANAGEMENT
This section describes regulations and management affecting the three most important recreational finfish fisheries along the Washington coast: Pacific halibut, bottomfish, and salmon.
6.2.1 Halibut Recreational Fisheries
Washington’s halibut fisheries are managed under the Pacific Fishery Management Council’s (PFMC’s) Pacific Halibut Catch Sharing Plan for Area 2A (PFMC 2015). The catch sharing plan specifies how the Area 2A total allowable catch, as defined by the International Pacific Halibut Commission, is allocated or “shared” among various state commercial and recreational fishing interests. For Washington, WDFW manages its recreational fisheries by subarea. These subareas are:
North Coast (waters in the Strait of Juan de Fuca west of the Sekiu River and Pacific Ocean waters south to the Queets River)
South Coast (Pacific Ocean waters south of the Queets River to Leadbetter Point)
Columbia River (Pacific Ocean waters south of Leadbetter Point to Cape Falcon, Oregon)
Management of Washington’s recreational halibut seasons for 2014 is described in Table 6-11.
(cc) NOAA Corps, 2006
China rockfish
Washington Coastal Marine Advisory Council Recreational Fishing | 6-15

Economic Analysis to Support Marine Spatial Planning in Washington
Table 6-11 Recreational Halibut Season in 2014, by Management Subarea
Subarea Quota (lbs) Catch (lbs) Avg Wt (lbs) Season Dates
North Coast 108,030 112,002 18.47 May 15, 17, 22, 24
South Coast 42,739 45,903 18.62 Primary: May 4, 6, 11, 13, 18
Columbia River* 11,895 7,630 14.13 Early: May 1 – Aug 3 Thu-Sun; Late: Aug 7 – Sept 28 Fri-Sun
* Columbia River harvest is Washington catch only. Area includes Ilwaco, WA.
Source: WDFW 2015a
Halibut are measured at the dock and the lengths of the samples are then converted to weights. On the coast, lengths are taken throughout the season on a weekly basis and applied to the number of halibut caught to project the total catch in pounds. The catches are then monitored and the fisheries are closed when they are projected to attain their respective subarea quotas (WDFW 2015a). If the quota is not reached by the end of the seasons, a few days of additional halibut sport fishing may be allowed in select portions of the North and South Coast subareas.
The 2015 Catch Plan established total weight limits for the entire season by subarea, as well as daily possession and bag limits. These quotas are set for each Washington port. All Washington ports have a daily bag and possession limit of one halibut per day per sport fisherman. There are no minimum size restrictions (WDFW 2015b).
6.2.2 Bottomfish Recreational Fisheries
Bottomfish recreational fisheries off the Washington coast are managed by WDFW with management coordinated with the PFMC. Table 6-12 summarizes restrictions and seasons during 2014 for key bottomfish species, including rockfish, lingcod, and various sharks (WDFW 2015c).
PFMC’s fishery management plan (FMP) for groundfish, which includes bottomfish species managed by WDFW, consists of several strategies, including measures to reduce bycatch and bycatch mortality, defining authorized fishing gear, establishing trip and bag limits and fishing seasons/areas, and limiting fishing through permits/licenses (PFMC 2014a). For recreational groundfish fishing, the only types of gear authorized are hook-and-line and spear. Routine management measures have been established that limit the number and size of hooks depending on the species.
(cc) Patrick Denker, 2008
Pacific halibut
6-16 | Recreational Fishing Washington Coastal Marine Advisory Council

Economic Analysis to Support Marine Spatial Planning in Washington
Table 6-12 Fishing Seasons and Restrictions for Key Bottomfish Species in 2014, by Management Area
Subarea Daily Limit Release Rules Minimum Size Season Dates
Area 1: Ilwaco 12 - rockfish 10, cod 2
Various sharks may not be retained
Lingcod, 22 inches; all other fish, no minimum size
Year round; lingcod March to October
Area 2: Westport 12 - rockfish 10, cod 2
Lingcod, 22 inches with retention restricted in certain depths; all other fish, no minimum size
Lingcod, 22 inches; all other fish, no minimum size
Year round, with seasonal lingcod depth restrictions
Area 3: La Push 12 - rockfish 10, cod 2
Various sharks may not be retained; rockfish and cod have depth restrictions
Lingcod, 22 inches; all other fish, no minimum size
Year round; lingcod March to October
Area 4: Neah Bay 12 western area, 10 eastern area, cod 2
Various sharks may not be retained; rockfish and cod have depth restrictions
Lingcod, 22 inches; cabezon, 18 inches
Year round; lingcod April to October
Source: WDFW 2015c
6.2.3 Salmon Recreational Fisheries
Similar to bottomfish management, salmon recreational fisheries off the Washington coast are managed by WDFW with management coordinated with PFMC, and the tribes. This management arrangement is referred to as a unique government-to-government relationship (PFMC 2014b). Management of salmon focuses on Chinook and coho salmon; pink, sockeye, chum, and steelhead are rarely caught in ocean fisheries off the Washington coast. Because certain coho and Chinook salmon are either federally listed or state-listed species under the Endangered Species Act (ESA), FMPs have
been developed to manage certain salmon fisheries. Chinook and coho environmentally significant units (ESUs) for Washington’s Pacific coast, however, are not ESA-listed, although certain ESUs in the Strait of Juan de Fuca, Hood Canal, and the Puget Sound region are (K. Krueger, pers. comm., 2015). Because salmon migrate to distant waters when in the ocean, managing the ocean salmon fisheries is complex and challenging.
On the Washington coast, most Chinook salmon that are caught are of hatchery origin, largely from hatcheries in nearby coastal streams as well as in the Columbia River and Puget Sound. Hatchery production escapement goals are established for most salmon stocks based on long-range production programs and/or mitigation requirements associated with displaced natural stocks (PFMC 2014).
Some of the tools used to manage salmon along the Washington coast during the 2014 season, including daily catch limits, release rules, minimum sizes, and season dates, are described by subarea in Table 6-13.
Photo courtesy USFWS
Chinook salmon
Washington Coastal Marine Advisory Council Recreational Fishing | 6-17

Economic Analysis to Support Marine Spatial Planning in Washington
Table 6-13 Marine Recreational Fishing Regulations for Salmon, by Management Area
Subarea* Daily Limit Release Rules Minimum Size** Season Dates
Area 1: Ilwaco
Early: Chinook: 2 Coho: 0, Late: 1.
Early: all wild Chinook, all coho. Late: all wild coho
Early: 24” Chinook, Late: 15” coho
Early: May 31 through June13, Late: June 14-September 30th (if quota available)
Area 2: Westport
Early: Chinook: 2 Coho: 0, Late: coho 1.
Early: all wild Chinook, all coho. Late: all wild coho
Early: 24” Chinook Late: 16” coho
Early: May 31 through June 13, Late: June 11-September 30 (if quota available)
Area 2-1: Willapa Bay
Early: Area 2 rules apply Late: limit 6, 3 adults.
Early: all wild Chinook, all coho. Late: all wild coho
Early: 16-24” Late: 12”
Early: May 31 through July 31, Late: August 1-Jan 31 30th
Area 2-2: Grays Harbor
Early: Area 2 limits Late: limit 2,3, or 6*
Same as Area 2, except all salmon required to be released must not be removed from the water on boats under 30’
Early: 16-24” Late: 12”
Early: May 31 through August 10, Late: August 16
Area 3: La Push
2, for both seasons Early: all wild Chinook, all coho. Late: all wild coho
Early: Chinook 24” Late: Chinook 24”, coho 16”
Early: May 16,17,23,24, May 31-June 13. Late: June 14- September 21
Area 4: Neah Bay
2, for both seasons Early: all wild Chinook, all coho. Late: all wild coho and chum on August 1
Early: Chinook 24” Late: Chinook 24”, coho 16”
Early: May 16,17,23,24, May 31-June 13. Late: June 14- September 21
* Areas may have locations with different limits and size restrictions. **No size restrictions unless otherwise noted.
Source: WDFW 2015c
6.3 ECONOMIC CONTRIBUTIONS OF RECREATIONAL FISHING
This section describes estimates of trip-related expenditures made by Washington State residents and out-of-state visitors associated with marine sportfishing activities in the coastal area of Washington. Although spending on equipment and durable goods (e.g., boats, trailers, off-highway vehicles) also contributes to the local and state-wide economy, the extent of equipment purchases and their relationship to coastal sportfishing activities cannot be determined with reasonable accuracy; therefore, these expenditures are not considered in the analysis.
6.3.1 Trip-related Expenditures Associated with Marine Angler Activities in the Washington Coastal Study Area
Total trip-related expenditures made by Washington State residents associated with sportfishing activities in the coastal study area are estimated at about $32.1 million in 2014 (Tables 6-14 through 6-16). Of this total, about $2.7 million was estimated to be made in the coastal study area and about $29.4 million was made elsewhere in the state.
Trip-related expenditures associated sportfishing activities in the coastal study area made by out-of-state visitors are estimated at about $5.7 million in 2014 (Tables 6-14 through 6-16). In addition to the spending within the coastal study area by out-of-state visitors, these visitors also spent an estimated $3.1 million related to sportfishing activities elsewhere in Washington.
6-18 | Recreational Fishing Washington Coastal Marine Advisory Council
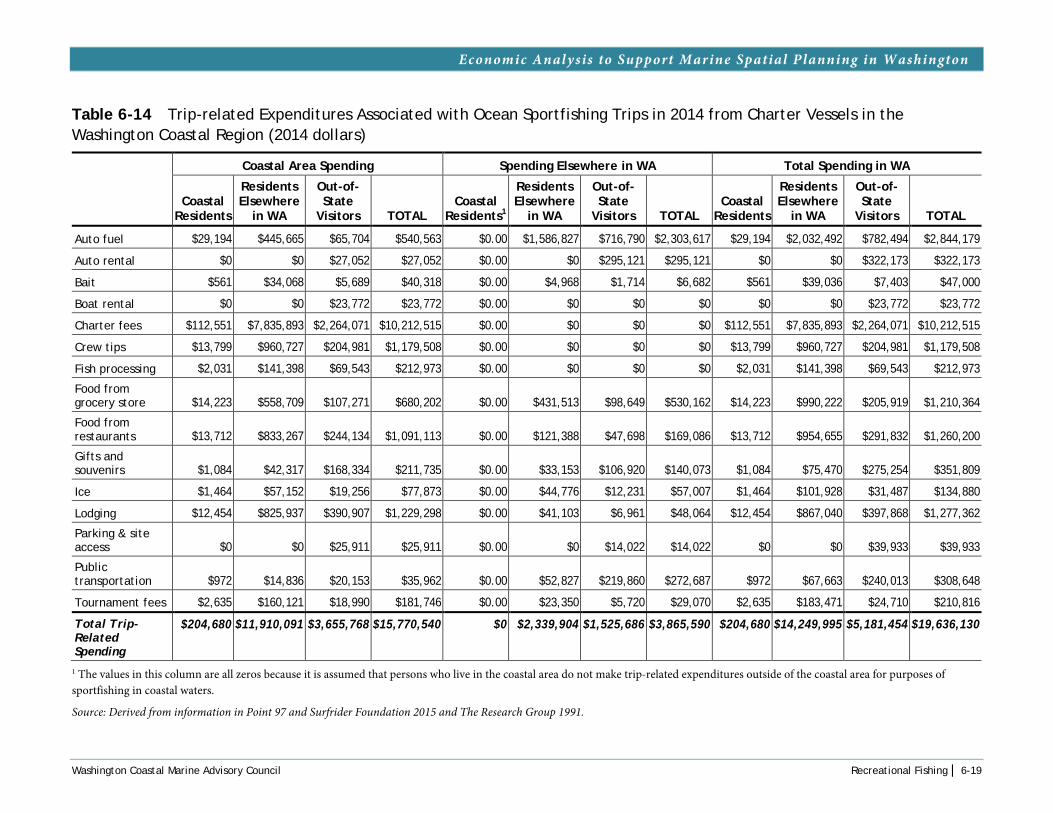
Economic Analysis to Support Marine Spatial Planning in Washington
Table 6-14 Trip-related Expenditures Associated with Ocean Sportfishing Trips in 2014 from Charter Vessels in the Washington Coastal Region (2014 dollars)
Coastal Area Spending Spending Elsewhere in WA Total Spending in WA
Coastal Residents
Residents Elsewhere
in WA
Out-of-State
Visitors TOTAL Coastal
Residents1
Residents Elsewhere
in WA
Out-of-State
Visitors TOTAL Coastal
Residents
Residents Elsewhere
in WA
Out-of-State
Visitors TOTAL
Auto fuel $29,194 $445,665 $65,704 $540,563 $0.00 $1,586,827 $716,790 $2,303,617 $29,194 $2,032,492 $782,494 $2,844,179
Auto rental $0 $0 $27,052 $27,052 $0.00 $0 $295,121 $295,121 $0 $0 $322,173 $322,173
Bait $561 $34,068 $5,689 $40,318 $0.00 $4,968 $1,714 $6,682 $561 $39,036 $7,403 $47,000
Boat rental $0 $0 $23,772 $23,772 $0.00 $0 $0 $0 $0 $0 $23,772 $23,772
Charter fees $112,551 $7,835,893 $2,264,071 $10,212,515 $0.00 $0 $0 $0 $112,551 $7,835,893 $2,264,071 $10,212,515
Crew tips $13,799 $960,727 $204,981 $1,179,508 $0.00 $0 $0 $0 $13,799 $960,727 $204,981 $1,179,508
Fish processing $2,031 $141,398 $69,543 $212,973 $0.00 $0 $0 $0 $2,031 $141,398 $69,543 $212,973
Food from grocery store $14,223 $558,709 $107,271 $680,202 $0.00 $431,513 $98,649 $530,162 $14,223 $990,222 $205,919 $1,210,364
Food from restaurants $13,712 $833,267 $244,134 $1,091,113 $0.00 $121,388 $47,698 $169,086 $13,712 $954,655 $291,832 $1,260,200
Gifts and souvenirs $1,084 $42,317 $168,334 $211,735 $0.00 $33,153 $106,920 $140,073 $1,084 $75,470 $275,254 $351,809
Ice $1,464 $57,152 $19,256 $77,873 $0.00 $44,776 $12,231 $57,007 $1,464 $101,928 $31,487 $134,880
Lodging $12,454 $825,937 $390,907 $1,229,298 $0.00 $41,103 $6,961 $48,064 $12,454 $867,040 $397,868 $1,277,362
Parking & site access $0 $0 $25,911 $25,911 $0.00 $0 $14,022 $14,022 $0 $0 $39,933 $39,933
Public transportation $972 $14,836 $20,153 $35,962 $0.00 $52,827 $219,860 $272,687 $972 $67,663 $240,013 $308,648
Tournament fees $2,635 $160,121 $18,990 $181,746 $0.00 $23,350 $5,720 $29,070 $2,635 $183,471 $24,710 $210,816
Total Trip-Related Spending
$204,680 $11,910,091 $3,655,768 $15,770,540 $0 $2,339,904 $1,525,686 $3,865,590 $204,680 $14,249,995 $5,181,454 $19,636,130
1 The values in this column are all zeros because it is assumed that persons who live in the coastal area do not make trip-related expenditures outside of the coastal area for purposes of sportfishing in coastal waters.
Source: Derived from information in Point 97 and Surfrider Foundation 2015 and The Research Group 1991.
Washington Coastal Marine Advisory Council Recreational Fishing | 6-19

Economic Analysis to Support Marine Spatial Planning in Washington
Table 6-15 Trip-related Expenditures Associated with Ocean Sportfishing Trips in 2014 from Private Vessels in the Washington Coastal Region (2014 dollars)
Coastal Area Spending Spending Elsewhere in WA Total Spending in WA
Coastal Residents
Residents Elsewhere
in WA
Out-of-State
Visitors TOTAL Coastal
Residents1
Residents Elsewhere
in WA
Out-of-State
Visitors TOTAL Coastal
Residents
Residents Elsewhere
in WA
Out-of-State
Visitors TOTAL
Auto fuel $577,739 $791,263 $62,629 $1,431,631 $0.00 $2,817,360 $683,238 $3,500,598 $577,739 $3,608,623 $745,867 $4,932,229
Auto rental $352 $482 $8,760 $9,595 $0.00 $1,718 $95,567 $97,285 $352 $2,200 $104,328 $106,880
Bait $116,605 $635,635 $87,898 $840,137 $0.00 $92,691 $26,478 $119,169 $116,605 $728,326 $114,375 $959,306
Boat rental $846,529 $4,965,484 $655,438 $6,467,451 $0.00 $322,029 $0 $322,029 $846,529 $5,287,513 $655,438 $6,789,480
Charter fees $0 $0 $0 $0 $0.00 $0 $0 $0 $0 $0 $0 $0
Crew tips $0 $0 $0 $0 $0.00 $0 $0 $0 $0 $0 $0 $0
Fish processing $0 $0 $0 $0 $0.00 $0 $0 $0 $0 $0 $0 $0
Food from grocery store $385,218 $1,357,593 $205,964 $1,948,774 $0.00 $1,048,523 $189,409 $1,237,932 $385,218 $2,406,116 $395,373 $3,186,707
Food from restaurants $119,423 $651,081 $313,520 $1,084,025 $0.00 $94,848 $61,255 $156,103 $119,423 $745,929 $374,775 $1,240,127
Gifts and souvenirs $10,392 $36,397 $92,580 $139,369 $0.00 $28,515 $58,804 $87,318 $10,392 $64,911 $151,384 $226,687
Ice $53,723 $188,152 $31,952 $273,827 $0.00 $147,406 $20,295 $167,701 $53,723 $335,558 $52,248 $441,528
Lodging $132,281 $787,074 $421,691 $1,341,046 $0.00 $39,169 $7,509 $46,678 $132,281 $826,243 $429,200 $1,387,724
Parking & site access $108,855 $458,185 $104,639 $671,678 $0.00 $221,733 $56,625 $278,358 $108,855 $679,917 $161,264 $950,036
Public transportation $22,546 $30,879 $25,465 $78,889 $0.00 $109,946 $277,805 $387,751 $22,546 $140,824 $303,270 $466,640
Tournament fees $20,080 $109,460 $257 $129,797 $0.00 $15,962 $78 $16,039 $20,080 $125,422 $335 $145,837
Trip Total-Related Spending
$2,393,743 $10,011,683 $2,010,793 $14,416,219 $0.00 $4,939,899 $1,477,064 $6,416,963 $2,393,743 $14,951,582 $3,487,857 $20,833,182
1 The values in this column are all zeros because it is assumed that persons who live in the coastal area do not make trip-related expenditures outside of the coastal area for purposes of sportfishing in coastal waters.
Source: Derived from information in Point 97 and Surfrider Foundation 2015 and The Research Group 1991.
6-20 | Recreational Fishing Washington Coastal Marine Advisory Council

Economic Analysis to Support Marine Spatial Planning in Washington
Table 6-16 Trip-related Expenditures Associated with Ocean Sport Fishing Trips in 2014 from Shore and Jetties in the Washington Coastal Region (2014 dollars)
Coastal Area Spending Spending Elsewhere in WA Total Spending in WA
Coastal Residents
Residents Elsewhere
in WA
Out-of-State
Visitors TOTAL Coastal
Residents1
Residents Elsewhere
in WA
Out-of-State
Visitors TOTAL Coastal
Residents
Residents Elsewhere
in WA
Out-of-State
Visitors TOTAL
Auto fuel $35,278 $15,467 $3,850 $54,595 $0.00 $55,072 $41,996 $97,067 $35,278 $70,539 $45,845 $151,662
Auto rental $0 $0 $275 $275 $0.00 $0 $3,000 $3,000 $0 $0 $3,275 $3,275
Bait $9,523 $16,617 $5,990 $32,130 $0.00 $2,423 $1,805 $4,228 $9,523 $19,041 $7,795 $36,358
Boat rental $0 $0 $0 $0 $0.00 $0 $0 $0 $0 $0 $0 $0
Charter fees $0 $0 $0 $0 $0.00 $0 $0 $0 $0 $0 $0 $0
Crew tips $0 $0 $0 $0 $0.00 $0 $0 $0 $0 $0 $0 $0
Fish processing $0 $0 $0 $0 $0.00 $0 $0 $0 $0 $0 $0 $0
Food from grocery store $25,273 $28,513 $0 $53,786 $0.00 $22,021 $0 $22,021 $25,273 $50,534 $0 $75,807
Food from restaurants $9,322 $16,269 $28,369 $53,960 $0.00 $2,370 $5,543 $7,913 $9,322 $18,639 $33,912 $61,873
Gifts and souvenirs $0 $0 $6,893 $6,893 $0.00 $0 $4,378 $4,378 $0 $0 $11,270 $11,270
Ice $1,567 $1,757 $3,096 $6,420 $0.00 $1,376 $1,967 $3,343 $1,567 $3,133 $5,063 $9,763
Lodging $4,400 $8,380 $1,559 $14,339 $0.00 $417 $28 $445 $4,400 $8,797 $1,587 $14,784
Parking & site access $3,415 $4,602 $13,701 $21,718 $0.00 $2,227 $7,414 $9,641 $3,415 $6,829 $21,115 $31,359
Public transportation $2,612 $1,145 $169 $3,925 $0.00 $4,077 $1,840 $5,917 $2,612 $5,222 $2,009 $9,843
Tournament fees $0 $0 $8,924 $8,924 $0.00 $0 $2,688 $2,688 $0 $0 $11,612 $11,612
Trip Total-Related Spending
$91,389 $92,750 $72,825 $256,964 $0.00 $89,984 $70,658 $160,641 $91,389 $182,733 $143,483 $417,606
1 The values in this column are all zeros because it is assumed that persons who live in the coastal area do not make trip-related expenditures outside of the coastal area for purposes of sportfishing in coastal waters.
Source: Derived from information in Point 97 and Surfrider Foundation 2015 and The Research Group 1991.
Washington Coastal Marine Advisory Council Recreational Fishing | 6-21

Economic Analysis to Support Marine Spatial Planning in Washington
6.3.2 Employment and Labor Income Effects of Angler Expenditures in the Washington Coastal Study Area
Trip-related spending by state residents and out-of-state visitors (identified in Tables 6-14, 6-15, and 6-16) generates economic activity that supports jobs and personal income for residents of the coastal study area and elsewhere in the state. In the coastal study area, trip-related spending by those residing both in the coastal region and elsewhere in Washington who sportfish at the coast is estimated to support 325 jobs and $17.3 million in labor income within the coastal economy (Tables 6-17 and 6-18). Statewide, as dollars and economic activity multiply through the state’s economy, it is estimated that 596 jobs and $32.3 million in labor income are supported directly and indirectly by ocean angler activities in the coastal area.
6.4 RECREATION FISHING TRENDS
As stated by the Washington Interagency Committee for Outdoor Recreation (2003), recreation fishing trends may be best detected in hindsight. As identified in Chapter 7, Recreation and Tourism (Section 7.5), total traveler spending in the four-county coastal area that comprises the Washington coast increased by 32 percent (about 3 percent annually) between 2002 and 2012, as compared to statewide traveler spending that increased by 36 percent (about 4 percent annually). With the exception of beachgoing, rates of participation for the five most popular recreation activities in the Washington coastal area did not change substantially between 2002 and 2012 (Washington State Recreation and Conservation Office 2013).
For ocean recreational fishing in Washington coastal waters, annual variability in fishing effort is evident between 2004 and 2013 (see Table 6-7). Total charter boat fishing effort ranged from about 36,400 trips in 2008 to about 58,300 trips in 2004. Similar annual variability can be seen in private boat fishing and shore fishing.
The relative popularity of recreational fishing, especially marine recreational fishing, is an indicator of future recreation trends. As identified in the 2013 Washington State Comprehensive Outdoor Recreation Plan, “fishing for shellfish” was the leading activity, in terms of increased participation, of the 53 recreation activities evaluated, increasing in ranking from 45th in 2006 to 29th in 2012. Fishing from a bank, dock, or jetty and fishing from a private boat also showed notable increases in popularity over the 2006−2012 period (Washington State Recreation and Conservation Office 2013).
National surveys of fishing, hunting, and wildlife-associated recreation conducted by USFWS every 5 years also provide insight to potentially important recent and future recreational fishing trends. Although it must be acknowledged that comparing data over extended time intervals often introduces measurement error (particularly if survey methodologies change), these results can at least shed some light on the validity of apparent trends. According to USFWS (2014) data, the number of fishing participants in Washington State varied over time, but the number of anglers in 2011 (938,000) approximately matched those from the 2002 survey.
6-22 | Recreational Fishing Washington Coastal Marine Advisory Council

Economic Analysis to Support Marine Spatial Planning in Washington
Table 6-17 Contribution of Trip-related Angler Expenditures in the Coastal Area to Coastal Employment and Coastal Labor Income
2-digit NAICS Code Description
Contribution to Employment Contribution to Labor Income
Direct Indirect Induced Total Direct Indirect Induced Total
11 Agriculture, Forestry, Fishing and Hunting 4 3 0 7 $277,670 $56,573 $11,524 $345,768
21 Mining, Quarrying, and Oil and Gas Extraction 2 0 0 2 $7,657 $7,706 $405 $15,768
22 Utilities 0 0 0 0 $0 $13,394 $7,207 $20,601
23 Construction 0 2 0 3 $0 $168,784 $18,550 $187,335
31 Food Processing 4 0 0 4 $218,071 $6,647 $5,888 $230,607
32 Wood and Construction Products 0 0 0 0 $19,651 $11,526 $2,825 $34,001
33 Metal Products 0 0 0 0 $7,896 $10,199 $1,607 $19,702
42 Wholesale Trade 3 1 1 5 $277,570 $84,288 $64,944 $426,802
44 Retail Food and Clothing 16 0 7 23 $678,181 $16,285 $290,058 $984,524
45 Other Retail 5 0 3 8 $112,366 $4,997 $110,543 $227,907
48 Transportation 60 3 1 64 $5,182,750 $208,211 $32,304 $5,423,265
49 Warehousing and Storage 0 8 0 8 $3,097 $486,249 $24,605 $513,951
51 Information 0 1 0 1 $0 $57,906 $20,954 $78,860
52 Finance and Insurance 0 1 1 3 $1,892 $117,055 $95,746 $214,694
53 Real Estate and Rental and Leasing 87 2 1 90 $3,560,771 $46,307 $30,132 $3,637,209
54 Professional, Scientific, and Technical Services 0 3 1 4 $0 $241,865 $57,045 $298,909
55 Management of Companies and Enterprises 0 1 0 1 $0 $161,745 $7,995 $169,740
56
Administrative and Support and Waste Management and Remediation Services 0 5 1 6 $0 $236,548 $36,813 $273,362
61 Educational Services 0 0 1 1 $0 $2,574 $32,962 $35,536
Washington Coastal Marine Advisory Council Recreational Fishing | 6-23

Economic Analysis to Support Marine Spatial Planning in Washington
2-digit NAICS Code Description
Contribution to Employment Contribution to Labor Income
Direct Indirect Induced Total Direct Indirect Induced Total
62 Health Care and Social Assistance 0 0 8 8 $0 $40 $452,672 $452,712
71 Arts, Entertainment, and Recreation 2 1 1 4 $47,636 $14,973 $24,159 $86,768
72 Accommodation and Food Services 47 2 6 55 $1,323,998 $59,149 $153,870 $1,537,018
81 Other Services (except Public Administration) 0 3 6 8 $0 $136,631 $195,792 $332,423
200S/L Govt State and Local Government 15 1 1 16 $1,523,198 $143,619 $104,596 $1,771,413
300Fed Govt Federal Government 0 0 0 1 $4,642 $1,847 $2,388 $8,877
Grand Total
246 39 40 325 $13,247,047 $2,295,117 $1,785,587 $17,327,751
Table 6-18 Contribution of Trip-related Angler Expenditures in the Coastal Area and Elsewhere in Washington to Statewide Employment and Labor Income
2-digit NAICS Code Description
Contribution to Employment Contribution to Labor Income
Direct Indirect Induced Total Direct Indirect Induced Total
11 Agriculture, Forestry, Fishing and Hunting 7 7 1 16 $462,794 $162,205 $55,722 $680,722
21 Mining, Quarrying, and Oil and Gas Extraction 0 1 0 1 $349 $6,766 $1,462 $8,578
22 Utilities 0 0 0 0 $0 $33,321 $27,563 $60,884
23 Construction 0 4 1 5 $0 $248,730 $76,412 $325,141
31 Food Processing 7 1 1 9 $417,822 $46,075 $69,522 $533,419
32 Wood and Construction Products 1 2 1 3 $120,346 $136,219 $58,064 $314,629
33 Metal Products 0 1 1 1 $16,022 $48,479 $33,937 $98,438
42 Wholesale Trade 16 4 5 25 $1,369,248 $384,693 $415,418 $2,169,359
44 Retail Food and Clothing 40 1 15 55 $1,685,682 $24,405 $648,648 $2,358,735
45 Other Retail 7 0 10 18 $179,946 $9,131 $348,059 $537,137
6-24 | Recreational Fishing Washington Coastal Marine Advisory Council

Economic Analysis to Support Marine Spatial Planning in Washington
2-digit NAICS Code Description
Contribution to Employment Contribution to Labor Income
Direct Indirect Induced Total Direct Indirect Induced Total
48 Transportation 88 5 2 95 $7,165,536 $351,010 $159,936 $7,676,482
49 Warehousing and Storage 0 10 1 12 $5,416 $639,065 $84,257 $728,738
51 Information 0 3 2 5 $0 $317,619 $217,179 $534,798
52 Finance and Insurance 1 6 9 15 $104,441 $429,899 $607,386 $1,141,726
53 Real Estate and Rental and Leasing 104 6 8 118 $4,290,661 $147,441 $161,301 $4,599,402
54 Professional, Scientific, and Technical Services 0 12 6 18 $0 $899,628 $382,429 $1,282,057
55 Management of Companies and Enterprises 0 4 1 5 $0 $534,593 $81,589 $616,182
56
Administrative and Support and Waste Management and Remediation Services 0 17 6 23 $0 $728,632 $242,848 $971,480
61 Educational Services 0 0 5 5 $0 $7,699 $140,918 $148,618
62 Health Care and Social Assistance 0 0 28 28 $0 $124 $1,803,222 $1,803,346
71 Arts, Entertainment, and Recreation 3 2 6 11 $78,583 $45,625 $131,669 $255,877
72 Accommodation and Food Services 66 4 16 86 $1,848,771 $110,500 $421,001 $2,380,272
81 Other Services (except Public Administration) 0 4 12 17 $0 $239,658 $498,705 $738,363
200S/L Govt State and Local Government 20 1 1 22 $2,011,650 $139,236 $161,247 $2,312,133
300Fed Govt Federal Government 2 0 1 4 $20,673 $17,202 $24,056 $61,931
Grand Total
363 95 138 596 $19,777,941 $5,707,953 $6,852,551 $32,338,444
Washington Coastal Marine Advisory Council Recreational Fishing | 6-25

Economic Analysis to Support Marine Spatial Planning in Washington
A number of key factors must be considered when projecting future participation in marine recreational fishing. As identified in Chapter 7, Recreation and Tourism (Section 7.5), population growth between 2015 and 2025 in the four Washington coastal counties is projected at about 9 percent, compared to a statewide population growth rate of 11 percent over the same 10-year period. In addition to population growth, other factors that have affected, and will continue to affect, rates of participation in marine recreation fishing are changes in the supply and quality of recreational and ocean resources that support recreational fishing, technology changes, and a myriad of potential socio-demographic factors that can substantially influence recreation activity preferences.
Research on long-term recreation trends sponsored by the U.S. Forest Service as part of its Resource Planning Act responsibilities provides some insight into the effects of considering past and future trends. A U.S. Forest Service report published in 2013 (Bowker et al. 2013) concluded that, although participation in fishing (both warm- and cold-water fishing) has remained relatively popular (an estimated 73 million adult participants in the U.S. in 2008), participation in fishing on a per-capita basis has actually declined over the past few decades and is projected to continue to decline for decades to come. Nationwide, 31 percent of adults claimed to have fished in 2008, but this participation rate is projected to decline by 3−17 percent by 2060. Projected changes in climate conditions are identified as one of the more salient factors that are expected to contribute to this decline; although not mentioned specifically, changing climate conditions have been linked to declines in stocks of important target species. Population will grow over this period, but this growth is not expected to fully offset the effects on fishing activity caused by the projected decline in participation rates.
Even if the projections turn out to be reasonably accurate, these national (and regional) trends are not necessarily good indicators of future levels of recreational fishing activity along the Washington coast. Factors that can be expected to play an increasingly important role in the future of the marine fishing industry in Washington will largely be locally determined, however, so these projected trends may be tempered or even reversed. As an example, resource conditions for species of primary interest to marine anglers will play a major role in shaping this future.
REFERENCES
Anderson, L. E., and S. T. Lee. 2013. Washington and Oregon saltwater sportfishing surveys: Methodology and results. U.S. Department of Commerce, NOAA Tech. Memo. NMFS- NWFSC-124.
Bowker, J. M., Ashley E. Askew, H. Ken Cordell, Carter J. Betz, Stanley J. Zarnoch, and Lynne Seymour. 2013. Outdoor Recreation Participation in the United States—Projections to 2060:A Technical Document Supporting the Forest Service 2010 RPA Assessment. July 2013
Makah Tribe. 2015. Makah Marine Facilities and Services. Accessible at: makah.com/activities/marina. Accessed May 19, 2015.
Pacific Fishery Management Council. 2014a. Pacific Coast Groundfish Plan. Available at: www.pcouncil.org/wp-content/uploads/GF_FMP_FINAL_May2014.pdf. Accessed May 15, 2015.
6-26 | Recreational Fishing Washington Coastal Marine Advisory Council

Economic Analysis to Support Marine Spatial Planning in Washington
Pacific Fishery Management Council. 2014b. Pacific Coast Salmon Fishery Management Plan. Available at: www.pcouncil.org/wp-content/uploads/FMP_through_A-18_Final.pdf. Accessed May 16, 2015.
Pacific Fishery Management Council. 2015. Pacific Halibut Catch Sharing Plan for Area 2A. Available at: www.pcouncil.org/wp-content/uploads/2015PACIFIC_HALIBUT_ CSP_FOR_AREA2A.pdf. Accessed May 15, 2015.PFMC. See Pacific Fishery Management Council.
PFMC. See Pacific Fishery Management Council.
Port of Grays Harbor Moorage. Available at: www.portofgraysharbor.com/westport/westport Moorage.php. Accessed May 19, 2015.
Port of Ilwaco. Welcome to the Port of Ilwaco. Available at: portofilwaco.com. Accessed May 19, 2015.
Point 97 and Surfrider Foundation. 2015. An Economic and Spatial Baseline of Coastal Recreation in Washington. Report to the Washington Department of Natural Resources. Portland, OR. May 28, 2015.
The Research Group. 1991. Oregon Angler Study. Prepared for the Oregon Department of Fish and Wildlife.
U.S. Department of Commerce. Washington and Oregon Saltwater Sportfishing Surveys. Available at: www.nwfsc.noaa.gov/assets/25/4646_11222013_142005_SportfishingSurveyTM124WebFinal~ Std.pdf. Accessed 5/19/2015.
U.S. Department of the Interior, U.S. Fish and Wildlife Service, and U.S. Department of Commerce, U.S. Census Bureau. 2014. 2011 National Survey of Fishing, Hunting, and Wildlife-Associated Recreation. January 2014.
U.S. Fish and Wildlife Service. 2014. National Survey of Fishing, Hunting, and Wildlife-Associated Recreation. Washington, DC. Available at: www.census.gov/prod/2013pubs/fhw11-wa.pdf. Accessed May 13, 2015.USFWS. See U.S. Fish and Wildlife Service.
Washington Department of Fish and Wildlife. Unpublished data. Data provided to economic consultant team on December 16, 2015 (file = 2004-13 WA Recreational Effort.xlsx).
Washington Department of Fish and Wildlife. 2014. Sport Fish Catch Reports, 2009-2014.
Washington Department of Fish and Wildlife. 2015a. Summary of Washington Pacific Halibut Fisheries Management in 2014. Available at: wdfw.wa.gov/publications/01716. Accessed May 13, 2015.
Washington Department of Fish and Wildlife. 2015b Washington State Pacific Halibut Catch Plan. Available at: wdfw.wa.gov/fishing/creel/halibut/2015catchplan_final.pdf. Accessed May 13, 2015.
Washington Department of Fish and Wildlife. 2015c. Washington Sportfishing Rules. Available at: wdfw.wa.gov/publications/01590/wdfw01590.pdf. Accessed May 15, 2015.
WDFW. See Washington Department of Fish and Wildlife.
Washington Coastal Marine Advisory Council Recreational Fishing | 6-27

Economic Analysis to Support Marine Spatial Planning in Washington
Washington State Recreation and Conservation Office. 2013. The 2013 State Comprehensive Outdoor Recreation Plan, 2013. Available at: www.rco.wa.gov/documents/rec_trends/2013-2018SCORP-FullRpt.pdf. Accessed June 13, 2015.
PERSONAL COMMUNICATIONS
Krueger, Katie. Staff attorney for the Quileute Tribe. Written comments on the draft economic analysis for the Washington Coast Marine Spatial Plan. June 9, 2015.
Waters, Edward. Economist. Washington Coast Charter Vessel Summary. Meetings with charter boat operators in February 2015.
IMAGES
Chapter 6 Header Image: Photographer Unknown, 2010. Quillback Rockfish just caught in the Gulf of Alaska. Retrieved May 29, 2015, from: commons.wikimedia.org/wiki/ File:Quillback_Rockfish.JPG
Page 6-3: Erin Kohlenberg, 2011. Dawn Fishing. Retrieved July 7, 2015, from: www.flickr.com/photos/ erinkohlenbergphoto/5904083924
Page 6-14: NOAA Corps, 2006, photographer Lt. John Crofts. China rockfish in the kelp forest. Retrieved July 7, 2015, from: www.flickr.com/photos/51647007@N08/5019886431
Page 6-15: Patrick Denker, 2008. IMG_7672. Retrieved July 7, 2015, from: www.flickr.com/photos/ pdenker/2556705797
6-28 | Recreational Fishing Washington Coastal Marine Advisory Council
CHAPTER 7. Recreation and Tourism
Historically, recreation and tourism have always been a part of the economy of Washington coast counties, but its contribution has been small relative to other well-established sectors, such as fishing, forestry, and manufacturing. While structural shifts continue to take place leading to declines in both forestry and manufacturing, the recreation and tourism sector remains steady or growing and is increasing in prominence. This shift has been foreseen for some time; a Washington Sea Grant report from a decade ago pointed to continued growth in the magnitude and, consequently, the economic importance of coastal tourism (Hadley 2002). Recent data from the U.S. Department of Commerce, Bureau of Economic Analysis (BEA) on industry earnings and trends supports this finding (BEA 2015).
In this chapter, an economic baseline is developed that characterizes existing recreation and tourism in the coastal study area. The study area includes the four Washington counties with coastal access: Jefferson, Clallam, Grays Harbor, and Pacific. (Wahkiakum County is included as part of the regional economy for economic modeling purposes; however, because Wahkiakum County does not have coastal frontage [only the Columbia River], recreation and tourism activity in the towns and cities of Wahkiakum County is not profiled in this chapter.) Because Neah Bay is located on Makah Reservation lands, which straddle both the coastal area and the western edge of the Strait of Juan de Fuca, it has been included in the study area for this assessment. The total population of the four coastal access counties was estimated at 198,000 in 2010, or about 3 percent of the state population (U.S. Census Bureau 2012). In recent years, population and economic growth in these counties has lagged behind the state average (Industrial Economics [IEc] 2014).
In addition to establishing an economic baseline for recreation and tourism, this chapter addresses the relative importance of recreation and tourism within community areas along the Washington coast. These community
Washington Coastal Marine Advisory Council Recreation and Tourism | 7-1

Economic Analysis to Support Marine Spatial Planning in Washington
areas are located within three distinct regions of the coastal study area: Northern Washington Coast, Southern Washington Coast – Grays Harbor Area, and Southern Washington Coast – Willapa Bay/Long Beach Peninsula.
7.1 NORTHERN WASHINGTON COAST (CLALLAM AND JEFFERSON COUNTIES)
The Northern Washington Coast is defined to include the Pacific coastlines of Clallam and Jefferson Counties, extending from Cape Flattery south to the northern border of the Quinault Indian Reservation (Figure 7-1). The northern coast is dominated by high rocky cliffs, with islands and sea stacks scattered offshore. The Makah, Quileute, and Hoh Indian Tribes have reservation lands along portions of this coastline, as well as reserved (not granted) treaty access and harvest rights to areas beyond their respective reservations, on the coast and into the ocean (the Usual and Accustomed Fishing Grounds and Stations, or U&A) This area of the coast has relatively few access points. No major changes in access to the ocean have occurred in several years, and no substantial changes are expected (IEc 2014).
The Olympic Coast National Marine Sanctuary makes up most of the northern half of the study area, running north from the mouth of the Copalis River along the coast and extending seaward 25−40 miles, including 2,408 square nautical miles of marine waters (IEc 2014). Olympic National Park occupies significant portions of the Clallam and Jefferson County coastlines. Major recreation features along the Northern Washington Coast include Cape Flattery, Olympic National Park’s campgrounds and trails, several well-known surfing beaches, and various tribal facilities, including lodging, marinas, and trails. The northern coast primarily attracts visitors looking to spend time connecting with nature (IEc 2014).
Recreation and tourism are important contributors to the economies of both Clallam and Jefferson Counties. In 2009, visitor-related travel expenditures were estimated to total $179.4 million in Clallam County and $103.3 million in Jefferson County (Dean Runyan Associates 2011). In Clallam County, this spending supported an estimated 2,980 jobs (direct, indirect, and induced), representing 8.2 percent of countywide employment. In Jefferson County, the estimated employment effects were smaller, at 1,630 jobs, but the relative contribution to the economy was larger, representing 11.6 percent of the county’s total employment. According to data on the ocean economy available from the National Ocean Economics Program (NOEP), the recreation and tourism sector contributed 2,282 jobs to the Clallam County economy and helped to support 238 businesses establishments in 2011 (NOEP 2015). In Jefferson County, the recreation and tourism sector contributed 1,065 jobs and helped to support 115 business establishments. (Note: Ocean economy data include only ocean-related activities and industries compiled from the databases of the U.S. Bureau of Labor Statistics.)
According to the National Park Service, the Northern Washington Coast region’s most prominent destination, Olympic National Park, receives an estimated 3 million visitors annually (IEc 2014). Olympic National Park estimates that visitation for the three coastal park districts located in the Northern Washington Coast region (Mora, Kalaloch, and Ozette) ranged from about 759,000 to 783,000 visitors each year from 2011 through 2013, while park-wide visitation was approximately 2.8−3.1 million visitors each year (IEc 2014).
National Park Service 2015
Hiker at Second Beach, Olympic National Park
7-2 | Recreation and Tourism Washington Coastal Marine Advisory Council

Economic Analysis to Support Marine Spatial Planning in Washington
Figure 7-1 Regions and Community Areas along the Washington Coast
Washington Coastal Marine Advisory Council Recreation and Tourism | 7-3

Economic Analysis to Support Marine Spatial Planning in Washington
7.1.1 Neah Bay Area
Communities
Within the area encompassing the Makah Reservation, Neah Bay is the only established community with a population of 865 in 2010, 77 percent of which is Native American according to the U.S. Census Bureau (2015). The town is home to a large marina, a small coast guard base, high school, general store and mini-mart, as well as several homes, cafes, and the Makah Council tribal offices. According to the Neah Bay Chamber of Commerce (2015), about 20 service oriented businesses are registered, four of which are fishing or charter related. According to U.S. Census Bureau (2015) data, within the Neah Bay CDP, an average of 16 (4.8 percent) of the community’s 335 employed residents 16 years of age or older were employed annually in retail, arts, entertainment, recreation, accommodation, and food services sectors between 2009 and 2013. Agriculture, fishing, and natural resource extraction are the primary industries in the town with an average 65 employed people over the same period.
Recreation Resources and Tourism Activities
Neah Bay is located near Cape Flattery at the entrance to the Strait of San Juan de Fuca at the Pacific Ocean in western Clallam County. This small community is located entirely within the Makah Indian Reservation. The town can be reached via U.S. Highway 101 (US 101) from the inland town of Forks, which is about a one hour drive via State Route (SR) 113 and SR 112, or about a 2-hour drive along SR 112 from Port Angeles.
Neah Bay is widely known for its salmon and halibut fishing, as well as fishing for bottomfish, such as lingcod, kelp greenling, black rockfish (sea bass), china rockfish, yellow eye and canary rockfish, among others (Neah Bay Chamber of Commerce 2015). Fishing for Lingcod is good in spring and summer, while salmon fishing is good during summer runs (Wikipedia 2015a). A 200-slip marina, which is operated by the Makah tribe, supports several charters and private boats during each fishing season.
Other activities in Neah Bay include deep sea diving with visibility at 60 feet at times, hikes to Cape Flattery via a cedar boardwalk and groomed earthen trail, and wildlife viewing opportunities, especially for sea birds, sea-lions, and Gray whales (Neah Bay Chamber of Commerce 2015). A $10 annual recreational permit is required to recreate in the area, and is available in several stores in town.
Accommodations are available near downtown Neah Bay at Cape Resort, King Fisher Inn, Apocalypto Motel, Cape Motel & RV [recreational vehicle] Park, Carol’s Tyee Motel, Butler’s Motel, Chito Beach Resort, Village RV Park, and Bullman Beach Inn, and The Inn at Neah Bay. Other visitor serving locations include Washburn’s General Store at the Makah Mini-Mart, as well as about a half dozen restaurants and cafes (Neah Bay Businesses 2015).
Indoor attractions include the Makah Museum, which displays artifacts retrieved from an 18th century Makah village as well as replicas of traditional Makah artifacts. Native art and crafts are available at a limited number of shops downtown.
7-4 | Recreation and Tourism Washington Coastal Marine Advisory Council

Economic Analysis to Support Marine Spatial Planning in Washington
About three miles southwest from Neah Bay down Cape Flattery Road lies the Hobuck Beach Resort, on Hobuck Beach. Sea-kayaking, surfing, paddle-boarding or swimming in the waves is very popular (Neah Bay Chamber of Commerce 2015). A fish hatchery is accessible via trail from the beach, where visitors can view salmon jumping up fish ladders into holding areas during the spawning season. Cape Loop road, which roughly follows the coastline from Neah Bay to Hobuck, allows visitors to tour smaller beaches and view points of interest such as the Tatoosh Island lighthouse offshore.
7.1.2 La Push Area
Communities
La Push is the only coastal community that provides an array of waterfront tourist services between the Makah Indian Reservation’s Hobuck Beach Resort and the Quinault Indian Reservation. With a 2010 population of 460, La Push is the tribal headquarters for the Quileute Indian Reservation and is home to many members of the Quileute Tribe. With the exception of High Tide Seafood, which is leased from the tribe, all of the businesses in La Push are owned by the Tribe, including Quileute Oceanside Resort and its marina. In addition, the Lonesome Creek Store and RV Park offer RV spaces and a small number of tent sites. First Beach, at the north edge of the reservation, is a wide, sandy beach with sea stacks between the beach and western horizon; during whale migration season, whales can be seen from the beach (Wikipedia 2015b). Although tourism has become increasingly important to the Quileute Tribe, tourism-sensitive industries do not employ a large share of La Push’s resident population, as represented by the resident population of the 98350 zip code area. According to data from the U.S. Census Bureau’s 2009-2013 American Community Survey (ACS) (U.S. Census Bureau 2014), an average of about 8 percent of employed residents 16 years of age or older were employed in the retail, arts, entertainment, recreation, accommodation, and food services sectors annually between 2009 and 2013 (Table 7-1).
Table 7-1 Resident Employment in Tourist-Sensitive Industries, by Coastal Community
Region/Community Total Resident Employment1
Employment in Tourism-Sensitive
Industries2
Percentage of Residents Employed in Tourism-Sensitive Industries
Northern Washington Coast
La Push3 152 12 7.9%
Ruby Beach N/A N/A N/A
Kalaloch N/A N/A N/A
Queets CDP 38 7 18.4%
Southern Washington Coast (Grays Harbor area, including the coastal portion of Grays Harbor County)
Taholah CDP 257 22 8.6%
Moclips CDP 21 0 0.0%
Pacific Beach4 40 23 57.5%
Copalis Beach CDP 50 41 82.0%
Ocean City CDP 98 84 85.7%
Washington Coastal Marine Advisory Council Recreation and Tourism | 7-5

Economic Analysis to Support Marine Spatial Planning in Washington
Region/Community Total Resident Employment1
Employment in Tourism-Sensitive
Industries2
Percentage of Residents Employed in Tourism-Sensitive Industries
Ocean Shores 1,876 645 34.4%
Hoquiam 3,028 718 23.7%
Aberdeen 6,326 1,619 25.6%
Cosmopolis 659 150 22.8%
Markham CDP 64 27 42.2%
Ocosta N/A N/A N/A
Bay City N/A N/A N/A
Westport 652 112 17.2%
Grayland CDP 261 87 33.3%
Willapa Bay/Long Beach Peninsula (including the coastal portion of Pacific County)
Tokeland CDP5 39 0 0.0%
Raymond 1,016 145 14.3%
South Bend 646 73 11.3%
Bay Center CDP 21 0 0.0%
Nemah N/A N/A N/A
Johnson’s Landing N/A N/A N/A
Chinook CDP 78 6 7.7%
Ilwaco 475 81 17.0%
Seaview6 219 126 57.5%
Long Beach 578 212 36.7%
Ocean Park CDP7 261 80 31.0%
Oysterville N/A N/A N/A
Notes: N/A = not available; CDP = Census Designated Place. 1 Includes civilian employed population aged 16 years and older. 2 Includes residents employed in the retail, arts, entertainment, recreation, accommodation, and food services sectors. 3 Data represent the 98350 zip code area. 4 Data represent the 98571 zip code area and include the community of Seabrook. 5 Data include the community of North Cove. 6 Data represent the 98644 zip code. 7 Data includes the community of Nahcotta.
Source: U.S. Census Bureau 2014.
Recreation Resources and Tourism Activities
Key recreation sites along the Northern Washington Coast are identified in Table 7-2. As shown, these sites, and the recreation and tourism resources they provide, are largely located on tribal reservation lands or within the coastal portion of Olympic National Park.
7-6 | Recreation and Tourism Washington Coastal Marine Advisory Council

Economic Analysis to Support Marine Spatial Planning in Washington
Table 7-2 Key Recreation Sites in the Northern Washington Coast Region
Clallam County Jefferson County
Makah Tribe: Cape Flattery (maintained trail to
northwestern-most tip of U.S.) Hobuck Beach Resort (tent campsites, cabins,
RV sites)
Olympic National Park: Kalaloch Lodge Kalaloch Campground (170 campsites) Queets Campground (20 campsites) South Beach Campground (55 campsites) Wilderness Campsites: Second Beach, Third
Beach, Scott Creek, Strawberry Point, Toleak Point, Mosquito Creek
Olympic National Park: Lake Ozette Campground (15 campsites) Mora Campground (94 campsites) Wilderness Campsites: Shi Beach, Seafield
Creek, N. Ozette River, S. Ozette River, Cape Alava, Wedding Rocks, Sand Point, South Sand Point, Yellow Banks, Norwegian Memorial, Cedar Creek, Chilean Memorial, Hole-in-the-Wall
Coastal Communities: Queets
Quileute Tribe: Quileute Oceanside Resort Campsites: 24 RV sites, 42 tent or RV sites Hotel: 25 motel/42 cabin units Quileute Marina (95 slips)
Coastal Communities: La Push
Sources: IEc 2014 and Hobuck Beach Resort 2015.
In the vicinity of La Push, key recreation and tourism resources include Olympic National Park and Quileute Reservation tribal lands. Nearby campgrounds are Mora Campground, with 94 campsites, and wilderness campsites at Hole-in-the-Wall, Second Beach, Third Beach, Scott Creek, Strawberry Point, Toleak Point, and Mosquito Beach.
On the Quileute Reservation, the tribe’s Oceanside Resort, located along First Beach in La Push, provides accommodations ranging from luxurious to rustic, including oceanfront cabins and motel units, a campground, and two full-service RV parks (Quileute Tribe 2012). In addition to the resort, the tribe operates a marina that is open year-round with 95 slips, some of which are leased to commercial and sport fishermen (IEc 2014). The tribe also operates a restaurant and small store/gas station used by tourists. Activities available from the resort and marina are wildlife viewing and photography, camping, coastal hiking, boating, scenic boat
(cc) Amlt Chattopadhayay 2009
Cape Flattery
Washington Coastal Marine Advisory Council Recreation and Tourism | 7-7

Economic Analysis to Support Marine Spatial Planning in Washington
cruises, fishing and while watching charters, surfing, stand-up paddle boarding, and mountain biking (Quileute Tribe 2012).
Other recreational opportunities available to visitors are kayaking, beachcombing, swimming (when the weather is warm enough), camping, and beach campfires. First Beach is a popular surf spot year-round, but primarily in the winter when bigger waves occur. In addition, whale watching is a popular activity from March through May. Gray whales stay relatively close to the coast when traveling north as they migrate from Mexico to Alaska. At high tide, the whales may be observed at First Beach as close as 20 feet offshore. Transient orcas hunt the calves and are sometimes seen cruising along the shoreline as well. Visitors trickle in throughout these months to walk the beach and watch the whales (IEc 2014).
Within the Mora District of Olympic National Park, which encompasses the La Push area, visitation is estimated for the entire district and for two sub-districts, including Rialto Beach, just north of La Push, and Second and Third Beaches, just south of La Push. For the entire Mora District, estimated annual visitation averaged about 263,300 visitors from 2011 through 2013 (IEc 2014). For the Rialto Beach sub-district, yearly visitation averaged about 144,600 visitors annually. For the Second and Third Beach sub-districts, visitation was estimated to average 108,500 visitors annually.
7.1.3 Kalaloch Area (including Ruby Beach and Queets)
Communities
Within the Kalaloch Area, the only community of substantial size is Queets, with a 2010 population of 174. An unincorporated community on the border of Jefferson County and Grays Harbor County, Queets is located about 5 miles south of Kalaloch Beach along the Queets River at the northern edge of the Quinault Indian Reservation. The community, which is populated primarily by members of the Quinault Indian Nation (QIN), consists of several homes, a store, gas station, fishery-related businesses, Head Start office, and a remote office for the tribe (Wikipedia 2015c). As discussed previously, a campground is located along the Queets River, and beach access and hiking trails are located nearby in the Kalaloch area. Because of its size, not many residents are employed in tourism-sensitive industries in Queets. According to U.S. Census Bureau (2014) data, within the Queets CDP, an average of seven of the community’s 38 employed residents 16 years of age or older were employed in the retail, arts, entertainment, recreation, accommodation, and food services sectors annually between 2009 and 2013 (Table 7-2).
Recreation Resources and Tourism Activities
South of the Hoh Indian Reservation, where US 101 touches the coastline and runs south through the coastal portion of Olympic National Park to the Quinault Indian Reservation, lies an area marked by several beaches and whale-watching locations. Ruby Beach, which can be reached from a short trail off US 101, is the northernmost of these southern beaches in the coastal section of Olympic National Park. Like many beaches along this coastline, Ruby Beach is notable for its sea arches, sea stack, and offshore islands, as well as for the large amounts of driftwood that wash up on the beach (Wikipedia 2015d). Although the beach provides scenic views, beach walks, and beachcombing, no significant visitor accommodations are available near Ruby Beach (National Park Service 2015). Nearby whale-watching vantage points include
7-8 | Recreation and Tourism Washington Coastal Marine Advisory Council
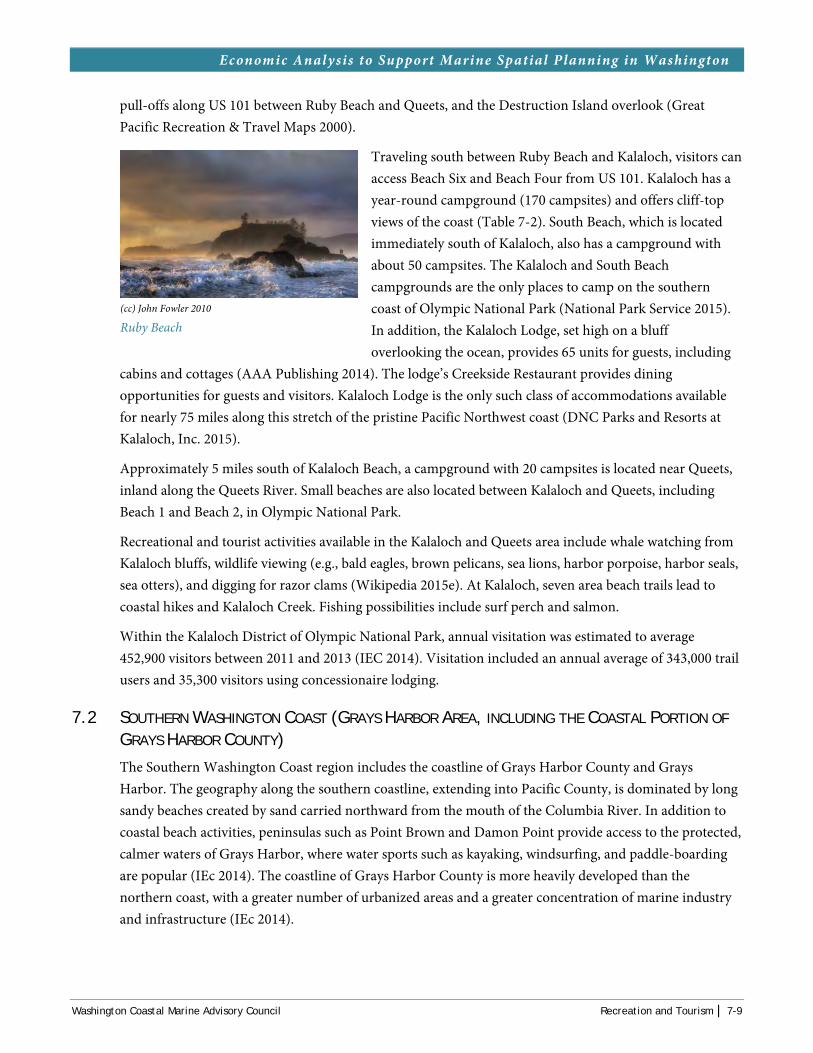
Economic Analysis to Support Marine Spatial Planning in Washington
pull-offs along US 101 between Ruby Beach and Queets, and the Destruction Island overlook (Great Pacific Recreation & Travel Maps 2000).
Traveling south between Ruby Beach and Kalaloch, visitors can access Beach Six and Beach Four from US 101. Kalaloch has a year-round campground (170 campsites) and offers cliff-top views of the coast (Table 7-2). South Beach, which is located immediately south of Kalaloch, also has a campground with about 50 campsites. The Kalaloch and South Beach campgrounds are the only places to camp on the southern coast of Olympic National Park (National Park Service 2015). In addition, the Kalaloch Lodge, set high on a bluff overlooking the ocean, provides 65 units for guests, including
cabins and cottages (AAA Publishing 2014). The lodge’s Creekside Restaurant provides dining opportunities for guests and visitors. Kalaloch Lodge is the only such class of accommodations available for nearly 75 miles along this stretch of the pristine Pacific Northwest coast (DNC Parks and Resorts at Kalaloch, Inc. 2015).
Approximately 5 miles south of Kalaloch Beach, a campground with 20 campsites is located near Queets, inland along the Queets River. Small beaches are also located between Kalaloch and Queets, including Beach 1 and Beach 2, in Olympic National Park.
Recreational and tourist activities available in the Kalaloch and Queets area include whale watching from Kalaloch bluffs, wildlife viewing (e.g., bald eagles, brown pelicans, sea lions, harbor porpoise, harbor seals, sea otters), and digging for razor clams (Wikipedia 2015e). At Kalaloch, seven area beach trails lead to coastal hikes and Kalaloch Creek. Fishing possibilities include surf perch and salmon.
Within the Kalaloch District of Olympic National Park, annual visitation was estimated to average 452,900 visitors between 2011 and 2013 (IEC 2014). Visitation included an annual average of 343,000 trail users and 35,300 visitors using concessionaire lodging.
7.2 SOUTHERN WASHINGTON COAST (GRAYS HARBOR AREA, INCLUDING THE COASTAL PORTION OF
GRAYS HARBOR COUNTY)
The Southern Washington Coast region includes the coastline of Grays Harbor County and Grays Harbor. The geography along the southern coastline, extending into Pacific County, is dominated by long sandy beaches created by sand carried northward from the mouth of the Columbia River. In addition to coastal beach activities, peninsulas such as Point Brown and Damon Point provide access to the protected, calmer waters of Grays Harbor, where water sports such as kayaking, windsurfing, and paddle-boarding are popular (IEc 2014). The coastline of Grays Harbor County is more heavily developed than the northern coast, with a greater number of urbanized areas and a greater concentration of marine industry and infrastructure (IEc 2014).
(cc) John Fowler 2010
Ruby Beach
Washington Coastal Marine Advisory Council Recreation and Tourism | 7-9

Economic Analysis to Support Marine Spatial Planning in Washington
Developed areas in the Southern Washington Coast region include the cities of Hoquiam and Aberdeen and the Port of Grays Harbor; the coastal towns of Pacific Beach, Ocean Shores, and Westport; and several smaller communities. The Quinault Indian Reservation takes in much of the coastline of the northern half of Grays Harbor County, and public access to the shoreline is greatly limited for much of the area within the reservation, particularly between Queets and Taholah. South of the reservation, access is provided by SR 109 between Taholah and Hoquiam/Aberdeen and by SR 105 between Aberdeen and Grayland.
Key recreation sites along the Southern Washington Coast region are identified in Table 7-3. As shown, most of the recreation and tourism resources are located on tribal reservation lands or within the coastal portion of the Olympic National Park.
Table 7-3 Key Recreation Sites along the Southern Washington Coast (Grays Harbor County)
Quinault Indian Nation: Quinault Beach Resort and Casino (located at Ocean Shores)
Federal Wildlife Refuges: Grays Harbor National Wildlife Refuge Copalis National Wildlife Refuge (offshore)
State Parks: Pacific Beach (22 standard campsites, 42 utility campsites, 2 yurts) Griffiths-Priday (day use) Ocean City (149 standard campsites, 29 full utility campsites) Westhaven (day use) Westport Light (day use) Bottle Beach (day use) Twin Harbors Beach (219 tent campsites, 42 utility campsites,
1 group campsite, 2 yurts) Grayland Beach (55 full-hookup campsites) Oyhut Wildlife Recreation Area
Coastal Communities: Taholah Moclips Pacific Beach Seabrook (150 cottage rentals) Copalis Beach Ocean City Ocean Shores (1,500 hotel rooms) Hoquiam Aberdeen Cosmopolis Westport (including Markham, Ocasta, and Bay City) Westport Marina (600 slips) Boat ramp at Westport Marina Grayland
Source: IEc 2014
7-10 | Recreation and Tourism Washington Coastal Marine Advisory Council

Economic Analysis to Support Marine Spatial Planning in Washington
Two national wildlife refuges are located in the Southern Washington Coast region, but only Grays Harbor National Wildlife Refuge near Hoquiam is open for visitation. Copalis National Wildlife Refuge is a group of islands located offshore, running from the northern part of the Quinault Indian Reservation to Copalis Beach. This refuge is open to wildlife observation by boat, but public access to islands within the refuge is not permitted (IEc 2014). Several state parks are located on or near coastal areas of the Southern Washington Coast region. From north to south, these parks are Pacific
Beach, Griffiths-Priday, and Ocean City, all located north of Grays Harbor; and Westhaven, Westport Light, Bottle Beach, and Twin Harbors, located near the southern mouth of Grays Harbor and just to the south along Point Chehalis and the coastline. Also, the Oyhut Wildlife Recreation Area is located at Point Brown, south of the community of Ocean Shores.
As in the Northern Washington Coast region, recreation and tourism are important contributors to the economy of the Southern Washington Coast region. In 2009, visitor-related travel expenditures totaled an estimated $253.7 million in Grays Harbor County (Dean Runyan Associates 2011). This spending supported an estimated 2,980 jobs (direct, indirect, and induced), representing 15.6 percent of countywide employment, the third largest percentage among the state’s counties, behind only Pacific and Skamania Counties. According to data on the ocean economy available from NOEP, the recreation and tourism sector contributed 1,537 jobs to the Grays Harbor County economy and helped to support 178 businesses establishments in 2011 (NOEP 2015). (Note: Ocean economy data include only ocean-related activities and industries compiled from the databases of the U.S. Bureau of Labor Statistics.)
7.2.1 Taholah Area
Communities
Taholah, with a population of 840 in 2010, is the headquarters for the QIN and is largely populated by tribal members. Businesses of potential interest to tourists include a mercantile shop and the Quinault Pride seafood processing plant, where visitors can buy the blueback (or sockeye) salmon unique to the Quinault River (North Beach Vacation 2015). According to U.S. Census Bureau data (2015), within the Taholah CDP, an average of 22 (8.6 percent) of the community’s 257 employed residents 16 years of age or older were employed in the retail, arts, entertainment, recreation, accommodation, and food services sectors annually between 2009 and 2013 (Table 7-1).
Recreation Resources and Tourism Activities
The Taholah Area largely consists of the coastline of the Quinault Reservation. No roadway access is available between the communities of Queets and Taholah, substantially reducing access to the coastline along the northern half of the reservation. Additionally, restrictions have been enacted at beaches on the Quinault Reservation, limiting access to beaches and surf spots to Quinault tribal members only (IEc
USFWS 2015
Grays Harbor National Wildlife Refuge
Washington Coastal Marine Advisory Council Recreation and Tourism | 7-11

Economic Analysis to Support Marine Spatial Planning in Washington
2014). Although up until 2014 visitors could obtain a beach pass for $15 from the tribal administration building or police station (North Beach Vacation 2015), this program was suspended last year and no access is allowed by non-tribal members until further notice (C. Dennehey, pers. comm., 2015). The rocky beach immediately accessible from Taholah lies at the mouth of the Quinault River. Views in the vicinity include the red sandstone rocks of Cape Elizabeth to the north, massive piles of driftwood on the beaches to the south of the river’s mouth, and the rocks of Point Grenville to the south (North Beach Vacation 2015).
Traveling south from Taholah on SR 109, a whale-watching viewpoint is available at Point Greenville, along with wildlife viewing possibilities at Grenville Bay (Great Pacific Recreation & Travel Maps 2000).
7.2.2 Moclips/Pacific Beach Area
Communities
Moclips and Pacific Beach, which are about 2 miles apart, are relatively small, unincorporated communities linked by SR 109. Within the Moclips CDP, which encompasses both communities, the 2010 population was 207 persons (U.S. Census Bureau 2014). Within the larger Pacific Beach area (98571 zip code) that excludes Moclips but includes nearby Seabrook, the 2010 population was 483. Several bed-and-breakfast inns (B&Bs), motels, hotels, and inns are located in or near Moclips and Pacific Beach, including the Pacific Beach Inn, Sand Dollar Inn, Hi-Tide Resort, and Ocean Crest Resort (Pacific Beach 2014). Other businesses in the vicinity include several small grocery stores and gas stations, a restaurant, and antique and gift shops. According to U.S. Census Bureau data (2015), within the combined Moclips CDP and Pacific Beach zip code area, an average of 23 (37.7 percent) of the area’s 61 employed residents 16 years of age or older were employed in the retail, arts, entertainment, recreation, accommodation, and food services sectors annually between 2009 and 2013 (Table 7-1).
Recreation Resources and Tourism Activities
The Moclips/Pacific Beach Area is a popular beach getaway (AAA Publishing 2014). From the mouth of the Moclips River, a long beach runs north and south from the community of Moclips, and Sunset Beach and Pacific Beach are located just south of Moclips. These beaches are often open year-round. Pacific Beach State Park, just south of the community of Pacific Beach, provides 22 standard campsites, 42 utility campsites, and 2 yurts (IEc 2014). Moclips and Pacific Beach are centrally located for visiting Lake Quinault, Kalaloch, or Ocean Shores (Pacific Beach 2014).
Recreation and tourism activities available in the Moclips/Pacific Beach Area include horseback riding, kiting on the beach, beachcombing, camping, hiking, bird watching and wildlife viewing, storm watching, sea kayaking, clamming, and visiting the Museum of the North Beach and the Quinault Reservation (Washington Tourism Alliance 2015a). Additionally, whale watching viewpoints are available at area beaches and along SR 109 (Great Pacific Recreation & Travel Maps 2000).
7-12 | Recreation and Tourism Washington Coastal Marine Advisory Council
Economic Analysis to Support Marine Spatial Planning in Washington
The Washington State Parks and Recreation Commission (WSPRC) tracks visitation at state parks, ocean beach approaches (OBAs), and access points for seashore conservation areas (SCAs). Although these data likely include some double counting, they provide a gauge for the level of visitation to the area over time. For Pacific Beach State Park, visitation over the 2004-2013 period has grown from 160,000 in 2004 to 291,300 in 2013, averaging 201,100 visitors per year over the 10-year period (IEc 2014).
7.2.3 Seabrook Area
Communities
Seabrook, a beach town designed around new urban principles, was founded in 2005 just south of Pacific Beach. This development currently includes 250 homes (half of which are in the Seabrook Cottage Rentals program) and is slated to expand to a total of 300 homes and more than 450 total units (IEc 2014). No population data are currently available for Seabrook, but the population of the Pacific Beach zip code area, which includes Seabrook, was 483 in 2010. The town includes beach access and has its own retail district, including a market, restaurant/pub, arts-and-craft shop, and gift shop. Additionally, convenience stores with basic groceries are available a few minutes away in Pacific Beach.
Recreation Resources and Tourism Activities
Seabrook is located about 1 mile south of Pacific Beach and shares many of the recreation and tourism resources of the Moclips/Pacific Beach Area described previously. In addition to those resources, the town offers many scenic vistas and a network of paths, trails, and sidewalks for visitors (Washington Tourism Alliance 2015b). Access to the beach at Seabrook is available from two points in the community.
7.2.4 Copalis Beach/Ocean City Area
Communities
Copalis Beach (population 415 in 2010) and Ocean City (population 200 in 2010) are the two largest communities in this area. Other nearby communities are North Beach, Hogan’s Corner, Oyehut-Hogan’s Corner, Simpson, and Oyehut. In addition to the campground at Ocean City State Park, visitor accommodations are available at both Copalis Beach and Ocean City, including the Copalis Beah RV Resort and RV Park, Riverside RV Resort, Beach Wood Resort, Dunes Beach Resort, Linda’s Low Tide Motel, and Blue Pacific Motel and RV Park. Other tourist-serving businesses, including restaurants, are located in the area.
According to U.S. Census Bureau data (2015), within the combined Copalis Beach and Ocean City CDPs, an average of 125 (84.5 percent) of the area’s 148 employed residents 16 years of age or older were employed in the retail, arts, entertainment, recreation, accommodation, and food services sectors annually between 2009 and 2013 (Table 7-1).
Washington Coastal Marine Advisory Council Recreation and Tourism | 7-13

Economic Analysis to Support Marine Spatial Planning in Washington
Recreation Resources and Tourism Activities
The coastline stretching from Copalis Beach south to Ocean City is well known for its razor clams, with an extensive razor clam bed running south from Copalis Beach (Wikipedia 2015f). Access to Copalis Beach and the beaches running south to Ocean City are available in several locations along SR 109, as well as from many of the resorts in the area. Recreational and tourist activities available in the immediate vicinity of Copalis Beach and Ocean City include clamming, beachcombing, surf fishing, camping, bird watching, wildlife viewing, and kiting (Sunrise Resorts 2015; Ocean City RV Resort 2015).
Two Washington State Parks are located in the Copalis Beach/Ocean City Area. Griffiths-Priday Ocean State Park, located just north of Copalis Beach, is a 364-acre marine park with 8,316 feet of saltwater shoreline on the Pacific Ocean and 9,950 feet of freshwater shoreline on the Copalis River (Washington State Parks 2015a). The park extends from the beach through low dunes to the river, then north to the river’s mouth. This oceanside beach day-use park extends through walkable low dunes to the river. The park is the northern border of the National Marine Sanctuary, and the Copalis Spit natural area is a designated wildlife refuge, particularly for birds. The day-use area includes picnicking facilities.
Ocean City State Park, located south of Ocean City, is a year-round, 170-acre camping park featuring ocean beach, dunes, and dense thickets of shore pine. Migratory birds may be viewed at the park and beach combing is a popular activity (Washington State Parks 2015b). In addition to picnicking and day-use facilities, the park provides 149 standard campsites and 29 full utility sites (Table 7-3).
According to WSPRC data, visitation at Griffiths-Priday Ocean State Park over the 2009-2013 period grew from 160,000 in 2004 to 291,300 in 2013, averaging about 64,000 visitors per year over the 5-year period (IEc 2014). At Ocean City State Park, visitation has averaged 397,600 per year between 2004 and 2013, peaking at 602,800 in 2012.
7.2.5 Ocean Shores Area
Communities
Ocean Shores, with a population of 5,569 in 2010, is the largest city in what is considered the North Beach area that extends north from Ocean Shores to Moclips. The city provides shopping and consumer services for visitors along this portion of the Washington coastline. In addition to an extensive retail district that includes antique ships, gift stores, and other specialty shops, the city offers a movie theater complex, bowling alley, and golf course (Ocean Shores Publishing 2015). Additionally, a 30,000-square-foot convention center provides conference and meeting space. Several hotels, inns, condominium resorts, and restaurants are available in Ocean Shores to accommodate visitors, including the Best Western Lighthouse Suites Inn, the Canterbury Inn, the Floating Feather Inn “On the Grand Canal,” the Polynesian Condominium Resort, the Quality Inn Ocean Shores, the Ramada Ocean Shores, and the Shilo Inn Suites Hotel (AAA Publishing 2014). Accommodations and gaming are also available at the nearby Quinault
WDFW 2015
Razor clam
7-14 | Recreation and Tourism Washington Coastal Marine Advisory Council

Economic Analysis to Support Marine Spatial Planning in Washington
Beach Resort and Casino. Additionally, the RV park located at the Ocean Shores Marina provides 99 RV sites with full hookups.
According to U.S. Census Bureau data (2015), an average of 645 (34.4 percent) of Ocean Shore’s 1,876 employed residents 16 years of age or older were employed in the retail, arts, entertainment, recreation, accommodation, and food services sectors annually between 2009 and 2013 (Table 7-1).
It should be noted that a community similar to, but smaller than, Seabrook (described above) and planned around new urban principles has been proposed for development in Ocean Shores (IEc 2014).
Recreation Resources and Tourism Activities
Ocean Shores is located on a 6-mile-long peninsula bordered by the Pacific Ocean and Grays Harbor. Ocean Shores is a popular resort area. More than 6 miles of sandy beach and a network of freshwater lakes and canals lend themselves to swimming, fishing, clamming, and kayaking (AAA Publishing 2014). Other activities available in the area include crabbing, beachcombing, kiting, horseback riding, bird watching, sightseeing, surfing and boogie boarding, whale watching, storm watching, golfing, biking, and shopping (Ocean Shores Publishing 2015). In Ocean Shores, access to the beach is provided at 0.7-mile intervals throughout the municipality’s 5-mile beachfront (IEc 2014).
The Ocean Shores Marina is located at the tip of the peninsula at Grays Harbor. Ocean-bound boats can launch and charter fishing trips depart from the marina (AAA Publishing 2014). Although small in comparison to Westport, the marina is home to several private fishing and crabbing boats. It is also the departure point for the passenger ferry El Matador, which makes scheduled trips to and from Westport from Memorial Day through Labor Day (Ocean Shores Publishing 2015). An RV park is also at the marina.
The Ocean Shores area has two notable bird watching resources. Damon Point, at the southern tip of the peninsula, is considered one of the Pacific Northwest’s premier sites for bird watching (AAA Publishing 2014) and is one of the few nesting sites for snowy plover. Oyehut Wildlife Recreation Area, located just north of Damon Point State Park, is another bird watching area. Blue herons, brown pelicans, pheasants, snowy plovers, and other species of birds can be spotted on the 682 acres of protected land (Ocean Shores Publishing 2015).
In addition to these two areas, the North Jetty, located at the southwestern tip of the peninsula, draws tourists and local residents to this area for sightseeing and ocean viewing. Jetty surf fishing for salmon and perch, surfing, and kite flying are available here (Ocean Shores Publishing 2015). Parking and public restrooms are also available.
The Quinault Beach Resort and Casino, owned and operated by the QIN, is located north of Ocean Shores in an area that offers beachside activities such as horseback riding, kite flying, beachcombing, and relaxing in ocean-view rooms. The beachside resort includes a full-service casino, conference facilities, RV parking, numerous dining options, and a spa (Quinault Beach Resort 2014).
Washington Coastal Marine Advisory Council Recreation and Tourism | 7-15

Economic Analysis to Support Marine Spatial Planning in Washington
The North Beach SCA, which includes 22 miles of Pacific Ocean shoreline stretching approximately from Moclips to Point Brown, attracted an average of 2,332,100 visitors per year between 2004 and 2013, with visitation peaking at 2,636,600 in 2010 (IEc 2014). Over the same period, annual visitation to the North Jetty OBA, which provides ocean access at Point Brown, averaged 537,900 visitors, peaking at 678,700 in 2010.
7.2.6 Grays Harbor Port Area (including Hoquiam, Aberdeen, and Cosmopolis)
Communities
Hoquiam and Aberdeen border each other but maintain separate identities. The economies of both cities have historically been driven by the logging and fishing industries, although tourism has become more of regional focus in recent years (City of Aberdeen 2015). With a population of 8,726 in 2010, Hoquiam is the smaller of the two communities but sponsors several tourism-related events, including the Shorebird Festival and the Logger’s Playday; other visitor attractions include the Polson Museum and the 7th Street Theater, a historical theater seating 1,100 people for concerts and plays (Grays Harbor Tourism 2015). The Hoquiam Castle Bed & Breakfast, constructed in 1897 and located a short distance from the theater, is open for tours. Downtown Hoquiam offers restaurants and shops for visitors. Traveler accommodations include the EconoLodge Inn & Suites and the Hoquiam River RV Park (Greater Grays Harbor 2015). According to U.S. Census Bureau data (2015), an average of 718 (23.7 percent) of Hoquiam’s 3,028 employed residents 16 years of age or older were employed in the retail, arts, entertainment, recreation, accommodation, and food services sectors annually between 2009 and 2013 (Table 7-1).
Aberdeen, with a population of 16,896 in 2010, is home to the Port of Grays Harbor. Once the leading export port for U.S. grown timber, Grays Harbor now leads the United States in exports of American-grown soybean meal and is the number one seafood landing point in Washington State (The Port of Grays Harbor 2015). While forest products remain an important piece of the Grays Harbor cargo mix, the port has substantially diversified the products shipped through this Pacific Northwest gateway to include automobiles, biodiesel, and other liquid and dry bulk products. Several motels, B&Bs, inns, and restaurants are available to visitors, including Grays Harbor Inn & Suites, A Harbor View Inn, Central Park Motel, and Olympic Inn Motel (Greater Grays Harbor 2015). According to U.S. Census Bureau data (2015), an average of 1,619 (25.6 percent) of Aberdeen’s 6,326 employed residents 16 years of age or older were employed in the retail, arts, entertainment, recreation, accommodation, and food services sectors annually between 2009 and 2013 (Table 7-1).
Smaller communities along the north shore of Grays Harbor include Chenois Creek, Gray Gables, and Grays Harbor City. Cosmopolis, located inland from Aberdeen along the Chehalis River, is somewhat larger than these communities, with a 2010 population of 1,649 persons. Situated along US 101, Cosmopolis likely benefits from visitors traveling to the Grays Harbor area, the Pacific Coast, and Olympia National Park.
7-16 | Recreation and Tourism Washington Coastal Marine Advisory Council

Economic Analysis to Support Marine Spatial Planning in Washington
Recreation Resources and Tourism Activities
The Grays Harbor Port Area includes the northern shoreline of Grays Harbor and the mouth of the Chehalis and Wishkay Rivers as they empty into the harbor. Traveling east from the Pacific coastline toward Hoquiam and Aberdeen on SR 109, the most notable recreation and tourism resource is the Grays Harbor National Wildlife Refuge, where hundreds of thousands of shorebirds stop over on the refuge’s muddy tidal flats during their spring and fall migrations (Grays Harbor Tourism 2015). An 1,800-foot boardwalk provides access for viewing birds at the refuge.
Aberdeen is home to two tall sailing ships (Lady Washington and Hawaiian Chieftain) that are available for tours and local sailing excursions (AAA Publishing 2014). These are owned and operated by Grays Harbor Historical Seaport Authority, a nonprofit entity. The Lake Aberdeen fish hatchery, located 3 miles east of the city, offers guided tours by appointment. Aberdeen is also a large regional retail center, benefiting from recreationists and tourists traveling to the North Beach Area (e.g., Ocean Shores) or to Westport. Aberdeen receives some visitation related to its reputation as the birthplace and hometown of Nirvana frontman Kurt Cobain.
Activities available to recreationists and tourists in the Grays Harbor Port Area include beachcombing, bird watching, kayaking, and hiking (City of Aberdeen 2015).
7.2.7 Westport Area (including Markham, Ocosta, Bay City, and Grayland)
Communities
Several small communities lie along SR 105 between Aberdeen and Westport, as the highway skirts the southern part of Grays Harbor. These communities include Markham, Ocosta, and Bay City. Population data are only available for Markham, which had a population of 111 in 2010. These small communities likely benefit from the spending of visitors traveling to Bottle Beach State Park, Westport, the Pacific coastline, and other state parks in the vicinity of Westport and Grayland. For example, according to U.S. Census Bureau (2015) data available for the Markham CDP, an average of 27 (42.2 percent) of Markham’s 64 employed residents 16 years of age or older were employed in retail, arts, entertainment, recreation, accommodation, and food services sectors annually between 2009 and 2013.
Westport, with a population of 2,099 in 2010, is a popular destination for tourists and saltwater sport anglers, as described previously. Nearly a dozen charter boat operators provide guided fishing trips from Westport (AAA Publishing. 2014). Recreationist and tourist-serving business in Westport include bait and tackle shops, a surf shop, several restaurants, and specialty shops (Westport-Grayland Chamber of Commerce and Visitor Center 2015). Visitor accommodations in Westport are extensive, including at least 21 motels, hotels, resorts, B&Bs, vacation condominiums, RV parks, and vacation rental agencies (Westport-Grayland Chamber of Commerce and Visitor Center 2015). Several restaurants and other tourist-serving businesses are also located in Westport. According to U.S. Census Bureau data available
(cc) John Lloyd 2009
Lady Washington in Aberdeen
Washington Coastal Marine Advisory Council Recreation and Tourism | 7-17

Economic Analysis to Support Marine Spatial Planning in Washington
for Westport (U.S. Census Bureau 2015), an average of 112 (17.2 percent) of Westport’s 652 employed residents 16 years of age or older were employed in retail, arts, entertainment, recreation, accommodation, and food services sectors annually between 2009 and 2013.
Located on the Pacific Ocean coastline south of Westport on a stretch of beach known as the Cranberry Coast, Grayland provides additional tourist services, along with hosting an annual cranberry harvest festival. With a 2010 population of 953, the small resort community offers accommodations through the Ocean Spray Beach Resort, the Grayland Motel & Cottages, the South Beach RV Park, the Kenanna RV Park, and several vacation rental properties (Westport-Grayland Chamber of Commerce and Visitor Center 2015). As discussed previously, camping is available at nearby Twin Harbors State Park and Grayland Beach State Park. According to U.S. Census Bureau data available for the Grayland CDP (U.S. Census Bureau 2015), an average of 87 (33.3 percent) of Grayland’s 261 employed residents 16 years of age or older were employed in retail, arts, entertainment, recreation, accommodation, and food services sectors annually between 2009 and 2013.
Recreation Resources and Tourism Activities
As visitors travel west from the Grays Harbor Port area, SR 105 takes them along southern Grays Harbor to Westport and the Pacific Coast shoreline. Most of the recreation and tourism resources available in this area are located in the vicinity of Westport and Grayland. Westport is located on a peninsula on the south side of the entrance to Grays Harbor from the Pacific Ocean, at the end of an 18-mile long-beach popular for surf fishing, clam digging, crabbing, wading, and sightseeing (AAA Publishing 2014). Surfing occurs south of the Westport jetty and in the harbor at Half Moon Bay and the groynes. Other recreation and tourism activities in and around Westport include visiting antique stores and the aquarium, walking and sightseeing on the local beaches, bird watching at the tidal flats and sand dunes, walking along the boardwalk at the Westport Marina, hiking on the Dune Trail to the lighthouse at Westport Light State Park, fishing at the boat basin, boogie boarding, and digging for razor clams on nearby beaches (WestportWa.com. 2015).
The Westport Marina, with 600 slips, is the largest coastal marina in the Pacific Northwest and provides a base for the state’s largest charter fishing fleet (The Port of Grays Harbor 2015a). The marina is home to a large commercial fishing fleet and several recreational charter fishing vessels that provide opportunities for salmon, halibut, bottomfish, cod and tuna fishing, as well as whale watching tours (The Port of Grays Harbor 2015b). The marina also provides a public boat ramp and guest boat moorage. Crabbing and pier fishing are also available to the public from the Westport fishing boardwalk. About 5 miles south along the Pacific coastline, the resort community of Grayland provides similar beach-based resources, including clamming opportunities, beachcombing, and bird watching.
Several state parks are located in the Westport area (Table 7-3):
Bottle Beach State Park, located east of Westport near the small community of Ocosta, is a 75-acre day-use park with 6,000 feet of shoreline on Grays Harbor. Wildlife viewing and bird watching are available, along an interpretive trail and from viewing platform and blinds. Large numbers of migratory waterfowl use the area, and 130 species of birds have been observed at Bottle Beach,
7-18 | Recreation and Tourism Washington Coastal Marine Advisory Council

Economic Analysis to Support Marine Spatial Planning in Washington
which has been designated an Important Bird Area by the Audubon Society (Washington State Parks 2015c).
Westhaven State Park, located on the peninsula north of Westport, is a 79-acre day-use park with 1,215-feet of shoreline on the Pacific Ocean and Half Moon Bay, with beach access to both shores. Sitting along the South Jetty, the park is a popular destination for surfing and fishing (Washington State Parks 2015d). A concrete boardwalk connects the park with Westport Light State Park, 1.3 miles away.
Westport Light State Park is a 212-acre day-use park on the shore of the Pacific Ocean. The Westport Lighthouse, for which the park was named, stands on adjacent U.S. Coast Guard property (Washington State Parks 2015e). This park offers a panoramic view of the Pacific Ocean and easy pedestrian access to the beach.
Twin Harbors State Park is a 172-acre camping park on the Pacific Coast, south of Westport. Camping opportunities include 219 tent sites, 42 utility sites, one group camping site, and two yurts (Table 7-3). Beach activities predominate at this state park, including kite flying, surf fishing, and beachcombing (Washington State Parks 2015f).
Grayland Beach State Park is a 412-acre, year-round, marine camping park with 7,449 feet of ocean frontage, just south of Grayland (Washington State Parks 2015g). The park attracts kite flyers, kite-flying observers, and those who enjoy beach activities. The park offers 55 full-hookup campsites that are within easy walking distance of the ocean. Five short, marked trails lead from the campground to the beach. Activities at the park include clamming, crabbing, saltwater fishing, beach exploration, and bird watching.
According to WSPRC visitation data (IEc 2014), visitation is significant for several of the state parks in the Westport Area. Annual visitation at Bottle Beach State Park averaged 85,300 between 2009 and 2013, with peak visitation of 114,600 in 2013. At Westhaven State Park, annual visitation average 499,900 between 2004 and 2013, peaking at 953,100 in 2008. At Westport Light State Park, just south of Westhaven, annual visitation over the same 10-year period averaged 272,000, including a peak of 455,800 visitors in 2009. Annual visitation at Twin Harbors State Park averaged 311,700 over the 10-year period, with a peak of 466,300 in 2013. Farther down the coast at Grayland Beach State Park, annual visitation averaged 285,700, peaking at 466,300 in 2013. Additionally, WSPRC visitation data are available for the South Beach SCA, which includes 19 miles of Pacific Ocean shoreline stretching from Grays Harbor to Willapa Bay. The South Beach SCA attracted an average of 1,017,100 visitors per year between 2004 and 2013, with visitation peaking at 1,333,481 in 2011.
© Michael D Martin 2008
Grays Harbor Lighthouse in Westport Light State Park
Washington Coastal Marine Advisory Council Recreation and Tourism | 7-19

Economic Analysis to Support Marine Spatial Planning in Washington
7.3 SOUTHERN WASHINGTON COAST (WILLAPA BAY/LONG BEACH PENINSULA, INCLUDING THE
COASTAL PORTION OF PACIFIC COUNTY)
The Willapa Bay/Long Beach Peninsula region includes Willapa Bay and the coastline of Pacific County. Similar to the coastline of Grays Harbor County, the Pacific County coastline features long sandy beaches, with access generally available from state highways and local roads. Additionally, the Long Beach Peninsula offers access to the protected, calmer waters of Willapa Bay, where water sports such as kayaking, windsurfing, and paddle-boarding are popular (IEc 2014). Willapa Bay also supports an economically important oyster industry. Developed areas in this region include the communities of Tokeland, Raymond, South Bend, Chinook, Ilwaco, Seaview, Ocean Park, Nahcotta, and several smaller communities. Additionally, the Shoalwater Bay Reservation is located on the north shore of Willapa Bay. Key recreation sites in the Willapa Bay/Long Beach Peninsula region are identified in Table 7-4.
Table 7-4 Key Recreation Sites in the Willapa Bay/Long Beach Peninsula Region (Pacific County)
Shoalwater Bay Indian Tribe:
Shoalwater Bay Casino (located at Tokeland)
Federal Wildlife Refuges: Willapa Bay National Wildlife Refuge
State Parks: Ledbetter Point (day use) Pacific Pines (day use) Loomis Lake (day use) Cape Disappointment (137 standard campsites, 78 utility
campsites, 14 yurts, 5 primitive campsites, 3 cabins, 1 boat ramp) Fort Columbia (2 vacation houses)
Coastal Communities: North Cove/Tokeland Raymond/South Bend/Bay Center Seaview/Long Beach Chinook Ilwaco Ocean Park/Nahcotta
Source: IEc 2014.
Willapa Bay National Wildlife Refuge is located adjacent to Willapa Bay, with units in several locations, including the northern tip of the Long Beach Peninsula on Long Island and along areas of Shoalwater Bay. The refuge encompasses diverse ecosystems, including salt marsh, muddy tidelands, forest, freshwater wetlands, streams, grasslands, coastal dunes, and beaches. This diversity supports a variety of recreational activities, including wildlife viewing, hiking, hunting, boating from boat launches at the refuge, photography, fishing, and shellfish harvesting (U.S. Fish and Wildlife Service 2015). A recent study evaluated the economic impact of visits to the Willapa Bay National Wildlife Refuge (IEc 2014). Based on refuge visitation estimated at 114,680 visits in 2011, the annual spending associated with refuge visitation
7-20 | Recreation and Tourism Washington Coastal Marine Advisory Council
Economic Analysis to Support Marine Spatial Planning in Washington
totaled an estimated $1.8 million, adding an estimated 21 jobs, $720,000 in labor income, and $2.6 million in final demand to the region’s economy.
In addition to the refuge, several state parks are located in the Willapa Bay/Long Beach Peninsula region. From north to south, these parks are Ledbetter, Pacific Pines, and Loomis Lake State Parks, all located on Long Beach Peninsula; and Cape Disappointment and Fort Columbia State Parks, located near the mouth of the Columbia River. Tourism in Pacific County, which is largely driven by its coastal resources, generates substantial economic benefits to the county. In 2009, visitor-related travel expenditures totaled an estimated $120.2 million in Pacific County (Dean Runyan Associates 2011). This spending supported an estimated 2,060 jobs (direct, indirect, and induced), representing 22 percent of countywide employment, the largest percentage among the state’s counties. According to data on the ocean economy available from NOEP, the recreation and tourism sector contributed 728 jobs to the Pacific County economy and helped to support 112 business establishments in 2010 (IEc 2014). (Note: Ocean economy data include only ocean-related activities and industries compiled from the databases of the U.S. Bureau of Labor Statistics.)
7.3.1 North Cove/Tokeland Area
Communities
North Cove and Tokeland are the primary communities in the northern part of Willapa Bay. Perched above the shore of the rapidly eroding Cape Shoalwater, North Cove is a small community that has been slowly losing homes and businesses to beach erosion for decades (Chinook Observer 2014). Including the nearby Shoalwater Bay Reservation, the North Cove area currently has a population of 415, but as more homes are lost to erosion, the future population is uncertain. The Shoalwater Bay Reservation reportedly had a 2010 population of 82 tribal members living on the reservation (Port of Willapa Harbor 2015a). In addition to the Shoalwater Bay Casino facilities on the reservation, the Tribe operates a health clinic.
Tokeland, with a population of 417, is a traditional fishing community that has become more oriented toward tourism over the years (Port of Willapa Harbor 2015a). Marine facilities at the Port of Willapa Harbor include two seafood servicing businesses and an RV park. A fish processing plant is located nearby. Tourist-serving businesses include the historic Tokeland Hotel & Restaurant, Tradewinds-on-the-Bay, My Suzie’s RV Park, and Bayshore RV Park, as well as several restaurants and specialty shops (Tokeland-North Cove Chamber of Commerce, Westport-Grayland Chamber of Commerce, and Cranberry Coast Chamber of Commerce 2015).
Washington Coastal Marine Advisory Council Recreation and Tourism | 7-21
Economic Analysis to Support Marine Spatial Planning in Washington
Recreation Resources and Tourism Activities
The North Cove/Tokeland Area takes in Cape Shoalwater and the north shore of Willapa Bay and includes the Shoalwater Bay Reservation. Over decades, substantial erosion of the beaches at the mouth of Willapa Bay near North Cove has limited tourism-related development. The focus of recreation and tourism-related activities is now Tokeland and Toke Spit, a 3-mile-long spit extending into Willapa Bay (AAA Publishing 2014). Recreation resources in the Tokeland area include sandy beaches and destinations such as the historic Tokeland Hotel and the Tokeland Marina, which is operated by the Port of Willapa Harbor. The marina offers recreational and commercial moorage, a boat ramp, and a pier for public fishing and bird watching (Port of Willapa Harbor 2015a). In addition to sport fishing, boating, and wildlife viewing, recreational opportunities in the Tokeland area include clam digging, crabbing, surfing, and beachcombing (Tokeland-North Cove Chamber of Commerce 2015).
The Shoalwater Bay Tribe operates the Shoalwater Bay Casino, located near Tokeland on the north rim of Willapa Bay. The resort includes 17 suites, as well as a small casino, restaurant, gift shop, and gas station near the beach (Shoalwater Bay Casino 2015).
7.3.2 Raymond/South Bend/Bay Center Area
Communities
The City of Raymond, with a 2010 population of 2,975, is largely supported by an economy that is based on logging and fishing, along with a limited amount of tourism (Wikipedia 2015g). Industrial uses at the Raymond Port Dock are also important contributors to the city’s economy. Based on the Willapa Harbor Chamber of Commerce visitor directory, visitor-serving accommodations and restaurants in Raymond are limited, although additional facilities are available in nearby South Bend (Willapa Harbor Chamber & Visitor Kiosk 2015). According to U.S. Census Bureau data available for the City of Raymond (U.S. Census Bureau 2015), an average of 145 (14.3 percent) of Raymond’s 1,016 employed residents 16 years of age or older were employed in the retail, arts, entertainment, recreation, accommodation, and food services sector each year between 2009 and 2013 (Table 7-1). Raymond also has a small but well regarded maritime museum, the Willapa Seaport Museum (K. Krueger, pers. comm., 2015).
South Bend, located on the southern side of the Willapa River across from Raymond with a population of 1,637, is widely known for its oyster processing industry and for the scenery at the entrance to Willapa Harbor. Tourist accommodations in South Bend include Chen’s Motel & Restaurant, the Seaquest Motel, and the Cabin at Willapa Bay (Willapa Harbor Chamber & Visitor Kiosk 2015). The Willapa Restaurant & Lounge is also available to visitors. According to U.S. Census Bureau data available for the City of South Bend (U.S. Census Bureau 2015), an average of 73 (11.3 percent) of South Bend’s 646 employed residents 16 years of age or older were employed in the retail, arts, entertainment, recreation, accommodation, and food services sectors annually between 2009 and 2013 (Table 7-1).
7-22 | Recreation and Tourism Washington Coastal Marine Advisory Council

Economic Analysis to Support Marine Spatial Planning in Washington
Bay Center, located 16 miles southwest of Raymond and South Bend, had a 2010 population (within the Bay Center CDP area) of 276 persons. The unincorporated residential community is home to several commercial oyster-growing operations. Additionally, facilities at the Port of Willapa Harbor in Bay Center accommodate a thriving shellfish and crabbing industry (Port of Willapa Harbor 2015b). Based on the Willapa Harbor Chamber of Commerce visitor directory, visitor-serving accommodations and restaurants in Bay City are limited, although facilities are available in South Bend and in communities along the Long Beach Peninsula; the Bay Center/Willapa Bay KOA provides camping and RV facilities in Bay Center (Willapa Harbor Chamber & Visitor Kiosk 2015).
Other nearby communities on Willapa Bay include Nemah and Johnson’s Landing, both located south of Bay Center on US 101. Nemah is a small farming community, and the Nemah Salmon Hatchery is located near the community and offers visitor tours. Johnson’s Landing is a very small community located just south of Nemah.
Recreation Resources and Tourism Activities
Raymond and South Bend are situated along the Willapa River on US 101, adjacent to Willapa Harbor. Proximity to the harbor and to Willapa Bay provide opportunities for water-based recreation, such as paddling and bird watching along water trails and in the bay (Willapa Harbor Chamber & Visitor Kiosk 2015). The Raymond Dock, which is operated by the Port of Willapa Harbor, primarily serves commercial vessels and commercial/industrial tenants; however, public fishing is available from the dock and moorage is available to recreational boats (Port of Willapa Harbor 2015b). The Willapa Hills trail traverses the entire length of the port dock along US 101 as part of its 57-mile route between Raymond/South Bend and Chehalis. Nearby, visitors can access viewing sites for the Lewis & Clark Trail and visit inland waterfalls, rivers, and streams (Willapa Harbor Chamber & Visitor Kiosk 2015). South Bend offers a recreational dock and boat launch that support canoeing, kayaking, boating, and fishing in Willapa Bay and in the Willapa River system (City of South Bend 2015). South Bend also has a large shellfish industry that attracts visitors.
Bay Center and other communities in the area benefit from the regional recreational and tourist resources that draw visitors to the region, including Willapa National Wildlife Refuge, tourist attractions on the Long Beach Peninsula, and coastal state parks. The Bay Center Marina provides boating opportunities in Willapa Bay, but the marina primarily serves the commercial fishing and aquaculture industries (Port of Willapa Harbor 2015b).
7.3.3 Ocean Park/Nacotta Area
Communities
Ocean Park CDP, with a population of 1,573 in 2010 (U.S. Census Bureau 2015), is a small resort community known for its oysters and recreation opportunities. According to the U.S. Census Bureau (2015), approximately 80 (about 31 percent) of the 261 employed residents 16 years of age or older are employed in tourist-sensitive industries (Table 7-1). Tourist accommodations include Westgate Cabins and RV Park, Blackwood Beach Cottages, The DoveShire Bed and Breakfast, Bloomer Estates Admiral
Washington Coastal Marine Advisory Council Recreation and Tourism | 7-23
Economic Analysis to Support Marine Spatial Planning in Washington
House, Evergreen Court & Trailer Park, Campbell House at Klipsan Beach, Shakti Cove Cottages, Black Bear Beach Camp, Ocean Park Resort, Moby Dick Hotel, Surfside Inn, Harbor View Motel, and Klipsan Beach Cottages.
Recreation Resources and Tourism Activities
The small communities of Ocean Park and Nahcotta are located a few miles north of the community of Long Beach. Nahcotta is home to the Port of Peninsula, which contains 90 slips and a public boat launch. The port serves both commercial and recreational uses, with 15 oyster dredges, a gillnet fleet, and crab operations (Port of Peninsula 2015). The Port of Peninsula also sponsors the Willapa Bay Oyster House Interpretive Center. Nearby Loomis Lake State Park is a 326-acre park with 24 picnic sites, a 67-car parking lot, and a trail to the beach. Other tourist attractions include the Northwest Garlic Festival, Jazz and Oysters, 4th of July Parade, and Beach Barons Car Club Rod Run in Ocean Park, as well as the Great Washington Birding Trail and the historic nearby town of Oysterville (Ocean Park Chamber of Commerce 2015).
7.3.4 Seaview/Long Beach Area
Communities
In 2010, Seaview had a population of 473 and the City of Long Beach had a population of 1,392. According to the U.S. Census Bureau (2015), of the 578 people employed in the Long Beach CDP, 212 (about 37 percent) were employed in tourist-sensitive businesses. The Long Beach Peninsula has many options for travel accommodations, especially compared to more rural parts of the Washington coast. Accommodations in Seaview/Long Beach include The Breakers, Chautauqua Lodge, Anchorage Cottages, Enchanted Cottages, Mermaid Inn and RV Park, Crow’s Nest RV Park beach, Boreas Bed & Breakfast, Bloomer Estates, The Shelburne Inn, Our Place at the Beach, Cedars Ocean View Inn, the Worldmark Club at Long Beach, Adrift Hotel, Inn at Discovery Coast, Hackney Cottage, A Rendezvous Place Bed & Breakfast, The Swan, Sou’wester Lodge and Cabins, and Seaview Motel and Cottages.
Recreation Resources and Tourism Activities
The communities of Seaview and Long Beach are located a few miles north of Ilwaco along US 101 and SR 103 on the Long Beach Peninsula. The peninsula is a popular area for razor clam digging, and the Razor Clam Festival is held annually in April in Long Beach. According to the Washington Department of Fish and Wildlife (WDFW), more than 6 million razor clams were harvested along the Washington coast in 2014. WDFW regulates the days on which digging is allowed; in 2015, the season was closed early due to high levels of domoic acid. Closure of the clam digging season during the 2002-03 season was estimated to represent a $10.4 million loss to the economies of Washington’s coastal communities (Washington Department of Fish and Wildlife 2015).
The World Kite Museum & Hall of Fame, Cranberry Museum, and Marsh’s Free Museum are located in the Seaview/Long Beach area. The area also is home to the Peninsula Golf Course; numerous pubs, eateries, and tourist-orientated shops are located along US 101. Other tourist attractions on the Long
7-24 | Recreation and Tourism Washington Coastal Marine Advisory Council

Economic Analysis to Support Marine Spatial Planning in Washington
Beach Peninsula include several kite-flying festivals, crab feeds, SummerFest, the Doggie Olympic Games, a half marathon/5k/10k race, the Columbia Pacific Farmers Market, events with sanctioned fireworks, fall wild mushroom harvesting events, and rodeos (Long Beach Peninsula Visitor’s Bureau 2014).
7.3.5 Ilwaco Area
Communities
Ilwaco, with a population of 936 in 2010, is a working fishing community that is home to a large commercial fishing fleet and several charter fishing operators. The city’s economy also benefits from its reputation as a popular sport fishing destination and from local and regional tourism. As discussed previously, the Port of Ilwaco provides extensive facilities for both commercial and sport fishermen. Ilwaco also provides a variety of accommodations for visitors. In addition to vacation rentals, accommodations include Heidi’s Inn; Inn at Harbour Village; Col-Pacific Motel; China Beach Retreat; Harbor Lights Motel, Restaurant, and Lounge; Eagle’s Nest Resort; and 101 Haciendas Motel (Ilwacowashington 2015).
Recreation Resources and Tourism Activities
Ilwaco, which is located at the south end of Long Beach Peninsula, is situated on Baker Bay just inside the mouth of the Columbia River. Ilwaco has excellent boating access to both the river and the Pacific Ocean. The town is a popular sport fishing port, with charter operators specializing in guided fishing trips for salmon, halibut, tuna, bottomfish, sea bass, lingcod, and sturgeon (AAA Publishing 2014). Ilwaco’s sport fishing industry is supported by the Port of Ilwaco, which provides an 800-slip marina used by both recreational boaters and commercial fishermen (The Port of Ilwaco 2015). Guest moorage is available year-round at the marina. Other facilities provided by the port include a boat launch, two small boat hoists, and two fuel docks. Several businesses are located at the port, including boat repair and related businesses. The Columbia Pacific Heritage Museum, which depicts frontier life in southwest Washington, is also available to visitors.
In addition to Willapa National Wildlife Refuge, Cape Disappointment State Park attracts recreationists and visitors to the Ilwaco area. Located about 3 miles southwest of Ilwaco, the park offers camping, 2 miles of beachfront, two lighthouses, and the Lewis and Clark Interpretive Center. Cape Disappointment has 137 standard campsites, 60 full hookup sites, 18 sites with water and electricity only, five primitive hiker/biker campsites, 14 yurts, and three cabins (Washington State Parks 2015i). Camping is available year-round. Three vacation rentals also are provided by the park. Other facilities include picnic tables, a dock, a boat launch, and 8 miles of hiking trails. Besides camping and visiting the park’s two historic lighthouses and the interpretive center, opportunities at the park include beachcombing, kayaking, bird watching, boating, saltwater and freshwater fishing, crabbing, and clamming.
According to WSPRC data (IEc 2014), annual visitation at Cape Disappointment State Park ranged from 571,200 to 1,078,000 over the 2004-2013 period, averaging 980,700 visitors annually.
Washington Coastal Marine Advisory Council Recreation and Tourism | 7-25
Economic Analysis to Support Marine Spatial Planning in Washington
7.3.6 Chinook Area
Communities
The community of Chinook is a fishing village with a busy port on the Columbia River. The Chinook CDP had a 2010 population of 466 persons. Based on a review of internet travel sites, visitor accommodations appear to be limited in Chinook, with the exception of the River’s End Campground. Accommodations and other visitor services, however, are readily available in nearby Ilwaco. According to U.S. Census Bureau data available for the Chinook CDP (U.S. Census Bureau 2015), an average of 6 (7.7 percent) of Chinoook’s 78 employed residents 16 years of age or older were employed in the retail, arts, entertainment, recreation, accommodation, and food services sectors annually between 2009 and 2013 (Table 7-1).
Recreation Resources and Tourism Activities
Chinook is located on US 101 at the mouth of the Columbia River. Access to the Columbia River and the Pacific Ocean for boating and fishing is provided by the Port of Chinook and its marina. The port accommodates both commercial and sport fishing vessels ranging from 16 to 60 feet in length; facilities include 300 boat slips, a boat launch and boat hoist, a fueling facility, and a cannery (Pacific County Economic Development Council 2015). The port also accommodates charter fishing operators.
Fort Columbia State Park is located immediately east of the community of Chinook. The day-use park provides an interpretive center, restored historic barracks, gun emplacements and batteries, picnicking facilities, two historic vacation houses for overnight stays, and a 5-mile forested hiking trail (Washington State Parks 2015h). In addition to hiking, picnicking, and sightseeing, outdoor recreation opportunities at the park include bird watching and wildlife viewing.
According to WSPRC data (IEc 2014), visitation at Fort Columbia State Park, including vacation housing users, ranged from 68,100 to 134,900 per year over the 2004-2013 period, averaging 112,800 visitors annually.
7.4 OUTDOOR RECREATION VISITATION ALONG THE WASHINGTON COAST
During 2014 and early 2015, an internet-based survey of residents of Washington State was conducted by Point 97 and the Surfrider Foundation to establish recreation and tourism baseline conditions. The two-part survey consisted of an internet panel survey focused on recreation trips to the Washington coast over the previous 12 months and an “opt-in” survey focused on participation in specialized recreational activities along the coast.
The internet panel survey was conducted in two survey waves, between June 2014 and February 2015, and gathered more than 6,100 survey responses. The results of the survey, which were extrapolated to the Washington State population, are presented in a May 2015 report (Point 97 and Surfrider Foundation 2015). Both parts of the survey conducted by Point 97 and the Surfrider Foundation included only residents of Washington State.
7-26 | Recreation and Tourism Washington Coastal Marine Advisory Council

Economic Analysis to Support Marine Spatial Planning in Washington
According to the study’s findings, 41 percent of all respondents reported visiting the Washington coast over the previous 12 months. Most respondents (34 percent) stayed one night on their last trip to the coast, and 26 percent stayed two nights. About 13 percent of respondents went to the coast for day use only. Coastal recreation sites in Pacific and Grays Harbor Counties were visited most frequently, accounting for about 37 percent and 36 percent, respectively, of total coastal recreation trips by state residents.
In terms of recreational activities, the top three activities that survey respondents participated in on their most recent trip were beach going (60.5 percent), sightseeing or scenic enjoyment (57.1 percent), and watching wildlife (35.1 percent). The favorite activities of participants were beach going (32 percent), sightseeing or scenic enjoyment (22.6 percent), camping (11.3 percent), hiking or biking (7 percent), and photography (3.6 percent). During trips to the coast over the previous 12 months, the three most popular activities were beach going (67.7 percent of respondents), sightseeing or scenic enjoyment (62.3 percent), and viewing wildlife (39.9 percent). The magnitude of recreation trips by state residents to different locations along the Washington coast is shown in Figure 7-2.
During respondents’ most recent trip, average spending was estimated to be about $117 per trip. The highest expense was for lodging and/or campsite fees, at an average of $25.96 per trip (this estimate includes both day use and overnight visitors). The most frequently cited expenditure item was car fuel, with 77.1 percent of respondents reporting expenditures, at an average per-trip cost of $24.02 per trip; expenditures for food and beverages at a restaurant or bar averaged $23.95 per trip. The average trip duration was 2.8 days per trip.
As shown in Table 7-5, about 26 percent of state residents who visited only one coastal county on their most recent trip to the Washington coast resided in King County (Figure 7-3), followed by Pierce County (19.2 percent) and Snohomish County (11.3 percent). For multi-county trips to the Washington coast, the same three counties accounted for most of the trips, although residents of King County accounted for an even larger share (34.2 percent) of coastal visitors.
Washington Coastal Marine Advisory Council Recreation and Tourism | 7-27

Economic Analysis to Support Marine Spatial Planning in Washington
Figure 7-2 Location and Magnitude of Recreation Trips to the Washington Coast by State Residents Source: Based on data from Point 97 and Surfrider Foundation 2015
7-28 | Recreation and Tourism Washington Coastal Marine Advisory Council
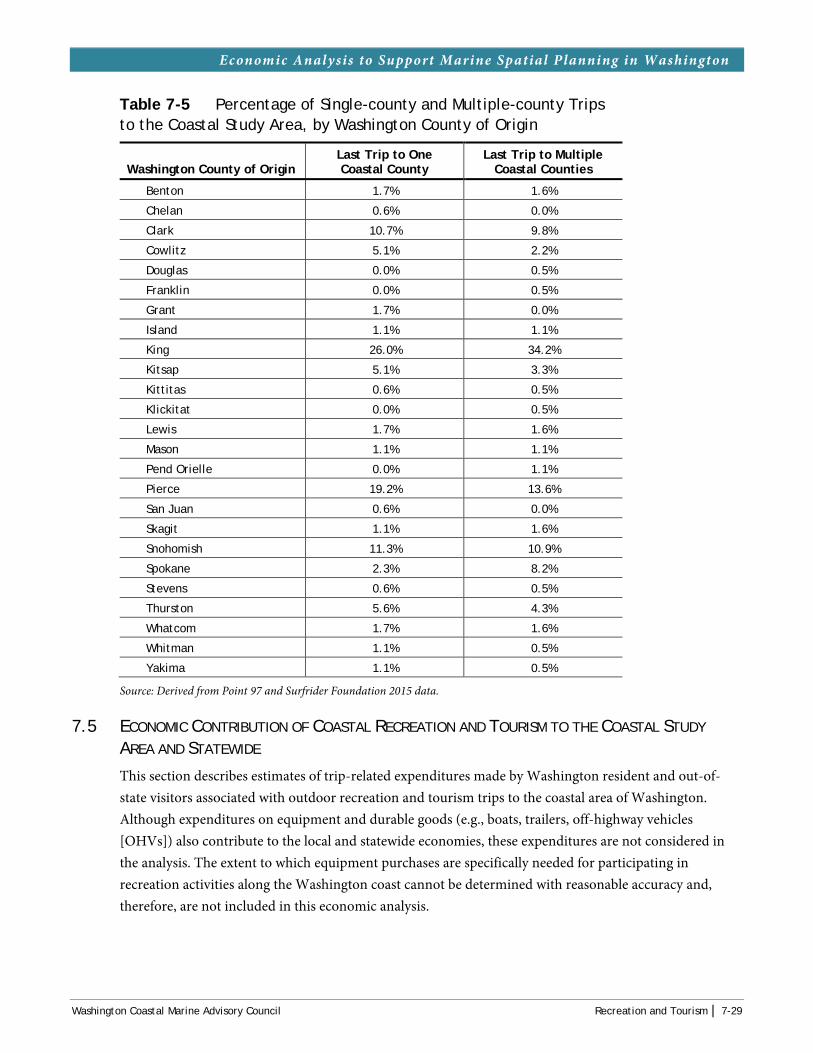
Economic Analysis to Support Marine Spatial Planning in Washington
Table 7-5 Percentage of Single-county and Multiple-county Trips to the Coastal Study Area, by Washington County of Origin
Washington County of Origin Last Trip to One Coastal County
Last Trip to Multiple Coastal Counties
Benton 1.7% 1.6%
Chelan 0.6% 0.0%
Clark 10.7% 9.8%
Cowlitz 5.1% 2.2%
Douglas 0.0% 0.5%
Franklin 0.0% 0.5%
Grant 1.7% 0.0%
Island 1.1% 1.1%
King 26.0% 34.2%
Kitsap 5.1% 3.3%
Kittitas 0.6% 0.5%
Klickitat 0.0% 0.5%
Lewis 1.7% 1.6%
Mason 1.1% 1.1%
Pend Orielle 0.0% 1.1%
Pierce 19.2% 13.6%
San Juan 0.6% 0.0%
Skagit 1.1% 1.6%
Snohomish 11.3% 10.9%
Spokane 2.3% 8.2%
Stevens 0.6% 0.5%
Thurston 5.6% 4.3%
Whatcom 1.7% 1.6%
Whitman 1.1% 0.5%
Yakima 1.1% 0.5%
Source: Derived from Point 97 and Surfrider Foundation 2015 data.
7.5 ECONOMIC CONTRIBUTION OF COASTAL RECREATION AND TOURISM TO THE COASTAL STUDY
AREA AND STATEWIDE
This section describes estimates of trip-related expenditures made by Washington resident and out-of-state visitors associated with outdoor recreation and tourism trips to the coastal area of Washington. Although expenditures on equipment and durable goods (e.g., boats, trailers, off-highway vehicles [OHVs]) also contribute to the local and statewide economies, these expenditures are not considered in the analysis. The extent to which equipment purchases are specifically needed for participating in recreation activities along the Washington coast cannot be determined with reasonable accuracy and, therefore, are not included in this economic analysis.
Washington Coastal Marine Advisory Council Recreation and Tourism | 7-29

Economic Analysis to Support Marine Spatial Planning in Washington
Figure 7-2 Washington State Counties
7.5.1 Trip-Related Expenditures Associated with Recreation and Tourism Activities in the Coastal Study Area
Total trip-related expenditure made by Washington State residents associated with recreation activities in the coastal study area were estimated to be about $481 million in 2014 (Table 7-6). Of this total, an estimated $331 million was made by Washington residents in the coastal study area, and about $150 million was made elsewhere in the state.
7-30 | Recreation and Tourism Washington Coastal Marine Advisory Council

Economic Analysis to Support Marine Spatial Planning in Washington
Table 7-6 Trip-related Expenditures by Washington Residents Associated with Recreation and Tourism Activities in the Washington Coastal Area (2014 dollars)
Item
Trip Spending (average
spending per trip)
Proportion of Per-Trip
Expenditures, by Spending
Category
Total Trip-Related
Spending
WA Residents Living INSIDE the Coastal
Study Area
WA Residents Living OUTSIDE the Coastal
Study Area
Total Recreation-Related Spending by WA
Resident Associated with Coastal Recreation
Inside Coastal Study Area
Elsewhere in WA1
Inside Coastal Study Area
Elsewhere in WA
In the Coastal Study Area
Elsewhere in WA
Lodging/campsite fee $25.96 0.2216 $106,642,069 $4,478,967 $0 $68,857,931 $33,305,171 $73,336,898 $33,305,171
Car fuel $24.02 0.2051 $98,672,670 $4,144,252 $0 $63,712,153 $30,816,264 $67,856,406 $30,816,264
Food and beverages at a restaurant or bar $23.95 0.2045 $98,385,114 $4,132,175 $0 $63,526,481 $30,726,458 $67,658,656 $30,726,458
Food and beverages from a store $14.29 0.1220 $58,702,433 $2,465,502 $0 $37,903,692 $18,333,240 $40,369,194 $18,333,240
Shopping and souvenirs (t-shirts, posters, gifts) $9.87 0.0843 $40,545,348 $1,702,905 $0 $26,179,807 $12,662,636 $27,882,711 $12,662,636
Airline flight $2.43 0.0207 $9,982,289 $419,256 $0 $6,445,484 $3,117,549 $6,864,740 $3,117,549
Charter fee (e.g., whale watching) $2.10 0.0179 $8,626,670 $362,320 $0 $5,570,172 $2,694,178 $5,932,492 $2,694,178
Bus/ferry/train ticket $1.81 0.0155 $7,435,368 $312,285 $0 $4,800,957 $2,322,125 $5,113,243 $2,322,125
Park entrance, museum, aquarium, or other entrance fee $1.51 0.0129 $6,202,986 $260,525 $0 $4,005,219 $1,937,242 $4,265,744 $1,937,242
Other $1.50 0.0128 $6,161,907 $258,800 $0 $3,978,694 $1,924,413 $4,237,494 $1,924,413
Sundries (sunscreen, surf wax, motion sickness pills, batteries, camera data cards) $1.49 0.0127 $6,120,828 $257,075 $0 $3,952,169 $1,911,583 $4,209,244 $1,911,583
Lessons, clinics, camps $1.45 0.0124 $5,956,510 $250,173 $0 $3,846,071 $1,860,266 $4,096,244 $1,860,266
Car rental $1.28 0.0109 $5,258,161 $220,843 $0 $3,395,152 $1,642,166 $3,615,995 $1,642,166
Boat rental $1.07 0.0091 $4,395,494 $184,611 $0 $2,838,135 $1,372,748 $3,022,746 $1,372,748
Parking $1.05 0.0090 $4,313,335 $181,160 $0 $2,785,086 $1,347,089 $2,966,246 $1,347,089
Boat fuel $0.83 0.0071 $3,409,589 $143,203 $0 $2,201,544 $1,064,842 $2,344,747 $1,064,842
Washington Coastal Marine Advisory Council Recreation and Tourism | 7-31
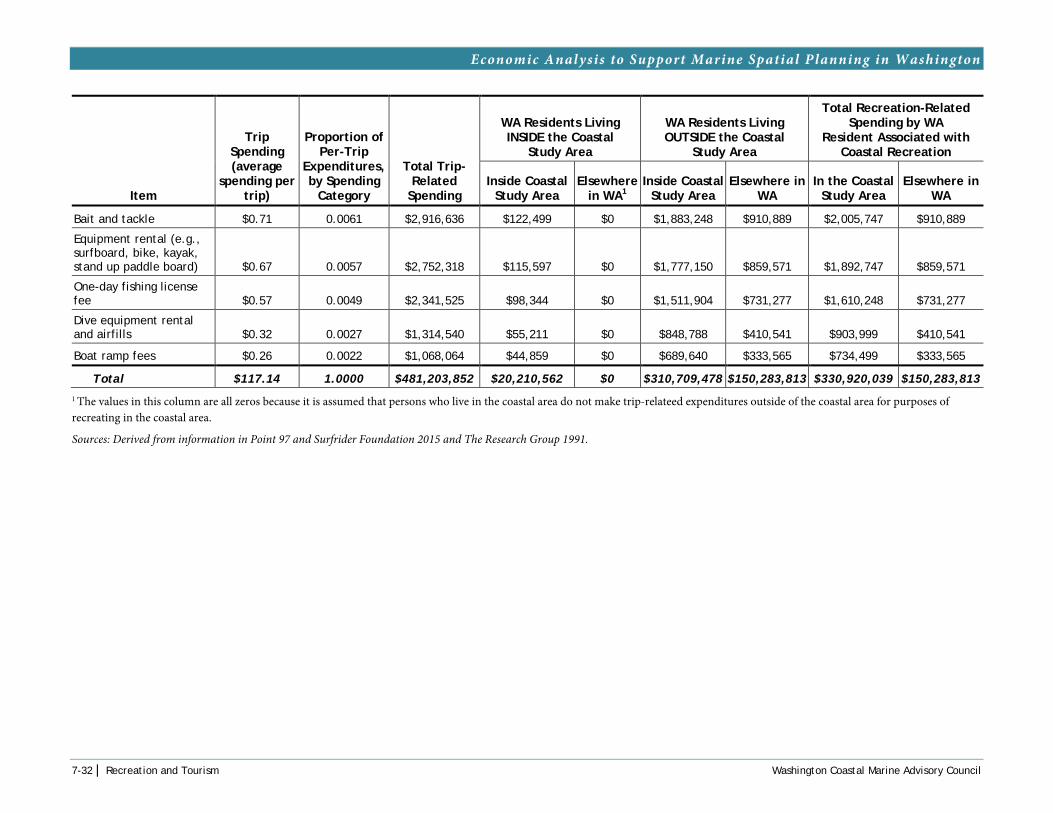
Economic Analysis to Support Marine Spatial Planning in Washington
Item
Trip Spending (average
spending per trip)
Proportion of Per-Trip
Expenditures, by Spending
Category
Total Trip-Related
Spending
WA Residents Living INSIDE the Coastal
Study Area
WA Residents Living OUTSIDE the Coastal
Study Area
Total Recreation-Related Spending by WA
Resident Associated with Coastal Recreation
Inside Coastal Study Area
Elsewhere in WA1
Inside Coastal Study Area
Elsewhere in WA
In the Coastal Study Area
Elsewhere in WA
Bait and tackle $0.71 0.0061 $2,916,636 $122,499 $0 $1,883,248 $910,889 $2,005,747 $910,889
Equipment rental (e.g., surfboard, bike, kayak, stand up paddle board) $0.67 0.0057 $2,752,318 $115,597 $0 $1,777,150 $859,571 $1,892,747 $859,571
One-day fishing license fee $0.57 0.0049 $2,341,525 $98,344 $0 $1,511,904 $731,277 $1,610,248 $731,277
Dive equipment rental and airfills $0.32 0.0027 $1,314,540 $55,211 $0 $848,788 $410,541 $903,999 $410,541
Boat ramp fees $0.26 0.0022 $1,068,064 $44,859 $0 $689,640 $333,565 $734,499 $333,565
Total $117.14 1.0000 $481,203,852 $20,210,562 $0 $310,709,478 $150,283,813 $330,920,039 $150,283,813 1 The values in this column are all zeros because it is assumed that persons who live in the coastal area do not make trip-relateed expenditures outside of the coastal area for purposes of recreating in the coastal area.
Sources: Derived from information in Point 97 and Surfrider Foundation 2015 and The Research Group 1991.
7-32 | Recreation and Tourism Washington Coastal Marine Advisory Council

Economic Analysis to Support Marine Spatial Planning in Washington
Trip-related expenditures made by out-of-state visitors associated with outdoor recreation and tourism activities in the coastal study area were estimated to be about $160 million in 2014 (Table 7-7). In addition to spending within the coastal study area, out-of-state visitors also spent an estimated $29.8 million elsewhere in Washington related to their recreation trips to the coastal area.
Table 7-7 Trip-Related Expenditures by Out-of-state Visitors Associated with Recreation and Tourism Activities in the Washington Coastal Study Area (2014 dollars)
Proportion of Per-Trip
Expenditures, by Spending
Category
Total Trip-Related Spending by Out-of-
state Visitors for Outdoor Recreation in
Washington
Recreation Activities within
the Coastal Study Area
Recreation Activities
Elsewhere in WA Associated with Coastal
Trips
Accommodations 31% $1,066,758,980 $49,604,293 $506,166
Food and beverage places 19% $653,820,020 $30,402,631 $2,171,616
Grocery stores 12% $412,938,960 $19,201,662 $1,477,051
Transportation 2% $68,823,160 $3,200,277 $2,800,242
Fees to recreation providers 6% $206,469,480 $9,600,831 $0
Government fees 3% $103,234,740 $4,800,415 $124,686
Miscellaneous retail 11% $378,527,380 $17,601,523 $293,359
Gas and oil 16% $550,585,280 $25,602,216 $22,401,939
Total 100% $3,441,158,000 $160,013,847 $29,775,059
Sources: Derived from information in Earth Economics 2015 and Dean Runyan Associates 2011.
7.5.2 Employment and Labor Income Effects of Recreation and Tourism Activities in the Coastal Study Area
The trip-related spending by state residents and out-of-state visitors identified in Table 7-6 and Table 7-7 above generates economic activity that supports jobs and personal income for residents of the coastal study area and elsewhere in the state. In the coastal study area, trip-related spending by residents of both the coastal regions and elsewhere in Washington who recreate at the coast is estimated to support 4,725 jobs and $196.8 million in labor income within the coastal economy (Table 7-8). Statewide, as dollars and economic activity multiply through the state’s economy, an estimated 9,309 jobs are supported directly and indirectly by recreation and tourism activities in the coastal area, as well as $413.0 million in labor income (Table 7-9).
Washington Coastal Marine Advisory Council

Economic Analysis to Support Marine Spatial Planning in Washington
Table 7-8 Contribution of Trip-related Recreation and Tourism Expenditures in the Coastal Study Area to Coastal Employment and Coastal Labor Income
2-digit NAICS Code Description
Contribution to Coastal Employment Contribution to Coastal Labor Income
Direct Indirect Induced Total Direct Indirect Induced Total
11 Agriculture, Forestry, and Fishing and Hunting 16 51 2 70 1,004,408 1,197,961 131,304 2,333,674
21 Mining, Quarrying, and Oil and Gas Extraction 1 7 0 97 361,918 231,335 4,607 597,859
22 Utilities 0 2 1 3 0 289,239 82,535 371,773
23 Construction 0 45 2 47 0 3,010,396 210,787 3,221,183
31 Food Processing 80 3 1 84 4,130,385 187,721 67,226 4,385,333
32 Wood and Construction Products 18 3 0 22 1,725,895 224,483 32,042 1,982,420
33 Metal Products 19 2 0 21 1,264,857 105,036 18,213 1,388,106
42 Wholesale Trade 147 15 9 171 12,814,615 1,319,054 746,653 14,880,322
44 Retail Food and Clothing 602 8 74 684 25,117,764 352,399 3,285,189 28,755,352
45 Other Retail 72 3 39 114 1,970,194 101,976 1,252,005 3,324,174
48 Transportation 124 21 6 151 9,497,814 1,443,031 364,594 11,305,438
49 Warehousing and Storage 1 42 4 47 68,773 2,920,811 279,307 3,268,891
51 Information 0 12 3 15 0 940,035 238,716 1,178,752
52 Finance and Insurance 1 18 14 34 185,338 1,423,349 1,084,606 2,693,294
53 Real Estate/Rental and Leasing 90 28 15 132 3,785,915 682,296 346,622 4,814,833
54 Professional, Scientific, and Technical Services 0 60 11 70 0 4,193,952 645,786 4,839,738
55 Management of Companies and Enterprises 0 14 1 15 0 1,882,344 91,000 1,973,344
56
Administrative and Support/ Waste Management and Remediation Services 0 69 10 78 0 2,767,941 418,221 3,186,163
61 Educational Services 0 3 14 17 0 66,090 366,634 432,724
62 Health Care and Social Assistance 0 0 96 96 0 395 5,165,366 5,165,761
7-34 | Recreation and Tourism Washington Coastal Marine Advisory Council

Economic Analysis to Support Marine Spatial Planning in Washington
2-digit NAICS Code Description
Contribution to Coastal Employment Contribution to Coastal Labor Income
Direct Indirect Induced Total Direct Indirect Induced Total
71 Arts, Entertainment, and Recreation 112 10 12 134 2,670,116 150,151 272,930 3,093,197
72 Accommodation and Food Services 2,143 47 65 2,255 60,085,041 1,251,261 1,747,865 63,084,167
81 Other Services (except Public Administration) 0 40 62 103 0 2,080,412 2,215,886 4,296,299
100 Miscellaneous 0 0 0 0 0 0 0 0
200 State and Local Government 219 18 8 244 22,002,623 2,779,653 1,188,289 25,970,566
300 Federal Government 18 2 2 22 190,203 35,635 27,153 252,992
Grand Total 3,663 520 453 4,725 146,875,859 29,636,959 20,283,538 196,796,355
Sources: These values were derived for this study using the IMPLAN input-output model; refer to Section 1.5 Economic Impact Modeling Approaches and Measures for details.
Table 7-9 Contribution of Trip-related Recreation and Tourism Expenditures to Statewide Employment and Labor Income
2-digit NAICS Code Description
Contribution to Statewide Employment Contribution to Statewide Labor Income
Direct Indirect Induced Total Direct Indirect Induced Total
11 Agriculture, Forestry, and Fishing and Hunting 40 127 17 184 2,565,258 3,064,481 718,490 6,348,229
21 Mining, Quarrying, and Oil and Gas Extraction 2 12 2 15 6,597 91,201 18,854 116,652
22 Utilities 0 5 3 8 0 715,500 355,785 1,071,285
23 Construction 0 57 12 69 0 3,882,276 984,882 4,867,158
31 Food Processing 110 23 16 149 5,978,758 1,336,728 896,658 8,212,144
32 Wood and Construction Products 60 32 8 101 5,972,430 2,846,720 748,399 9,567,549
33 Metal Products 29 13 7 48 2,050,735 856,402 436,949 3,344,086
42 Wholesale Trade 338 70 62 470 29,522,127 6,118,556 5,367,834 41,008,517
44 Retail Food and Clothing 868 10 189 1,068 36,288,990 460,482 8,349,769 45,099,241
45 Other Retail 113 5 130 248 3,051,352 167,619 4,480,399 7,699,370
Washington Coastal Marine Advisory Council Recreation and Tourism | 7-35

Economic Analysis to Support Marine Spatial Planning in Washington
2-digit NAICS Code Description
Contribution to Statewide Employment Contribution to Statewide Labor Income
Direct Indirect Induced Total Direct Indirect Induced Total
48 Transportation 332 51 32 415 21,715,915 3,599,103 2,055,747 27,370,765
49 Warehousing and Storage 2 78 16 96 96,116 5,185,493 1,085,566 6,367,175
51 Information 0 48 28 76 0 5,362,027 2,799,964 8,161,991
52 Finance and Insurance 9 74 112 195 1,270,261 5,592,517 7,816,837 14,679,615
53 Real Estate/Rental and Leasing 147 106 100 352 6,168,175 2,371,296 2,085,905 10,625,377
54 Professional, Scientific, and Technical Services 0 200 72 272 0 14,556,834 4,924,607 19,481,441
55 Management of Companies and Enterprises 0 51 8 59 0 6,677,840 1,051,915 7,729,755
56
Administrative and Support/ Waste Management and Remediation Services 0 226 72 298 0 9,278,218 3,129,501 12,407,719
61 Educational Services 0 5 59 64 0 129,371 1,803,503 1,932,874
62 Health Care and Social Assistance 0 0 367 367 0 1,630 23,262,300 23,263,929
71 Arts, Entertainment, and Recreation 195 35 71 302 4,643,393 757,061 1,693,729 7,094,183
72 Accommodation and Food Services 3,559 94 203 3,856 100,258,496 2,514,194 5,423,177 108,195,868
81 Other Services (except Public Administration) 0 73 160 232 0 3,970,141 6,419,590 10,389,730
100 Miscellaneous 0 0 0 0 0 0 0 0
200 State and Local Government 228 16 14 258 21,790,471 2,602,694 2,077,463 26,470,628
300 Federal Government 80 9 17 106 825,079 386,551 310,226 1,521,856
Grand Total 6,112 1,421 1,775 9,309 242,204,153 82,524,936 88,298,049 413,027,137
Source: These values were derived for this study using the IMPLAN input-output model; refer to Section 1.5 Economic Impact Modeling Approaches and Measures for details.
7-36 | Recreation and Tourism Washington Coastal Marine Advisory Council

Economic Analysis to Support Marine Spatial Planning in Washington
7.6 TRENDS AFFECTING RECREATIONAL AND TOURISM ACTIVITIES IN THE COASTAL STUDY AREA
This section describes notable trends and observations about participation in recreational activities in the coastal area. Changes in population for the four-county coastal area relative to the state overall are identified; historical/recent travel trends in the four-county coastal area are identified; and notable shifts in the popularity of recreational activities important to coastal visitors are identified. The Washington State Comprehensive Outdoor Recreation Plan (SCORP) is the primary source for time series information on participation trends associated with outdoor recreation activities popular in the coastal area.
7.6.1 Projected Population Growth in the Four-County Coastal Area and Washington State As shown in Table 7-10, total population growth between 2015 and 2025 in the coastal counties is projected to be about 9 percent, ranging from an estimated 4 percent in Pacific County to about 17 percent in Jefferson County. Statewide growth between 2015 and 2025 is projected to be about 11 percent. With the exception of Grays Harbor, all coastal counties are projected to experience more deaths than births, suggesting that projected population growth will rely more on migration than on local births; this demographic trend is expected to be particularly evident in retirement-oriented Jefferson County. At the state level, however, nearly 400,000 more births than deaths are projected over the 10-year period.
Table 7-10 10-Year Projections of Population Growth for Washington State and Coastal Counties, 2015-2025
County Current
Population (2015)
Projected Population
(2025) Change in Population
% Population Change
Clallam 71,910 78,884 6,974 9%
Jefferson 34,035 40,769 6,734 17%
Grays Harbor 74,710 80,213 5,503 7%
Pacific 21,705 22,657 952 4%
Four-county coastal area total
202,360 222,523 20,163 9%
WA State 7,255,672 8,120,510 864,838 11%
Source: Washington State Office of Financial Management 2015
Historical and Recent Travel Trends in the Four-County Coastal Area
Between 2002 and 2012, total traveler spending in the four-county coastal area increased by 32 percent (about 3 percent annually), or by about $243 million (Dean Runyan and Associates 2012). Harbor County accounted for the largest share of this travel spending growth, with an increase of about 36 percent, followed by Pacific County with a 33 percent increase, Clallam County at 29 percent, and Jefferson County at 20 percent. Statewide, traveler spending increased by 36 percent (about 4 percent annually), or by about $11.2 billion. More recently, traveler spending in the four-county coastal area increased by $57 million between 2010 and 2012, representing an annual growth rate of 4 percent; over this same 3-year period, statewide traveler spending increased by $1.4 billion (Dean Runyan and Associates 2012).
Washington Coastal Marine Advisory Council Recreation and Tourism | 7-37

Economic Analysis to Support Marine Spatial Planning in Washington
During the same 2010-2012 period, visitors to the four-county coastal area accounted for about 8,400 person nights annually, with 38 percent of visitors staying in private homes, 35 percent staying in “other accommodations” that includes camping, and 27 percent of visitors staying in hotels. In Clallam County, about half of visitors stayed in private homes; in Jefferson County, about 43 percent of visitors stayed in “other accommodations”; and about 40 percent of visitors to Grays Harbor County stayed in private homes. More than half of Pacific County visitors stayed in “other accommodations,” with only 22 percent staying in private homes. Statewide, an average of 108.9 million person nights were spent in Washington annually, with 32 percent in hotels, 56 percent in private homes, and 12 percent in other accommodations.
Historical Recreational Activity Trends in the Four-County Coastal Area
According to results from the 2014-15 Surfrider recreation survey (Point 97 and Surfrider Foundation 2015), the top five recreational activities in which visitors to the coast participated are beach going, sightseeing, camping, hiking, and photography. With the exception of beach going, rates of participation in these activities have not changed substantially over the 2002−2012 period (Washington State Recreation and Conservation Office 2013).
Wildlife viewing/photography, which ranked as the third most popular outdoor recreation activity in 2012, was ranked as the second most popular activity in 2002. During the same period, participation in beachcombing/beach going has increased substantially, ranking as the 21st (out of 53 activities) most popular activity in 2002 but ranking as 12th most popular activity in 2012. The popularity of RV camping has declined from being the 16th most popular outdoor recreation activity in 2002, to the 28th most popular activity in 2012. The popularity of primitive camping, however, has increased, moving in ranking from 46th in 2002 to 36th in 2012. Lastly, the popularity of hiking has remained relatively stable, ranking as the eighth most popular activity in 2002 and slightly rising to sixth most popular in 2012 (Washington State Recreation and Conservation Office 2013).
REFERENCES
AAA Publishing. 2014. Washington Tour Book Guide. Heathrow, FL.
BEA. See U.S. Department of Commerce, Bureau of Economic Analysis.
Chinook Observer. 2014. “Ocean Washing Away a Way of Life: Rapid Erosion Resumes in County’s Disappearing Town of North Cove.” Published November 5, 2014. Available at: www.chinookobserver.com/co/local-news/20141105/ocean-washing-away-a-way-of-liferapid-erosion-resumes-in-countys-disappearing-town-of-north-cove. Accessed: April 1, 2015.
City of Aberdeen. 2015. City of Aberdeen, Washington. Available at: www.aberdeenwa.gov. Accessed: March 31, 2015.
City of South Bend. 2015. Website Home Page. Available at: www.southbend-wa.gov/en. Accessed: April 1, 2015.
7-38 | Recreation and Tourism Washington Coastal Marine Advisory Council

Economic Analysis to Support Marine Spatial Planning in Washington
Dean Runyan Associates. 2011. Washington State Travel Impacts 1991-2010. Prepared for Washington State Department of Commerce Tourism Office. Portland, OR.
Dean Runyan and Associates. 2012. Washington Counties Report. Available at: www.seattle southside.com/system/assets/general/static_pages/Dean_Runyan_Washington_Counties_Report_2012.pdf. Accessed June 13, 2015.
DNC Parks and Resorts at Kalaloch, Inc. 2015. Kalaloch Lodge, Olympic National Park. Available at: www.thekalalochlodge.com/Accommodations.aspx. Accessed: March 25, 2015.
Earth Economics. 2015. Economic Analysis of Outdoor Recreation in Washington State. Prepared for Washington State Recreation and Conservation Office. January 2015.
Grays Harbor Tourism. 2015. Unforgettable Grays Harbor, Washington. Available at: visitgraysharbor.com/about-our-region/city-of-hoquiam. Accessed: March 31, 2015.
Great Pacific Recreation & Travel Maps. 2000. Olympic Peninsula/Washington Coast Recreation Map & Guide, 6th Edition. Bellevue, WA.
Greater Grays Harbor. 2015. Lodging and Travel. Available at: chamber.graysharbor.org/list/QL/lodging-travel-24.htm. Accessed: March 31, 2015.
Hadley, Nina. 2002. Coastal Tourism in Washington. Washington Sea Grant WASHU-G-02-007-C2.
Hobuck Beach Resort. 2015. Hobuck Beach Resort. Available at: hobuckbeachresort.com. Accessed: March 23, 2015.
Ilwacowashington. 2015. Accommodations. Available at: ilwacowashington.com/blog/accomodations. Accessed: April 2, 2015.
Industrial Economics. 2014. Marine Sector Analysis Report: Recreation and Tourism. Prepared for Washington Coastal Marine Advisory Committee. Cambridge, MA.
Long Beach Peninsula Visitor’s Bureau. 2014. Washington’s Long Beach Peninsula 2015-2016 Beach Vacation Planner. Available at: www.funbeach.com. Accessed: May 11, 2015.
National Ocean Economics Program. 2015. Ocean Economy Data. Available at: www.oceaneconomics.org/Market/ocean/oceanEcon.asp. Accessed: February 27, 2015.
National Park Service. 2015. Olympic National Park: Visiting Kalaloch and Ruby Beach. Available at: www.nps.gov/olym/planyourvisit/visiting-kalaloch-and-ruby-beach.htm. Accessed: March 25, 2015.
Neah Bay Businesses. 2015. Available at: makah.com/business. Accessed June 10, 2015.
Neah Bay Chamber of Commerce, 2015. Available at: www.neahbaywa.com/where.htm. Accessed: June 10, 2015.
North Beach Vacation. 2015. Taholah. Available at: www.northbeachvacation.com/taholah.html. Accessed: March 26, 2015.
Washington Coastal Marine Advisory Council Recreation and Tourism | 7-39

Economic Analysis to Support Marine Spatial Planning in Washington
Ocean City RV Resort. 2015. Ocean City RV Resort. Available at: www.oceancityrvresort.com/ index.php. Accessed: March 30, 2015.
Ocean Park Chamber of Commerce. 2015. Available at: opwa.com. Accessed May 11, 2015.
Ocean Shores Publishing, Inc. 2015. Ocean Shores. Available at: oceanshores.com/our-town/stuff-to-do. Accessed: March 30, 2015.
Pacific Beach. 2014. Pacific Beach, Washington. Available at: www.pacificbeachwa.com. Accessed: March 27, 2015.
Pacific County Economic Development Council. 2015. Transportation. Available at: www.pacificedc.org/Transportation/transportation.htm. Accessed: April 2, 2015.
Point 97 and Surfrider Foundation. 2015. An Economic and Spatial Baseline of Coastal Recreation in Washington. Report to the Washington Department of Natural Resources. Portland, OR. May 28, 2015.
Port of Peninsula. 2015. Port of Peninsula, Nahcotta, Washington. Available at: www.portof peninsula.org. Accessed May 11, 2015.
Port of Willapa Harbor. 2015a. Tokeland Marina. Available at: www.portofwillapaharbor.com/ index.php?option=com_content&view=article&id=8:tokeland-marina&catid =2:facilities&Itemid=5. Accessed: April 1, 2015.
Port of Willapa Harbor. 2015b. Raymond Port Dock. Available at: www.portofwillapaharbor.com/ index.php?option=com_content&view=article&id=3:raymond-port-dock&catid =2:facilities&Itemid=5. Accessed: April 1, 2015.
Quinault Beach Resort. 2014. Quinault Beach Resort. Available at: www.quinaultbeachresort.com. Accessed: March 30, 2015.
Quileute Tribe. 2012. The Quileute Tribe. Available at: www.quileuteoceanside.com/local-attractions. Accessed: March 23, 2015.
Shoalwater Bay Casino. 2015. About Us. Available at: www.shoalwaterbaycasino.com/about-us.html. Accessed: April 1, 2015.
Sunrise Resorts. 2015. Copalis Beach Resort. Available at: www.sunriseresorts.com/resort-locations/copalis-beach-resort. Accessed: March 30, 2015.
The Port of Grays Harbor. 2015a. Port of Grays Harbor Info. Available at: www.portofgraysharbor.com/about/index.php. Accessed: March 31, 2015.
The Port of Grays Harbor. 2015b. Fishing. Available at: www.portofgraysharbor.com/ westport/westportFishingInfo.php. Accessed March 31, 2015.
The Port of Ilwaco. 2015. Home Port. Available at: portofilwaco.com. Accessed April 2, 2015.
7-40 | Recreation and Tourism Washington Coastal Marine Advisory Council

Economic Analysis to Support Marine Spatial Planning in Washington
The Research Group. 1991. Oregon Angler Study. Prepared for the Oregon Department of Fish and Wildlife.
Tokeland-North Cove Chamber of Commerce. 2015. Website Home Page. Available at: www.tokeland-northcovechambercommerce.org/. Accessed: April 1, 2015.
Tokeland-North Cove Chamber of Commerce, Westport-Grayland Chamber of Commerce, and Cranberry Coast Chamber of Commerce. 2015. Accommodations. Available at: www.2thebeach.org/accom.php. Accessed: April 1, 2015.
U.S. Census Bureau. 2012. Washington: 2010: Population and Housing Unit Counts. Washington, DC. Issued August 2012.
U.S. Census Bureau. 2014. 2009-2013 American Community Survey 5-Year Estimates. Table S2405: Industry by Occupation for the Civilian Employed Population 16 Years and Older. Available at: factfinder.census.gov/faces/nav/jsf/pages/searchresults.xhtml?refresh=t. Accessed: March 17, 2015.
U.S. Census Bureau. 2015. Community Facts: 2013 Population Estimates (as of July 1, 2013). Available at: factfinder.census.gov/faces/nav/jsf/pages/index.xhtml. Accessed: March 23, 2015.
U.S. Department of Commerce, Bureau of Economic Analysis. 2015. Regional Economic Accounts: Local Area Personal Income, and Gross Domestic Product, Washington, 2010-2014. Interactive data files available from http://bea.gov/regional/index.htm. Accessed May 20, 2015.
U.S. Fish and Wildlife Service. 2015. Willapa Bay National Wildlife Refuge Visitor Activities. Available at: www.fws.gov/refuge/willapa/visitor_activities. Accessed April 1, 2015.
Washington Department of Fish and Wildlife. 2015. Razor Clams, Fishing and Shellfishing. Available at: wdfw.wa.gov/fishing/shellfish/razorclams/current.html Accessed: May 11, 2015
Washington State Office of Financial Management. 2015. Washington State Growth. Available at: http://www.ofm.wa.gov.pop/gma/projections12/projections12.asp. Accessed June 13, 2015.
Washington State Recreation and Conservation Office. 2013. The 2013 State Comprehensive Outdoor Recreation Plan, 2013. Accessible at: http://www.rco.wa.gov/documents/rec_trends/2013-2018SCORP-FullRpt.pdf
Washington Tourism Alliance. 2015a. ExperienceWA.com: Moclips. Available at: www.experiencewa.com/cities/moclips. Accessed: March 27, 2015.
Washington Tourism Alliance. 2015b. Washington the State: Seabrook. Available at: www.experiencewa.com/cities/seabrook. Accessed: March 30, 2015.
Washington State Parks. 2015a. Griffiths-Priday Ocean State Park. Available at: www.parks.wa.gov/516/Griffith-Priday-Ocean. Accessed: March 30, 2015.
Washington State Parks. 2015b. Ocean City State Park. Available at: www.parks.wa.gov/554/Ocean-City. Accessed: March 30, 2015.
Washington Coastal Marine Advisory Council Recreation and Tourism | 7-41

Economic Analysis to Support Marine Spatial Planning in Washington
Washington State Parks. 2015c. Bottle Beach State Park. Available at: www.parks.wa.gov/479/Bottle-Beach. Accessed: March 31, 2015.
Washington State Parks. 2015d. Westhaven State Park. Available at: www.parks.wa.gov/285/Westhaven. Accessed: March 31, 2015.
Washington State Parks. 2015e. Westport Light State Park. Available at: www.parks.wa.gov/ 284/Westport-Light. Accessed: March 31, 2015.
Washington State Parks. 2015f. Twin Harbors State Park. Available at: www.parks.wa.gov/292/Twin-Harbors. Accessed: March 31, 2015.
Washington State Parks. 2015g. Grayland Beach State Park. Available at: www.parks.wa.gov/ 515/Grayland-Beach. Accessed: March 31, 2015.
Washington State Parks. 2015h. Fort Columbia State Park. Available at: www.parks.wa.gov/506/Fort-Columbia. Accessed: April 2, 2015.
Washington State Parks. 2015i. Cape Disappointment State Park. Available at: www.parks.wa.gov/486/Cape-Disappointment. Accessed: April 2, 2015.
Westport-Grayland Chamber of Commerce and Visitor Center. 2015. Business Directory. Available at: westportgrayland-chamber.org/categories.php. Accessed: March 31, 2015.
WestportWa.com. 2015. Things to Do and See in Westport, Grayland, and Tokeland. Available at: westportwa.com/activities. Accessed: March 31, 2015.
Wikipedia. 2015a. Neah Bay, Washington. Available at: en.wikipedia.org/wiki/Neah_Bay,_Washington. Accessed: June 10, 2015.
Wikipedia. 2015b. La Push, Washington. Available at: en.wikipedia.org/wiki/La_Push,_Washington. Accessed: March 23, 2015.
Wikipedia. 2015c. Queets, Washington. Available at: en.wikipedia.org/wiki/Queets,_Washington. Accessed: March 26, 2015.
Wikipedia. 2015d. Ruby Beach, Washington. Available at: en.wikipedia.org/wiki/Ruby_Beach. Accessed: March 25, 2015.
Wikipedia. 2015e. Kalaloch, Washington. Available at: en.wikipedia.org/wiki/Kalaloch,_Washington. Accessed: March 25, 2015.
Wikipedia. 2015f. Copalis Beach, Washington. Available at: en.wikipedia.org/wiki/Copalis_ Beach, Washington. Accessed: March 30, 2015.
Wikipedia 2015g. Raymond, Washington. Available at: en.wikipedia.org/wiki/Raymond,_Washington. Accessed: April 1, 2015.
Willapa Harbor Chamber & Visitor Kiosk. 2015. Welcome to Willapa Harbor. Accessible at: www.willapaharbor.org/about-2. Accessed: April 1, 2015.
7-42 | Recreation and Tourism Washington Coastal Marine Advisory Council

Economic Analysis to Support Marine Spatial Planning in Washington
PERSONAL COMMUNICATIONS
Dennehy, C. Surfrider Foundation. Personal communication with Michael Taylor, Cascade Economics, on June 9, 2015, regarding beach access near the community of Taholah in Grays Harbor County.
Krueger, Katie. Staff attorney for the Quileute Tribe. Written comments on the draft economic analysis for the Washington Coast Marine Spatial Plan. June 9, 2015.
IMAGES
Chapter 7 Header Image: (cc) Jason Taellious, 2008. 2008 Washington State International Kite Festival. Retrieved July 7, 2015, from: www.flickr.com/photos/dreamsjung/2785572729
Page 7-7: Amlt Chattopadhayay, 2009. Cape Flattery. Retrieved June 29, 2015, from: www.flickr.com/ photos/amitchat/4513224447
Page 7-9: John Fowler, 2010. Ruby Beach North. Retrieved June 29, 2015, from www.flickr.com/ photos/snowpeak/4571616677
Page 7-16: John Lloyd, 2009. Aberdeen's favorites. Retrieved June 29, 2015, from www.flickr.com/ photos/hugo90/4045692948
Page 7-19: Michael D. Martin, 2008. Grays Harbor Lighthouse 1. Retrieved June 29, 2015, from: www.flickr.com/photos/martinvirtualtours/3043872839
Washington Coastal Marine Advisory Council Recreation and Tourism | 7-43

Economic Analysis to Support Marine Spatial Planning in Washington
This page intentionally left blank
7-44 | Recreation and Tourism Washington Coastal Marine Advisory Council

CHAPTER 8. Ecosystem Services
The paradigm of natural resource management is changing as the link between the ecosystem functions and human welfare becomes better understood, and research and modeling tools are developed to aid in decision-making. The planning environment for those resources is changing as well, requiring a reexamination of the relationship between the natural landscape and resource use, as well as a more complete understanding of the ecosystem role in the economic environment of the region. Contemporary economic theory suggests that many environmental attributes can be measured and monetized. Once these environmental attributes (e.g., water quality, maintenance of vegetation cover for carbon sequestration) are connected to the human condition and assigned dollar values, they can be incorporated with more traditional ways of identifying the economic impacts and benefits of open space or protected areas. This line of reasoning supports the notion that sometimes the highest economic value for a natural or cultural resource base may be to maintain it in its undisturbed condition. This contemporary thinking is referred to as “ecosystem services” and is often instructive in the context of natural and recreational resource planning.
Several studies have attempted to estimate the value of ecosystem services in watersheds, small regions, or even particular land parcels. These studies have utilized a wide variety of site-specific physical and biological data to derive estimates. Such information is not generally available, however, in uniform measure or degree of detail at the full scale that can be applicable to all counties.
Washington Coastal Marine Advisory Council Ecosystem Services | 8-1

Economic Analysis to Support Marine Spatial Planning in Washington
In this chapter, the concepts of ecosystem services valuation are introduced and discussed on a qualitative basis to the types and forms of ecosystem services that are associated with the Washington coastal area, with examples drawn from individual locations on the coast. This is followed by a discussion of research on valuations from representative locations, and sites in the planning area are identified that are likely to carry relatively high ecosystem service values. The chapter also includes a discussion of the data requirements associated with preparing a site-specific valuation of ecosystem services.
8.1 CONCEPT OF ECOSYSTEM SERVICES
In 2001, the United Nations launched the Millennium Ecosystem Assessment (MA), a work effort designed to meet the needs of decision makers and the public for scientific information concerning ecosystem change for human well-being and options for responding to those changes. The MA focuses on the benefits people obtain from natural systems; it synthesizes information from the scientific literature, data sets, and scientific models and includes knowledge held by the private sector, practitioners, local communities, and indigenous peoples. The effort took 4 years and involved 1,360 experts in 95 countries in a rigorous peer review. The MA has been adopted internationally and within several federal resource agencies in the United States (Millennium Ecosystem Assessment 2005).
One of the products of that effort is a way to categorize ecosystem goods and services. The MA groups ecosystem goods and services as follows:
Supportive Functions: Services necessary for production of other ecosystem services (e.g., nutrient cycling, soil formation, and wildlife habitat);
Regulating Services: Benefits obtained from ecosystem processes (e.g., improved water quality, waste assimilation, and flood control);
Provisioning Services: Goods produced or provided by ecosystems (e.g., shellfish and salmon, water, timber, and fiber); and
Cultural Services: Non-material benefits from ecosystems (e.g., recreational, spiritual, and aesthetic).
Within the categories of ecosystem services are subcategories representing specific aspects that pertain to the areas on the Washington coast. These benefit subcategories are shown in Table 8-1 (note that economic impacts, measures that are discussed in other chapters, are separate from ecosystem benefits).
8-2 | Ecosystem Services Washington Coastal Marine Advisory Council

Economic Analysis to Support Marine Spatial Planning in Washington
Table 8-1 Summary of Organizing Coastal Attributes into Benefit Categories
Ecos
yste
m G
oods
and
Ser
vice
s Va
lues
Indi
rect
Ben
efit
to
Hum
ans Supportive Functions
Biodiversity
Nutrient Cycling
Soil Formation
Habitat
Regulating Services Natural Hazard Regulation (Flood Control)
Water Regulation (Hydrologic Flows)
Water Purification and Waste Treatment
Dir
ect
Bene
fit
to H
uman
s
Provisioning Services Food
Fresh Water
Fiber (Timber)
Cultural Services Recreation and Tourism
Aesthetic
Cultural Heritage
Education
Spiritual and Inspirational
Source: Adapted from Millennium Ecosystem Assessment 2005.
The MA also examined how ecosystem services influence human well-being (Millennium Ecosystem Assessment 2005, p. v). Human well-being has several constituent parts, including the following:
Basic material for a good life – food, shelter, clothing, secure and adequate livelihoods;
Health – healthy physical environment, clean air and water;
Good social relations – social cohesion, ability to help others and care for children;
Security – secure access to natural and other resources, personal safety, security from natural disasters; and
Freedom of choice and action – opportunity to achieve what an individual values doing and being.
Washington Coastal Marine Advisory Council Ecosystem Services | 8-3

Economic Analysis to Support Marine Spatial Planning in Washington
The conceptual framework for the MA posits a linkage between ecosystem services and human well-being as shown in Figure 8-1. The study further notes that people are integral parts of ecosystems and that a dynamic relationship exists between people and other parts of ecosystems; changes in human conditions lead, directly or indirectly, to changes in ecosystems and, therefore, to changes in human well-being. This interaction and feedback effect is demonstrated in Figure 8-2.
As demonstrated in Table 8-1 and Figures 8-1 and 8-2, a considerable part of the contributions to human well-being provided by ecosystems are “pure public goods,” with the characteristics of non-rivalry and non-excludability (Costanza et al. 1997). Non-rivalry means that one person can enjoy the benefits of ecosystem services without diminishing it for another. Non-excludability means that it is difficult (costly) to prevent an individual from enjoying the benefits without explicitly paying for it (thus, they will get a “free ride”), and therefore price data that reflect the value of those benefits will not be available (Dumas et al. 2004). This “non-excludability” characteristic extends as well to private investment (e.g., shellfish aquaculture production or sustainable forest practices), where the full set of benefits is not paid for by those enjoying them (Northern Economics, Inc. [NEI] 2009).
Because of their public good nature, many ecosystem services accrue directly to people without passing through the market economy. If the public goods are not explicitly recognized or accounted for, the frequent result for many ecosystems is overuse or excessive exploitation (or, in the case of restoration or enhancement, underinvestment), even though they provide services that people desire and would otherwise be willing to pay for. It may also be argued that the reason many ecosystems are in decline is that they are not valued as highly as the activities and products that degrade them because of a lack of public awareness of the many ecologic, economic, societal, and cultural values of those ecosystems (U.S. Environmental Protection Agency [EPA] 2010). If fully recognized and accounted for, the benefits of ecosystem services can be accounted for when making comparisons among competing resource uses. Explicit costs and benefits would provide important information that can be referred to in the decision-making process.
8-4 | Ecosystem Services Washington Coastal Marine Advisory Council

Economic Analysis to Support Marine Spatial Planning in Washington
Figure 8-1 Linkage of Ecosystem Services and Human Well-being Source: Millennium Ecosystem Assessment 2005, p. vi.
Washington Coastal Marine Advisory Council Ecosystem Services | 8-5
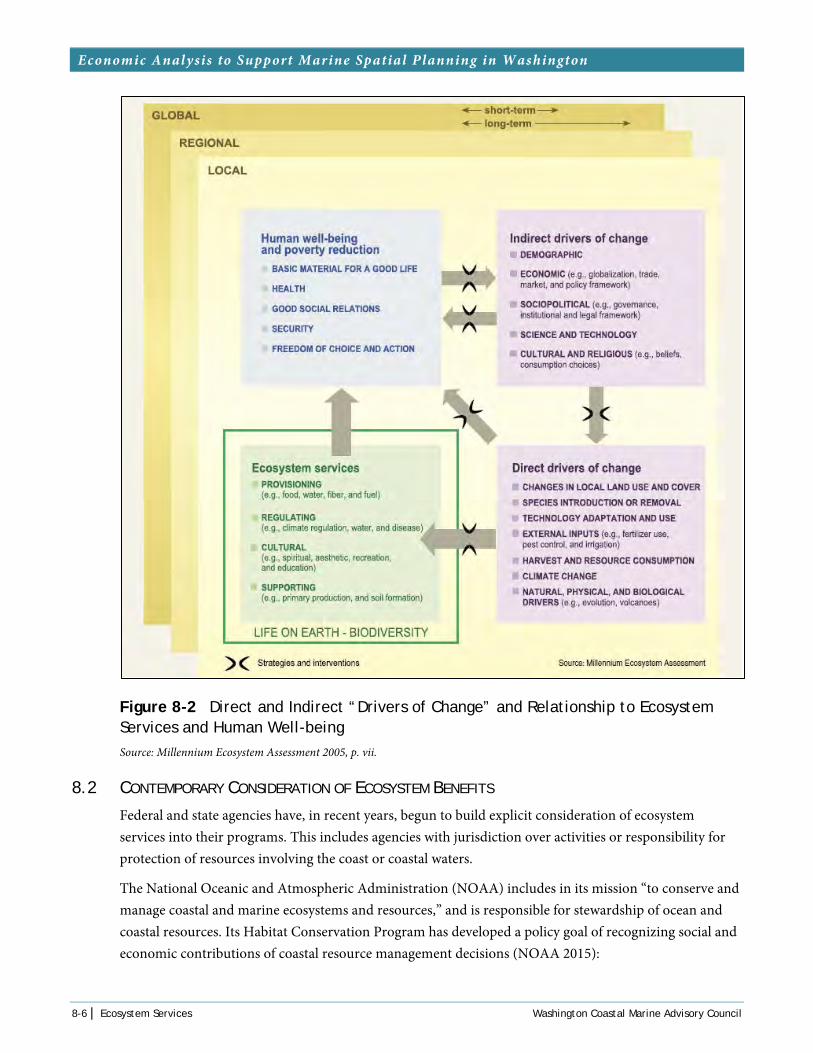
Economic Analysis to Support Marine Spatial Planning in Washington
Figure 8-2 Direct and Indirect “Drivers of Change” and Relationship to Ecosystem Services and Human Well-being Source: Millennium Ecosystem Assessment 2005, p. vii.
8.2 CONTEMPORARY CONSIDERATION OF ECOSYSTEM BENEFITS
Federal and state agencies have, in recent years, begun to build explicit consideration of ecosystem services into their programs. This includes agencies with jurisdiction over activities or responsibility for protection of resources involving the coast or coastal waters.
The National Oceanic and Atmospheric Administration (NOAA) includes in its mission “to conserve and manage coastal and marine ecosystems and resources,” and is responsible for stewardship of ocean and coastal resources. Its Habitat Conservation Program has developed a policy goal of recognizing social and economic contributions of coastal resource management decisions (NOAA 2015):
8-6 | Ecosystem Services Washington Coastal Marine Advisory Council

Economic Analysis to Support Marine Spatial Planning in Washington
We conserve habitat to make sure the benefits of our natural resources—or ecosystem services—are available for healthy coastal communities and future generations. And, the work of conserving habitat makes a positive contribution to our economy by generating “green” jobs and making sure coastal resources are available for industries such as fishing and tourism.
EPA’s Western Ecology Division has an Estuarine Ecosystem Services Program that is developing tools and approaches for estimating the effects of habitat alteration on important ecosystem services associated with estuarine tidal wetlands of the Pacific Northwest (PNW). The research focuses on highly valued services such as healthy fish, shellfish, and wildlife populations and will evaluate the likely changes, in terms of these and other ecosystem services, resulting from impacts of current and future alterations of tidal wetland habitats. The primary products of the research will be generally applicable geographic information system (GIS)-based tools capable of estimating the value of ecosystem services provided by different combinations of habitat types, habitat conditions, and habitat area coverage in PNW estuaries at scales ranging from single systems to the entire Pacific coast (EPA 2010).
The Natural Capital Project is a collaborative research institute involving Stanford University, The Nature Conservancy, the World Wildlife Fund, and the University of Minnesota, with goals of “develop[ing] practical, science-based approaches and software tools that quantify, map, and value services provided by nature” (Natural Capital Project 2015). The project is working on a 2-year, $1.9-million program to develop a marine decision support tool called InVEST (Integrated Valuation of Ecosystem Services Tradeoffs), which will be used to assess ecosystem services in a marine environment along the Pacific Coast. The InVEST modeling tool includes components for carbon sequestration, pollination of crops, managed timber production, water pollution regulation, and sediment retention for reservoir maintenance. It also includes a biodiversity model so that comparisons and tradeoffs between biodiversity and ecosystem services can be analyzed. The newest edition is intended to include models for ecosystem services, including flood mitigation, agriculture production, irrigation, open-access harvest, and hydropower production.
The U.S. Bureau of Reclamation and U.S. Army Corps of Engineers are both required to follow the “Principles and Guidelines” (P&G) devised by the Water Resources Council (WRC) in 1983 (WRC 1983). Given the era and age of the document, the original version did not include an economic measure of environmental benefits. Several attempts have been made to revise and update the P&G to explicitly incorporate environmental protection and restoration into the document, including valuation of ecosystem benefits. The latest version in draft form, renamed “Principles and Standards” and prepared by the Council on Environmental Quality (CEQ), includes the following as its first two principles (CEQ 2009):
(cc) Sam Beebe, 2008
Bone River feeds into Willapa Bay
Washington Coastal Marine Advisory Council Ecosystem Services | 8-7

Economic Analysis to Support Marine Spatial Planning in Washington
(a) Protect and restore natural ecosystems and the environment while encouraging sustainable economic development; and
(b) Account for ecosystem services.
In discussing ecosystem services, the report states (CEQ 2009, p. 5):
Consideration of ecosystem services can play a key role in evaluating water resource alternatives. Using the best available methods in the ecological, social, and behavioral sciences to develop an explicit list of the services derived from an ecosystem is the first step in ensuring appropriate recognition of the full range of potential impacts of a given alternative. This can help make the formulation and the analysis of alternatives more transparent and accessible and can help inform decision makers of the full range of potential impacts stemming from different options before them.
Finally, for the purposes of water and land resource planning, it concludes (CEQ 2009, p. 6):
In the context of these Standards, evaluations shall focus on identifying ecological service and intrinsic natural value changes and the significance of those changes, rather than attempting to assess the value of entire ecosystems. [emphasis in original]
8.3 VALUATION OF ECOSYSTEM SERVICES WITH APPLICABILITY TO THE WASHINGTON COAST: A SUMMARY OF THE LITERATURE
Several research efforts in recent years have addressed ecosystem services on Pacific Coast or marine resources that have applicability to the Washington coast. This section provides a review of some relevant studies.
8.3.1 A Community-based Approach for Evaluating Tradeoffs across Marine Ecosystem Services in Oregon
A Master of Science Degree Thesis Prepared by Peter M. Freeman, Oregon State University (2012)
The thesis reports on a study that developed an operational approach to implementing a rigorous approach for analyzing tradeoffs across the provision of ecosystem services in an MSP setting. The author’s solution is founded on community-based methods, ecological production theory, and multi-criteria decision analysis. The approach merges ecological models with surveys to identify marine ecosystem services for use in tradeoff analysis. The approach allows for a single set of marine ecosystem services to at once be valued by local stakeholders and measured by biologists, thus connecting social and biological monitoring efforts.
To develop the approach in a real-world context, the author examined ecosystem services associated with nearshore marine ecosystems in Oregon, where marine reserves are being introduced for biodiversity conservation. Working with stakeholder focus groups in three Oregon communities, he identified 24 marine ecosystem services, then linked the ecosystem services with eleven ecological indicators, which were consolidated to for use in a survey-based tradeoff analysis exercise (see Table 8-1). Survey data was
8-8 | Ecosystem Services Washington Coastal Marine Advisory Council

Economic Analysis to Support Marine Spatial Planning in Washington
stratefied in three ways: by location of residence (coastal vs. non-coastal), by eight categories of affiliation (e.g., business owners, conservationists, commercial and recreational fishers, etc.), and by resource use patterns. Results of the analyses showed that there are statistically significant variations in preferences within and between most groupings.
Table 8-2 Aggregrate Survey Results for 11 Ecological Indicators in Three Oregon Coast Communities
Rank Order Ecological Indicator Mean Rank
1 Number and Size of Fish and Shellfish 8.10
2 Variety of Sealife 7.40
3 Natural Integrity of Marine Ecosystem 7.30
4 Natural Sustainability of Fish and Shellfish Stock 6.63
5 Outdoor Recreation and Leisure 6.33
6 Cleanliness of Ocean Water 5.77
7 Abundance of Seabirds 5.45
7 Availability of Fish and Shellfish for Harvest 5.45
9 Natural Aesthetic of the Seascape 4.92
10 Abundance of Marine Mammals 4.87
11 Coastal Culture and Lifestyle 3.78
Source: Freeman 2012, p. 83.
8.3.2 Deschutes Estuary Feasibility Study: Net Social and Economic Benefits of Analysis
Prepared for Washington Department of Fish and Wildlife by Cascade Economics LLC, Northern Economics, Inc., and Spatial Informatics Group LLC (2007)
The study involved an assessment of the social and economic effects of restoring a naturally functioning marine estuary. The study team organized a set of attributes of community importance into categories of estuary “goods and services,” and further mapped them into a generally accepted economic framework that includes categories of market, non-market, and non-economic (social) values. A literature review of applicable studies was then used to provide comparable estimates of non-market benefits. A follow up survey of stakeholders was conducted in order to elicit responses to individual attributes.
Three broad categories of benefits were evaluated: use values, non-use values, and social and cultural values. Findings suggested importance was placed by the community on aesthetics, habitat, and biodiversity, and that flood control and water quality generated the largest net benefits.
Washington Coastal Marine Advisory Council Ecosystem Services | 8-9

Economic Analysis to Support Marine Spatial Planning in Washington
8.3.3 Marine and Coastal Ecosystem Services
Prepared for David Suzuki Foundation by Michelle Molnar, Cathryn Clarke-Murray, John Whitworth, and Jordan Tam (2009)
The report’s subtitle is, “A report on ecosystems services in the Pacific North Coast Integrated Management Area (Pncima) on the British Columbia coast.” The study presents known information about ecosystem services and identifies gaps in information that should be filled to support the implementation of an integrated ocean management plan in the Pncima. The approach of the integrated management plan is similar to an MSP in that integrated management plans are aimed at “preserving healthy, vibrant ecosystems and human communities” in Large Ocean Management Areas (LOMAs).
The study utilizes ecosystem services concepts and elements in the marine planning field to develop an accounting of the range of ecosystem services provided by the coastal and marine environments. For example, the study concluded that (Molner et al. 2009, p. iv):
Fisheries provide up to one-quarter of regional employment income, amounting to more than $2.6 million annually on the Central Coast alone.
Natural structures mitigate the effects of extreme weather events, potentially saving thousands of lives and hundreds of thousands of dollars.
As a popular destination for nature-based recreation, the Pncima region attracts more than $60 million in tourism revenues each year.
8.3.4 Valuation of Ecosystem Services from Shellfish Restoration, Enhancement and Management: A Review of the Literature
Prepared for the Pacific Shellfish Institute by Northern Economics, Inc. (2009)
The report offered planners and decision makers an overview of the existing literature on the valuation of ecosystem services provided by shellfish restoration and enhancement and by shellfish management (i.e., the sustainable use of natural shellfish beds). Within the scientific literature, there is growing recognition of the central role that shellfish can play in the maintenance and stability of coastal ecosystems. For example, oysters support a complex community of species by performing various functions essential to the diverse array of species that surround them.
The report identifies the role of shellfish in each of the four benefit categories depicted in Figure 8-1: provisioning, regulating (water quality maintenance, protection of shorelines and sediment stabilization, and carbon sequestration), supporting (cycling of nutrients and nursery habitats), and cultural services. Economic valuation literature is then discussed, including methods and issues associated with the four benefit categories. Another section discusses the costs of shellfish restoration, enhancement, and management. Finally, economic valuation issues are presented.
8-10 | Ecosystem Services Washington Coastal Marine Advisory Council

Economic Analysis to Support Marine Spatial Planning in Washington
8.3.5 An Assessment of the Value of Pacific County’s Nearshore Ecosystems
Prepared for Pacific County by L. Flores and D. Batker (2014)
In support of the county’s Shoreline Master Program planning update, the authors from Earth Economics produced an economic analysis that estimated the value of the ecosystem services provided by natural assets in Pacific County’s nearshore environment. The authors developed a matrix of 15 ecosystem services provided by the nearshore environment, with a comparison to 12 land cover types found within the county. A subset of those ecosystem services is explicitly valued within the report.
To value ecosystem services, the authors used county GIS data. Existing peer-reviewed ecosystem service valuation studies were then selected from their database and applied to the Pacific County nearshore environment. Each land cover in the county was assigned a total high and low annual per-acre dollar value for ecosystem services produced. Values were summed across all land covers, resulting in a total annual flow of value for Pacific County. The value of Pacific County’s nearshore ecosystems was estimated to be approximately $985 million to $4.4 billion dollars per year. The authors also developed recommendations for the “preservation of ecosystems that contribute tangibly to the local economy.”
8.3.6 Valuing Nearshore Ecosystems in Grays Harbor County
Prepared for Grays Harbor County by L. Flores and G. Schundler (2014)
In support of the county’s Shoreline Master Program planning update, the authors from Earth Economics used a “natural capital assessment” approach to produce an economic analysis that estimated the value of the ecosystem services provided by natural assets in Pacific County’s nearshore environment. The authors developed a matrix of 15 ecosystem services provided by the nearshore environment, with a comparison to 11 land cover types found within the county. A subset of those ecosystem services is explicitly valued within the report.
The report begins with a discussion of the economy of Grays Harbor County, followed by a section on threats to the nearshore with a focus on Crude-by-Rail (CBR) transport and on oil spills. The report next provides a valuation of the ecosystem services in Grays Harbor County. Finally, the report concludes with recommendations on incorporation and use of the values in planning efforts.
To value ecosystem services, the authors used county GIS data. Existing peer-reviewed ecosystem service valuation studies were then selected from their database and applied to the Grays Harbor County nearshore environment. Each land cover in the county was assigned a total high and low annual per-acre dollar value for ecosystem services produced. Values were summed across all land covers, resulting in a total annual flow of value for Grays Harbor County. The value of Grays Harbor County’s nearshore ecosystems was estimated to be approximately $313 million to $3.1 billion dollars per year. The authors also developed recommendations for the “preservation of ecosystems that contribute tangibly to the local economy.”
Washington Coastal Marine Advisory Council Ecosystem Services | 8-11

Economic Analysis to Support Marine Spatial Planning in Washington
8.3.7 Protecting the Strait of Juan de Fuca Nearshore through Improved Understanding of Shoreline Erosion and Deposition Processes, Ecosystem Services Valuation, and Community Stewardship
Prepared for Clallam County by C. Lear (2013)
Clallam County received an EPA grant to assist the county in its Shoreline Master Program (SMP) planning process. Lear studied beach and bluff sediment processes, forage and juvenile fish use, and ecosystem services values in the nearshore of the central Strait of Juan de Fuca. The study compared two drift cells, the Dungeness and the Elwha.
The ecosystem services were valued for the nearshore of the study area across 12 land cover types. A primary value for the nearshore was also calculated with consideration of “appreciation of natural capital over time, and the understanding that natural capital provides important services without the need for expensive built infrastructure” (Lear 2013, p. 8).
Within the SMP, physical and biological processes were identified along the shoreline that are important for habitat, storm buffering, water filtering, and other elements of a functioning ecosystem. Finally, Lear provided examples of costs that are incurred by the public when the “system becomes compromised” (Lear 2013, p. 8), including the following:
Ediz Hook, a sand spit protecting the deep harbor of Port Angeles, which required a beach nourishment project costing the City of Port Angeles $1 million per year and the U.S. Army Corps of Engineers an additional $636,000; and
Port Angeles landfill, which was starved for sediment and for which protection from bluff erosion is estimated to cost taxpayers $2,000 per foot per year.
8.4 DATA REQUIREMENTS TO VALUE ECOSYSTEM SERVICES
In general, valuation of ecosystem services requires a considerable amount of localized data. Various past studies have attempted to estimate the value of ecosystem services in watersheds, small regions, or even particular land parcels. These studies have utilized a wide variety of site-specific physical and biological data to derive estimates. Such information is not generally available in uniform measure or degree of detail at the full scale that can be applicable to large expanses such as the Washington coast. Therefore, to effectively conduct an ecosystem services valuation, a wide range of data may be required. The following list provides an initial indication of basic data requirements:
Inventory and Understanding of Complex Marine Ecosystems
Ocean and Shoreline Processes and Dynamics
Hydrology and Climate
Soils Inventory and Properties
Biophysical Responses
Landscape Inventory and Patterns
8-12 | Ecosystem Services Washington Coastal Marine Advisory Council

Economic Analysis to Support Marine Spatial Planning in Washington
Cultural and Historical Inventory
Land Ownership (Private vs. Public)
Relationships between Biophysical Changes and Human/Social Impacts
REFERENCES
Cascade Economics LLC, Northern Economics, Inc., and Spatial Informatics Group. 2007. Deschutes Estuary Feasibility Study: Net Social and Economic Benefits of Analysis. Report for Capitol Lake Adaptive Management Plan Steering Committee and Washington Department of Fish and Wildlife. June 1, 2007.
CEQ. See Council on Environmental Quality.
Costanza, R., R. d’Arge, R. de Groot, S. Farber, M. Grasso, B. Hannon, K. Limburg, S. Naeem, R. V. O’Neill, J. Paruelo, R. G. Raskin, P. Sutton, and M. van den Belt. 1997. The value of the world’s ecosystem services and natural capital. Nature 387:253-260.
Council on Environmental Quality. 2009. Proposed National Objectives, Principles and Standards for Water and Related Resources Implementation Studies. December 9.
Dumas, C. F., P. W. Schuhmann, and J. C. Whitehead. 2004. Measuring the Economic Benefits of Water Quality Improvement with Benefit Transfer: An Introduction for Non-Economists.
EPA. See U.S. Environmental Protection Agency.
Flores, L., and D. Batker. 2014. An Assessment of the Value of Pacific County’s Nearshore Ecosystems: Economic Data for the Shoreline Master Program Planning Process. Earth Economics, Tacoma, WA.
Flores, L., and G. Schundler. 2014. Valuing Nearshore Ecosystems in Grays Harbor County: A Natural Capital Assessment to Inform the Shoreline Master Program Planning Process. Earth Economics, Tacoma, WA.
Freeman, Peter M. 2012. A Community-Based Approach for Evaluating Tradeoffs across Marine Ecosystem Services in Oregon. Master’s Thesis, Oregon State University, September 28.
Lear, Cathy. 2013. Protecting the Strait of Juan de Fuca Nearshore through Improved Understanding of Shoreline Erosion and Deposition Processes, Ecosystem Services Valuation, and Community Stewardship. Summary Report for Use with Clallam County’s Shoreline Master Program, EPA Project PC-00J298-01. December 2013.
Millennium Ecosystem Assessment. 2005. Ecosystems and Human Well-Being: Synthesis. Island Press, Washington.
Washington Coastal Marine Advisory Council Ecosystem Services | 8-13

Economic Analysis to Support Marine Spatial Planning in Washington
Molnar, Michelle, Cathryn Clarke-Murray, John Whitworth, and Jordan Tam. 2009. Marine and Coastal Ecosystem Services: A report on ecosystem servides in the Pacific North Coast Integrated Management Area (Pncima) on the British Columbia coast. Report for the David Suzuki Foundation. Available at: http://www.davidsuzuki.org/publications/downloads/2009/ marine_ecosystems_report_web.pdf.
National Oceanic and Atmospheric Administration. 2015. Habitat Conservation: Habitat – What’s it Worth? Available at: www.habitat.noaa.gov/abouthabitat/ecosystemservices.html. Accessed May 2015.
Natural Capital Project. 2015. About the Natural Capital Project. Available at: www.naturalcapital project.org/about.html#mission. Accessed May 2015.
NEI. See Northern Economics, Inc.
NOAA. See National Oceanic and Atmospheric Administration.
Northern Economics, Inc. 2009. Valuation of Ecosystem Services from Shellfish Restoration, Enhancement and Management: A Review of the Literature. Prepared for the Pacific Shellfish Institute. September.
U.S. Environmental Protection Agency. 2010. Estuarine Ecosystem Services. Western Ecology Division. June. Available at: www.epa.gov/wed/pages/projects/estuarine_original.pdf. Accessed May 15, 2015.
Water Resources Council. 1983. Economic and Environmental Principles and Guidelines for Water and Related Land Resources Implementation Studies.
WRC. See Water Resources Council.
IMAGES
Chapter 8 Header Image: (cc) Mickey Thurman, 2015. Grays Harbor at Hoquiam. www.flickr.com/ photos/hokyumgrl/16569398542
Page 8-7: Sam Beebe, 2008. Bone River. Retrieved June 29, 2015, from: www.flickr.com/photos/ sbeebe/2849071890
8-14 | Ecosystem Services Washington Coastal Marine Advisory Council
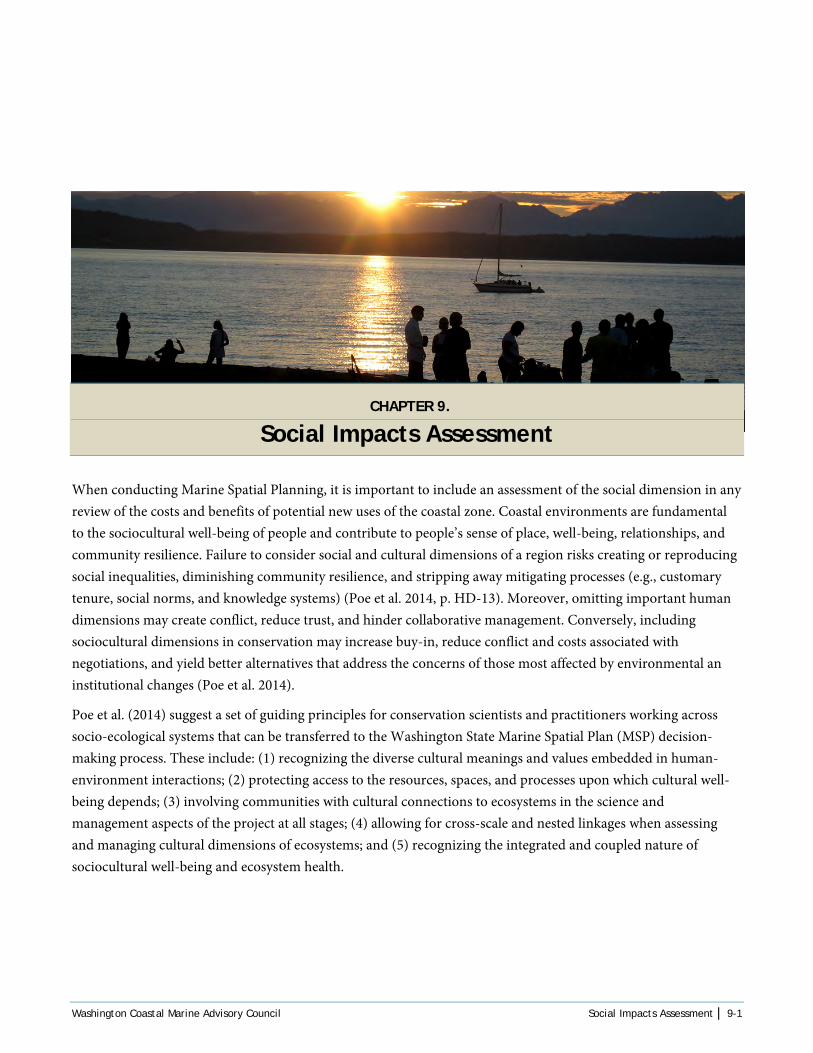
CHAPTER 9. Social Impacts Assessment
When conducting Marine Spatial Planning, it is important to include an assessment of the social dimension in any review of the costs and benefits of potential new uses of the coastal zone. Coastal environments are fundamental to the sociocultural well-being of people and contribute to people’s sense of place, well-being, relationships, and community resilience. Failure to consider social and cultural dimensions of a region risks creating or reproducing social inequalities, diminishing community resilience, and stripping away mitigating processes (e.g., customary tenure, social norms, and knowledge systems) (Poe et al. 2014, p. HD-13). Moreover, omitting important human dimensions may create conflict, reduce trust, and hinder collaborative management. Conversely, including sociocultural dimensions in conservation may increase buy-in, reduce conflict and costs associated with negotiations, and yield better alternatives that address the concerns of those most affected by environmental an institutional changes (Poe et al. 2014).
Poe et al. (2014) suggest a set of guiding principles for conservation scientists and practitioners working across socio-ecological systems that can be transferred to the Washington State Marine Spatial Plan (MSP) decision-making process. These include: (1) recognizing the diverse cultural meanings and values embedded in human-environment interactions; (2) protecting access to the resources, spaces, and processes upon which cultural well-being depends; (3) involving communities with cultural connections to ecosystems in the science and management aspects of the project at all stages; (4) allowing for cross-scale and nested linkages when assessing and managing cultural dimensions of ecosystems; and (5) recognizing the integrated and coupled nature of sociocultural well-being and ecosystem health.
Washington Coastal Marine Advisory Council Social Impacts Assessment | 9-1

Economic Analysis to Support Marine Spatial Planning in Washington
The economics consultants have reviewed several projects that focus on the social and cultural dimension of Marine Spatial Planning and, more generally, ecosystem-based management on the Washington coast. These projects, described in the next section, in addition to analysis in Chapter 2, have provided the consultants with a potential suite of indicators by which to assess the impacts on the local communities of introducing potential new uses to the Washington coast. As indicated in the various Sector Analyses completed for the Washington Coastal Marine Advisory Council (WCMAC), the rural communities on Washington’s Pacific coast depend heavily on natural resource−based industries (fisheries, aquaculture, timber, and tourism). These communities already face considerable uncertainty as a result of economic and environmental conditions. The introduction of new potential uses to the coast, including marine product extraction, offshore aquaculture, dredge disposal, mining of gas hydrates, mining of marine sand and gravel, and renewable energy sources (such as offshore wind, wave, and tidal energy generation), offer potential benefits and use compatibilities, but even more likely environmental costs and use conflicts.
This analysis of social impacts of new potential uses is based on a review of related research efforts, outlined in Section 9.2, and a list of indicators derived from Human Wellbeing Vital Signs and Indicators for Puget Sound Recovery by Stiles et al. (2015). Selected indicators and descriptions of potential new uses of coastal Washington waters were included in a survey described in Section 9.3.
9.1 RELATED EFFORTS
9.1.1 University of Washington Sea Grant: Integrated-based Social Indicators for Washington Marine Spatial Planning
Washington Sea Grant (WSG) has, in collaboration with the National Oceanic and Atmospheric Administration’s (NOAA’s) Northwest Fisheries Science Center (NWFSC), created a conceptual model to assess social indicators of human well-being for use in the integrated ecosystem assessment (IEA) for the Washington State MSP. The social indicators generated through this model are designed to communicate information about the status and trends of objective categories of social conditions (e.g., housing, education, health, safety). They were derived in part through local input on what matters to coastal community residents. An analysis of the results from a 2013 WSG-hosted Values, Goals and Objectives Setting Workshop, together with the result of the Coastal Voices Marine Resources Committee (MRC) workshops conducted by Bridget Trosin of WSG, resulted in identification of the following themes of importance:
Access to natural resources
Aesthetic beauty and open space
Remoteness
Healthy ecosystems
Tribal and non-tribal communities
Engagement in decision making
Natural resource livelihoods
9-2 | Social Impacts Assessment Washington Coastal Marine Advisory Council

Economic Analysis to Support Marine Spatial Planning in Washington
These status and trends assessments of social well-being are part of the Washington IEA, which is not the same as a social impact assessment but could be used as supporting baseline data. In addition, WSG has invested in the gathering and assessing of existing data for each indicator for four coastal counties—Pacific, Grays Harbor, Jefferson, and Clallam—for 2000, 2005, and 2010. The indicator model and assessment will be presented in spring 2015 at four meetings with Washington MRCs and other constituents, as well as the coastal Treaty tribes. Feedback from these meetings will be included in reports to the Washington Department of Natural Resources (DNR). WSG’s social indicators do not include subjective measures of well-being, which would require new data collection and were outside the scope of the WSG project. The following indicators were included in the WSG analysis:
Access to Social Services
Social support: nutritional assistance, reduced-cost lunch, human services, transportation
Availability of medical care Mobility
Basic Needs
Housing Clean water Healthy food
Education
Expenditure Attainment Enrollment
Governance
Management Planning
Health
Birth Life expectancy Mortality Recreational opportunity
Social Connectedness
Participation in democracy Access to communication Social gathering places Arts and culture Tenure in community
Safety
Safety from natural disaster Safety from crime
Environmental Conditions
Impervious cover Coastal water quality Water sediment Beach closures Air quality
Economic Security
Government economic security Industry economic security Household economic security Population in poverty Individual economic security
Results of this work can be found in a report to DNR in fulfillment of Interagency Agreement No. IAA 14-204, Washington Sea Grant WSG-TR 15-xx (Poe et al. forthcoming).
Washington Coastal Marine Advisory Council Social Impacts Assessment | 9-3

Economic Analysis to Support Marine Spatial Planning in Washington
9.1.2 Northwest Fisheries Science Center CCIEA: Social Well-being Indicators for Marine Management
The Social Well-being Indicators for Marine Management (SWIMM) project is a 2-year effort of the California Current Integrated Ecosystem Assessment (CCIEA), supported by NWFSC, WSG, and the University of Washington, to improve understanding of the human dimensions of ecosystem-based management (EBM). The primary objective of this project was to develop a suite of indicators of human well-being for use in NOAA’s Integrated Ecosystem Assessment of the California Current. The broader objective of the project was to develop a generalizable social science protocol for assessing human well-being that can be used in other socio-ecological assessments, such as MSP and social impact assessment (Breslow et al. 2015). The NOAA team developed a conceptual model of human well-being for the purposes of EBM by comparing and compiling priorities for well-being found in federal environmental policies and legislation, as well as in existing socio-ecological indicators projects around the world. In addition, through a pilot project, the NOAA team is seeking guidance on local issues, concerns, and definitions of well-being, specifically with respect to marine conditions and management, from conversations with stakeholders on the outer coast (S. Breslow, pers. comm., 2015). The NOAA team has identified six high-priority domains that cover the breadth of potential indicators:
Resource access (resource access and utility, resource availability, environmental quality)
Self-determination (sense of control, agency, self-governance, sovereignty, political participation, government transparency)
Social integrity (social relationships, social capital, community integrity)
Job equality (jobs/employment, demographics, livelihoods, personal activities, time allocation)
Food systems (food resources, nutrition, food security)
Tangible connections to nature (sense of place, wonder and spirituality, recreation and tourism, cultural values, knowledge) (Breslow et al. 2015)
At the time of publication of this report (June 2015), the NOAA team had not completed a screening of indicators that fall within these domains or ground-truthed indicators.
9.1.3 Northwest Fisheries Science Center CCIEA: Community Vulnerability Assessments
Norman et al. (2007) developed a method for using secondary data to assess fishing community−level vulnerability to ecosystem changes as well as management, policy, and other shifts. The method relies primarily on sociodemographic data derived from the U.S. Census combined with commercial fisheries data. This community vulnerability assessment approach is supported by earlier efforts within the NWFSC to define and characterize fishing communities, both quantitatively and qualitatively (Norman et al. 2007). Indices developed to account for socioeconomic vulnerability of California
© Katharine Wellman, 2015
Local seafood market
9-4 | Social Impacts Assessment Washington Coastal Marine Advisory Council

Economic Analysis to Support Marine Spatial Planning in Washington
Current coastal communities included (1) a personal disruption index, (2) a population composition index, and (3) an index of community poverty.
Norman et al. (2007) described the personal disruption index as providing a means of assessing commercial fishing−reliant communities according to one aspect of their relative socioeconomic vulnerability. Relatively frequent personal disruptions within the community are linked to an increase in overall vulnerability to natural hazards and other events associated with livelihood and social impacts (Cutter et al. 2000, Jacob et al. 2012).
The personal disruption index includes indicators such as:
Percentage of people within the community who are unemployed;
Percentage of people within the community with no diploma;
Percentage of people within the community who are living in poverty; and
Percentage of people within the community who are separated females.
According to Norman et al. (2007), the population composition index describes the social makeup of the human communities on the Pacific Coast of Washington, Oregon, and California. This index relies on community-specific data from the U.S. Census Bureau’s American Community Survey (ACS) and combines data on race, gender, and other demographics, such as the following:
Percentage of community members identifying racially as “white alone”;
Percentage of community members with female single-headed households;
Population age 0−5 years
Percentage of community members that speak English less than well.
The poverty index, similar to the personal disruption index and population composition index, can offer an assessment of socioeconomic vulnerability for coastal communities. The poverty index provides a means of assessing relative well-being, vulnerability, and resilience potential of fishing-reliant communities. Included in this index are the following factors:
Percentage of people within the community who are receiving assistance;
Percentage of families within the community who are living below the poverty level;
Percentage of people within the community older than 65 years who are living in poverty; and
Percentage of people within the community younger than 18 years who are living in poverty.
Norman et al. (2007) used data from the 2010 U.S. Census and conducted a factor analysis to provide single-factor solutions for each index of social vulnerability. Together these indices provide a means of comparing socioeconomic vulnerabilities across the coastal communities of the California Current Large Marine Ecosystem (CCLME). The results suggest that a community such as Long Beach, Washington, is less socially vulnerable according to all three indices, whereas Queets, Washington, is relatively more socially vulnerable.
Washington Coastal Marine Advisory Council Social Impacts Assessment | 9-5

Economic Analysis to Support Marine Spatial Planning in Washington
Norman et al. (2007) also developed indices of coastal community reliance on and engagement with commercial fishing. The data used for these indices are from the Pacific Fisheries Information Network (PacFIN) and employment data from the ACS. The following indicators were incorporated into the commercial fishing reliance index:
Value of commercial fisheries landings per capita by community;
Processors with landings per capita for each community; and
Percentage of people within the community employed in agriculture, fishing, and forestry.
The following indicators were included in the commercial fishing engagement index:
Value of commercial fisheries landed,
Total landings for each community, and
Processors with landings.
These indices allow for selection of those communities that (1) are clearly linked to the coast through data that capture commercial fishing activity and (2) are also potentially most socioeconomically vulnerable to exogenous shifts and events. Norman et al. (2007) found that Neah Bay is more vulnerable relative to communities such as Naselle and Long Beach, Washington.
9.1.4 University of Washington Report Washington’s Working Coast: An Analysis of the Washington Pacific Coast Marine Resource-based Economy
Butler et al. (2013) conducted an assessment of the economics of marine-resource−dependent businesses and the challenges that they face. The team gathered varying opinions on subjects such as environmental and economic stability and social factors. Some of the most compelling statements relative to Marine Spatial Planning include the following:
“Competition for resources, particularly conflicts between traditional and new uses, was also often mentions as a problem for the coast” (p. 3).
“Many stakeholders cited the lack of political will to act in the interest of marine resource-based industries as a source frustration” (p. 4).
“The most frequently voiced concern in terms of the environment was animal population stability and health; specifically, stakeholders expressed extreme concern about the health of commercial fisheries and the longevity of fishing jobs” (p. 4).
“Our interviews revealed a general lack of trust in regulatory agencies and suspicion that agencies were actively working against the coast’s self-governance efforts” (p. 4).
“Interviewees hoped to see specific marine resource-based industries and their supporting industries continue as viable, sustainable options in perpetuity. Permanent, long-term jobs are most desirable” (p. 5).
9-6 | Social Impacts Assessment Washington Coastal Marine Advisory Council
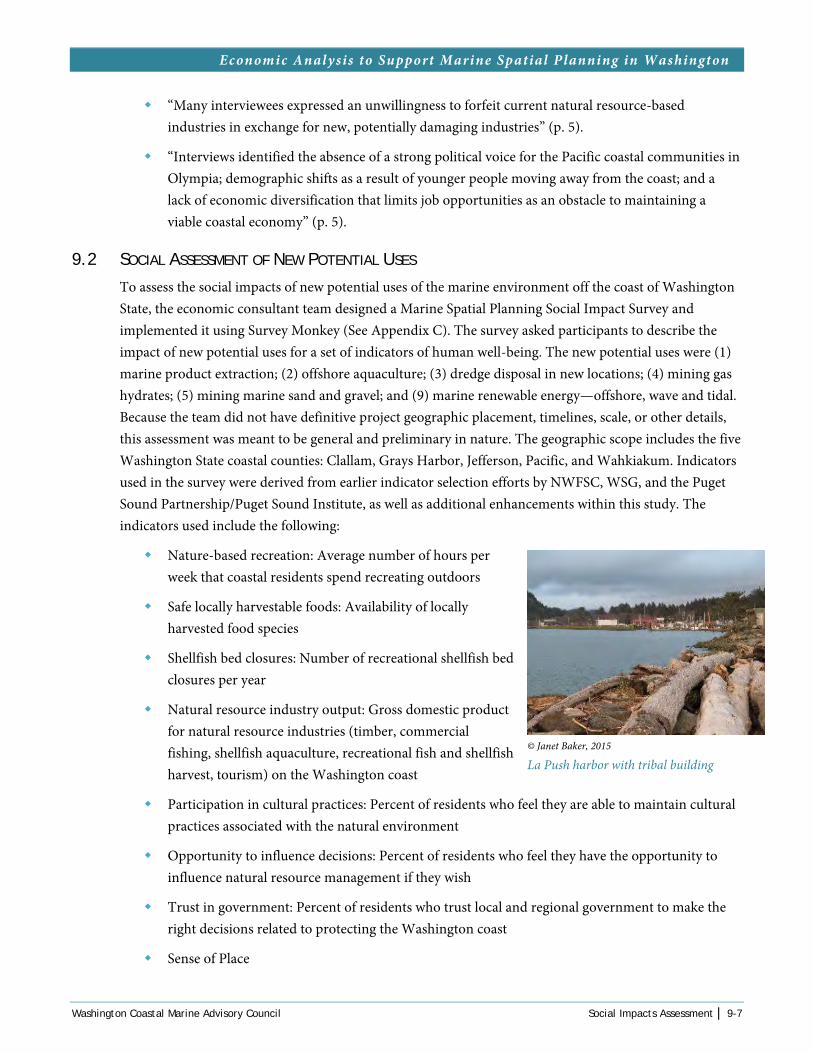
Economic Analysis to Support Marine Spatial Planning in Washington
“Many interviewees expressed an unwillingness to forfeit current natural resource-based industries in exchange for new, potentially damaging industries” (p. 5).
“Interviews identified the absence of a strong political voice for the Pacific coastal communities in Olympia; demographic shifts as a result of younger people moving away from the coast; and a lack of economic diversification that limits job opportunities as an obstacle to maintaining a viable coastal economy” (p. 5).
9.2 SOCIAL ASSESSMENT OF NEW POTENTIAL USES
To assess the social impacts of new potential uses of the marine environment off the coast of Washington State, the economic consultant team designed a Marine Spatial Planning Social Impact Survey and implemented it using Survey Monkey (See Appendix C). The survey asked participants to describe the impact of new potential uses for a set of indicators of human well-being. The new potential uses were (1) marine product extraction; (2) offshore aquaculture; (3) dredge disposal in new locations; (4) mining gas hydrates; (5) mining marine sand and gravel; and (9) marine renewable energy—offshore, wave and tidal. Because the team did not have definitive project geographic placement, timelines, scale, or other details, this assessment was meant to be general and preliminary in nature. The geographic scope includes the five Washington State coastal counties: Clallam, Grays Harbor, Jefferson, Pacific, and Wahkiakum. Indicators used in the survey were derived from earlier indicator selection efforts by NWFSC, WSG, and the Puget Sound Partnership/Puget Sound Institute, as well as additional enhancements within this study. The indicators used include the following:
Nature-based recreation: Average number of hours per week that coastal residents spend recreating outdoors
Safe locally harvestable foods: Availability of locally harvested food species
Shellfish bed closures: Number of recreational shellfish bed closures per year
Natural resource industry output: Gross domestic product for natural resource industries (timber, commercial fishing, shellfish aquaculture, recreational fish and shellfish harvest, tourism) on the Washington coast
Participation in cultural practices: Percent of residents who feel they are able to maintain cultural practices associated with the natural environment
Opportunity to influence decisions: Percent of residents who feel they have the opportunity to influence natural resource management if they wish
Trust in government: Percent of residents who trust local and regional government to make the right decisions related to protecting the Washington coast
Sense of Place
© Janet Baker, 2015
La Push harbor with tribal building
Washington Coastal Marine Advisory Council Social Impacts Assessment | 9-7
Economic Analysis to Support Marine Spatial Planning in Washington
Positive connections: Percent of residents who express a positive connection to the region
Sense of stewardship: Percent of residents who feel a strong sense of stewardship for the coast
Pride of place: Percent of residents who feel a sense of pride about being from coastal counties
Inspiration: Average number of residents who experience inspiration from being in nature
Safety from navigational hazards: Number of vessel incidents along shores of coastal counties
Access to coastal environment: Number of public access points (parks, boat ramps, marinas, beaches) to the marine environment
Economic development goals/issues: Citizens who feel there are barriers to Tribal development goals
Marine water quality: Water quality that allows for traditional and historical uses of the marine environment
Beach closures: Number of incidents per year of public beach closure to recreational activities
Participants of the survey were citizens suggested by members of WCMAC; state agency representatives; individuals associated with economic development councils, chambers of commerce, and tourism bureaus; local officials; community members; and Tribal members. These individuals were asked to list their affiliation, whether they represent a Tribal or Non-Tribal community, and their town and county of residence. Respondents were asked to answer all questions to the best of their ability for their geographic area.
9.3 WASHINGTON MARINE SPATIAL PLANNING SOCIAL IMPACTS SURVEY
The purpose of this survey was to obtain a qualitative sense of the social impacts that could occur in Washington coastal communities as a result of potential new uses of the coastal zone identified by the state-led MSP process. The potential new uses assessed below are marine product extraction, offshore aquaculture, dredge disposal in new locations, mining of gas hydrates, mining of marine sand and gravel, and marine renewable energy (offshore, wave, and tidal).
Respondents were asked to evaluate the impacts of each potential new use of the coastal zone using the following characteristics of social and human well-being derived from NOAA, NWFSC, University of Washington Sea Grant, and the Puget Sound Partnership/Puget Sound Institute:
Nature-based recreation: Average number of hours per week coastal residents spend outdoors recreating
Safe, locally harvestable foods: Availability of locally harvested food species
Shellfish bed closures: Number of recreational shellfish bed closures per year
Natural resource industry output: Gross domestic product for natural resource industries on the Washington coast (i.e., timber, commercial fishing, shellfish aquaculture, recreational fish and shellfish harvest, tourism)
9-8 | Social Impacts Assessment Washington Coastal Marine Advisory Council
Economic Analysis to Support Marine Spatial Planning in Washington
Participation in cultural practices: Percentage of residents who feel they are able to maintain cultural practices associated with the natural environment
Opportunity to influence decisions: Percentage of residents who feel they have the opportunity to influence natural resource management if they want to
Trust in the government: Percentage of residents who trust local and regional government to make the right decisions related to protecting the Washington coast
Sense of place:
Positive connections: Percentage of residents who express a positive connection to the region
Sense of stewardship: Percentage of residents who feel a strong sense of stewardship for the coast
Pride of place: Percentage of residents who feel a sense of pride about being from the coastal counties
Inspiration: Average number of residents who experience inspiration from being in nature
Safety from navigational hazards: Number of vessel incidents along the shores of coastal communities
Access to coastal environment: Number of public access points (i.e., parks, boat ramps, marinas, beaches) to the marine environment
Economic development goals: Reduce barriers to economic opportunity for residents
Marine water quality: Water quality that allows for traditional and historical uses of the marine environment
Beach closures: Number of incidents per year of public beach closure to recreational activities
The Washington Marine Spatial Planning Social Impact Survey (Appendix C), a 20-question electronic survey, was sent to 92 identified stakeholders on May 15, 2015. By June 5, 2015, the study team had received 26 completed responses to this survey. The following discussion summarizes completed responses received from this electronic survey.
9.3.1 Participation
A total of 30 survey responses were submitted: 26 complete responses and four partial or incomplete responses. This represented approximately a 28.2-percent overall response rate for this survey after being open for 3 weeks. Figure 9-1 displays the distribution of the 26 completed survey responses received by the participant’s affiliation. Residents accounted for the largest percentage of completed survey responses, with slightly less than 27 percent, followed by members of the Coastal Voices MRC with slightly more than 19 percent, and academic institutions with slightly more than 15 percent.
Washington Coastal Marine Advisory Council Social Impacts Assessment | 9-9

Economic Analysis to Support Marine Spatial Planning in Washington
Figure 9-1 Distribution of Participants by Affiliation
To protect the identity of the survey respondents, results of this survey (presented in the following sections) are displayed in aggregate. While the participation rate for each individual question varies slightly throughout this survey, it is reasonable to assume that the distribution displayed above can be applied to any of the individual results.
9.3.2 Marine Product Extraction Impacts
Marine product extraction (or bioextraction) is the practice of harvesting marine plants and animals to develop non-food-related goods. Examples include anti-viral, anti-cancer, and anti-tumor agents used in medical treatments; anti-inflammatories in cosmetics; chemicals used in biomedical and cell biology research; and fatty amino acids used in nutritional supplements. New genome sequences have also been discovered within marine organisms.
Based on the literature, it does not seem likely that the Washington coast is a primary target for marine bioprospecting and marine product extraction. The MSP study area has high biodiversity and extreme environments, however, including sea mounts, deep sea corals, and hydrothermal vents. Organisms within these habitats are predicted to have the greatest potential to contain undiscovered genome sequences and chemicals. Therefore, as technology continues to expand the depths of the ocean that are able to be explored, it is possible that novel chemicals and DNA sequences could be discovered within MSP study area waters.
15.4%
3.8%
7.7%
7.7%
19.2% 7.7% 3.8%
26.9%
7.7% Academic institutionFederal governmentIndustryLocal governmentMRCNon-profitPortsResidentTribal Government
9-10 | Social Impacts Assessment Washington Coastal Marine Advisory Council
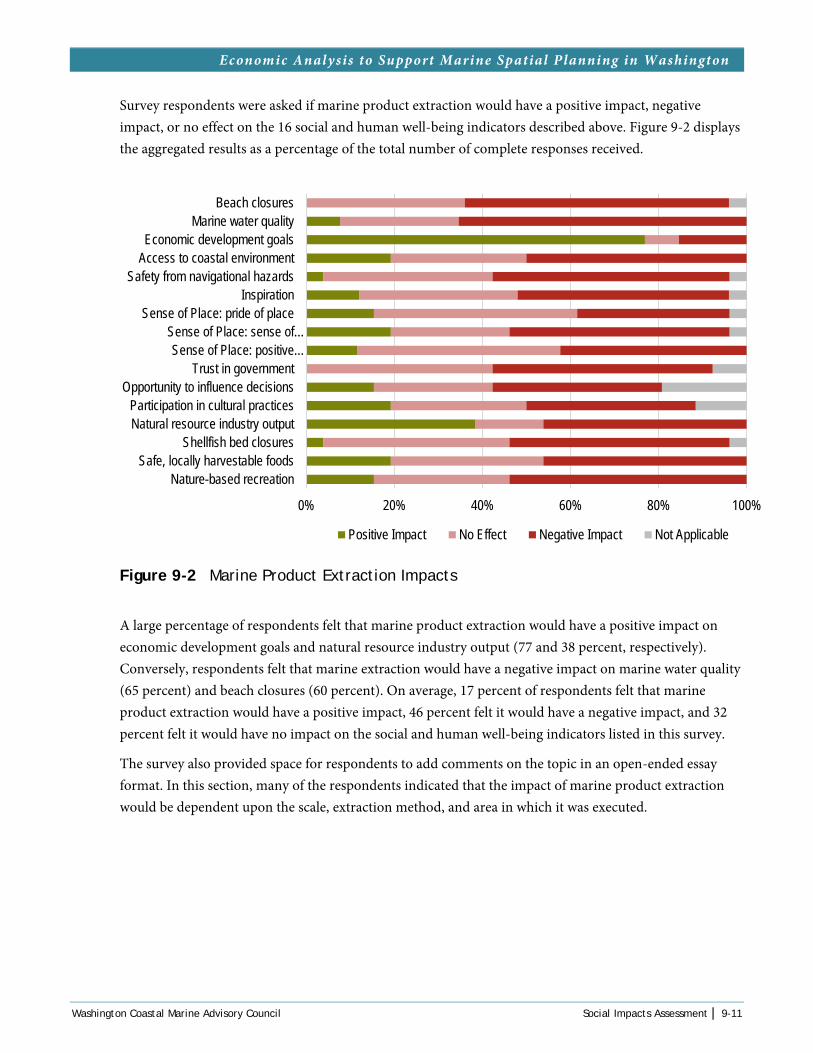
Economic Analysis to Support Marine Spatial Planning in Washington
Survey respondents were asked if marine product extraction would have a positive impact, negative impact, or no effect on the 16 social and human well-being indicators described above. Figure 9-2 displays the aggregated results as a percentage of the total number of complete responses received.
Figure 9-2 Marine Product Extraction Impacts
A large percentage of respondents felt that marine product extraction would have a positive impact on economic development goals and natural resource industry output (77 and 38 percent, respectively). Conversely, respondents felt that marine extraction would have a negative impact on marine water quality (65 percent) and beach closures (60 percent). On average, 17 percent of respondents felt that marine product extraction would have a positive impact, 46 percent felt it would have a negative impact, and 32 percent felt it would have no impact on the social and human well-being indicators listed in this survey.
The survey also provided space for respondents to add comments on the topic in an open-ended essay format. In this section, many of the respondents indicated that the impact of marine product extraction would be dependent upon the scale, extraction method, and area in which it was executed.
0% 20% 40% 60% 80% 100%
Nature-based recreationSafe, locally harvestable foods
Shellfish bed closuresNatural resource industry outputParticipation in cultural practices
Opportunity to influence decisionsTrust in government
Sense of Place: positive…Sense of Place: sense of…
Sense of Place: pride of placeInspiration
Safety from navigational hazardsAccess to coastal environmentEconomic development goals
Marine water qualityBeach closures
Positive Impact No Effect Negative Impact Not Applicable
Washington Coastal Marine Advisory Council Social Impacts Assessment | 9-11

Economic Analysis to Support Marine Spatial Planning in Washington
9.3.3 Offshore Aquaculture Impacts
Aquaculture, the culture or growing of fish, shellfish, or other aquatic plants and animals, is an active industry in Washington. All of Washington’s marine aquaculture currently occurs close to shore, within bays, estuaries, and Puget Sound. No offshore aquaculture is currently taking place in the state.
There is no standard definition for offshore aquaculture; it typically occurs in deep water and is generally exposed to one or several of the following: strong waves, storms, swells, and currents. Given the physical exposure of Washington’s Pacific Coast, offshore aquaculture is currently defined within the
MSP as any new aquaculture operation outside of the coastal estuaries.
The survey asked respondents if offshore aquaculture would have an impact on the social and human well-being indicators. Figure 9-3 displays the aggregated results as a percentage of the total number of complete responses received.
Figure 9-3 Offshore Aquaculture Impacts
0% 10% 20% 30% 40% 50% 60% 70% 80% 90% 100%
Nature-based recreationSafe, locally harvestable foods
Shellfish bed closuresNatural resource industry outputParticipation in cultural practices
Opportunity to influence decisionsTrust in government
Sense of Place: positive connectionsSense of Place: sense of stewardship
Sense of Place: pride of placeInspiration
Safety from navigational hazardsAccess to coastal environmentEconomic development goals
Marine water qualityBeach closures
Positive Impact No Effect Negative Impact Not Applicable
© Tara Schmidt, 2014
Willapa Bay oyster beds
9-12 | Social Impacts Assessment Washington Coastal Marine Advisory Council
Economic Analysis to Support Marine Spatial Planning in Washington
Responses indicate that offshore aquaculture would have a positive impact on economic development goals and natural resource industry output (72 and 48 percent, respectively). Safety and navigational hazards and marine water quality are the two areas that most respondents felt would be negatively affected by offshore aquaculture (80 and 72 percent, respectively). On average, 18 percent of respondents felt that offshore aquaculture would have a positive impact, 50 percent felt it would have a negative impact, and 25 percent felt it would have no impact on the social and human well-being indicators listed in this survey.
In the open-ended portion of this question, survey respondents noted that the impacts involved with offshore aquaculture may be very different between species. Shellfish aquaculture, for example, is considered to have less of an impact and was more generally accepted by respondents than finned fish aquaculture, which was much more negatively perceived. Government oversight and regulations were also brought up in this section, and multiple respondents felt that an increase in offshore aquaculture would warrant a review and possibly an update to current regulations to protect the area.
9.3.4 Dredge Disposal Impacts
Navigation channels in Grays Harbor, the mouth of the Columbia River, and other locations within the MSP study area require frequent dredging to maintain vessel access to critical port infrastructure and services. In some locations, millions of cubic yards are dredged annually to keep navigation channels safe and accessible.
Most of the dredged material is disposed of in-water at specific disposal sites. Current disposal locations and types include the following:
Nearshore and on-shore beneficial use sites keep sediment within the nearshore system, which can minimize erosion. These sites have boundaries, and sediment can accumulate on the sea floor. These sites are designed to allow the sediment to disperse over time.
Flow lane sites are generally used for relatively small volumes of material. The material is placed in scour channels and does not accumulate on the sea floor.
Deepwater sites are located offshore in federal waters. Sediment disposed at deepwater sites is effectively removed from the nearshore system.
The survey asked respondents if dredge disposal would have an impact on the social and human well-being indicators. Figure 9-4 displays the aggregated results as a percentage of the total number of complete responses received.
Washington Coastal Marine Advisory Council Social Impacts Assessment | 9-13

Economic Analysis to Support Marine Spatial Planning in Washington
Figure 9-4 Dredge Disposal Impacts
According to survey results, 60 percent of the respondents felt that dredge disposal would have a positive impact on safety from navigational hazards and 52 percent of respondents felt that it would have a positive impact on economic development goals. Marine water quality and safe, locally harvestable foods are the two areas that the largest portion of respondent felts would be negatively affected by dredge disposal (64 and 46 percent, respectively). On average, 18 percent of respondents felt that dredge disposal would have a positive impact, 34 percent felt it would have a negative impact, and 36 percent felt it would have no impact on the social and human well-being indicators listed in this survey.
In the open-ended portion of this question, respondents indicated that they viewed the activity of dredging as necessary to maintain the current coastal activities and support future activities; they saw the disposal of dredge materials as necessary but not beneficial. There also appears to be a strong preference for returning the dredged material to its natural system instead of using upland disposal sites.
9.3.5 Gas Hydrate Impacts
Gas hydrates are a mixture of gas and water that, under low temperature and high pressure, forms a solid, ice-like structure in marine sediments. Methane is the main type of gas in hydrates. When methane hydrates are exposed to warmer temperatures or lower pressures, the hydrates “dissociate” and release methane gas. Preliminary research suggests that traditional oil and gas equipment and infrastructure can be successfully adapted to mine gas hydrates. Globally, no commercial methane mining activities currently exist, and no projects are currently proposed for offshore Washington.
0% 10% 20% 30% 40% 50% 60% 70% 80% 90% 100%
Nature-based recreationSafe, locally harvestable foods
Shellfish bed closuresNatural resource industry outputParticipation in cultural practices
Opportunity to influence decisionsTrust in government
Sense of Place: positive connectionsSense of Place: sense of stewardship
Sense of Place: pride of placeInspiration
Safety from navigational hazardsAccess to coastal environmentEconomic development goals
Marine water qualityBeach closures
Positive Impact No Effect Negative Impact Not Applicable
9-14 | Social Impacts Assessment Washington Coastal Marine Advisory Council

Economic Analysis to Support Marine Spatial Planning in Washington
When asked if gas hydrates would have a positive impact, negative impact, or no effect, most respondents indicated that it would have a negative impact on each of the social and human well-being indicators listed. Figure 9-5 displays the aggregated results as a percentage of the total number of complete responses received.
Figure 9-5 Gas Hydrate Impacts
Not a single response indicated a positive impact for more than half of the listed social and human well-being indicators in regard to gas hydrates. Economic devolvement goals and natural resource industry output were the two indicators that had the largest percentage of respondents who felt these indicators would be positively affected, but they still only accounted for 33 and 20 percent, respectively, of respondents. On average, 5 percent of respondents felt that gas hydrates would have a positive impact, 75 percent felt it would have a negative impact, and 19 percent felt it would have no impact on the social and human well-being indicators listed in this survey.
In the open-ended essay portion of this question, many respondents raised concerns over the safety of gas hydrate extraction and its potential to negatively affect the ecosystem. Many respondents felt that this type of resource could be extracted more safely in different conditions and did not feel the Washington coast would benefit from this activity enough to outweigh the potential risks.
0% 10% 20% 30% 40% 50% 60% 70% 80% 90% 100%
Nature-based recreationSafe, locally harvestable foods
Shellfish bed closuresNatural resource industry outputParticipation in cultural practices
Opportunity to influence decisionsTrust in government
Sense of Place: positive connectionsSense of Place: sense of stewardship
Sense of Place: pride of placeInspiration
Safety from navigational hazardsAccess to coastal environmentEconomic development goals
Marine water qualityBeach closures
Positive Impact No Effect Negative Impact Not Applicable
Washington Coastal Marine Advisory Council Social Impacts Assessment | 9-15

Economic Analysis to Support Marine Spatial Planning in Washington
9.3.6 Marine Sand and Gravel Mining Impacts
Sand and gravel mining is the dredging of sand or gravel from the sea floor for use in beach nourishment, coastal hazard defense, and other uses such as upland construction. Suction dredges are used to extract the material, which is stored and transported by ship, barge, or pipeline to a beach or rehandling area.
The survey asked respondents if marine sand and gravel mining would have a positive impact, negative impact, or no impact on the social and human well-being indicators. Figure 9-6 displays the aggregated results as a percentage of the total number of complete responses received.
Figure 9-6 Marine Sand and Gravel Mining Impacts
Following a similar trend to the other new uses of the coastal zone areas analyzed above, economic development goals and natural resource industry output received the highest percentage of positive responses with regard to marine sand and gravel mining, with 54 and 30 percent of respondents, respectively. The indicators that received the highest percentage of negative impact responses were marine water quality (79 percent), safety from navigational hazards (71 percent), and safe, locally harvestable foods (71 percent). On average, 13 percent of respondents felt that marine sand and gravel mining would have a positive impact, 61 percent felt it would have a negative impact, and 23 percent felt it would have no impact on the social and human well-being indicators listed in this survey.
0% 20% 40% 60% 80% 100%
Nature-based recreationSafe, locally harvestable foods
Shellfish bed closuresNatural resource industry outputParticipation in cultural practices
Opportunity to influence decisionsTrust in government
Sense of Place: positive…Sense of Place: sense of…
Sense of Place: pride of placeInspiration
Safety from navigational hazardsAccess to coastal environmentEconomic development goals
Marine water qualityBeach closures
Positive Impact No Effect Negative Impact Not Applicable
9-16 | Social Impacts Assessment Washington Coastal Marine Advisory Council

Economic Analysis to Support Marine Spatial Planning in Washington
In the open-ended portion of this question, some respondents expressed concerns about the impacts that marine sand and gravel mining would have on crab and groundfish species in the area. Other respondents noted that the impacts would differ depending on the size, methods used, and location of the mining sites.
9.3.7 Offshore Wind Energy Impacts
Marine renewable energy includes any technology that converts potential energy from wind, waves, or tides into electricity. Currently, researchers are developing various technologies and testing devices in research labs and waters throughout the United States to provide clean energy alternatives for the nation. No devices are currently permitted for the marine waters along Washington’s coast.
Offshore wind energy uses technology adapted from land-based wind turbines and applies it to floating or anchored support structures that vary according to water depth. Turbines used in offshore installations can be up to 500 feet tall to gain access to reliable wind resources. Offshore wind energy is classified by base structures, with fixed bases for shallow waters and floating bases for deep waters.
The survey asked respondents if offshore wind energy would have a positive impact, negative impact, or no impact on the social and human well-being indicators. Figure 9-7 displays the aggregated results as a percentage of the total number of complete responses received.
Figure 9-7 Offshore Wind Energy Impacts
Once again, economic development goals and natural resource industry output received the highest percentage of positive impact responses, with 59 and 30 percent, respectively. The two indicators that
0% 10% 20% 30% 40% 50% 60% 70% 80% 90% 100%
Nature-based recreationSafe, locally harvestable foods
Shellfish bed closuresNatural resource industry outputParticipation in cultural practices
Opportunity to influence decisionsTrust in government
Sense of Place: positive connectionsSense of Place: sense of stewardship
Sense of Place: pride of placeInspiration
Safety from navigational hazardsAccess to coastal environmentEconomic development goals
Marine water qualityBeach closures
Positive Impact No Effect Negative Impact Not Applicable
Washington Coastal Marine Advisory Council Social Impacts Assessment | 9-17
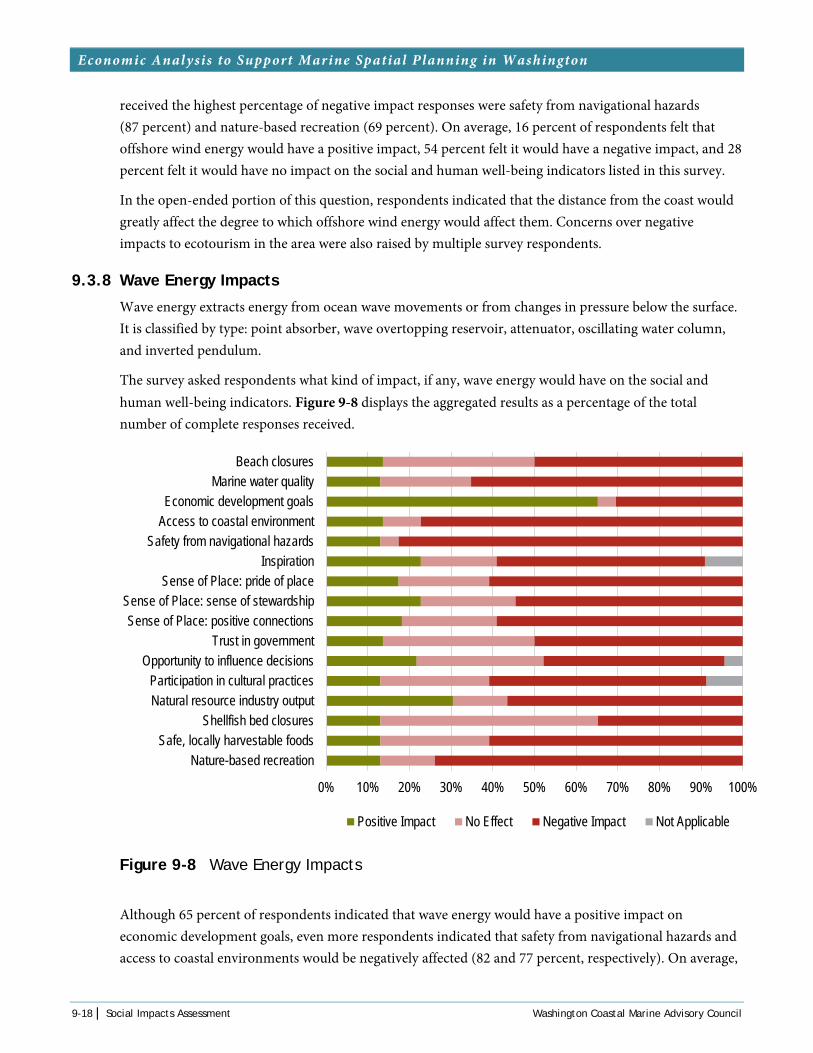
Economic Analysis to Support Marine Spatial Planning in Washington
received the highest percentage of negative impact responses were safety from navigational hazards (87 percent) and nature-based recreation (69 percent). On average, 16 percent of respondents felt that offshore wind energy would have a positive impact, 54 percent felt it would have a negative impact, and 28 percent felt it would have no impact on the social and human well-being indicators listed in this survey.
In the open-ended portion of this question, respondents indicated that the distance from the coast would greatly affect the degree to which offshore wind energy would affect them. Concerns over negative impacts to ecotourism in the area were also raised by multiple survey respondents.
9.3.8 Wave Energy Impacts
Wave energy extracts energy from ocean wave movements or from changes in pressure below the surface. It is classified by type: point absorber, wave overtopping reservoir, attenuator, oscillating water column, and inverted pendulum.
The survey asked respondents what kind of impact, if any, wave energy would have on the social and human well-being indicators. Figure 9-8 displays the aggregated results as a percentage of the total number of complete responses received.
Figure 9-8 Wave Energy Impacts
Although 65 percent of respondents indicated that wave energy would have a positive impact on economic development goals, even more respondents indicated that safety from navigational hazards and access to coastal environments would be negatively affected (82 and 77 percent, respectively). On average,
0% 10% 20% 30% 40% 50% 60% 70% 80% 90% 100%
Nature-based recreationSafe, locally harvestable foods
Shellfish bed closuresNatural resource industry outputParticipation in cultural practices
Opportunity to influence decisionsTrust in government
Sense of Place: positive connectionsSense of Place: sense of stewardship
Sense of Place: pride of placeInspiration
Safety from navigational hazardsAccess to coastal environmentEconomic development goals
Marine water qualityBeach closures
Positive Impact No Effect Negative Impact Not Applicable
9-18 | Social Impacts Assessment Washington Coastal Marine Advisory Council

Economic Analysis to Support Marine Spatial Planning in Washington
20 percent of respondents felt that offshore wave energy would have a positive impact, 56 percent felt it would have a negative impact, and 22 percent felt it would have no impact on the social and human well-being indicators listed in this survey.
Respondents felt that the navigational hazards associated with offshore wave energy would negatively affect the existing sustainable uses of the coast and have significant impacts on the local economy. While some respondents supported the effort to find new alternative to renewable energy, they did not feel that wave energy would be the best fit for their community.
9.3.9 Tidal Energy Impacts
Tidal energy extracts energy from a steady water flow, typically through an existing narrow channel. It is classified by type: horizontal- and vertical-axis turbines, oscillating hydrofoil, and venture-effect turbines.
The survey asked respondents if tidal energy would have a positive impact, negative impact, or no impact on the social and human well-being indicators. Figure 9-9 displays the aggregated results as a percentage of the total number of complete responses received.
Figure 9-9 Tidal Energy Impacts
The two indicators that received the highest percentage of positive impact responses are economic development goals (74 percent) and natural resource industry output (35 percent). Safety from navigational hazards and nature-based recreation are the two indicators that received the highest percentages of negative impact responses, with 70 percent and 65 percent of responses, respectively. On
0% 20% 40% 60% 80% 100%
Nature-based recreationSafe, locally harvestable foods
Shellfish bed closuresNatural resource industry outputParticipation in cultural practices
Opportunity to influence decisionsTrust in government
Sense of Place: positive connectionsSense of Place: sense of stewardship
Sense of Place: pride of placeInspiration
Safety from navigational hazardsAccess to coastal environmentEconomic development goals
Marine water qualityBeach closures
Positive Impact No Effect Negative Impact Not Applicable
Washington Coastal Marine Advisory Council Social Impacts Assessment | 9-19

Economic Analysis to Support Marine Spatial Planning in Washington
average, 19 percent of respondents felt that tidal energy would have a positive impact, 49 percent felt it would have a negative impact, and 24 percent felt it would have no impact on the social and human well-being indicators listed in this survey.
Concerns were raised regarding damage done to the marine environment during the construction and installation of tidal energy structures. Navigational hazards and impacts on local fishing industries were also concerns raised in the open-ended portion of this question.
9.3.10 Qualitative Impact Assessment
The final task presented to survey respondents was rating the eight potential new uses of coastal zone areas by the qualitative level of impact (high, medium, low, or no effect). Figure 9-10 displays the aggregated results as a percentage of the total number of complete responses received for this final survey question.
Figure 9-10 Qualitative Impact Assessment
Respondents indicated that both gas hydrates and marine sand and gravel mining would have a high social impact and that marine product extraction would have a medium social impact. Tidal energy appears to have the lowest perceived social impact of the potential new uses presented in this survey.
In the open-ended portion of this question, multiple respondents indicated that their responses to the survey questions may have been fueled by the fear of potential problems or malfunctions more than by concerns about the day-to-day operations of the proposed new activities. Many respondents also indicated that they lacked adequate information to make an
0% 20% 40% 60% 80% 100%
Marine Product Extraction
Offshore Aquaculture
Dredge Disposal
Gas Hydrates
Marine Sand and Gravel Mining
Marine Renewable Energy: Wind
Marine Renewable Energy: Wave
Marine Renewable Energy: Tidal
Low Impact Medium Impact High Impact No Effect
(cc) Mickey Thurman, 2015
Sunset at Grays Harbor
9-20 | Social Impacts Assessment Washington Coastal Marine Advisory Council

Economic Analysis to Support Marine Spatial Planning in Washington
informed decision on many of the proposed uses that they were not familiar with. Recreational use of the area in question is highly valued, and many respondents viewed the potential new uses as potentially limiting or inhibiting recreational use.
REFERENCES
Butler, K., C. Fryday, M. Gordon, Y. Ho, S. McKinney, M. Wallner, and E. Watts. 2013. Washington’s Working Coast: An Analysis of the Washington Pacific Coastal Marine Resource-based Economy. University of Washington Environmental Management Certificate Program.
Breslow, S., D. Holland, P. Levin, K. Norman, M. Poe, et al. 2015. Human dimensions of the CCIEA: A summary of concepts, methods, indicators, and assessments. CCIEA Phase III Report 2013: Human Dimensions. NOAA Fisheries, NWFSC. Available at: www.noaa.gov/iea/Assets/ documents/HumanDimensions_Final.pdf.
Cutter, S. L., J. T. Mitchell, and M. S. Scott. 2000. Revealing the vulnerability of people and places: a case study of Georgetown County, South Carolina. Annals of the Association of American Geographers 90:713-737.
Jacob, S., P. Weeks, B. G. Blount, and M. Jepson. 2012. Development and evaluation of social indicators of vulnerability and resiliency for fishing communities in the Gulf of Mexico. Marine Policy 26:16-22.
Norman, K., J. Sepez, H. Lazrus, N. Milne, C. Package, S. Russell, K. Grant, R. Peterson, J. Primo, M. Styles, B. Tilt, and I. Vaccaro. 2007. Community Profiles for West Coastal and North Pacific Fisheries – Washington, Oregon and California, and other U.S. States. NMFS-NWFSC-85.
Poe, M. R., K. C. Norman, and P. S. Levin. 2014. Cultural dimensions of socioecological systems: key connections and guiding principles for conservation in coastal environments. Conservation Letters 7:166-175.
Poe, M., M, Watkinson, B. Trosin, K. Decker. Forthcoming. Social Indicators for Washington Coastal Counties. Report to Washington Department of Natural Resources in fulfillment of Interagency Agreement No. IAA 14-204. Washington Sea Grant WSG-TR 15-xx.
Stiles, K., K. Biedenweg, K.F. Wellman, L. Kinter, D. Ward. 2015. Human Wellbeing Vital Signs and Indicators for Puget Sound Recovery. A Technical Memorandum for the Puget Sound Partnership.
PERSONAL COMMUNICATIONS
Breslow, Sara. Researcher, NOAA, Northwest Fisheries Science Center. Personal communication with K. F. Wellman of Northern Economics, Inc., on February 11, 2015, regarding NWFSC indicator development.
Washington Coastal Marine Advisory Council Social Impacts Assessment | 9-21

Economic Analysis to Support Marine Spatial Planning in Washington
IMAGES
Chapter 9 Header Image: (cc) Jeff Wilcox, 2005. Silhouettes in the alki beach sunset. Retrieved May 6, 2015, from: https://www.flickr.com/photos/jeffwilcox/95649932
Page 9-11: Tara Schmidt, 2014. Oysters. Retrieved July 6, 2015, from: www.flickr.com/photos/ taramarie/15578128844
Page 9-19: Mickey Thurman, 2015. Grays Harbor at Hoquiam. Retrieved July 6, 2015, from: www.flickr.com/photos/hokyumgrl/16569398542
9-22 | Social Impacts Assessment Washington Coastal Marine Advisory Council
CHAPTER 10. Risk and Vulnerability of Marine-dependent Sectors
It is obvious at first glance that the Washington coast economy and the base sectors upon which it relies – commercial fishing, shellfish aquaculture, recreation and tourism, recreational fishing, shipping – is highly marine dependent. What may not be as obvious is the extent to which businesses within these sectors, and the support businesses that supply or serve them, are vulnerable to factors affecting the marine environment, or to other factors beyond their control. Unlike industries that are not marine resource-dependent, with few exceptions they do not have the ability to relocate to where conditions are better or opportunities more fruitful or abundant. These industries also face “critical mass” limitations. There is a balance among resource-dependent businesses, suppliers, and buyers, and reductions in any one below a certain minimum threshold have the potential to risk the viability of an entire industry. In addition, there is a high degree of co-dependence among the different sectors; for example, coastal tourism and commercial fishing can, and often have, a synergistic relationship, benefiting both sectors. Similarly, a significant loss or downsizing of one sector can have negative consequences on the other.
This chapter explores the exogenous risks and vulnerabilities affecting marine-dependent industries, and the coastal economy in general. In particular, issues are discussed that affect the viability of the individual sectors. In some cases, the industries have the ability to adjust and adapt to changes in conditions affecting the industry; in other cases, the options to adapt are more limited. The risks and vulnerabilities factor into the resilience of the industry in the face of potential impacts from new uses, discussed in Chapter 11, and whether or not the impacts rise to the level of significance.
The marine spatial planning process entails a view of conditions twenty years into the future. The key industries identified elsewhere in the report, and the local populations along the coast face risks, uncertainties, and vulnerabilities within this 20-year forecast period. Some of the risks and vulnerabilities are driven by economic and demographic issues, others by biological uncertainties and forces of nature, or uncertainty in public policy.
Washington Coastal Marine Advisory Council Risk and Vulnerability of Marine-dependent Sectors | 10-1

Economic Analysis to Support Marine Spatial Planning in Washington
10.1 COMMERCIAL FISHING
Certain risks and vulnerabilities facing the commercial fishing and seafood processing industry on the Washington coast were identified in the Marine Sector Analysis Report: Non-Tribal Fishing (Industrial Economics [IEc] 2014a). The following section discusses those issues as well as additional issues that have surfaced during the course of this study.
10.1.1 Economic and Regulatory Issues
The economics of commercial fishing are constantly changing as a result of many factors, including: introduction of new technology; competition from other vessels, fisheries elsewhere, and farm-raised supplies; changing consumer demand; fluctuating currency exchange rates; and politically motivated trade restrictions both at home and abroad.
Dependence on Commercial Fishing
Many Washington coast communities are heavily invested in commercial fisheries-related activities, with a large share of local income and employment directly or indirectly derived from fishing. When shellfish aquaculture and recreational fishing activities are included, the involvement level in the marine-based sectors is even greater. A recent report listed Pacific County as the 4th most “fishing-intensive” county in the United States (measured by estimated earnings from commercial fishing as a share of total county earnings) (Kearney et al. 2014). This ranking, even though it excludes earnings from seafood processing and recreational fishing, makes Pacific county among the most fishing-intensive counties in the nation, and certainly the highest in Washington State.
Increasing Costs
The sector report for non-tribal fisheries listed barriers to entry as a key vulnerability affecting the future of the commercial fishing industry. Specifically the report cited as an example the increasingly high initial cost to obtain the permits, vessel and gear necessary to participate in the Dungeness crab fishery. Current (June 2015) listings on Permitmaster.com for Washington coast Dungeness crab permits range from $110,000 for a 300-pot permit to $300,000 for a 500-pot permit. The website also lists 500 used crab pots for sale for $80,000. A modern, seaworthy, 50 foot steel-hull vessel with necessary deck, communications and safety gear could easily cost $400,000. So the cost range cited in the report of between $250,000 and $1.0 million to enter the Dungeness crab fishery seems very plausible (IEc 2014a).
Need to Diversify
At the same time that entry costs are rising, uncertainty surrounding available annual fishery quotas and seasons has made it increasingly necessary for Washington coast fishermen to participate in a portfolio of multiple commercial fisheries in order to maintain cash flow throughout the year. The mainly available opportunities include Dungeness crab, ocean troll and inside waters gillnet fisheries for salmon, albacore
(cc) Kat+Sam, 2009
Commercial fishing vessel
10-2 | Risk and Vulnerability of Marine-dependent Sectors Washington Coastal Marine Advisory Council

Economic Analysis to Support Marine Spatial Planning in Washington
troll, and fixed gear fisheries for groundfish and halibut, among others. While participation in multiple fisheries increases the range of income-earning opportunities, each fishery requires a unique combination of permits, gear and vessel configuration that impose large upfront costs that must be paid (or borrowed) well before any fishing actually takes place.
Diversification of commercial fishery portfolios by Washington coast participants extends to Alaska, especially gillnet fisheries for salmon. Washington coast residents currently hold 152 Alaska salmon permits, including 81 combined Bristol Bay drift gillnet and set gillnet permits and 24 Cook Inlet drift gillnet permits (see Table 4-23 in Chapter 4). Maintaining the permits, vessels and gear necessary to participate in these relatively short duration, annual, distant-water fisheries necessitates incurring significant additional upfront costs.
Groundfish Trawl Rationalization
The sector report also cited concerns about concentration of ownership that is occurring in the rationalized groundfish trawl fishery. The concern is that permit buybacks, retirements and additional pressure to reduce fixed costs in order to acquire the individual transferable quota (ITQ) necessary to participate in West Coast groundfish trawl fisheries has resulted in fewer participating vessels clustered into a smaller number of ports. Table 10-1 shows that the number of groundfish trawl vessels registered to owners in Washington coast communities declined from 36 in 1994 to 5 in the most recent years. Similarly the number of Washington coast communities hosting vessels with groundfish trawl permits declined from 10 in 1994 to 4 in the last two years. These trends feed fears by independent fishermen on the Washington coast that they will no longer have a role in this important fishery.
Table 10-1 Number of Vessels Registered to Groundfish Trawl Permits by Vessel Owner’s Residence, Selected Years 1994−2015
Community 1994 1995 2001 2002 2003 2004 2005 2010 2011 2012 2013 2014 2015
Aberdeen 7 5 3 3 3 3 3 2 1 1 1 1 1
Grayland 2 - - - - - - - - - - - -
Hoquiam 1 1 - - - - - - - - - - -
Ilwaco 2 1 - - - - - - 2 2 2 2 2
Long Beach 2 1 - - - - - - - - - - -
Naselle - - - - - - 1 - - - - - -
Ocean Park 1 1 2 2 2 - - - - - - - -
Port Angeles 2 2 1 1 1 1 2 1 1 - - - -
Sequim 1 - 1 1 1 - - - - - - - -
South Bend 3 1 2 2 2 1 1 1 1 1 1 1 1
Westport 15 6 5 5 4 - - 1 1 1 1 1 1
Total 36 18 14 14 13 5 7 5 6 5 5 5 5
Source: National Oceanic and Atmospheric Administration, National Marine Fisheries Service (NOAA Fisheries) 2015.
Washington Coastal Marine Advisory Council Risk and Vulnerability of Marine-dependent Sectors | 10-3

Economic Analysis to Support Marine Spatial Planning in Washington
An additional concern was expressed regarding sector allocations for certain groundfish species caught as bycatch in the main trawl target fisheries. The concern is that if sector allocations for overfished species such as dark-blotched rockfish and yelloweye rockfish were caught, then unspecified emergency area restrictions and/or a shortened season may result. It is also conceivable that exceeding the very limited catch allowances for yelloweye rockfish may spill over and affect other commercial and/or recreational fisheries, although since about 2002 when rebuilding plans for these overfished rockfish species began to be implemented, there have been no early closures of commercial groundfish fisheries due to early attainment of sector allocations or catch allowances (although early closure of recreational groundfish fishing did occur in one year during this time period).
Dungeness Crab Regulation
There are concerns about the future viability of the Dungeness crab fishery, which in most years is the single most valuable commercial fishery conducted off the Washington coast. The Washington Department of Fish and Wildlife’s (WDFW’s) “Fair Start” commercial fishery regulations and the compressed nature of the crab market cycle push most of the fishery’s effort and catch into the opening few weeks of the season (i.e., between Thanksgiving and Chinese New Year) (WDFW 2015a). These factors fuel intense competition for the limited crabbing grounds off the southern Washington coast, especially during the early part of the season.
“Klipsan line” (46°28.00″ North latitude)
Figure 10-1 Distribution of Dungeness Crab Effort off the Washington Coast Source: Washington Marine Spatial Planning (MSP) 2015.
Evidence from vessel logbooks suggests that during the early part of the season, regulations that are designed to control effort in certain areas push the density of deployed crab pots to be very high south of Point Chehalis (mouth of Grays Harbor), especially near the “Klipsan line” (46° 28.00″ North latitude)
10-4 | Risk and Vulnerability of Marine-dependent Sectors Washington Coastal Marine Advisory Council

Economic Analysis to Support Marine Spatial Planning in Washington
which demarcates areas that are open at the very beginning of the Dungeness crab season from areas to the north that open later (WDFW 2015b).
Another issue possibly making the Dungeness crab fishery more vulnerable is that under current regulations Dungeness crab fisheries are managed by the states, even in federal waters beyond 3 miles offshore. However this authority is scheduled to expire in 2016 after which time another management regime possibly may emerge. This potential decision point about future management of the Dungeness crab fishery creates additional uncertainties, especially for vessel owners and processors considering making capital investments in the near term (IEc 2014a).
Salmon Fisheries
The commercial gillnet fisheries conducted for salmon species in the Columbia River, Willapa Bay and Grays Harbor have come under increasing pressure to reduce catch of native or natural salmon runs occurring in those rivers and estuaries. Recently, commercial gillnet quotas have been reduced and increased restrictions have been imposed on the areas, days and times when this fishing can occur. Since these gillnet fisheries are a key component of the fisheries portfolios of many participants, and have been a cornerstone of the economies of coastal and Columbia River communities, their apparent decline provides another example of the vulnerability of participants in Washington coast commercial fisheries to economic and regulatory factors largely beyond their control.
The list of additional concerns over the long-term viability of commercial salmon fisheries includes: cyclical and apparent long term ocean warming trends; predation in the Columbia River estuary of returning salmon by California sea lions, and of young, outmigrating salmon by cormorants and Caspian terns; reduction in hatchery production due to factors including suggestions that hatchery production may have a negative impact on wild salmon, and uncertainty over federal funding. Since salmon spawn in rivers and streams, they are also very susceptible to land and water use issues far removed from the coastal environment, including pollution and silting of streams resulting from agriculture, road building and logging; and management of dams for hydropower generation, water storage and flood control.
Pacific Halibut
Pacific halibut are an important fishery species off the Washington coast, caught in directed commercial, recreational and tribal fisheries, but also taken as bycatch in many other commercial fisheries. Sector quotas and incidental catch allowances for Pacific halibut are derived annually from amounts determined under international treaties. Recently Pacific halibut quotas and bycatch allowances are coming under increasing pressure as a result of lower stock projections. Uncertainty over the level and distribution of Pacific halibut quotas and bycatch allowances and
Photo courtesy NOAA
Pacific halibut
Photo courtesy BLM
Chinook salmon
Washington Coastal Marine Advisory Council Risk and Vulnerability of Marine-dependent Sectors | 10-5

Economic Analysis to Support Marine Spatial Planning in Washington
associated harvest regulations can be expected to affect Washington coast commercial and recreational fisheries in the future.
10.1.2 Environmental Factors
Ocean acidification and other environmental processes may also threaten the commercial fishing industry on the coast. The negative effects of acidification on growth rates and survival of oysters and other shellfish have been demonstrated. The impacts on Dungeness crab are not as well known, but research studies are underway to determine impacts on crab larvae. Ocean acidification has been identified as an issue affecting growth rates of pteropods, a key food source for juvenile salmon (IEc 2014a). The possible effects of ocean acidification on the increasingly important Washington coast pink shrimp fishery may also merit attention.
The example of the West Coast Pacific sardine fishery highlights the not well understood effects that ocean conditions have on the productivity of commercial fish stocks. Recent catch in the Pacific sardine fishery has ranged from a low of 9.7 million lbs in 2006 to a high of 77.6 million lbs in 2012, back down to 17.4 million lbs in 2014. The directed fishery for sardines was recently closed for the remainder of 2015 and is not likely to open in 2016 and perhaps not for several years after that. Pacific sardines may be a key forage species for other commercially caught species, such as Pacific whiting and salmon, as well as for protected marine species such as whales. As a result, the virtual disappearance of commercially harvestable sardine stocks may presage additional adverse effects on other fisheries and marine uses in the future (Pacific Fishery Management Council 2015).
Pacific Ocean water temperature conditions are known to affect the distribution and availability of commercial fish species. For example, the widely pursued albacore fishery is usually only available off the Washington coast in late summer, when a plume of warm water from the south reaches northern latitudes on the California Current. Likewise, Pacific whiting are known to follow water temperature gradients from south to north during the season. This factor coupled with annual variations in total allowable catch amounts and sector allocations contributes to considerable variability in where and when Pacific whiting harvest occurs off the West Coast. For example, the share of catch taken off Washington by the at-sea Pacific whiting sectors varies substantially from year to year, with 2014 representing a low for the catcher-processor sector and a near low for the mothership sector (Table 4-7 in Chapter 4). To what degree this variability is related to ocean temperature conditions is not known, but the current warming trend may affect the distribution and availability of commercial species and their prey in unexpected ways in the future (Pacific Fishery Management Council 2014).
10.2 RECREATIONAL FISHING
Certain risks and vulnerabilities have the potential of adversely affecting the recreational fishing industry along the Washington coast. This section summarizes issues identified in the Marine Sector Analysis Report: Non-Tribal Fishing (IEc 2014a), as well as other issues important to the coastal recreational fishing industry in Washington.
10-6 | Risk and Vulnerability of Marine-dependent Sectors Washington Coastal Marine Advisory Council

Economic Analysis to Support Marine Spatial Planning in Washington
10.2.1 Regulatory and Economic Issues
The popularity and economic value of marine recreational fishing is substantially influenced by resource conditions and the resulting quality of the fishing experience. Resource conditions affect catch, which in turn affects the fishing experience for most anglers. This section describes regulatory and economic issues that affect resource conditions of key species that support the ongoing viability of the recreational fishing industry along the Washington coast.
Two groundfish species that inhabit the marine waters off the Washington coast are the canary and yelloweye rockfish. Stock rebuilding plans for both species were implemented in about 2002 and, since then, recreational fisheries for these species were closed once prematurely. Although the Pacific Fishery Management Council adopted a proposal in June 2015 that declares that stocks of the canary rockfish were rebuilt (M. Cedergreen, pers. comm., 2015), yelloweye rockfish stocks are still considered depleted. Recreational fishing for all groundfish was closed after Labor Day in 2014 when the state guideline for harvesting yelloweye rockfish was projected to have been reached (H. Reed, pers. comm., 2015). Retention of yelloweye and canary rockfish is prohibited year round.
Although there has been no closure of commercial fisheries affecting these species since 2002, meeting the allowable catch quotas—particularly for the yelloweye rockfish—could affect both recreational and commercial fisheries in the future. If stocks do not rebuild as planned, potential restrictions on recreational fisheries include premature season closures and/or catch restrictions. As described in Chapter 6, Recreational Fishing, fishing for groundfish is one of the most popular marine recreation fishing activities along the Washington Coast, accounting for about 29 percent of all charter boat trips and about 13 percent of all private boat trips between 2004 and 2013.
The production and survivability of salmon in the coastal area is an issue that has the potential to adversely affect (or already is adversely affecting) recreational (and commercial) salmon fisheries along the Washington coast. As described in greater detail in Section 10.2 above, key issues affecting salmon production and survivability include oceanic conditions and climatic shifts, predation, and reduced hatchery production. In addition to these factors, the Governor’s Salmon Recovery Board has identified other causes of salmon declines, including destruction of salmon habitat, pollution of waterways and habitat, the presence of stream-blocking dams, and overfishing. As described in Chapter 6 Recreational Fishing, fishing for salmon is the most popular marine recreation fishing activity along the Washington Coast, accounting for about 56 percent of all charter boat trips and about 74 percent of all private boat trips between 2004 and 2013.
Although time and area closures of recreational fisheries are limited, they do occur for various purposes, including the protection of sensitive bottom habitats, recovery of overfished rockfish, and the need for resource sharing. According to mapping information available from the Washington MSP website (refer to Figure 6-1 in Chapter 6 of this report) and based on WDFW sport fisheries management regimes for 2014, area restrictions on recreational fishing are isolated. Also, other than for recreational halibut fishing,
Photo courtesy SIMoN 2004
Yelloweye rockfish
Washington Coastal Marine Advisory Council Risk and Vulnerability of Marine-dependent Sectors | 10-7

Economic Analysis to Support Marine Spatial Planning in Washington
most of the popular recreational fisheries are either open year round (groundfish) or during extended periods, such as March through October for ling cod and late May through mid-June and mid-June through late September for salmon. As mentioned above, recreational fishing for all groundfish was closed after Labor Day in 2014 when the state guideline for harvesting yelloweye rockfish was projected to have been reached. Recreational fishing for halibut in 2014 was limited to four or five days (depending on area) in May.
Opportunities for recreational fishing for halibut are limited primarily by the high level of effort combined with a relatively small quota, resulting in a small number of fishing days (H. Reed, pers. comm., 2015). The limited opportunities for recreational halibut fishing off the Washington coast also are partly intended to reduce impacts on yelloweye rockfish, which are caught incidentally in deep water when lingcod are targeted (M. Cedergreen, pers. comm., 2015). Depth restrictions and groundfish retention restrictions are the primary tools used to limit encounters with yelloweye and canary rockfish (H. Reed, pers. comm., 2015).
As discussed in Section 10.2, regulatory uncertainty makes it difficult for businesses directly involved in fisheries, such as charter boat operators or marinas, to make long-term capital investment decisions. For example, the uncertainty over how long the halibut season will last each year makes it difficult for businesses that provide services to halibut anglers, such as charter operations, fishing resorts, hotels, and campgrounds, to prepare for the influx of halibut anglers.
10.2.2 Environmental Issues
As described in Section 10.2, the risks of ocean acidification are a concern to the recreational fishing industry, as it has the potential to affect targeted finfish and shellfish. Recognizing the importance of this issue, the Governor’s office has taken a number of actions in the past several years to promote research to address the issue. A Washington State Blue Ribbon Panel on Ocean Acidification was convened in 2012 to develop actions to address the causes and consequences of acidification. The legislature established the Marine Resource Advisory Council (MRAC) to advise on ocean acidification, and set up (and funded) the Washington Center for Ocean Acidification (housed at the University of Washington) to conduct research on ocean acidification.
One additional environmental concern to the recreational fishing industry relates to high levels of domoic acid in razor clams. Harvested primarily along the southern portion of the Washington coast, high toxicity levels resulted in the premature closure of this razor clam fishery in May 2015. As noted in Chapter 6, Recreational Fishing, digging for razor clams is a very popular activity along the southern Washington coast.
10.3 SHELLFISH AQUACULTURE
10.3.1 Regulatory Issues
Industry representatives perceive the existing regulatory structure and permitting process as a threat to the continued success of the shellfish aquaculture industry (IEc 2014b). Concerns include: (1) resources
10-8 | Risk and Vulnerability of Marine-dependent Sectors Washington Coastal Marine Advisory Council

Economic Analysis to Support Marine Spatial Planning in Washington
required to comply and keep up with permit application/renewal, reporting requirements, etc.; (2) as a result of new permit requirements, the industry is vulnerable to additional challenges from conservation organizations which can result in expensive legal proceedings; (3) environmental requirements with which shellfish farms must comply are burdensome; and (4) it is difficult to operate under existing regulations which are tied to the fact that the industry is regulated as a “fishery” rather than as an agricultural producer.
Some regulatory uncertainties faced by the industry are listed below. Potential future regulations may limit producers from maintaining and rehabilitating existing critical over-water structure (D. Nisbet, pers. comm., 2014). Compliance with new Department of Health rulings regarding regular monitoring of temperature and vibrio outbreaks may increase labor expenses to growers. Environmental Issues
Invasive and Native Noxious and Nuisance Species
A variety of invasive and native noxious and nuisance species, including burrowing shrimp, Japanese eelgrass, and oyster drills, are currently perceived by interviewed representatives to be the greatest threat to the continued economic viability of the aquaculture industry on the coast (IEc 2014b). Probably the most uncertainty surrounds burrowing shrimp. There has been a substantial increase in populations since the 1950s. While there is no conclusive evidence to explain the expansion of this species, potential causes include declining populations of shrimp predators, channel dredging, soil erosion, the effects of El Niño, and possible changes in salinity levels (IEc 2014). The pesticide carbaryl was permitted by Ecology in the 1980s and 1990s for use in controlling burrowing shrimp in Willapa Bay and Grays Harbor, following environmental impact statements (EISs) prepared in 1985 and 1992 (Ecology 2006). In 2002 the first National Pollutant Discharge Elimination System (NPDES) permit for control of burrowing shrimp on commercial shellfish beds was issued; this followed a Ninth Circuit Court of Appeals ruling that required NPDES permits for water quality modifications (Ecology 2006, p. 3). In 2006, Washington Department of Ecology (Ecology) renewed the permit. An application was subsequently submitted by the Willapa Grays Harbor Oyster Growers Association (WGHOGA) to Ecology for a permit to use a new pesticide, Imidacloprid, as carbaryl was phased out under a mutual agreement. In response to concerns raised by the public and its customer base, however, the WGHOGA withdrew its permit application on May 3, 2015; Ecology complied and canceled the permit the next day (Ecology 2015b). This decision leaves the industry at risk from the adverse effects of burrowing shrimp without a suitable alternative. With no control there is tremendous uncertainty around those effects. Patten (pers. comm., 2015) suggests that there is the potential for significant declines in production (10-20 percent per year) in areas where there are high shrimp populations and bottom culture is the predominate technology. The most affected growers believe that they will be driven out of the industry if there are several future years of high recruitment of burrowing shrimp, posing a potential for an industry collapse.
Photo courtesy USDA
Washington Coastal Marine Advisory Council Risk and Vulnerability of Marine-dependent Sectors | 10-9

Economic Analysis to Support Marine Spatial Planning in Washington
Ocean Acidification
Another area of significant uncertainty to the shellfish aquaculture sector is the effects of ocean acidification (OA). As outlined in Huppert et al. (2012) hydrographic surveys and modeling studies have confirmed that the uptake of carbon dioxide (CO2) by the oceans has resulted in a lowering of seawater pH by about 0.1 since the beginning of the Industrial Revolution (Feely et al., 2008). A drop by one pH unit corresponds to a ten-fold increase in the concentration of hydrogen ions, thus making the water more acidic (Doney 2006). Lower pH levels have been found to decrease calcification rates in mussels, clams, and oysters because the reaction of CO2 with seawater reduces the availability of carbonate ions that are necessary for calcium carbonate (CaCO3) skeleton and shell formation for a number of marine organisms. Many species of juvenile shellfish may be highly sensitive to lower-than-normal pH levels, resulting in higher rates of mortality directly correlated with the higher CO2 levels (Feely et al, 2008). A growing number of studies have shown that the survival of larval marine species, including commercial shellfish, is reduced by ocean acidification. Acidity levels in upwelled waters off the Pacific Coast have already begun increasing faster than anticipated (Feely et al., 2008). Because these changes will be large and will occur quickly, and because human development has fragmented species into small and vulnerable populations, there is concern that future climate changes will be more stressful to species than past changes (Tangley 1988). Hence, while there is great uncertainty about the future path of acidification and resulting impacts, there are also potentially great risks of significant changes in the species composition and vulnerability of ocean ecosystems that support shellfish.
According to Ekstrom et al. (2015), while the Pacific Northwest exhibit only medium and medium-low social vulnerability to OA, these areas are particularly economically sensitive and lie adjacent to marine ecosystems highly exposed to global OA. Ocean acidification has already cost the oyster industry in the Pacific Northwest nearly $110 million, and directly or indirectly jeopardized 3,200 jobs (Washington State Blue Ribbon Panel on Ocean Acidification 2012). Scientists believe that OA is the likely cause of the failure of the natural oyster set in recent years (Welch 2012), and of the significant die offs of hatchery produced larvae that were being grown in local seawater (NOAA PMEL Carbon Program 2014). The impacts of OA on sensitive spat has resulted in the need for one grower to move hatchery operations to Hawaii. This has resulted in significant capital, operations and maintenance, and transportation costs. Many growers will not have the means to relocate hatcheries if they own one or face rising costs of purchased spat.
Sea Level Rise
According to the Washington Department of Ecology (2015), sea level is projected to rise 24 inches along the coast of Washington in the next century. As outlined in Huppert et al. (2012) sea level rise (SLR) may affect coastal habitats through the inundation and shift of habitat types on existing beaches. SLR would have a minimal impact on mussel and oyster culture on rafts or other floating structures (Pacific Coast Shellfish Growers Association 2008). However, most shellfish culture occurs on the intertidal substrate, where SLR will directly affect access to these lands through changes in the high and low tide ranges (Pacific Coast Shellfish Growers Association 2008). If the aquaculture sites do not migrate landward, SLR reduces access to aquaculture beds because of increased water coverage. A 0.16-meter (m, or 0.53-foot
10-10 | Risk and Vulnerability of Marine-dependent Sectors Washington Coastal Marine Advisory Council

Economic Analysis to Support Marine Spatial Planning in Washington
[ft]) rise in sea level could lead to an increase in water coverage and a reduction in harvest time of 13%, while a 0.31-m (1-ft) rise in sea level could lead to an increase in water coverage and a reduction in harvest time of 31 percent (Cheney and Dewey 2006). The increased water coverage will reduce workdays for shellfish growers because they typically work at low tide. It is very difficult to plant, harvest, or tend partially or completely submerged oysters (Gordon et al. 2003). A further complexity is the issue of shoreline armoring, which affects the availability of tidelands for shellfish farming, as shoreline armoring tends to increase beach erosion and change the characteristic of the beach sediment. Since SLR will shift beach profiles landward, there may be no reduction in sub-tidal habitat overall, but the optimal growing areas may be shifted off of the farmer’s property or lease (Cheney and Dewey 2006). At present, “average high tide” or “ordinary high water” is treated as a stable boundary line that separates upland property from inter-tidal areas used for shellfish aquaculture. In the future, however, SLR may create ambiguity in the definition of the property rights due to a shift in where the actual high tide occurs. The high tide with SLR will be further inland. One option would be to retain the definition of tidelands and shoreline property boundaries, but recognize explicitly that these boundaries are moving upland as sea level rises – an option entitled “rolling easements” (Titus 1986).
Water Quality
Huppert et al. (2012) describe how increased sea surface temperature could impact the shellfish aquaculture industry in several ways. Negative effects of increased temperature could include reduced shellfish growth, reproduction, distribution, and health (Cheney and Dewey, 2006). In particular, harmful algal blooms (HABs) are blooms of algae, can produce potent natural toxins that cause harmful physiological effects (including illness or death) when they are concentrated within filter feeding shellfish and fish. Humans and other animals are exposed to the HAB toxins by ingesting the contaminated fish or shellfish and by consumption, aerosol inhalation, or skin contact with contaminated water. Paralytic shellfish poisoning (PSP) from dinoflagellates in the genus Alexandrium and amnesiac shellfish poisoning, caused by domoic acid created by diatoms Pseudo-nitzschia, are the primary problems on the West Coast (Horner et al. 1997). Other species of dinoflagellates can cause a range of illnesses, such as neurotoxic shellfish poisoning, diarrheic shellfish poisoning, and ciguatera fish poisoning. These also cause fish, bird, and marine mammal die-offs (Patz et al. 2006). Over the past decade, evidence of a relationship between climate and the magnitude, frequency, and duration of HABs has suggested that the seasons when HABs occur may expand as a result of climate change. Sea surface temperature and upwelling have both been linked with HABs (Patz et al. 2006).
The Washington Department of Health (DOH) is responsible for monitoring water quality in shellfish growing areas. According to IEc, since 2003, DOH has issued 38 closures of growing areas in Willapa Bay and Grays Harbor due to water quality concerns. Typically viruses tend to occur in cooler months, bacteria tend to be more problematic in warmer months, and toxins throughout the year. In the late spring of 2015 federal biologists discovered the largest toxic algae bloom ever recorded off the West Coast (Seattle Times, June 16, 2015). A combination of paralytic shellfish poisoning, demoic acid poisoning, and diarrheic shellfish poisoning have led to coastwide closers of shellfish beds. This may be, as indicated in the IEc sector analysis, a result of increased water temperature being experienced the last several years.
Washington Coastal Marine Advisory Council Risk and Vulnerability of Marine-dependent Sectors | 10-11

Economic Analysis to Support Marine Spatial Planning in Washington
DOH is concerned that the nature and diversity of toxins found in the water will turn to new and more dangerous forms. This situation may ultimately limit the ability of DOH to approve raw oysters for consumption – something that would result in significant negative economic impacts to the industry as oysters on the half shell are a highly valued commodity.
IEc also notes the impacts of development and industrialization in Grays Harbor has risks to water quality as do the possibility of three separate developments related to the transportation of crude oil by rails. Other threats include conversion of timber land to residential and commercial development, and discharges from two existing pulp mills, an active port and a river system that transports water of poor quality from as far away as Centralia and Chehalis, Washington (IEc 2014b).
Failure of a Natural Set
According to IEc (2013) historically, many of the shellfish farms in Willapa Bay relied upon the natural set of oysters to seed actively farmed beds. Beginning in the mid-2000s, the area began to experience a failure of this natural set. Although the cause of this change is not confirmed, oceanographers suspect it is likely due to increased water acidity resulting from climate change (Welch 2012). As a result of this failure, most farms now rely upon larvae from hatcheries to seed their beds. IEc reports that for one operation, this need has increased the cost of the seeding process alone by five to six times, and has required the purchase of additional equipment that was previously unnecessary. As discussed earlier, one company opened a hatchery in Hawai’i in response to this issue. Other consequences of the natural set failure according to IEc include:
Reduced production, and an inability to meet market demand due to the additional labor required to maintain production;
The inability of certain farms to maintain production, due either to lack of appropriate grounds for hatchery-based operations or constraints on the supply of hatchery seed (especially for smaller farms that lack substantial purchasing power); and
Heightened economic risks stemming from the substantial upfront costs associated with relying on hatchery seed, coupled with the potential for harvests to fail due to a variety of factors, including the threat posed by burrowing shrimp.
An additional consequence of set failure related to the Willapa Harbor State Oyster Reserve. This reserve depends completely on the occurrence of natural sets of larvae. Without these natural events, the reserve supply is diminished and thus its seeding program is threatened. This seed reserve provides income of approximately $200,000 per year to the operations of the reserve management (B. Sheldon, pers. comm., 2015). Oysters occurring on these particular tide lands contribute to the habitat and water quality ecosystem services provided by all shellfish operations in the Bay.
10.3.2 Economic Issues
Economic uncertainties include the impact of burrowing shrimp, as indicated above. The potential for increased regulatory costs also may have a significant impact on industry sustainability. Several industry
10-12 | Risk and Vulnerability of Marine-dependent Sectors Washington Coastal Marine Advisory Council

Economic Analysis to Support Marine Spatial Planning in Washington
representatives raised the issue of the high cost to their companies in order to support the permitting process to maintain a burrowing shrimp control program alone. One company reported that they spent nearly $0.5 million dollars dealing with burrowing shrimp, one of their largest expenses over the past several years (IEc 2014b).
There are also heightened economic risks stemming from the need to rely on larvae from hatcheries to seed beds with a failure of natural set and impacts of OA. There are substantial upfront costs associated with relying on hatchery seed, coupled with the potential for harvest to fail due to a variety of other factors, including the threat posed by burrowing shrimp (IEc 2014c). Other consequences of a natural set failure are the reduced production and inability to meet market demand due to the additional labor required to maintain production and the inability of certain farms to maintain production due to either the lack of appropriate grounds for hatchery-based operations or constraints on the supply of hatchery seed.
Other variables leading to uncertainty in the industry include market forces: How many single oysters from Willapa and Grays Harbor can the industry absorb without a decline in price? How are coastal oysters perceived in the market? Will consumers buy them if growers continue to treat their beds?
Finally, IEc notes the issue of workforce availability, particularly for companies involved in the processing side of the industry. At current wage levels, companies have difficulty attracting documented workers willing to do the type of manual labor the industry requires. If the State of Washington mandates higher minimum wage laws, will smaller companies continue to remain competitive? In addition, how will immigration reform impact the availability of labor?
10.4 RECREATION AND TOURISM
Certain risks and vulnerabilities have the potential of adversely affecting the recreation and tourism industry based along the Washington coast. Some of these issues were identified in the Marine Sector Analysis Report: Recreation and Tourism (IEc 2014c). This section summarizes those issues, and identifies other issues of concern to the coastal recreation and tourism industry along the Washington coast.
10.4.1 Regulatory Conflicts
Actions to protect ESA-listed threatened or endangered species that inhabit the Washington coast have the potential to restrict recreational uses of marine resources in the coastal area. Past examples include actions taken to protect the western snowy plovers along Washington beaches. Use restrictions associated with protecting snowy plover habitat include area restrictions when the plovers are nesting on the beach during their breeding season (March to September). These actions decrease the amount of beach area available for recreation use. Other restrictions include limiting beach driving, and prohibiting the removal of native plants, driftwood, and alteration of other habitat features (IEc 2014c). Whether these restrictions actually reduce the number of visitors or just displace visitors to other areas is uncertain.
Washington Coastal Marine Advisory Council Risk and Vulnerability of Marine-dependent Sectors | 10-13

Economic Analysis to Support Marine Spatial Planning in Washington
10.4.2 Environmental Issues
As identified in the sector report for recreation and tourism, environmental issues of concern to the recreation and tourism industry include potential erosion along the southern coast, resulting in adverse effects on recreation facilities (e.g., camping) and access; water quality and port access concerns due to sediment deposits from erosion (e.g., marina at the mouth of the Quillayute River), and the potentially catastrophic effects on recreation and tourism from oil spills.
As identified in Section 10.2 above, occasional water quality issues along the Washington coast have led to beach or shellfish closures, sometimes related to contamination and resulting in potential health concerns. In 2004, the Washington State Department of Ecology implemented a statewide monitoring and notification program for marine recreational beaches. The Washington Beach Environmental Assessment Communication & Health (BEACH) program monitors recreational swimming beaches that are at risk for fecal bacteria contamination from Memorial Day to Labor Day (IEc 2014c). In the fall of 2009, a marine algae bloom caused numerous bird deaths and reports of health symptoms among surfers on coastal beaches.
10.4.3 Growth-Related Issues
Growth-related factors that can affect the quality and levels of recreation and tourism along the Washington coast include site availability and access, crowding conditions, recreation access costs, and traffic conditions. As described in more detail in Chapter 7, Recreation and Tourism, the northern section of the coast has limited access and there are no major changes in access anticipated in the near future (IEc 2014). Access to beaches along the Quinault Reservation is restricted, with some beach access limited to Quinault tribal members only. Along the southern beaches, access is regularly available. Fees are charged to access the beach at some locations.
The 2013 State Comprehensive Outdoor Recreation Plan indicates that the current facility capacity available statewide only satisfies 30-40 percent of the demand for recreation (Washington State Recreation and Conservation Office 2013). During peak periods, anecdotal evidence indicates certain locations lack sufficient parking facilities to handle large crowds that come to the shore (i.e., parking at the jetty at Westport). Although overcrowding is not considered a major issue at present, population growth and the increasing popularity of certain activities will likely lead to overcrowding at certain locations unless improvements are made.
According to information in the Recreation and Tourism Sector Report, high levels of rail traffic to the Port of Grays Harbor are another issue of concern to the recreation and tourism industry. Traffic delays along State Route (SR) 12, which is the only access route to the northern coast, could negatively affect tourism (IEc 2014c).
10-14 | Risk and Vulnerability of Marine-dependent Sectors Washington Coastal Marine Advisory Council

Economic Analysis to Support Marine Spatial Planning in Washington
10.5 SHIPPING
10.5.1 Uncertainties in Markets
As discussed near the end of the Chapter 2, County Profiles, changing trade patterns create some risks and uncertainty for the Port of Grays Harbor. In particular, China, a major trading partner for port customers, is showing a slowdown in growth from the very rapid growth it has been experiencing for the past 30 years.
Growth in wages in coastal parts of China may shift production to other regions in Asia which could shift vessel traffic to the Suez Canal. Alternatively, rising cost of production in China could result in some companies bringing manufacturing back to the United States or to other nearby regions such as Mexico (BST Associates 2014).
The ever changing energy sector also creates a lot of uncertainty for the port. Production of oil has shifted from Alaska to the Bakken region and that has very significant implications for the transport of oil to refineries on the west coast and for export shipments.
10.5.2 Competition with Other Ports
The Port of Grays Harbor faces competition from many other ports. It competes against the much larger ports such as Oakland and Los Angeles, and it competes against ports such as Tacoma with more rail capacity, and it even competes against east coast ports. After a major decline in forest products exports a decade ago, the port reinvented itself to provide shipping for other cargo. This reinvention included successfully beating out other west coast and east coast ports for an auto export contract from Chrysler.
Given competition between ports is based on a number of factors—rail rates, port rates, ocean accessibility—there is always a risk that the Port of Grays Harbor will not be able to maintain its current level of competitiveness. Some of that is also dependent on continued public financing including dredging funds from the Corps of Engineers.
10.6 COASTWIDE ISSUES
In addition to risks and threats to specific sectors there are some risks that impact a broad range of sectors. Several of these are discussed in the next sections.
10.6.1 Oil Trains
Bulk crude oil terminals are proposed, or existing facilities modified, in nearly a dozen locations in Washington, including three directly on the coast, and several others that could affect the coast through impacts in the Columbia River. For each of the proposed facilities on the coast, separate environmental reviews are being conducted under the State Environmental Policy Act (SEPA), and each will generate an EIS (Ecology 2015a). The processes are independent of the MSP, and the MSP law requires the use of existing authorities, does not provide additional authority to any agency, and does not allow the plan to change requirements for any use already permitted or undergoing permitting during development of the MSP (Revised Code of Washington [RCW] 43.372.060). Although not included as a potential new use for
Washington Coastal Marine Advisory Council Risk and Vulnerability of Marine-dependent Sectors | 10-15

Economic Analysis to Support Marine Spatial Planning in Washington
analysis in the MSP, the proposed projects have been identified by marine-dependent industries, individual tribes, interest groups, and other entities as a “potential risk to the coast.” This subsection contains a brief discussion of these projects.
Three of the currently proposed Washington bulk crude oil facilities are in Grays Harbor County. Two of the Grays Harbor proposed projects are expansions of existing bulk liquid storage facilities owned by two companies—Westway Terminal Company LLC (Westway) and Imperium Renewables Inc. The third is a proposed expansion of use at the Port’s Terminal 3.
Westway and Imperium Renewables, Inc., operate on two separate properties at Terminal 1 at the Port of Grays Harbor. The expanded facilities could be used to store crude oil brought via rail from North Dakota. By law, domestically produced crude oil is restricted from export markets so the two proposed facilities would ship crude oil to west coast refineries. The facility could also be used to move Canadian crude oil, which does not face the same export restrictions, to foreign markets. In both scenarios, oil would arrive by rail and leave via ships and barges (Ecology 2015c).
According to an economic impact analysis conducted by ECONorthwest prepared for the Westway and Imperium companies, the combined facilities would result in one to two unit trains per day delivering oil to Grays Harbor with an average of 105 tank cars per train. An estimated 260 vessels (articulated barges and ships) a year would be required to deliver bulk liquid from these two facilities to refineries and other customers on the west coast. These would be vessels that otherwise would not be coming to the Port of Grays Harbor (ECONorthwest 2013). Documents on the Port of Grays Harbor website indicate the ECONorthwest figures may be very conservative estimates of train and vessel traffic.1
EISs are being prepared for both the Westway and Imperium proposed projects. Ecology and the City of Hoquiam are co-lead agencies for the EISs. Draft EISs are expected in the summer of 2015 (Port of Grays Harbor 2015).
The third proposed facility at Grays Harbor, is a proposal from the Grays Harbor Rail Terminal (US Development Group LLC). This project would be on the Port’s Terminal 3 property. The facility would be able to handle 45,000 barrels per day of liquid bulk materials. For this project the liquid bulk materials would be various kinds of crude oil and condensates. Scoping was completed in 2014; the next step will be a draft EIS (Ecology 2014).
1 Documents on the Port of Grays Harbor website show higher estimates of train and vessel traffic. The Port reports estimates provided by Westway and Imperium. According to information on the website, Westway’s project alone would result in 458 trains a year or 1.25 trains per day. Westway also estimated 99 to 119 barges a year (198−238 entry and departure transits) or approximately one every two days. Imperium estimated their terminal could handle up to 730 unit trains a year or two per day. They also estimated their project could handle up to 200 ships or barges a year (400 entry and departure transits) or one per day (Port of Grays Harbor 2015).
10-16 | Risk and Vulnerability of Marine-dependent Sectors Washington Coastal Marine Advisory Council

Economic Analysis to Support Marine Spatial Planning in Washington
In addition to the three proposed projects at Grays Harbor there are a number of other proposed projects in Washington and Oregon that would entail moving crude oil vessels down the Columbia River. These would have the potential of affecting coast residents and marine-dependent industries, even though the facilities are not physically located on the coast.
There is a proposal to build a large oil-by-rail terminal at the Port of Vancouver on the Columbia River. If built, Vancouver Energy USA, a joint venture between Tesoro Corp. and Savage Companies, would be the largest oil by rail terminal in the U.S. It could receive up to 360,000 barrels of crude oil a day, which would then be transferred to vessels for transport to West Coast refineries. The City of Vancouver Council voted to oppose this project. The U.S. Army Corps of Engineers recently announced it will evaluate the project under both the Clean Water Act and the National Environmental Policy Act (Culverwell 2015).
Several smaller projects have been proposed along the Columbia River. While some have met opposition from state and local entities, the projects have not been withdrawn. In addition to the Vancouver Energy USA project in Vancouver, other projects for moving crude oil include the Global Partners project at Clatskanie, Oregon; the NuStar Energy project in Vancouver; and the Arc Logistics project in Portland (Culverwell 2015).
In a recent report on rail transport of crude oil in Washington, the state included a map of existing and proposed project shown in Figure 10-2.
Although the draft EISs are not available yet for any of the Grays Harbor projects, public comments made during meetings of the Washington Coastal Marine Advisory Council (WCMAC) and two recent reports identify the key environmental and safety concerns with these projects.
In April 2015 the Quinault Indian Nation (QIN) published an analysis conducted by Resource Dimensions that analyzed potential impacts on the QIN from a potential oil spill in or near Grays Harbor. Their report relied in part on a recent Ecology report on oil transport by rail (Resource Dimensions 2015; Ecology 2015a).
According to the QIN report there is only very limited information to model an oil spill for the kinds of the oil that would be transported through the proposed facilities (Bakken crude which is a light, highly volatile crude and Canadian diluted bitumen (Canadian tar sands oil) which has characteristics similar to heavy crude oils). Two past oil spills in the Grays Harbor area were spills of Bunker C fuel oil which has different characteristics than the Bakken and Canadian crude so these two spills over only limited insight into the potential risks.
Washington Coastal Marine Advisory Council Risk and Vulnerability of Marine-dependent Sectors | 10-17

Economic Analysis to Support Marine Spatial Planning in Washington
Figure 10-2 Crude Oil by Rail Facilities Source: Ecology 2015b.
Despite a lack of good information about the extent of possible damage from a spill from these proposed projects, the concerns center on the following:
The risk of an oil spill from an individual vessel is a function of internal (operation and maintenance of the vessel) and external (environmental conditions, e.g., visibility, current and tides, and interactions with other vessels) factors. Increased vessel traffic at Grays Harbor increases the risk of a spill and the increased risk is not simply additive.
Oil spills would damage the fish and shellfish due to oil ingestion, smothering and mechanical injury:
Adult salmon returning to spawn are at risk
Juvenile salmon in the Grays Harbor estuary are at risk
Juvenile and adult Dungeness crabs are at risk
10-18 | Risk and Vulnerability of Marine-dependent Sectors Washington Coastal Marine Advisory Council
Economic Analysis to Support Marine Spatial Planning in Washington
Mollusk are extremely sensitive to oil spills
Carcinogenic elements from the oil could make surviving fish unmarketable
Oil spills could damage tourism, a key industry on the coast.
Much of the tourism surrounding Grays Harbor is based on beach activities. Even if the oil spill did not impact human safety, public perceptions following oil spills have been shown to have a negative impact on tourism.
Oil spills in Grays Harbor could harm plant materials collected in the estuary (e.g., sweetgrass and cattails) which are used by the Quinault Indian Nation.
Damage to treaty fisheries
In addition to the risks associated with oil spills in the waterways, there are additional risks of oil train derailments or fires. There have been several recent incidents of oil train catastrophes in other parts of the U.S. that demonstrate the risks associated with these trains.
10.6.2 Tsunami Threat
The coastal sections of the MSP counties are all vulnerable to tsunami hazards. The tsunamis could be generated from distant earthquakes on the Pacific Rim such as the 2011 earthquake in Japan which was a magnitude 9.0. This is the more common source of tsunami hazards and poses less risk to human lives but can still cause damage. The other threat would be from local tsunamis caused by magnitude 8.0 or greater earthquakes on the Cascadia subduction zone. In this latter situation, the waves are much larger, can strike the coast within 25 to 30 minutes, and have much greater potential for loss of life and property damage (Washington Military Department, Emergency Management Division, 2012/2013).
The U.S. Geological Service in cooperation with the Washington Military Department, Emergency Management Division assessed tsunami exposure in 24 communities along the Washington coast and the Strait of Juan de Fuca. Clallam, Jefferson, Grays Harbor and Pacific counties were included in this study. Their analysis found almost 43,000 people or about 24 percent of the population in the total study area were inside the tsunami-inundation zone but this percentage varied widely across the four coastal counties. The City of Aberdeen had the greatest number of residents in the tsunami-inundation zone but the City of Long Beach had the greatest percentage (100 percent) in the zone. Many communities had small populations in the zone but high percentages of residents at risk. The Shoalwater Bay Reservation, the Hoh Reservation, and the Makah Reservation all had over half their population living in the tsunami zone (Wood and Soulard 2008).
While anyone living or working in the tsunami hazard zone is at risk, certain groups are considered more vulnerable. These include:
Children under the age of five: They need more help with evacuation and are more likely to suffer stress after the tsunami.
Washington Coastal Marine Advisory Council Risk and Vulnerability of Marine-dependent Sectors | 10-19

Economic Analysis to Support Marine Spatial Planning in Washington
Adults over the age of 65: They may have health or mobility problems that would impair evacuation, may need medical equipment, and may have more limited financial resources to invest after property damage occurs.
Renters: They tend to be less prepared than homeowners and lack financial resources to recover from tsunami losses.
Visitors: Tourists visiting public beaches, museums, etc., may not understand the tsunami warnings and are not knowledgeable about the evacuation routes.
Tsunamis also are a risk to the economic security of the coast given many local businesses, particularly tourism facilities, are also located within the tsunami-inundation zone. Tsunamis can also cause damage to key coastal resources such as fisheries, aquaculture, and timber.
REFERENCES
BST Associates. 2014. Assessment of the Shipping Sector. Prepared for the Washington Coastal Marine Advisory Council. August 30, 2014.
Cheney, D., and B. Dewey. 2006. Shellfish and climate change: Ecological and Economic Effects. Powerpoint Presentation to the Washington State Climate Project. Pacific Shellfish Institute.
Culverwell, Wendy. 2015. Army Corps Won’t Rubber Stamp $210M Vancouver Oil Terminal. Portland Business Journal. June 4, 2015.
Doney, S. C. 2006. The dangers of ocean acidification. Sci. Am. (March) 294: 58-65.
Ecology. See Washington Department of Ecology.
ECONorthwest. 2013. Economic Impact Analysis of Bulk Liquid Storage Facilities at the Port of Grays Harbor. September 5, 2013.
Ekstrom, J. A., et al. 2015. Vulnerability and adaptation of US Shellfisheries to ocean acidification. Nature Climate Change. www.nature.com/natureclimatechange.
Feely R. A., C. L. Sabine, J. M. Hernandez-Ayon, D. Ianson, and B. Hales. 2008. Evidence for upwelling of corrosive “acidified” water onto the continental shelf. Sci Express (May): 1-4.
Gordon, D. G., N. E. Blanton, T. Y. Nosho, and K. K. Chew. 2003. Heaven on the Half Shell. Westwinds Press, Portland, OR.
Horner, R. A., D. L. Garrison, and F. G. Plumley. 1997. Harmful algal blooms and Red Tide problems on the U.S. West Coast. Limnol and Ocean 42: 1076-1088.
Huppert, D. H., A. Moore, and K. Dyson. 2012. Impact of climate change on the coast of Washington State. In Preparing for a Changing Climate - Washington State’s Integrated Climate Response
10-20 | Risk and Vulnerability of Marine-dependent Sectors Washington Coastal Marine Advisory Council

Economic Analysis to Support Marine Spatial Planning in Washington
Strategy. Washington State Department of Ecology, April 2012. Available at: cses.washington.edu/db/paf/wacciach8coasts651.pdf. Accessed June 22, 2015.
IEc. See Industrial Economics, Inc.
Industrial Economics, Inc. 2014a. Marine Sector Analysis Report: Non-Tribal Fishing. Prepared for the Washington Coastal Marine Advisory Council. August 14, 2014.
Industrial Economics, Inc. 2014b. Marine Sector Analysis Report: Aquaculture. Prepared for the Washington Coastal Marine Advisory Council. October 31, 2014.
Industrial Economics, Inc. 2014c. Marine Sector Analysis Report: Recreation and Tourism. Prepared for the Washington Coastal Marine Advisory Council. August 14, 2014.
Kearney, M., et al. 2014. What’s the Catch? Challenges and Opportunities of the U.S. Fishing Industry. The Hamilton Project, Washington, DC. Available at: www.hamiltonproject.org/papers/ whats_the_catch_challenges_and_opportunities_of_the_u.s._fishing_indus. Accessed June 29, 2015.
MSP. See Washington Marine Spatial Planning.
NOAA Fisheries. 2015. Pacific Coast Fisheries Permit System – on-line query of groundfish trawl limited entry permits. Available at: www.webapps.nwfsc. noaa.gov/apex_ifq/f?p=112:23:0::NO:: P23_VIEW_ALL:Y. Accessed June 13, 2015.
National Oceanic and Atmospheric Administration (NOAA) Pacific Marine Environmental Laboratory (PMEL) Carbon Dioxide Program. 2014. Ocean Acidification’s impact on oysters and shellfish video. Available at: www.pmel.noaa.gov/co2/story/Ocean+Acidification%27s+impact+on+ oysters+and+other+shellfish. Accessed June 24, 2014.
NOAA. See National Oceanic and Atmospheric Administration.
Pacific Coast Shellfish Growers Association. 2008. Shellfish farming. Available at: www.pcsga.org. Accessed February 16, 2008.
Patz, J. A., S. H. Olson, and A. L. Gray. 2006. Climate change, oceans, and human health. Ocean 19: 52-59.
Pacific Fishery Management Council. 2014. Status of the Pacific Coast Coastal Pelagic Species Fishery and Recommended Acceptable Biological Catches. Stock Assessment and Fishery Evaluation for 2014. Available at: www.pcouncil.org/wp-content/uploads/2014_CPS_SAFE_Text_FINAL.pdf. Accessed June 2015.
Pacific Fishery Management Council. 2015. The Line, Volume 4, Number 1, May 2015. Available at: www.pcouncil.org/wp-content/uploads/2009/12/The-Line-Spring-2015.pdf. Accessed June 2015.
Port of Gray Harbor. Crude by Rail (CBR). Available at: www.portofgraysharbor.com/about/CBR-Project.php. Accessed on June 14, 2015.
RCW. See Revised Code of Washington.
Washington Coastal Marine Advisory Council Risk and Vulnerability of Marine-dependent Sectors | 10-21

Economic Analysis to Support Marine Spatial Planning in Washington
Resource Dimensions. Economic Impacts of Crude Oil Transportation on the Quinault Indian Nation and the Local Economy. April 2015.
Revised Code of Washington. Chapter 43.372 RCW, Marine Waters Planning and Management. Available at: apps.leg.wa.gov/rcw/default.aspx?cite=43.372&full=true. Accessed June 15, 2015.
Seattle Times. 2015. “Toxic algae bloom might be largest ever.” June 16, 2015. Page 1.
Tangley, L. 1988. Preparing for climate change. BioScience 38: 14-18.
Titus, J. G. 1986. Greenhouse effect, seal level rise, and coastal zone management. Coast Zone Manage J 14(3): 147-171.
Washington Department of Ecology. 2006. Fact Sheet for NPDES Permit No. WA0040975, Willapa Bay/Grays Harbor Oyster Growers Association and Farm and Forest Helicopter Service. March 2006. Available at: www.ecy.wa.gov/programs/wq/pesticides/final_pesticide_permits/ oyster/docs/062306carbarylFS.pdf. Accessed June 2015.
Washington Department of Ecology. 2014. Determination of Significance and Request for Comments on Scope of Environmental Impact Statement for Grays Harbor Rail Terminal, LLC (GHRT) Bulk Liquids Logistics Terminal Facility Project. September 10, 2014.
Washington Department of Ecology. 2015a. Washington State 2014 Marine and Rail Oil Transportation Study. Publication Number: 15-08-010. March 1, 2015.
Washington Department of Ecology. 2015b. News Release: “Ecology, shellfish growers cancel pesticide spraying permit.” Blog post, May 3, 2015. Available at: ecologywa.blogspot.com/2015/05/news-release-ecology-shellfish-growers.html. Accessed: June 2015.
Washington Department of Ecology. 2015c. Westway and Imperium Expansion Projects. Available at: www.ecy.wa.gov/geographic/graysharbor/terminals.html. Accessed June 15, 2015.
Washington Department of Fish and Wildlife 2015b. Dungeness crab catch and pot density by area (email from WDFW, June 2, 2015).
Washington Department of Fish and Wildlife 2015a. 2014/15 Coastal Dungeness Crab Fishery Fair Start Structure. Online information and area maps. Available at: wdfw.wa.gov/fishing/commercial/ crab/coastal/2014-15_fairstart.pdf. Accessed June 13, 2015.
Washington Marine Spatial Planning. 2015. Mapping application. Available at: www.msp.wa.gov/ explore/mapping-application. Accessed June 13, 2015.
Washington Military Department, Emergency Management Division. 2012/2013. How Vulnerable Is Grays Harbor to Tsunamis? 2012/2013.
Washington State Blue Ribbon Panel on Ocean Acidification. 2012. Ocean Acidification: From Knowledge to Action. Washington State’s Strategic Response. Available at: fortress.wa.gov/ ecy/publications/publications/1201015.pdf. Accessed June 2015.
10-22 | Risk and Vulnerability of Marine-dependent Sectors Washington Coastal Marine Advisory Council
Economic Analysis to Support Marine Spatial Planning in Washington
Washington State Recreation and Conservation Office. 2013. The 2013 State Comprehensive Outdoor Recreation Plan. May 2013.
WDFW. See Washington Department of Fish and Wildlife.
Welch, C. 2012. “Willapa Bay oyster grower sounds alarm, starts hatchery in Hawaii.” Seattle Times, June 22, 2012. Available at: seattletimes.com/html/localnews/2018496037_oysters22m.html. Accessed June 24, 2014.
Wood, N., and C. Soulard. 2008. Variations in community exposure and sensitivity to tsunami hazards on the open-ocean and Strait of Juan de Fuca coasts of Washington. U.S. Geological Survey Scientific Investigations Report 2008-5004, 34 pp.
PERSONAL COMMUNICATIONS
Cedergreen, Mark. Personal communication with Michael Taylor of Cascade Economics. Transmittal of comment letter on the draft economic analysis for the Washington Marine Spatial Plan. June 25, 2015.
Nisbet, Dave. Personal communication with Katharine Wellman of Industrial Economics, 2014.
Patten, Kim. Washington Department of Ecology. Personal communication with Katharine Wellman of Northern Economics on June 12, 2015, regarding risks of burrowing shrimp.
Reed, Heather. Personal communication to Mark Cedergreen and Michael Taylor (Cascade Economics). Email transmittal on June 29, 2015, regarding Mark Cedergreen’s comments from June 25, 2015, and other information pertaining to the draft economic analysis of the Washington Marine Spatial Plan.
Sheldon, Brian. Email communication with Mike Taylor of Cascade Economics on June 23, 2015, regarding risks and vulnerabilities facing the shellfish aquaculture sector.
IMAGES
Chapter 10 Header Image: (cc) Richard Wilson, PhD, 2009. Very early morning at dock. Retrieved May 6, 2015, from: www.flickr.com/photos/76798465@N00/4160177673
Page 10-2: Kat+Sam, 2009 [Screen Name]. Albatrosses, Shearwaters, and Fulmars following fishing vessel. Retrieved July 4, 2015, from: www.flickr.com/photos/39871249@N07/3821032479
Washington Coastal Marine Advisory Council Risk and Vulnerability of Marine-dependent Sectors | 10-23

Economic Analysis to Support Marine Spatial Planning in Washington
This page intentionally left blank
10-24 | Risk and Vulnerability of Marine-dependent Sectors Washington Coastal Marine Advisory Council

CHAPTER 11.
Qualitative Analysis of the Impacts of Proposed New Uses
The Washington Marine Spatial Plan (MSP) process involves identifying current and potential future activities for the coastal marine area, priority locations where these activities take place, and the recognition of cultural and aesthetic values. As an overriding mission, this economic analysis is intended to “foster and encourage sustainable uses that provide economic opportunity without significant adverse environmental impacts” (Revised Code of Washington [RCW] 43.372.040). This requires that the economic analysis consider not only baseline conditions for ocean uses and the important relationships to coastal communities, but also an analytical ability to evaluate the economic consequences of proposals or planning options.
The preceding chapters developed the baseline of current uses, detailing existing conditions and relationships, supported by an updatable economic impacts model. A key feature of the development of this economic information it that it is dynamic, allowing for feedback responses to individual or combinations of proposed uses in the future, while considering and incorporating changing demographics and economic conditions.
To date, the MSP process has identified six potential new uses that may generate specific proposals in the future. The new uses are broad in scope and, with a few exceptions, are not specific in location. In addition, the current information on proposed uses does not provide details on scope or scale of potential projects. As such, it is not possible to identify, much less quantify, the impacts of proposed new uses on existing uses of coastal resources. However, the nature of the proposed uses, including general information that is known about their resource requirements and potential externalities or other effects, allows for general qualitative assessments (i.e., positive, negative, or neutral) associated with elements of current uses.
Washington Coastal Marine Advisory Council Qualitative Analysis of the Impacts of Proposed New Uses | 11-1

Economic Analysis to Support Marine Spatial Planning in Washington
This chapter contains a brief summary of the proposed use categories, drawn primarily from the efforts by Washington Department of Ecology (Ecology) to characterize them in the MSP. This is followed by a qualitative assessment of the potential effects on the primary uses identified and analyzed elsewhere in this report. The purpose of this information is to provide future guidance as to what current uses of the coast, and in particular, which characteristics, are likely to be potentially affected by proposed new uses. Where negative impacts may be anticipated, proponents should be required to analyze and address potential effects on these elements.
11.1 POTENTIAL NEW USES ON THE WASHINGTON COAST
The MSP process identified six potential new use categories:
Marine Product Extraction
Offshore Aquaculture
Dredge Disposal
Mining of Gas Hydrates
Mining of Marine Sand and Gravel
Marine Renewable Energy:
Offshore Wind Energy
Wave Energy
Tidal Energy
A brief description of each category of use is included below, with highlights on aspects that affect current economic uses. The information in this section is developed from Ecology (2015), unless otherwise referenced. A more complete description of each of the proposed uses is contained within the Marine Spatial Plan.
11.1.1 Marine Product Extraction
Marine product extraction (also sometimes called bioextraction) is the practice of harvesting marine plants and animals to develop non-food related goods. Examples include anti-viral, anti-cancer, and anti-tumor agents used in medical treatments, anti-inflammatories in cosmetics, chemicals used in biomedical and cell biology research, and fatty amino acids in nutritional supplements. New genome sequences have also been discovered within marine organisms.
Researchers, universities, government agencies, and private companies use marine bioprospecting to search for novel chemicals for human health products. SCUBA diving, manned submersible vehicles, and remotely operated vehicles are current methods for marine bioprospecting.
The required quantities of the marine organism and target chemical can be obtained by a few different methods:
11-2 | Qualitative Analysis of the Impacts of Proposed New Uses Washington Coastal Marine Advisory Council
Economic Analysis to Support Marine Spatial Planning in Washington
Wild harvest has been used to collect the required amounts of chemical for product development and sales. Harvest sustainability is dependent upon the organism, method of harvest, and desired quantities.
Aquaculture of marine organisms to produce desired chemicals can be land-based or in-the-sea. The success of aquaculture for product supply depends on the husbandry needs for the organism, as well as specific environmental controls that stimulate the organism to produce the desired chemical.
Biotechnology is used within laboratories to synthetically replicate chemicals. There are examples of this, but the methods are often too complex and costly to be effective at creating the desired quantities.
11.1.2 Offshore Aquaculture
There is no standard definition for offshore aquaculture. Offshore aquaculture typically occurs in deep water and is generally exposed to one or several of the following: strong waves, storms, swells, and currents. Given the physical exposure of Washington’s Pacific coast, offshore aquaculture is currently defined within the MSP as any new aquaculture operation outside of the coastal estuaries. All of Washington’s existing coastal marine aquaculture occurs close to shore, within bays, and estuaries.
Current and emerging technologies include the following:
Finfish aquaculture uses two general types of cage designs:
Surface cages: This type sits at the surface of the water. Surface cages are often referred to as net pens, which are currently used in offshore aquaculture in Norway and Chile.
Submersible cages: This type can partially or fully submerge underwater to avoid rough seas. Some have nets, while other designs have a rigid outer cage.
Shellfish aquaculture uses longlines moored to the seafloor. The shellfish are either directly attached to the lines or grown in net bags attached to the lines. Mussels and scallops are currently cultured offshore in many countries using this technique. Challenges for this technique include detachment of the shellfish from the lines in rough seas.
Marine plant aquaculture methods are similar to shellfish. Growing plants requires more sunlight and surface space compared to shellfish and finfish.
Washington Coastal Marine Advisory Council Qualitative Analysis of the Impacts of Proposed New Uses | 11-3

1
1
Economic A
1-4 | Qualitativ
11.1.3 Dre
NavigPlan a(see Fnavigspecif
Figu
Analysis to
ve Analysis of the
edge Dispo
gation channearea require frFigure 11-1 anation channelfic disposal sit
re 11-1 Dr
o Support M
e Impacts of Prop
osal in New
els in Grays Hfrequent dredgnd Figure 11-ls safe and actes. Current d
redge Dispo
Marine Spa
posed New Uses
w Locations
Harbor, the Mging to maint-2). In some locessible. The
disposal types
osal Placem
Dred
*approx
Cape
t ial Planni
s
outh of the Ctain vessel accocations, millmajority of th
s include:
ment Locati
Benson BeDeepwaterNorth JettyShallow WaSouth Jetty
Co
0
dgeDisposa
Federal Ch
ximate location
e Disappointme
ing in Was
Columbia Rivecess to criticallions of cubiche dredged m
ions: Colum
each* r Site y ater y
olumbiaRiv
2
Nautical Mile
alSites
hannel
of 2010 demonst
ent
hington
Washington Coa
er, and other l port infrastr
c yards are drematerial is disp
mbia River
Chinook Ilwaco
ver
4
es
Ports
tration site
stal Marine Advi
locations withructure and seedged annualposed of in-w
sory Council
hin the ervices lly to keep
water at

WWashington Coas
E
tal Marine Adviso
Figure 11-2
Nearshorecan minimThese sites
Flow lane sin scour ch
conomic A
ory Council
e and on-shormize erosion. Ts are designed
sites are genehannels, and d
nalysis to S
Dredge Disposal Placement Locations: Grays Harbor
e beneficial uThese sites had for the sedim
erally used fordoes not accu
Support Ma
Quali
use sites keep save boundariement to dispe
r relatively smumulate on th
GraysHar
0
arine Spati
itative Analysis o
sediment withes, and sedimerse over time
mall volumes ohe seafloor.
rborDredg
3.9 mile
Federa
Half Mo
Point C
South B
South J
1
Nautical
ial Plannin
of the Impacts o
hin the nearshent can accum
e.
of material. T
geDisposal
e Ocean
al Channel
oon Bay
Chehalis
Beach
Jetty
2
l Miles
ng in Wash
of Proposed New
hore system, mulate on the
The material is
Sites
ington
Uses | 11-5
which e seafloor.
s placed

Economic Analysis to Support Marine Spatial Planning in Washington
Deep water sites are located offshore in federal waters. Sediment disposed at deep water sites is effectively removed from the nearshore system.
In contrast to other proposed new uses, specific future dredge disposal sites have been identified:
The Mouth of the Columbia River Regional Sediment Management Plan identified two potential new locations for dredge disposal. An onshore site at Benson Beach has been a demonstration project, but there are concerns about the safety and cost effectiveness of this site. A proposed North Head nearshore site is currently under consideration.
Two sites at Grays Harbor may undergo small shifts in locations. The South Jetty site may be shifted slightly northward to accommodate the shifting scour channel. The Point Chehalis open water site may undergo a one-time northwestern shift in order to accommodate the additional material from the Grays Harbor channel deepening.
Additional flow lanes in Willapa Bay may be established in the future for small port dredging.
11.1.4 Mining of Gas Hydrates
Gas hydrates are a mixture of gas and water which, under low temperature and high pressures, forms a solid ice-like structure in marine sediments. Methane is the main type of gas in hydrates. When methane hydrates are exposed to warmer temperatures or lower pressures, the hydrates “dissociate” and release methane gas. Preliminary research suggests traditional oil and gas equipment and infrastructure can be successfully adapted to mine gas hydrates. Globally, no commercial methane mining activities currently exist, and no projects are proposed for offshore Washington.
The Washington coastal margin has significant amounts of methane hydrates. However, the hydrates are generally widely dispersed and therefore not a high target for resource extraction. Current research efforts are focused on highly concentrated hydrate sites in the Gulf of Mexico and the Atlantic coastal margin.
11.1.5 Mining of Marine Sand and Gravel
Sand and gravel mining is the dredging of sand or gravel from the seafloor for use in beach nourishment, coastal hazard defense, and other uses such as upland construction. Suction dredges are used to extract the material, which is stored and transported by ship, barge, or pipeline to a beach or re-handling area.
Washington’s seafloor contains significant amounts of sand and gravel. Current local demand for sand and gravel is low, but decreasing land supplies, coastal population growth, increased storms, and sea level rise may increase future demand. Cost and logistics may limit the sand available from navigation dredging for beach projects, which may influence demand for offshore sand. To date, the U.S. Bureau of Ocean Energy Management (BOEM) has not assessed Washington offshore lease blocks for sand and gravel mining for beach nourishment.
11.1.6 Marine Renewable Energy
Marine renewable energy includes any technology that converts potential energy from wind, waves, or tides into electricity. Currently, researchers are developing different technologies and testing devices in
11-6 | Qualitative Analysis of the Impacts of Proposed New Uses Washington Coastal Marine Advisory Council

Economic Analysis to Support Marine Spatial Planning in Washington
research labs and waters throughout the United States to provide clean energy alternatives for the nation. No devices have been permitted for the marine waters along Washington’s coast. Three categories are included:
Offshore Wind Energy. Uses technology adapted from land-based wind turbines and applies the technology to floating or fixed support structures that vary according to water depth. Turbines used in offshore installations can be up to 500 feet tall to gain access to reliable wind resources. Classified by base structures including fixed bases for shallow and floating bases for deep waters.
Wave Energy. Extracts energy from ocean wave movements or from changes in pressure below the surface. Classified by type, including point absorber, wave overtopping reservoir, attenuator, oscillating water column, and inverted pendulum.
Tidal Energy. Extracts energy from a steady water flow typically through an existing narrow channel. Classified by type, including horizontal and vertical axis turbines, oscillating hydrofoil, and venturi effect turbine.
International interest in marine renewable energy is growing. The U.S. Department of Energy provides matching funds for industries and grants to developers that invest in marine renewable energy technology. Washington signed the renewable portfolio standards, which require large energy utilities to migrate at least 15 percent of their electricity load to renewable resources (excluding dams) by 2020. In response, some local utilities are providing customer incentives to support locally-produced sustainable energy.
Washington has significant potential offshore wind and wave resources. In the last decade there has been some interest in marine renewable energy in Washington’s marine waters, but there are no projects currently under development or in the permitting process. The major barriers to entry include cost and permitting complexity. The MSP will include a state agency framework to coordinate ocean planning and maps to summarize the existing geographic information on sensitive areas and human uses of marine waters. According to the Marine Renewable Energy Sector Analysis (Industrial Economics [IEc] 2014) offshore wind is the most viable candidate, but the likelihood of any marine renewable energy development in the next 20 years is limited.
11.2 INTERPRETATION OF THE QUALITATIVE ANALYSIS
As indicated above, the potential new uses are currently in concept stage, and do not reflect specific proposals. There is no indication or limits to size, scale, or location (with the exception of dredge disposal) of the new uses. As such, the determination of a direct link between proposed new uses and impacts to existing uses is largely premature; in other words, it depends upon the details.
However, many elements of significance in existing uses have the potential of being affected (possibly in a negative way) by a proposed new use under certain conditions or in proximity to a particularly sensitive element of current use. Where this potential exists, it is appropriate that the proponent of a new use account for and address the potential impact on existing use. The elements discussed are derived from issues raised in the sector analyses, the summary of new uses (Ecology 2015), or through key informant
Washington Coastal Marine Advisory Council Qualitative Analysis of the Impacts of Proposed New Uses | 11-7

Economic Analysis to Support Marine Spatial Planning in Washington
interviews. The focus is on long-term impacts, but in some cases, short-term impacts (from construction or implementation) are also relevant and specifically called out.
In the subsections below, a table is presented within the subsection summarizing the qualitative analysis. Elements that are important or significant to the existing use are identified, and appear in the first column of the impacts table. The elements listed are not exhaustive, and are generally have an economic focus. Along the top row are the six proposed new uses. The last column contains explanatory notes.
The intersecting squares of elements and uses contain a symbol representing “positive,” “negative,” or “neutral.” The symbol shows the potential effect of the new use on the element associated with the existing use. If the symbol indicates a “negative effect,” this means that under certain circumstances, or depending upon the precise location of the new use or its ancillary components, the new use may have a negative impact on the existing use. This should be interpreted as an indicator that any specific proposal for a new use may be required to evaluate and determine the impacts on the existing use as a part of their proposal. The actual requirement will depend upon the scoping process under the State Environmental Policy Act.
If the symbol indicates a “neutral” effect, this is an indication that the new use is not likely to have an effect on the particular element, regardless of the circumstances or locations. This does not preclude its consideration or a requirement for evaluation as a result of the scoping process. A “positive” symbol indicates that the new use may provide a beneficial impact to the existing use element, depending upon circumstances or location. Finally, an “up and down” arrow indicates that there may be both positive and negative impacts simultaneously on different aspects.
The column labeled “notes” provides additional information, including context or specific circumstances under which a negative impact might be anticipated.
11.3 POTENTIAL IMPACTS OF NEW USES ON EXISTING USES
11.3.1 Commercial Fishing
Proposed new uses on the coast may have consequences for existing commercial fisheries. The potential for conflicts is outlined below and potential impacts are summarized in Table 11-1.
Marine Products Extraction
Presumably marine product extraction would be conducted periodically by harvesting vessels (much like current commercial fishing activity) rather than from fixed installations or platforms. Consequently any effects of this activity on commercial fisheries will depend primarily on where and what scale any eventual extraction occurs. Localized exploration or small scale extraction is not likely to interfere with commercial fish harvesting. Coordination of larger scale extraction with ongoing commercial fisheries may pose greater challenges, but could be relatively easily addressed. Any effects on markets for traditional commercial
(cc) Cory Barnes, 2009
Ilwaco harbor
11-8 | Qualitative Analysis of the Impacts of Proposed New Uses Washington Coastal Marine Advisory Council

Economic Analysis to Support Marine Spatial Planning in Washington
fisheries products would be negligible, with the possible exception of market competition with fish oil-based products which are being produced from commercial fish processing byproducts and marketed for health and therapeutic reasons.
Extraction of any marine products would need to be carefully studied to ensure that the species and quantities harvested are sustainable and do not have adverse effects on the habitat or food chain of existing commercial fishery species or their prey.
Washington Coastal Marine Advisory Council Qualitative Analysis of the Impacts of Proposed New Uses | 11-9

Economic Analysis to Support Marine Spatial Planning in Washington
Table 11-1 Summary of Potential Impacts of New Uses on Commercial Fishing
Potential Impacts
Marine Product
Extraction Offshore
Aquaculture
New Dredge Disposal
Locations
Mining of Gas
Hydrates
Mining of Sand and Gravel
Marine Renewable
Energy Notes
Impacts on commercial harvesters’ income from increased competition with commercial fishery products
– – – – – Adverse effects on commercial harvesters from pressure on ex-vessel prices
Impacts on processors’ income and consumer surplus from increased competition with commercial fishery products
– – – – – Possible positive effects on processors and consumers from increased seafood supplies
Impacts on fishing vessel navigation or safety –
Consultation/coordination needed to locate activities so as to minimize potential for conflict with commercial fisheries
Impacts on fish habitat
– – Offshore aquaculture and mining risk disruption or fouling of habitat; gas hydrate mining rigs and marine renewable energy platforms may enhance habitat for certain species
Impacts on marine food chain – – – –
Without careful planning, marine product extraction and mining of gas hydrates may risk depleting or fouling marine food chains
Impacts on the extent or quality of available fishing grounds –
Consultation/coordination needed to locate activities so as to minimize potential for conflict with commercial fisheries
Impacts from introduced species – – – – – Planning needed to mitigate possible
adverse effects on salmon from exposure to farmed fish
Notes: – = neutral impact; = negative impact; = positive impact; = positive and negative impacts.
11-10 | Qualitative Analysis of the Impacts of Proposed New Uses Washington Coastal Marine Advisory Council

Economic Analysis to Support Marine Spatial Planning in Washington
Offshore Aquaculture
Offshore aquaculture of clams may compete in the market with shellfish (razor clams) caught commercially inshore. Offshore aquaculture of finfish (presumably salmon) would directly compete with product supplied by wild-capture commercial fisheries. Current salmon aquaculture, although credited with making salmon products more widely available to consumers, has depressed ex-vessel prices for wild-caught salmon (Knapp, Roheim, and Anderson 2007). If new aquaculture production is directly substitutable for current wild-caught supplies, then additional price effects may further reduce the income and producer surplus of commercial harvesters.
Increased local supplies of farmed products may have positive effects on local processors (increased production) and consumers (reduced prices or increased consumer surplus). However, local benefits are not guaranteed because supply contracts may result in the new production being shipped out of the region for processing and distribution.
Pollution resulting from the concentrated waste from aquaculture operations is a concern, as is the potential for escape or transmitting parasites or diseases to wild fish stocks. Care must be taken to locate offshore aquaculture facilities where the waste would be quickly flushed away by tides or currents, and opportunities for contact between penned or escaped fish and wild fish stocks are minimized. Although it appears unlikely that populations of escaped farmed salmon would successfully spawn and become established in West Coast streams, it is not without some risk, and the possibility of interbreeding between farmed and native species or opportunities for transmission of pathogens to wild fish need to be carefully studied and considered (Naylor, et al. 2005).
The source of feed stock used for the farmed fish may also be an issue. Local harvesting of baitfish for feeding of penned fish may adversely affect food availability or the food chain for wild fish stocks (or their prey) that are targeted in commercial fisheries.
It is likely that any offshore aquaculture pens would need to be located where they were readily accessible by supply vessels and tenders. Ports on the northern Washington coast are fairly small and remote, so it is unlikely that offshore aquaculture facilities would be located there. Areas closer to the main ports in Pacific County or Grays Harbor County that are capable of accommodating the required vessel traffic and logistics are more likely locations. This would mean the area occupied by aquaculture pens may encroach on the already limited fishing grounds remaining off the southern Washington coast. Unless carefully coordinated, the additional spatial compression in that area would increase the likelihood of conflicts between offshore aquaculture facilities and commercial fishing activities.
Dredge Disposal
The main issues for the commercial fishing industry regarding disposal of dredge spoils are concerns over (1) contamination or covering up of crab beds and/or gear, and (2) navigational safety, especially concerning wave amplification on the Columbia River bar. However these concerns should be able to be fairly easily accommodated by coordinating the scheduling of dredge spoils dumping, and consultations
Washington Coastal Marine Advisory Council Qualitative Analysis of the Impacts of Proposed New Uses | 11-11
Economic Analysis to Support Marine Spatial Planning in Washington
to avoid disposal of dredge spoils in areas that are heavily used by commercial fisheries, or where mounding can amplify wave height near the Columbia River bar.
Mining of Gas Hydrates
The exploration and extraction of gas hydrates could have several adverse impacts on the commercial fishing industry on the coast. Although the mining would presumably be conducted in relatively deep water, the potential for overlap with current commercial fishing activities is probably fairly high. Unless carefully sited, gas hydrate exploration platforms, presumably much like current deep water oil and gas drilling rigs, may obstruct commercial fishing activities or impede vessel navigation. In addition, the network of pipelines and other connections necessary to move the mined gas to shore for processing and distribution would likely create additional opportunities for conflict with commercial fishing and vessel navigation.
There are also concerns that extraction of gas hydrates may adversely affect the environment, much like concerns over offshore oil extraction in other regions. The possibility of a leak or spill of hazardous material from mining, drilling or pumping operations fouling key benthic or pelagic habitat needs to be carefully assessed and mitigation measures considered.
It has also been observed that certain types of fish are more plentiful around marine structures such as oil rigs, which can become artificial reefs over time. Research suggests that certain rockfish species tend to aggregate around oil rig platforms in California (Love and Nishimoto 2012). This has sparked debate about whether it is better to leave decommissioned oil drilling platforms in place as marine habitat enhancements rather than removing them. It seems likely that artificial structures for mining gas hydrates could similarly enhance habitat structure and attract certain marine species.
Mining of Marine Sand and Gravel
Washington coast commercial fisheries would likely be impacted by mining of marine sand and gravel unless the extraction sites were carefully coordinated to avoid areas of high use by crab fisheries and other bottom-tending gear. Presumably some of the most accessible marine sand and gravel deposits for mining are located within existing fishing grounds just off the southern Washington coast. Care must be taken to avoid conducting mining or dredging operations in key fishing grounds or during certain high-use periods of the year.
Increased vessel traffic associated with dredging and transporting the mined material could also lead to conflicts and/or safety issues with commercial fishing vessels deploying gear or transiting areas near offshore mining operations.
Offshore Wind, Wave, and Tidal Energy
Offshore energy development is likely to have the largest footprint of all the new uses discussed in this section. The potential for conflicts with commercial fishing vessels deploying gear or transiting areas near an offshore energy facility are significant. In addition, the network of transmission cables and other
11-12 | Qualitative Analysis of the Impacts of Proposed New Uses Washington Coastal Marine Advisory Council

Economic Analysis to Support Marine Spatial Planning in Washington
connections necessary to move electricity to shore would create additional opportunities for conflict with fishing and navigation.
The geography of the Washington coast is unique, with the main ports and population centers located toward the south and communities to the north being fairly small and remote. This means that any offshore energy installations would most likely be placed off the southern Washington coast adjacent to the main ports in Pacific County or Grays Harbor County where infrastructure is most compatible with constructing and servicing offshore facilities and collecting and distributing the electrical energy produced. Unless carefully coordinated, any further compression of already very limited fishing grounds off the southern Washington coast increases the likelihood for conflict between offshore energy facilities and the commercial fishing industry.
In the sector report, industry representatives were cited as raising concerns that new uses on the Washington coast could reduce available fishing areas. Their greatest concern was the potential for conflict between offshore energy development and commercial fishing. The perception is that these projects would reduce available fishing grounds in areas off the southern Washington coast that are already highly compressed and heavily utilized for commercial fishing. Any further reductions in available fishing grounds or opportunities off the southern Washington coast could create significant additional strain on the remaining economic viability of the Washington coast commercial fishing industry.
As was noted above regarding gas hydrate mining platforms, structures built for offshore energy generation may serve as artificial reefs, enhancing habitat, attracting and aggregating certain marine species including those caught in commercial fisheries.
11.3.2 Shellfish Aquaculture
Proposed new uses on the coast may have some consequences to existing commercial aquaculture. These conflicts are outlined below and impacts are summarized in Table 11-2.
Marine Products Extraction
Any effects on markets for traditional commercial shellfish aquaculture products are anticipated to be negligible unless, though highly unlikely) a product extracted is a substitute for a shoreside shellfish aquaculture product. If so, one might see a downward shift in prices for existing shoreside shellfish products, and a shift in consumer demand and reduction in producer surplus (profits). There is some chance, however, of the potential for trespassing on private shellfish beds or existing infrastructure which might put growers at financial or legal risk.
Offshore Aquaculture
If offshore aquaculture is focused on bivalve species such as oysters or clams, there would be direct competition with shellfish raised in the estuaries, unless the offshore facility is owned and operated by an existing shoreside grower/processor. If the products are directly substitutable and have noted quality or
© Katharine Wellman, 2015
Oysters
Washington Coastal Marine Advisory Council Qualitative Analysis of the Impacts of Proposed New Uses | 11-13

Economic Analysis to Support Marine Spatial Planning in Washington
taste differences that attracts consumers away from the shoreside product, there would be potential prices effects and reductions in producer surplus and profits for the shoreside aquaculture products.
Pollution resulting from the concentrated waste from aquaculture operations and the potential for transmitting parasites or diseases to shoreside stocks, water quality and hypoxia is a concern. Care must be taken to site offshore aquaculture facilities where the waste would be quickly flushed away by tides or currents.
Dredge Disposal
Past dredging activities are believed to have affected tidal flow and caused migration of sediment/sand with subsequent detrimental effects on shellfish aquaculture growth rates and then production (IEc 2014). There is also come concern for the release of contaminates that could impact the safety and or quality of the shellfish aquaculture product. Generally speaking, however, the new dredge disposal sites that have been identified are not located near existing shellfish beds and should not have an effect on commercial aquaculture.
.
11-14 | Qualitative Analysis of the Impacts of Proposed New Uses Washington Coastal Marine Advisory Council

Economic Analysis to Support Marine Spatial Planning in Washington
Table 11-2 Summary of Potential New Uses on Shoreside Aquaculture
Potential Impacts
Marine Product
Extraction Offshore
Aquaculture
New Dredge Disposal
Locations
Mining of Gas
Hydrates
Mining of Sand and Gravel
Marine Renewable
Energy Notes
Competition with existing shellfish products
– – – – – For marine product extraction and offshore aquaculture, competition will only be a concern if the off-shore products are viewed as substitutes to existing products. Off-shore aquaculture could be operated by existing shoreside grower processors. Aquaculture industry could benefit from a stronger support and processing infrastructure
Changes in turbidity, tidal flow and circulation that affect shellfish growth rates and production – – – –
There is limited evidence that commercial-scale Marine Renewable Energy projects sited in or near estuaries will influence tidal flow and other physical factors. Further consultation will be needed to understand these potential impacts. No scientific support for the supposition of impacts from sand and gravel mining in the estuaries.
Increased vessel traffic that affects safety in the estuaries – – – – – –
It is unlikely that there will be effects on aquaculture harvest and production. Consultation / coordination with aquaculture industry needed to minimize conflicts.
Restrictions on state lands for commercial aquaculture that affect shellfish production – – – – – – No methane hydrates mining will occur in
state waters. No sand mining will occur in tidal areas.
Placement of shoreside energy transmission and mining facilities that affect aquaculture harvest and processing activities
– – – – – – Rehandling areas/pipelines on aquaculture beds highly unlikely but Consultation / coordination with aquaculture industry needed to minimize conflicts.
Notes: – = neutral impact; = negative impact; = positive impact; = positive and negative impacts.
Washington Coastal Marine Advisory Council Qualitative Analysis of the Impacts of Proposed New Uses | 11-15

Economic Analysis to Support Marine Spatial Planning in Washington
Mining of Gas Hydrates
There is some concern about the environmental impacts of mining gas hydrates on shellfish and other benthic invertebrates. The possibility of a leak or spill of hazardous material from mining, drilling or pumping operations impacting water quality needs to be carefully assessed and mitigation measures put in place. However, there will be no mining of methane hydrates in waters of Washington State so at this time there are no anticipated impacts on the coastal aquaculture industry.
Mining of Marine Sand and Gravel
There is no scientific evidence of impacts to the shellfish aquaculture sector from mining of marine sand and gravel. If such mining occurs in the estuaries, however, it is possible that turbidity or changes in tidal flows due to scour from mining could impact shellfish growth and production (K. Gianou, pers. comm., 2015).
Offshore Wind, Wave, and Tidal Energy
The network of transmission cables to move electricity to shore would create additional opportunities for potential conflict with navigation. The unique geography of the Washington coast means that there is a high probability any offshore energy infrastructure installations would be placed in Grays Harbor, where infrastructure levels are most compatible with constructing and servicing the offshore facilities and distributing the electrical energy produced. While without documented evidence, there is speculation in the literature that marine renewable energy could, in some circumstances, potentially change physical factors such as tidal flow and water exchange. According to Boehlert et al. (2008), Copping et al. (2013), and Polagye et al. (2011), marine renewable energy extraction may influence the surf mixing zone, tidal ranges, and oxygen and water exchange of the marine environment. If these processes were altered, there may be effects to water quality and habitat along the nearshore, particularly for commercial-scale tidal current energy projects within semi-enclosed water bodies (i.e., estuaries). This could potentially impact coastal aquaculture which relies on natural physical processes to maintain water quality and optimal shellfish growing conditions. According to the authors of these reports, it is currently unclear how likely or to what extent these impacts would occur. Finally, while energy suitability maps developed by Copping et al. (2013) were done to analyze technical suitability of marine renewable energy technologies, they did not offer insights in the conflict of current uses such as privately owned or leased shellfish beds, or address the likelihood of marine renewable energy project locations.
© Global Marine, 2007
Example of offshore wind energy
11-16 | Qualitative Analysis of the Impacts of Proposed New Uses Washington Coastal Marine Advisory Council

Economic Analysis to Support Marine Spatial Planning in Washington
11.3.3 Recreational Fishing
Marine recreational fishing activity important to the Washington coast can be generally characterized as follows:
Salmon fishing accounts for the largest share of recreational fishing (both from charter and private boats) originated from all Washington coast ports, with the exception of charter boat fishing out of the Neah Bay port area.
Recreational fishing for bottomfish is the second most important (in terms of annual number of trips between 2004 and 2013) fishing activity originating from Washington coast ports, with the exception of private boat fishing out of the Ilwaco port area and charter boat fishing out of the Chinook port area.
Recreational fishing for albacore is a particularly important activity out of the ports of La Push and Westport.
Halibut is considered a highly prized target, but recreational fishing for halibut takes place only on a few days per year; most activity (more than 90 percent of trips) occurs out of Westport, La Push, and Neah Bay.
In addition to charter and private boat fishing activities off the Washington coast, digging for razor clams is a very popular activity along the southern portion of the coast.
New uses being considered for siting on the Washington coast have the potential to impact—both negatively, and in some cases, beneficially—these economically-important recreational fishing activities. Potential effects of new uses on the recreational fishing industry are described below and summarized in Table 11-3. The “Potential Impact” categories in Table 11-3 were developed based on consideration of existing issues, including trends that could affect the extent of these issues, currently being faced by the recreational fishing industry, as discussed in Section 10.2, “Recreational Fishing.”
Marine Products Extraction
Resource conditions of species important to recreational anglers, including halibut, bottomfish, and salmon, are essential to maintaining high quality sport fishing experiences, which serves as the backbone of the recreational fishing industry along the Washington coast. Although extraction of marine products has the potential to adversely affect habitat for these species that could, in turn, either reduce catch success or even lead to closures of areas for sport fishing activities, recent studies conducted by the Washington Department of Ecology suggest that the Washington coast is not considered a primary target area for marine products extraction. However, even preliminary operations associated with extraction would need to be carefully studied to ensure that the quantities of materials removed would not adversely affect critical habitat for important recreational fishery species. Although this type of evaluation and coordination would appear feasible, the potential for a negative impact on key recreational species from extraction activities is possible.
Washington Coastal Marine Advisory Council Qualitative Analysis of the Impacts of Proposed New Uses | 11-17

Economic Analysis to Support Marine Spatial Planning in Washington
As described in Section 11.3.1, “Commercial Fishing,” harvesting of marine plant and animals products to develop non-food products presumably would be conducted using harvesting vessels rather than from fixed installations or platforms. Consequently, extraction-related effects on recreational fisheries will depend primarily on the location and scale of a proposed extraction operation. Potential adverse effects of small-scale extraction operations could be avoided fairly easily through coordination with existing recreational fishing operations so as not to interfere with these existing uses. Large scale extraction operations, however, would require more extensive coordination among affected interests to avoid potential negative impacts on existing recreational fishing operations and activities even though these coordination efforts would appear generally feasible. Consequently, the potential for a negative impact from conflicts with large scale extraction operations on fishing grounds therefore is possible.
As indicated in Table 11-3, marine products extraction would not be expected to have consequential environmental impacts, such as contributing to acidification, which would substantially affect existing recreational fishing uses.
11-18 | Qualitative Analysis of the Impacts of Proposed New Uses Washington Coastal Marine Advisory Council

Economic Analysis to Support Marine Spatial Planning in Washington
Table 11-3 Summary of Potential Impacts of New Uses on Recreational Fishing
Potential Impacts
Marine Product
Extraction Offshore
Aquaculture
New Dredge Disposal
Locations
Mining of Gas
Hydrates
Mining of Sand and Gravel
Marine Renewable
Energy Notes
Impacts on fishing vessel navigation, gear, or safety Consultation/coordination needed to locate
activities so as to minimize potential for conflict with recreational fisheries
Impacts on habitat important to marine recreational fishing –
Offshore aquaculture and mining risk disruption or fouling of habitat; gas hydrate mining and marine renewable energy platforms may enhance habitat for certain species
Impacts on extent or quality of available fishing grounds – – Consultation/coordination needed to locate
activities so as to minimize potential for conflict with recreational fisheries
Impacts from introduced species – – – – – Planning needed to mitigate possible adverse
effects on salmon from exposure to farmed fish
Notes: – = neutral impact; = negative impact; = positive impact; = positive and negative impacts.
Washington Coastal Marine Advisory Council Qualitative Analysis of the Impacts of Proposed New Uses | 11-19

Economic Analysis to Support Marine Spatial Planning in Washington
Offshore Aquaculture
Offshore aquaculture for finfish (presumably salmon) and shellfish would be expected to be located in marine areas outside of the coastal estuaries. Offshore aquaculture facilities would likely include either net pens or submersible cages for finfish, and/or longlines moored to the seafloor for shellfish production. Environmental concerns associated with offshore aquaculture operation include seafloor accumulation of food particles and feces that could affect benthic chemistry, and the presence of chemical contaminants used in the operations. These negative effects could affect aquatic conditions for key species that are important to the recreational fishing industry. Also, the facilities used for offshore aquaculture operations, including cages longlines, and moorings, appear likely to pose conflicts for charter boats and private vessels used for sport fishing.
As indicated in Section 11.3.1, “Commercial Fishing,” there is a high probability that offshore aquaculture pens would be sited where they can be readily accessed and serviceable by vessels originating from the main southern Washington Coast ports of Ilwaco or Grays Harbor. Unless these operations are carefully coordinated, fishing grounds that are already limited in the area could become more compressed, leading to a greater likelihood for conflicts between offshore aquaculture facilities and recreational (and commercial) fishing vessels and/or gear. Lastly, as discussed in Section 11.3.1, there are concerns over the potential escape of fish raised in offshore aquaculture facilities and adverse effects on wild stocks.
As indicated in Table 11-3, offshore aquaculture would not be expected to have consequential effects on fishery resource conditions that would substantially affect existing recreational fishing uses.
Dredge Disposal
In-water disposal of dredge materials is a practice being considered for expansion along the Washington coast. Although this practice has been used in the past, new disposal areas are being considered, focused primarily near the mouth of the Columbia River.
The primary negative impact of in-water disposal of dredge materials is potential habitat destruction. Based on current information, certain benthic species such as Dungeness crab and razor clams, are the most at-risk species for direct burial impacts. Little information is available on potential impacts of dredge disposal on marine fish, birds, and mammals, and the potential for impacts on these species is considered low. The potential for negative impacts from burial of certain benthic species important to recreational fisheries is possible, however.
An additional concern of dredge disposal is the potential impact on navigational safety from the amplifying of waves caused by the mounding of disposal piles. Standards have been established for wave amplification in the Columbia River mouth area and the Army Corps of Engineers has a monitoring program in place to ensure that effects from dredge disposal on wave amplification remain within established standards. As a result, the likelihood for potential adverse effects from dredge disposal at new locations appears low.
11-20 | Qualitative Analysis of the Impacts of Proposed New Uses Washington Coastal Marine Advisory Council

Economic Analysis to Support Marine Spatial Pla
As indicated in Table 11-3, dredge disposal in new locations would not be expected to results in consequential conflicts on fishing grounds that would substantially affect existing recreational fishing uses.
Mining of Gas Hydrates
As identified in Section 11.3.1, “Commercial Fishing,” the exploration and extraction of gas hydrates could have several adverse impacts on the commercial (and recreational) fishing industry along the Washington coast. Although mining presumably would be conducted in relatively deep water (i.e., outside of State waters), exploration/extractions operations would appear to have potential to conflict with current recreational fishing activities. Unless carefully sited, establishing exploration platforms, presumably much like constructing and operating deepwater oil and gas drilling rigs, could obstruct recreational fishing activities or impede vessel navigation. In addition, the network of pipelines necessary to move the mined gas to shore for processing and distribution would appear to contribute to likely conflicts between fishing and vessel navigation.
In addition to potential displacement effects, other effects that could be a concern to the recreational fishing industry include changes in the location and behavior of species important to the recreational fishing industry, and potential loss of fishing gear due to the tangling with exploration/extraction facilities. However, these potentially adverse effects would likely be offset to some degree by potential beneficial effects associated with creating marine habitat improvements by constructing artificial reefs that benefit species important to recreational fisheries.
As indicated in Table 11-3, mining of gas hydrates would not be expected to have environmental impacts that would substantially affect existing recreational fishing uses.
Mining of Marine Sand and Gravel
The mining of marine sand and gravel could adversely affect the recreational fishing industry by creating potential vessel traffic conflicts, restricting access to fishing grounds, and potential gear loss. Presumably, existing fishing grounds just off the southern Washington coast would be most likely for these operations. Also, marine sand and gravel mining could disrupt habitat conditions, leading to adverse effects on species important to recreational anglers. These areas also have extensive beach use that may conflict with these operations.
Although the intended use of the marine sand and gravel is uncertain, use of these materials have the potential to contribute to beach nourishment and in the defense from coastal hazards. (Some of these coastwide hazards (e.g., tsunamis) are described in Chapter 10, Risks and Vulnerabilities.) These beneficial effects from sand and gravel mining appear likely.
As indicated in Table 11-3, mining of marine sand and gravel would not be expected to results in consequential environmental impacts that would substantially affect existing recreational fishing uses. Shellfish can be directly harmed by disturbances to their habitat, and shellfish harvesting would be affected by reduced access and abundance.
Washington Coastal Marine Advisory Council Qualitative Analysis of the Impacts of Proposed New Uses | 11-21

Economic Analysis to Support Marine Spatial Planning in Washington
Offshore Wind, Wave, and Tidal Energy
Of all of the new uses being considered for the Washington coast, offshore energy development would be expected to likely have the largest footprint. Energy developments that are being considered include wind, wave, and tidal energy. The Washington coast is considered to have significant wind and wave resources for potential development.
Potentially adverse conflicts with recreational fishing from developing marine renewable energy include vessel conflicts from vessels deploying gear or transitioning areas near an offshore energy facility. In addition, the network of transmission cables to move electricity to shore would create additional potential for conflict with fishing and navigation. Area restrictions around energy facilities could also conflict with recreational fishing activity.
The unique geography of the Washington coast would suggest that the siting of offshore energy installations would be most likely off the southern Washington coast near the ports of Ilwaco or Grays Harbor. Existing infrastructure in these areas is most compatible with the construction and servicing of offshore facilities and with distributing the electrical energy produced from these facilities. Similar to conditions described above for Offshore Aquaculture uses, the already limited fishing grounds off the southern Washington coast could become even more compressed, resulting in conflicts between offshore energy facilities and recreational charter operators and private fishing vessels. This potential impact is considered likely and adverse.
The construction of offshore energy development facilities also has the potential for providing new habitat for certain marine species that could use these facilities as artificial reefs. This could lead to habitat improvements that support populations of marine species important to recreational fishing along the Washington coast. This potential impact is considered likely and positive.
11.3.4 Recreation and Tourism
Recreation and tourism activities important to the Washington coast can be characterized as follows:
The top five recreation activities that visitors to the Washington coast participated in during 2014 were: beach going, sightseeing, camping, hiking, and photography
Pacific County accounted for 37 percent of all outdoor recreation trips in 2014 to the coastal region, followed closely by Grays Harbor County at 36 percent.
Trip-related recreation spending within the coastal region was an estimated $481 million in 2014.
New uses being considered for siting on the Washington coast have the potential to impact—both negatively and in some cases positively—important recreation and tourism activities. Potential impacts of new (or expanded) coastal uses on the recreation and tourism industry are described below and
Photo courtesy National Park Service 2009
Beach hiking
11-22 | Qualitative Analysis of the Impacts of Proposed New Uses Washington Coastal Marine Advisory Council

Economic Analysis to Support Marine Spatial Pla
summarized in Table 11-4. The “Potential Impact” categories in Table 11-4 were developed based on considering existing issues, being faced by the recreation and tourism industry, as discussed in Section 10.5, “Recreation and Tourism.” Trends in recreation activities that could affect the extent and magnitude of these issues (discussed in Section 7.6, “Trends Affecting Recreational and Tourism Activities in the Coastal Study Area”) also were considered in developing these Potential Impacts.
Marine Products Extraction
As described in Section 11.3.3, “Recreational Fishing,” harvesting of marine plant and animals products to develop non-food products presumably would be conducted using harvesting vessels rather than from fixed installations or platforms. Extraction-related effects on recreation and tourism would be related to potential site conflicts between these activities and existing recreation and tourism activities, but would depend primarily on the location and scale of a proposed extraction operation. Potential adverse effects of small-scale extraction operations could be avoided fairly easily through coordination with existing recreation and tourism operations so as not to interfere with existing uses. Larger scale extraction operations would require more extensive coordination among affected interests to avoid potential impacts. Because the Washington coast is not considered a primary target area for marine product extraction, recreation and tourism effects would appear unlikely.
Washington Coastal Marine Advisory Council Qualitative Analysis of the Impacts of Proposed New Uses | 11-23

Economic Analysis to Support Marine Spatial Planning in Washington
Table 11-4 Summary of Potential Impacts of New Uses on Recreation and Tourism
Potential Impacts
Marine Product
Extraction Offshore
Aquaculture
New Dredge Disposal
Locations
Mining of Gas
Hydrates
Mining of Sand and Gravel
Marine Renewable
Energy Notes
Access to Locations for Recreation and Tourism Activities – – – – – Recreation sites near sand and gravel mining
could be closed temporarily, but access would be much improved in the longer term.
Disruption or Displacement of Recreation Activities – Disruption of cruise, sightseeing, or pleasure
boaters from increased vessel traffic or access limits by offshore facilities.
Quality of Experience at Nearby Recreation Sites –
Vessel traffic and congestion, noise, visual impairment, and disturbed habitat areas important to wildlife viewers are the primary concerns. Habitat near marine renewable energy sites could enhance some activities.
Rate or Quantity of Tourist Participation – –
Offshore facilities can create unwanted views, vessel traffic conflicts with boater tourists. Marine renewable energy could be an attraction or distraction for tourists. Beach conditions would improve with sand and gravel mining.
Notes: – = neutral impact; = negative impact; = positive impact; = positive and negative impacts.
11-24 | Qualitative Analysis of the Impacts of Proposed New Uses Washington Coastal Marine Advisory Council

Economic Analysis to Support Marine Spatial Pla
Offshore Aquaculture
Offshore aquaculture for finfish (presumably salmon) and shellfish would be expected to be located in marine areas outside of the coastal estuaries. Offshore aquaculture facilities would likely include either net pens or submersible cages for finfish, and/or longlines moored to the seafloor for shellfish production.
The facilities used for offshore aquaculture operations, including cages longlines, and moorings, could pose conflict for boaters, including sightseeing charters and private for-pleasure vessels. As indicated in Section 11.3.3, “Recreational Fishing,” there is a high probability that offshore aquaculture pens would be sited where they can be readily accessed and serviceable by vessels originating from the main southern Washington Coast ports of Ilwaco or Grays Harbor. Unless the siting of these operations are carefully coordinated, potential conflicts with recreational boating activities would appear likely, leading to disruption or displacement of coastal visitors that could negatively affect the coastal tourism economy.
Dredge Disposal
In-water disposal of dredge materials is a practice being considered for expansion along the Washington coast. Although this practice has been used in the past, new disposal areas are being considered, focused primarily near the mouth of the Columbia River.
As indicated in Section 11.3.3, “Recreational Fishing,” one potential concern of in-water disposal of dredge materials is the amplifying of waves caused by the mounding of disposal piles, which can contribute to vessel safety concerns. These safety concerns could affect recreational boating activities, which could disrupt or displace coastal visitors who participate in recreational boating. Coordination of different operations and activities would appear to minimize potential effects.
Although the impacts of disposing of dredge materials at new sites has potentially adverse habitat destruction effects, depositing dredge materials in areas that are currently subject to ongoing erosion also has the potential to beneficially affect certain recreation areas that otherwise might be eroded away.
Mining of Gas Hydrates
As identified in Section 11.3.3, “Recreational Fishing,” the exploration and extraction of gas hydrates has the potential to adversely impact recreational activities along the Washington coast. Unless carefully sited, the establishment of exploration platforms, presumably much like deepwater oil and gas drilling rigs, could obstruct recreational boating activities (both charters and private vessels) or impede vessel navigation. The network of pipelines necessary to move the mined gas to shore for processing and distribution would likely have the potential to conflict with recreational boaters. Lastly, the visual impacts of on-shore gas pipelines and/or infrastructure needed to support these operations has the potential for adverse visual impacts and potential beach use conflicts for a wide range of seashore visitors, including beach goers and sightseers. Disruption or displacement of coastal visitors could negatively affect the coastal tourism economy.
Washington Coastal Marine Advisory Council Qualitative Analysis of the Impacts of Proposed New Uses | 11-25

Economic Analysis to Support Marine Spatial Planning in Washington
Mining of Marine Sand and Gravel
The mining of marine sand and gravel could adversely affect the recreation and tourism industry by creating potential vessel traffic conflicts, restricting access to recreation areas, and generating noise and traffic that would adversely affect the coastal visitor experience. Also, marine sand and gravel mining could disrupt habitat conditions, leading to adverse effects on species important to birdwatchers and other wildlife enthusiasts. Presumably, existing areas off the southern Washington coast would be most likely for these operations. These areas also have extensive beach use that may conflict with these operations, at least temporarily.
Although the intended uses of the marine sand and gravel to be mined is uncertain at this point, a potentially important beneficial use of these materials would be to contribute to beach nourishment and in the defense of coastal uses from environmental hazards. These potential impacts could result in beneficial effects to wildlife habitat and wildlife viewing opportunities. The impacts associated with certain coastwide hazards (e.g., tsunamis) are described in greater detail in Chapter 10, Risk and Vulnerability of Marine-dependent Sectors.
Offshore Wind, Wave, and Tidal Energy
As described in Section 11.3.3, “Recreational Fishing,” offshore energy development would be expected to have the largest footprint. Energy developments that are being considered include wind, wave, and tidal energy. The Washington coast is considered to have significant wind and wave resources for potential development.
Potentially significant conflicts with recreation and tourism from developing marine renewable energy include potential vessel conflicts and adverse visual impact to some coastal visitors associated with the presence of marine renewable energy facilities in the viewshed. As indicated in Section 11.3.3, “Recreational Fishing,” the unique geography of the Washington coast would suggest there being a high probability that offshore energy installations would be sited off the southern Washington coast, likely near the ports of Ilwaco or Grays Harbor where existing infrastructure is most compatible with constructing and servicing the offshore facilities.
Other potential negative impacts of energy development facilities on recreation and tourism include potential effects of the facilities on migrating whales and other mammals, potential electromagnetic field effects from underwater lines, effects of structure lighting on birds and fish, and potential effects of chemical contaminants on fish and wildlife resources. Potential positive impacts from offshore energy development include the potential for improving habitat for marine species that could enhance underwater activities such as scuba diving.
11-26 | Qualitative Analysis of the Impacts of Proposed New Uses Washington Coastal Marine Advisory Council

Economic Analysis to Support Marine Spatial Pla
11.3.5 Shipping
Proposed new uses on the coast could impact commercial shipping vessels entering and exiting the Port of Grays Harbor as well as vessels transiting the Washington coast but not using coastal ports. For this discussion, the Port of Port Angeles is not included because the proposed new use analysis does not include the Strait of Juan de Fuca.
A key point to note in assessing impacts from potential new uses is that most deep draft vessels and barges carrying liquid bulk transit the coast well offshore. On the northern coast there is an Area to Be Avoided (ATBA)1 that extends up to 25 miles off the coast before tapering down at the entrance to the Strait of Juan de Fuca. However barges carrying dry cargoes up or down the coast and vessels and barges entering or leaving the Port of Grays Harbor transit closer to the coast and hence may have greater a chance of impacts with proposed new uses (BST 2014) (see Figure 11-3).
The potential conflicts with shipping are addressed below and impacts are summarized in Table 11-5.
1 The Area to Be Avoided was established to reduce risk to the marine environment of the Olympic Coast Sanctuary. All ships and barges that carry oil or hazardous materials in bulk as cargo or cargo residue, and all ships 400 gross tons and above, are expected to avoid this area (Ecology 2014).
Washington Coastal Marine Advisory Council Qualitative Analysis of the Impacts of Proposed New Uses | 11-27

Economic Analysis to Support Marine Spatial Planning in Washington
Figure 11-3 Shipping Lanes, Including Deep Draft Waterways
11-28 | Qualitative Analysis of the Impacts of Proposed New Uses Washington Coastal Marine Advisory Council

Economic Analysis to Support Marine Spatial Planning in Washington
Table 11-5 Summary of Potential Impacts of New Uses on Commercial Shipping
Potential Impacts
Marine Product
Extraction Offshore
Aquaculture
New Dredge Disposal
Locations
Mining of Gas
Hydrates
Mining of Sand and Gravel
Marine Renewable
Energy Notes
Additional project related vessel traffic could interfere with commercial vessel traffic – – – – – –
While conflicts between project-related vessels and commercial shipping vessels is possible it would be limited to near shore transits. The increase in project-related vessels is assumed to be small but coordination of vessels may be needed to minimize conflicts
Potential navigation conflicts or safety issues caused by project equipment – – Level of conflict will depend on specific
locations of projects and equipment used.
Increased access to ports – – – – – Any negative navigation and safety issues for commercial shipping would be short term. Longer term positives
Notes: – = neutral impact; = negative impact; = positive impact; = positive and negative impacts.
Washington Coastal Marine Advisory Council Qualitative Analysis of the Impacts of Proposed New Uses | 11-29

Economic Analysis to Support Marine Spatial Planning in Washington
Marine Products Extraction
If extraction of marine products includes periodic harvesting via vessels rather than from fixed installations or platforms, it would add to vessel traffic on the coast. Depending on the location of the extraction areas and the number of vessels involved, it is possible there could be some conflict with shipping, particularly commercial vessels transiting close to the coast and near Grays Harbor. However it is likely the number of vessels involved with harvest would be small, and any potential conflicts could be resolved with coordination of efforts between shippers and marine products extraction harvesting vessels.
Offshore Aquaculture
Similar to marine products extraction, offshore aquaculture would entail some increase in vessel traffic to maintain and operate the aquaculture pens and to move products to shore where they could be processed or transported to other markets. If offshore aquaculture is restricted on the north coast because of the Sanctuary, offshore aquaculture impacts would be limited to the south coast. Assuming the aquaculture operation would be well inside the Washington coastal shipping channel, the conflicts would be limited mostly to commercial vessels entering and exiting the Port of Grays Harbor or barges carrying dry cargo up and down the coast to non-MSP ports. Assuming a fairly small number of vessels involved in the offshore aquaculture, these conflicts likely could be resolved with coordination of vessel movements.
Depending upon the kind of aquaculture cages used for finfish aquaculture and the depth of any submergible cages used it is possible there could be conflicts between commercial vessels moving in the offshore aquaculture operational areas and the equipment used for the operation.
If the proposed project involves shellfish aquaculture, which uses longlines, additional conflicts between commercial shipping vessels and the aquaculture operations could occur.
Dredge Disposal
Dredging in the south coast is done to in part to maintain commercial shipping vessel access to the Port of Grays Harbor. Proposed adjustments to dredge disposal sites in Grays Harbor would help overcome capacity and accessibility issues with current dredge disposal site. This would have positive impacts for the shipping sector. There could be some navigational issues during the actual dredging and disposal operations but this would be short term in nature. Overall proposals for adjusted dredge disposal should be a positive for the shipping sector.
Mining of Gas Hydrates
No mining of hydrates would occur in state waters (3 nautical miles from the coast) and any proposed mining would occur in deeper waters. Depending on where a mining project was located, it could interfere with the shipping channel or vessel transit into Grays Harbor. As described above in the commercial fishing section, mining facilities (e.g., platforms) could be navigational hazards for commercial shipping vessels.
11-30 | Qualitative Analysis of the Impacts of Proposed New Uses Washington Coastal Marine Advisory Council
Economic Analysis to Support Marine Spatial Planning in Washington
Mining of Marine Sand and Gravel
Assuming sand and gravel mining would be limited to areas outside the Olympic Coast Sanctuary, proposed project impacts would be on the south coast.
Increased barge traffic associated with sand and gravel mining could create a conflict with commercial shipping vessels transiting near the coast or in and out of Grays Harbor. Scale of the project and the number of vessels involved in dredging and movement of mined products would need to be examined to determine whether the increased vessel traffic would significantly impact commercial shipping vessel movements.
Offshore Wind, Wave, and Tidal Energy
Based on an examination of site quality, grid connection and shore side support, one recent analysis concluded the southern half of the coast had more areas of high suitability for renewable energy development than the north coast. This same study noted most areas of high suitability are within 25 miles of the coast. If offshore projects occur within the next five to seven years, existing technology is expected to constrain deployment to no more than a few miles offshore. The exception would be offshore wind which could be deployed as far out as 20 miles off shore. (Pacific Northwest National Laboratory 2013).
Given most deep draft vessels and barges carrying liquid bulk transit further offshore than these potential energy projects, these vessels would not be impacted by any near term (5−7 years) projects. The exceptions are barges carrying dry bulk, barges and other vessels going to the Port of Grays Harbor, and vessels entering the Columbia River. This latter set of vessels could be impacted by offshore development even in this 5- to 7-year window (BST 2014).
Assuming offshore energy technologies continue to evolve potentially project beyond this near term window could have additional impacts in the shipping channel if the new technologies allow for installations further from the coast.
Given the limited deployment of offshore energy anywhere in the United States, there is little information as to how to site projects in such a way to minimize conflicts with shipping. The U.S. Coast Guard would set exclusion zones around the marine energy structures. Also channel distances between offshore wind turbines would need to be considered. Many of these factors are not well analyzed. Any proposals for offshore energy projects on the Washington coast would require careful analysis of impacts on the shipping channels (IEc 2014).
REFERENCES
Boehlert, G. W., G. R. McMurray, and C. E. Tortorici (eds.). 2008. Ecological Effects of Wave Energy in the Pacific Northwest (NOAA Technical Memorandum NMFS-F/SPO-92). U.S. Department of Commerce. Available at: hmsc.oregonstate.edu/files/main/waveenergynoaatm92.pdf.
Washington Coastal Marine Advisory Council Qualitative Analysis of the Impacts of Proposed New Uses | 11-31

Economic Analysis to Support Marine Spatial Planning in Washington
BST Associates. 2014. Washington Coast Marine Spatial Planning Assessments of Shipping Sector. August 2014.
Copping, A., J. Hanna, J. Whiting, S. Geerlofs, M. Grear, K. Blake, and H. Battey. 2013. Environmental effects of marine energy development around the world for the OES Annex IV (Annex IV Final Report No. PNNL-22176). Richland, WA: Pacific Northwest National Laboratory. Available at: mhk.pnnl.gov/sites/default/files/publications/Final%20Annex%20IV%20Report%202013 %20v2.pdf
Ecology. See Washington Department of Ecology.
IEc. See Industrial Economics, Inc.
Industrial Economics, Inc. 2014. Marine Sector Analysis Report: Marine Renewable Energy. Available at: msp.wa.gov/wp-content/uploads/2014/03/EnergySectorAnalysis.pdf. Accessed June 2015.
Love, M. S., and M. M. Nishimoto. 2012. Completion of Fish Assemblage Surveys Around Manmade Structures and Natural Reefs off California. BOEM OCS Study 2012-020 Marine Science Institute, University of California, Santa Barbara, California. BOEM Cooperative Agreement No.: M10AC2001. Available at: www.lovelab.id.ucsb.edu/BOEM%20final%20report %202012.pdf.
Knapp, G., C. Roheim, and J. Anderson. 2007. The Great Salmon Run: Competition between Wild and Farmed Salmon. TRAFFIC North America. Washington, DC: World Wildlife Fund. Available at: www.iser.uaa.alaska.edu/people/knapp/personal/pubs/TRAFFIC/The_Great_Salmon_Run.pdf.
Naylor, R., et al. 2005. Fugitive Salmon: Assessing the Risks of Escaped Fish from Net-Pen Aquaculture. BioScience 55(5):427-437 (May). Available at: bioscience.oxfordjournals.org/content/55/ 5/427.full.pdf
Pacific Northwest National Laboratory. 2013. Geospatial Analysis of Technical and Economic Suitability for Renewable Ocean Energy Development of Washington’s Outer Coast.
Polagye, B., B. Van Cleve, A. Copping, and K. Kirkendall (eds.). 2011. Environmental effects of tidal energy development: Proceedings of a Seattle workshop (NOAA Technical Memorandum NMFS-F/SPO-116). U.S. Department of Commerce. Available at: tethys.pnnl.gov/sites/default/ files/publications/Tidal%20Energy%20Workshop%20Proceedings%202011.pdf
RCW. See Revised Code of Washington.
Revised Code of Washington. Chapter 43.372.040 RCW, Marine Waters Planning and Management. Available at: apps.leg.wa.gov/rcw/default.aspx?cite=43.372&full=true. Accessed June 15, 2015.
Washington Department of Ecology. 2015. MSP Potential New Use Literature Summary. Washington Coastal Marine Advisory Council meeting materials for January 7 and February 25, 2015.
Washington Department of Ecology. 2014. Vessel Entries and Transits for Washington Waters VEAT 2013. Publication 14-08-004. March 2014.
11-32 | Qualitative Analysis of the Impacts of Proposed New Uses Washington Coastal Marine Advisory Council

Economic Analysis to Support Marine Spatial Planning in Washington
PERSONAL COMMUNICATIONS
Gianou, Kelsey. Marine Spatial Planning, Washington Department of Ecology. Personal communication on June 24, 2015, about sand and mining tidal effects on aquaculture.
IMAGES
Chapter 11 Header Image: (cc) Anupam_ts, 2013. Cape Flattery. Retrieved July 4, 2015, from: www.flickr.com/photos/anupamsrivastava/9721576376
Page 11-8: Cory Barnes, 2009. Ilwaco Harbor. Retrieved July 6, 2015, from www.flickr.com/photos/1337n00b/3835502849
Page 11-14: Global Marine, 2007. Wind Farm at Sunset. Retrieved July 7, 2015, from: www.flickr.com/photos/globalmarinesystems/5987370629/
Washington Coastal Marine Advisory Council Qualitative Analysis of the Impacts of Proposed New Uses | 11-33

Economic Analysis to Support Marine Spatial Planning in Washington
This page intentionally left blank
11-34 | Qualitative Analysis of the Impacts of Proposed New Uses Washington Coastal Marine Advisory Council

CHAPTER 12. Additional Research and Study Needs
The Washington Marine Spatial Plan (MSP) process requires that the economic analysis consider baseline conditions for ocean uses and relationships to coastal communities and develop an analytical tool to evaluate the economic effects of proposed new uses. For the existing uses, economic information is always a “snapshot in time,” reflecting the current situation at the point at which it is examined. But conditions change over time, and the economic analysis should ideally account for the new economic environment, as well as new information that has emerged since the study’s initiation.
The preceding economic analysis was conducted in an accelerated timeframe. For a project of this size and scale, as well as its inherent interactive approach, the short time frame is significant. Much of the information developed required cooperation and interviews with industry representatives and participants, tribes and tribal staff, and interested members of the public. Ideally, in order to obtain useful and workable information, adequate time is needed for researchers and participants to create a dialogue and interact productively. Inevitably, this requires that the researchers identify information needs, participants develop confidence and an understanding of information requests, internal protocols and processes have time to proceed, and followup may be accomplished to ensure that the correct data are transferred properly.
In this chapter, additional high-priority research needs are identified by the economic consultants. These needs reflect data gaps identified by the researchers that could be addressed in the future, should the interest levels be high enough, and sufficient time and funding be available. Needs listed below are organized according to the topic areas of the preceding chapters.
Washington Coastal Marine Advisory Council Additional Research and Study Needs | 12-1

Economic Analysis to Support Marine Spatial Planning in Washington
12.1 IDENTIFIED ADDITIONAL RESEARCH NEEDS
1. Coastal county profiles and commercial shipping:
Evaluate in more depth the two-port impact studies (Grays Harbor and Port Angeles) to determine how they might be used to analyze shipping and port impacts associated with offshore energy and other potential new uses.
Update counties’ and ports’ information about future development plans of counties and communities through key informant interviews.
2. Coastal tribes economic profiles:
Estimate economic contributions to the coastal economy of tribal recreation and tourism enterprises.
Continue to work with the tribes to adequately characterize and estimate the economic contribution of tribal fisheries to the coastal economy.
3. Commercial fishing:
Conduct seafood market analyses:
Describe additional processing in the region.
- Production of fishmeal and fish oil from processing byproducts
- Secondary processing activities (filleting, smoking)
Where do manufactured seafood products go?
- Exported outside the state
- Elsewhere in Washington
Local consumption of Washington coast seafood.
- Restaurants (connection with recreation and tourism sector)
- Elsewhere in Washington
Evaluate ownership by Washington coast residents of other fisheries permits and quotas.
Federal permits and quotas for West Coast and North Pacific fisheries
Permits and quotas for fisheries in other states
Compare economic dependence on income and employment from Washington coast commercial fisheries with that of other regions.
Study safety issues and other concerns resulting from compression of Washington coast commercial fisheries in time and space.
12-2 | Additional Research and Study Needs Washington Coastal Marine Advisory Council

Economic Analysis to Support Marine Spatial Planning in Washington
4. Aquaculture:
Validate number of leased and owned manila clam and Pacific oyster acres in Pacific and Grays Harbor counties.
Update economic impact analysis of shellfish aquaculture production in Pacific and Grays Harbor counties using new survey data collected for 2014.
Conduct a focused, robust annual survey of growers to assure adequate and representative data for use in future economic analyses.
Compare economic dependence on income and employment from Washington coast commercial aquaculture with that of other regions.
Conduct aquaculture market analysis:
Local consumption of Washington coast shellfish.
- In-state restaurants
- Outside of Washington
5. Recreational fishing:
Assess net-willingness-to-pay values for coastal ocean sport fishery resources.
Investigate the extent to which area closures affect the ability of charter boat operations to provide, and private boat fishers to have, a high-quality recreational fishing experience.
Conduct an angler expenditure pattern survey, in order to update information from the most recent study, which was conducted in 1991.
Expand cost-of-service studies of charter boat operators to include local versus non-local businesses, and workforce residence, which would add precision to the estimate of economic multipliers.
6. Recreation and tourism:
Investigate motivations of coastal visitors (what exactly brings them to the coast), possibly through a visitor survey.
Delve more deeply into Point 97 and Surfrider Foundation 2015 report.
Conduct a recreation activity expenditure pattern survey of visitors, to update information from the most recent study, which was conducted in 1991.
Survey out-of-state visitors to Washington coast on expenditure patterns.
Investigate how national and regional trends in recreation participation will affect similar participation on the coast.
Assess net-willingness-to-pay values for coastal recreation resources.
Washington Coastal Marine Advisory Council Additional Research and Study Needs | 12-3
Economic Analysis to Support Marine Spatial Planning in Washington
7. Ecosystem services:
Identify and estimate value of ecosystem services for other locations on the Washington coast.
Quantify values of off-shore ecosystem services, including those provided by shellfish aquaculture.
REFERENCES
None cited.
IMAGES
Chapter 12 Header Image: (cc) Dimi Talen, 2011. Rialto Beach in Olympic National Park (Washington). Retrieved May 6, 2015, from: https://commons.wikimedia.org/wiki/File:Rialto_Beach.jpg
12-4 | Additional Research and Study Needs Washington Coastal Marine Advisory Council

Appendix A
Comparison of Approaches


Comparison of Approaches - 1 - Cascade Economics LLC
Menu of Approaches for Economic Analysis: A Comparison Summary The components that make up an economic analysis will vary by the identified needs of the study, scenarios being investigated, required precision of output, sectors or groups of particular interest or emphasis, locations being examined, data availability and delivery, timeline, and budget available. Because so many elements must be balanced in order to frame an appropriate economic analysis, we developed a summary comparison of three bundled packages, as shown in Table 1. The three packages represent different levels of investment in studies, each yielding a different set of output estimates that vary in precision and reliability.
Summary information about particular components as they relate to each study level is shown across the rows in Table 1. The categories of components are oriented to addressing points raised by the Technical Committee in Exhibit D of the RFP, plus some additional components that our team believes are useful or necessary in this economic analysis.

Table 1 - Economic Impact Studies Comparison Matrix
Item Level I Study Level II Study Level III Study
Strengths Quickest implementation. Data already exists. Advantageous if budget is limited.
Impact estimators specificallydesigned for the study region.
Most data already exists.
Impacts fine-tuned for individualcommunities in the study region.
Most accurate representation ofsectors, contributions and impacts.
Weaknesses “Off-the-shelf” so accuracy maysuffer.
Finer-level activity and geographicdetail may not be available.
May require access to confidentialbusiness data.
Relies on existing data but someinterviews required.
May require access to confidentialbusiness data.
Data needed for fine-tuning must becollected via interviews.
Most time-consumingimplementation.
Economic Profile of the Coast
Research and provide narrativeprofile of economic base. Rely onexisting publications.
Socioeconomic data from US census,REIS, BEA, WA Employment Security.
Incorporate information from SectorAnalyses.
Research and provide profile ofeconomic base, coast-wide and bycounty.
Socioeconomic data from US census,REIS, BEA, WA Employment Security.
Incorporate information from SectorAnalyses.
Research and discuss trendsaffecting coastal economy.
Research and provide profile ofeconomic base, coast-wide and bycounty.
Socioeconomic data from US census,REIS, BEA, WA Employment Security.
Incorporate information from SectorAnalyses.
Research and discuss trendsaffecting coastal economy; researchand forecast near-term economicconditions for major sectors.
- 2 -Comparison of Approaches Cascade Economics LLC

- 3 - Cascade Economics LLC Comparison of Approaches
Item Level I Study Level II Study Level III Study
Economic Profile of Tribal Communities
Research and provide socioeconomicprofile of Quinault, Quileute, Hoh,Shoalwater Bay, and Makah Tribes,based on published sources.
Research and provide socioeconomicprofile of Quinault, Quileute, Hoh,Shoalwater Bay, and Makah Tribes.Use published sources, plus directinterviews with the Tribes.
Discuss economic relationship ofTribes within coastal community.
Research and provide socioeconomicprofile of Quinault, Quileute, Hoh,Shoalwater Bay, and Makah Tribes.Use published sources, plus directinterviews with the Tribes.
Discuss economic relationship ofTribes within coastal community.
Research and discuss trendsaffecting tribal economy; researchand forecast near-term economicconditions for major sectors.
Economic Impact Analysis Measures
Document and use publishedindustry impact multipliers.
Quantitative direct impact estimatesapply coast-wide, with qualitativediscussion relating to localizedimpacts.
Economic models of coastal regionwith minor adjustments to data.
Models and data turned over toDNR.
Economic models of coastal regionplus state with significantadjustments to data.
Conduct business interviews in orderto adjust trade flow data.
Models and data turned over toDNR.
Regulatory and Policy Decision Impacts
Work with Technical Committee,provide qualitative analysis ofimpacts of several “key decisions.”
Work with Technical Committee,provide quantitative estimate ofimpacts of several “key decisions.”
Work with Technical Committee,provide quantitative analysis ofimpacts of several “key decisions.”
Estimate Impacts of Potential Uses
Provide qualitative and, if possible,quantitative estimates of impacts ofup to 5 potential uses identified byTechnical Committee
Provide quantitative estimates ofimpacts of up to 5 potential usesidentified by Technical Committee.
Provide quantitative estimates ofimpacts on the region and state ofup to 5 potential uses identified byTechnical Committee.
Ecosystem Services Discuss general concepts, identifycoastal sites that are providers ofrelatively high level of ecosystemservices.
Discuss general concepts, provideexamples of valuation within thestate, and identify coastal sites thatare providers of relatively high levelof ecosystem services.
Discuss general concepts, provideexamples of valuation within thestate, and identify coastal sites thatare providers of relatively high levelof ecosystem services.
Identify data needs required for asite specific valuation.

- 4 - Cascade Economics LLC Comparison of Approaches
Item Level I Study Level II Study Level III Study
Commercial Fishery Profile of the Coast
Research and develop profile ofmajor or significant fisheries byspecies, ports of landing, andprocessors. Include discussion oftrends by major species.
Research and develop profile ofcommercial fisheries by species,ports of landing, processors, marketforms and markets. Includediscussion of trends, including databy port.
Research and develop profile ofcommercial fisheries by species,ports of landing, processors, marketforms and markets. Includediscussion of trends, including databy port.
Update economic models toincorporate data from sector profilesand industry interviews.
Tribal Fisheries and Ports
Provide profile of tribal fisheries andports based on publishedinformation.
Provide profile of tribal fisheries andports based on publishedinformation and interviews withtribal fisheries managers.
Provide profile of tribal fisheries andports based on publishedinformation and interviews withtribal fisheries managers.
Include details as available related totribal fish markets and hatcheryoperations.
Estimate Impacts of Potential Uses on Fisheries
Include qualitative and, if possible,quantitative impacts on commercialfisheries of proposed uses identifiedabove
Include quantitative impacts bylocation on commercial fisheries ofproposed uses identified above
Include quantitative impacts bylocation on commercial fisheries ofpotential alternative uses identifiedabove
Profile of Commercial Aquaculture
Develop profile of aquacultureproduction, processing, and markets.Incorporate sector analysis.
Develop profile of aquacultureproduction, processing, and markets,including future trends. Incorporatesector analysis.
Develop profile of aquacultureproduction, processing, and markets,including future trends. Incorporatesector analysis.
Update economic models toincorporate data from sector profilesand industry interviews.
Estimate Impacts of Potential Uses on Aquaculture
Include qualitative and, if possible,quantitative impacts on aquacultureof proposed uses identified above
Include quantitative impacts bylocation on aquaculture of proposeduses identified above
Include quantitative impacts bylocation on aquaculture of potentialalternative uses identified above

- 5 -Comparison of Approaches Cascade Economics LLC
Item Level I Study Level II Study Level III Study
Recreational Fishing Research and develop profile ofrecreational fishing on the coast,including activities and participationrates and trends, based on publishedinformation.
Research and develop profile ofrecreational fishing on the coast,including activities and participationrates and trends, based on publishedinformation.
Incorporate WDFW data onrecreational fishing participation.
Research and incorporate publishedspending profiles by activity in orderto estimate baseline and impacts
Research and develop profile ofrecreational fishing on the coast,including activities and participationrates and trends, based on publishedinformation.
Incorporate WDFW data onrecreational fishing participation.
Research and incorporate publishedspending profiles by activity toestimate economic contribution andimpacts
Other Recreation Sector
Research and develop profile ofrecreation on the coast, includingactivities and participation rates andtrends, based on publishedinformation.
Research and develop profile ofrecreation on the coast, includingactivities and participation rates andtrends, based on publishedinformation.
Incorporate Surfrider study ofrecreation participation.
Research and incorporate publishedspending profiles by activity in orderto estimate baseline and impacts
Research and develop profile ofrecreation on the coast, includingactivities and participation rates andtrends, based on publishedinformation.
Incorporate Surfrider study ofrecreation participation.
Research and incorporate publishedspending profiles by activity toestimate economic contribution andimpacts
Tourism Industry Research and develop profile oftourism on the coast, based onpublished information andincorporating information fromsector analysis.
Research and develop profile oftourism on the coast, based onpublished information andincorporating information fromsector analysis.
Research future trends,incorporating broader regional ornational research on participation.
Research and develop profile ofrecreation on the coast, includingactivities and participation rates andtrends, based on publishedinformation.
Research future trends,incorporating broader regional ornational research on participation

Comparison of Approaches - 6 - Cascade Economics LLC
Item Level I Study Level II Study Level III Study
Social Impact Analysis Provide social impact informationbased on recent community profilesby NOAA and PFMC in EISs
Provide social impact informationbased on NOAA research, addressingeffects by port or community ifpossible.
Provide a NOAA guidelines-based“social impact analysis,” as practical,by port and community of eachproposed use.
Identify data requirements for a fullycompliant analysis.

Appendix B
Coastal Oyster and Clam Processing and Distribution Survey


Continue to page 2
2014
Washington Coast Marine Spatial Planning Project
Shellfish Aquaculture Processing and
Distribution Survey

Page 2 of 10
Coastal Shellfish Processing and Distribution Survey
Content
This survey is designed to ask pertinent questions needed to characterize the role of shellfish (oyster and clams) processing and distribution in the Washington Coast economy. For purposes of this survey, the Washington Coast economy includes communities in Pacific, Wahkiakum, Grays Harbor, Jefferson and Clallam counties. Data from this survey will be used to estimate economic impacts generated by the Washington Coast shellfish aquaculture industry.
Confidentiality
Per applicable Federal and State of Washington laws and administrative rules, strict
confidentiality of data gathered by this survey will be maintained at all times. Survey
participants’ responses will be treated as confidential, private information at all times.
Your name, business name, and contact information will be used only for the purposes
of administering this survey. Individual surveys will be viewed by only a limited number
of project researchers. Once data have been entered into electronic formats, only
selected researchers will have password-protected access to the electronic data for the
explicit purpose of analyzing economic contributions of Washington Coast shellfish
aquaculture production, processing, and distribution. State of Washington government
agencies and members of the general public will see only aggregated, summary results
of the analysis reported by the project researchers.

Page 3 of 10
Contact Information
Facility Name:
Parent Company:
Facility Address:
Contact Person:
Phone:
Email:
Interview Date:

Page 4 of 10
A. Location of Licensed Shellfish Aquaculture Processor
1. Did your business have multiple shellfish processing facilities in 2014? (If yes please complete Sections B, C, and D for each facility)
Yes No
2. In what regions were your shellfish processing facilities located?
Region Number of facilities Coastal Counties Elsewhere in Washington State Outside Washington State
3. What types of products do you produce? (Indicate percent of total sales for all that apply) Product Approx. percent of total sales Whole oysters __ __% Shucked oyster meat __ __% Whole clams __ __% Shucked clam meat __ __% Other (specify): __ __% Other (specify): __ __% Total 100%
B. Number of and Sales of Cultured Shellfish Sold (by product type and unit of measurement you use) NOTE: If you have more than one product type please list output and value for each type.
1. What was the approximate total output (estimate across all sizes) of Washington grown oysters you processed and sold during 2014? __ __oysters
2. What was the approximate total sales value (estimated across all sizes of Washington grown oysters you processed and sold during 2014? $__ __
3. What was the approximate total output (estimate across all sizes) of Washington grown clams you processed and sold during 2014 __ __clams
4. What was the approximate total sales value (estimated across all sizes of Washington grown clams you processed and sold during 2014? $__ __

Page 5 of 10
C. Origin of Shellfish (Oyster and Clam) Supply
Consider the following sources of oyster and clams to your processing facility: (1) Your Lease or Owned Acres, (2) Other Growers, (3) Wholesalers, (4) Other sources.
4. Of the total quantity (in whatever unit of measurement you use) and value of shellfish you processed and sold in 2014, estimate the quantity and value obtained from the following sources: Source Approx. Quantity Approx. Sales Value Your Lease or Owned Acres $__ __ Other Growers $__ __ Wholesalers $__ __ Other Sources $__ __
(Note: The total should add up to the answers for questions B.1 through B.4.)
5. Of those shellfish obtained from Your Lease or Owned Acres estimate what percent were grown on leases in each region. Region Approximate Percent Coastal Counties __ __% Elsewhere in Washington State __ __% Outside Washington State __ __% Total 100%
6. Of those shellfish obtained from Other Growers estimate what percent were obtained from
growers in each region. Region Approximate Percent Coastal Counties __ __% Elsewhere in Washington State __ __% Outside Washington State __ __% Total 100%
7. Of those shellfish obtained from Wholesalers estimate what percent were obtained from
wholesalers in each region? Region Approximate Percent Coastal Counties __ __% Elsewhere in Washington State __ __% Outside Washington State __ __% Total 100%
8. Of those shellfish obtained from Other Sources estimate what percent were obtained from
wholesalers in each region? Region Approximate Percent Coastal Counties __ __% Elsewhere in Washington State __ __% Outside Washington State __ __% Total 100%

Page 6 of 10
D. Destination of Cultured Shellfish Sales
The following questions ask for information on destination of your shellfish product sales. Please provide estimated percentages of total sales that went to different types of buyers in the following general locations: Washington Coast Elsewhere in Washington Oregon Elsewhere in the U.S. Outside the U.S.
1. Of total shellfish you processed and sold in 2014, estimate the approximate percent of total
sales that were sold to buyers in the following locations: Location Approximate Percentage Washington Coast __ __% Elsewhere in Washington __ __% Oregon __ __% Elsewhere in the U.S. __ __% Outside the U.S. __ __% Total 100%
2. Of the sales on the Washington Coast, who did you sell them to?
Purchaser Approximate Percentage Other wholesalers __ __% Restaurants/food service __ __% Retail Seafood Shops __ __% Direct to Consumers __ __% Total 100%
3. Of the sales Elsewhere in Washington, who did you sell them to?
Purchaser Approximate Percentage Other wholesalers __ __% Restaurants/food service __ __% Retail Seafood Shops __ __% Direct to Consumers __ __% Total 100%
4. Of the sales in Oregon, who did you sell them to?
Purchaser Approximate Percentage Other wholesalers __ __% Restaurants/food service __ __% Retail Seafood Shops __ __% Direct to Consumers __ __% Total 100%

Page 7 of 10
5. Of the sales Elsewhere in the U.S., who did you sell them to?
Purchaser Approximate Percentage Other wholesalers __ __% Restaurants/food service __ __% Retail Seafood Shops __ __% Direct to Consumers __ __% Total 100%
6. Of the sales Outside the U.S., who did you sell them to?
Purchaser Approximate Percentage Other wholesalers __ __% Restaurants/food service __ __% Retail Seafood Shops __ __% Direct to Consumers __ __% Total 100%

Page 8 of 10
E. Expenditures Related to Cultured Shellfish Processing, Sales and Distribution
Please enter your total expenses related to your processing and distribution of product. Following that, please enter the dollar amount of expenditures in each of the following expense categories. Also please record the approximate percentages of expenditures for each cost category spent in Washington Coast Communities, Elsewhere in Washington, Oregon, Elsewhere in the U.S. and Outside the U.S. (NOTE: This table continues to the next page)
1. Oysters: Expenses for the 2014 Calendar Year
Total
Expenditures
Percentage of Expenditures by Location WA Coast
Communities Elsewhere
in WA Oregon Elsewhere in the U.S.
Outside the U.S.
Total Expenses Likely more than the sum of categories listed below
$ % % % % %
Labor Expenses Total Payroll (wages) Owners and employees(not including profits)
$ % % % % %
Total Non-Wage Benefits Include medical, bonuses, etc.
$ % % % % %
Payments to Govt. Federal Include payroll taxes, income taxes, etc.
$ % % % % %
State & Local Include permit and license fees, property taxes, etc.
$ % % % % %
Other Expense Categories
Capital Expenditures Include vessels, buildings & heavy machinery > $10K
$ % % % % %
Packaging $ % % % % % Insurance Total payments to insurance companies
$ % % % % %
Freight Expenses paid to freight companies (ground, air & water)
$ % % % % %
Gas/Fuel Expenses paid to fueling stations or fuel deliveries
$ % % % % %
Utilities (water, sewer, gas…)
$ % % % % %

Page 9 of 10
Shellfish Purchases $ % % % % % Interest Payments $ % % % % % Other costs $ % % % % %
2. Clams: Expenses for the 2014 Calendar Year
Total
Expenditures
Percentage of Expenditures by Location WA Coast
Communities Elsewhere
in WA Oregon Elsewhere in the U.S.
Outside the U.S.
Total Expenses Likely more than the sum of categories listed below
$ % % % % %
Labor Expenses Total Payroll (wages) Owners and employee, not including profit)
$ % % % % %
Total Non-Wage Benefits Include medical, bonuses, etc.
$ % % % % %
Payments to Govt. Federal Include payroll taxes, income taxes, etc.
$ % % % % %
State & Local Include permit and license fees, property taxes, etc.
$ % % % % %
Other Expense Categories
Capital Expenditures Include vessels, buildings & heavy machinery > $10K
$ % % % % %
Packaging $ % % % % % Insurance Total payments to insurance companies
$ % % % % %
Freight Expenses paid to freight companies (ground, water & air)
$ % % % % %
Gas/Fuel Expenses paid to fueling stations or fuel deliveries
$ % % % % %
Utilities (water, sewer, gas….)
$ % % % % %
Shellfish Purchases $ % % % % % Interest Payments $ % % % % % Other costs $ % % % % %
Page 10 of 10
THANK YOU!!
For questions please contact Katharine (Trina) Wellman
[email protected] or (206) 618 4814
Northern Economics
1455 NW Leary Way, Suite 400
Seattle, WA 98107

Appendix C
Social Assessment


As you may know, the State of Washington is engaged in a Marine Spatial Planning Project. The purpose ofthis survey is to get a qualitative sense of the social impacts that could occur in Washington coastalcommunities as a result of potential new uses of the coastal zone identified by the state-led Marine SpatialPlanning process. These new uses include (1) marine product extraction; (2) offshore aquaculture; (3)dredge disposal in new locations; (4) mining gas hydrates; (5) mining marine sand and gravel; and (9)marine renewable energy - offshore, wave and tidal. Because we do not have definitive project geographic placement, timelines, scale and etc. this assessment ismeant to be general and preliminary in nature. The geographic scope includes Washington State coastalcounties: Clallam, Grays Harbor, Jefferson, Pacific and Wahkiakum.
When answering the survey questions, please try to answer for your own geographic location. If notapplicable to your area, please use Not Applicable. If your perspective is not geographic in nature pleaseanswer more broadly.
The list of characteristics of social or human well-being are derived from several sources including NOAANWFSC, University of Washington Sea Grant and the Puget Sound Partnership/Puget Sound Institute as wellas from the work being conducted by Cascade Economics LLC on behalf of WCMAC. The indicators listedbelow cover multiple dimensions of human well being and represent both quantitative and qualitativemeasures. The indicators include:
Nature-based recreation: Average number of hours per week coastal residents spend outdoor recreating
Safe locally harvestable foods: Availability of locally harvested food species
Shellfish bed closures: Number of recreational shellfish bed closures per year
Natural resource industry output: Gross domestic product for natural resource industries on the Washingtoncoast (timber, commercial fishing, shellfish aquaculture, recreational fish and shellfish harvest, tourism)
Participation in cultural practices: percent of residents who feel they are able to maintain cultural practicesassociated with the natural environment
Opportunity to influence decisions: Percent of residents who feel they have the opportunity to influencenatural resource management if they want to
Trust in government: Percent of residents who trust local and regional government to make the rightdecisions related to protecting the Washington coast
Sense of Place: Positive connections: Percent of residents who express a positive connection to the region
Washington Marine Spatial Planning Social Impacts Survey
Cascade Economics LLC, on behalf of the WCMAC, welcomes you to this survey.
1

Sense of stewardship: Percent of residents who feel a strong sense of stewardship for the coast Pride of place: Percent of residents who feel a sense of pride about being from coastal counties
Inspiration: Average number of residents who experience inspiration from being in nature
Safety from navigational hazards: Number of vessel incidents along shores of coastal counties
Access to coastal environment: Number of public access points (parks, boat ramps, marinas, beaches) to themarine environment
Economic development goals: Reduces barriers to economic opportunity for residents.
Marine water quality: Water quality that allows for traditional and historical uses of the marine environment
Beach closures: Number of incidents per year of public beach closure to recreational activities
2
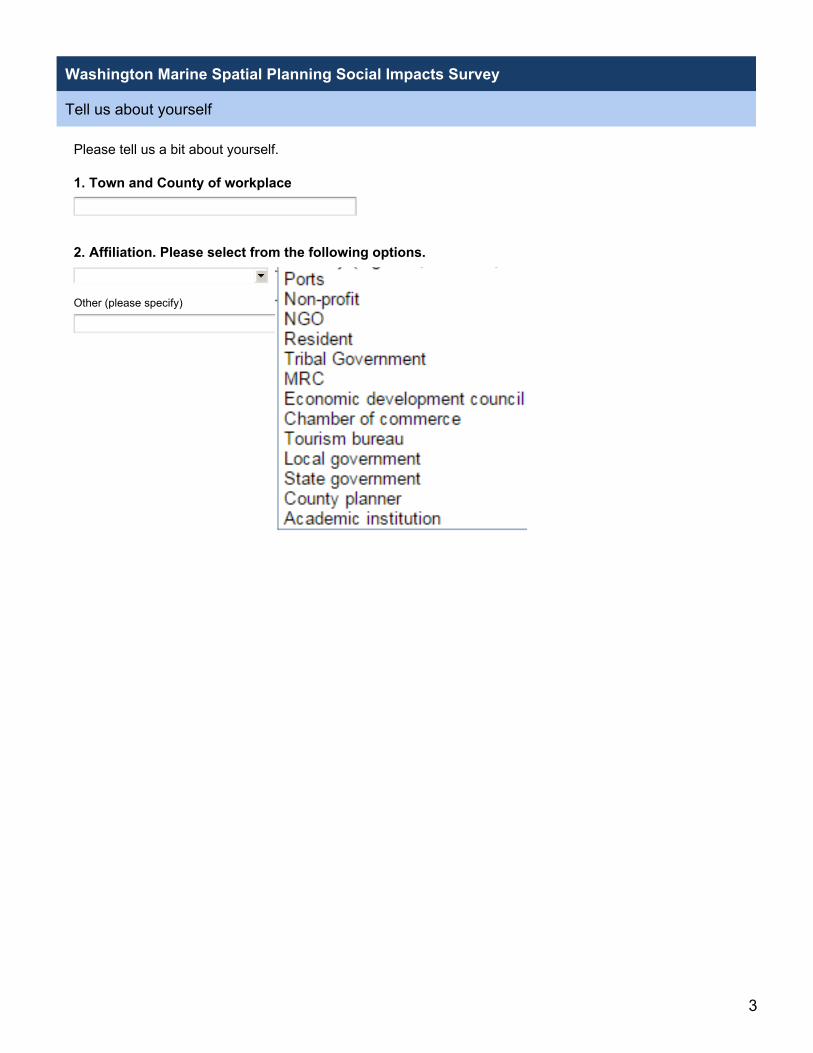
Please tell us a bit about yourself.
Washington Marine Spatial Planning Social Impacts Survey
Tell us about yourself
1. Town and County of workplace
2. Affiliation. Please select from the following options.
Other (please specify)
3

Marine product extraction (also sometimes called bioextraction) is the practice of harvesting marine plantsand animals to develop non-food related goods. Examples include anti-viral, anti-cancer, and anti-tumoragents used in medical treatments, anti-inflammatories in cosmetics, chemicals used in biomedical and cellbiology research, and fatty amino acids in nutritional supplements. New genome sequences have also beendiscovered within marine organisms.
Researchers, universities, government agencies, and private companies use marine bioprospecting tosearch for novel chemicals for human health products. SCUBA diving, manned submersible vehicles, andremotely operated vehicles are current methods for marine bioprospecting.
Several phases occur between initial discovery and commercial sales of a developed product. Initial chemicaldiscovery and genome sequencing often require small amounts of the target organism. Testing, clinical trials,and commercial sales will require greater amounts of availability.
Based on the literature, it does not seem likely that the Washington coast is a primary target for marinebioprospecting and marine product extraction. However, the Plan’s study area has some high biodiversity andextreme environments including seamounts, deep sea corals, and hydrothermal vents. Organisms withinthese habitats are predicted have the greatest potential to contain undiscovered genome sequences andchemicals. Therefore, as technology continues to expand the depths of the ocean to be explored, it ispossible that novel chemicals and DNA sequences could be discovered within Plan waters.
Washington Marine Spatial Planning Social Impacts Survey
Marine Product Extraction
4

3. Do you think that Marine Product Extraction will have a Positive Impact, Negative Impact, or NoEffect on the following indicators:
Positive Impact Negative Impact No Effect Not Applicable
Nature-based recreation
Safe locally harvestablefoods
Shellfish bed closures
Natural resourceindustry output
Participation in culturalpractices
Opportunity to influencedecisions
Trust in government
Sense of Place: positiveconnections
Sense of Place: sense ofstewardship
Sense of Place: pride ofplace
Inspiration
Safety from navigationalhazards
Access to coastalenvironment
Economic developmentgoals
Marine water quality
Beach closures
4. Please share any additional thoughts you have on the effects of Marine Product Extraction in thespace below
5

Aquaculture, the culture or growing of fish, shellfish, or other aquatic plants and animals, is an active industryin Washington. All of Washington’s marine aquaculture currently occurs close to shore, within bays, estuaries,and Puget Sound. There is no offshore aquaculture currently in the state.
There is no standard definition for offshore aquaculture. Offshore aquaculture typically occurs in deep waterand is generally exposed to one or several of the following: strong waves, storms, swells, and currents. Giventhe physical exposure of Washington’s Pacific coast, offshore aquaculture is currently defined within theMarine Spatial Plan as any new aquaculture operation outside of the coastal estuaries.
Washington Marine Spatial Planning Social Impacts Survey
Offshore Aquaculture
5. Do you think that Offshore Aquaculture will have a Positive Impact, Negative Impact, or No Effecton the following indicators:
Positive Impact Negative Impact No Effect Not Applicable
Nature-based recreation
Safe locally harvestablefoods
Shellfish bed closures
Natural resourceindustry output
Participation in culturalpractices
Opportunity to influencedecisions
Trust in government
Sense of Place: positiveconnections
Sense of Place: sense ofstewardship
Sense of Place: pride ofplace
Inspiration
Safety from navigationalhazards
Access to coastalenvironment
Economic developmentgoals
Marine water quality
Beach closures
6

6. Please share any additional thoughts you have on the effects of Offshore Aquaculture in the spacebelow
7

Navigation channels in Grays Harbor, the Mouth of the Columbia River, and other locations within the Planarea require frequent dredging to maintain vessel access to critical port infrastructure and services. In somelocations, millions of cubic yards are dredged annually to keep navigation channels safe and accessible.
The majority of the dredged material is disposed of in-water at specific disposal sites. Current disposal typesinclude:
Nearshore and on-shore beneficial use sites keep sediment within the nearshore system, which canminimize erosion. These sites have boundaries, and sediment can accumulate on the seafloor. These sitesare designed for the sediment to disperse over time.
Flow lane sites are generally used for relatively small volumes of material. The material is placed in scourchannels, and does not accumulate on the seafloor.
Deep water sites are located offshore in federal waters. Sediment disposed at deep water sites is effectivelyremoved from the nearshore system.
Currently dredge disposal area in the MSP part of the coast include: --Grays Harbor: 5 active disposal locations (nearshore and onshore use) --Mouth of the Columbia River (MCR): 4 active disposal locations (nearshore use and deepwater) --Willipa Bay: Flow lanes --La Push: 2 beneficial use sites
Future Trends and Factors in Washington --The Mouth of the Columbia River Regional Sediment Management Plan identified two potential newlocations for dredge disposal. An onshore site at Benson Beach has been a demonstration project, but thereare concerns about the safety and cost effectiveness of this site. A proposed North Head nearshore site iscurrently under consideration.
--Two sites at Grays Harbor may undergo small shifts in locations. The South Jetty site may be shiftedslightly northward to accommodate the shifting scour channel. The Point Chehalis open water site mayundergo a one-time northwestern shift in order to accommodate the additional material from the Grays Harborchannel deepening.
--Additional flow lanes in Willapa Bay may be established in the future for small port dredging.
Washington Marine Spatial Planning Social Impacts Survey
Dredge Disposal
8

7. Do you think that Dredge Disposal will have a Positive Impact, Negative Impact, or No Effect on thefollowing indicators:
Positive Impact Negative Impact No Effect Not Applicable
Nature-based recreation
Safe locally harvestablefoods
Shellfish bed closures
Natural resourceindustry output
Participation in culturalpractices
Opportunity to influencedecisions
Trust in government
Sense of Place: positiveconnections
Sense of Place: sense ofstewardship
Sense of Place: pride ofplace
Inspiration
Safety from navigationalhazards
Access to coastalenvironment
Economic developmentgoals
Marine water quality
Beach closures
8. Please share any additional thoughts you have on the effects of Dredge Disposal in the spacebelow
9

Gas hydrates are a mixture of gas and water which, under low temperature and high pressures, forms a solidice-like structure in marine sediments. Methane is the main type of gas in hydrates. When methane hydratesare exposed to warmer temperatures or lower pressures, the hydrates “dissociate” and release methane gas.Preliminary research suggests traditional oil and gas equipment and infrastructure can be successfullyadapted to mine gas hydrates. Globally, no commercial methane mining activities currently exist, and noprojects are currently proposed for offshore Washington.
Washington Marine Spatial Planning Social Impacts Survey
Gas Hydrates
9. Do you think that Gas Hydrates will have a Positive Impact, Negative Impact, or No Effect on thefollowing indicators:
Positive Impact Negative Impact No Effect Not Applicable
Nature-based recreation
Safe locally harvestablefoods
Shellfish bed closures
Natural resourceindustry output
Participation in culturalpractices
Opportunity to influencedecisions
Trust in government
Sense of Place: positiveconnections
Sense of Place: sense ofstewardship
Sense of Place: pride ofplace
Inspiration
Safety from navigationalhazards
Access to coastalenvironment
Economic developmentgoals
Marine water quality
Beach closures
10

10. Please share any additional thoughts you have on the effects of Gas Hydrates in the space below
11

Sand and gravel mining is the dredging of sand or gravel from the seafloor for use in beach nourishment,coastal hazard defense, and other uses such as upland construction. Suction dredges are used to extract thematerial, which is stored and transported by ship, barge, or pipeline to a beach or re-handling area.
Washington Marine Spatial Planning Social Impacts Survey
Marine Sand and Gravel Mining
11. Do you think that Marine Sand and Gravel Mining will have a Positive Impact, Negative Impact, orNo Effect on the following indicators:
Positive Impact Negative Impact No Effect Not Applicable
Nature-based recreation
Safe locally harvestablefoods
Shellfish bed closures
Natural resourceindustry output
Participation in culturalpractices
Opportunity to influencedecisions
Trust in government
Sense of Place: positiveconnections
Sense of Place: sense ofstewardship
Sense of Place: pride ofplace
Inspiration
Safety from navigationalhazards
Access to coastalenvironment
Economic developmentgoals
Marine water quality
Beach closures
12

12. Please share any additional thoughts you have on the effects of Marine Sand and Gravel Mining inthe space below
13

Marine renewable energy includes any technology that converts potential energy from wind, waves or tidesinto electricity. Currently, researchers are developing different technologies and testing devices in researchlabs and waters throughout the United States to provide clean energy alternatives for the nation. No devicesare currently permitted for the marine waters along Washington’s coast.
Offshore Wind Energy uses technology adapted from land-based wind turbines and applies the technologyto floating or anchored support structures that vary according to water depth. Turbines used in offshoreinstallations can be up to 500 feet tall to gain access to reliable wind resources. Offshore Wind Energy isclassified by base structures including fixed bases for shallow and floating bases for deep waters.
Washington Marine Spatial Planning Social Impacts Survey
Marine Renewable Energy: Offshore Wind Energy
14
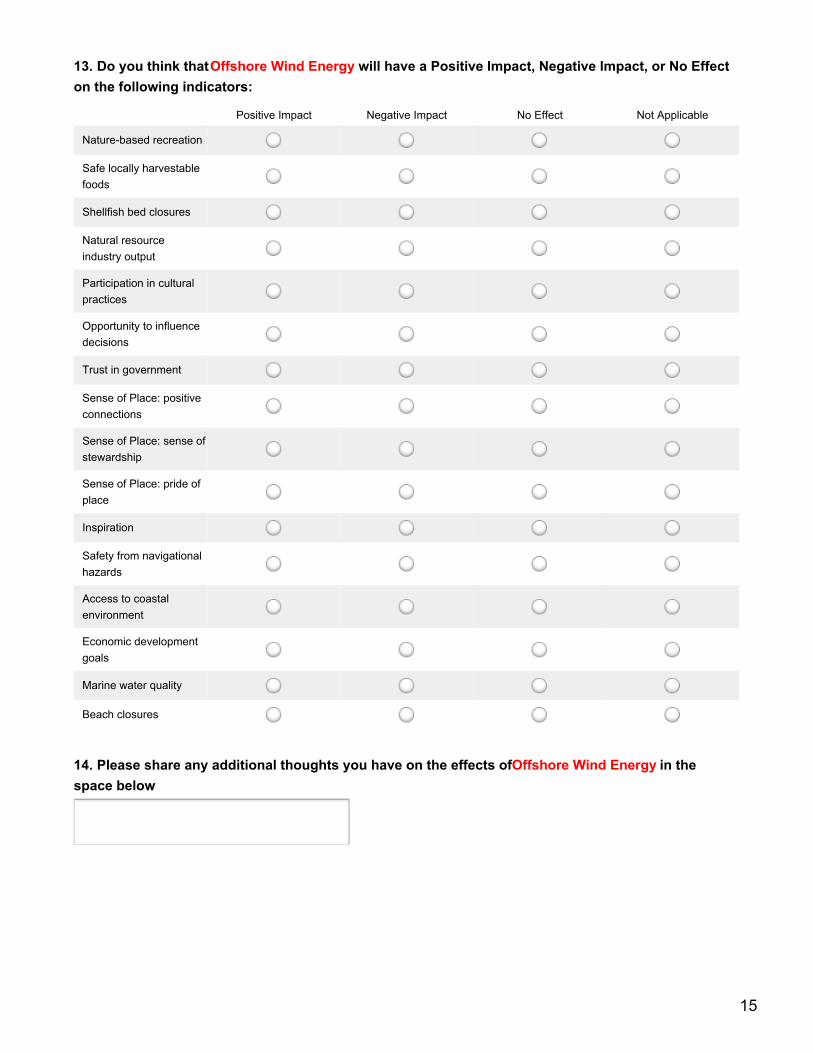
13. Do you think that Offshore Wind Energy will have a Positive Impact, Negative Impact, or No Effecton the following indicators:
Positive Impact Negative Impact No Effect Not Applicable
Nature-based recreation
Safe locally harvestablefoods
Shellfish bed closures
Natural resourceindustry output
Participation in culturalpractices
Opportunity to influencedecisions
Trust in government
Sense of Place: positiveconnections
Sense of Place: sense ofstewardship
Sense of Place: pride ofplace
Inspiration
Safety from navigationalhazards
Access to coastalenvironment
Economic developmentgoals
Marine water quality
Beach closures
14. Please share any additional thoughts you have on the effects of Offshore Wind Energy in thespace below
15
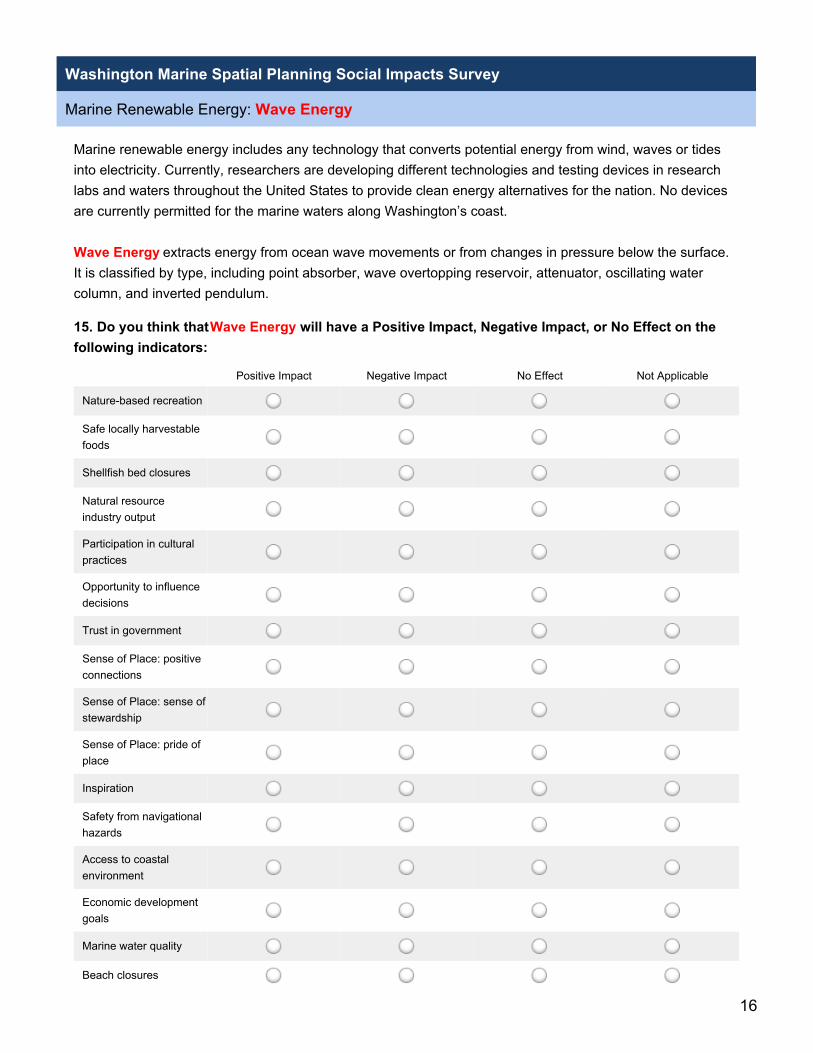
Marine renewable energy includes any technology that converts potential energy from wind, waves or tidesinto electricity. Currently, researchers are developing different technologies and testing devices in researchlabs and waters throughout the United States to provide clean energy alternatives for the nation. No devicesare currently permitted for the marine waters along Washington’s coast.
Wave Energy extracts energy from ocean wave movements or from changes in pressure below the surface.It is classified by type, including point absorber, wave overtopping reservoir, attenuator, oscillating watercolumn, and inverted pendulum.
Washington Marine Spatial Planning Social Impacts Survey
Marine Renewable Energy: Wave Energy
15. Do you think that Wave Energy will have a Positive Impact, Negative Impact, or No Effect on thefollowing indicators:
Positive Impact Negative Impact No Effect Not Applicable
Nature-based recreation
Safe locally harvestablefoods
Shellfish bed closures
Natural resourceindustry output
Participation in culturalpractices
Opportunity to influencedecisions
Trust in government
Sense of Place: positiveconnections
Sense of Place: sense ofstewardship
Sense of Place: pride ofplace
Inspiration
Safety from navigationalhazards
Access to coastalenvironment
Economic developmentgoals
Marine water quality
Beach closures
16

16. Please share any additional thoughts you have on the effects of Wave Energy in the space below
17

Marine renewable energy includes any technology that converts potential energy from wind, waves or tidesinto electricity. Currently, researchers are developing different technologies and testing devices in researchlabs and waters throughout the United States to provide clean energy alternatives for the nation. No devicesare currently permitted for the marine waters along Washington’s coast.
Tidal Energy extracts energy from a steady water flow typically through an existing narrow channel. It isclassified by type, including horizontal and vertical axis turbines, oscillating hydrofoil, and venturi effectturbine.
Washington Marine Spatial Planning Social Impacts Survey
Marine Renewable Energy: Tidal Energy
17. Do you think that Tidal Energy will have a Positive Impact, Negative Impact, or No Effect on thefollowing indicators:
Positive Impact Negative Impact No Effect Not Applicable
Nature-based recreation
Safe locally harvestablefoods
Shellfish bed closures
Natural resourceindustry output
Participation in culturalpractices
Opportunity to influencedecisions
Trust in government
Sense of Place: positiveconnections
Sense of Place: sense ofstewardship
Sense of Place: pride ofplace
Inspiration
Safety from navigationalhazards
Access to coastalenvironment
Economic developmentgoals
Marine water quality
Beach closures
18

18. Please share any additional thoughts you have on the effects of Tidal Energy in the space below
19

Washington Marine Spatial Planning Social Impacts Survey
Qualitative Impact Assessment
19. Finally, we are interested in your overall assessment of the impacts of all potential new uses. Foreach, please provide a Qualitative Impact Assessment (High, Medium, or Low Impact, or No Effect)
High Impact Medium Impact Low Impact No Effect
Marine ProductExtraction
Offshore Aquaculture
Dredge Disposal
Gas Hydrates
Marine Sand and GravelMining
Marine RenewableEnergy: Wind
Marine RenewableEnergy: Wave
Marine RenewableEnergy: Tidal
20
Thank you for your time. We value any further insights or thoughts you might have regarding the socialimpacts of potential new uses of the coastal Washington marine environment.
Washington Marine Spatial Planning Social Impacts Survey
Thank you! Additional Thoughts?
20. Please use the space provided below to share any additional comments.
21
