economic analysis of biogas upgrading and utilization … economic assessment performance of any...
TRANSCRIPT

Abstract— Economic and sensitivity analysis of a simulated
biogas upgrading plant using a gas permeation software has been presented in this study. The effect of three process conditions on gas processing cost (GPC) were simulated. An increase in CO2 increased the GPC from $0.73 to $1.39/m3 of biomethane while an increase in feed pressure increased GPC from $0.65 to $1.16/m3 of biomethane. As the feed flow rate increased from 80-140 m3/h, the product flow rate increased from 46-100 m3/h while the GPC decreases from $0.79 to $0.39/m3 of biomethane. At optimized condition, the calculated GPC was $0.46/m3 of biomethane. The NPV, IRR and BCR for producing biomethane was R15,240,343, 22.41% and 2.05 respectively with a break-even in the 5th year. Using CBG over gasoline, the end user saves 34% of annual fuel cost which is approximately R47,255 with a payback period of one year and three months for vehicle retrofitting. The fuel prices differential between gasoline and CBG as well as the overall savings, makes CBG attractive to the producer and end user.
Index Terms— Biomethane, Economics, Gas processing cost, Sensitivity analysis
I. INTRODUCTION
LOBALLY, most energy is provided by burning fossil fuel [1]. The general trend of volatility in crude oil prices, decline in fossil fuel reserve, and concerns on the climate change has strengthened
interest in the development of alternative energy sources to fossil fuel [2, 3]. To reduce greenhouse gas (GHG) emissions and secure a sustainable supply of energy globally, the utilisation of the earth’s non-renewable resources must be reduced, while more sustainable and efficient alternative energy sources are developed [4]. From an array of environmentally friendly energy alternatives, synthetic gas, natural gas, hydrogen and biofuels have been identified as the most promising substitutes for vehicular fuel in the nearest future [5]. Biogas, a sub-derivatives of biofuel, comprises mainly methane (CH4), CO2, smaller traces of acidic gases and impurities such as hydrogen sulphide (H2S), nitrogen (N2), water vapour and volatile
Manuscript received June 09, 2015; revised August 11, 2015. This work is fully funded by South African National Energy Development Institute (SANEDI).
S. O. Masebinu is with the department of Chemical Engineering, University of Johannesburg, Doornfontein, South Africa ([email protected])
A. O. Aboyade is an Energy and Sustainability specialist at Faculty of Engineering and the Built Environment, University of Johannesburg, Bunting Campus, South Africa ([email protected]).
Edison Muzenda is a Professor of Chemical and Petroleum Engineering and Head of Department: Department of Chemical, Materials and Metallurgical Engineering, College of Engineering and Technology, Botswana International University of Science and Technology, Private Mail Bag 16, Palapye, Botswana, and as well as Visiting Professor at the University of Johannesburg, department of Chemical Engineering, Faculty of Engineering and the Built Environment, Johannesburg, P O Box 17011, 2028, South Africa Email: [email protected]
organic gases (VOCs) [6]. For biogas to be suitable as vehicular fuel, it must be upgraded by removal of CO2 and other trace impurities. After upgrading, biogas is generally referred to as biomethane which can be used for all applications designed for natural gas since both gases will have an approximate amount of CH4 concentration [7]. Engines of conventional gasoline vehicles must be modified to use biomethane as fuel. New bi-fuel vehicles, biomethane and gasoline, are also been produced by original equipment manufacturer (OEM).
The interest in biomethane stem out of the fact that locally produced fuel alleviate, to a large extent, the reliance on imported fuel, ensure stability in fuel supply and prices, enhance national security and develop the economy. Biomethane fuelled vehicle emits approximately 20-25% less CO2 as compared to gasoline fuelled vehicle. This is due to the fact that the carbon to hydrogen ratio of CH4 is approximately 52% lower than the ratio in gasoline [8, 9]. Though energy density which is an important factor for automotive fuel is much higher in liquid fuel than for gases, however, this disadvantage can be partially offset by compression of biomethane [8]. The compression of biomethane into cylinders adds approximately 200 kg to the vehicle weight, despite the added weight, a savings of up to 19% has been reported when used as fuel [9]. The ability to utilise a wide range of organic feedstock as well as its greater environmental benefits when compared to other biofuels makes its deployment important for consideration. However, the requirements to upgrade biogas to fuel grade biomethane, compression of the gas for storage and transportation, the lack of adequate fuel distribution network, refuelling station and the need to convert existing vehicle fleet to use biomethane [10, 11] were considered to be a significant barrier to the deployment of biomethane as vehicular fuel in South Africa. The potential benefit and challenges of production and utilization of biofuels are as summarised in Table 1 [5, 12]. To implement an economically viable biomethane project, some key factors must be considered. They are market for the product; availability of organic waste & collection strategy; location of upgrading plant; upgrading technology; transportation of product/distribution network; financial model & financing; permit; and regulatory framework. Of the aforementioned factors, transportation of product/distribution network, financial model, permit and regulatory framework are the major barrier in the deployment of biomethane as vehicular fuel in South Africa. Most biogas facilities are mainly for electricity generation in South Africa. However, the use of biogas as a substitute for transport fuel has been reported to have higher economic advantages over its use in power or heating applications [13]. Despite the challenges been faced in the deployment of biomethane, the South African government is keen to exploit the possibility of biomethane as vehicular fuel to reduce her carbon footprint and provide an alternative fuel source for its transportation sector.
Economic Analysis of Biogas Upgrading and Utilization as Vehicular Fuel in South Africa
S. O. Masebinu, A. O. Aboyade, Member, IAENG, and E. Muzenda, Member, IAENG
G
Proceedings of the World Congress on Engineering and Computer Science 2015 Vol II WCECS 2015, October 21-23, 2015, San Francisco, USA
ISBN: 978-988-14047-2-5 ISSN: 2078-0958 (Print); ISSN: 2078-0966 (Online)
WCECS 2015
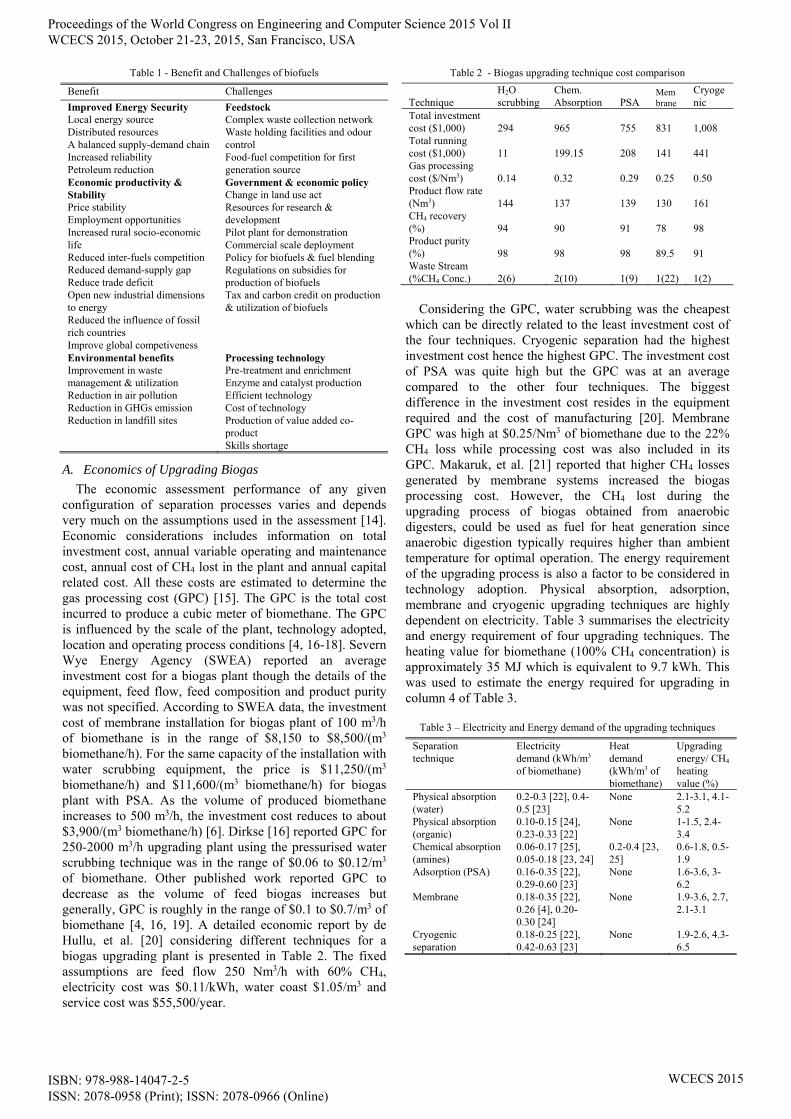
Table 1 - Benefit and Challenges of biofuels
Benefit Challenges
Improved Energy Security Local energy source Distributed resources A balanced supply-demand chain Increased reliability Petroleum reduction
Feedstock Complex waste collection network Waste holding facilities and odour control Food-fuel competition for first generation source
Economic productivity & Stability Price stability Employment opportunities Increased rural socio-economic life Reduced inter-fuels competition Reduced demand-supply gap Reduce trade deficit Open new industrial dimensions to energy Reduced the influence of fossil rich countries Improve global competiveness
Government & economic policy Change in land use act Resources for research & development Pilot plant for demonstration Commercial scale deployment Policy for biofuels & fuel blending Regulations on subsidies for production of biofuels Tax and carbon credit on production & utilization of biofuels
Environmental benefits Improvement in waste management & utilization Reduction in air pollution Reduction in GHGs emission Reduction in landfill sites
Processing technology Pre-treatment and enrichment Enzyme and catalyst production Efficient technology Cost of technology Production of value added co-product Skills shortage
A. Economics of Upgrading Biogas
The economic assessment performance of any given configuration of separation processes varies and depends very much on the assumptions used in the assessment [14]. Economic considerations includes information on total investment cost, annual variable operating and maintenance cost, annual cost of CH4 lost in the plant and annual capital related cost. All these costs are estimated to determine the gas processing cost (GPC) [15]. The GPC is the total cost incurred to produce a cubic meter of biomethane. The GPC is influenced by the scale of the plant, technology adopted, location and operating process conditions [4, 16-18]. Severn Wye Energy Agency (SWEA) reported an average investment cost for a biogas plant though the details of the equipment, feed flow, feed composition and product purity was not specified. According to SWEA data, the investment cost of membrane installation for biogas plant of 100 m3/h of biomethane is in the range of $8,150 to $8,500/(m3 biomethane/h). For the same capacity of the installation with water scrubbing equipment, the price is $11,250/(m3 biomethane/h) and $11,600/(m3 biomethane/h) for biogas plant with PSA. As the volume of produced biomethane increases to 500 m3/h, the investment cost reduces to about $3,900/(m3 biomethane/h) [6]. Dirkse [16] reported GPC for 250-2000 m3/h upgrading plant using the pressurised water scrubbing technique was in the range of $0.06 to $0.12/m3 of biomethane. Other published work reported GPC to decrease as the volume of feed biogas increases but generally, GPC is roughly in the range of $0.1 to $0.7/m3 of biomethane [4, 16, 19]. A detailed economic report by de Hullu, et al. [20] considering different techniques for a biogas upgrading plant is presented in Table 2. The fixed assumptions are feed flow 250 Nm3/h with 60% CH4, electricity cost was $0.11/kWh, water coast $1.05/m3 and service cost was $55,500/year.
Table 2 - Biogas upgrading technique cost comparison
Technique H2O scrubbing
Chem. Absorption PSA
Membrane
Cryogenic
Total investment cost ($1,000) 294 965 755 831 1,008 Total running cost ($1,000) 11 199.15 208 141 441 Gas processing cost ($/Nm3) 0.14 0.32 0.29 0.25 0.50 Product flow rate (Nm3) 144 137 139 130 161 CH4 recovery (%) 94 90 91 78 98 Product purity (%) 98 98 98 89.5 91 Waste Stream (%CH4 Conc.) 2(6) 2(10) 1(9) 1(22) 1(2)
Considering the GPC, water scrubbing was the cheapest
which can be directly related to the least investment cost of the four techniques. Cryogenic separation had the highest investment cost hence the highest GPC. The investment cost of PSA was quite high but the GPC was at an average compared to the other four techniques. The biggest difference in the investment cost resides in the equipment required and the cost of manufacturing [20]. Membrane GPC was high at $0.25/Nm3 of biomethane due to the 22% CH4 loss while processing cost was also included in its GPC. Makaruk, et al. [21] reported that higher CH4 losses generated by membrane systems increased the biogas processing cost. However, the CH4 lost during the upgrading process of biogas obtained from anaerobic digesters, could be used as fuel for heat generation since anaerobic digestion typically requires higher than ambient temperature for optimal operation. The energy requirement of the upgrading process is also a factor to be considered in technology adoption. Physical absorption, adsorption, membrane and cryogenic upgrading techniques are highly dependent on electricity. Table 3 summarises the electricity and energy requirement of four upgrading techniques. The heating value for biomethane (100% CH4 concentration) is approximately 35 MJ which is equivalent to 9.7 kWh. This was used to estimate the energy required for upgrading in column 4 of Table 3.
Table 3 – Electricity and Energy demand of the upgrading techniques
Separation technique
Electricity demand (kWh/m3 of biomethane)
Heat demand (kWh/m3 of biomethane)
Upgrading energy/ CH4 heating value (%)
Physical absorption (water)
0.2-0.3 [22], 0.4-0.5 [23]
None 2.1-3.1, 4.1-5.2
Physical absorption (organic)
0.10-0.15 [24], 0.23-0.33 [22]
None 1-1.5, 2.4-3.4
Chemical absorption (amines)
0.06-0.17 [25], 0.05-0.18 [23, 24]
0.2-0.4 [23, 25]
0.6-1.8, 0.5-1.9
Adsorption (PSA) 0.16-0.35 [22], 0.29-0.60 [23]
None 1.6-3.6, 3-6.2
Membrane 0.18-0.35 [22], 0.26 [4], 0.20-0.30 [24]
None 1.9-3.6, 2.7, 2.1-3.1
Cryogenic separation
0.18-0.25 [22], 0.42-0.63 [23]
None 1.9-2.6, 4.3-6.5
Proceedings of the World Congress on Engineering and Computer Science 2015 Vol II WCECS 2015, October 21-23, 2015, San Francisco, USA
ISBN: 978-988-14047-2-5 ISSN: 2078-0958 (Print); ISSN: 2078-0966 (Online)
WCECS 2015

From Table 3, chemical absorption upgrading energy demand is the least of the four techniques and demand ranges between 0.6-1.9% of CH4 heating value but requires heat as high as 120 °C for regeneration when MEA is used as absorbent. Generally, absorption processes is best operated at low temperature and high pressure while desorption process requires an increased temperature hence a heating and cooling system is required. Cryogenic requires the highest demand on electricity which ranges between 1.9-6.5% of CH4 heating value for the upgrading process. Jonsson and Westman [23] reported the energy requirement of a cryogenic plant to be at 580.9 kJ/m3 of biomethane with a heat pump cycle operating between -100 °C to 40 °C. Adsorption technique was also high because of the compression energy required but membrane technique was about the average of all the processes. The energy demand ranges between 1.9-3.1% of CH4 heating value.
B. Conversion of Vehicles
Three types of natural gas vehicles (NGVs) are available, they are; dedicated NGVs which are designed to use natural gas only; bi-fuel NGVs which are designed to either run on natural gas or gasoline alternatively; and dual fuel NGVs which run on blended fuel of natural gas and diesel by injecting the blend into a turbocharger [26, 27]. Biomethane can be used as substitute to natural gas without any further alteration of the NGV. During cold start of NGVs, gasoline and diesel are the fuels used for ignition in both bi-fuel and dual fuel NGVs respectively. Once the normal operating temperature is attained, the system automatically switches to natural/biomethane or the blended fuel. Reduced efficiency and low output power are associated with bi-fuel engine when operating on natural gas/biomethane but when it switches to gasoline, the efficiency and power output increases [26]. However, dedicated NGV engines have higher efficiency to a level similar to that of gasoline engine due to the high octane rating of natural gas and the purpose built engine optimized for the fuel only [26]. Figure 1 shows a complete kit for bi-fuel NGV. The kit presented in Figure 1 can also be used for biomethane without any further alteration of the system. The conversion kits consist of fuel storage cylinders and bracket, fuel lines, regulator, a fuel-air mixer, pressure reducer and a switch that allows the driver to alternate between gasoline and compressed biomethane gas (CBG) manually [28]. The cost of converting gasoline vehicles which were not originally designed to operate as bi-fuel varies. The cost depends on the engine size, vehicle make and model, the size and number of the pressurised cylindrical tanks, number of cylinder in the engine and also if customisation of a part is required [29]. The conversion cost ranges between $2,700 to $5,500 for 4-8 cylinder engine in medium size car and vans. While the conversion cost for heavy duty truck ranges between $5,300 to $10,600 [30]. In the international market, the cost of light duty OEM NGVs is higher than gasoline vehicle in the range of $1,900 to $4,500 depending on the national tax regime for new vehicle while price increase for medium duty commercial vehicle ranges from $6,500 to $9,000 depending on the type of vehicle and its application [31]. For heavy duty vehicle, the price has been reported to be higher by 20-25% the cost of its diesel engine equivalent [31].
Figure 1 - Complete natural gas kit for vehicle integration
C. Life Cycle Analysis
The life cycle analysis (LCA) of cost, energy demand and GHG emissions are important components in assessing deployment of any vehicle fuel [32]. LCA of vehicle fuel include their extraction, processing, transport, utilisation and emissions [9]. A well-to-wheel (WTW) analysis describe a complete cycle for vehicle fuel. The WTW is of two stages namely; well-to-tank (WTT) which is the upstream part and covers the production of the fuel including extraction, transportation, distribution and its storage on board a vehicle while tank-to-wheel (TTW) which is the downstream part, covers the end use of the product (combustion) and exhaust emissions [32]. The GHG savings achieved in the production and utilisation of biomethane varies considerably but generally, it depend on digested substrate, substrate transport distance, chosen digestion technique, production capacity, upgrading technique and end use equipment efficiency. Biomethane produced from municipal waste and animal manure has been reported to achieve GHG savings approximately 50% and 80% respectively when compared to conventional fossil fuel [33]. Using biomethane as fuel for vehicle, Brightman, et al. [34] reported a lifecycle CO2 reduction of 49-63% while Fierro, et al. [35] reported a whole life cycle saving as high as 84%. Overall, biomethane has the lowest carbon intensity of road transport fuels, a significant reduction in air pollutants and lower noise emission during vehicle operation [34].
D. Objective of the Paper
This paper assessed the economics of producing biomethane from a closed landfill and its utilization as transport fuel. This paper builds upon a previously published work by the authors “Parametric study of single and double stage membrane configuration on methane enrichment process”. The article studied the effect of variation in process conditions on CH4 recovery and purity in a biogas upgrading process. A case study of an operational biogas upgrading plant which also offer vehicle fuel kit conversion services was the basis for this work. In this study, the effect of variation in feed composition, feed pressure and flow rate on GPC was simulated. An optimal process condition was used to determine the final GPC and estimate the profitability of production and utilization of biomethane as vehicular fuel taking into consideration the prevailing dispensing price of gasoline.
Proceedings of the World Congress on Engineering and Computer Science 2015 Vol II WCECS 2015, October 21-23, 2015, San Francisco, USA
ISBN: 978-988-14047-2-5 ISSN: 2078-0958 (Print); ISSN: 2078-0966 (Online)
WCECS 2015

II. METHODOLOGY
A. Case Study
The biogas upgrading plant that was studied and presented in this paper is privately owned and operated at Sebenza in collaboration with the Ekurhuleni Municipality, South Africa where the landfill is located. The plant process block flow diagram is as shown in Figure 2. Raw biogas from the landfill was composed of 38.9% CO2, 55% CH4, 5% N2, 0.4% O2, 0.002% H2S and 0.66% H2O. The most important task required to achieve fuel grade biomethane is the separation of CO2 from the product gas stream. The plant studied used cascade configuration of hollow fiber membrane for the separation of CO2 from the biogas to achieve the desired fuel grade biomethane. The biogas permeation separation process was carried out in a double stage membrane configuration. Biomethane produced during the second stage separation is the desired product which is stored into a vessel after which it was odourised with mercaptan as a safety procedure and for leak detection. The last stage is compression of the biomethane to 220 bar into high pressure cylinders.
B. Process Simulation
The simulation of the upgrading process was done using a licenced ChemCAD 6.5.5 steady state process simulator from Chemstation and AlmeeSoft Engineering gas permeation software. The pressure swing adsorption (PSA) unit, a dynamic and unsteady state process, which was not covered in the purchased licence was represented with a component separator unit operation and was therefore constrained to plant result for vapour and H2S removal. The cleaning process according to plant data, effectively eliminated vapour and H2S content in the biogas while N2 was reduced to acceptable limit; hence in the enrichment process simulated, CO2 and CH4 were only considered. The process was operated under the following conditions; feed pressure at 9.9 bar; feed flow rate was at 80 m3/hr; feed to permeate flow mode was counter-current; feed side was through the bore; CO2/CH4 selectivity of the membrane was 15.6. The membrane intrinsic properties and module design data were not shared due to intellectual property infringement and confidentiality concerns. Intrinsic properties were gotten from literature while the module design data was provided by Almeesoft Engineering, USA. The membrane intrinsic properties as well as the operating conditions were supplied into three data sections; input data that consist of the process condition; shell data for module design; and permeability data of the gases. Parameters considered in the membrane module design are as listed in the Table 4. The module design data were verified by the plant manager and was accepted to be in conformity with industrial standard.
Table 4 - Membrane module design parameters
Properties units Fiber internal diameter 220.98 μm Fiber outer diameter 370.84 μm No. of fibres 10,000 Active length 1.1 m Membrane area per module 11.6293 m2
Pot length 0.0509 mm No. of shell 1 CO2 viscosity 0.0153 cp Packing porosity 73.8% % Module housing Stainless steel
A double stage membrane with permeate recycle (DSPR)
configuration was simulated for the upgrading process. The following assumptions were considered for the hollow fiber membrane module for the study. (1) Transport properties of the membrane are independent of variation in gas composition throughout the separation. (2) No flux coupling between gas components. (3) Deformation of the hollow fiber under pressure is negligible. The process simulation for the cleaning and CH4 enrichment process was validated by the plant upgrading process result.
C. Process Economics
The processing cost for biogas could be expressed as the cost per cubic metre of feed after cleaning (removal of trace impurities) if it is meant for domestic use. It will be unjustifiable to measure the processing cost of biogas used as vehicular fuel as cost per cubic meter of feed due to the high volume of non-combustible CO2 present in the biogas. Therefore, processing cost per cubic meter of product after upgrading will be considered. For natural gas, the upgraded natural gas is sold on the basis of product volume rather than on the feed volume [14, 19]. Hao, et al. [15] procedure for calculating natural gas processing cost per cubic meter was modified to include the cleaning cost for biogas upgrading process as presented in Table 5. The cleaning cost is largely dependent on the composition and volume of the biogas to be treated [14]. The cleaning cost for removal of vapour and other acidic gases except CO2 was reported to be within the range of 30-100% of the capital cost of the membrane unit [14]. The pre-treatment process consists of a Fe2O3 adsorbent, heat exchanger, an Al2O3 dehydrant and activated carbon. The plant used in this study was a small scale plant with a capacity of producing 100 m3/h of biomethane hence, 80% of the membrane unit cost was considered as the cost for the pre-treatment process. Post-treatment cost was not considered since there was no regeneration process for sulphur recovery from Fe2O3. Mercaptan cost for odourization and high pressure cylinder cost was also not considered for this calculation. Assumptions made to simplify the evaluation of the GPC were as summarised in Table 5.
Proceedings of the World Congress on Engineering and Computer Science 2015 Vol II WCECS 2015, October 21-23, 2015, San Francisco, USA
ISBN: 978-988-14047-2-5 ISSN: 2078-0958 (Print); ISSN: 2078-0966 (Online)
WCECS 2015

Figure 2 - Block flow diagram of the upgrading plant
Table 5 - Economic parameters and assumptions for gas processing costa
Total plant investment cost (TPI)
Total membrane module cost (MC)b MC = $125/m2
Pre-treatment cost (PTC) PTC = 0.8 x MC
Heat exchanger (HE) (a+b*Sn)* I2014/I2004
Compressors cost (CC) (c*Sn)*I2014/I2004
Vessel cost VC = W(ton)*$1,462.5
Fixed cost (FC) FC = MC + PTC + CC + HE+VC
Base plant cost (BPC) BPC = 1.12 * FC
Project contingency (PC) PC = 0.20 * BPC
Total facilities investment cost (TFI)
TFI = BPC + PC
Start-up cost (SC) SC = 0.10 * VOM
TPI = TFI + SC
Annual variable operating and maintenance cost (VOM)
Contract and material maintenance cost (CMC)
CMC = 0.05 * TFI
Local taxes and insurance (LTI) LTI = 0.015 * TFI
Direct labour cost (DL) $15/h
Labour overhead cost (LOC) LOC = 1.15 * DL
Membrane replacement cost (MRC) $63/m2
Utility cost (UC) $0.12/KWh
VOM = CMC+LTI+DL+LOC+MRC+UC
Annual Cost of CH4 lost in permeate stream (CH4LS)
Annual biogas lost (BGLS) BGLS=365*OSF*Lf*Yp(C
H4)*Xp(CH4) CH4LS = BGLS*BGHV*BGWP
Gas processing cost (GPC)
Annual capital related cost (CRC) CRC = 0.2 * TPI
GPC = (CRC + CH4LS + VOM)/[365*OSF*Lf*(1-SCE)*24]
Other assumptions
Membrane life (t) 5 years
Price of biomethane (BGWP) $0.2/Nm3
Heating value of biogas (BGHV) 34.37MJ/m3
On-stream factor (OSF) 96%
Compressor efficiency (ƞ) Ƞ = 0.80 a[15],b[36]
The compressor power was estimated for each condition simulated by Equation 1 [19].
From Table 5 the compressor cost (CC) in USD is the total purchase cost, C = $2700 for reciprocating compressor, S (kW) is the capacity of the compressor and n is 0.8 which is an exponential factor. I2014/I2007 = 1.08 is the chemical engineering plant cost index used to adjust the cost to a 2014 cost level. Compressor that were below 20 kW were cost estimated as 20 kW since the equation is only valid for compressor of 20 kW and above [37, 38]. A U-tube shell & tube heat exchanger was used. From Table 5, HE is the total purchase cost, a = 24,000 and b = 46 are constant, S (m2) is the heat exchanger area, n = 1.2 is an exponential factor. I2014/I2004 = 1.24 is the chemical engineering plant index cost used to adjust the cost to a 2014 cost level. The heat exchange area (A) is most important criteria needed to calculate the cost. Area less than 10 m2 where taken to be 10 m2 as the equation in Table 5 is only valid for area of 10 m2 and above. Other cost such as equipment erection, piping, instrumentation, electrical, building, utilities and site development cost were also factored into calculating the fixed cost.
The profitability of the process was determined using the net present value (NPV), Equation 2, internal rate of return (IRR), Equation 3 and the benefit cost ratio (BCR), Equation 4. A project life span (t) of 20 years was taken as the basis for calculation. Since the real value of money changes over time, discounting factor based on the prime lending rate (r) of 9% according to the South Africa Reserve Bank [39] was used to estimate the net present value of the investment.
D. Cost Analysis of Biomethane as Vehicular Fuel
Refuelling stations sell compressed natural gas (CNG) in litre at gasoline energy equivalent (GEE). The energy content of 1 Nm3 of 100% CH4 equals 1.18 litres of 95 octane gasoline equivalent [29]. The biomethane fuel
Proceedings of the World Congress on Engineering and Computer Science 2015 Vol II WCECS 2015, October 21-23, 2015, San Francisco, USA
ISBN: 978-988-14047-2-5 ISSN: 2078-0958 (Print); ISSN: 2078-0966 (Online)
WCECS 2015

consumption of a mini bus taxi (MBT) in this work was calculated based on gasoline energy equivalent required to cover the same distance under the same operating condition. The price of CNG in 1 litre of GEE was used to calculate the biomethane fuel prices on comparable basis. To estimate the price of biomethane in per litre of gasoline equivalent, Equation 5 was used. By dividing Pm by M%, the price of 100% CH4 fuel was calculated.
Where, Pm= price of CH4 (CNG) at pump; M%= CH4
concentration in biomethane (product purity); L= the energy content of 1 Nm3 of 100% CH4 in gasoline; PGE = price of biomethane in per liter of gasoline energy equivalent (GEE). An average distance of 64,000 km per year travelled by gasoline MBT [40] with fuel consumption of 6.62 km/l [41] was adopted as a model. The cost of conversion kit for conventional gasoline MBTs varies. From the field survey
carried out in South Africa, the cost for converting a Toyota Quantum 16 passenger seat MBT to bi-fuel ranges from R20,000 – R 60,000 depending on the condition of vehicle. The cost covers two 70 l-cylinder bottles (water volume), a pressure reducer unit, an injector rail, an electronic control gauge, a filler nozzle, a switch and any retrofitting to accommodate all the units mentioned. The average distance, fuel consumption, maximum cost of conversion as presented will serve as basis for the economic comparative study for CNG against gasoline and CBG against gasoline.
III. RESULT AND DISCUSSION
A. Simulation Validation
Figure 3 shows the process flow diagram of the DSPR configuration. Table 6 shows the result of the simulation against plant upgrading data.
Figure 3 - Double stage membrane configuration
Table 6 - Validation of simulation with plant data
Plant result Simulated result
Final stage DSPR Initial stage Final stage
Feed Permeate Retentate (Sale gas)
Mixed feed with recycle
Comp discharge/cleaned Feed 1 Permeate
Retentate/feed 2
Permeate to recycle
Retentate (product)
Flow (m3/hr) 80.000 23.000 46.000 98.550 98.030 33.210 64.820 18.560 46.300
Pressure (bar) 1.000 1.082 8.280 1.000 9.900 1.500 9.230 0.800 8.769
Av. Mol. Wt. 27.606 31.847 18.384 28.890 28.949 39.594 23.496 34.426 19.111
CH4 (% mol.) 55.000 40.120 87.200 50.660 50.934 14.657 69.518 31.947 84.590
CO2 (% mol.) 38.934 53.997 4.900 43.626 43.862 83.265 23.677 63.843 7.563
N2 (% mol.) 5.000 4.543 7.693 4.730 4.756 1.685 6.329 3.566 7.437
O2 (% mol.) 0.400 0.964 0.265 0.446 0.448 0.393 0.476 0.643 0.410
H2S (% mol.) 0.002 0.000 0.000 0.000 0.000 0.000 0.000 0.000 0.000
H2O (% mol.) 0.664 0.372 0.005 0.537 0.000 0.000 0.000 0.000 0.000
Heat values (BTU/SCF)
HHV 967.4 202.9 882.0 130.4 861.2
LLV 870.9 182.7 794.0 117.3 775.3
% CH4 Recovery 91.16 89.01
Proceedings of the World Congress on Engineering and Computer Science 2015 Vol II WCECS 2015, October 21-23, 2015, San Francisco, USA
ISBN: 978-988-14047-2-5 ISSN: 2078-0958 (Print); ISSN: 2078-0966 (Online)
WCECS 2015

The plant had 91.16% CH4 recovery with 87.2% product purity. The simulated DSPR configuration yielded 89.01% CH4 recovery with 84.59% purity. DSPR configuration suggests a good approximation to the plant data with a percentage error of 2.64%. The error in the comparison could be attributed to higher CO2/CH4 selectivity of the plant membrane and feed pressure drop within the membrane module. Sensitivity study was carried out using the base condition to study the effect of feed composition, feed pressure and feed flow rate on GPC and the results were discussed. The GPC includes the capital related cost (CRC), the variable operating and maintenance cost (VOM), the cost of CH4 lost in the permeate stream (CH4LS) and the cost of final compression to 220 bar.
B. Effect of Process Condition on GPC
1) Effect of Feed Composition The effect of feed composition on GPC is shown in
Figure 4. It was observed that an increase in CO2 content in the feed from 10% to 30% increased the GPC gradually from $0.73 to $0.79/m3 of biomethane. The observation was assumed to be due to gradual but steady increase of the 2-staged compressor power from 12.68 kW to 23.11 kW. With increasing CO2 in the feed, the fraction of lost CH4 was reduced. This reduction should have reduced the GPC but the compression power was increasing in the progression of the increasing CO2 in the feed; hence the slightly increase in GPC. An increase in CO2 from 30% to 60%, significantly increased the GPC from $0.79 to $1.39/m3 of biomethane as the 2-stage compressor power increased by 72% as compared to 30% of CO2 in the feed. The increase in the compressor power was linked to an increase in CO2 permeating through the second stage of the membrane that increased from 32.1% to 70.2% in the recycled stream.
Figure 4 - Effect of %CO2 in feed on GPC
2) Effect of Feed Pressure The effect of feed pressure on GPC is as shown in Figure
5. Increasing feed pressure from 10 bar to 50 bar increased the required compressor power. As the compressor power increased from 29.66 kW to 51.96 kW, the GPC increased from $0.65 to $1.16/m3 of biomethane. An increase in feed pressure increases the CO2 permeating through the first stage membrane, thereby a highly CH4 concentrated stream is fed to the second stage membrane. Between 10 bar and 30 bar, the GPC increased from $0.65 to $0.77 of biomethane. The sharp increase in GPC from $0.77 to $1.16/m3 of biomethane as feed pressure increases from 30 bar to 50 bar was as a result of the low rate of reduction in the membrane
area which only reduces from 19.65 m2 to 14.09 m2 as compared to the rate of area reduction from 57.6 m2 to 19.65 m2 when feed pressure increased from 10 bar to 30 bar. A reduction in membrane area and CH4 lost in the purge stream lowers the impact of the compressor power on GPC when compared to the GPC for increasing CO2 in the feed. However, the optimal operating pressure for a membrane module will be determined by the pressure limit of the module design since generally increasing pressure increase CH4 recovery up to a limit beyond which the module may structurally fail and reduction in membrane area won’t be proportional to the increase in feed pressure. Figure 5 shows the intersection point at 20 bar of feed pressure to membrane area which is the maximum pressure limit of the module. Beyond the intersection point, increasing feed pressure increased the GPC with an insignificant reduction in membrane area when compared to the rate of membrane area reduction between 10 bar and 20 bar. Therefore, limiting the feed pressure below 20 bar will reduce the membrane area required for separation and limit the sudden increase in GPC.
Figure 5 - Effect of feed pressure on GPC 3) Effect of Feed Flow Rate
Maximising the plant production capacity to produce 100 m3/hr biomethane, reduces the GPC as shown in Figure 6. At feed flow of 80 m3/hr the GPC is $0.79/m3 of biomethane with a product flow rate of 45.99 m3/hr. As the feed flow rate increases to 140 m3/hr, the GPC reduces by 100% to $0.39/m3 with a product flow rate of 100.55 m3/hr. The reduction in GPC was due to a reduction in the CH4 lost in the upgrading process which reduces by 30% in the purge stream, and a 119% increase of the product flow rate. A slight increase in the 2-stage compression power from 28.14 kW to 34.50 kW was observed which was due to the increase in the feed flow rate.
Figure 6 - Effect of feed flow on GPC
Proceedings of the World Congress on Engineering and Computer Science 2015 Vol II WCECS 2015, October 21-23, 2015, San Francisco, USA
ISBN: 978-988-14047-2-5 ISSN: 2078-0958 (Print); ISSN: 2078-0966 (Online)
WCECS 2015

C. Cost of Upgrading
Economics and process efficiency are the key components when optimizing a process with target of achieving the desired quality of the end product. Important technical factors for an optimal membrane configuration are biomethane purity and CH4 recovery while compression duty and adequate membrane area for separation are economic factors [4]. To optimise the process, the feed pressure and membrane area were the two factors considered. Generally, increasing the membrane area makes more economic sense since it is cheaper than increasing the feed pressure which increases the compression power and also requires the membrane module to be designed to accommodate such pressure without failure. Also, the cost of electricity in South Africa has been increasing. Therefore, it will be economical to reduce any recurrent expenditure such as utilities in the optimization process. The membrane area was increased to accommodate the increasing feed flow rate and achieve the desired product. The feed pressure was slightly increased to 14 bar from 10 bar to increase the driving force of the feed stream across the increased membrane area. Table 7 shows the optimised process condition for simulated process configuration. The feed composition was as defined earlier, membrane CO2/CH4 selectivity of 15.6 was maintained while target CH4 purity was 91%.
Table 7 - Simulation result of the optimal process
Parameters Simulation result Feed flow rate 140m3/hr Feed pressure at 1st stage and 2nd stage 14 bar, 11bar Temperature and pressure at permeate side 30°C, 1.08bar Membrane area required 89.26m2 Upgraded biogas flow rate 81.26m3/hr CH4 purity 91% vol. CH4 recovery 96% CO2 recovery in purge 98% vol. Compression duty 141kW
The process increased the product purity by 4.4% and
recovery by 5.4% with a product flow rate of 81.26 m3/hr as against 46 m3/hr of the base case. A membrane area of 89.26 m2 was used to achieve 91% CH4 concentration in the product stream and 98% CO2 concentration in the purge stream. Equations used for calculating the equipment costing were based on larger production volume than what has been studied in this work. All heat exchanger area were less than 10 m2 because of the low flow rate and plant capacity. To satisfy the minimum area condition for the base cost calculation as specified in Table 5, the heat exchangers area were approximated to 10 m2. Also compressor less than 20kW were cost estimated as if they were 20 kW to satisfy the conditions for the purchase cost equation in Table 5. Thus the estimated fixed cost is higher than what the real cost will be but can be used on a scaled up biogas upgrading plant. Table 8 shows the summarised economic impact of the optimised process. In the simulated process, the GPC was approximately $0.42/Nm3 (R4.48/Nm3) of biomethane. Mercaptan cost for odourization and high pressure cylinder cost was not considered for this calculation. The plant in this study dispense CBG on production site, hence cost of transporting CBG was not incurred.
Table 8 - Economics of the process
USD
ZAR(1USD =R10.75) as at 15th June, 2014
Total plant investment cost 1,352,452.21 14,538,861.29
Fixed cost 930,434.05 10,002,166.08
Base plant cost 1,116,520.86 12,002,599.30
Project contingency 223,304.17 2,400,519.86
Total facilities investment 1,339,825.04 14,403,119.15
Start-up cost 12,627.18 135,742.13
Annual variable O&M cost 126,271.75 1,357,421.32
Contract and material maintenance cost 66,991.25 720,155.96
Local taxes and insurance 40,194.75 432,093.57
Direct labour cost 3,504.00 37,668.00
Labour overhead cost 4,029.60 43,318.20
membrane replacement cost 5,623.38 60,451.34
Utility cost 5,928.77 63,734.26
Annual cost of CH4 lost in permeate 9,829.70 105,669.26
Annual biogas lost 1,429.98 15,372.31
Gas processing cost /Nm3 0.4172 4.48
Annual capital related cost 267,965.01 2,880,623.83
D. Profitability of Upgradingin and Utilization
The pump price of CNG (92% CH4) in Johannesburg was R9.90/litre [42] while 95 grade octane gasoline was R14.4/litre as at 15th June, 2014 [43]. The dispensing cost of biomethane from the simulated process was calculated based on the purity of the product to 1 litre gasoline energy equivalent (GEE) as earlier described. The dispensing price for the biomethane based on 91% CH4 concentration was R9.30/liter GEE. To estimate the profitability of the process plant over 20-years period, the NPV was estimated with a discounting factor. At the end of the 20th year, the discounted cumulative NPV will be R15,240,343. Based on the prevailing prime lending rate of 9%, the project will break even in the 5th year after plant start-up as shown in Figure 7. The IRR is 22.41%. An interest rate greater than IRR will make the investment not viable within the project life. The net discounted benefit of the project is R29,767,996.63 while the net discounted cost is R14,527,653.22. The ratio of the benefit to cost (BCR) is 2.05. The overall investment is profitable as indicated by the NPV, IRR and BCR if the biomethane is been sold on site and waste is provided at no cost as assumed in this analysis.
Figure 7 - Cash flow diagram
Proceedings of the World Congress on Engineering and Computer Science 2015 Vol II WCECS 2015, October 21-23, 2015, San Francisco, USA
ISBN: 978-988-14047-2-5 ISSN: 2078-0958 (Print); ISSN: 2078-0966 (Online)
WCECS 2015

Figure 8 - Effect of interest rate and incentives on NPV
To encourage investors, any special incentive and interest rate for renewable energy project provided by the government can reduce the payback period while increasing the NPV. Decreasing interest rate has more positive effect on NPV than increasing incentives as shown in Figure 8. A single digit interest rate was varied to study the impact on discounted cumulative NPV. The NPV decreases from R48,734,655 to R13,478,031 as the interest rate increased from 0 to 9.9%. NPV increased from R15,640,343 to R19,640,343 as incentive increased from R400,000 to R4,400,00 when the prevailing interest rate was constant at 9%. Similarly, the BCR decreases from 4.35 to 1.93 as interest rate increased from 0 to 9.9% while it increases from 2.11 to 3.02 as the incentive increased from R400,000 to R4,400,000. From the analysis, it can be deduced that the discounted NPV is most sensitive to changes in interest rate charged than to cash incentives.
To the end user, a base case of a gasoline MBT was used to determine the profitability of using biomethane as vehicular fuel. Parameters for annual distance, distance travelled per liter of fuel, and conversion cost has been earlier defined. A MBT covering a distance of 64,680 km/annum at 6.62 km/l will require 9,770 litres of fuel. The cost effect for the volume of fuel for using gasoline, CNG and CBG is as calculated in Table 9. Table 9 - Profitability of using biomethane as vehicular fuel to end user
Comparison Gasoline CNG CBG
Litre/year 9,770 9,770 9,770
Annual fuel cost R138,153.35 R97,606.22 R 90,897.95
Annual savings R40,547.13 R47,255.40 Investment Payback (years) 1.5 1.3
Saving 29% 34%
For using CNG over gasoline, the end user will save 29%
of annual fuel cost which is approximately R40,547 per annum with payback period for converting the taxi into bi-fuel of approximately one and half years. Using CBG over gasoline, the end user saves 34% of annual fuel cost which is approximately R47,255 with a payback period of one year and three months. The dispensing cost of CNG includes all taxes and cost of transportation to gas station which makes it slightly expensive than CBG. This calculation indicates that using CBG as vehicular fuel for taxis is a profitable venture when sold directly from the production site.
IV. CONCLUSION
Economic and sensitivity analysis carried out in this study indicated that using CBG as vehicular fuel for taxis is a profitable venture. Increase in %CO2 in the feed and feed pressure increased the GPC while an increase in feed flow rate decreases the GPC. It was observed that if the MBT travels a shorter distance annually, the payback period will be extended and the economic benefit of using the fuel will be defeated aside the positive environmental impact. Though the fuel prices differential between gasoline and CBG, the environmental benefit, as well as the overall savings makes CBG attractive to the producer, government and end user. However, the lack of CBG refuelling infrastructure, location of landfills site to urban centre, frequency of refuelling due to volume of cylinder, cost of retrofitting and volatility of gasoline prices, which is used to determine the actual saving for using CBG, will continue to be a limitation to the full economic potential of upgrading and utilization of CBG as vehicular fuel in South Africa. The calculations in this work has not consider engine efficiency, age of the vehicle, drag factor due to CBG cylinder weight and driving behavioural pattern of the end user which might impact negatively on the annual savings of using CBG and increases fuel consumption per km.
ACKNOWLEDGEMENT
The authors wish to acknowledge South African National Energy Development Institute (SANEDI) for providing funding for this project, the industrial partners, for granting access to their plant and Dr. Alexander Narinsky of Almeesoft Engineering for providing the software for the gas permeation calculation.
REFERENCE [1] D. Deublein and A. Steinhauser, Biogas from waste & renewable
resources: An introduction. Germany: WILEY-VCH Verlag GmbH & Co. KGaA, Weinheim 2008.
[2] C. M. Drapcho, N. P. Nhuan, and T. H. Walker, Biofuels engineering process technology, 1st ed.: McGraw Hill, 2008.
[3] V. K. Vijay, R. Ram Chandra, P. M. V. Subbarao, and S. S. Shyam S. Kapdi, "Biogas purification and bottling into CNG cylinders: Producing Bio-CNG from biomass for rural automotive applications," presented at the The 2nd Joint International Conference on Sustainable Energy and Environment (SEE 2006), Bangkok, Thailand, 2006.
[4] L. Y. Deng and M. B. Hagg, "Techno-economic evaluation of biogas upgrading process using CO2 facilitated transport membrane,"
Proceedings of the World Congress on Engineering and Computer Science 2015 Vol II WCECS 2015, October 21-23, 2015, San Francisco, USA
ISBN: 978-988-14047-2-5 ISSN: 2078-0958 (Print); ISSN: 2078-0966 (Online)
WCECS 2015

International Journal of Greenhouse Gas Control, vol. 4, pp. 638-646, Jul 2010.
[5] P. S. Nigam and A. Singh, "Production of liquid biofuels from renewable resources," Progress in Energy and Combustion Science, vol. 37, pp. 52-68, 4 May 2010.
[6] A. G. Chmielewski, A. Urbaniak, and K. Wawryniuk, "Membrane enrichment of biogas from two-stage pilot plant using agricultural waste as a substrate," Biomass & Bioenergy, vol. 58, pp. 219-228, Nov 2013.
[7] N. Mirsada, "Removal of carbon dioxide from biogas," Lund University, Lund, Sweden2006.
[8] P. Bielaczyc, J. Woodburn, and A. Szczotka, "An assessment of regulated emissions and CO2 emissions from a European light-duty CNG-fueled vehicle in the context of Euro 6 emissions regulations," Applied Energy, vol. 117, pp. 134-141, 15 Mar 2013.
[9] E. Uherek, T. Halenka, J. Borken-Kleefeld, Y. Balkanski, T. Berntsen, C. Borrego, et al., "Transport impacts on atmosphere and climate: Land transport," Atmospheric Environment, vol. 44, pp. 4772-4816, 8 Jan 2010.
[10] M. B. Peterson, G. E. Barter, T. H. West, and D. K. Manley, "A parametric study of light-duty natural gas vehicle competitiveness in the United States through 2050," Applied Energy, vol. 125, pp. 206-217, 7/15/ 2014.
[11] T. Patterson, S. Esteves, R. Dinsdale, and A. Guwy, "An evaluation of the policy and techno-economic factors affecting the potential for biogas upgrading for transport fuel use in the UK," Energy Policy, vol. 39, pp. 1806-1816, Mar 2011.
[12] S. K. Hoekman, "Biofuels in the U.S. – Challenges and Opportunities," Renewable Energy, vol. 34, pp. 14-22, 9 Jul 2008.
[13] J. D. Murphy, E. McKeogh, and G. Kiely, "Technical/economic/environmental analysis of biogas utilization," Journal of Applied Energy, vol. 77, pp. 407-427, 2004.
[14] J. Hao, P. A. Rice, and S. A. Stern, "Upgrading low-quality natural gas with H2S- and CO2-selective polymer membranes Part I. Process design and economics of membrane stages without recycles streams," Journal of Membrane Science, vol. 209, pp. 177-206, Jun 18 2002.
[15] J. Hao, P. A. Rice, and S. A. Stern, "Upgrading low-quality natural gas with H2S- and CO2- selective polymer membranes Part II. Process design, economics and selectivity study of membrane stages with recycle stream," Journal of Membrane Science, vol. 320, pp. 108-122, Mar 30 2008.
[16] E. H. M. Dirkse, "Biogas upgrading using the DMT TS-PWS technology," DMT Environmental Technology2008.
[17] A. Petersson and A. Wellinger, "Biogas upgrading technologies: Development & innovation," Swedish gas center & Nova Energie2009.
[18] K. E. H. Warren, "A techno-economic comparison of biogas upgrading technologies in Europe," Master's, Department of Biological and Environmental Science, University of Jyvaskyla, Renewable Energy, Sustainable Energy Technologies, 2012.
[19] F. Ahmad, K. K. Lau, A. M. Shariff, and G. Murshid, "Process simulation and optimal design of membrane separation system for CO2 capture from natural gas," Computers & Chemical Engineering, vol. 36, pp. 119-128, Oct, 1 2012.
[20] J. de Hullu, J. I. W. Maassen, P. A. Meel, S. Shazad, J. M. P. Vaessen, J. C. Reijenga, et al., "Comparing different biogas upgrading techniques," Eindhoven University of Technology, Eindhoven2008.
[21] A. Makaruk, M. Miltner, and M. Harasek, "Membrane biogas upgrading processes for the production of natural gas substitute," Separation and Purification Technology, vol. 74, pp. 83-92, Jul 30 2010.
[22] F. Scholwin and M. Nelles, "Energy flow in biogas plant: Analysis and implication for plant design," in The biogas handbook: Science, production & application, A. Wellinger, J. D. Murphy, and D. Baxter, Eds., ed Philadelphia: Woodhead Publishing, 2013, pp. 212-227.
[23] S. Jonsson and J. Westman, "Cryogenic biogas upgrading using plate heat exchangers," Master's, Department of Energy and Environment, Chalmers University of Technology, Göteborg, Sweden, 2011.
[24] F. Bauer, C. Hulteberg, T. Persson, and D. Tamm, "Biogas upgrading - Review of commercial technologies," Svenskt Gastekniskt Center (SGC) AB, Malmö, Sweden2013.
[25] N. Johansson, "Production of liquid biogas, LBG, with cryogenic and conventional upgrading technology-description of systems and evaluation of energy balances," Master's, Department of Technology and Society, Lunds Universitet, 2008.
[26] G. A. Whyatt, "Issues affecting adoption of natural gas fuel in light and heavy duty vehicles," U. S. Department of Energy, Pacific Northwest National Laboratory, Washington2010.
[27] U. S. Department of Energy, "Clean cities guide to alternative fuel and advanced medium-and heavy-duty vehicle," Department of Energy2012.
[28] Viking Strategies, "Farm to fuel: Developers' guide to biomethane as vehicle fuel," Biogas Association, CanadaJul 2013.
[29] H. Arnorsson, "A feasibility study of using biomethane as an alternative fuel for taxis in the Reykjavick capital area," Masters of Science Masters, School of Renewable Energy, University of Iceland, Akureyri, 2011.
[30] S. Clarke and J. DeBruyn, "Vehicle conversion to natural gas or biogas," Ministry of Agriculture, Food & Rural Affairs, Ontario, CanadaJul. 2012.
[31] M. Sanne and J. M. Seisler, "How to implement a biomethane project: Decision maker's guide," Europe Natural Gas Vehicle Association, Sweden12 Feb 2008.
[32] X. Ou and X. Zhang, "Life-cycle analysis of energy consumption and GHG emissions of natural gas-based alternative vehicle fuels in China," Journal of Energy, vol. 2013, pp. 1-9, Apr. 24 2013.
[33] EUCAR, CONCAWE, and JRC, "Well-to-wheel analysis of future automotive fossil fuels & powertrains in the European context," European Commission, Joint Research CouncilMar 2007.
[34] T. Brightman, T. Parker, and C. Matthews, "LowCVP Biomethane for Transport (HGV cost modelling)," Transport and Travel Research Ltd., United Kingdom31 Oct 2011.
[35] J. Fierro, X. Gómez, and J. D. Murphy, "What is the resource of second generation gaseous transport biofuels based on pig slurries in Spain?," Applied Energy, vol. 114, pp. 783-789, 2014.
[36] P. H. Shao, M. Dal-Cin, A. Kumar, H. B. Li, and D. P. Singh, "Design and economics of a hybrid membrane-temperature swing adsorption process for upgrading biogas," Journal of Membrane Science, vol. 413, pp. 17-28, Sep 15 2012.
[37] E. Berstad, "Testing and optimization of PVAm/PVA blend membranes for biogas upgrading," Masters of Engineering, Chemical Engineering & Biotechnology, Norwegian University of Science & Technology, Trondhiem, 2012.
[38] R. K. Sinnott, Chemical Engineering Design, 4 ed. New York, USA: Coulson & Richardson's, 2005.
[39] SARB. (2014, 30 Jul). Current market rates. Available: https://www.resbank.co.za/Research/Rates/Pages/CurrentMarketRates.aspx
[40] UITP, "Report on statictical indicator of public transport performance in Sub-Sahara Africa," International Association of Public Transport2010.
[41] B. Merven, A. Stone, A. Hughes, and B. Cohen, "Quantifying the energy needs of the transport sector for South Africa: A bottom‐up model," University of Cape Town, Cape TownJun. 2012.
[42] NGV, "Launch of NGV Station in Johannesburg," S. O. Masebinu, Ed., ed. Johannesburg, 2014.
[43] Department of Energy. (2014, Jun, 17). Fuel prices June https://www.energy.gov.za/files/esources/petroleum_fuelprices.html
Proceedings of the World Congress on Engineering and Computer Science 2015 Vol II WCECS 2015, October 21-23, 2015, San Francisco, USA
ISBN: 978-988-14047-2-5 ISSN: 2078-0958 (Print); ISSN: 2078-0966 (Online)
WCECS 2015