economic analysis in rbmp in spain · economic analysis in rbmp in spain ... dh segura dh segura dh...
TRANSCRIPT

DIRECTIVA
MARCO
AGUA
Economic analysis in RBMP in Spain
Josefina MaestuCoordinator of Economic Analysisof the Water Framework Directive

DIRECTIVA
MARCO
AGUA
Issues • Economic Analysis of water uses
• Pricing and cost recovery of water services
• Cost of WFD measures and Cost effectiveness analyss of programs of measures
• Costs and Financing Strategies of Current actions: sanitation and modernization of irrigation

DIRECTIVA
MARCO
AGUA
Economic Analysis of Water Uses

DIRECTIVA
MARCO
AGUA
The spatial analysis ofproductivity of irrigation
agriculture
Economic analysis of water use
ESPAÑA
0
0,5
1
1,5
2
2,5
3
3,5
4
212 570 407 884 941 1.671 3.952 1.025 3.788 1.571
hm3
€/m
3
Hortalizas
Olivar Otros Cultivos
CítricosViñedo
Frutales no cítricos
Cereales
Bajo plástico
MaízArroz
Productivity per m3 andtotal water use by crops
(for 78% of Has)

DIRECTIVA
MARCO
AGUA
15 Hm30,00-0,08 0,08-0,14 0,14-0,21 0,21-0,45 0,45-0,87
130,44 17,72 3,69 11,85 11,07
Market opportunities in Madrid for urban users to engage in transactions with agricultural users without increasing allocativeefficiency without increasing pressures on the water ecosystems
Policy implications

DIRECTIVA
MARCO
AGUA
Given the presentindustrial structure toproduce 1.000€ of GDP in the industry requires 10 m3 of water.
A 1% increase in industrial productionrequires 12 hm3 ofwater.
Spanish industry growsat 3% p.a. but in lesswater intensive sectors.
Economic analysis of water use and implications
Intensity of water use perindustrial sector m3/1000 €

DIRECTIVA
MARCO
AGUA
Spatial distribution of Industrial GDP in Spain and the geography of wateruse and pollution

DIRECTIVA
MARCO
AGUA
Development of economic analysis modelling and computer tools
• Software application for baseline scenario in agriculture
• Software application for baseline scenario industry
• Software application for baseline scenario urban uses.
• Model of irrigators’ decisions (MODERE)
Economic analysis of water use

DIRECTIVA
MARCO
AGUA
Model of irrigators’ decisions (MODERE)Economic analysis of water use

DIRECTIVA
MARCO
AGUA
Pricing and Cost Recovery
of Water Services

DIRECTIVA
MARCO
AGUA
In Mediterranean agriculture in Spain groundwater use is importantPumping costs are related to volume whilst surface water is mainly charged per hectare
The highest cost of ground water in the Segura River basin (0,74 €/m3)
In average costs for groundwater abstraction for farmers is 0,12 €/m3
Costs of bulk surface water around 0,02 €/m3 although higher costs where there are water transfers (0,14 €/m3)
Pricing and cost recovery of water services

DIRECTIVA
MARCO
AGUA
Agricultural areas with higher water prices specialize in more profitable crops
Rents
Water prices
Groundwater
Surface water
Pricing and cost recovery of water services

DIRECTIVA
MARCO
AGUA
Precio servicio distribución / Dotación por habitante y día
0,00
0,20
0,40
0,60
0,80
1,00
1,20
1,40
1,60
240 250 260 270 280 290 300 310 320 330
Pagos por hectárea / Dotación hectárea y año
0
100
200
300
400
500
600
2.000 4.000 6.000 8.000 10.000
Archipiélagos
CI de Cataluña
DH Segura
DH Segura
DH Tajo
Pricing and cost recovery of water services
Prices and water use vary in different areas of SpainLower prices are correlated with higher per capita and per hectare use
DIRECTIVA
MARCO
AGUA
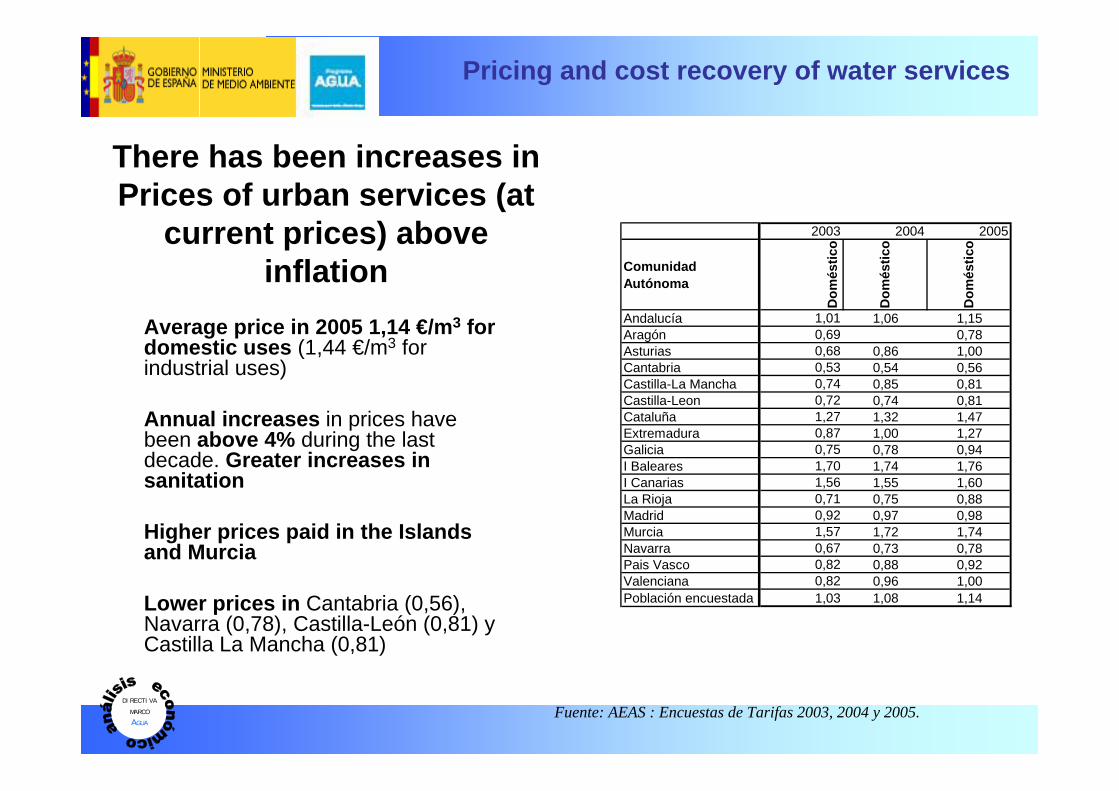
Average price in 2005 1,14 €/m3 for domestic uses (1,44 €/m3 for industrial uses)
Annual increases in prices have been above 4% during the last decade. Greater increases in sanitation
Higher prices paid in the Islands and Murcia
Lower prices in Cantabria (0,56), Navarra (0,78), Castilla-León (0,81) y Castilla La Mancha (0,81)
There has been increases in Prices of urban services (at
current prices) above inflation
Fuente: AEAS : Encuestas de Tarifas 2003, 2004 y 2005.
2003 2004 2005
ComunidadAutónoma
Dom
éstic
o
Dom
éstic
o
Dom
éstic
o
Andalucía 1,01 1,06 1,15Aragón 0,69 0,78Asturias 0,68 0,86 1,00Cantabria 0,53 0,54 0,56Castilla-La Mancha 0,74 0,85 0,81Castilla-Leon 0,72 0,74 0,81Cataluña 1,27 1,32 1,47Extremadura 0,87 1,00 1,27Galicia 0,75 0,78 0,94I Baleares 1,70 1,74 1,76I Canarias 1,56 1,55 1,60La Rioja 0,71 0,75 0,88Madrid 0,92 0,97 0,98Murcia 1,57 1,72 1,74Navarra 0,67 0,73 0,78Pais Vasco 0,82 0,88 0,92Valenciana 0,82 0,96 1,00Población encuestada 1,03 1,08 1,14
Pricing and cost recovery of water services

DIRECTIVA
MARCO
AGUA
Greater increases in prices are correlated with lower increases in per capita consumption
Fuente: INE. Datos 1991-2001
Pricing and cost recovery of water services

DIRECTIVA
MARCO
AGUA
Increases in income and changes in housing patterns is leading to greater water use in urban areas
Tipología viviendas visadas entre 1992-2000
0
10
20
30
40
50
60
70
80
90
Albacete Alicante Almería Murcia España
Porc
enta
je
% Aisladas % Adosadas % en Bloque
Tendencia tipología edificatoria Comarca Noroeste
33,82
54,68
11,5
% Aisladas % Adosadas % en Bloque
Pricing and cost recovery of water services

DIRECTIVA
MARCO
AGUA
Cost of WFD and cost-effectiveness analysis
of the programs of measures

DIRECTIVA
MARCO
AGUA
Estimates in the UK, Scotland andHolland (per capital annual costs)
Case study Minimal MaximalUnited Kingdom € 5 € 20Scotland € 25 € 30Netherlands € 25 € 70
Source: EC cost-benefit study of the WFD
DIRECTIVA
MARCO
AGUA
Wide range of estimates so far:
Preliminary estimates of Prointec of around 18 € per person/year for domestic measures
Case studies: up to 75 € per person/year
Cost of the WFD measures in Spain

DIRECTIVA
MARCO
AGUA
Characterization System of Measures for the Cost-Effectiveness Analysis (SICMACE)
Economic analysis of water use

DIRECTIVA
MARCO
AGUA
ECOAGUAEconomic analysis of water use

DIRECTIVA
MARCO
AGUA
Costs and financing strategies of specific
measures: Sanitation and Modernization
of Irrigation

DIRECTIVA
MARCO
AGUA
The new 2007-2015 water quality plan
Budget: 19007 Million Euros of investment in the period 2007-2015
More than 2000 actions in a 9 year period (2007-2015)
Aiming to comply with EC regulations (Directive 91/271/CEE; and the WFD 60/2000/CE) and the National “AGUA” programme (Law 11/2005)
Water quality plan

DIRECTIVA
MARCO
AGUA
Financing strategy
Central Government participation (DGA/PPCC and CCHH): 3046 + 557 M€ : 3603 M€
European Funding: 1369.9 M€
Important role of State Water Companies
Need for private financing
Water quality plan

DIRECTIVA
MARCO
AGUA
Financing strategy: Conditionality in Central Government participation in financing
General Budget financing of projects in autonomous regions on the basis of bilateral formal framework agreements/contracts (Convenios)
Financing of projects by State Water Companies on the basis of bilateral formal agreements/contracts for specific projects: co-financing and execution (possible Operation)
Financing of Central Government conditional to: a) existence of WWT tariff (3 regions do not have them)b) cost - recovery mechanisms in placec) existence of WWT Law and d) WWT Plan in the region
Water quality plan

DIRECTIVA
MARCO
AGUA
IMPACT on pricesCost recovery of projects financed by the
public budget must be recovered, as well as the ones financed by external financing
Average impact on prices of infrastructure costs of 11%, varies according to Autonomous Communities. Ranges between 6.9% and 21%
The issue of distributing the burden of the smaller projects with greater unit costs
The issue of exceptions to the cost recovery principle
Andalucía 0,48 1,12AragónCanarias 0,29 1,76Cantabria 0,10 0,75Castilla y León 0,36 0,80Castilla-La Mancha 0,41 0,89Cataluña 0,50 1,45Ciudad Autónoma de CeutaCiudad Autónoma de MelillaComunidad de Madrid 0,33 0,97Comunidad Foral de Navarra 0,36 0,77Comunidad Valenciana 0,42 1,04Extremadura 0,24 1,01Galicia 0,34 0,95Islas Baleares 0,77 2,06La Rioja 0,40 0,76País Vasco 0,60 1,21Principado de Asturias 0,34 1,09Región de Murcia 0,66 1,72
Total España 0,43 1,17
Precio Saneamiento 2004 (AEAS)
Precio Ciclo Integral 2004 (AEAS)Comunidad Autónoma
Prices in the different Autonomous Communities
Water quality plan

DIRECTIVA
MARCO
AGUA
Modernization of irrigationNational Plan of Rural Development 2007-2013Impact Plan 2006-2007
– Coordinated actions of Minister of the Environment and Minister of Agriculture
– Saving foreseen 1.200 hm3
– Modernisation of 866.898 ha– ICO (Credit Official Institute) average support to
farmers of 5.000 € – 18.000 €
Modernization of irrigation

DIRECTIVA
MARCO
AGUA
Summary• Important effort in economic analysis to asses
future water use, efficiency and productivity of present water use.
• Policy oriented results: potential of pricing and market instruments and modification of legislation
• Pending information on costs of the WFD measures and on going work on financing strategies and analysis of economic impacts of measures
• Some major efforts under way in implementing measures to improve water status.
• Development of computer applications for estimating future use, efectiveness and economic impacts of measures, and for comparing the cost-effectiveness of measures