economia internazionale 7 alireza naghavi capitolo...
TRANSCRIPT

7Economia Internazionale
Alireza Naghavi
Capitolo 9(b)
L’outsourcing di beni
e servizi

2 of 118© 2008 Worth Publishers ▪ International Economics ▪ Feenstra/Taylor
Introduction
• A vast array of products consist of materials,
parts, components, and services that are
produced in multiple countries.
• The provision of services or the production of
various parts of a good in different countries that
are then used or assembled into a final good in
another location is called foreign outsourcing, or
simply outsourcing.
• Outsourcing is a type of trade that differs from
what we have studied so far.

3 of 118© 2008 Worth Publishers ▪ International Economics ▪ Feenstra/Taylor
Introduction
• Outsourcing is the trade in intermediate inputs,
which can sometimes cross borders several times
before being incorporated into a final good.
• Outsourcing is a relatively new phenomenon as
the costs of transportation and communication
have fallen so much that it is now economical to
combine resources from many countries to
produce a good or service.

4 of 118© 2008 Worth Publishers ▪ International Economics ▪ Feenstra/Taylor
Introduction
• Is outsourcing different from the type of trade we studied in the Ricardian and Heckscher-Ohlin models?
• We will look at how outsourcing compares to these models. In some ways it is similar and in some ways it is different.
• Outsourcing results in lower prices, but changes the mix of jobs in the U.S.
• In some ways outsourcing is similar to immigration as U.S. companies can employ foreign labor although those workers still live in their own countries.

5 of 118© 2008 Worth Publishers ▪ International Economics ▪ Feenstra/Taylor
Introduction
• The goal of this chapter is to examine in detail the
phenomenon of outsourcing and describe in what
ways it differs from trade in final products.
How does outsourcing affect the demand for skilled and
unskilled labor and their wages?

SIDE BAR
6 of 118© 2008 Worth Publishers ▪ International Economics ▪ Feenstra/Taylor
Outsourcing versus Offshoring
• The term “offshoring” is sometimes used to refer
to a company moving some of its operations
overseas, but retaining ownership of those
operations.
Intel produces microchips in China and Costa Rica
using subsidiaries that it owns.
Intel has engaged in foreign direct investment (FDI) to
establish those offshore subsidiaries.
Mattel, on the other hand, arranges for the production
of the Barbie doll in several different countries.

SIDE BAR
7 of 118© 2008 Worth Publishers ▪ International Economics ▪ Feenstra/Taylor
Outsourcing versus Offshoring
The difference is that Mattel does not actually own the firms in those countries.
Mattel is engaging in outsourcing as it contracts with these firms, but has not done any FDI.
• In this chapter we will not worry about the distinction between “offshoring” and “outsourcing.”
• We will use outsourcing whenever the components of a good or service are produced in several countries, regardless of who owns the plants that provide the service or components.

8 of 118© 2008 Worth Publishers ▪ International Economics ▪ Feenstra/Taylor
A Model of Outsourcing
• To develop the model of outsourcing, we need to distinguish all the activities used to produce and market a good or service.
• Figure 7.2 (a) describes the activities in the order in which they are performed.
• However, for outsourcing, it is more useful to look at the activities according to the ratio of skilled to unskilled labor they use which is shown in figure 7.2 (b). We start with the less skilled activities and move to
more complex components and then onto the more skilled labor activities.

9 of 118© 2008 Worth Publishers ▪ International Economics ▪ Feenstra/Taylor
A Model of Outsourcing
Figure 7.2

10 of 118© 2008 Worth Publishers ▪ International Economics ▪ Feenstra/Taylor
A Model of Outsourcing
• Value Chain of Activities
The whole set of activities we just described is
sometimes called the value chain for the products.
Each activity adds more value to the combined product.
Some of the activities can be transferred to other
countries when it is more economical.
By looking at activities in terms of their relative amount
of skilled labor, we can predict which ones are likely to
be transferred abroad.

11 of 118© 2008 Worth Publishers ▪ International Economics ▪ Feenstra/Taylor
A Model of Outsourcing
• This prediction depends on several assumptions:
1. Relative Wage of Skilled Workers
We assume that Foreign wages for unskilled and
skilled workers are less than those at Home.
W*L < WL and W*S < WS
Additionally, we assume the relative wage of unskilled
labor is lower in foreign than at home.
W*L / W*S < WL / WS
Remember that unskilled labor in developing countries
typically receives especially low wages.

12 of 118© 2008 Worth Publishers ▪ International Economics ▪ Feenstra/Taylor
A Model of Outsourcing
2. Costs of Capital and Trade
Although labor costs are lower in Foreign, the firm
must also take into account extra costs of doing
business there.
Higher prices to build a factory or for costs of production.
Extra costs in communication or transportation.
In making a decision to outsource, the firm will
balance the saving from lower wages against the
extra costs of capital and trade.
We assume that these extra costs apply uniformly
across all the activities in the value chain—a
somewhat unrealistic assumption.

13 of 118© 2008 Worth Publishers ▪ International Economics ▪ Feenstra/Taylor
A Model of Outsourcing
3. Slicing the Value Chain
Based on our previous assumptions, it will make
sense for the firms to send the most unskilled-labor
intensive activities abroad and keep the more-skilled
labor intensive activities at Home.
In figure 7.2 that might be all activities to the left of the
vertical line A.
This is referred to as slicing the value chain.
Activities to the left of line A are sent abroad because
the cost savings from paying lower wages in Foreign
are greatest for the less-skilled labor intensive
activities.

14 of 118© 2008 Worth Publishers ▪ International Economics ▪ Feenstra/Taylor
A Model of Outsourcing
4. Relative Demand for Skilled Labor
Figure 7.3 graphs the demand for labor in each
country.
For Home we graph the relative demand for skilled
labor at Home, S/L against the relative wage, WS/WL
for activities to the right of line A.
The relative demand curve slopes downward because
a higher relative wage for skilled labor would cause
home firms to substitute toward less-skilled labor in
some activities.
We can do the same thing for Foreign.

15 of 118© 2008 Worth Publishers ▪ International Economics ▪ Feenstra/Taylor
A Model of Outsourcing
Figure 7.3
16 of 118© 2008 Worth Publishers ▪ International Economics ▪ Feenstra/Taylor
A Model of Outsourcing
• Relative Demand for Skilled Labor
We can add a relative supply curve to the graph.
The relative supply curve is upward sloping because a
higher relative wage for skilled labor will cause more
skilled individuals to enter the industry.
The intersection of the relative demand and relative
supply curves gives the equilibrium relative wage in this
industry in each country.
We can now study how the equilibrium changes as
Home outsources more activities to Foreign.

17 of 118© 2008 Worth Publishers ▪ International Economics ▪ Feenstra/Taylor
Changing the Costs of Trade
• Suppose that the costs of capital or trade in
Foreign fall.
E.g. NAFTA lowered tariffs charged on goods crossing
the U.S.-Mexico border.
• Lowering trade costs makes it easier for Home to
outsource to Foreign.
• What are the effects of these changes on labor
demand and relative wages?
18 of 118© 2008 Worth Publishers ▪ International Economics ▪ Feenstra/Taylor
Changing the Costs of Trade
• Change in Home Labor Demand and Relative
Wage
When costs of capital or trade decline in Foreign, there
is an incentive to shift more activities in the value chain
from Home to Foreign.
The dividing line in the value chain shifts right (shown in figure
7.4).
The activities shifted to Foreign are less skill-intensive
than the ones left at Home.
The range of activities now done at Home are more
skilled labor intensive on average.
The relative demand for skilled labor at Home will
increase.

19 of 118© 2008 Worth Publishers ▪ International Economics ▪ Feenstra/Taylor
Changing the Costs of Trade
Figure 7.4
20 of 118© 2008 Worth Publishers ▪ International Economics ▪ Feenstra/Taylor
Changing the Costs of Trade
• Change in Home Labor Demand and Relative
Wage
The Home demand curve will shift right, shown in figure
7.5 (a).
Remember this graph shows the relative demand, not
the absolute quantity of labor demanded.
We would expect the absolute demand of skilled and unskilled
workers to decrease with increased outsourcing.
BUT, relative demand increases because the activities
still done at Home are more skill-intensive than before.
The relative wage of skilled labor will increase due to
outsourcing.

21 of 118© 2008 Worth Publishers ▪ International Economics ▪ Feenstra/Taylor
Changing the Costs of Trade
Home
Supply
Home
Demand
Skilled/Unskilled
Labor, S/L
(a) Home Country
A
Skilled/Unskilled
Wage, WS/WL
Figure 7.5
Relative demand increases
because the jobs done at
home are now more skill
intensive than before.
The relative wage of skilled
labor increases due to
outsourcing.
B

22 of 118© 2008 Worth Publishers ▪ International Economics ▪ Feenstra/Taylor
Changing the Costs of Trade
• Change in Foreign Labor Demand and Relative Wage For Foreign, the activities that are newly outsourced
there are more skill-intensive than those initially outsourced to them.
The range of activities in Foreign are more skilled-labor intensive on average.
Therefore the relative demand for skilled labor in Foreign will increase.
The demand curve shifts to the right as seen in figure 7.5 (b).
The relative wage of skilled labor increases in foreign.

23 of 118© 2008 Worth Publishers ▪ International Economics ▪ Feenstra/Taylor
Changing the Costs of Trade
Figure 7.5
Foreign
Supply
Foreign
Demand
(b) Foreign Country
A*
Skilled/Unskilled
Labor, S*/L*
Skilled/
Unskilled
Wage,
W*S/W*L
The activities outsourced to
Foreign are more skill intensive
so the relative demand for
skilled labor increases
B*
The relative wage of skilled
labor increases in Foreign

24 of 118© 2008 Worth Publishers ▪ International Economics ▪ Feenstra/Taylor
Changing the Costs of Trade
• From this model we can see that both countries
experience an increase in the relative wage of
skilled labor due to increased outsourcing.
As activities in the middle of the value chain are shifted
from home to Foreign, they raise the relative demand
for skilled labor in both countries because these
activities are the least skill-intensive of those formerly
done at Home but the most skill-intensive of those done
in Foreign.
So the relative demand for skilled labor rises in both
countries along with the relative wage.

APPLICATION
25 of 118© 2008 Worth Publishers ▪ International Economics ▪ Feenstra/Taylor
Change in Relative Wages in the United States
• Since the early 1980s, the wages of skilled
workers have risen relative to those of unskilled
workers in the U.S. as well as other countries.
• We can use data from the manufacturing sector
on “production” (unskilled) and “non-production”
(skilled) workers.
APPLICATION
26 of 118© 2008 Worth Publishers ▪ International Economics ▪ Feenstra/Taylor
Change in Relative Wages in the United States
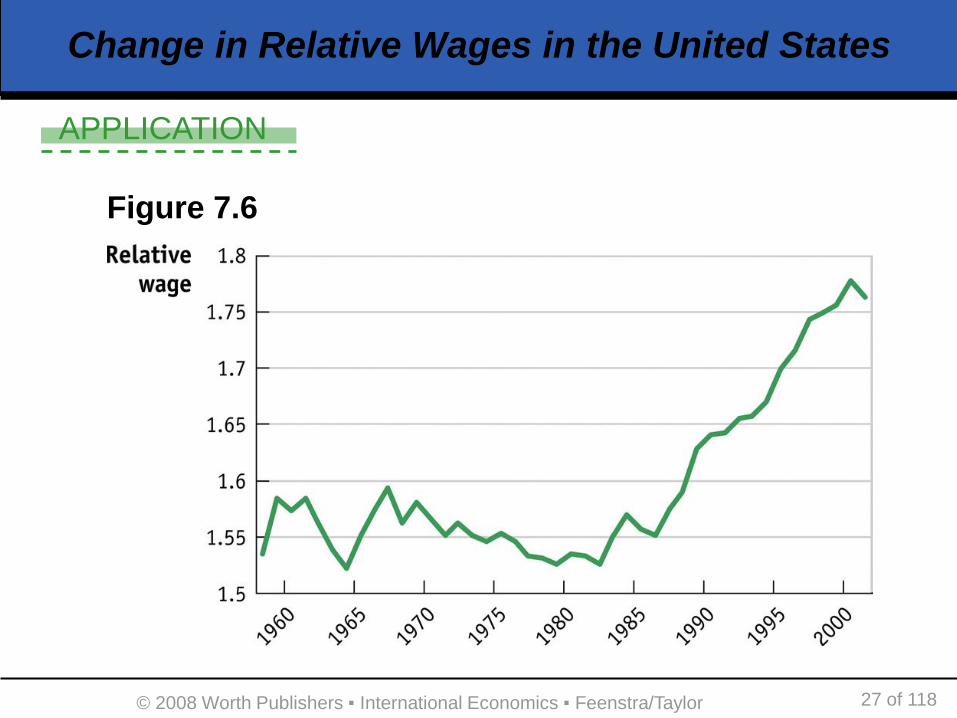
• Relative Wage of Non-production Workers
Figure 7.6 shows the average annual earnings of non-
production workers relative to production workers in
U.S. manufacturing from 1958 to 2001.
Relative earnings were erratic from 1958 to 1967, and fell from
1968 to 1983 due to increased supply of college graduates.
In 1983 the relative wage increased steadily to 2000.
APPLICATION
27 of 118© 2008 Worth Publishers ▪ International Economics ▪ Feenstra/Taylor
Change in Relative Wages in the United States
Figure 7.6

APPLICATION
28 of 118© 2008 Worth Publishers ▪ International Economics ▪ Feenstra/Taylor
Change in Relative Wages in the United States
• Relative Employment of Non-production Workers Figure 7.7 shows a steady increase in the ratio of non-
production to production workers employed in U.S. manufacturing until the early 1990s. Firms were hiring fewer production, or unskilled, workers
relative to non-production workers.
In 1990s there was a fall in the ratio of non-production to production workers.
From 1980 to about 1990, the relative employment of non-production workers continued to rise even with a rising relative wage of non-production workers.

APPLICATION
29 of 118© 2008 Worth Publishers ▪ International Economics ▪ Feenstra/Taylor
Change in Relative Wages in the United States
Figure 7.7

APPLICATION
30 of 118© 2008 Worth Publishers ▪ International Economics ▪ Feenstra/Taylor
Change in Relative Wages in the United States
• Relative Employment of Non-production Workers
The only way both of these could increase is if there
was an outward shift in the relative demand for non-
production (skilled) workers during that time period.
This would lead to a simultaneous increase in their relative
employment and in their wages.
We can see this in figure 7.8 where we plot the relative
wage and employment of non-production workers from
1979 to 1990.

APPLICATION
31 of 118© 2008 Worth Publishers ▪ International Economics ▪ Feenstra/Taylor
Change in Relative Wages in the United States
Figure 7.8

APPLICATION
32 of 118© 2008 Worth Publishers ▪ International Economics ▪ Feenstra/Taylor
Change in Relative Wages in the United States
• Explanations
One factor that can lead to an increase in the relative
demand for skilled labor is outsourcing.
The evidence from the manufacturing sector in the U.S.
is strongly consistent with our model of outsourcing
Another possible explanation is the increased use of
personal computers in the workplace during that time
frame. This would also cause an increase in the relative demand for skilled
labor as workers who knew how to use them would be needed.
This is called skill-biased technological change.
33 of 118© 2008 Worth Publishers ▪ International Economics ▪ Feenstra/Taylor
Change in Relative Wages in Mexico
• Our model of outsourcing predicts that the relative wage of skilled labor will rise in both countries.
• We have seen this for the U.S., but what about for Mexico?
• Figure 7.9 shows the relative wage of non-production labor in Mexico from 1964–1994. Data comes from the census of industries in Mexico
which occurs infrequently.
We can see the data seem to follow the same trends that we saw in the U.S.
Relative wages do move in the same direction in both countries.

34 of 118© 2008 Worth Publishers ▪ International Economics ▪ Feenstra/Taylor
Change in Relative Wages in Mexico
Figure 7.9

35 of 118© 2008 Worth Publishers ▪ International Economics ▪ Feenstra/Taylor
Change in Relative Wages in Mexico
• In summary:
Changes in relative prices in the U.S. and Mexico
match from 1964 to 1985 (relative wages falling) and
from 1985 to 1994 (relative wages rising).
Outsourcing from the U.S. to Mexico was rising from
1985 to 1994, so the rise in relative wages matches our
prediction from the model of outsourcing.

36 of 118© 2008 Worth Publishers ▪ International Economics ▪ Feenstra/Taylor
The Gains from Outsourcing
• We have shown that outsourcing can shift the
relative demand for labor, and raise the wage for
skilled workers.
• Since the wage for unskilled workers is the
reciprocal of that for skilled workers, that means
that outsourcing will decrease the relative wage
for unskilled workers.
• However, outsourcing reduces production costs
which, in a competitive market, reduces prices so
outsourcing benefits consumers.

37 of 118© 2008 Worth Publishers ▪ International Economics ▪ Feenstra/Taylor
The Gains from Outsourcing
• The goal of this section is to try and balance the
potential losses faced by some groups (unskilled
labor) with the gains enjoyed by others (skilled
labor and consumers).
• In the previous chapters, the Ricardian and
Heckscher-Ohlin models generate more gains
than losses.
• Is this true for outsourcing?

38 of 118© 2008 Worth Publishers ▪ International Economics ▪ Feenstra/Taylor
A Simplified Outsourcing Model
• Suppose there are only two activities: components
production and research and development (R&D).
• Each activity uses skilled and unskilled labor, but we
assume components uses unskilled labor intensively
and R&D uses skilled labor intensively.
• The costs of capital are equal in both activities.
• We want to compare the no-trade situation to an
equilibrium with trade through outsourcing, to
determine if there are overall gains from trade.

39 of 118© 2008 Worth Publishers ▪ International Economics ▪ Feenstra/Taylor
A Simplified Outsourcing Model
• Suppose that the first has a certain amount of skilled (S) and unskilled (L) labor to devote to components and R&D.
• The two kinds of labor are free to move between the two activities.
• Given the total amount of skilled and unskilled labor, we graph a production possibilities frontier (PPF) for the firm between components and R&D activities—figure 7.10. Points on the PPF show the mix of skilled and unskilled
labor used in the firm for each good.
Moving along the PPF shows opportunity cost.
40 of 118© 2008 Worth Publishers ▪ International Economics ▪ Feenstra/Taylor
A Simplified Outsourcing Model
• Production in the Absence of Outsourcing
Suppose that the firm, initially, cannot engage in
outsourcing.
The component production and R&D done at Home are used to
manufacture a final product at Home.
It cannot assemble any components in Foreign nor send any of
its R&D results abroad.
An isoquant is used to determine how much of the final
good is produced.
Similar to a consumer’s indifference curve except, instead of
utility, it illustrates production of the firm.
A curve along which the output of the firm is constant despite
changing combinations of inputs.

41 of 118© 2008 Worth Publishers ▪ International Economics ▪ Feenstra/Taylor
A Simplified Outsourcing Model
• Production in the Absence of Outsourcing
Figure 7.10 shows production in the absence of
outsourcing.
The quantity of the final good Y0 can be produced using
the quantity QC of components and the quantity QR of
R&D shown at point A.
This isoquant is tangent to the PPF showing this is the
highest amount of product that can be produced with
current amounts of components and R&D.
Y1 cannot be produced without outsourcing because it
lies outside the PPF.

42 of 118© 2008 Worth Publishers ▪ International Economics ▪ Feenstra/Taylor
A Simplified Outsourcing Model
• Through the no-trade equilibrium A in figure 7.10, we draw a line with the slope of the isoquant at point A.
• The slope of the isoquant measures the value, or price, that the firm puts on components relative to R&D.
• We can think of these prices as reflecting the marginal costs of production of the two activities.
• The slope of the price line through A is the price of components relative to the price of R&D, (PC/PR)A, in the absence of outsourcing.

43 of 118© 2008 Worth Publishers ▪ International Economics ▪ Feenstra/Taylor
A Simplified Outsourcing Model
A
R&D
Components
QR
QC
Y0
Y1
Figure 7.10
Home firm PPF
No-trade Home firm
equilibrium
Home firm
isoquants
Relative price of
components = (PC/PR)A

44 of 118© 2008 Worth Publishers ▪ International Economics ▪ Feenstra/Taylor
A Simplified Outsourcing Model
• Equilibrium with Outsourcing
Now suppose the firm can import and export its
production activities through outsourcing.
The quantity of the final good is no longer constrained by the
Home PPF.
A higher level of production (isoquant) is possible by trading
intermediate activities.
We will refer to the relative price of the two activities
that the Home firm has available through outsourcing
as their world relative price, (PC/PR)W1.
Assume the world relative price of components is
cheaper than Home’s no-trade relative price.

45 of 118© 2008 Worth Publishers ▪ International Economics ▪ Feenstra/Taylor
A Simplified Outsourcing Model
• Equilibrium with Outsourcing
With a lower relative wage of unskilled labor in Foreign,
the components assembly will also be cheaper in
Foreign.
It follows that Home will want to outsource components,
which are cheaper abroad, while Home firms will be
exporting R&D, which is cheaper at Home.
The Home equilibrium is shown in figure 7.11.
The world relative price is tangent to the PPF at B, and
is flatter than the no-trade relative price line at Home.

46 of 118© 2008 Worth Publishers ▪ International Economics ▪ Feenstra/Taylor
A Simplified Outsourcing Model
• Equilibrium with Outsourcing The flatter line reflects the lower world relative price of
components as compared to the no-trade relative price at Home.
The Home firm undertakes more R&D and less component production, moving from point A to point B on the PPF.
Starting at B, the Home firm exports R&D and imports components, moving along the relative price line to point C. The isoquant is tangent to the world price line at a new
maximum amount of the good, Y1, that can now be produced.
Home can produce more with outsourcing.

47 of 118© 2008 Worth Publishers ▪ International Economics ▪ Feenstra/Taylor
A Simplified Outsourcing Model
Figure 7.11
A
R&D
Components
Y0
Y1
No-trade Home firm
equilibrium
C
Gains from
Outsourcing
B
World relative price of
components = (PC/PR)W1
Home firm imports of components
Home firm
exports of
R&D
Before outsourcing, Home
starts at A, the no-trade
equilibrium. They can only
use what they have
When the firm outsources,
they now face the world
relative price of components at
B and use a new mix of inputs
based on the new world price
This means the firm will
export R&D and import
Components. The
increase in production
from Y0 to Y1 are the
gains from outsourcing
(PC/PR)A
Given the firms production
abilities from the isoquants,
we can see the firm can now
produce Y1 at C using
corresponding levels of R&D
and Components
No-trade relative price of
components = (PC/PR)A

48 of 118© 2008 Worth Publishers ▪ International Economics ▪ Feenstra/Taylor
A Simplified Outsourcing Model
• Gains from Outsourcing Within the Firm
The increase of final goods produced (Y0 – Y1) is a
measure of the gains from trade to the Home firm from
outsourcing.
Because more of the final good is produced with the
same overall amount of skilled and unskilled labor
available in Home, the Home company is more
productive.
Its costs of production fall.
Price if the final product falls.
The gains for this company are therefore spread to
consumers as well.

49 of 118© 2008 Worth Publishers ▪ International Economics ▪ Feenstra/Taylor
A Simplified Outsourcing Model
• Gains from Outsourcing Within the Firm
Our first conclusion therefore is: when comparing a no-
trade situation to the equilibrium with outsourcing, and
assuming that the world relative price differs from that
at Home, there are always gains from outsourcing.
We now need to consider the impact on a country’s
terms of trade.

50 of 118© 2008 Worth Publishers ▪ International Economics ▪ Feenstra/Taylor
Terms of Trade
• As before, the terms of trade equal the price of a country’s exports divided by the price of its imports. Home terms of trade are (PR/PC)W1 since Home is
exporting R&D and importing components.
• A rise in the terms of trade indicates that a country is getting a higher price for its exports, or paying a lower price for its imports—both benefit the country.
• Conversely, a fall in the terms of trade harms a country, because it is paying more for its imports and getting less for its exports.
51 of 118© 2008 Worth Publishers ▪ International Economics ▪ Feenstra/Taylor
Terms of Trade
• Fall in the Price of Components
Turning to figure 7.12, let the Home country start at the
equilibrium with outsourcing shown by points B and C.
Suppose there is a fall in the relative price of
component production.
Maybe Foreign improves its productivity in components.
This raises the terms of trade for Home.
The world price becomes flatter and production shifts to
B’. The firm ends up at point C′.
Production of the final good is Y2 > Y1.
Home enjoys greater gains due to outsourcing.

52 of 118© 2008 Worth Publishers ▪ International Economics ▪ Feenstra/Taylor
Terms of Trade
Figure 7.12
R&D
Components
Y1
C
World relative price of
components = (PC/PR)W1
A
B
World relative price of
components = (PC/PR)W2
C’
Home firm
exports of
R&D
Home firm imports of components
B’
Home gains
from trade
when relative
price of
components
falls
Y2
Relative price of
components falls leading
to a new relative world
price (PC/PR)W2
The firm now exports less
R&D and imports more
components
Home gains from
increased
production
This leads to new use of
inputs at B’, new production
at Y2, and new use of inputs
at C’

53 of 118© 2008 Worth Publishers ▪ International Economics ▪ Feenstra/Taylor
Terms of Trade
• Fall in the Price of R&D
Samuelson was referring to this when he stated that
outsourcing might allow developing countries to gain a
comparative advantage in those activities where the
U.S. once had the comparative advantage.
For example, as Indian companies like Wipro (an
information technology service company) engage in
more R&D, they compete directly with American
companies exporting the same services.
Competition can lower the world price of R&D services.

54 of 118© 2008 Worth Publishers ▪ International Economics ▪ Feenstra/Taylor
Terms of Trade
• Fall in the Price of R&D
Figure 7.13 again shows the no-trade equilibrium at
point A and Home production at B with outsourcing
from figure 7.11.
A fall in the world relative price of R&D will lead to a
steeper price line (PR falls).
Home shifts production to point B′′, and by exporting
R&D and importing components, moves to point C′′.
Final output has fallen from Y1 to Y3.
The fall in the price of R&D services leads to losses for
the Home firm compared to point C.

55 of 118© 2008 Worth Publishers ▪ International Economics ▪ Feenstra/Taylor
Terms of Trade
Figure 7.13
R&D
Components
Y0
Y1
(PC/PR)A
(PC/PR)W1
Home firm imports of
components
Home firm
exports of
R&D
After the costs of R&D fall,
the world relative price
gets steeper at (PC/PR)W3
A
B
World Relative Price of
Components(PC/PR)W3
The country shifts production
reducing R&D and increasing
Components, moving from B
to B”
C
Y3
B”
C”
Terms of trade loss leads
to reduced production to
Y3, and reduced exports
and imports

56 of 118© 2008 Worth Publishers ▪ International Economics ▪ Feenstra/Taylor
Terms of Trade
• Fall in the Price of R&D
Remember Home is exporting R&D and importing
components in the initial outsourcing equilibrium: terms
of trade are PR/PC.
When the price of R&D falls, Home terms of trade have
worsened and Home is worse off compared to initial
outsourcing equilibrium.
Samuelson’s point is that the U.S. could be worse off if
China or India become more competitive in, and lower
the prices of, the products that the U.S. itself is
exporting.

57 of 118© 2008 Worth Publishers ▪ International Economics ▪ Feenstra/Taylor
Terms of Trade
• Fall in the Price of R&D
Additionally, notice that the final output of Y3 is still
higher than Y0—the no-outsourcing output.
There are still Home gains from outsourcing at C′′ as
compared to the no-trade equilibrium at A.
Samuelson’s point is that a country is worse off when
its terms of trade fall, even though it is still better off
than in the absence of trade. When there is a fall in the
terms of trade, some factors of production will lose and
others will gain, but in this case the gains of the winners
are not enough to compensate the losses of the losers.

58 of 118© 2008 Worth Publishers ▪ International Economics ▪ Feenstra/Taylor
The Future of US Comparative Advantage
• As China and India grow, we should expect that
the industrialized countries will face increasing
competition in world markets.
• The final issue we address in this chapter is to
identify the types of goods or services for which
the U.S. can be expected to retain its comparative
advantage.
• We will argue that not all production is suitable for
outsourcing.

59 of 118© 2008 Worth Publishers ▪ International Economics ▪ Feenstra/Taylor
The Future of US Comparative Advantage
• One of the first service activities to be outsourced
to India was the transcription of doctor’s notes
from spoken to written.
• Since then other types of medical services have
been outsourced and a New York Times article
identified the reading of X-rays as the next area to
shift overseas.
• However, there are only certain types of radiology
jobs that could potentially be transferred.

60 of 118© 2008 Worth Publishers ▪ International Economics ▪ Feenstra/Taylor
The Future of US Comparative Advantage
• The reading of X-rays is difficult and takes years
of training and practice to perfect.
• In a few cases, such as mammograms, it is
possible that the work can be outsourced.
• Firms known as “nighthawks” already provide
some outsourcing services primarily during
nighttime hours.
Headquartered in U.S. but have radiologists at offshore
sites.
These services allow smaller hospitals that cannot
afford a full-time night radiologist.

61 of 118© 2008 Worth Publishers ▪ International Economics ▪ Feenstra/Taylor
The Future of US Comparative Advantage
• In many cases, the services being outsourced are
not directly competing for the daytime jobs, but
instead are complements to these U.S. jobs.
• Radiology is under no imminent threat from
outsourcing because the profession involves
decisions that cannot be codified in written rules.
• The recognition of patterns cannot be simply
passed onto another person or firm—work cannot
be outsourced.

62 of 118© 2008 Worth Publishers ▪ International Economics ▪ Feenstra/Taylor
The Future of US Comparative Advantage
• In every profession there will be jobs that cannot
be duplicated by someone who is not on-site.
• In many manufacturing industries, the U.S. is
likely to continue to maintain some activities like
R&D and marketing at home, even if a portion is
shifted abroad.
• Finally we should recognize that outsourcing
ultimately makes the U.S. companies involved
more profitable, and therefore able to withstand
foreign competition.
• This allows other activities to remain in the U.S.

63 of 118© 2008 Worth Publishers ▪ International Economics ▪ Feenstra/Taylor
Conclusions
• We have studied outsourcing, a type of trade that
is becoming more important.
Some production is shifted to another country while
some is kept at home.
• In our model of outsourcing, since unskilled labor
is relatively cheaper abroad, it makes sense for
Home to outsource the less skill-intensive
activities to the Foreign country while keeping the
more skill-intensive activities at Home.
64 of 118© 2008 Worth Publishers ▪ International Economics ▪ Feenstra/Taylor
Conclusions
• From both the Home and Foreign point of view,
the ratio of skilled to unskilled labor in value chain
activities goes up.
• A major conclusion is that an increase in
outsourcing will raise the relative demand (and
hence the relative wage) for skilled labor in both
countries.

65 of 118© 2008 Worth Publishers ▪ International Economics ▪ Feenstra/Taylor
Conclusions
• We concluded the chapter by exploring
outsourcing in service activities.
• The new type of outsourcing that is getting a lot of
media attention consists of higher skilled jobs
performed by college educated people in
countries like India.
• The fact that it is not only possible to shift these
activities to India, but economical to do so, shows
how new technologies make possible patterns of
international trade that would have been
unimaginable a decade ago.
66 of 118© 2008 Worth Publishers ▪ International Economics ▪ Feenstra/Taylor
Conclusions
• One likely prediction is that the activities in the
U.S. that cannot be codified in written rules and
procedures, and that benefit from face-to-face
contact as well as proximity to other highly-skilled
individuals in related industries, will continue to
have comparative advantages.