econ 385. intermediate macroeconomic theory ii. economic growth … · · 2014-09-05readings...
TRANSCRIPT

ECON 385. IntermediateMacroeconomic Theory II. Economic
Growth Facts
Instructor: Dmytro Hryshko
1 / 25
Outline
• Measures for standard of living• The importance of economic growth• Main long-run growth facts
2 / 25

Readings
Mankiw and Scarth, Chapter 7
Charles Jones, Introduction to EconomicGrowth, Chapter 1 (optional, non-technical,accessible intro into growth issues)
Acemoglu, Introduction to modern economicgrowth, Chapter 1 (optional, non-technical,accessible intro into growth issues)
3 / 25

Measures of Living Standards
• Normally, the focus on two statistics of theaverage person’s well-being: GDP per worker(productivity measure), and GDP per capita(welfare measure).
• They correlate with many other importantstatistics measuring well-being:
infant mortalitylife expectancyconsumption, etc.
4 / 25

.1.2 Income and Welfare 7
1.2 Income and Welfare
Should we care about cross-country income differences? The answer is definitely yes. High income levels reflect high standards of living. Economic growth sometimes increases pollution or may raise individual aspirations, so that the same bundle of consumption may no longer satisfy an individual. But at the end of the day, when one compares an advanced, rich country with a less-developed one, there are striking differences in the quality of life, standards of living, and health.
Figures 1.5 and 1.6 give a glimpse of these differences and depict the relationship between income per capita in 2000 and consumption per capita and life expectancy at birth in the same year. Consumption data also come from the Penn World tables, while data on life expectancy at birth are available from the World Bank Development Indicators.
These figures document that income per capita differences are strongly associated with differences in consumption and in health as measured by life expectancy. Recall also that these numbers refer to PPP-adjusted quantities; thus differences in consumption do not (at least in principle) reflect the differences in costs for the same bundle of consumption goods in different countries. The PPP adjustment corrects for these differences and attempts to measure the variation in real consumption. Thus the richest countries are not only producing more than 30 times as much as the poorest countries, but are also consuming 30 times as much. Similarly, cross-country differences in health are quite remarkable; while life expectancy at birth is as
Log consumption per capita, 2000
15
14
13
12
11
10
AFG
ALB
DZA
AGO
ATG
ARG
ARM
AUSAUT
AZE
BHS
BHR
BGD
BRB
BLR
BEL
BLZ
BEN
BMU
BTN
BOL BIH
BWA
BRA BRN
BGR
BFA
BDI
KHM
CMR
CAN
CPV
CAF
TCD
CHL
CHN
COL
COM
ZAR
COG
CRI
CIV
HRV
CUB
CYP
CZE
DNK
DJI DMA
DOM
ECU
EGYSLV
GNQ
ERI
EST
ETH
FJI
FIN
FRA
GAB
GMB
GEO
GER
GHA
GRC
GRD
GTM
GIN
GNB
GUYHTI HND
HKG
HUN
ISL
IND
IDN
IRN
IRQ
IRLISR
ITA
JAM
JPN
JOR
KAZ
KEN
KIR
PRK
KOR
KWT
KGZ
LAO
LVA
LBN
LSO
LBR
LBY LTU
LUX
MAC
MKD
MDGMWI
MYS
MDV
MLI
MLT
MRT
MUS
MEX
FSMMDA
MNG
MAR
MOZ
NAM
NPL
NLD
ANT
NZL
NIC
NER NGA
NOR
OMN
PAK
PLWPAN
PNG
PRY
PERPHL
POL
PRT PRI
QAT
ROM RUS
RWA
WSM
STP
SAU
SEN
SCG
SYC
SLE
SGP
SVK
SVN
SLB
SOM
ZAF
ESP
LKA
KNA
LCA
VCT
SDN
SUR
SW Z
SWE
CHE
SYR
TWN
TJK
TZA
THA
TGO
TON
TTO
TUN
TUR
TKM
UGA
UKR
AREGBR
USA
URY
UZB
VUT
VEN
VNM
YEM
ZMB
ZWE
6 7 8 9 10 11 Log GDP per capita, 2000
FIGURE 1.5 The association between income per capita and consumption per capita in 2000. For a definition of the abbreviations used in this and similar figures in the book, see http://unstats.un.org/unsd /methods/m49/m49alpha.htm.
Source: Acemoglu (2008). Introduction to Modern Economic Growth5 / 25

8 . Chapter 1 Economic Growth and Economic Development: The Questions
Life expectancy, 2000 (years)
AFG
AGO
ALB
ANT
ARE
ARG
ARM
AUS AUT
AZE
BDI
BEL
BEN
BFA
BGD
BGR
BHR
BHS
BIH
BLR
BLZ
BOL
BRA
BRB
BRN
BTN
BWA
CAF
CANCHE
CHL
CHN
CIV CMR
COG
COL
COM
CPV
CRICUB
CYP
CZE
DJI
DNK
DOM
DZA
ECU
EGY
ERI
ESP
EST
FIN
FJI
FRA
FSM
GAB
GBR
GEO
GHA
GIN GMB
GNB GNQ
GRC
GTM
GUY
HKG
HND
HRV
HTI
HUN
IDN
IND
IRL
IRN
IRQ
ISL ISRITA
JAM JOR
JPN
KAZ
KEN
KGZ
KHM
KOR
KWT
LAO
LBN
LBR
LBYLCALKA
LSO
LTU
LUX
LVA
MAC
MAR
MDA
MDG
MDV
MEX MKD
MLI
MLT
MNG
MOZ
MRT
MUS
MWI
MYS
NAM
NER NGA
NIC
NLD NOR
NPL
NZL
OMN
PAK
PAN
PERPHL
PNG
POL
PRI
PRK
PRT
PRY
QAT
ROM
RUS
RWA
SAU SCG
SDN SEN
SGP
SLB
SLE
SLV
SOM
STP
SUR
SVK
SVN
SWE
SW Z
SYR
TCD
TGO
THA
TJK
TKM
TON
TTO
TUN
TUR
TZA
UGA
UKR
URY
USA
UZB
VCT
VEN
VNM
VUTWSM
YEM
ZAF
ZMB
ZWE
ETH
GER
30
40
50
60
70
80
6 7 8 9 10 11 Log GDP per capita, 2000
FIGURE 1.6 The association between income per capita and life expectancy at birth in 2000.
high as 80 in the richest countries, it is only between 40 and 50 in many sub-Saharan African nations. These gaps represent huge welfare differences.
Understanding why some countries are so rich while some others are so poor is one of the most important, perhaps the most important, challenges facing social science. It is important both because these income differences have major welfare consequences and because a study of these striking differences will shed light on how the economies of different nations function and how they sometimes fail to function.
The emphasis on income differences across countries implies neither that income per capita can be used as a “sufficient statistic” for the welfare of the average citizen nor that it is the only feature that we should care about. As discussed in detail later, the efficiency properties of the market economy (such as the celebrated First Welfare Theorem or Adam Smith’s invisible hand) do not imply that there is no conflict among individuals or groups in society. Economic growth is generally good for welfare but it often creates winners and losers. Joseph Schumpeter’s famous notion of creative destruction emphasizes precisely this aspect of economic growth; productive relationships, firms, and sometimes individual livelihoods will be destroyed by the process of economic growth, because growth is brought about by the introduction of new technologies and creation of new firms, replacing existing firms and technologies. This process creates a natural social tension, even in a growing society. Another source of social tension related to growth (and development) is that, as emphasized by Simon Kuznets and discussed in detail in Part VII, growth and development are often accompanied by sweeping structural transformations, which can also destroy certain established relationships and create yet other winners and losers in the process. One of the important questions of
Source: Acemoglu (2008). Introduction to Modern Economic Growth6 / 25

What is Economic Growth?
Standard economists’ answer: growth in GDPper capita (or per worker), Y/L
Does growth in per capita GDP reflectanything important about the improvement ofliving standards?—No consideration, for example, of thedistribution of income within the economy(inequality)
7 / 25

Key Questions in Economic Growth
Why are there countries so rich and others sopoor?
Why do growth rates vary across countriesand over time?
What are the policies that can change growthin the short and long run?
Why do some countries “take off” whileothers fall behind
8 / 25

The importance of economic growth
For poor countries, income growth may reducepoverty. Example: Growth and poverty inIndonesia.
change in income change in # of pers.per capita living below
poverty line
1984–1996 +76% –25%1997–1999 –12% +65%
9 / 25

The importance of economic growth
For rich countries, if government policies or“shocks” have even a small impact on thelong-run growth rate, they will have a largeimpact on the standard of living in the long run
10 / 25
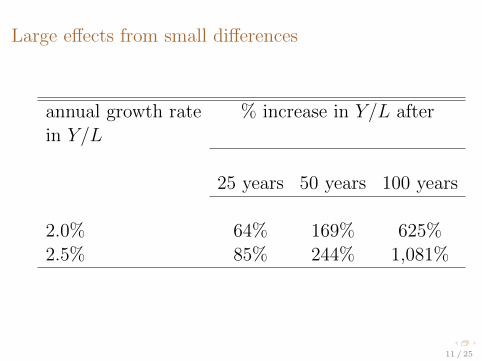
Large effects from small differences
annual growth rate % increase in Y/L afterin Y/L
25 years 50 years 100 years
2.0% 64% 169% 625%2.5% 85% 244% 1,081%
11 / 25

Growth Facts
Fact 1. There is enormous variation in incomes percapita across countries. The poorest countries have percapita incomes less than 5% of per capita incomes inthe richest countries. Table
Fact 2. Rates of economic growth vary substantiallyacross countries. Fig
Fact 3. Growth rates are not generally constant overtime. For the world as a whole, growth rates were closeto zero over most of history but have increased sharplyin the 20-th century. Fig
The same applies to individual countries. Countriescan move from being “poor” to being “rich” (e.g.,South Korea), and vice versa (e.g., Argentina). Fig
12 / 25
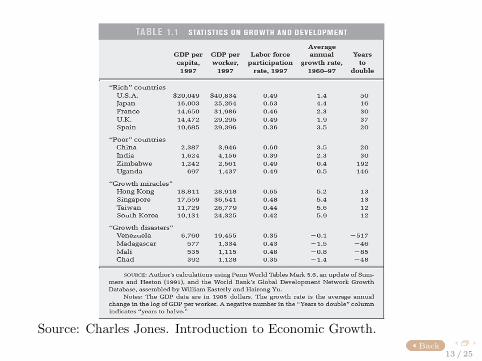
Source: Charles Jones. Introduction to Economic Growth.Back
13 / 25

1.4 Today’s Income Differences and World Economic Growth . 11
Log GDP per capita
United States
United Kingdom
Spain
Singapore
Brazil
South Korea
Botswana
Guatemala
Nigeria
India
7
8
9
10
11
1960 1970 1980 1990 2000
FIGURE 1.8 The evolution of income per capita in the United States, the United Kingdom, Spain, Singapore, Brazil, Guatemala, South Korea, Botswana, Nigeria, and India, 1960–2000.
40 years? Why did Spain grow relatively rapidly for about 20 years but then slow down? Why did Brazil and Guatemala stagnate during the 1980s? What is responsible for the disastrous growth performance of Nigeria?
1.4 Origins of Today’s Income Differences and World Economic Growth
The growth rate differences shown in Figures 1.7 and 1.8 are interesting in their own right and could also be, in principle, responsible for the large differences in income per capita we observe today. But are they? The answer is largely no. Figure 1.8 shows that in 1960 there was already a very large gap between the United States on the one hand and India and Nigeria on the other.
This pattern can be seen more easily in Figure 1.9, which plots log GDP per worker in 2000 versus log GDP per capita in 1960 (in both cases relative to the U.S. value) superimposed over the 45◦ line. Most observations are around the 45◦ line, indicating that the relative ranking of countries has changed little between 1960 and 2000. Thus the origins of the very large income differences across nations are not to be found in the postwar era. There are striking growth differences during the postwar era, but the evidence presented so far suggests that world income distribution has been more or less stable, with a slight tendency toward becoming more unequal.
Source: Acemoglu. Introduction to Modern Economic Growth.Back
14 / 25

Source: Charles Jones. Introduction to Economic Growth.Back
15 / 25

The Power of Growth Rates
Time to double (rule of 70): Assume that ytgrows at a constant rate g. Then
yt+1 = (1 + g)yt
yt+2 = (1 + g)yt+1 = (1 + g)(1 + g)yt = (1 + g)2yt
yt+3 = (1 + g)yt+2 = (1 + g)3yt...
yt+k = (1 + g)kyt, k ≥ 0
What is the time needed for yt to double? Findk∗ when
yt+k∗ = (1 + g)k∗yt = 2yt.
16 / 25
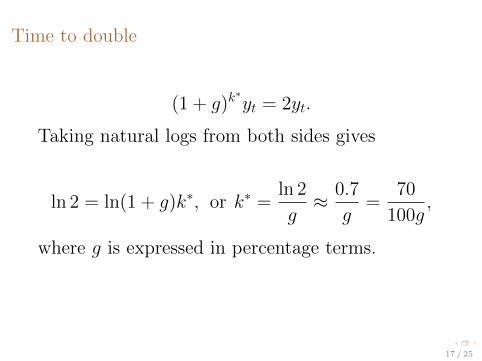
Time to double
(1 + g)k∗yt = 2yt.
Taking natural logs from both sides gives
ln 2 = ln(1 + g)k∗, or k∗ =ln 2
g≈ 0.7
g=
70
100g,
where g is expressed in percentage terms.
17 / 25
The Power of Growth Rates
Thus, if g = 0.02 (e.g., U.S.), GDP per capitawill double every 70/2=35 years
if g = 0.06 (e.g., South Korea)≈ every 12years.
If, e.g., the difference in age betweengrandparents and grandchildren is about 48years, Korean (future) grandchildren of thecurrent newly adult generation will be about24 = 16 times wealthier than the currentgeneration.
18 / 25

Kaldor Facts
For the U.S. over the last century:
1 The real interest rate shows no trend, up ordown. (In the classical model related toMPK = α Y
K .)2 The share of labor and capital costs in
income, although fluctuating, have no trend.Fig
3 The average growth rate in output per capitahas been relatively constant over time, i.e.,the U.S. is on a path of sustained growth ofincomes per capita. Fig
19 / 25

Back
20 / 25

Fig. 1.4
Source: Charles Jones. Introduction to Economic Growth.21 / 25

Questions About Growth
What determines growth? In particular,–How much capital accumulation accounts forgrowth? (“growth accounting”)–How important is technological progress?(“growth accounting”)
Why do countries grow at different rates?
What causes growth rates to decline?
22 / 25

Acemoglu’s questions in relation to Figure 1.8
“Why is the United States richer in 1960 thanother nations and able to grow at a steadypace thereafter?”
“How did Singapore, South Korea, andBotswana manage to grow at a relativelyrapid pace for 40 years?”
“Why did Spain grow relatively rapidly forabout 20 years but then slow down?”
“Why did Brazil and Guatemala stagnateduring the 1980s?”
“What is responsible for the disastrousgrowth performance of Nigeria?”
23 / 25

The Lessons of Growth Theory
understand why poor countries are poor
design policies that can help them grow
learn how the growth rates of rich countriesare affected by shocks and the governments’policies
24 / 25

Acemoglu. Introduction to Modern Economic Growth.
“Our starting point is the so-called Solow-Swanmodel named after Robert (Bob) Solow and TrevorSwan, or simply the Solow model, named after themore famous of the two economists. Theseeconomists published two pathbreaking articles inthe same year, 1956 (Solow, 1956; Swan, 1956)introducing the Solow model. Bob Solow laterdeveloped many implications and applications ofthis model and was awarded the Nobel prize ineconomics for his contributions. This model hasshaped the way we approach not only economicgrowth but also the entire field of macroeconomics.Consequently, a by-product of our analysis . . . is adetailed exposition of a workhorse model ofmacroeconomics.”
25 / 25