econ. 364x
DESCRIPTION
Econ. 364X. Definition of a farm Iowa land values Farmland ownership Farmland rental Land return Costs of production Other sources of information for appraisal. What is a farm?. Farmland Value. Farmland Ownership. Farmland Rent. Farmland Returns. Costs of Production. - PowerPoint PPT PresentationTRANSCRIPT

Econ. 364X
• Definition of a farm• Iowa land values• Farmland ownership• Farmland rental• Land return• Costs of production• Other sources of information for appraisal
What is a farm?
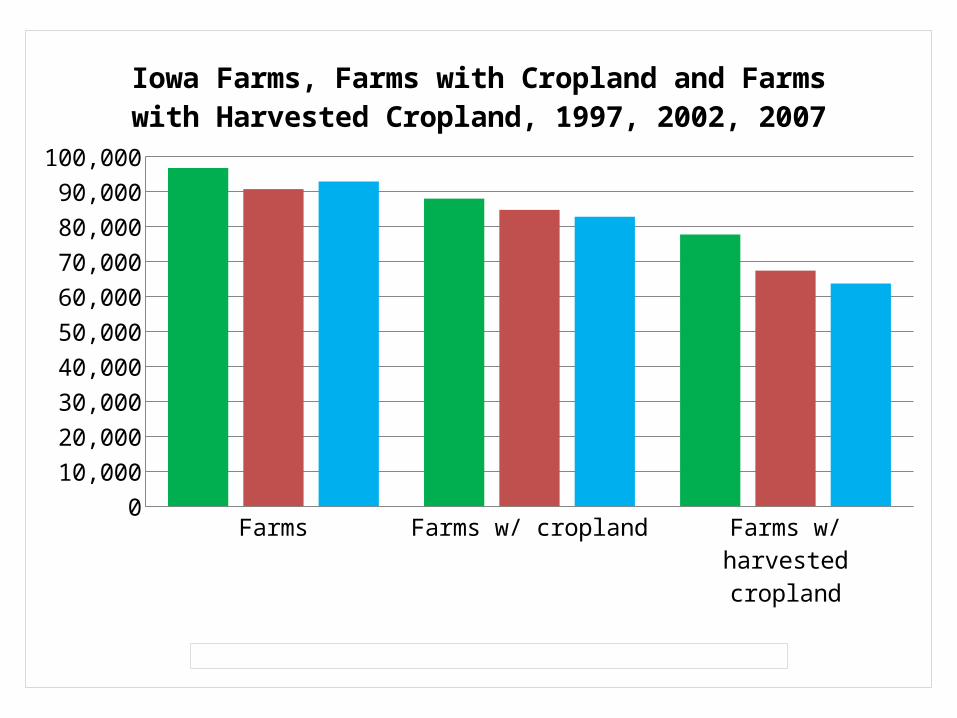
Farms Farms w/ cropland Farms w/ harvested cropland0
10,000
20,000
30,000
40,000
50,000
60,000
70,000
80,000
90,000
100,000
Iowa Farms, Farms with Cropland and Farms with Harvested Cropland, 1997, 2002, 2007
1997 2002 2007

Farms and Sales by Sales Class in Iowa, 2007
0%
5%
10%
15%
20%
25%
30%
35%
40%
45%
50%
Less than$1,000
$1,000 to$2,499
$2,500 to$4,999
$5,000 to$9,999
$10,000 to$24,999
$25,000 to$49,999
$50,000 to$99,999
$100,000to
$249,999
$250,000to
$499,999
$500,000to
$999,999
$1,000,000or more
Farms Sales
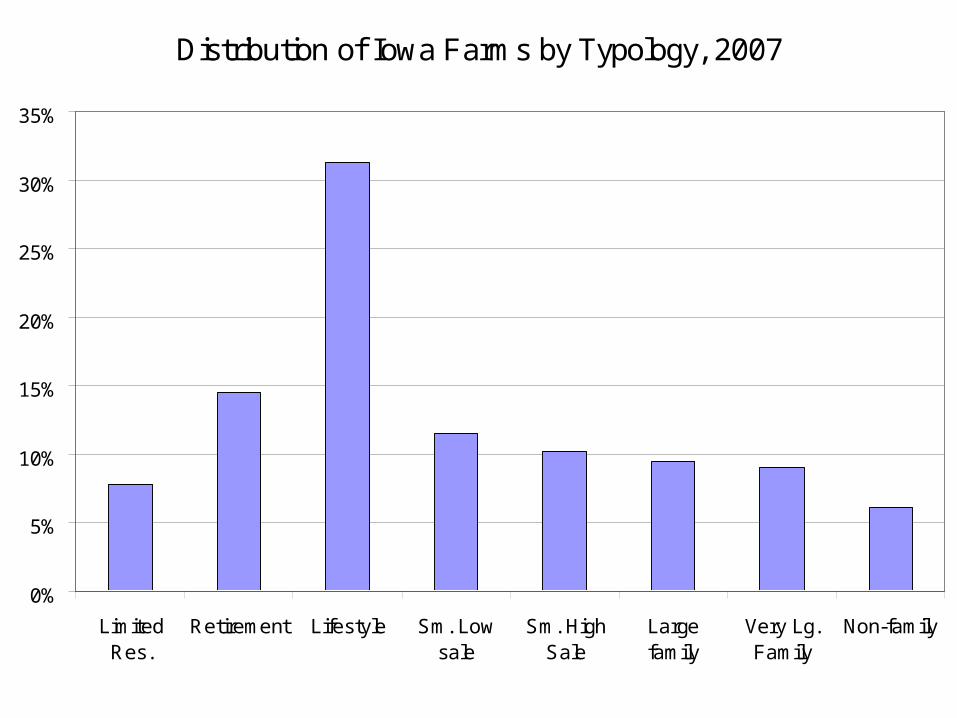
Distribution of Iowa Farms by Typology, 2007
0%
5%
10%
15%
20%
25%
30%
35%
LimitedRes.
Retirement Lifestyle Sm. Lowsale
Sm. HighSale
Largefamily
Very Lg.Family
Non-family
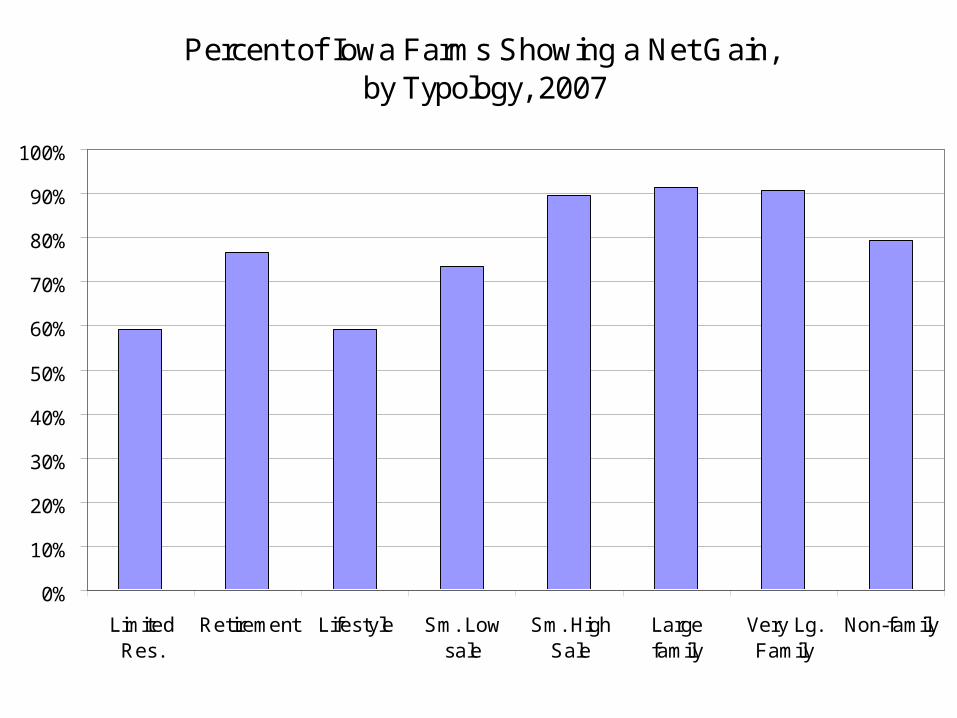
Percent of Iowa Farms Showing a Net Gain, by Typology, 2007
0%
10%
20%
30%
40%
50%
60%
70%
80%
90%
100%
LimitedRes.
Retirement Lifestyle Sm. Lowsale
Sm. HighSale
Largefamily
Very Lg.Family
Non-family
Farmland Value

1950
1953
1956
1959
1962
1965
1968
1971
1974
1977
1980
1983
1986
1989
1992
1995
1998
2001
2004
2007
$0
$500
$1,000
$1,500
$2,000
$2,500
$3,000
$3,500
$4,000
$4,500
Iowa Average Land Values
1950
1953
1956
1959
1962
1965
1968
1971
1974
1977
1980
1983
1986
1989
1992
1995
1998
2001
2004
2007
$0
$1,000
$2,000
$3,000
$4,000
$5,000
$6,000
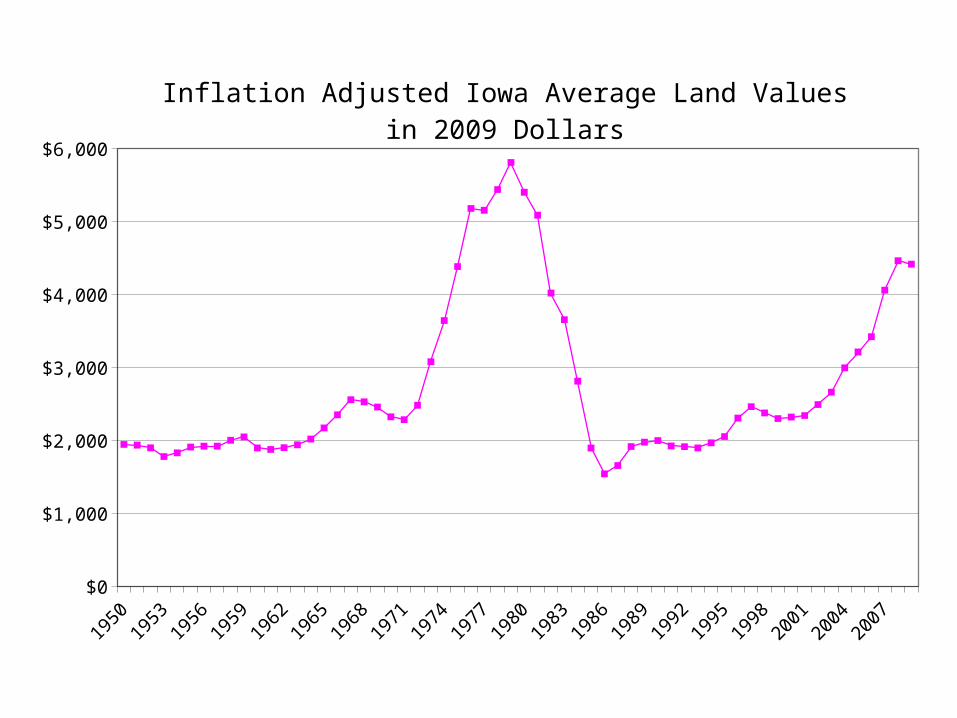
Inflation Adjusted Iowa Average Land Values in 2009 Dol-lars

1850
1880
1910
1930
1945
1952
1955
1958
1961
1964
1967
1970
1973
1976
1979
1982
1985
1988
1991
1994
1997
2000
2003
2006
2009
$0
$1,000
$2,000
$3,000
$4,000
$5,000
$6,000
Iowa Land Values in 2009 Dollars
Year

Farmland Ownership
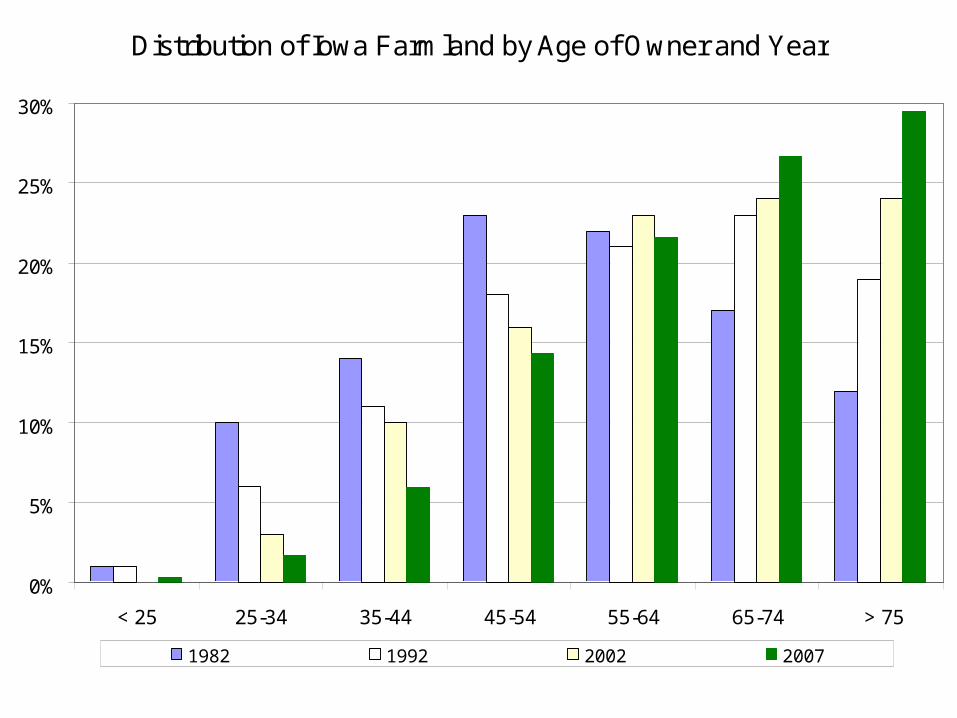
Distribution of Iowa Farmland by Age of Owner and Year
0%
5%
10%
15%
20%
25%
30%
< 25 25-34 35-44 45-54 55-64 65-74 > 75
1982 1992 2002 2007
1910 1920 1930 1940 1950 1960 1970 1980 1990 2000 20070%
10%
20%
30%
40%
50%
60%
0
10
20
30
40
50
60
70
80
90
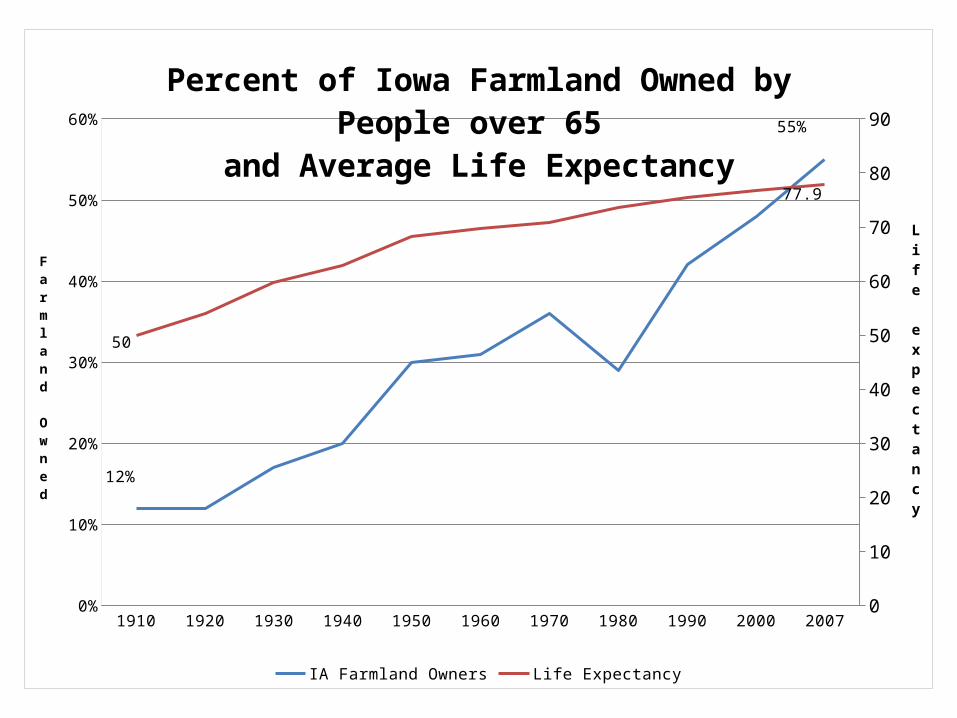
12%
55%
50
77.9
Percent of Iowa Farmland Owned by People over 65 and Average Life Expectancy
IA Farmland Owners Life Expectancy
Far
mland Owned
Life expectancy

Spouses SO - Male SO - Female Multiple0%
10%
20%
30%
40%
50%
60%
70%
80%
Percent of Total Acres Owned and Percent of Category Rented
Percent of Acres Owned Percent of Owned Rented

Percent of Iowa Farmland by Residence of Owner
0%
10%
20%
30%
40%
50%
60%
70%
80%
90%
100%
Iowa Resident Non-Iowa Resident
1982 1992 2002 2007
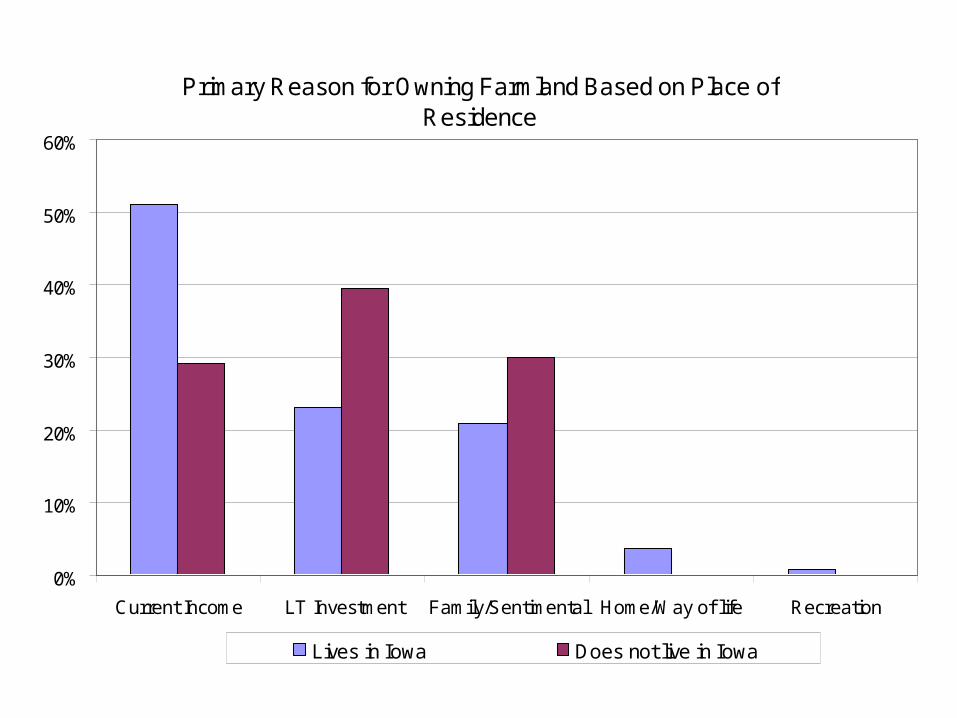
Primary Reason for Owning Farmland Based on Place of Residence
0%
10%
20%
30%
40%
50%
60%
Current Income LT Investment Family/Sentimental Home/Way of life Recreation
Lives in Iowa Does not live in Iowa
Farmland Rent

19501952
19541956
19581960
19621964
19661968
19701972
19741976
19781980
19821984
19861988
19901992
19941996
19982000
20022004
20062008
$0
$500
$1,000
$1,500
$2,000
$2,500
$3,000
$3,500
$4,000
$4,500
$5,000
$0
$20
$40
$60
$80
$100
$120
$140
$160
$180
$200
Iowa Land Values and Rents
Land value Rent
Land Values
Cash Rent
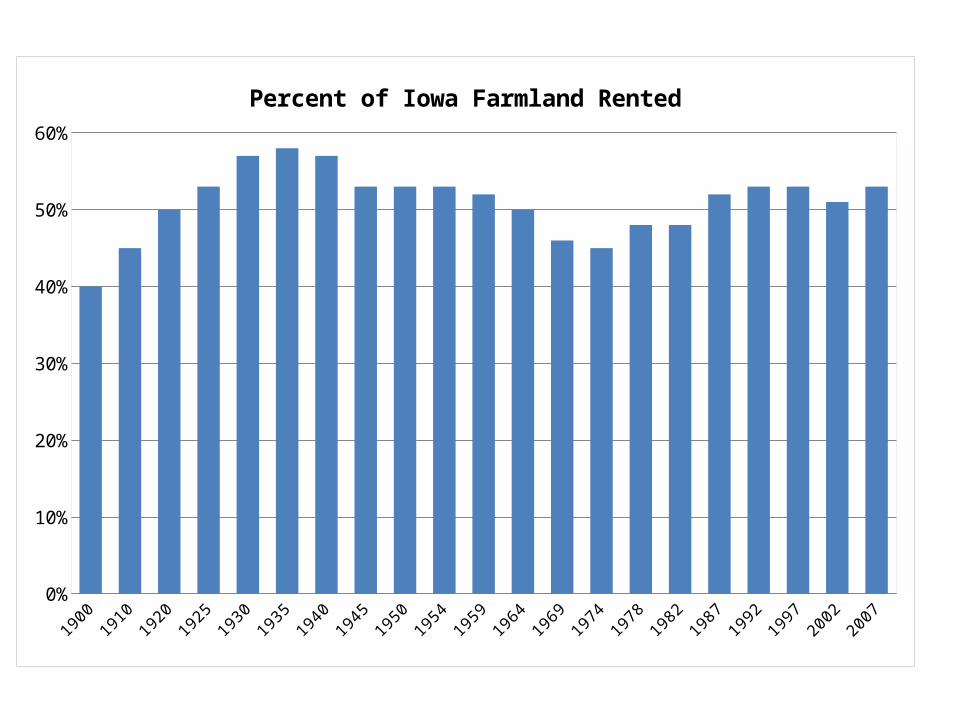
1900 1910 1920 1925 1930 1935 1940 1945 1950 1954 1959 1964 1969 1974 1978 1982 1987 1992 1997 2002 20070%
10%
20%
30%
40%
50%
60%
Percent of Iowa Farmland Rented

Total <25 25-34 35-44 45-54 55-64 >650%
10%
20%
30%
40%
50%
60%
70%
80%
90%
Percent of Acres Owned and Rented by Age Category, Iowa, 2007
Owned Rented

Percent of Farms and Land by Tenure Status
0%
10%
20%
30%
40%
50%
60%
70%
Full Owner Part Owner Tenant
Farms Land

0 1-25% 26-50% 51-75% 76-99% 100%0%
10%
20%
30%
40%
50%
60%
Percent of Farms and Cropland by Percent of Land Rented, 2007
Farms Cropland
Percent of Acres Rented

Farmland Returns
1950
1953
1956
1959
1962
1965
1968
1971
1974
1977
1980
1983
1986
1989
1992
1995
1998
2001
2004
2007
0.0%
2.0%
4.0%
6.0%
8.0%
10.0%
12.0%
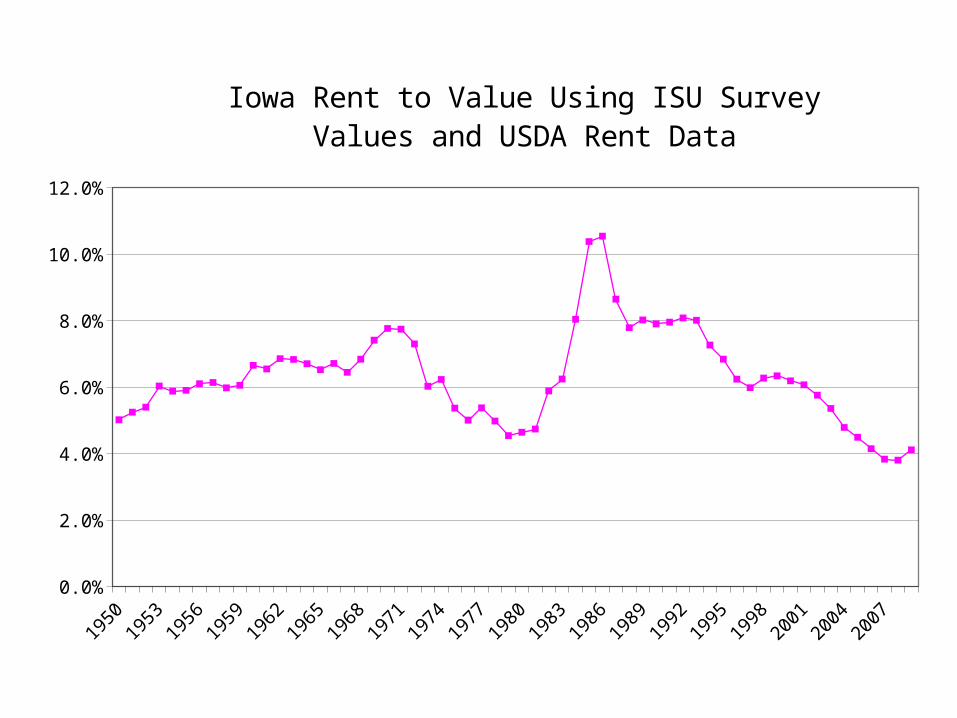
Iowa Rent to Value Using ISU Survey Values and USDA Rent Data

1989
1990
1991
1992
1993
1994
1995
1996
1997
1998
1999
2000
2001
2002
2003
2004
2005
2006
2007
2008
2009
0%
10%
20%
30%
40%
50%
60%
70%
80%
90%
Purchasers of Iowa Farmland by Year
Existing Farmers Investors New Farmers New Other
18671872187718821887189218971902190719121917192219271932193719421947195219571962196719721977198219871992199720022007$0.00
$0.50
$1.00
$1.50
$2.00
$2.50
$3.00
$3.50
$4.00
$4.50
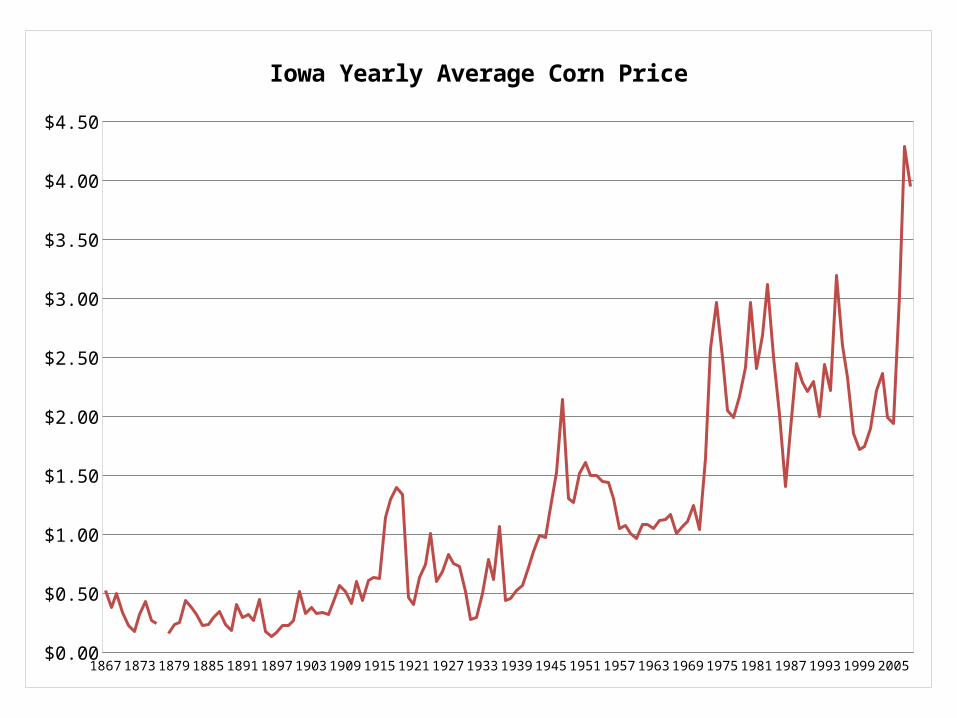
Iowa Yearly Average Corn Price

19241926
19281930
19321934
19361938
19401942
19441946
19481950
19521954
19561958
19601962
19641966
19681970
19721974
19761978
19801982
19841986
19881990
19921994
19961998
20002002
20042006
2008$0.00
$2.00
$4.00
$6.00
$8.00
$10.00
Iowa Average Soybean Price
J F M A M J J A S O N D J F M A M J J A S O N D J F M A M J J A S O N D J F M A M J J A S O N D*2006 2007 2008 2009
$0.00
$1.00
$2.00
$3.00
$4.00
$5.00
$6.00
$0.00
$2.00
$4.00
$6.00
$8.00
$10.00
$12.00
$14.00
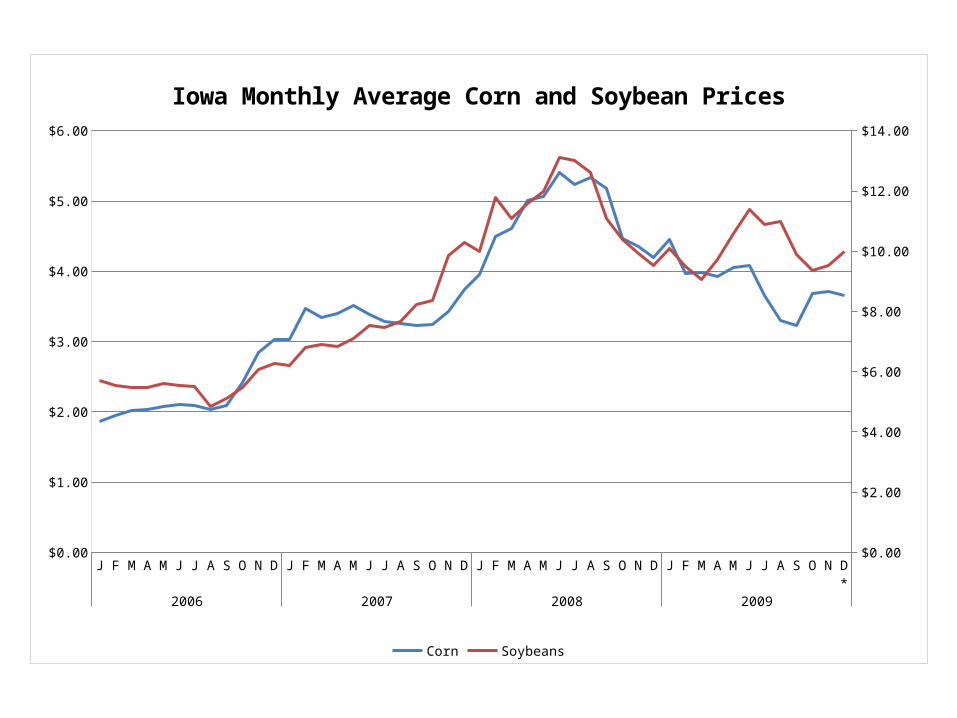
Iowa Monthly Average Corn and Soybean Prices
Corn Soybeans

Costs of Production

Machinery19%
Seed, Chemicals, etc.47%
Labor5%
Land29%
Distribution of Estimated Costs of Production for Continuous Corn, 2010

Machinery20%
Seed, Chemicals, etc.45%
Labor5%
Land31%
Distribution of Estimated Costs of Production for Corn Following Soybeans, 2010

Machinery13%
Seed, Chemicals, etc.37%
Labor6%
Land44%
Distribution of Estimated Costs of Production for Soybeans, 2010

19721974
19761978
19801982
19841986
19881990
19921994
19961998
20002002
20042006
20082010
$0
$50
$100
$150
$200
$250
$300
$350
$400
$450
$500
$550
$600
$650
$700
$750
Estimated Total Costs of Production per Acre for Corn

19721974
19761978
19801982
19841986
19881990
19921994
19961998
20002002
20042006
20082010
$0.00
$0.50
$1.00
$1.50
$2.00
$2.50
$3.00
$3.50
$4.00
$4.50
$5.00
Estimated Costs of Producing Corn per Bushel

1984
1986
1988
1990
1992
1994
1996
1998
2000
2002
2004
2006
2008
2010
**$0
$20
$40
$60
$80
$100
$120
Corn Seed Costs per Acre
Estimated Cost, ISU Actual Costs FBA
1984
1986
1988
1990
1992
1994
1996
1998
2000
2002
2004
2006
2008
2010
**$0
$10
$20
$30
$40
$50
$60
$70
$80
$90
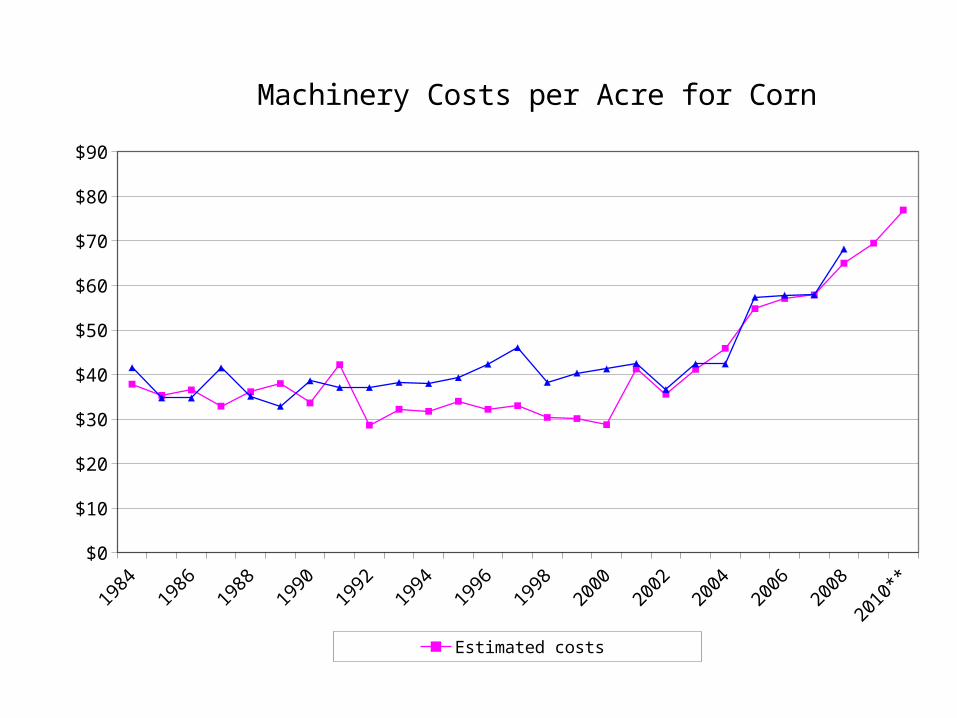
Machinery Costs per Acre for Corn
Estimated costs Actual costs FBA

1984
1986
1988
1990
1992
1994
1996
1998
2000
2002
2004
2006
2008
2010
**$0
$20
$40
$60
$80
$100
$120
$140
$160
$180
$200
Fertilizer and Lime Costs per Acre
Estimated costs Actual costs FBA
1984
1985
1986
1987
1988
1989
1990
1991
1992
1993
1994
1995
1996
1997
1998
1999
2000
2001
2002
2003
2004
2005
2006
2007
2008
2009
2010
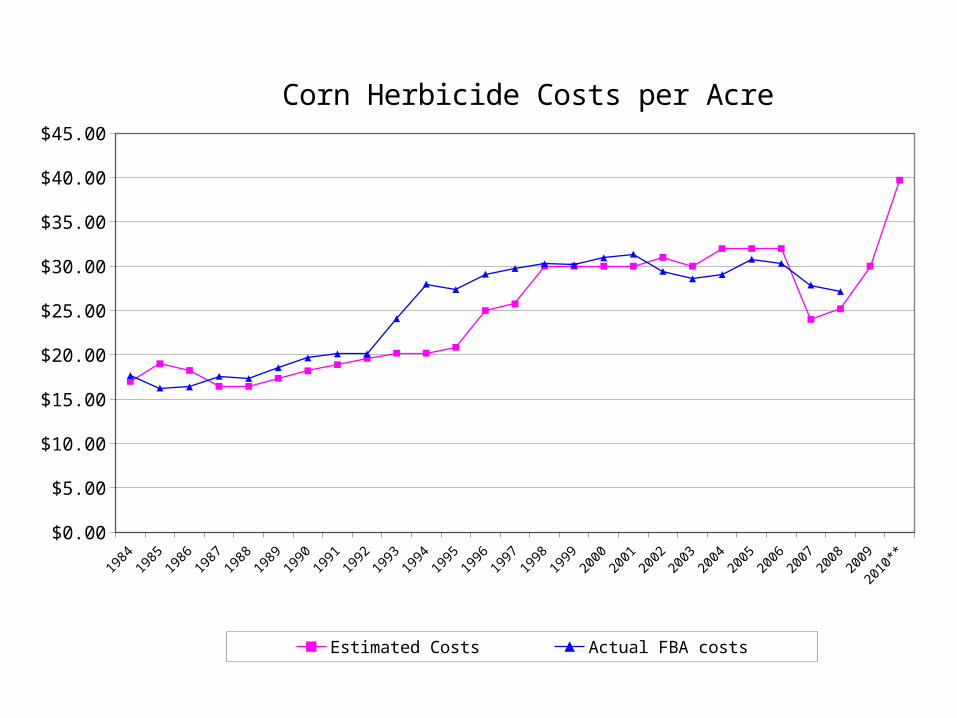
**$0.00
$5.00
$10.00
$15.00
$20.00
$25.00
$30.00
$35.00
$40.00
$45.00
Corn Herbicide Costs per Acre
Estimated Costs Actual FBA costs
19721974
19761978
19801982
19841986
19881990
19921994
19961998
20002002
20042006
20082010
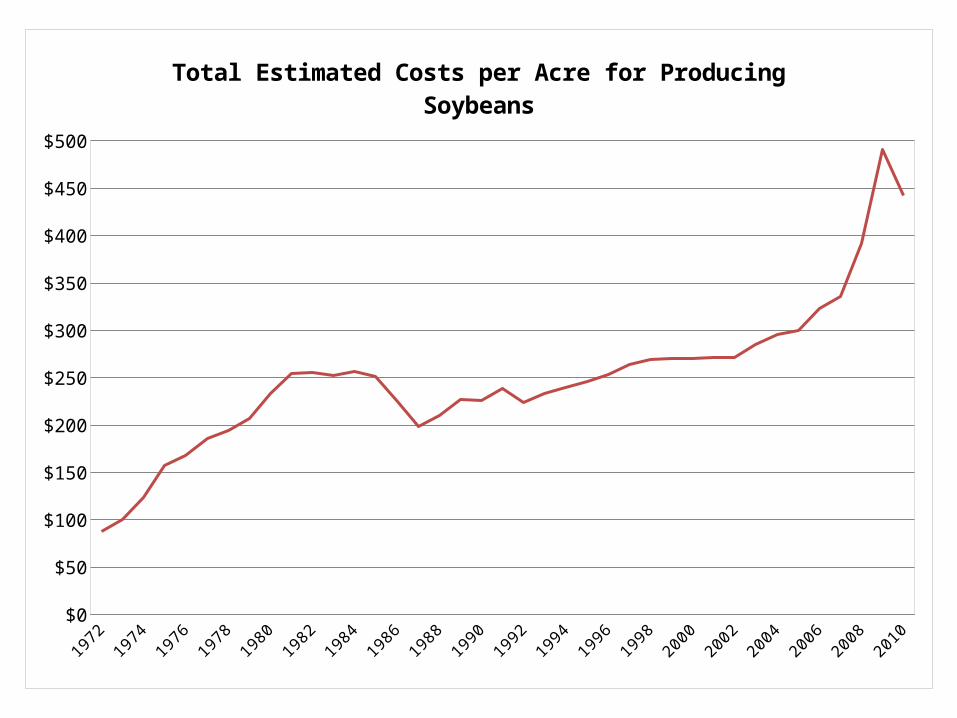
$0
$50
$100
$150
$200
$250
$300
$350
$400
$450
$500
Total Estimated Costs per Acre for Producing Soybeans
19721974
19761978
19801982
19841986
19881990
19921994
19961998
20002002
20042006
20082010
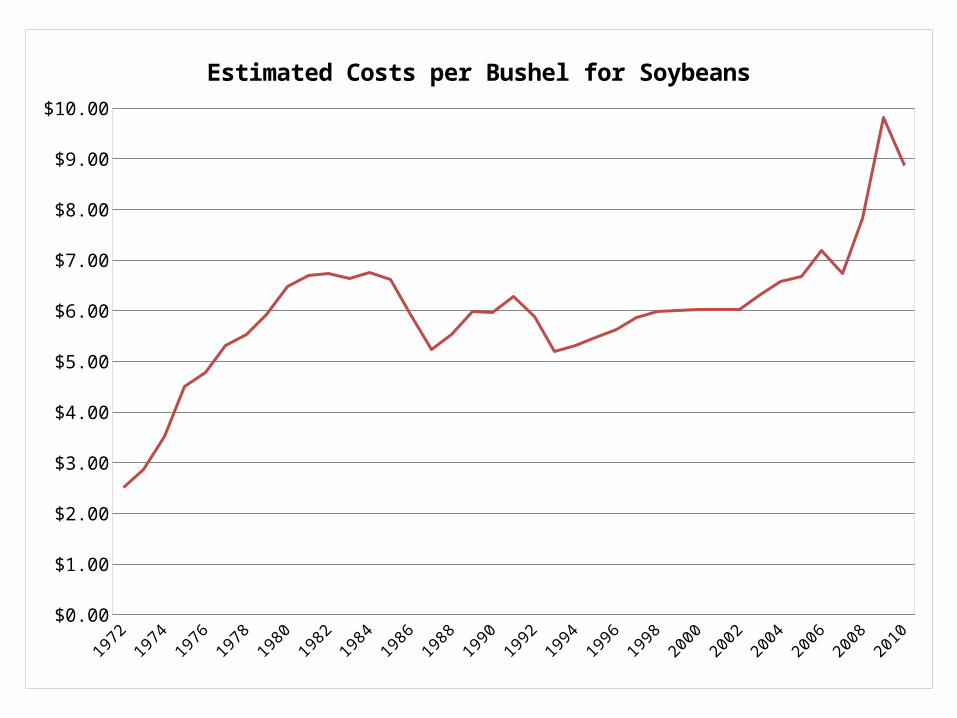
$0.00
$1.00
$2.00
$3.00
$4.00
$5.00
$6.00
$7.00
$8.00
$9.00
$10.00
Estimated Costs per Bushel for Soybeans
1984
1986
1988
1990
1992
1994
1996
1998
2000
2002
2004
2006
2008
2010
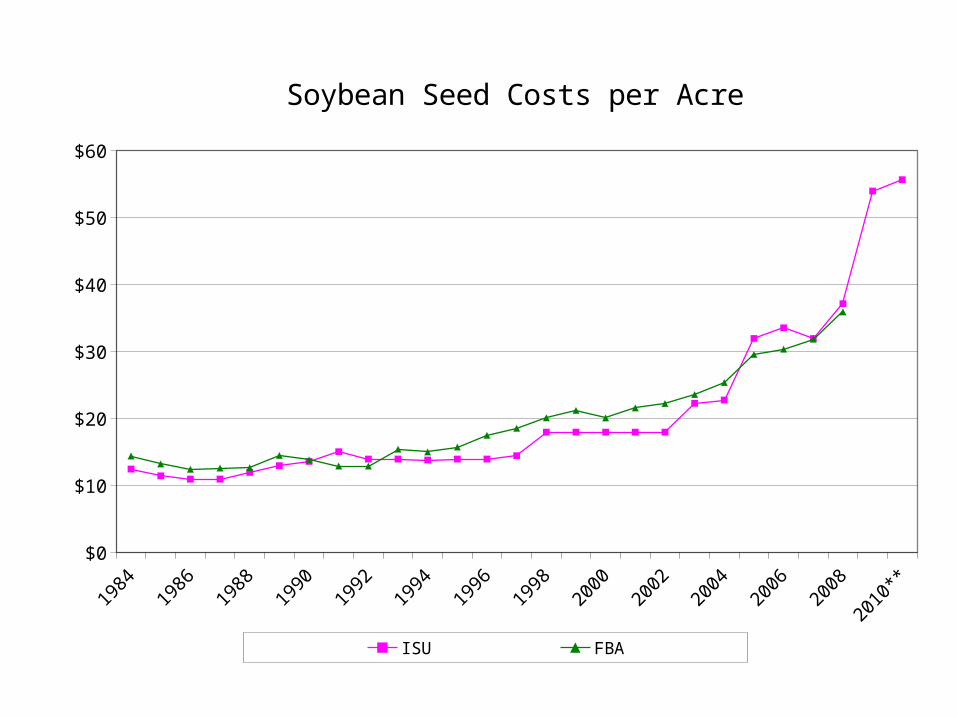
**$0
$10
$20
$30
$40
$50
$60
Soybean Seed Costs per Acre
ISU FBA
1984
1986
1988
1990
1992
1994
1996
1998
2000
2002
2004
2006
2008
2010
**$0.00
$5.00
$10.00
$15.00
$20.00
$25.00
$30.00
$35.00
$40.00
$45.00
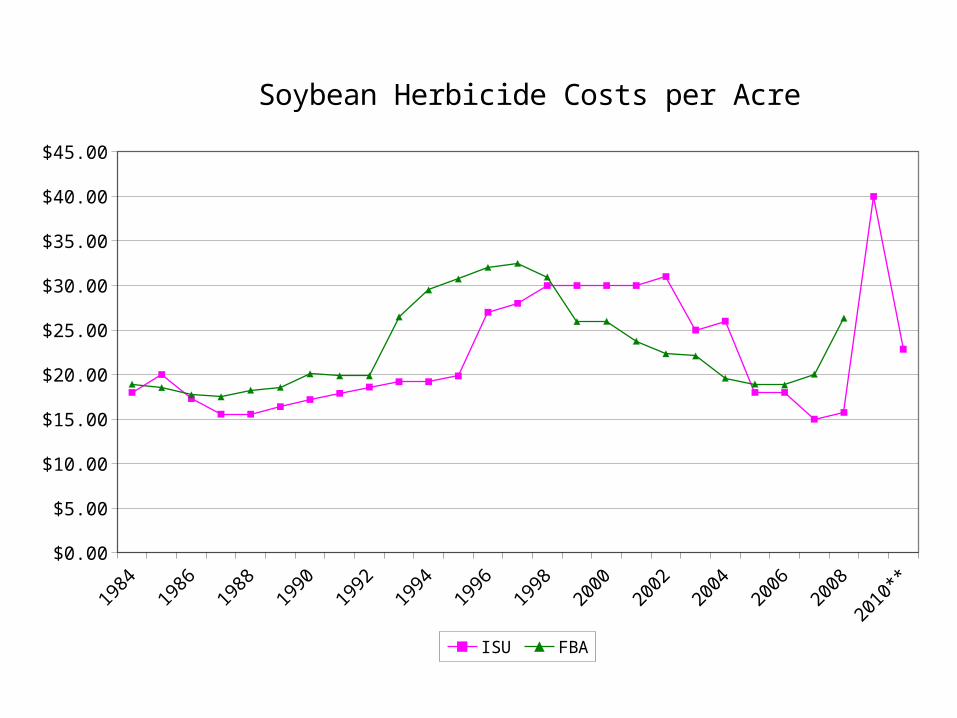
Soybean Herbicide Costs per Acre
ISU FBA
19721974
19761978
19801982
19841986
19881990
19921994
19961998
20002002
20042006
2008
-$1.50
-$1.00
-$0.50
$0.00
$0.50
$1.00
$1.50
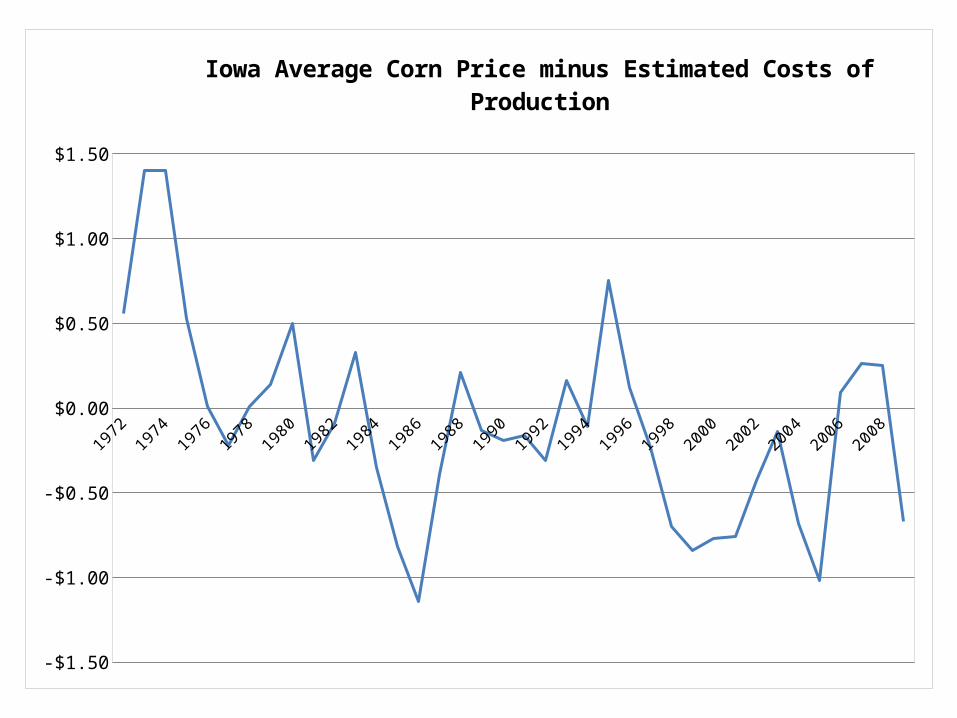
Iowa Average Corn Price minus Estimated Costs of Production
19721974
19761978
19801982
19841986
19881990
19921994
19961998
20002002
20042006
2008
-$2.00
-$1.00
$0.00
$1.00
$2.00
$3.00
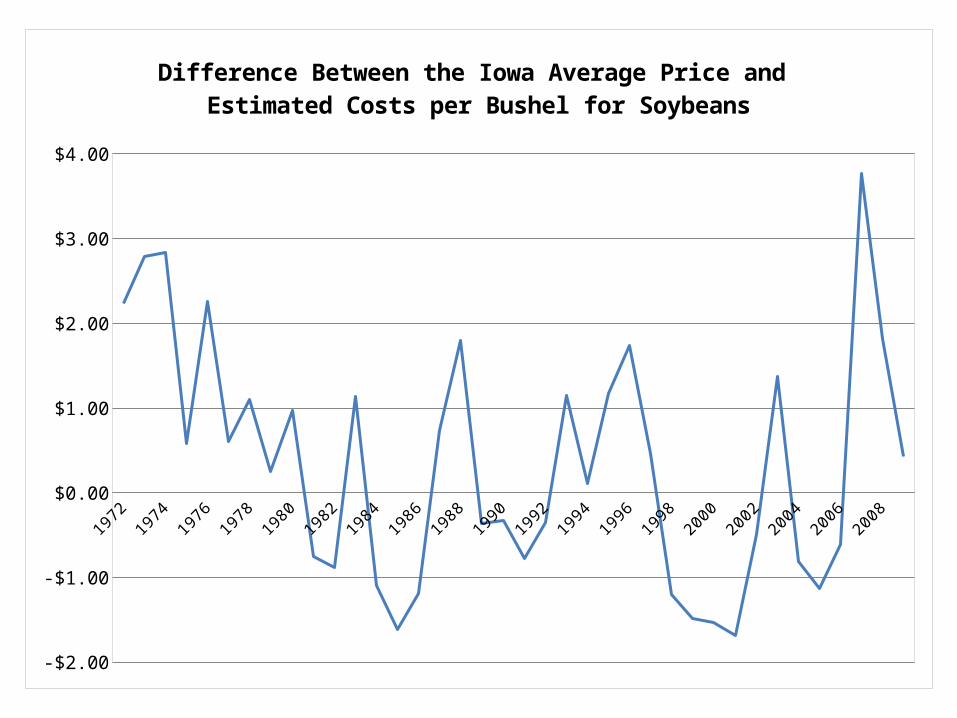
$4.00
Difference Between the Iowa Average Price and Estimated Costs per Bushel for Soybeans