ecology and development series no. 65, 2009 - zef.de · de uso da terra e o de “biodiversidade...
TRANSCRIPT

Ecology and Development Series No. 65, 2009
Editor-in-Chief: Paul L.G.Vlek
Editors:
Manfred Denich Christopher Martius Ahmad Manschadi Nick van de Giesen
Daniel Callo-Concha
An approach to environmental services assessment: functional biodiversity in tropical agroforestry systems
(The case of Tomé-Açú, Northern Brazil)

ABSTRACT Agriculture is one of the main sources of income in developing countries and at the same time one of the major drivers causing environmental conflicts like loss of biodiversity. Agroforestry, which combines agricultural with forestry components at plot, community and landscape level, through a component-specific management can satisfy a series of multiple demands, among them, biodiversity conservation and in general the provision of environmental services.
Since environmental services are proposed as alternative compensation schemes to prevent and remediate negative environmental impacts, incentives that support ecologically sound agricultural management practices are therefore needed. These incentives (e.g., compensation payments) have to be based on an adequate understanding and evaluation of the services provided by the agricultural systems.
For this purpose, the concept of biodiversity in land-use systems has been revised. ‘Functional biodiversity’, in contrast to traditional approaches, emphasizes the system’s dynamics at various levels and the implications of these on its functioning as a whole. To operationalize such a concept, an assessment protocol based on multicriteria analysis has been developed. The approach combines productive, ecological and operational indicators to describe functional biodiversity, and aims at the identification of those management decisions and interventions that support this.
The suitability of the evaluation protocol was tested with 70 farms in the Brazilian Amazon region divided in three groups, which had been defined based on the time of settlement, property size, technological know-how, organization and access to market, i.e., 'CAMTA partners' long-ago established farmers, 'immigrated' some time ago and recently immigrated farmers 'newcomers'.
The analyses reveal that the most relevant factors supporting functional biodiversity in agroforestry systems are: (1) the farmers' technical qualification, (2) their preference for low impact techniques, (3) their capacity to adapt to environmental, social and political changes, (4) the diversification of species composition at plot level, (5) the increase in the use of perennial species; and (6) the financial profitability of the system. Concerning the differences among groups, the ‘CAMTA partners’ farmers are significantly superior to the two other groups only in agricultural practices related to production.
As the functional biodiversity concept is based on an integrative approach, its outputs provide a supportive platform for the proposed assessment framework. In turn, the developed protocol can be used to optimize biodiversity roles on farms and support decisions regarding compensation payments. Nevertheless, its further validation, testing and adaptation as a monitoring tool are necessary.
KURZFASSUNG
Die Bewertung von Umweltserviceleistungen: funktionale Biodiversität in tropischen Agroforstsystemen (Das Beispiel Tomé-Açú, Nordbrasilien) Landwirtschaft ist eine der Haupteinnahmequellen in den Entwicklungsländern und gleichzeitig einer der größten Verursacher von Umweltkonflikten wie z. B. Biodiversitätsverlust. Agroforstwirtschaft, die landwirtschaftliche und forstliche Komponenten auf Feld-, Gemeinde- und Landschaftsebene verbindet, kann durch flächenspezifisches Management vielfältige Anforderungen erfüllen, unter anderem den Erhalt von Biodiversität und ganz allgemein die Bereitstellung von Umweltdienstleistungen.
Da Umweltdienstleistungen dazu beitragen können, Umweltprobleme zu verhindern oder zu lösen, sind Anreize notwendig, die ein ökologisch sinnvolles Landmanagement unterstützen. Diese Anreize (z.B. Ausgleichszahlungen) müssen sich auf eine fundierte Kenntnis und auf die Bewertung der Umweltleistungen von Landnutzungssystemen stützen.
In der vorliegenden Arbeit wurde ein Konzept erarbeitet, das auf der funktionellen Rolle der Biodiversität in Landnutzungssystemen basiert. ‘Funktionelle Biodiversität’, im Gegensatz zu traditionellen Ansätzen, betrachtet auf verschiedenen Ebenen die Dynamik des Systems sowie deren Auswirkungen auf das Funktionieren des Systems als Ganzes. Als wesentlicher Bestandteil des Konzeptes wurde auf der Grundlage einer 'Multicriteria Analysis' ein Bewertungsprotokoll entwickelt. Dieser Ansatz verbindet produktive, ökologische und operationale Indikatoren mit dem Ziel, funktionelle Biodiversität zu beschreiben und Managemententscheidungen und -eingriffe zu ermitteln, die diese unterstützen.
Die Eignung des Bewertungsprotokolls wurde auf 70 Farmen in der brasilianischen Amazonasregion überprüft. Die Farmen wurden in folgende drei Gruppen eingeteilt: (1) Zeitpunkt der Niederlassung des Farmers, (2) Größe der Farm, und (3) technologisches Know-how, Organisation und Zugang zum Markt. Die untersuchten Farmen gehörten Farmern, die sich (1) vor Jahrzehnten ('CAMTA Partner'), (2) vor längerem ('immigrated'), und (3) vor kurzem niedergelassen hatten ('newcomers').
Die Analysen ergaben, dass (1) die technische Qualifikation der Farmer, (2) minimale Bodenbearbeitung, (3) die Fähigkeit der Farmer, sich an ökologische, gesellschaftliche und politische Veränderungen anzupassen, (4) die Artendiversifizierung auf der Fläche, (5) der verstärkte Einsatz von mehrjährigen Arten, und (6) die Wirtschaftlichkeit des Systems zur Aufrechterhaltung der funktionellen Biodiversität in agroforstlichen Systemen beitragen. Hinsichtlich der Unterschiede zwischen den Gruppen, heben sich die lang etablierten Farmer ('CAMTA Partner') signifikant von den anderen beiden Gruppen nur in den produktionsspezifischen landwirtschaftlichen Aktivitäten ab.
Da das Konzept der funktionellen Biodiversität auf einem integrativen Ansatz beruht, liefern die Ergebnisse eine Grundlage für den vorgeschlagenen Bewertungsrahmen. Das entwickelte Protokoll kann zur Optimierung der Rolle der Biodiversität auf der Farm und als Entscheidungshilfe hinsichtlich Ausgleichszahlungen eingesetzt werden. Weitere Validierungen und Anpassungen als Monitoringinstrument sind notwendig.
RESUMO Uma abordagem para a avaliação de serviços ambientais: biodiversidade funcional em sistemas agroflorestais tropicais (o caso de Tomé-Açú, Norte do Brasil) A agricultura é uma das fontes principais de renda em países em desenvolvimento e ao mesmo tempo uma das maiores causas de prejuízo ambiental, como no caso da perda da biodiversidade. A agrofloresteria ao combinar componentes agrícolas e florestais a níveis de parcela, comunidade e paisagem, pode a través dum manejo específico de cada componente pode satisfazer múltiplas demandas, tais como a conservação da biodiversidade e em geral a provisão de serviços ambientais.
Para se possibilitar os serviços ambientais, propostos como mecanismos pra prever e remediar os danos ambientais, precisam de incentivos que promovam praticas agrícolas ecologicamente amigáveis. Estes incentivos (por exemplo os pagos compensatórios) devem se basear na adequada compreensão e na avaliação dos serviços providos pelos sistemas agrícolas.
Com tal propósito, tem se revisado o conceito de biodiversidade em sistemas de uso da terra e o de “biodiversidade funcional” o que, ao contrario das abordagens tradicionais enfatiza na dinâmica do sistema em vários níveis e as implicações das partes no funcionamento do conjunto. Para operacionalizar tal conceito foi desenvolvido um protocolo de avaliação baseado em análise multicritério, que combina indicadores produtivos, ecológicos e operacionais objetivando descrever biodiversidade funcional, e identificar as decisões de manejo e intervenções que a promovam.
O protocolo de avaliação foi testado em 70 propriedades agrícolas da Amazônia brasileira, divididas em três grupos tendo como critérios o tempo de estabelecimento, tamanho da propriedade, capacidade técnica, nível de organização e acesso ao mercado. Assim foram definidos os grupos: (‘CAMTA partners’) primeiros colonizadores, (‘immigrated’) imigrados ha tempo e os recentemente imigrados (‘newcomers’).
As análises revelam que os fatores mais determinantes da biodiversidade funcional em sistemas agroflorestais são: (1) a capacidade técnica dos agricultores, (2) a sua preferência pelas técnicas de baixo impacto, (3) a sua capacidade para se adaptar as mudanças ambientais, sociais e políticas, (4) a diversidade de espécies ao nível de parcela, (5) o aumento no uso de espécies perenes; e (6) a rentabilidade do sistema. Com respeito às diferenças entre grupos, 'CAMTA partners' é significativamente superior aos outros dois grupos apenas no que tange às práticas agrícolas produtivas.
Ao ser conceituada a biodiversidade funcional numa abordagem integral, ela fornece uma base para o protocolo de avaliação sugerido. Por sua vez, o protocolo pode ser utilizado para otimizar as atividades e decisões de manejo concernentes aos pagamentos compensatórios. Apesar disso, a sua validação avaliação e adaptação como ferramenta de monitoramento são necessárias.

RESUMEN Un enfoque para la evaluación de los servicios ambientales: biodiversidad funcional en sistemas agroforestales tropicales (el caso de Tomé-Açú, norte de Brasil) La agricultura es una de las principales fuentes de ingreso en los países en vías de desarrollo y al mismo tiempo una de las mayores causas del daño ambiental, como, p.ej., la pérdida de biodiversidad. La agroforestería al combinar componentes agrícolas y forestales a niveles de parcela, comunidad y paisaje, puede, a través de un manejo específico de componentes, satisfacer múltiples demandas, entre ellas la conservación de la biodiversidad y en general la provisión de servicios ambientales.
Dado que los servicios ambientales son propuestos como esquemas para prevenir y remediar los perjuicios ambientales, se requieren incentivos que promuevan prácticas ecológicamente amigables. Tales incentivos (p.ej., pagos compensatorios) deben basarse en un adecuado entendimiento y evaluación de los servicios prestados por los sistemas agrícolas.
Con tal propósito, se ha revisado el concepto de biodiversidad en sistemas de uso de la tierra y sugerido el de “biodiversidad funcional” que, a diferencia de los enfoques tradicionales, enfatiza en la dinámica del sistema a varios niveles y en las implicaciones de las partes en el funcionamiento del conjunto. Para operativizar tal concepto se desarrolló un protocolo de evaluación basado en análisis multicriterio, que combina indicadores productivos, ecológicos y operativos para describir la biodiversidad funcional e identificar las decisiones de manejo e intervenciones que la promueven.
El protocolo de evaluación se probó en 70 propiedades agrícolas de la Amazonia brasileña, divididas en tres grupos definidos con base en el tiempo de establecimiento, tamaño de la propiedad, capacidad técnica, grado de organización y acceso al mercado. Los grupos son: (‘CAMTA partners’) primeros colonizadores, (‘immigrated’) inmigrados de algún tiempo atrás y (‘newcomers’) los recientemente inmigrados.
Los análisis revelan que los factores determinantes de la biodiversidad funcional en sistemas agroforestales son: (1) la capacidad técnica de los granjeros, (2) su preferencia para las técnicas de bajo impacto, (3) su capacidad para adaptarse a los cambios ambientales, sociales y políticos, (4) la diversidad de especies a nivel de la parcela, (5) el aumento en el uso de especies perennes, y (6) la rentabilidad del sistema. Con respecto a las diferencias entre grupos, 'CAMTA partners' es significativamente superior a los dos otros grupos sólo en lo relacionado a prácticas agrícolas productivas.
Como el concepto de biodiversidad funcional está basado en un enfoque integrador, éste provee una base para el protocolo de evaluación sugerido. A su vez, el protocolo desarrollado puede usarse para optimizar actividades y decisiones de manejo concernientes a pagos compensatorios. Sin embargo, su validación, evaluación y adaptación como herramienta de monitoreo son necesarias.

LIST OF ACRONYMS AND ABBREVIATIONS
AFS Agroforestry System
AHP Analytic Hierarchy Processes
ANOVA Analysis of Variance
ASB Alternatives to Slash and Burn
BI Biogeographical Islands
BTI Biodiversity Threat Index
C&I Criteria and Indicators
CAMTA Cooperativa Agrícola Mista de Tomé-Açú (Mixed Agricultural
Cooperative of Tomé-Açú)
CBD (United Nations) Convention on Biological Diversity
CDM Clean Development Mechanism
CIFOR Center for International Forestry Research
CIMAT Criteria and Indicators Modification and Adaptation Tool
CONACIN Coordinadora Nacional Indianista (Indianist National
Committee)
COP Conference of the Parties
CPATU Centro de Pesquisa Agropecuaria do Tropico Umido
(Agricultural and Cattle Research Centre of Humid Tropics)
CRI Capacity Response Index
DBH Diameter at Breast Height
DNA Deoxyribonucleic Acid
ECO 92 Earth Summit, Rio de Janeiro 1992
EMBRAPA Empresa Brasileira de Pesquisa Agropecuária (Brazilian
Agricultural. and Cattle Research Company)
FMU Forestry Management Unit
GEF Global Environmental Facility
IBGE Instituto Brasileiro de Geografia e Estatística (Brazilian Institute
of Geography and Statistics)
ICRAF International Center for Research in Agroforestry
ITTO International Tropical Institute Organization
IUCN International Union for Conservation of Nature
LBA Large Scale Biosphere-Atmosphere Experiment in Amazonia
LSD (Fisher's) Least Significant Difference
LUI Land Use Intensity
MCA Multicriteria Analysis
MDA Millennium Development Assessment
MVA Multivariate Analysis
NGO Non-Governmental Organization
OECD Organization for Economic Co-operation and Development
PLEC People, Land Management and Environmental Change
PROAMBIENTE Programa de Desenvolvimento Socioambiental da Produção
Familiar Rural (Socio-environmental Development Program for
Rural Household Production)
RAF Relative Agricultural Functionality
REF Relative Ecological Functionality
SCOPE Scientific Committee on Problems of the Environment
SFM Sustainable Forest Management
SMI Sustainable Management Index
SPSS Statistical Package for the Social Sciences
TEV Total Economic Value
UN United Nations
UNEP United Nations Environment Programme
WAC (ICRAF) World Agroforestry Centre
WCPA World Commission on Protected Areas

TABLE OF CONTENTS
1 INTRODUCTION ............................................................................................. 1
1.1 Background ...................................................................................................... 1 1.2 Hypotheses and objectives .............................................................................. 2 1.2.1 Hypotheses .................................................................................................... 2 1.2.2 Objectives .................................................................................................... 2 1.3 Scope of the study ........................................................................................... 3 1.4 Expected outputs ............................................................................................. 3 1.4.1 Protocol of evaluation ...................................................................................... 3 1.4.2 Criteria and indicators set ................................................................................ 4 1.4.3 Optimization model ......................................................................................... 4 1.5 Structure of the study ....................................................................................... 4
2 AGROFORESTRY ........................................................................................... 6
2.1 Pre-existence, definition and paradigm ........................................................... 6 2.2 Biodiversity conservation and enhancement in land-use systems ................... 7 2.2.1 Agroforestry paradigm .................................................................................... 8 2.2.2 Sustainability in land-use systems ................................................................... 8 2.3 Agroforestry practices for biodiversity conservation and enhancement ......... 9 2.3.1 Linear technologies ......................................................................................... 9 2.3.2 Analog forestry or agroforests ....................................................................... 11 2.3.3 Homegardens ................................................................................................. 12 2.3.4 Slash-and-burn agriculture ............................................................................ 13 2.3.5 Tree-crop combination .................................................................................. 14 2.4 State of the art of the research on agroforestry and biodiversity
conservation and enhancement ...................................................................... 15 2.4.1 Conceptual propositions ................................................................................ 15 2.4.2 Suitable principles, systems and practices for biodiversity conservation
and enhancement in agroforestry systems ..................................................... 16 2.4.3 Perspectives of agroforestry as a biodiversity-friendly production
paradigm .................................................................................................. 18
3 BIODIVERSITY IN LAND-USE SYSTEMS ................................................ 20
3.1 Definitions and concepts ............................................................................... 20 3.1.1 Definition .................................................................................................. 20 3.1.2 Biodiversity study organization, perspectives, importance and functions .... 20 3.1.3 Biodiversity concentration in the tropics ....................................................... 22 3.2 Biodiversity loss ............................................................................................ 23 3.2.1 Factors causing the loss of biodiversity ......................................................... 23 3.2.2 Agriculture as a driver of biodiversity loss ................................................... 25 3.3 Biodiversity conservation strategies .............................................................. 26 3.3.1 Conventional approaches for biodiversity conservation ............................... 26 3.3.2 Biodiversity conservation in land-use systems .............................................. 27 3.3.3 From agrobiodiversity to agrodiversity ......................................................... 29 3.4 Biodiversity assessment ................................................................................. 33 3.4.1 Approaches to valuing biodiversity ............................................................... 33
3.4.2 Evaluating biodiversity .................................................................................. 33 3.4.3 Alternative assessment frameworks .............................................................. 35 3.4.4 Agrobiodiversity assessment ......................................................................... 37 3.5 Functional biodiversity .................................................................................. 37 3.5.1 Antecedents and conceptualization ............................................................... 37 3.5.2 Theoretical background ................................................................................. 39 3.5.3 Functional biodiversity in land-use systems .................................................. 43
4 ENVIRONMENTAL SERVICES ................................................................... 45
4.1 A conceptual framework of environmental services ..................................... 45 4.1.1 Background and conceptualization ................................................................ 45 4.1.2 Classification of environmental services ....................................................... 46 4.1.3 Assessment of environmental services .......................................................... 48 4.1.4 Payment for environmental services ............................................................. 50 4.2 Environmental services: the operational framework ..................................... 51 4.2.1 Operationalizing criteria ................................................................................ 51 4.2.2 Stakeholders characterization and perspectives concerning provision of
environmental services .................................................................................. 53 4.2.3 Environmental services provided by land-use systems ................................. 55 4.3 Environmental services: the social frame ...................................................... 56 4.3.1 Recognition and operationalization ............................................................... 56 4.3.2 Social capital ................................................................................................. 57 4.3.3 The ‘social justice’ perspective ..................................................................... 57 4.4 Environmental services: the biophysical frame ............................................. 58 4.4.1 Land-use systems as providers of environmental services ............................ 58 4.4.2 Bundling environmental services .................................................................. 60 4.4.3 Seeking for an optimization point: tradeoff between inputs, components
and outputs .................................................................................................. 60 4.5 The Brazilian model: Proambiente ................................................................ 61 4.5.1 The Proambiente approach ............................................................................ 61 4.5.2 The working unit: pólo pioneiro .................................................................... 62 4.5.3 Civil society participation and operationalization ......................................... 63
5 THE WORKING SITE .................................................................................... 65
5.1 Biophysical and socioeconomic situation ..................................................... 65 5.2 Historical background ................................................................................... 67 5.2.1 The Brazilian migration background ............................................................. 67 5.2.2 The Amazonian adventure: Japanese arrival to Tomé-Açú and further
development .................................................................................................. 67 5.3 Target groups of the study ............................................................................. 68 5.3.1 The CAMTA partners: Tomé-Açú and Quatro Bocas .................................. 69 5.3.2 The immigrated: Igapú-Açú and Forquillas .................................................. 70 5.3.3 The newcomers: Miritipitanga and Tropicalia .............................................. 71 5.4 The Tomé-Açú model of land-use management ........................................... 72 5.4.1 Management principles ................................................................................. 73 5.4.2 Guiding economic and ecological criteria ..................................................... 74
6 METHODOLOGICAL APPROACH ............................................................. 75

6.1 Multicriteria Analysis (MCA) ....................................................................... 75 6.1.1 Definition .................................................................................................. 75 6.1.2 Sustainable forest management (SFM) ......................................................... 75 6.1.3 MCA operationalization: Criteria & Indicators ............................................. 77 6.1.4 C&I development and application ................................................................. 80 6.1.5 Criteria and Indicators Modification and Adaptation Tool (CIMAT) ........... 82 6.2 Multivariate Analysis (MVA) ....................................................................... 83 6.2.1 Definitions and importance ........................................................................... 83 6.2.2 Applied protocols and tools ........................................................................... 84 6.3 Linking MCA and MVA ............................................................................... 85
7 RESULTS AND DISCUSSION ...................................................................... 87
7.1 Evaluation protocol ....................................................................................... 87 7.1.1 Framing the study .......................................................................................... 88 7.1.2 Data collection and integration ...................................................................... 89 7.1.3 Building a conceptual model ......................................................................... 90 7.1.4 Establishing a hierarchy among components ................................................ 92 7.1.5 Components characterization ........................................................................ 94 7.1.6 CIMAT: the data administration tool .......................................................... 115 7.2 Optimization model ..................................................................................... 116 7.2.1 SMI Statistics ............................................................................................... 117 7.2.2 Clusters analysis .......................................................................................... 124 7.2.3 Factor analysis ............................................................................................. 128
8 GENERAL DISCUSSION ............................................................................ 136
8.1 Operational issues: protocol of functional biodiversity evaluation ............. 136 8.1.1 Definition of boundaries .............................................................................. 136 8.1.2 Establishing hierarchies and participative methods .................................... 137 8.1.3 Sustainable management index ................................................................... 137 8.1.4 Protocol feasibility concerns ....................................................................... 138 8.1.5 Data gathering constraints and software applied ......................................... 139 8.2 Conceptual issues: functional biodiversity accomplishments ..................... 140 8.2.1 General hypothesis ...................................................................................... 140 8.2.2 Specific hypothesis 1 ................................................................................... 142 8.2.3 Specific hypothesis 2 ................................................................................... 143 8.3 Prospective issues and further research ....................................................... 144
9 CONCLUSIONS AND OUTPUTS .............................................................. 146
9.1 Conclusions ................................................................................................. 146 9.1.1 General conclusion ...................................................................................... 146 9.1.2 Conclusion specific objective 1 ................................................................... 146 9.1.3 Conclusion specific objective 2 ................................................................... 147 9.2 Expected outputs ......................................................................................... 147 9.2.1 Output 1: protocol of evaluation .................................................................. 147 9.2.2 Output 2: Criteria and indicators set ............................................................ 148 9.2.3 Output 3: optimization model ...................................................................... 148

10 REFERENCES .............................................................................................. 150
11 APPENDICES ............................................................................................... 163
12 ACKNOWLEDGEMENTS .......................................................................... 183
Introduction
1
1 INTRODUCTION
1.1 Background
Environmental management, like most human activities, has been grounded
progressively in market-based approaches with the aim of making judgments and
decisions more efficient and rational against the background of the global
environmental crisis, its degree and its scope. The concept of payment for
environmental services, a sort of trade of by-products to a third party, has taken a
leading role. Several environmental disturbances have been managed under this
approach (Kleinn et al. 2000).
The two greatest challenges facing world agriculture are the production of
sufficient food for the world’s population and the conservation of biodiversity (Conway
1997). Countless alternatives have been suggested, such as agroforestry, which is a
series of land-use management principles based on a high number and diversity of
components, flexible technical management, and a multicriteria decision making, aimed
at increasing land productivity while taking into consideration ecological and economic
concerns (Schroth et al. 2004).
Previous investigations in agroforestry systems as environmental services
providers, (in our case biodiversity conservation) have been wide but disperse. Neither,
framework, criteria and boundaries, nor assessment, management and monitoring
aspects have yet been defined (Nair 1997, Callo-Concha 2003).
The premise of functionality, i.e., the roles performed by systems, has not been
adequately dealt with by the environmental services approach. The studies have usually
focused on biophysical and/or economic status evaluation. This approach in fact shifts
the focus from the main aim of land-use systems management, which is the continuous
provision of goods and services (Altieri & Nicholls 1999).
The inclusion of this premise into agroforestry systems management is
attempted through the functional biodiversity approach, which emphasizes the processes
triggered by organisms and the subsequent benefits rather than their static condition. In
the present study, agroforestry systems are seen as environmental services providers in
addition to its most important goals, i.e., assurance of food provision and generation of
income opportunities.

Introduction
2
1.2 Hypotheses and objectives
1.2.1 Hypotheses
General hypothesis
Agroforestry systems maintain functional biodiversity at levels sufficient to keep the
production sustainable and the environmental processes stable.
Premises
- The theoretical background suggests that the abundance and richness of species in a
system should be highly related to the intensification of processes occurring in it.
- It is believed that the intensification of the ecosystem functionality implies the
intensification of the production processes and consequently the increase in yields
and by-product generation.
- There is no consensus on how biodiversity should be assessed in agro-ecosystems
nor which biodiversity approach or approaches should be applied.
- There are many scientific references about the virtues of agroforestry systems to
maintain biodiversity, generally enunciative but have been demonstrated
conclusively yet.
Specific hypothesis 1
The degree of functional biodiversity in agroforestry systems depends on the level of
technical management.
Specific hypothesis 2
A model derived from the criteria and indicators approach should provide a better
understanding of agroforestry systems efficiency to maintain functional biodiversity.
1.2.2 Objectives
General objective
To assess the factors that influence the processes that determine the capabilities of
agroforestry systems to maintain functional biodiversity (case study: municipality of
Tomé-Açú, Pará state, northern Brazil), underlining management as a key factor to
improve the systems towards making them more productive and sustainable.

Introduction
3
Specific objective 1
To develop a protocol for evaluating functional biodiversity in agroforestry systems.
Specific objective 2
To define a management optimization model of agroforestry systems for enhancing and
maintaining functional biodiversity.
1.3 Scope of the study
- It is a common understanding that environmental services are biodiversity
preservation, carbon sequestration, water management and scenic beauty. However,
for conceptual and methodological reasons, this study will cover only biodiversity,
which, due to its complexity also involves directly or indirectly the other services.
- It is assumed that the benefits obtained from agroforestry systems+ should be
assigned in the following order of priorities: assurance of food security, increment
of system productivity, tradable surpluses to access the market, progressive
capitalization based on the production of high market-value products, and eventually
provision of environmental services.
- We assume that agroforestry generally develops progressively with the capabilities
of those involved, so we consider it as a small farmers’ option; however several
considerations can be extrapolated to larger scales.
1.4 Expected outputs
This research discusses the theoretical topic ‘functional biodiversity approach for
agroforestry systems’, and also provides pragmatic means for optimizing land-use
system performance by stakeholders.Within this frame, the expected outputs are:
1.4.1 Protocol of evaluation
A protocol to characterize, evaluate, analyze, rate, weigh and interpret functional
biodiversity in agroforestry systems, able to extrapolate to similar conditions elsewhere.
This protocol will be based on a small-scale study, so neither the agroforestry
systems nor the conditions are really representative. Thus, we will focus on the
extrapolation possibilities rather than on the accuracy of a particular case study.

Introduction
4
1.4.2 Criteria and indicators set
A Criteria and Indicators (C&I) set for functional biodiversity assessment in tropical
agroforestry systems, clustered, hierarchized, and interrelated; developed ad hoc but
eventually able to extrapolate to similar conditions with some modifications.
1.4.3 Optimization model
The integration of a protocol of evaluation, a set of indicators and an ad hoc analysis
procedure will provide a dynamic model of the systems functioning, defining topics of
action, support and prediction, and could serve as a political negotiation argument in an
environmental services payment framework. This optimization model will be highly
location specific.
1.5 Structure of the study
This study is organized as follows:
- Chapter 1 summarizes the problem focus of this research, its conceptual premises,
original idea and necessity of further validation, and details the hypotheses,
objectives, scope of the study and, expected outputs.
- Chapters 2, 3 and 4 consist of the literature review of the three conceptual pillars on
which this research lies: agroforestry, biodiversity and environmental services.
- Chapter 2 provides an overview of agroforestry as a production paradigm, analyzing
its advantages against other land-use systems aiming at biodiversity conservation,
the most important technological variations and their environmental advantages, and
the trends of research on biodiversity.
- Chapter 3 deals with the evolution of the concept of biodiversity in relation to land-
use systems, i.e., approaches, conservation strategies and assessment. The chapter
ends with a revision of the emerging ecological concept of functional biodiversity,
suggesting its adaptation to agro-ecosystems, which is the conceptual core of this
study.
- Chapter 4 explores the concept of environmental services from four aspects:
conceptual, operational, socioeconomic and biophysical, highlighting the
characteristics most relevant for this study. The chapter concludes with a brief
review of the Brazilian environmental services program.

Introduction
5
- Chapter 5 presents the study area: biophysical and socio-economic conditions, the
subjects of study and the unit of analysis, i.e. local agroforestry systems.
- Chapter 6 describes the methodological approach, applied analytical tools, further
development and integration, concentrating on Multicriteria Analysis (MCA)
definition and operationalization, the Criteria and Indicators (C&I) approach,
principles and supporting software, as well as the Multivariate Analysis (MVA)
methods (cluster analysis and factor analysis). It concludes with the exposition of
the linkage between MCA and MVA.
- The results in Chapter 7 are divided into two subchapters: (1) the evaluation
protocol: study scope, data collection and integration scheme, conceptual model
with the relevant components, a hierarchization of the proposed C&I set, details of
each C&I component and description of their application; and (2) the optimization
model, i.e., the univariate statistical analysis of the Sustainable Management Index
(SMI) per group and as a whole, the multivariate analysis (cluster analysis and
factor analysis), results and interpretation.
- In the general discussion in Chapter 8, results are analyzed with respect to the
established hypotheses. The main limitations regarding the feasibility of the
proposed approach are discussed, and finally suggestions are made for further
research for the improvement of the approach or its upgrading into an environmental
services evaluation protocol.
- Chapter 9 provides conclusions and outputs.

Agroforestry
6
2 AGROFORESTRY A further alternative in the production-conservation bridge
2.1 Pre-existence and definition and paradigm
Agroforestry existed well before its scientific characterization. There are vestiges of
agroforestry in most agro-centric cultures where various productive components were
integrated and managed in a complex manner. What is new, is its naming and the
systematization of its study (Young 1989, Nair 1993).
There was a great deal of discussion about the definition of agroforestry during
the 1970’s and 80’s, and consequently many definitions exist. Nevertheless, it was
generally agreed that a definition must include the following items (Table 2.1):
Table 2.1 Prerequisites for defining agroforestry As a science As a socioeconomic
option As a productive practice
- It is interdisciplinary and integrative.
- Requires understanding of its biophysical and socioeconomic circumstances.
- Must be compatible with local habits.
- It is not an alternative by itself, but becomes such circumstantially.
- Must include at least one wood component
- Includes in the same plot: herbaceous crops and/or shrubs and/or trees and/or animals.
- Attempts to optimize the use and recycling of available resources.
- Affords various spatial and/or temporal arrangements.
- Focuses on yield maximization in the long term.
Based on Nair (1985), Young (1989), Leakey (1996), Nair (1997) and Huxley (1999).
In addition, every agroforestry system must fulfill the following criteria: must
be intentional, its components must interact, it must generate multiple outputs (products
and/or services), and exceed a one-year management term.
The World Agroforestry Centre (former International Center for Research in
Agroforestry ICRAF) defines agroforestry as: “A dynamic, ecologically based, natural
resource management practice that, through the integration of trees and other tall
woody plants in the farm and within the agricultural landscape, diversifies production
for increased social, economic and environmental benefits” (ICRAF 2000).
Agroforestry demands a re-conceptualization of productive practices that,
instead of maximizing a unique output giving priority to a homogeneous production

Agroforestry
7
style, underlines the environmental sustainability, strengthens economic profitability,
promotes productive diversity, enforces social equity, and protects the cultural diversity
of existing and introduced systems (Callo-Concha 2003).
Thus, agroforestry does not represent a uniform ensemble of systems and
technologies. The global qualities commonly attributed to agroforestry practices are not
always observed, like soil conservation on steep slopes or higher soil fertility, where
complementary factors, such as climate or physiognomy can have a drastic influence on
the systems’ characteristics and performance (Michon & de Foresta 1995).
The resourcefulness usually attributed to agroforestry systems manifests itself
through an inherent and a key component of every agroforestry system: the
‘multipurpose tree’ one that besides the products and services usually given as wood,
climate influence, soil improvement and organic matter addition, provides of important
products and services as nitrogen fixation, forage, gums, resins, fibers, medicines,
human-eatable products, etc (Krishnamurthy & Avila 1999).
2.2 Biodiversity conservation and enhancement in land-use systems
Colonization and land-use change have been pointed out as being the major causes of
species loss in the past centuries. Modern agriculture based on substitution of natural
systems for human-managed ones first converted small plots and later, as technology
developed, large areas into intensive land-use systems (Albuquerque et al. 2000).
These farming systems are generally mono-specific and even mono-varietal
based on intensive use of capital and external inputs, have lead to the loss of associated
flora and fauna, endangering the equilibrium not only in natural ecosystems, but
paradoxically also in the land-use systems themselves (Leakey 1999, Schroth et al.
2004a, Ammann 2004).
Several management tools have been proposed as more environmentally
friendly alternatives: agroecology, ecoagriculture, permaculture, etc. Agroforestry, far
from being a panacea, has become a further option in this large spectrum of alternative
land-use management paradigms.
Agroforestry
8
2.2.1 Agroforestry paradigm
It has been assumed that agroforestry systems are more complex than monocultures but
less complex than natural systems (Bates 1999), and by their biophysical structure are
more in tune with primary forest, forest reserves and similar biotopes (von Maydell
1990).
Agroforestry focuses strongly on the increase in income through involving a
diversity of components and conservation of natural resources (Williams et al. 1997).
Moreover, a positive correlation has been found between the size of the system and the
scale of management and the attention to environmental problems (Krishnamurthy &
Avila 1999, Izac & Sánchez 2001). This is possible because in contrast to other land-use
systems where the farmer focuses on a limited number of products or services, in
agroforestry the farmer generates a number of products, by-products and services in the
way to set a final profit (Arnold & Dewees 1999).
2.2.2 Sustainability in land-use systems
Sustainability in a land-use system implies that its by-products should not disrupt the
functioning of the system to the extent that the system’s capacity to absorb those
disruptions is surpassed. In other words: “(...) a cropping systems is sustainable if has
an acceptable level of production of harvestable yield which shows a non-declining
trend from cropping cycle to cropping cycle over the long term” (Izac & Swift 1994).
Assuring sustainability of land-use systems is the major focus of this research;
an increase in biodiversity should contribute to its ecological sustainability, attaining
equilibrium with multiple uses of the involved species (Padoch & Peters 1993, Bates
1999, Scherr & McNeely 2003).
Scientific literature has stated that agroforestry systems (1) are more efficient
in the cycling and use of nutrients in a system (Nair 1987, 1993), (2) have a higher
structural complexity and greater diversity of biological components (Kidd & Pimentel
1992, Leakey 1999), (3) have structures, composition and interactions that imitate
natural forests (Shoeneberger 1993, Williams et al. 1997, Krishnamurthy & Avila 1999,
Newman & Gordon 1997), and (4) reduce the pressure on deforestation since their
outputs have multiple uses (Krishnamurthy & Avila 1999, Wilkinson & Elevitch 2000).
Agroforestry
9
These are all characteristics that lead to an increase in the agroecosystem diversification
capacities and thus maintaining and even enhancing biodiversity.
2.3 Agroforestry practices for biodiversity conservation and enhancement
Agroforestry does not represent a uniform ensemble of systems and technologies, and
biodiversity conservation is function of several factors, such as system type, ecological
interactions, species composition and their spatial and temporal arrangements
(Shoeneberger 1993, Pimentel & Wightman 1999). These qualities are not always
present in agroforestry systems (Michon & de Foresta 1995). For clarification below are
listed some agroforestry practices and their characteristics with respect biodiversity
conservation.
2.3.1 Linear technologies
Biodiversity corridors, living fences and windbreaks are categorized as linear
technologies. They consist of one or more lines of a number of tree species partially or
completely surrounding the production plot.
The two principal benefits of linear technologies for biodiversity preservation
are providing habitats for wild and/or useful fauna, and supplying connectivity between
areas with different diversity levels. However, several critical factors such as structure,
composition, management and location in the landscape can also influence the level of
biodiversity conservation (Harvey et al. 2004, Laurance 2004a).
Biodiversity corridors
Biodiversity corridors provide mobility to animal species (Harris & Eisemberg 1989),
simulating to some extent the natural vegetation coverage that could have previously
existed (Gascón et al. 2004). They facilitate wildlife movement locally and during
migration and dispersion processes, provide habitats for resident species during nesting,
and support ecosystem processes (Shoeneberger 1993, Laurance 2004a).
It is important to notice that as ‘preserver systems’, biodiversity corridors are
not better than monoculture farms (van Noordwijk et al. 1997).

Agroforestry
10
Living fences
Living fences control the movement of livestock and people between farm boundaries.
In addition, they can perform other functions such as prevention of soil erosion, and
delimitation and parceling of properties or grazing lands (Budowski & Russo 1993).
In Central America, it is estimated that 60 to 95% of the cattle farms are
surrounded by living fences (Harvey et al. 2004). Despite their initial poor diversity,
with time they become structurally more complex, due to the progressive enrichment of
under-story species as a function of a number of ecological factors such as seed input,
regeneration dynamics, biophysical conditions (weather and soil quality), and
management (pollarding and herbicides application) (Budowski & Russo 1993, Harvey
et al. 2004).
Windbreaks
Windbreaks are to linear plantings of trees and/or shrubs (usually several rows together)
whose primary function is to protect crops, livestock and houses from wind damage.
They are used regularly in temperate regions, but are less common in tropical areas.
Windbreaks can facilitate natural regeneration in their under-stories, serving as perching
and seed deposition sites for birds and other animals, and providing microclimates that
help the tree growth (Harvey et al. 2004).
The conservation value of windbreaks increases when they connect intact
forest or remnants of natural vegetation, and are wide enough to contain some interior
habitat (Schoeneberger 1993, Harvey et al. 2004).
Case studies
There is an extensive documentation that supports the benefits of linear technologies. It
has been demonstrated that bird populations increase up to five times compared to
conventional systems, while they host newcomer species that control pests (Williams et
al. 1997).
In Usambara Mountains Reservation, Northeast Tanzania, from the
surrounding living fences the farmers gather in average 45.5% of their fuel wood and
31.5% of poles, thus alleviating the pressure on the reservation (Huang et al. 2002).

Agroforestry
11
In León, Nicaragua, 20-year-old multi-species windbreaks under two levels of
maintenance (regular and poor) were compared to a control (no windbreaks). The
Shannon index value in well maintained windbreaks was (2.98) higher than the
regularly maintained sites (2.62) and poorly-maintained sites (1.47), besides the benefits
obtained from the windbreaks as food supplies and for resting, perching, and nesting
areas for birds, windbreaks functioned as well as mobility corridors (Alvarado 2001).
2.3.2 Analog forestry or agroforests
The enrichment of natural forests with useful trees has been identified as the earliest
form of agriculture, even preceding slash-and-burn systems, a model that still can be
found in many peasant farms in humid tropics (Michon & de Foresta 1995). Agroforests
are complex systems where a great diversity of species coexists in non-predefined
spatial and temporal arrangements, following the physiognomy, structure and functions
of natural forests. Normally they are composed of native vegetation and often exotic
species that generate anthropogenic benefits (Torquebiau 1990, Michon & de Foresta
1995).
Agroforests are usually associated with annual cropping systems such as
lowland rice, slash-and-burn plots, homegardens, pastures, perennial crop plantations
and remnants of primary and secondary forests, appearing in a heterogeneous patchwork
pattern (Schroth et al. 2004b).
Agroforests are nominally classified as: (1) cyclic agroforests, where the
agroforestry phase alternates with a slash-and-burn phase in the same piece of land, and
(2) permanent agroforests, where continuous small scale-processes occur
simultaneously rather than modifying the whole plot (Schroth et al. 2004b).
In contrast to other agroforestry systems, where every component receives the
same treatment outputting a small number of products in high amounts, in agroforests
each component is managed individually or by groups, generating in consequence
distinguishable goods in moderate amounts (Torquebiau 1990).
The relatively high biodiversity in agroforests compared with typical
agricultural systems is judged differently by different researchers: some consider it the
only form of agroforestry with the potential to restore, sustain and conserve the original
forest biodiversity (Michon & de Foresta 1995), while others point out that there are

Agroforestry
12
limited substitutes for natural forests, due to the presence and under-representation of
forest-dependant species (Schroth et al. 2004b).
Nevertheless, agroforests are useful as buffer zones in protected areas and
deforested regions, where they can offer refugee habitats to forest-dependent flora and
fauna, promoting biophysical interactions and enhancing landscape connectivity
(Wilkinson & Elevitch 2000, Guiracocha et al. 2001).
The case of the Sumatra and Kalimantan lowlands in Indonesia is well known,
where small farmers have modified the crop-fallow systems introducing rubber trees
plus annual and perennial crops. These rubber-based agroforestry systems have been
able to conserve 50% of the original pool of birds, 70% of the plant species and much of
the native soil microfauna, while providing dependable income to at least 5 million
people (Padoch & Peters 1993, Leakey 1999, Wilkinson & Elevitch 2000, Schroth et al.
2004b).
2.3.3 Homegardens
Defined by Kehlenbeck & Maass (2004) as “a clearly bounded piece of land cultivated
by a diverse mixture of annual and perennial crops and on which a house is built”,
homegardens can be found in almost every socioeconomic and biophysical situation.
They are characterized by high species diversity, including indigenous and exotic
species, showing a varied and apparently haphazard horizontal and vertical
stratification, and generating constant outputs (Krishnamurthy & Avila 1999). In
addition to their main function, i.e., guaranteeing food security to their owners,
homegardens can also provide cash crops, and be a source of extra income
(Krishnamurthy & Avila 1999, Kehlenbeck & Maass 2004, Leakey 1999).
In Sulawesi, Indonesia, 30 homegardens in three localities near the Lore Lindu
National Park were studied and 149 plant species, mainly fruit, vegetable, spices and
medicinal plants were identified. The Shannon index as well as the Sørensen coefficient
showed considerable differences among the sampled sites; the differences were
attributed to the dissimilar socioeconomic characteristics, origin and economic activities
of the owner groups (Kehlenbeck & Maass 2004). In Cuba, in a similar investigation
assessing 31 homegardens in three villages 101 plant species were observed, with the

Agroforestry
13
number of species varying between 18 and 24 and a maximum of 49 per plot, each with
a different composition (Wezel & Bender 2003).
2.3.4 Slash-and-burn agriculture
No other land-use system has been so controversially discussed than slash-and-burn
agriculture also called shifting cultivation. On the one hand, it is considered the major
agricultural system given the availability of resources and technology. On the other
hand, because of its role in replacing natural vegetation, it is the major cause of habitat
destruction and biodiversity loss in the tropics (Nye & Greenland 1960 cited by Myers
1980, Myers 1980).
Known as well as ‘swidden agriculture’, it was defined by Finegan & Nasi
(2004) as: “(…) any agricultural system in which the fields are cleared and cultivated
for periods shorter than which they are fallowed”. It proposes a strategy of resource
management in which fields are shifted in order to exploit the energy and nutrient
capital of the vegetation-soil complex for future uses.
Widely practiced in tropical areas, slash-and-burn agriculture leads to the
enlargement of the farming frontier to substitute the cultivated areas with depleted
fertility after sequential cultivation seasons. Originally, this system was sustainable as
the land availability was extensive, but currently, demographic, political and
environmental pressures have curtailed its usefulness (Krishnamurthy & Avila 1999).
The main consequences of shortening the fallow period are decline in crop yields, weed
increase and consequent rising demand for labor (Finegan & Nasi 2004). Nonetheless,
about 350 to 500 million people, mostly poor farmers in tropical areas, base their
subsistence on slash-and-burn agriculture, making it the most widespread agricultural
practice worldwide (Krishnamurthy & Avila 1999).
The contribution of slash-and-burn agriculture to biodiversity conservation
must be considered in both cultivation and fallow stages, and in consequence their
evaluation has to consider not just the diversity of species, but also the system structure
and the diversity of niches (Finegan & Nasi 2004).
Crop biodiversity in slash-and-burn agriculture has received little attention,
because most participant species are propagated vegetatively, making their conservation
unfeasible through the ex situ conservation approach. This has changed with the
Agroforestry
14
introduction of the in situ conservation paradigm and participative methods (Finegan &
Nasi 2004).
2.3.5 Tree-crop combination
Tree-crop combinations, installed in a regular (temporal and spatial) pattern are the
agroforestry systems more analogous to extensive monocultures. They have defined
design principles and management strategies, and pursue an economic rationality that
normally is based on the woody component (Bates 1999, Krishnamurthy & Avila 1999).
These systems have become extensive and economically important and have received
increasing attention with respect to technological improvements, e.g. ‘alley cropping’
(Kang & Wilson 1987).
The most well known cases of tree-crop combinations are shade-coffee
(Coffea spp.) and cocoa (Theobroma cacao) plantations, which dominate agricultural
economic activities in more than 50 countries, covering 11 million ha and providing
support to more than 25 million people (Somarriba et al. 2004).
The structural and spatial arrangements of coffee plantations can generally be
extrapolated to other tree-crop combinations. The most representative coffee tree-crop
plantation models are open coffee monocultures, coffee plantations with lateral shading
from linear plantings in field borders, monolayered shade canopy (usually only one
woody species), two-layered shade canopies (generally one tree component and some
other intermediate species that perform short-term functions), multistory coffee
policultures (with three or more species and three or more vertical strata), and rustic
plantations (understory of natural forest cleared to host coffee plants) (Somarriba et al.
2004).
Research has shown that traditional coffee associations are only second in
importance to primary forests in terms of their diversity of birds, insects, bats,
microfauna and even mammals, who use shade species and related flora for nesting,
mating, foraging and sheltering (Wilkinson & Elevitch 2000, Guiracocha 2001). In
Mexico, 24 large mammal species, including three types of cats, have been reported in
shaded coffee systems (Somarriba et al. 2004). In Salamanca Costa Rica, the mammal
biodiversity in multi-strata agroforestry systems was 32 and 18 species for cacao-based
and banana-based systems, respectively, numbers not greatly different from those of
Agroforestry
15
natural forests (Guiracocha 2001). In Colombia, 170 species of avifauna were found in
three tree-crop systems, about 10% of the known species in the country. In the forests of
central Guatemala, the bird populations ranged between 87 and 122 species, out of
which 73 were found in coffee-shadow plantations (Somarriba et al. 2004). Similar
results were found when comparing the diversity and abundance of coffee agroforestry
systems with the semi-evergreen tropical forest in southern Mexico: up to 180 species
of birds, more than 10 times the number of neighboring monocultures (Wilkinson &
Elevitch 2000, Villavicencio-Enríquez & Valdez-Hernández 2003).
Another study in Costa Rica compared the diversity of Homoptera in three
different coffee plantation arrangements: no shadow, shadow through Erythrina
poeppigiana and shadow through Erythrina poeppigiana and Cordia alliodora. The
greatest diversity and richness was found in Coffea + Erythrina + Cordia combination,
followed by Coffea + Erythrina and then by Coffea monoculture (Rojas et al. 1999).
2.4 State of the art of the research on agroforestry and biodiversity
conservation and enhancement
2.4.1 Conceptual propositions
The current research knowledge allows formulating the following three propositions
over the contribution of agroforestry systems towards preserving biodiversity.
Agroforestry-deforestation
Agroforestry can help to reduce the pressure on natural forests resulting from the
clearing of additional land for agriculture if adopted as an alternative to more extensive
and less sustainable land-use practices. It can also help local populations to cope with a
limited availability of forestland and resources. Nevertheless, its success depends on
other socioeconomic issues, such as food security, profitability, and political factors,
i.e., good governance, appropriate legislation and effective enforcement.
Agroforestry-habitat
Agroforestry systems can provide habitats and resources for forest-dependant native
plant and animal species, which would not be able to survive in a purely agricultural
landscape, thus directly helping threatened species, especially in regions where native

Agroforestry
16
forest areas have been reduced. However, agroforestry cannot become a substitute for
natural habitats, but only a complementary activity near these.
Agroforestry-matrix
In landscapes that are mosaics of agricultural and natural vegetation plots, the
conservation value of the remnant vegetation (which may or may not be protected)
becomes greater if it is embedded in a landscape dominated by agroforestry elements
and not by crop fields and/or pastures. This would facilitate connectivity between
patches of natural habitats and buffer areas, and consequently the internal movement of
species (Schroth et al. 2004c).
2.4.2 Suitable principles, systems and practices for biodiversity conservation
and enhancement in agroforestry systems
In general, biodiversity tends to reach a maximum in fallows, secondary and primary
forests, and diminishes progressively when the capacity to produce biomass reduces
(Bates 1999). The level of management of agroforestry systems varies from intensely
managed systems, as in alley cropping, to less demanding systems, as in agroforests.
The higher management scale the more participant variables, and hence the weaker the
selection pressure and hence a higher density of species (Michon & de Foresta 1995); in
contrast the less intensively a system is managed, the more diffuse and localized is the
species selection (Bates 1999).
Based on the above review, some general guidelines are given for the
mentioned land-use systems:
- When optimizing the management of linear technologies, it is recommended to
conserve the remnants of primary and riparian forest, encourage the use of shadow
in traditional plantations, include native species and large fruit trees, plant as wide
windbreaks as possible, fill the gaps between plantation lines, confine domestic
animals, and to control hunting (Laurance 2004b).
- In the case of tree-crop combinations, the diversity is strongly linked to the diversity
of trees and layer-story, plantation management, and composition and structure of
the surrounding landscape (Somarriba et al. 2004).

Agroforestry
17
- To improve the biodiversity of slash-and-burn systems, the focus must be on the
variation of their spatial characteristics over time, regeneration mechanisms, change
in richness, diversity and composition per cycle, the systems’ contribution to
conserving original forests and the landscape, and on the role of management in
increasing the conservation value of individual components (Finegan & Nasi 2004).
Important are also the recently developed improved or planted fallows, which focus
on enriching the plot with leguminous species under appropriate management, with
the aim of restoring fertility, accelerating decomposition and inducing regeneration
of beneficial (woody) species (Beer 1983 and Budowski 1987 cited by
Krishnamurthy & Avila 1999).
- The species selection factor supports more than any other the socioeconomic
concerns of biodiversity preservation, because of its importance as a source of
valuable goods and a way of achieving economic profit (Bates 1999). Considerable
advances have been made with the use of cinderella species, which are little known
indigenous trees that are highly profitable both economically and environmentally
(Leakey 1999). However, despite these advances, the demand for multipurpose tree
species is still high. This shows that it is difficult to integrate sustainability criteria
with local values in the species selection (Bates 1999).
Managing agroforestry systems
The conceptual observations relevant to managing land-use systems for biodiversity
conservation are summarized by Bates (1999) in four ideas: (1) in almost every
situation, fewer species are used than those available, (2) the selection of species
depends on a combination of factors, (3) external factors tend to influence the decisions
of farming communities regarding resources management, and (4) when the value and
importance of certain species increases, the selection favors the cultivated ones against
the wild ones.
Considering these we should focus on: (1) diversifying species composition,
e.g., multistoried systems provide more benefits than the addition of subsystems, (2)
creating a variety of niches for wildlife (over-story, under-story and ground layer),
minimizing the management activities that could alter them, (3) creating wildlife
corridors, preferably in natural undisturbed areas with limited human presence, (4)

Agroforestry
18
providing shade and augmenting niches for sun-demanding species through spatial
arrangements, (5) also managing the non-crop species, (6) conserving and storing water
on the land or nearby, and (7) encouraging the presence of particular species to satisfy
specific demands (Shoeneberger 1993, Bates 1999, Leakey 1999).
Summarizing, in order to reach higher biodiversity standards, environmental
research recommends that agroforestry should: in biophysical terms follow successional
phases by developing productive and complex agroecosystems similar to natural
ecosystems, and in socioeconomic terms identify commercially and functionally
valuable species and develop an entrepreneurial mentality in system management
(Leakey 1999).
2.4.3 Perspectives of agroforestry as a biodiversity-friendly production
paradigm
Since the beginning of agroforestry as an academic discipline thirty years ago, the focus
has changed constantly and meaningfully. Initially, the discipline aimed at developing a
theoretical framework based on related fields, such as agronomy, forestry, ecology,
economics and anthropology, producing as outputs databases, methodological
guidelines, and empirical approaches. Once the theoretical basis had been established,
its focus shifted to transboundary issues, such as biophysical interactions, system
design, and integration of socioeconomic and animal components. Lately, responding to
market and environmental forces, the attention have moved to issues such as product
marketing, economic assessment, carbon sequestration, water quality and biodiversity
conservation (Nair 1997).
It seems that the future research agenda will continue along such a trend,
integrating paradigms and demands, taking into consideration the key concepts
complexity, profitability and sustainability.
Integrating perspectives, aims and outputs
Keeping in mind that the greatest challenge for land-use systems is integrating
production and conservation, the question whether combining a wide variety of species
to perform a great number of functions is better than efficiently producing certain goods
and services through a less diverse system comes into the fore. In the case of

Agroforestry
19
agroforestry systems, which are by definition more diversified than other land-use
systems, the disjunctive remains (Leakey 1999).
Probably the best answer to the above question is given by Van Noordwijk et
al. (1987), who stated that optimization processes of segregation vs. integration are
system specific and their equilibrium point always needs to be searched for.
The question of the degree of correlation between management intensity and
level of diversity can be easily extended to our research issue: which is the equilibrium
point in the design of a productive, profitable and sustainable (environmental services
provider) agroforestry system? One of the goals of this study is to contribute to the
answering of this question.

Biodiversity in land-use systems
20
3 BIODIVERSITY IN LAND-USE SYSTEMS Beyond conservation: the maintenance of processes
3.1 Definitions and concepts
3.1.1 Definition
Like most controversial topics, there is no single definition for biodiversity (Noss 1990,
Chadwick 1993). On the contrary, there are many approaches, which vary from static
“(…) the variety of life on Earth” to more functional, like “(…) the study of the
processes that create and maintain variation” (Takacs 1996).
However, seems that an integrative idea of biodiversity should consider
variability of vegetation, fauna and micro-organisms, and the ecosystems occupied by
such species. It also considers the genetic resources and the products of their
manipulation, as well as nations, peoples, ethnics, and in general human groups who
handle the resources and their inherent knowledge related to the resources management
(Harte 1996, Goicochea 1998, Acharya 1999, Stocking 2002, Altieri & Nicholls 2004).
The most accepted definition of biodiversity is the one introduced during the
United Nations Earth Summit in 1992: “(…) the variability among living organisms
from all sources, including, interalia, terrestrial, marine, and other aquatic ecosystems,
and the ecological complexes of which they are part: this includes diversity within
species, between species and of ecosystems.”, which later was adopted by The United
Nations Convention on Biological Diversity (CBD 2007).
3.1.2 Biodiversity study organization, perspectives, importance and functions
The study of biodiversity is categorized in three levels, namely genetic, species, and
ecosystem biodiversity. Genetic biodiversity considers genes as key structures, as the
basis for species’ evolution and adaptation in the long term. At the species level, the
individual is treated as the unit of analysis, and its study is supported by classification,
sampling, and derivation of statistical operators as assessment tools. Thus, the number
and types of species and changes in their populations are assumed as comprehensive
measurements of the health of an ecosystem. The ecosystem level refers to communities
whose spatial and temporal boundaries are not well defined: they could be a fragment of
a forest or the entire biosphere; the study of biodiversity at ecosystem level focuses on

Biodiversity in land-use systems
21
the distribution patterns of species and their roles (Ryan 1992, Srivastava et al. 1996,
Harrison et al. 2004a).
Similarly, biodiversity can be studied from two perspectives: one considers
biodiversity as a charismatic global-interest issue and encourages efforts to safeguard it,
and the another deals with its performed roles (Tomich et al. 2004). This role-oriented
perspective is addressed through the following approaches: compositional diversity, i.e.,
ecosystems, species and genetic diversity; structural diversity, given by spatial and
temporal arrangements at different scales; and functional diversity, reflected by
variations in ecological processes at all scales (Table 3.1).
Table 3.1 Disintegration of the concept of biodiversity into its operative components Biodiversity components
Compositional Structural Functional Genetic Number of genes,
alleles Genetic structure Recombination,
evolution Species Number and types of
species Species distribution and abundance
Trophic levels, life history
Ecosystems and community
Number and types of communities and ecosystems
Habitat structure and distribution
Ecosystem processes
Source: Adapted from Schoeneberger (1993)
The importance of biodiversity can be argued in two ways: intrinsic and
extrinsic. The intrinsic factor is based on ethics, stressing on the idea and need of
evolution, questioning the activities that risk and constrain biodiversity existence in
future as stated by the Noah Principle: “…the usefulness of a species is not considered
when discussing its conservation, but rather its very presence in the long history of
evolution is sufficient to warrant its preservation” (Ehrenfeld 1972, 1998).
Complementarily, the extrinsic argument is much more utilitarian and
anthropocentrically-oriented, emphasizing on the benefits that biodiversity provides to
the societies in maintaining human life and its activities (Harrison et al. 2004) (Table
3.2).

Biodiversity in land-use systems
22
Table 3.2 Principal benefits provided by biodiversity Level Provided benefits Genetic - Regulation of global processes: (gas flow, climate stability, etc.)
- Conservation of soil and water (invigoration of hydrological cycle, erosion control, flood avoidance, infiltration enhancement, etc.)
- Cycling of nutrients and energy (photosynthesis, soil renewal, nitrogen fixation, organic matter decomposition, etc.)
- Reserves of matter and energy Species - Provision of raw materials for sustaining human activities:
agriculture, medicine, manufacturing, industry, etc. - Increasing populations resilience
Ecosystem - Saving of genetic information - Saving of promising materials for coping present and/or future needs
Source: Adapted from Perrings et al. (1995), Swift et al.(2004), Vermeulen & Koziell (2002), Stocking (2002), Altieri & Nicholls (2004), Swift et al. (2004).
3.1.3 Biodiversity concentration in the tropics
Tropical rainforests comprise only 6 to 7% of the Earth's land surface, but they make up
approximately 50 to 90% of the global biodiversity, more than 80% of all plant species
and nearly 50% of all animal species (Mooney et al. 1995, Gascon et al. 2004). It has
been estimated that Colombia, Ecuador and Peru alone shelter 60% of the worldwide
biodiversity (Kloppenburg 1988); nonetheless a great number of species in the tropics
are still little known and unclassified, e.g., in the case of Amazonia, it is believed that
the non-classified species vary from 65% to 99% (Mooney et al. 1995).
The factors determining biodiversity concentration in tropics are (1) time, as
tropics are older than most ecosystems, they have higher indices of complexity, and in
consequence relatively longer processes of evolution, speciation and persistence, (2)
climatic stability and other climate-derived factors that define the lack of inter-annual
and intra-annual variations optimize species performing conditions, (3) co-evolution as
function of interactions with countless individual mechanisms such as pollination,
predation, speciation and competency, (4) spatial heterogeneity, which provokes a great
diversity of niches for a large number of species, and (5) greater water availability,
which enhances cycling processes and biomass production (Eisemberg & Harris 1987,
Detweiler & Hall 1988, Vitousek & Hooper 1993, Mooney et al. 1995, Gascon et al.
2004).
Concerning cultivated plants, tropics are equally important, since they
maintain a high number of varieties and races of main crops as well as of their wild and

Biodiversity in land-use systems
23
weedy relatives (Harlan 1975 cited by Altieri & Nicholls 2004). The pioneering work of
Vavilov in the 1920’s enumerated the centers of origin and centers of diversification,
which are sites of higher ratios of inter and intra-specific variability of cultivated plants.
Interestingly, most of them are located in the tropical area (Kloppenburg 1988). This
finding became the basis for the development of the in situ conservation approach for
maintaining and repositioning the diversity of native crops (Altieri & Nicholls 2004).
3.2 Biodiversity loss
Biodiversity loss has become a central topic in environmental science because of the
massive species extinction in the past few decades and its anthropogenic, ethical, social
and economic implications (Stocking 2003).
3.2.1 Factors causing the loss of biodiversity
It is widely accepted that human disturbance is the major threat natural ecosystems are
facing (Vitousek et al. 1997, Huang et al. 2002), and paradoxically humans themselves
are greatly affected by the provoked changes. Phenomena like the extinction of species
and the subsequent loss of genetic resources, or migration of species to marginal areas
due to land pressure and its collateral effects, have reached levels that could endanger
human survival (Stocking 2003). The triggering factors for this depletion chain are the
industrialization, technological expansion and by-products generation; the rapid
population increase and consequent rising demand for goods and services; and the
growth of environmentally-noxious consumption habits (Takacs 1996).
Between 1991 and 2000, an area twice the size of Portugal (around 500 000
km2) in the Brazilian Amazon was converted from natural areas to human land-use
purposes (CIFOR 2004). In Central America, about 95% of dry forest areas have been
converted into agricultural fields (Mooney et al. 1995). It is calculated that
approximately 2 billion ha of forested areas have disappeared since the beginning of the
agricultural revolution (Gascon et al. 2004). If these rates of deforestation were to
continue, the world’s rain forests would vanish within 100 years, provoking
innumerable harmful effects (Urquhart et al. 2007).

Biodiversity in land-use systems
24
The most relevant factors of biodiversity loss in natural ecosystems are listed and
discussed below.
Habitat fragmentation
Landscape fragmentation leads to changes in the landscape performance as a whole,
increasing the vulnerability of component species, and causing inbreeding and genetic
drift, low heterozygosis, fecundity reduction and diminishing of offspring viability. The
case of meta-populations is quite illustrative: small numbers of newcomer species shape
subpopulations in places that have lost their original populations, thus immigration
becomes the only way of restoring species composition in these areas (Laurance &
Vasconcelos 2004, Gascon et al. 2004).
The factors affecting biodiversity in a fragmented landscape are fragment size
(large areas are less affected than small ones), distance among patches (the longer the
distances the slower the movement and propagation of related organisms), and the
matrix effect, which combines interactions of the two above factors at landscape level.
In general, it can be said that the more patchy a landscape, the more diverse (Laurance
& Vasconcelos 2004).
Introduction of species
Closely linked to landscape fragmentation is the fact that prevalent species are replaced
by newer wide-ranging species, which are tolerant to disturbed habitats and harsh
conditions. Subsequently, native species are displaced and new predator species begin
to appear, provoking a cascade effect, while the damaging phenomena are masked by
the increase in biodiversity richness (Gascon et al. 2004).
Pollution
Economic growth reaches a detrimental point when the human population cannot be
maintained or increased without damaging the natural ecosystems and the processes
occurring in them (Gascon et al. 2004), as in the case of the biogeochemical cycles
affected by human drivers, such as emissions by industries, mining and agricultural by-
products to air, water and soil (Tilman 1999).

Biodiversity in land-use systems
25
3.2.2 Agriculture as a driver of biodiversity loss
Agriculture is commonly seen as an enemy of biodiversity rather than an ally, because
raising crops and livestock have changed vast areas of the available land, which is
estimated to be around 25 to 30% of the total land surface on the Earth (Srivastava et al.
1996, Altieri & Nicholls 2004).
The extinction of species associated and not associated with farming is a
concomitant phenomenon alongside the development of agriculture and human
colonization. A total of 34 mammal genera have become extinct as a consequence of the
first colonization of North America. The collapse of the Mayan Empire around 800 AD
is closely related, as the archeologists argue, to the modification of the Yucatan rain
forest conditions resulting from the unsustainable agricultural practices of the Mayan.
The heavy erosion periods in pre-Columbian Mexico coincide chronologically with the
widespread cultivation of maize (Zea mays) in sloped areas and the precedent
demographic explosion. Similarly, about 90% of the European Mediterranean mammals
became extinct after the agricultural expansion in the middle ages (McNeely 2004).
Today, monoculture farming is recognized as the main driving factor for the
extinction of species due to the expansion of agricultural land, which leads to the loss of
natural habitats, to the conversion of forested areas into homogeneous agricultural
landscapes with low habitat value for wildlife, to the loss of wild and beneficial species
as a direct consequence of agrochemical inputs and noxious practices, and finally to the
erosion of genetic resources due to the expansion of improved varieties and more
recently genetically modified organisms (Altieri & Nicholls 2004). In addition,
continuous overriding of ecological principles in the form of salinization, soil erosion,
pests and pathogens attacks, and a greater dependence on external inputs destabilize the
ecosystems and make them vulnerable to constant breakdowns (Altieri & Nicholls 1999,
2004).
Contemporary agricultural practices, i.e., expansion of farming frontiers,
hegemony of monoculture faming, over-application of agrochemicals, excessive water
consumption and heavy mechanization, have enhanced significantly the above negative
impacts (Altieri & Nicholls 1999, Brookfield et al. 2002). In the last millennia, from
about 20,000 edible species around 3000 were selected and only a few hundred of those
were cultivated in fields and gardens. In the twentieth century, less than 100 food
Biodiversity in land-use systems
26
species were considered significant enough to be included in the global list of
agricultural crops, and nowadays barely three species supply nearly 60% of the calories
derived from plants (Vietmeyer 1996). It is estimated that in the twentieth century, 75%
of the genetic diversity of agricultural crops has disappeared (Brookfield et al. 2002). A
similar phenomenon occurred in forestry, where nearly 2 billion ha of forests have
disappeared, and conifers dominate forest plantations, comprising roughly 80% of the
total area (Gascon et al. 2004). The situation with regard to livestock is worse, where
90% of the cattle raised belongs to only 14 species (Brookfield et al. 2002). The series
of these phenomena is currently known as the sixth major extinction events in the
history of life (Chapin et al. 2000).
3.3 Biodiversity conservation strategies
3.3.1 Conventional approaches for biodiversity conservation
The conservation approach aims at protecting ecosystems, populations or even
individuals from harmful impacts. Here, human activities in endangered ecosystems are
forbidden to allow these to recover to previous equilibrium stages, while a
precautionary action is taken to prevent later damage. Such an approach is applied in all
types of different cultures evolution (CONACIN 1998).
In the development of a conservation strategy, the following phases are
normally experienced. The development of a technology that implies the degradation of
an ecosystem in the medium-long term is followed by the detriment of the society by
the over-exploitation of the resources supplied by the system. Then comes the reduction
of human pressure on the resource and consequent return to high levels of productivity
and diversification (sometimes permanently), and finally the determination of the best
way of protecting the ecosystem, which generally oscillates between two extremes, i.e.,
strict protection and intensive use (McNeely 2004).
There is a consensus that conservation strategies must be formulated based on
a comprehensive set of both the biophysical and socioeconomic data of an area (Gascon
et al. 2004). Recently, was suggested the idea of controlled intervention rather than the
intangibility of protected areas, which is promoted by mass media and supported by
global and local policies (Gomez Pompa & Kaus 1999, McNeely 2004).

Biodiversity in land-use systems
27
Conservation strategies present some variations according to the scale of their
application:
At the global level, conservation strategies are focused on areas where the
biota is threatened, protecting them via different kinds of seclusion schemes, such as the
creation of protected areas or the use of a controlled resource exploitation regime as in
the case of national forests (WCPA 2007). Such strategies are criticized for their siege
mentality where certain ecosystems are confined and their integration into a global
system denied (Stocking 2003).
At the landscape level, there are countless principles and techniques, such as
landscape fragmentation, which intends to make heterogeneous areas interact
dynamically through the mobility of individual species and exchange of nutrients, water
and energy (Gascon et al. 2004).
At the species level, the key factor lies on the linkage between species and
habitat conservation. Therefore, conservationist measures should attempt to safeguard
natural habitats for wild species and populations, and improve the management of
human-modified habitats, such as farmlands (Srivastava et al. 1996).
In the conservation of agricultural species, two approaches have been widely
used: ex situ and in situ. The ex situ approach removes the endangered species from
their original but threatened habitats and places them in a new location to be monitored
by humans, frequently using laboratory techniques to maintain reproductive germs. The
in situ approach refers to the protection given to the species in their natural habitats,
maintaining the populations in the environment where they have developed their
characteristics, which are essential factor in safeguarding their evolution (Brookfield et
al. 2002).
3.3.2 Biodiversity conservation in land-use systems
The most productive agricultural areas in the world coincide with the most biodiverse
ones, (Stocking et al. 2003) and these areas are expanding resulting in extensive
monocultures.
On the other hand, not all forms of agriculture lead unavoidably to the
simplification of biodiversity. Some farming systems, especially in developing
countries, manage to maintain higher degrees of plant diversity in forms of polycultures

Biodiversity in land-use systems
28
and/or agroforestry patterns (Altieri & Nicholls 2004). Then it is possible to extend the
principles of natural systems to land-use systems. Some theoretical arguments like the
niche complementary hypothesis states that species-mixed rather than mono-specific
communities are more stable and efficient in the use of resources and in coping with
environmental disturbances, pests, diseases, and even seed predators (Tilman 1997,
Ashton 2000, Naeem et al. 2003, Samu 2003, Atta-Krah et al. 2004).
In land-use systems, the users arrange the component species in groups
according to their needs: the first group provides the target product or service, a second
group complementary to the first, provides functions and/or services, and a third group
is able to substitute the other two in their production of goods and services. Eventually a
fourth group can exist, benefiting not the people but the environment (Bates 1999).
That is why the sustainability of a system can only be fulfilled with the
utilization of multiple benefit species, or with the integration of various species
performing various roles involving the three main dimensions: economic, social and
environmental (Bates 1999), and furthermore the application and promotion of
practices, technologies and policies that enhance the productivity and provide multiple
goods and services (Gollin & Smale 1999, CDB V 2000 cited by Stocking et al. 2003).
Local land-use systems as a conservation strategy
Local farmers use their indigenous knowledge to develop strategies to manage the
resources appropriately: preventing oscillating markets and environmental constraints,
diversifying the use of the landscape and mixing their agricultural practices with off-
farm activities (Srivastava et al. 1996, Brookfield et al. 2002, Altieri & Nicholls 2004).
However, there are factors that support the inclusion of small farmers in a
conservation framework, such as their considerable participation in global food
production: around 15 to 20% of world’s supplies are provided by traditional multiple-
cropping systems (Altieri & Nicholls 2004). It is possible to extrapolate these farming
practices, despite the great diversity of environments and factors: evidence suggests that
farmers under similar agro-ecological situations take similar functional-aspect decisions
(Tomich et al. 2004).
Complementarily, alternative land-use systems like agroforestry have gained
attention as integrated approaches to biodiversity conservation of natural reserves

Biodiversity in land-use systems
29
(Sánchez 1995, Dobson et al. 1997, Leakey 1999) because of their ability to maintain a
high proportion of species compared to natural forests (about 50 to 80%) and because
they prevent the conversion into mono-specific crop lands or grasslands (Huang et al.
2002).
Research and management
Biophysical research concerning biodiversity in different land-use systems has arrived
at two main conclusions. First, the increase in biodiversity in landscapes through
biodiversity islands which strengthens the resilience of the surrounding areas depending
on their size and connectivity (McNeely 2004). Second, biodiversity is increased at
parcel/system level by promoting biophysical interactions. Research in interactions is
covered by the study of invasive species management, and interactions among
established species (Richardson 1999, McNeely 2004).
Biodiversity management is possible only through an integrative framework,
which needs various levels and groups of interest (local, regional and national), different
stakeholders (small farmers, indigenous groups, civil society, research institutions,
public agencies and private investors), a multi-output platform that includes a diversity
of outputs and beneficiaries in terms of food security, income generation, environmental
services, and a financial support mechanism, such as a taxing system or payment for
environmental services (Altieri & Nicholls 1999, Callo-Concha 2003, McNeely 2004).
Nevertheless, there are important aspects to consider. First, from the farmers’
point of view, the principal interest lies in the improvement of their lives rather than in
conservation, therefore, no agroecosystem could be maintained as a museum, neither for
a crop plant or a field method (Brookfield 2002). Second, the assumption that
agricultural practices that promote biodiversity are not yet generalized nor well
integrated with local ecosystems, livelihoods and households means that the promotion
of these practices cannot be done through the conventional extension model of
technology transfer (Stocking et al. 2003).
3.3.3 From agrobiodiversity to agrodiversity
The term agrodiversity entered the literature only in the 1990’s in the PLEC (People,
Land Management and Environmental Change) Project, which attempted to develop

Biodiversity in land-use systems
30
biodiversity management models in agricultural ecosystems based on locally developed
management systems that embrace ecosystem functions and processes (see section
3.4.4) (PLEC 2007).
It is important to distinguish between biodiversity and agrobiodiversity, which
are linked but not synonymous concepts. Agricultural diversity, or agrodiversity in
short, means “the many ways in which farmers use the natural diversity for production”,
which includes not only their choice of crops but also their management of land, water,
environment and biota as a whole; in this concept agrobiodiversity or agricultural
biodiversity is considered a subset (Brookfield et al. 2002).
The components of agrodiversity are: agrobiodiversity; management diversity
of water, biota and other physical resources; biophysical diversity related to the physical
environment; and organizational diversity, i.e., the manner of organization of resources
and workforces.
Although we intend to differentiate agrobiodiversity from the larger array of
biodiversity in general, we have to say that the boundaries between them are not very
clear-cut. Agroecosystems, especially at small-farmers’ scale, are highly dynamic,
changing continuously in time and space according to biological, cultural,
socioeconomic and environmental factors (Altieri & Nicholls 1999, Stocking 2003), as
well as other less conventional factors, such as changes in technology, consumer
preferences, rising fuel prices, alternation of pricing policies and, more recently, global
warming and genetic manipulation (Vietmeyer 1996, Callo-Concha 2002).
However, we should keep in mind that the premise of agroecosystems is the
production of specific goods and values for human consumption, although it may lead to
a reduction in species diversity due to the high level of disturbance, i.e., agricultural
practices (Swift et al. 2004).
Components and roles of agrobiodiversity
With respect to logistical aspects, agrobiodiversity has two important components: (1)
planned biodiversity, included purposely by the farmer (mainly crops and animals),
which depends on management inputs and spatial and temporal arrangements on the
farm, and (2) associated biodiversity, which includes all remnant flora, fauna, and
microorganisms that depend heavily on the system’s management and its structure

Biodiversity in land-use systems
31
(Vandermeer & Perfecto 1995 cited by Altieri & Nicholls 2004, Swift et al. 2004)
(Figure 3.1).
Figure 3.1 Relationship between planned biodiversity and associated biodiversity and
how both influence ecosystem functions. Source: Modified from Vandemeer & Perfecto (1995) cited by Altieri & Nicholls (2004)
The roles that biodiversity components play in the operation of an
agroecosystem have been classified in three groups: (1) productive biota, trees and
animals determined by farmers to perform specific roles in the system, (2) resource
biota, i.e., organisms that contribute to productivity through pollination, biological
control and decomposition, and (3) destructive biota, i.e., weeds, insects, pests and
microbial pathogens (Swift & Anderson 1993 cited by Altieri & Nicholls 2004).
In natural ecosystems, the internal regulation of functions is substantially a
product of plant biodiversity through biological synergisms and antagonisms; this form
of control is progressively lost under agricultural intensification and simplification.
Monocultures require external inputs, such as petrochemical energy and manpower to
perform such functions (Altieri & Nicholls 1999, Swift et al. 2004). That is why
biodiversity functions in agroecosystems are still poorly understood, even though is
Agroecosystems management
Planned biodiversity
Associated biodiversity
Biodiversity of surrounding biodiversity
influences
influences
Ecosystem function Promote conditions
Direct function
Indirect function

Biodiversity in land-use systems
32
known that agriculture normally results in less rich and lower planned diversity, genetic
variation, and presence of functional groups (Swift et al. 2004).
However, there are some indicators of the agroecosystem’s capacity to
enhance agrobiodiversity, such as the permanence of various crops, the diversity of
vegetation within and surrounding the system, the intensity of management, or the
extent of the isolation from natural vegetation (Altieri & Nicholls 1999).
Biodiversity diversification factors
The degree of determinism of the vegetation structure in a community is influenced by
the canopy disturbance, the resources availability and a combination of both. Thus, the
combination of this ‘threshold opportunity’ factor plus stochastic processes makes the
community structure virtually unpredictable (Ashton 2000).
In all cases, coexistence occurs when resource demand differs among species
and these are replenished to levels that allow competitors to survive. Sometimes
homogeneous plantations may contribute through the modification of original
vegetation to the regeneration of non-frequent species or the penetration of pioneers
(Ashton 2000). Therefore, mixtures can be more efficient ecologically in the resource
exploitation over time through their succession or by maximizing the yield of harvested
products. Such mechanisms are applied empirically by smallholders, spreading the risk
and perhaps increasing productivity (Izac & Sánchez 2001).
Nonetheless, there are still some knowledge gaps regarding species’ co-
habitation, such as the differential response to light of tropical evergreen woody species,
distances between individuals, population densities, or correlations between specific
predation and pathogenicity (Ashton 2000).
However, there is a little evidence that farmers may choose not to plant
mixtures or to selectively thin or lop their plantations for ecological reasons. It can be
assumed that the reasons are more pragmatic.
Biodiversity in land-use systems
33
3.4 Biodiversity assessment
3.4.1 Approaches to valuing biodiversity
For the reasons given above, assigning a value to biodiversity is a complex and
demanding task. There are several considerations to be taken into account. First there is
the intrinsic value, which assumes that the essential value of biodiversity is based on its
mere existence and its cultural, social, aesthetic and ethical significance (Suzuki
Foundation 2007, Shiva 1993), second the utilitarian value, that refers to the direct
utility that biodiversity provides for commercial sectors of society, such as agricultural,
pharmaceutical and infrastructural, then follows the ‘serependic’, potential or bequest
value, based on the belief that biodiversity should be conserved for the benefit of future
generations, founded on the theory that any species may have a potential value that we
have not yet discovered (Harrison et al. 2004). Finally, the supportive value refers to
ecological functions in form of goods and services and ecosystem stability and
resilience (Weesie & van Andel 2003, Harrison et al. 2004, Swift et al. 2004).
3.4.2 Evaluating biodiversity
Levels of evaluation
As stated previously, biological diversity has been analyzed at three levels: genetic,
species and ecosystems; thus, the ecological valuation analysis, conceptualization and
measurements are done at the same levels.
At genetic level, the differences among species are established in terms of
allelic frequencies, phenotypic traits and DNA sequences. In general, these perspectives
and methodologies focus on other aspects (rooting species origins or identifying
relationships), and therefore do not coincide with the objectives of this study.
At species level, diversity is understood as a complete catalogue of the
distribution and abundance of species in a particular site, but since it is not easy to carry
out a full inventory, the catalogue is generally based on samples of populations. There
are three main terms for measuring biodiversity over spatial scales: (1) alpha diversity,
within a particular area or ecosystem, usually expressed by the number of species
(richness), (2) beta diversity, a comparison of diversity between ecosystems, where the
species that are unique to each ecosystem are compared to each other, and (3) gamma or

Biodiversity in land-use systems
34
geographic-scale diversity, which is a measure of the overall species diversity for
different ecosystems within a region (Harrison et al. 2004).
At ecosystem level, biodiversity evaluation covers multiple relationships at
various stages, and involves a series of factors, making the process very complex and
less clear.
Other methods combine several factors into one specific function, such as the
ecosystem health index, which is an overall indicator of integrity between ecological
and human systems and their functioning (Nunes et al. 2001).
In addition, mapping methods can be used to carry out measurements at a
larger scale, identifying types of vegetation using geographical information systems and
remote sensing tools (Podolsky 1995).
Diversity indices
Species level has become central in biodiversity assessment procedures and the
definition of indices. According their ability to perform different measurements,
biodiversity indices are grouped in richness, abundance or both. (1) Indices of species
richness, which estimate the number of species for a sample unit, and are optimally
applied when the target species is enumerated and identified for a defined space and
time. Among the most commonly used are Margalef’s index and Menhinick’s index, (2)
Indices of abundance, which focus on the evenness and unevenness of the species’
distribution. There are four main models: log-normal, geometric, logarithmic and the
Mac Arthur's broken-stick distribution, and (3) Indices based on the proportional
abundance of species, which through a single measurement give both the abundance and
evenness at the same time. The most commonly used are the Shannon index and the
Simpson index.
There are other complex indices that integrate several components at the same
time, which were developed for different management purposes, such as the SDI
(species diversity index) that ranks political units of administration according to their
infrastructure and supervision capacities. In addition, we have the BTI (biodiversity
threat index) based on population density, area of disturbance, change in areas of
croplands, and percentage of annual loss of forest, which gives projections of
biodiversity loss in land-use change scenarios, and finally the CRI (capacity response

Biodiversity in land-use systems
35
index) that calculates the capacity of an administrative unit to respond to biodiversity
threats (OECD 2002).
The advantages using indices for biodiversity assessment are that they provide
a transparent and repeatable evaluation framework criterion, allowing a direct
comparison of management and conservation strategies, and permit an evaluation even
when some of the data are missing (Nunes et al. 2001). A disadvantage is that there are
too many indices differing only slightly from one another (Lek 2005), and since “(…) it
is a single statistic that only summarizes characteristics and it is not very informative by
itself” bear the risk of becoming a non-concept (Hulbert 1971 and Pielou 1975 cited by
Noss 1990).
3.4.3 Alternative assessment frameworks
In the evaluation framework established above, the functions performed by ecosystems
are underestimated or simply not considered, therefore de Groot (1994) indicated that at
least some functions should be included in the assessment, such as life support, carrier
of processes, production, and information flow, to make the assessment framework
more utilitarian (Nunes 2001).
Hierarchical characterization approach
Noss (1990) suggested that biodiversity should be treated at various levels of
organization and at multiple temporal scales, and proposed the ‘hierarchical
characterization’ approach, based on the attributes recognized initially by Franklin
(1988), such as composition, structure and function. This approach nests these attributes
into a hierarchy that incorporates elements of each attribute at four levels of
organization: regional-landscape, community-ecosystem, population-species and
genetic.
Hierarchical characterization is based on the definition of indicators that
perform as measurable surrogates of the influential factors. Ideally, an indicator should
be sensitive enough to provide an early warning of change, it should be distributed over
a broad geographical area or otherwise widely applicable, and it should be capable of
providing a continuous assessment over a wide range of stress. Furthermore, it should
be independent of sample size, easy and cost-effective to measure, collect, test and

Biodiversity in land-use systems
36
calculate, be able to provide information to distinguish its origin whether from natural
cycles or induced by anthropogenic stress, and finally be able to represent significantly
the targeted phenomenon (Franklin 1988). Since no single indicator possesses all these
desirable properties, a set of complementary indicators is required.
In general terms, the indicators are in the following four main crossing scales:
- Genetic: produces very specific and reliable information concerning traces of
evolution trends and taxonomic proximities, but is restricted to specific demands
and the availability of technological resources.
- Population-species: applies single-species indicators due to its relative simplicity
and tangibility. The most well known indicator group species considers ecological
indicators, keystone species, umbrella species, and vulnerable species (IUCN 2007).
- Community-ecosystem: combines interacting populations of relevant species and
abiotic components of the ecosystem, and generates variable indicators well known
in community ecology, such as species richness, diversity dominance, diversity
curves, life forms, guild proportions and other compositional measures.
- Regional-landscape: combines functionally the habitats in a landscape mosaic
related to animal movement. Its major determinants are ecotone differences,
biogeochemical, hydrologic and energy flow disturbances, while the major
controllers are heterogeneity, patch size, perimeter-area ratio, and connectivity. At
this scale, the inventory and monitoring are done through aerial photographs and
satellite imagery.
In implementing this evaluation framework, Noss (1990) suggests the
following steps. First, the final objectives and the mid-term goals of the evaluation
should be defined. Second, data gathering and integration should be at the beginning
establish the baseline conditions and later identify hot spots, e.g., ecosystems at risk.
Third, specific questions to be answered by monitoring and, based on these questions,
indicators of structure, function and composition are defined. Finally, control areas and
treatments should be established, sampling schemes design and implemented, and
relationships between indicators validated.

Biodiversity in land-use systems
37
3.4.4 Agrobiodiversity assessment
Typical biodiversity assessment methods are not capable of depicting the full picture of
biodiversity in small farmers’ land-use systems, mainly because they cannot cope with
their inherent complexity (Stocking et al. 2003).
Alternatively, several methods have been proposed, e.g., method developed by
PLEC Biodiversity Advisory Group, which besides trying to widen the evaluation
scope, focuses on ensuring the method’s repeatability and quality to meet international
standards. PLEC’s methodology is based on the following principles: each sample area
is stratified based on a particular field type; the samples selected have to show a great
variety of species; multiple sample plots of mixed dimensions are surveyed; and, to
capture temporal variations, the plots are re-assessed at appropriate intervals.
The data analysis can include classic biodiversity indices, i.e., species richness
and utility within each plot, within field type and within land-use stage; similarity
analysis, such as S∅renson’s index calculation under three situations (temporal
variations of species composition in the same plot, replication sample area variations of
species composition in the same field type, and field type variations of species
composition within the same land-use stage), and species-area curves and abundance-
diversity curves (Zarin et al. 2002).
3.5 Functional biodiversity
3.5.1 Antecedents and conceptualization
Functional biodiversity was first mentioned in a specialists meeting held in Mitwitz,
Germany, organized by E.D. Schulz and H.A. Mooney in 1991, while launching a
research program by SCOPE (Scientific Committee on Problems of the Environment)
whose aim was to assess the state of the knowledge and the role of biodiversity in all
dimensions and at ecosystem and landscape levels (Mooney 2002).
An intense debate soon followed about the role of biodiversity in the
functioning of ecosystems, and the type of relationships among the factors involved.
This spotlighted this topic as one of the main issues of contemporary ecology (Naeem et
al. 2003, Swift et al. 2004).
Functional biodiversity is an alternative perspective in the study of
biodiversity in ecosystems, and is based on the heterogeneity and dynamism of

Biodiversity in land-use systems
38
community components, and on the feedback of biophysical and socioeconomic
variations.
Functional biodiversity assigns more weight to biodiversity components’ roles
in ecosystems than to the number of species per unit of area, or similar quantitative
approaches. This finally provides sustainability to the system through the enhancement
and intensification of the processes (Altieri & Nicholls 1999).
As functional biodiversity derives from the accurateness of plant species
number and agroecosystem stability, the optimal functionality depends not on finding a
high number of species per se, but on determining their correct assemblage
(Vandermeer 1995).
Based on the above, the attention shifted to the study of species’ cohorts,
categorized according to their ability to carry out certain types of activities (Huang et al.
2002). This categorization led to the identification of types of desirable biodiversity,
i.e., functional groups, which should be capable of supporting, maintaining and
enhancing specific ecological services (Altieri & Nicholls 1999).
Nevertheless, functional biodiversity is an integrative concept, and several
branches need to be addressed from one direction. Franklin (1988) developed a frame
that can operationalize the functional biodiversity concept, defining the three
operational groups: (1) compositional, based on the identity and variety of elements in a
collection, including species lists and measures of species and genetic diversity, (2)
structural, based on the physical organization, patterns within communities and at
various scales, and (3) functional, involving ecological and evolutionary processes,
including gene flow, disturbances and nutrient cycling (Figure 3.2).

Biodiversity in land-use systems
39
Figure 3.2 Operationalization of the functional biodiversity study through the
fragmentation/integration on compositional, structural and functional issues. Source: Adapted from Franklin (1988)
3.5.2 Theoretical background
The Vitousek-Hooper relationship shows that the essential functions of an ecosystem
require a minimum level of biodiversity to optimize its performance, and that effect is
accomplished with a relatively low number of individuals, which normally consist of a
selection of representative functional groups (Vitousek & Hooper 1993).
There are three types possible interactions between a given ecosystem function
and the number of species involved in: in type 1, the ecosystem function is performed
optimally by a small number of species; in type 2, the supply of the ecosystem function
Landscape patterns
Population
st
Landscape types
Communities ecosystems
Species, populations
STRUCTURAL
Landscape processes
Ecosystem processes, interspecific interactions
Demographic processes
Physiognomy, habitat structure
FUNCTIONAL
Genetic struture
Genetic process
Genes
COMPOSITIONAL
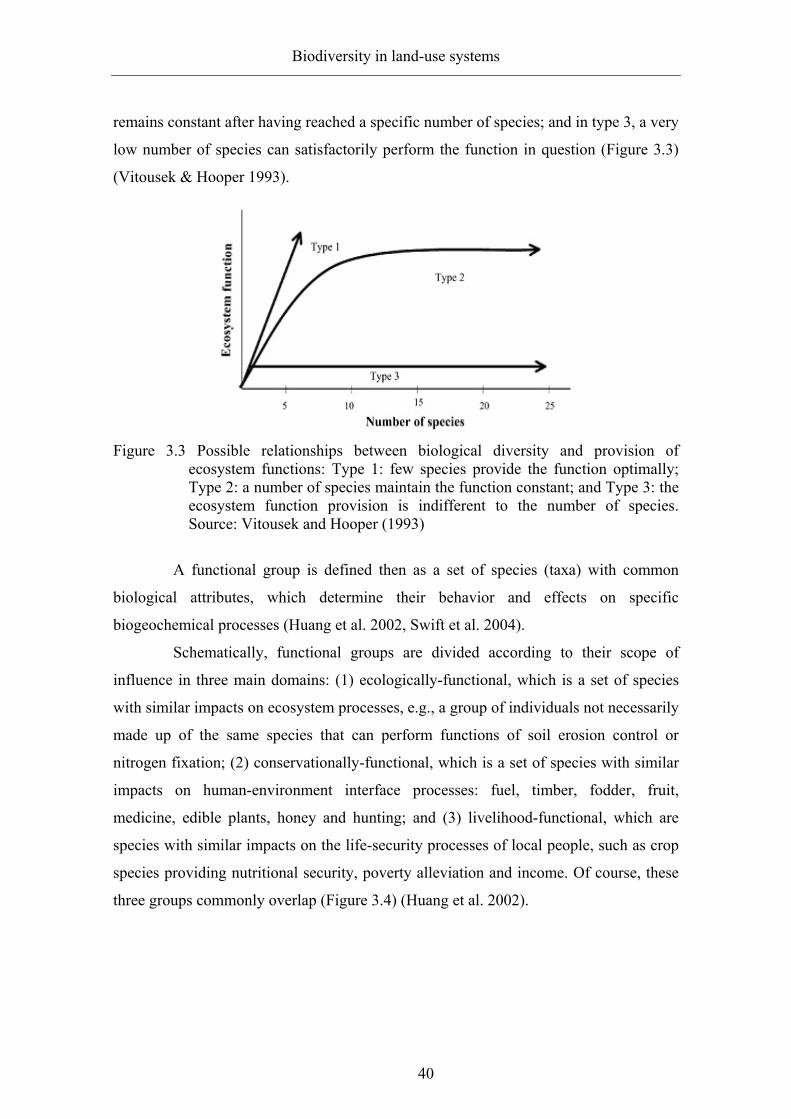
Biodiversity in land-use systems
40
remains constant after having reached a specific number of species; and in type 3, a very
low number of species can satisfactorily perform the function in question (Figure 3.3)
(Vitousek & Hooper 1993).
Figure 3.3 Possible relationships between biological diversity and provision of
ecosystem functions: Type 1: few species provide the function optimally; Type 2: a number of species maintain the function constant; and Type 3: the ecosystem function provision is indifferent to the number of species. Source: Vitousek and Hooper (1993)
A functional group is defined then as a set of species (taxa) with common
biological attributes, which determine their behavior and effects on specific
biogeochemical processes (Huang et al. 2002, Swift et al. 2004).
Schematically, functional groups are divided according to their scope of
influence in three main domains: (1) ecologically-functional, which is a set of species
with similar impacts on ecosystem processes, e.g., a group of individuals not necessarily
made up of the same species that can perform functions of soil erosion control or
nitrogen fixation; (2) conservationally-functional, which is a set of species with similar
impacts on human-environment interface processes: fuel, timber, fodder, fruit,
medicine, edible plants, honey and hunting; and (3) livelihood-functional, which are
species with similar impacts on the life-security processes of local people, such as crop
species providing nutritional security, poverty alleviation and income. Of course, these
three groups commonly overlap (Figure 3.4) (Huang et al. 2002).

Biodiversity in land-use systems
41
Figure 3.4 Three main functional biodiversity groups, the most frequent activities within
each, overlapping and trends in human-oriented land-use systems. Source: Modified from Huang et al. (2002)
Taxonomically, the main functional groups are: (1) primary producers, mainly
vegetation of different strata as the major source of raw materials; (2) service providers,
a large community of invertebrates, such as protists, bacteria and fungi that carry out
functions of decomposition and mineralization of organic matter; and (3) primary and
secondary regulators, organisms in charge of regulating biological influences on water
flow, soil cover, organic matter content and soil activity, etc. (Swift et al. 2004) (Figure
3.5).
Soil erosion
Polinization
Nitrogen fixation
Firewood
Timber
Fodder
Fruit
Medicine
Food
Honey Hunting
Ecologically functional
Livelihood functional
Conservationally functional
Water purification
Air cleaning

Biodiversity in land-use systems
42
Figure 3.5 Hierarchical relationships between categories of functional groups. Source: Modified from Swift et al. (2004)
Certain functional groups seem strongly influence certain manifestations of
biodiversity, e.g., pine trees storing carbon, while others, like microorganisms, because
of their high degree of redundancy may be functionally neutral, but at the same time
very resilient. For that reason, no principles of biodiversity maintenance can be applied
across all functional groups and environmental circumstances (Swift et al. 2004).
As the total (agro)ecosystem diversity and services are determined by the
nature of the plant community in interaction with human influence, it is possible to
reduce the biodiversity substantially down to a scale which maintains the productivity
and resilience of the system. Then, certain ecosystem functions can be provided by a
minimum essential diversity, represented by a few functionally distinct species, or a few
representatives of functional groups. The total diversity will then depend on the number
of recognized functions and on the degree of overlapping of functional groups (Swift et
al. 2004, Tomich et al. 2004). However, in multifunctional ecosystems, a higher number
Primary producers (sources of raw materials)
Trees Shrubs Herbs Vegetation
Service providers (decomposers, transformers,
…) Fungi Bacteria Protists (…)
Primary regulators (of flows on air, soil & water)
Pollinator Herbivores Parasites Various (…)
Secondary regulators (of flows on air, soil & water)
Hyper- Predators Various (…)
Environmental service provisionFlow of energy and

Biodiversity in land-use systems
43
of species is necessary to promote each individual process and the overall functioning of
the system (Hector & Bagchi 2007).
The study of functional biodiversity has been made operative through
approaches such as the analytic hierarchy processes (AHP), which generate a
distinctness index of functional groups of various land-use systems and their impact on
biodiversity conservation through the arrangement and comparison of criteria at various
levels (Huang et al. 2002).
3.5.3 Functional biodiversity in land-use systems
Crop plants and animals, like all other organisms, need systems in place for uptake and
metabolization of nutrients and water, protection against pests, diseases and
competition. These services are provided fundamentally by the genetic make-up of each
organism, and are supplemented by the interactions of adjacent organisms (Altieri n/d).
In human-managed ecosystems, the species are not introduced randomly but in
oriented patterns. Yet the species used are not always the same, i.e., similar demands
could be supplied by different providers, e.g., in post slash-and-burn systems,
carbohydrates are supplied by cassava in Latin America, banana in southeast Asia, and
yam in Africa (Bates 1999).
As a consequence, the utility of biodiversity in land-use systems depends on
the way the systems cope with the impacts that disturb them, and how they strengthen
their stability and resilience (Altieri n/d, Wolfe 2001), and at the same time generate
useful outputs (Bates 1999).
Some agricultural practices are known to be better than others in their potential
to enhance functional biodiversity (Altieri & Nicholls 2004), and farmers participate
actively in their selection (Swift et al. 2004). Tropical polycultures are good examples
of such systems, characterized by a higher number of intercropped perennial and annual
species, more intense interactions, lower costs, greater energy efficiency, greater natural
biodiversity, more efficient internal fertilization processes, stronger pest and weed
restrictions, and a wider range of products in different seasons (Wolfe 2000, 2001).

Biodiversity in land-use systems
44
Expectations, perspectives
The functional biodiversity approach is new, and the lack of consensus has led to
divergent products. Here lie the challenges for future research. Among these challenges
are full understanding of biodiversity and ecosystem functioning, quantification of
ecosystem services, increasing in the scale of study from small and single functional
groups to landscape scale and different trophic levels, and finally the key challenge:
how important is biodiversity in system processes over short- and long-term periods
(Mooney 2002).
The first integrative approach for evaluating biodiversity was applied by
Franklin (1988), who suggested defining indicators for depicting the main
compositional, structural and operational functions. Later in 1990 Noss applied a
hierarchical characterization to these indicators. Recently Huang et al. (2002) extended
this approach trough the analytic hierarchy process.
This study evaluates biodiversity within this frame, coping the inherent
comple and variability of functional biodiversity-related phenomena through the
application of integrative methods.
Environmental services
45
4 ENVIRONMENTAL SERVICES From the worldwide demand to the Brazilian Amazon case
4.1 A conceptual framework of environmental services
4.1.1 Background and conceptualization
Once environmental services were taken for granted or, if perceived at all, they were
viewed as gifts of nature. Such a vision has changed since the end of the twentieth
century, due to political, socio-economic and ecological forces, which warned us about
the degradation of the environment and the goods and services supply (Tomich et al.
2004, van Noordwijk et al. 2004).
Ecosystem or environmental services refer to a wide range of conditions,
processes and goods through which natural ecosystems help to sustain and fulfill human
needs (Daily et al. 1997). Among these benefits are products that already have a value
and are commercialized in several ways (Viana et al. 2006).
In addition, the concept includes goods that refer to tangible, materials and
services that refer to processes themselves (Costanza et al. 1997). There is also the
distinction between environmental services and environmental functions, the latter
performed by nature and oriented to its own maintenance and non-human use; and
environmental processes, performed by the nature without being part of any established
framework (Brown et al. 2006). There is also the distinction between ecosystemic
services when they are provided by nature but are not used and environmental services
when their use is addressed by humans (Boyd & Banzhaf 2006).
The operationalization of the concept of environmental services is based on
the relationship between beneficiaries and providers (Tomich et al. 2004). The
extrapolation of this discussion on diplomatic level involving different interest groups
with the aim of obtaining subventions for preservation activities has become very
politically relevant. Furthermore, due to the increasing number of degraded ecosystems
and affected parties, the focus has shifted to safeguarding the vulnerability of
individuals, communities and nations (Daily et al. 1997, Pérez 2004).
Research on environmental services deals mainly with the following issues:
understanding the pathways of resources generation, use and damage, recognition of the
resources’ spatial extent and distribution patterns as potential providers, development of

Environmental services
46
indicators for recognition and monitoring environmental services, and simplification
and making more accurate the measurements and validation of environmental services
to facilitate negotiations among stakeholders (Tomich et al. 2004).
The determinant factors in any scheme of environmental services provision are
natural capital, i.e., inherent richness of flora and fauna, soil and water, guardianship for
preventing the destruction of the natural capital, and human capital, active management
or stewardship (Tomich et al. 2004). The type and extent of interaction among these
components will determine the degree of generation or degradation of the
environmental services in a given system.
4.1.2 Classification of environmental services
The most pragmatic attempts to classify environmental services group them into four
main groups: greenhouse gases fixation, biodiversity conservation, water management,
and scenic beauty (Chaves & Lobo 2000); the Alternatives to Slash and Burning (ASB)
consortium modified and extended this classification (Table 4.1).
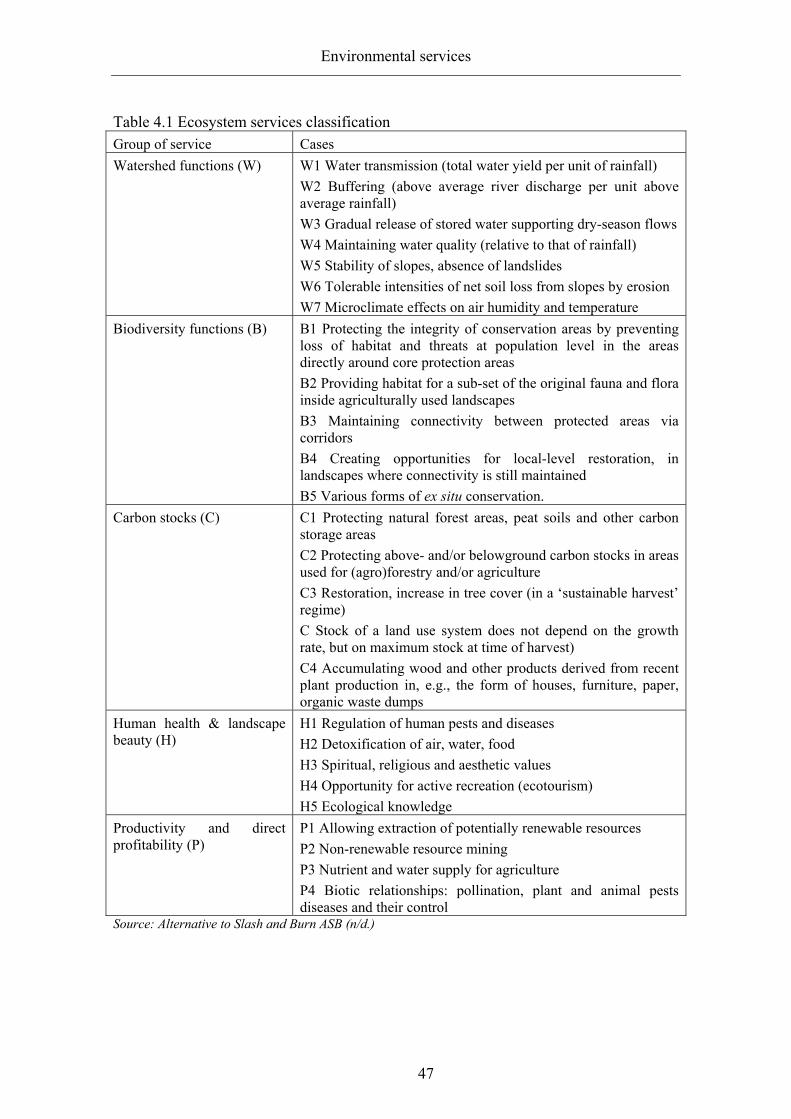
Environmental services
47
Table 4.1 Ecosystem services classification Group of service Cases Watershed functions (W)
W1 Water transmission (total water yield per unit of rainfall) W2 Buffering (above average river discharge per unit above average rainfall) W3 Gradual release of stored water supporting dry-season flows W4 Maintaining water quality (relative to that of rainfall) W5 Stability of slopes, absence of landslides W6 Tolerable intensities of net soil loss from slopes by erosion W7 Microclimate effects on air humidity and temperature
Biodiversity functions (B)
B1 Protecting the integrity of conservation areas by preventing loss of habitat and threats at population level in the areas directly around core protection areas B2 Providing habitat for a sub-set of the original fauna and flora inside agriculturally used landscapes B3 Maintaining connectivity between protected areas via corridors B4 Creating opportunities for local-level restoration, in landscapes where connectivity is still maintained B5 Various forms of ex situ conservation.
Carbon stocks (C)
C1 Protecting natural forest areas, peat soils and other carbon storage areas C2 Protecting above- and/or belowground carbon stocks in areas used for (agro)forestry and/or agriculture C3 Restoration, increase in tree cover (in a ‘sustainable harvest’ regime) C Stock of a land use system does not depend on the growth rate, but on maximum stock at time of harvest) C4 Accumulating wood and other products derived from recent plant production in, e.g., the form of houses, furniture, paper, organic waste dumps
Human health & landscape beauty (H)
H1 Regulation of human pests and diseases H2 Detoxification of air, water, food H3 Spiritual, religious and aesthetic values H4 Opportunity for active recreation (ecotourism) H5 Ecological knowledge
Productivity and direct profitability (P)
P1 Allowing extraction of potentially renewable resources P2 Non-renewable resource mining P3 Nutrient and water supply for agriculture P4 Biotic relationships: pollination, plant and animal pests diseases and their control
Source: Alternative to Slash and Burn ASB (n/d.)
Environmental services
48
4.1.3 Assessment of environmental services
Environmental services have been greatly under-valued because they are not traded in
formal markets but treated as public goods and consequently private owners have had
no way of obtaining benefits from them. This is an issue that has to be solved in order to
define an assessment platform, which should permit both the conservation of natural
resources and a socially rewarding mechanism.
But what should be assessed and how should it be assessed? There are several answers
to these two questions. One could assess the contribution to the maintenance of a
system’s status, where every structure and function has a specific purpose and therefore
a value (Costanza 2000). Or the qualities of each service referring to different demand-
scales, e.g., including the recreational and aesthetic services of a forest, beyond the
explicit goods and services provided, such as sustainability, stability and resilience
(Costanza & Farber 2002). One could also assess the relative ability of certain systems
to perform certain services, like forests compared to other land-use systems with respect
to carbon sequestration. Studies could also be based on the time frame, where the needs
of coming generations are taken into account, as in the case of biological resources,
whose use has not been yet discovered but which are already in danger of extinction
(Viana et al. 2006).
In practical terms, political decisions about what to assess, depend on how natural
systems function and how societies alter them, as well as on the strategies developed to
protect and preserve those resources (Costanza & Farber 2002). This involves
determining the value of environmental services at different levels, i.e., ecological,
sociocultural and economic (de Groot et al. 2002, Viana et al. 2006).
Ecological value focuses on ensuring the continued availability of ecosystem
functions. The use of goods and services should be limited to sustainable levels, which
are determined by ecological criteria, such as integrity, resilience and resistance. Since
most functions and related ecosystem processes are interlinked, sustainable use should
be determined under complex system conditions, taking into account the dynamic
interactions between functions, values and processes (Boumans et al. 2002, Limburg et
al. 2002).
Socio-cultural value is based on the perception of the society who determines
the importance of natural ecosystems and their functions in human development.
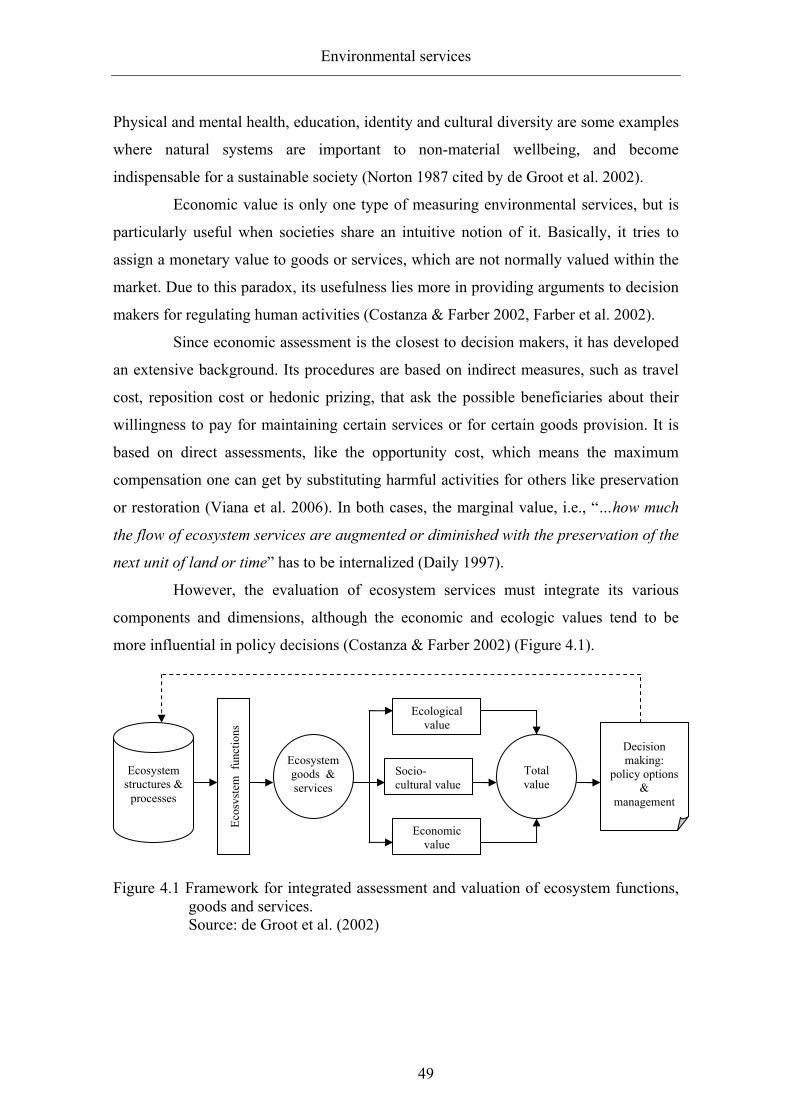
Environmental services
49
Physical and mental health, education, identity and cultural diversity are some examples
where natural systems are important to non-material wellbeing, and become
indispensable for a sustainable society (Norton 1987 cited by de Groot et al. 2002).
Economic value is only one type of measuring environmental services, but is
particularly useful when societies share an intuitive notion of it. Basically, it tries to
assign a monetary value to goods or services, which are not normally valued within the
market. Due to this paradox, its usefulness lies more in providing arguments to decision
makers for regulating human activities (Costanza & Farber 2002, Farber et al. 2002).
Since economic assessment is the closest to decision makers, it has developed
an extensive background. Its procedures are based on indirect measures, such as travel
cost, reposition cost or hedonic prizing, that ask the possible beneficiaries about their
willingness to pay for maintaining certain services or for certain goods provision. It is
based on direct assessments, like the opportunity cost, which means the maximum
compensation one can get by substituting harmful activities for others like preservation
or restoration (Viana et al. 2006). In both cases, the marginal value, i.e., “…how much
the flow of ecosystem services are augmented or diminished with the preservation of the
next unit of land or time” has to be internalized (Daily 1997). However, the evaluation of ecosystem services must integrate its various
components and dimensions, although the economic and ecologic values tend to be
more influential in policy decisions (Costanza & Farber 2002) (Figure 4.1).
Figure 4.1 Framework for integrated assessment and valuation of ecosystem functions,
goods and services. Source: de Groot et al. (2002)
Ecosystem structures &
processes
Ecosystem goods & services
Ecological value
Socio-cultural value
Economic value
Total value
Decision making:
policy options &
management
Ecos
yste
m f
unct
ions

Environmental services
50
4.1.4 Payment for environmental services
The payment for environmental services refers to a contractual transaction between a
buyer and a seller for a series of practices capable of assuring environmental benefits.
This transaction is facilitated by the market, which is understood as “a series of
regulations that settle the principles on which a buyer, who so far made use of the same
service as a common good, recognizes it as valuable for himself and society, and
accepts to pay for it henceforth” (van Noordwijk et al. 2004).
The natural capital through the providers’ intermediation reaches the
beneficiaries, while the process is addressed by compensation mechanisms and is
triggered by the cost of opportunity (Figure 4.2).
Figure 4.2 Scheme of recognition and payment for environmental services. Source: Modified from van Noordwijk et al. (2004)
This framework can be affected by complementary considerations, such as the
scale of the benefit, global in the case of climate regulation through carbon
sequestration, or more restricted as in watersheds treatment; or the nature of the service,
generated in the form of goods, such as food, fibers, or finished products; or of services,
such as clean water, clear air, or fire risk reduction (Viana et al. 2006).
The operationalization of the payment requires establishing a proper political
and economic framework for regulating the prices of environmental goods and services,
through the provision of direct and indirect incentives that promote a behavior
Natural capital
Dynamic landscapes
Menaces
Mitigation
Providers of ES Beneficiaries
of ES
Environmental services
Biodiversity
Water
Carbon
Cost of opportunity
Direct benefits
Functions
Recognition & payment
Control of resources

Environmental services
51
amendment among stakeholders in favor of environment conservation. Here, three types
of economic instruments could be considered: (1) based on compensatory mechanisms,
when an economic activity generates impacts on the environment, (2) based on the
benefit to the stakeholder, who contributes with a tax, toll or fee, or (3) based on the
principle of payment by economic instruments, created explicitly for environmental
purposes (Tomich et al. 2004, Viana et al. 2006).
4.2 Environmental services: the operational framework
Environmental services operationalization has become very complex because of the
unequal degree of development between societies, and their divergent views concerning
environmental issues (Costanza & Daily 1992, Costanza et al. 1997). Moreover, the
great number of involved stakeholders demands greater institutional capacities, able to
cater for their different social, cultural, political, and economic backgrounds (Swallow
2006).
The participant institutions should be able to understand the environmental
services causal pathways, recognize the spatial extent and distribution patterns, and
develop protocols for their easy recognition and monitoring, which would simplify and
validate the measures towards facilitating negotiations among stakeholders (Tomich et
al. 2004).
4.2.1 Operationalizing criteria
Regulating vs. rewarding
The institutional options to operationalize environmental management are limited and
can be grouped into two broad categories: regulations and rewards. Despite the
attainments developed below, it is important noticing that the choice between them is
pretty circumstantial and involves a considerable degree of uncertainty.
Regulating is the more traditional approach usually considered as an
administrative tool. In general, it establishes tolerable levels of management, such as
‘do not cross this line’ as in the case of air pollution, or ‘minimum allowed’ as in the
case of drinking-water standards. However, with respect to maintaining biodiversity as
an environmental service, we know little about stabilizing functions, which makes
establishing thresholds a debatable way.
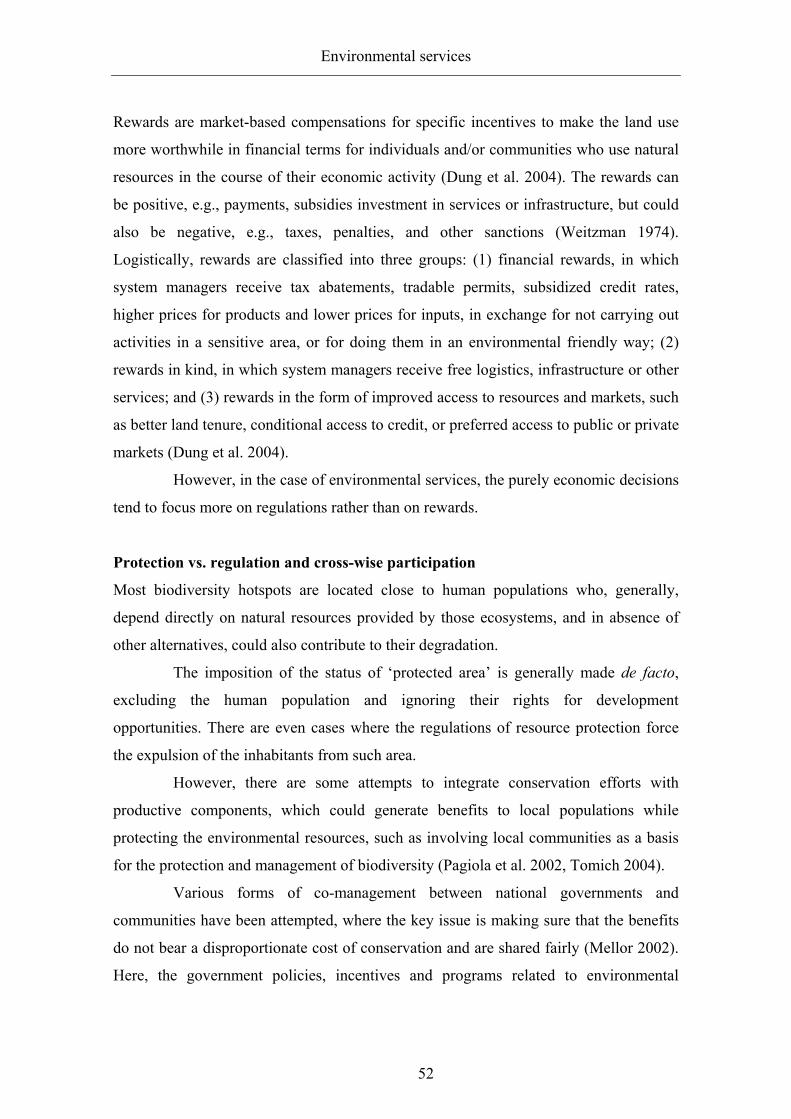
Environmental services
52
Rewards are market-based compensations for specific incentives to make the land use
more worthwhile in financial terms for individuals and/or communities who use natural
resources in the course of their economic activity (Dung et al. 2004). The rewards can
be positive, e.g., payments, subsidies investment in services or infrastructure, but could
also be negative, e.g., taxes, penalties, and other sanctions (Weitzman 1974).
Logistically, rewards are classified into three groups: (1) financial rewards, in which
system managers receive tax abatements, tradable permits, subsidized credit rates,
higher prices for products and lower prices for inputs, in exchange for not carrying out
activities in a sensitive area, or for doing them in an environmental friendly way; (2)
rewards in kind, in which system managers receive free logistics, infrastructure or other
services; and (3) rewards in the form of improved access to resources and markets, such
as better land tenure, conditional access to credit, or preferred access to public or private
markets (Dung et al. 2004).
However, in the case of environmental services, the purely economic decisions
tend to focus more on regulations rather than on rewards.
Protection vs. regulation and cross-wise participation
Most biodiversity hotspots are located close to human populations who, generally,
depend directly on natural resources provided by those ecosystems, and in absence of
other alternatives, could also contribute to their degradation.
The imposition of the status of ‘protected area’ is generally made de facto,
excluding the human population and ignoring their rights for development
opportunities. There are even cases where the regulations of resource protection force
the expulsion of the inhabitants from such area.
However, there are some attempts to integrate conservation efforts with
productive components, which could generate benefits to local populations while
protecting the environmental resources, such as involving local communities as a basis
for the protection and management of biodiversity (Pagiola et al. 2002, Tomich 2004).
Various forms of co-management between national governments and
communities have been attempted, where the key issue is making sure that the benefits
do not bear a disproportionate cost of conservation and are shared fairly (Mellor 2002).
Here, the government policies, incentives and programs related to environmental

Environmental services
53
services should be coherent and not accelerate resource depletion, as in the case of
agricultural expansion into natural habitats, or the over-use of freshwater and marine
fisheries.
At international level, the conservation of the world’s biological diversity has
been prioritized since the 1992 signing of the Convention on Biological Diversity
(CBD), which emphasizes that sustainable use of biodiversity is one of the most urgent
issues of our time and demands commitment to address it collectively (UNEP 2007).
Since then, there have been numerous initiatives, like the Global Environmental Facility
(GEF), which, under the so called Clean Development Mechanism (CDM) scheme,
links developing countries’ initiatives with resources from developed countries, to
support environmentally friendly projects, involving a series of stakeholders: farmer
organizations, private companies, non-governmental organizations and civil society
(GEF 2007).
4.2.2 Stakeholders characterization and perspectives concerning provision of
environmental services
Stakeholders characterization
The stakeholders in the environmental services scheme can be broadly characterized
into three groups according to the functions they perform: providers, intermediaries and
consumers.
Ecosystem services providers, modifiers or sellers. They could be individuals,
families groups or communities whose actions influence the availability of the services.
They are located near the provider ecosystem and maintain a close cause-effect
relationship with the ecosystem service; they enjoy rights to modify the ecosystem
structure and to benefit from what it generates; they have officially recognized rights to
reside in, use and modify the ecosystem; their levels of wellbeing and poverty affect the
ecosystem’s conditions; their most influential characteristics are demographic
composition (gender, ethnicity, age), social organization, and involvement with external
political, economic and social processes.
Ecosystem services intermediaries, brokers or facilitators. They could be
public authorities, non-governmental organizations, or projects, which directly or
indirectly shape interactions among ecosystem service providers and beneficiaries. They

Environmental services
54
could be the source of authority and perform as such among partners through
international conventions, national policy or customary laws. They influence the
behaviors of ecosystem service providers and beneficiaries, for instance by imposing
and enforcing regulations regarding the resource use within an environmental
management regime; they also could manage financial and physical resources involved
in ecosystem services provision.
Ecosystem services beneficiaries or buyers. They could be individuals,
families, groups, corporations, towns or utility companies who benefit from ecosystem
services. They are located outside the provider ecosystem but within the administrative
area where the ecosystem is placed. Generally, their dependence on ecosystem services
is at commercial operation level; their performance is influenced by their demographic
composition (gender, ethnicity, age), their social organization and the degree of
connection to external political, economic and social processes; companies could use
ecosystem services in redressing an environmental damage caused by business
operations, or to maintain or enhance the reputation of their business; they comply with
current or future environmental regulations (Swallow 2006).
Stakeholders’ perspectives
Since environmental services have to satisfy conflicting interests and demands of
different social groups, finding an equilibrium among their different expectations is the
only way to make the environmental services provision sustainable. The perspectives of
the involved stakeholders are as follows.
Wildlife conservation perspective sees environmental services as a possibility
for accessing sources of financing to complement or replace public funding and entry
fees. In contrast, the environmental management perspective seeks for good
environmental stewardships to go along with environmental regulations, while the
poverty reduction perspective looks for alternative income sources for poor people
settled near provider areas. Economic planners think about environmental services as a
good tool for correcting market failures, while the social equity perspective considers
that environmental services provide an opportunity to redress imbalances of power,
rights and responsibilities between beneficiaries and providers. Finally, the peace and

Environmental services
55
justice stakeholders look at environmental services as a mechanism for managing
conflicts of resource use and/or benefit sharing (Swallow 2006).
4.2.3 Environmental services provided by land-use systems
Despite its wide possibilities, the promotion of environmentally-friendly land-use
management at unit level has been vague. In general, policies have focused on the
landscape level, where environmental matters seem graver though the resilience is
higher too.
Up to date the importance of land-use systems as environmental services
providers has not been sufficiently placed. Population pressure, globalization of trade
and urban expansion has resulted in the increase in disturbances and environmental
impacts, which have reduced the ability of the systems to perform multiple tasks. The
larger the area, the larger the number of land users, the more difficult it is to develop an
effective management strategy, as in the case of extensive monocultures, whose outputs
are expected to be uniform and not a series of them.
The farmers have difficulties in including global (serependic) values into their
local-scale management values, since their aim is defined in advance and usually in
financial terms. In general, all the services are provided jointly (carbon sequestration
and water treatment, for example), but they are not marketed as such, and hence, are
financially unrewarded and only indirectly connected to their economic activities. And
finally, there is the risk that environmental services could simplify inherent
(agro)ecosystems complexity, and their profitability or even existence could only be
justified on government subsidies as in the case of US and European farmers (Swift et
al. 2004, Dung et al. 2004).
Based on the above stated, Swift et al. (2004) suggested consecutive steps for
the promotion of a resources management scheme oriented to the provision of
environmental services in a land-use system: (1) development of a set of indicators
derived from the main functions that shape the current state of the agroecosystem; (2)
detection of interventions that could externally modify the agroecosystem; (3) definition
of management interventions regarding the resources, options and objectives; (4)
definition of objectives and motivation that drive these management interventions; and
(5) learning process along the known options, expanding as expectations are updated.

Environmental services
56
4.3 Environmental services: the social frame
4.3.1 Recognition and operationalization
Van Noordwijk (2004) sequenced the recognition of environmental services as a
retribution mechanism: it starts with the recognition of a noticeable negative
environmental episode, initially ignored until is not possible to overlook it anymore.
Then the affected groups are compensated when they try to shield them against the
negative impacts. Furthermore, mitigating activities are implemented, such as
conservation measures, followed by the establishment of incentives for the modification
of practices environmentally harmful, and finally the creation of market-based
instruments or other means of control.
In the same way, the operationalization of the environmental services is only
possible through the understanding of the issue by societies in general, and authorities in
particular. Tomich et al. (2004) identified the stages of such evolution. It starts with an
early perception by pioneers of slight changes of a particular environmental issue,
which is not shared by the society at large. A development of initiatives by lobbyists
follows, despite the little interest of stakeholders. Gradually, an extended acceptance of
the environmental impacts is perceived, and at the same time pressure on the authorities
for action arises. Then debates about cause and effect, and subsequently attribution of
blame take place. These are followed by demands for inventories, assessments,
prevention and mitigation alternatives in environmental, economic, financial and
administrative terms, and normally end with negotiations on prevention or mitigation,
and finally implementation and enforcement of prevention, monitoring and mitigation
actions (Figure 4.3).

Environmental services
57
Figure 4.3 Evolution of public perception of the environmental services issue by social
interaction and scientific advance. Source: Tomich et al. (2004)
4.3.2 Social capital
Capital in economics alludes to any form of goods capable of being employed in the
generation of wealth generally expressed in financial terms. The so-called five capitals
concept is based on the participant types of capital transaction, i.e., natural, economic,
infrastructural, social and human. It is assumed that the conversion among capitals is
possible, e.g., natural to financial as in the case of wood logging; financial to natural in
the construction of conservation infrastructure; or financial to human, in the case of
capacity building activities.
Environmental services are seem as a natural capital investment, but also
directly linked to human and social capitals, i.e., guardianship, stewardship and
restoration. Therefore, this key social capital is defined by Coleman (1988) as “the
shared knowledge, understanding and patterns of interaction that a group of individuals
brings to any productive activity”, given its quality of been addressed in form of well-
built institutions.
4.3.3 The ‘social justice’ perspective
The millennium development assessment (MDA) states that by providing a minimum
level of environmental services free or with a low charge, several disadvantaged

Environmental services
58
segments of society could profit from the accomplishment of the millennium
development goals (MDG), i.e., poverty alleviation, education, women empowerment,
reduction of child mortality, improvement of women’s health, fewer pernicious
diseases, better environmental sustainability and increased partnerships for development
(UN 2007).
It is well known that there is a firm linkage between poverty and land-use
intensification, e.g., the poor access to public services and political recognition of
inhabitants of remote regions, who paradoxically are rich in natural resources
availability, or the ones who overexploit forests to get cash, degrading the landscape
and their opportunities of subsistence and profit in the middle term or who live in
degraded environments, with a high demand for public services and low opportunities
of self-provision (van Noordwijk et al. 2004).
In such a frame, environmental services besides contributing to the
sustainability of the systems can perform as a reassigning quotas mechanism. Therefore,
providers’ possibility to obtain incentives for doing so is not only an opportunity but a
compensation instrument in a frame of equity and justice (Callo-Concha 2003).
4.4 Environmental services: the biophysical frame
Of the numerous aspects of the biophysical frame, addressed from different scientific
viewpoints, we have included the main three, because of their controversial role in the
current phase of the environmental services issue evolution.
4.4.1 Land-use systems as providers of environmental services
If we understand land-use systems as a range of practices between two extreme cases,
i.e., forests and agricultural lands, the perceptions about the functions performed by
each system are defined as conservation in one extreme against intensive exploitation in
the other (Figure 4.6). Hence, from the environmental services point of view, our
attention should narrow to woody systems, while production and generation of income
should be come from agricultural lands.
But in reality, most services providers lie in between these two extremes,
entailing both environmental and productive functions. This idea clashes with the
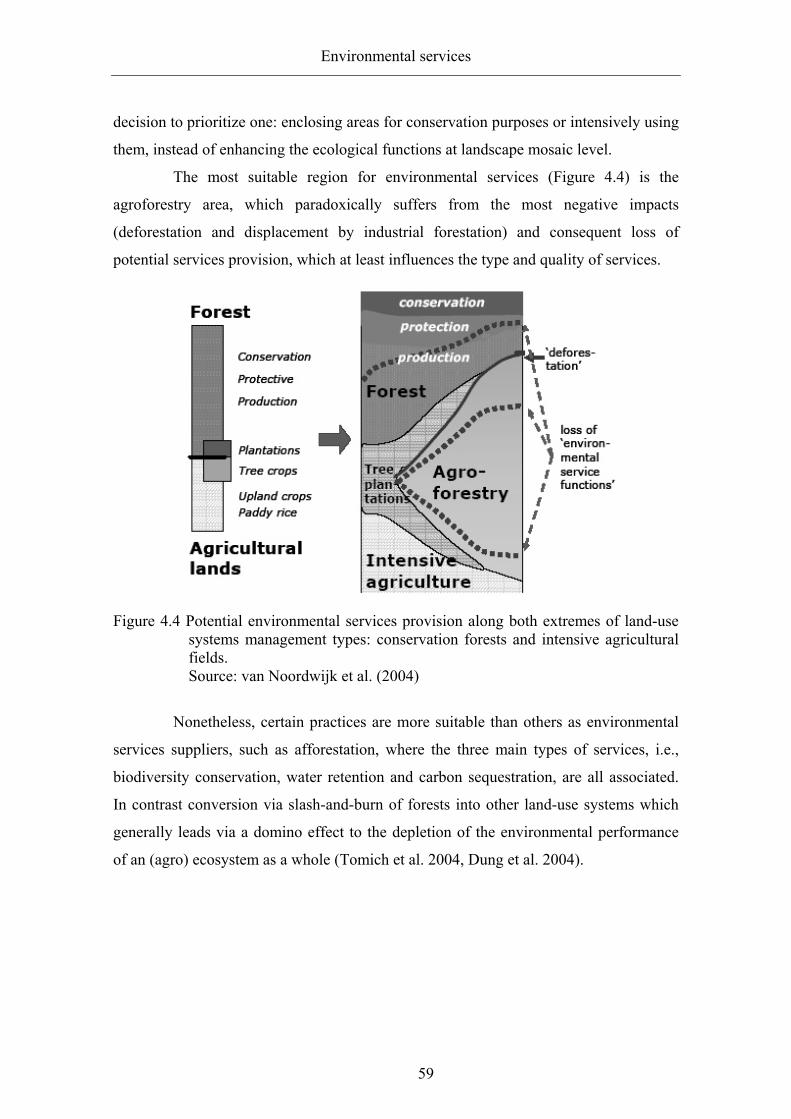
Environmental services
59
decision to prioritize one: enclosing areas for conservation purposes or intensively using
them, instead of enhancing the ecological functions at landscape mosaic level.
The most suitable region for environmental services (Figure 4.4) is the
agroforestry area, which paradoxically suffers from the most negative impacts
(deforestation and displacement by industrial forestation) and consequent loss of
potential services provision, which at least influences the type and quality of services.
Figure 4.4 Potential environmental services provision along both extremes of land-use systems management types: conservation forests and intensive agricultural fields.
Source: van Noordwijk et al. (2004)
Nonetheless, certain practices are more suitable than others as environmental
services suppliers, such as afforestation, where the three main types of services, i.e.,
biodiversity conservation, water retention and carbon sequestration, are all associated.
In contrast conversion via slash-and-burn of forests into other land-use systems which
generally leads via a domino effect to the depletion of the environmental performance
of an (agro) ecosystem as a whole (Tomich et al. 2004, Dung et al. 2004).

Environmental services
60
4.4.2 Bundling environmental services
The provision of environmental services, e.g., clear air, clean water, preservation of
biodiversity and other natural resource values are in most cases achieved jointly, and
very rarely separately (Gouyon 2003, Dung 2004).
Ecological functions and services overlap naturally due to their
interconnectedness, interacting positively and negatively. For example an increase in
biomass by fast and diverse growing trees upstream can lead to the increase in
biodiversity and carbon sequestration but reduction of water availability downstream.
Furthermore, the different by anthropogenic needs determines whether they can be
integrated or not for mutual benefit, for instance, the level of intensity with which a
system is managed against the area occupied by such a system, or the tradeoff between
trees’ biomass production (carbon) against the lower strata biodiversity.
This association can bear some constraints, e.g., it can lead to ecological
and/or economic double counting and the providers’ decisions could be driven by the
value of all environmental services, while their rewards are based on the degree with
which each service is provided. This makes it necessary to develop dynamic and
integrative models, which should include the interdependencies between ecosystem
functions, services and values (Boumans et al. 2002, Dung et al. 2004).
4.4.3 Seeking for an optimization point: tradeoff between inputs, components
and outputs
The Vitusek-Hooper hypothesis states that the number of ecosystem services at
landscape scale is optimized by the land-use diversity and by the participation of a
required number of factors, which is optimally rather small. Thus, it is implied that a
limited number of different land-use types should be sufficient to satisfy the functional
needs of the majority of ecosystem services (Hooper & Vitousek 1997).
The most evident example is the case of agriculture (at plot/farm level), where
biodiversity is largely managed through simplification, decreasing connectivity and
maintaining the agro-ecosystem in an early stage of succession, which in certain
conditions can reach a threshold, where the system looses its resilience irreversibly.
However, in most cases, the farmer can cope with disturbances and stress through
adjustments in resources management (Swift et al. 2004).

Environmental services
61
Thus, the land-use system diversity and its abilities to perform functions at landscape
scale follows the pattern showed in Figure 4.5: the transition from Curve 1 ‘biodiversity
reaches a certain level in terms of the service provision’ to Curve 2 ‘intensively
managed agroecosystems, maintained through the constant addition of external inputs’
is function of the efficiency in the provision of environmental services in exchange for
reducing the alpha or gamma biodiversity. The shift from Curve 3 compared to Curve 1,
‘greater essential biodiversity function of land-surface increase’ to 4 ‘displacement due
to human intervention’, leads to an increase in alpha and gamma diversity in exchange
for a reduction in the efficiency of the provision of environmental services (Swift et al.
2004).
Figure 4.5 Two cases of variation of environmental services provision efficiency vs.
biodiversity indices in land–use systems: changes from curves 1 to 2 based on addition of extrernal inputs, and curves 3 to 4 due to human intervention.
Source: Swift et al. (2004)
The above suggests that the study of environmental services in co-evolved
communities, which are more suitable for performing such functions, must be done
separating the effects between and within them, and be conducted through a range of
stress and disturbance conditions (Swift et al. 2004).
4.5 The Brazilian model: Proambiente
4.5.1 The Proambiente approach
The Proambiente: Programa de Desenvolvimento Socioambiental da Produção
Familiar Rural (Socio-environmental Development Program for Rural Household

Environmental services
62
Production) is the result of the Grito da Amazonia (Amazonian scream), a debate about
poverty and resources’ management policy between 2000 and 2002, where civil
organizations demanded rural development polices to improve populations’ living
conditions in harmony with environment conservation. The result was a mechanism of
recognition and payment for environmental services, i.e., Proambiente.
The environmental services considered by Proambiente are: reduction of
deforestation, recovering of deforested areas (carbon sequestration), soil, water and
biodiversity conservation, progressive reduction of agrochemical use, fire risk
reduction, change to renewable energies source, and transition to agroecology.
The financial funds come mainly from two sources: first the federal budget
through the ministries of the environment, agriculture and social development, and
specific funds for the environment, education and biodiversity, and second from the
program itself, i.e., taxes and royalties applied to combustibles, electricity and mining,
international agreements, voluntary donations and contributions from private
companies’.
The Proambiente construction as an environmental services payment program
was sorted out as follows: making feasible a financing mechanism of payment for
environmental services; providing a legal basis for the recognition of the concept of
environmental services; establishment of a public policy structure for the environmental
services payment, making replicable the regional projects at the national scale; and
accepting the conceptual economics background as an instrument.
4.5.2 The working unit: pólo pioneiro
Proambiente is conceived in the frame of territorial development, which targets specific
spatial areas defined by their geographical, ecological, social and political boundaries,
such as social organization strength, technical assistance availability, access to credit,
certification and payment logistics and social control. The integrative name for this
action unit is pólo pioneiro (pioneer pole).

Environmental services
63
Originally 13 pioneer poles were installed across Amazônia Legal(*) (legal Amazonia).
Each pole consists of about 400 families, who depend mainly on natural resources
management actors, i.e., colonizers, extrativistas (who perform mainly extractive
activities), ribeirinhos (who inhabit areas near rivers and streams), fishermen,
craftsmen, quilombolas (descendants of former black slaves), and traditional
communities.
The implantation of a pioneer pole is a participative process, where land users
together with a technical advisor set up a conselho gestor (management council) in
charge of assessing the site’s environmental services, developing of short and middle
term management plans, and formalizing agreements and compromises for the
accomplishment of the management plans.
4.5.3 Civil society participation and operationalization
In January 2004, Proambiente, beginning as a project outlined by civil society, was
transferred to the federal government as part of the Ministry of Environment. A national
management council, composed of representatives of public research centers,
universities, development institutions, and local and national NGO’s, supported policy
makers in the implementation of the program and related tasks.
The Proambiente protocol considers the following steps. First, the provider site
and baseline measures are characterized by an authorized federal institution. Second,
once the state of art has been determined, the environmental services are evaluated,
detailing the services offered, the procedures applied, the proposed institutional
arrangements, the formal decision-making instruments and the financing sources. Based
on the above data, a management plan per property unit is proposed, which is followed
by an payment contract between providers and beneficiaries. This includes verifying
and monitoring procedures, i.e., periodicity, length, type of verification, etc. At the same
time, consultants for resources administration and certification of environmental
(*) Concept equally defined by geographical and ecological criteria, which clusters the states that
shape the Brazilian Amazonian region: Acre, Amapá, Amazonas, Pará, Rondônia, Roraima,
Tocantins, Mato Grosso and Maranhão.

Environmental services
64
services are defined and hired via communitarian agreements (Proambiente 2004,
Proambiente 2005 a,b, Viana et al. 2006, Shiki 2007).
While developing the objectives of this study, we bore in mind the
Proambiente case, which shares the multicriteria approach as a methodological tool and
territorial development as logistical paradigm.

The working site
65
5 THE WORKING SITE Case study: Tomé-Açú situation, inhabitants and agroforestry systems
5.1 Biophysical and socioeconomic situation
This research was carried out in the municipality of Tomé-Açú, Pará state, northern
Brazil (Figure 5.1). This area is well known for its great variety of agroforestry systems
developed by the descendants of the Japanese colonizers, and their considerable
influence in the surrounding communities.
Figure 5.1 Location of Tomé-Açú municipality in the Pará state and Brazil
The municipality of Tomé-Açú is located in the northeast of the State of Pará,
110 km to the south of Belém do Pará, the state capital. It occupies an area of 5145 km2
and is situated between the coordinates 2° 40’ 54” south and 48° 16’ 11” west, with a
population of 50795 inhabitants (IBGE 2000).
The area is predominately flat with elevations varying between 14 m and 96 m
above sea level. The soils are mainly weathered acid oxisols (Sanguino 2004, Yamada
& Gholz 2002a). The climate is classified as the Ami–Köppen type classification with
an annual average temperature of 27.9 °C oscillating between 20 °C to 35 °C. Humidity
is always more than 80% and average annual rainfall is about 2,500 mm distributed
irregularly throughout the year with a main rainy season from November to June and a

The working site
66
less rainy season between July and October; the cloudiness and hours of sun follow the
same pattern (CPATU 2003 cited by Sanguino 2004) (Figure 5.2).
0
10
20
30
40
50
60
70
80
90
100
Janu
ary
Febr
uary
Mar
ch
Apr
il
May Ju
n
July
Aug
ust
Sept
embe
r
Oct
ober
Nov
embe
r
Dec
embe
r
T avg (C) Rain (mm) *0.1 Humidity (%) T max (C) T min (C)
Figure 5.2 Annual climatic data Tomé-Açú, Para State, Brazil 2003. Source: EMBRAPA/CEPATU 2003
The vegetation cover is composed mainly of secondary forest, a result of
previous intense anthropogenic pressure related to selective wood exploitation and crop
plantation. Remnants of species, indicators of precedent forest richness, are to be found
such as Castanha do Brasil (Bertholletia excelsa), Cedar (Cedrella odorata) or Ipê
amarelo (Eucylophora paraensis) (Sanguino 2004).
The principal economic activity is agriculture. Permanent crops, slash-and-
burn systems and pastures occupy about 46% of the available land; while approximately
20% is assigned to conservation purposes (conservation forests and riparian zones). The
unproductive areas cover less than 35%. The land tenure is based mostly on private
property regime, and more than 98% of the farms are managed as such, with only a few
under shared responsibility agreements (LBA 2007).

The working site
67
5.2 Historical background
In Japan during the Meiji period (1862-1912), which began with the re-opening of Japan
to the western world after two centuries of voluntary seclusion, there were numerous
social conflicts. Peasant riots broke out, as legislation limited severely access to the
farming class by allowing only the eldest son to become farmer. Furthermore a heavy
tax regime was imposed to support the Sino-Japanese war (1894-95) and the Russo-
Japanese war (1904-05).
As result of these conflicts the Japanese government decided on the emigration
option, and commissioned the Minister of Foreign Affairs Takeaki Enomoto to set up
the division of emigration in 1881, and in 1893 the colonization society (Yamada 1999).
5.2.1 The Brazilian migration background
Brazil has received colonists since 1812, when Germans were invited to Bahía and
Espirito Santo. In 1819, two thousand Chinese coolies were brought as a substitute for
African slaves. But until the abolition of slavery in 1888, the proportion of immigrants
compared to the imported slaves was around 1:100. It was the slavery abolition, and the
consequent lack of manpower, that forced the Brazilian government to encourage
immigration. Yet only on June 18th 1908, after several failed attempts, did the first
batch of 793 Japanese arrive in Brazil on the ship Kasato-Maru, almost all of them
already contracted as coffee plantation workers.
Initially, most Japanese arrived with the idea of making money and soon going
back home, but they quickly realized that if they wanted to realize their expectations,
they had to become landowners. Thus, the first settlements in São Paulo emerged,
which, based on intercropping systems, focused on producing food crops of high
demand. In a few years, those first settlers became economically independent and
actively organized and were able to hire new immigrants (Yamada 1999).
5.2.2 The Amazonian adventure: Japanese arrival to Tomé-Açú and further
development
The Brazilian Immigration Program in the 1920’s suggested establishing settlements in
the Amazon Region. And due to their success in São Paulo, the Japanese were strongly

The working site
68
encouraged to be part of it. First attempts were not entirely successful, and vulnerability
to illnesses, technical deficiencies, and environmental constraints forced some
colonizers to go back or re-settle in better locations.
Tomé-Açú as an agricultural community was founded in 1929. At the beginning,
Japanese settlers concentrated on the removal of forests to establish cacao (Theobroma
cacao L.), which failed due to lack of knowledge of management techniques, and forced
them to practice subsistence agriculture similar to local Brazilians. In addition to the
common products like rice, corn, beans and manioc, they introduced the cultivation of
vegetables, initially for self-consumption and later for selling, covering gradually bigger
markets, such as Belém do Pará city, which brought them an important source of
income (Anderson 1990, Smith et al. 1995).
In 1933, as a part of one of the immigration waves, Makinosuke Usui brought
from Singapore a few seedlings of black pepper (Piper nigrum L.), a species that soon
became the most widespread crop in the region, making Tomé-Açú the country’s
principal producer. In 1957, an epidemic of the fungal disease Fusarium solani sp.
piperis badly affected the pepper fields, compelling the farmers to develop alternative
production systems, diversify the fields and enrich them with perennial cash crops
(Fearnside 1980 cit. by Smith et al. 1995).
In the last fifty years, the Tomé-Açú nikkei inhabitants, through their innovative
attitudes have developed a large number of agroforestry systems, highly diverse and
productive, and furthermore, a dynamic production paradigm based on perennials, with
constant technical innovations and market-based feedback. Their success has depended
to a greater part on their good organization of technical support in production, post-
production and commercialization (Jordan 1987, Anderson 1990).
5.3 Target groups of the study
The influence of the Japanese community also became strong in neighboring areas,
because of their interest in obtaining high revenues from black pepper plantations, and
later because of the comparative advantages of polycultures in small plots. However,
this has not been uniform, so in order to portray better the agroforestry systems
practiced in the region, we decided to diversify this study by including neighboring sites

The working site
69
with different characteristics, such as property size, management record, level of
technology, land property regime and capacity for organization.
We stratified our analysis units in three groups: (1) the ‘CAMTA partners’,
mainly descendants of the Japanese colonists, generally well-established owners of
regular-size and market-oriented plots associated with the ‘The Mixed Agricultural
Cooperative of Tomé-Açú’; (2) the ‘immigrated’ middle-size farmers in terms of land
size and technological level used and markets access, who had immigrated long ago and
are poorly organized; and (3) the ‘newcomers’, small subsistence farmers, recently
immigrated as beneficiaries of the agrarian reform and generally non-organized.
5.3.1 The CAMTA partners: Tomé-Açú and Quatro Bocas
The Cooperativa Agrícola Mista de Tomé-Açú (CAMTA), The Mixed Agricultural
Cooperative of Tomé-Açú, was established soon after the first Japanese immigrants had
founded Tomé-Açú to assist the farmers with credit, technical advice and market access
facilities. After the black pepper production drop in the 1960’s, CAMTA led the
transition from monocultures to agroforestry systems via intercropping, with high-value
perennial species.
CAMTA operates mainly in what became the core of the municipality, i.e., the
surroundings of the villages of Tomé-Açú and Quatro Bocas, which concentrate the
majority of the Japanese-descendant farm properties. The farm areas vary from 150 to
200 ha, but on the average only 20 ha are cultivated, generally maintaining the
remaining area as secondary forest after the abandonment of pepper or previous slash-
and-burning activities in hitherto undisturbed forests. CAMTA partners are the better-
established farmers, owners of larger plots, and very well organized.

The working site
70
Figure 5.3 Characteristic CAMTA partners agroforestry system in Quatro Bocas with
açai (Euterpe oleracea) and cupuaçú (Theobroma grandiflorum)
5.3.2 The immigrated: Igapú-Açú and Forquillas
The Tomé-Açú agroforestry model was gradually exported to neighboring areas,
initially as a production pattern, versatile and varied in by-products, and later because of
the demand for its production outputs.
The immigrated are part of this area of influence, with properties from 50 to
100 ha, generally administered by a second generation of colonists (usually Brazilian,
non-Japanese immigrants) having a permanence of 20 to 30 years.
The selected locations are Forquillas and Igapú-Açú, the first about 15 km
from Tomé-Açú and the second about 20 km. These sites do not constitute villages, but
consist of households scattered in a radius of 5 to 10 km with a commercial center by
the road.
Their production technology is at an intermediate level, supported by family
manpower and sometimes hired workmen. Organization for commercialization is
minimal. The structure of the agroforestry systems is less diverse than in Tomé-Açú,
and the major emphasis is on fast cash species, such as cupuaçú (Theobroma
grandiflorum) and açai (Euterpe oleracea).

The working site
71
Figure 5.4 Characteristic Immigrated agroforestry system in Igapú-Açú with cupuaçú
(Theobroma grandiflorum), black pepper (Piper nigrum L.) and açai (Euterpe oleracea)
5.3.3 The newcomers: Miritipitanga and Tropicalia
The newcomers are installed in the assentamentos (settlements), which constitute the
basis of the Brazilian policy of land reform. This system is supported by governmental
and non-governmental institutions and groups of organized farmers, that receive parcels
between 25 and 100 ha and some complementary benefits, such as a starting fund and
technical assistance during the establishment of their crops.
The degree of farming development of the newcomers depends on the date of the
establishment of the settlement. The first selected sampling area is Miritipitanga,
founded in the mid 1990’s, located 27 kilometers from Tomé-Açú with a population of
around 400 inhabitants, and 12 years-old agroforestry plots of woody species in the
highest strata. The second is Tropicalia, founded just 11 years ago in 1997, located 40
km from Tomé-Açú, with a population smaller than in Miritipitanga and only a few
recent agroforestry plots, based mainly on the Taungya model (temporal cultivation of
crops in tree-based plots while the growth of these allow it). The conditions are quite
similar in both areas, with subsistence production systems, young agroforestry parcels,

The working site
72
medium or poor technological standards, and almost nonexistent community
organization.
Figure 5.5 Characteristic newcomers agroforestry system in Miritipitanga with black
pepper (Piper nigrum L.), açai (Euterpe oleracea) and mahogany (Swietenia macrophylla)
5.4 The Tomé-Açú model of land-use management
The agroforestry systems developed by the Tomé-Açú farmers have gotten international
recognition due to their profitability and sustainability. This success is based on the
development of a varied and variable production model. One of the most common
variations follows these steps (Figure 5.6): (a) short-lived perennials, such as black
pepper, are generally planted after clearing of forest or secondary vegetation; (b)
depending on existing market conditions, annual species such as rice, beans, cucumbers,
tomatoes or leafy vegetables are planted between the rows of perennials; (c) following
these intermediate-lived perennials, such as black pepper, fruit trees or long-lived plants
such as cacao, rubber, cupuaçú or forest-tree species, are interplanted; (d) when the
short-lived crops are nearing the end of production, the longer-lived crops are ready to
begin with their own production (Jordan 1987, Anderson 1990).

The working site
73
Figure 5.6 Succession stages in the Agroforestry ‘Tomé-Açú model’. Source: Based on Jordan (1987)
5.4.1 Management principles
The general principles on which the Tomé-Açú model is managed are as follows: (1) to
use as much as possible tree species providers of biomass, fruit or latex that minimize
disturbances in the soil; (2) to plant annual species of high economic value once or
twice followed by species of lower economic value but less demanding of soil nutrients,
when possible plant species that can both enrich the soil and provide economic benefit;
(3) to maintain the ground cover as much as possible to minimize the deterioration of
soil physical properties; (4) to maintain a high diversity of crops to fully exploit soil
nutrients and sunlight and inhibit problems of diseases and insects; and (5) to recycle as
much as possible, both animal and vegetal organic matter into the soil (Jordan 1987).
a. Short lived perennials planted after slash and burn
b. Enrichment with annuals and planting of perennials
d. Succession to a multistrata polyculture c. Enrichment with intermediate-lived perennials, and soil covering
The working site
74
5.4.2 Guiding economic and ecological criteria
Tomé-Açú farmers acknowledge that the factors that influence their decisions to
increase the diversity and complexity of their farms are basically economic. They
respond primarily to changes in the crop prices, the cost of labor, and material inputs for
the production of particular crops. In that framework, the use of commercial
agrochemicals is extensive in order to optimize the profitability of the fields.
The diversity of species is also important. A number of perennial crops in
different stages of production allows to farmers to have harvests from three or four
crops at the same time, with the option of planting annual crops as the need arises. The
farmers are able to spread the production risk over a number of crops, such as cocoa,
coconut (Cocos nucifera), cupuaçú (Theobroma grandiflorum), passion fruit (Passiflora
edulis), açai (Euterpe oleracea), mango (Manguifera indica), papaya (Carica papaya),
guanábana (Annona muricata), bacurí (Platonia insignia), abricó (Mammea americana),
uxí (Dipteryx alata), cajú (Anacardium occidentale), graviola (Annona muricata), etc.
However, this flexibility in income generation comes with the burden of complex
management, requiring higher technical knowledge of each individual crop, and with
the need for increased physical resources and manpower, which in the end limit the size
of the area under cultivation.
The most important factors for fulfilling these demands are the cultural
discipline inherited by the settlers from their traditional Japanese values, and the
participation of CAMTA in the support of production, postproduction and
commercialization (Jordan 1987, Anderson 1990, Yamada 1999, Yamada & Holz
2002).

Methodological approach
75
6 METHODOLOGICAL APPROACH Applied analytical tools, further development and integration
6.1 Multicriteria Analysis (MCA)
6.1.1 Definition
Multicriteria Analysis (MCA) is a decision making tool that integrates a series of
methods in order to give an integrative insight into complex, interdisciplinary problems,
including different sources of data, different expert positions and different groups of
interest. In other words: “MCA breaks the problem into pieces, reassembles such data
and judgments and presents a coherent overall sight” (Dogson et al. n/d). In general,
when a consensus is searched, different interests may prevent agreement on the relative
importance of criteria or on the ranking of different alternatives. Here, MCA can assist
each stakeholder to make his/her own decisions and judgments, and then channel all of
them in a final and integrative conclusion (Dogson et al. n/d, Mendoza & Macoun
2002).
MCA is especially applicable in situations where a single-criterion approach
does not satisfy the expected demands, as in the cases that involve environmental and
social matters, where decision makers are compelled to include a wide range of social,
environmental, technical and economic criteria.
This tool exhibits a hierarchical structure, where the highest level represents
the broad overall objectives, e.g., improving the quality of life, often vaguely stated and
hence, not very operational. These items are gradually broken down into lower-level
objectives, successively more applicable and concrete, until the lowest level becomes
very practical and easy to assess (Munasinghe 2007). Finally, MCA outputs are a series
of stratified arguments on which a decision has been made, and a cumulative or partial
index(es) of performance of each system which allow stratifying them from the most
preferred to the least preferred (Mendoza & Martins 2006).
6.1.2 Sustainable forest management (SFM)
Among the main products of the Earth Summit (ECO 92) were the issue of binding
documents: First the Rio declaration on environment and development, which is a
statement of principles to guide the management, conservation, and sustainable

Methodological approach
76
development of all types of forests, second is the United Nations framework convention
on climate change, and third, the convention on biological diversity. All three are
considered milestones in the achievement of international recognition and promotion of
concrete activities in the most crucial environmental issues. The summit agreed to carry
out regular meetings towards the achievement of the proposed objectives, under the
name of the Conference of the Parties (COP) (UNEP 2007).
In the COP 3 Buenos Aires (1996) on the Convention on Biological Diversity,
a consensus was reached to focus immediate attention on two critical issues: assessing
the human impacts on forest ecosystems, and developing criteria and indicators for
forest quality and biodiversity conservation (Stork et al. 1997). Subsequent meetings
strengthened these trends, ending with the revaluation of the concept of Sustainable
Forest Management (SFM).
SFM is defined as “… the process of managing forests to achieve one or more
clearly specified objectives, with regard to the production of a continuous flow of
desired forest products and services, without undue reduction of its inherent values and
future productivity, and without undue undesirable effects on the physical and social
environment” (ITTO 1998).
The principle of SFM is holistically addressed by using a system oriented
approach. Here, the interactions and linkages between indicators are examined that
might have direct and indirect consequences on the sustainable use at the Forestry
Management Unit (FMU) level (Wolfslehner et al. n/d). In SFM evaluations, two
guiding principles, ecosystem integrity and people’s well being, should be maintained
and enhanced. Therefore, the physical and political boundaries of the forest area must
be clearly demarcated, as well as the long-term management plan and objectives
(Mendoza & Macoun 2002).
The SFM concept is restricted not only to forests as ecological systems, but
also to forest as human-influenced environments, which are in many respects
subordinated to the socio-economic background, i.e., food security, access to resources,
heritage and identity, economic opportunity, justice and health (Prabhu et al. 1999,
Prasad 2002).
SFM is considered the guiding resource management paradigm in forest
landscapes (Loyn & McAlpine 2001), and in general made operative through MCA,

Methodological approach
77
which supports the selection, processing, and modification of component variables in a
consistent and transparent way, according to a specified target (Mendoza & Macoun
2002).
Under this perspective, the application of SFM paradigms and protocols for
the evaluation of environmental services provision by agroforestry systems is justified.
6.1.3 MCA operationalization: Criteria & Indicators
Definition, characteristics, components
The Criteria and Indicators (C&I) methodology operationalizes multicriteria analysis
(MCA) for any particular scheme, such as in the present study, which assesses
functional biodiversity in agroforestry systems. It operates along a series of vertical
steps by fragmenting conceptual issues, such as poverty, into a series of smaller and
more manageable subjects, e.g., food security, lack of income, etc. These are then
divided further into more pragmatic and simpler items such as children’s weight,
calories consumed, etc. (CIFOR 1999).
The methodology is characterized by its ability to involve the participation and
agreement of multiple interest groups using both qualitative and quantitative data. It can
also incorporate two opposite insights on the same matter, such as top-down and
bottom-up approaches, and finally allow the feedback of processes concerning the
consistency of the judgments (CIFOR 1999, Stork et al. 1997). Practically, the C&I
methodology is easy to understand and simple to apply, and is able to provide
arguments to managers and policy makers that are relevant, scientifically sound and
cost-effective (Stork et al. 1997).
The C&I set is based in a four-level hierarchy consisting of the components,
principles, criteria, indicators and verifiers. Principle is a fundamental truth or law on
which reasoning or an action is based. The principles give the primary framework for
managing any system in a sustainable fashion, providing justification for criteria,
indicators and verifiers. A criterion is a standard by which the progress towards meeting
the principles of a system can be judged, adds meaning and operationality to a principle
without being itself a direct measure of performance, and compiles the subordinated
indicator weights in a single rate. An indicator is any quantitative, qualitative or
descriptive attribute measured periodically, which indicates the direction of a change in

Methodological approach
78
one or various related elements. Finally a verifier is a specific data that reflects the
condition of an indicator; verifiers must be meaningful and precise (Prabhu 1999,
Mendoza et al. 1999, ITTO 1998, Prasad 2002, Mendoza & Macoun 2002).
Criteria and indicators and Sustainable Forest Management
The main purpose of sustainable forest management (SFM) is evaluating the factors that
affect forest sustainability, emphasizing the ones related to management. The
understanding of these processes will determine the optimization of the management
actions, and eventually support the sustainable use of the forest (Stork et al. 1997, Loyn
& McAlpine 2001).
The C&I methodology has performed successfully in supporting the
development and monitoring of sustainable forest management schemes, and has
therefore been chosen by many institutions, such as ITTO and CIFOR, who have
developed a number of C&I sets for specific forest conditions (Stork et al. 1997, Loyn
& McAlpine 2001).
Criteria and Indicators for biodiversity evaluation
Given its innate complexity, biodiversity is very difficult to assess. In general,
traditional approaches based on taxonomic diversity, indicators groups or keystone
species have limited usefulness, because of their lack of attention to examining the
processes that generate and/or maintain biodiversity (Prabhu et al. 1996, Stork et al.
1997).
The C&I methodology is an option for filling such a gap, as during its
operationalization, it links traditional evaluation tools with new ones and considers
various stakeholder positions and demands. Compiling these into an understandable set
where the correspondence, weight and linkages of each component of the set can be
viewed, compared and eventually modified (Stork et al. 1997).
Conceptualization of indicators
Although the C&I methodology has been developed for all kinds of conditions, and can
be used at various planning levels, i.e., global, regional (and eco-regional), national and
local (Prasad 2002), the indicators are very much specific, and must match the particular

Methodological approach
79
conditions of each site (CIFOR 1999). In the selection/development of indicators, one
has to take into account the ecological characteristics of the systems, the representation
of natural disturbances, and overall, the indicators’ operational relevance to assess
ecosystems affected by anthropogenic practices (Kneeshaw et al. 2002). For this reason,
it is essential to test the validity of the C&I set and, when necessary, to adjust it to suit
the pursued objectives, because in practice, only a limited number of indicators can be
used to evaluate spatial and temporal changes and at the same time meet the
requirements of easy collection and application (Prasad 2002).
Stork et al. (1997) proposed a classification system of biodiversity-status
indicators for any ecosystem (Figure 6.1). This system takes into account the
progression of any phenomenon in time, pointing out the types of indicators: (1) human
interventions that occur within the management unit, e.g., logging, grazing, land-use
conversion, burning, collecting by-products, introduction of exotics species, mining,
etc., (2) mediators, which are the impacts of human interventions on the generation and
maintenance of biodiversity, e.g., fragmentation, change of area, pollution, loss of
species, change in nutrient stocks, etc., (3) processes, which are responses to the
mediators influence in determining the generation and maintenance of biodiversity, e.g.,
species dispersal, reproduction, natural disturbance, migration, trophical dynamics,
ecosystem processes, local extinction, regeneration, etc. and (4) biodiversity status,
identified at any point in the causal chain from human intervention, e.g., population
structure, species richness, higher taxa, habitat diversity, etc.
Figure 6.1 Definition of biodiversity assessment indicators triggered by human
interventions and subsequent changes on related processes Source: Based on Stork et al. 1997
Human interventions Mediators Processes
Biodiversity status
Pressure State and response
Time, influence, determination

Methodological approach
80
Pressure indicators are easier to develop but provide less valuable information when the
intention is to understand the functioning of the ecosystem. On the other hand, state and
response indicators are potentially more useful, but are harder to develop and apply
(Stork et al. 1997).
Required conditions for indicator selection
The usefulness of the C&I approach depends on the suitability of the selected indicators.
Prabhu (1999) and Mendoza et al. (1999) listed the main requirements that a C&I
component should fulfill. These are (1) relevance, all C&I components (verifiers,
indicators, criteria and principles) should be relevant to the issues that define the
agroecosystem in question; (2) coherence, each component should be closely related to
the assessed goal in its vertical hierarchy, and thus each indicator has to be directly
related to a criterion and each criterion to a principle, and finally all principles to the
sustainable management index; (3) clarity, each component should be simple and
unambiguously defined; (4) specificity, where subordinate components should provide,
as far as possible, information that allows a direct interpretation of the upper-level
component, e.g., criteria in relation to principle; (5) simplicity, components should be
easy to detect, record and interpret; (6) reliability, components should provide
trustworthy data; (7) representativity, component responses should be able to depict a
range of levels of a targeted issue; (8) inclusivity, components should provide a
summary over space and/or time of the targeted issue; and (9) appealing, C&I
components should be user friendly (Prabhu 1999, Mendoza et al. 1999).
6.1.4 C&I development and application
Analytical hierarchy process
The analytical hierarchy process (AHP), suggests a vertical arrangement of a C&I set,
with a hierarchical structure shaped like a tree, where the main problem (trunk) is
divided into components (sub-trunks = principle), and these into more detailed
components (branches = criteria), and so on, until a better depiction of the original
problem is established.
There are two possible approaches in this process. First, the top-down
approach, that starting from the conceptual view of an issue, descends until one shapes

Methodological approach
81
the most pragmatic matters of the issue, and second the bottom-up approach, which is
based on primary data of the studied matter and brings the details into a more general
and integrative concept (Prabhu et al. 1996) (Figure 6.2). In an optimal scenario, a
balance between the two approaches is pursued, though usually one or another approach
is prioritized.
Figure 6.2 Definition and hierarchization of principle, criteria, indicators and verifiers
applying buttom-up and top-down approaches. Source: Modified from Mendoza & Macoun (2002)
Scoring, ranking and weighting
Once the set of C&I is defined and ordered in a hierarchical pattern, each indicator and
its interactions with other indicators are tagged with scores in two steps. First, by rating,
where each element is assigned with a perceived degree of importance based on a
predefined scale, e.g., 5 (very high), 4 (high), 3 (moderate), 2 (low), 1 (none) or in an
ordinal succession, e.g., 1st, 2nd, 3rd, etc., and second by scoring, where each up-level
indicator is assigned with the sum of the weighted scores of its subordinated items, e.g.,
the score of a principle is a function of the weights of its criteria (Mendoza & Macoun
2002). This weighting process is done through pair-wise comparisons, a method that
contrast one-to-one elements of the same hierarchical level, each time assigning an
Biophysical production functions
Technical design promote biodiversity conservation
Input-output stability is maintained
Species diversification in
the system
Number of strata of the system
Principles Criteria Indicators Verifiers
Interpretation
Design
Bottom-up Top-down
Methodological approach
82
arbitrary weight, and considering all the values of the related elements’ (Mendoza &
Macoun 2002).
This ascending procedure is continued until one obtains an overall indicator of
the performance of the analyzed agro(ecosystem), i.e., the Sustainable Management
Index SMI (named in CIMAT as ‘Sustainable Forest Management’ score), which
compiles the relative weights of all C&I components (principles, criteria, indicators and
verifiers), and intends to provide a sound representation of the performance of the whole
system (Purnomo et al. 2000).
Criticisms to C&I approach
The C&I approach has received some criticism as its suitability for different ecosystems
is doubted. Since land-use systems are highly variable, it is not feasible to develop C&I
sets appropriate for all conditions. Therefore, the development of indicators, especially
at lower levels that are modified and adapted to local conditions is necessary. Templates
can be useful as guide-lining platforms, on which necessary modifications can be done
(Stork et al. 1997).
On the other hand, using the C&I approach may not be practical in situations
where land-use change is planned or scheduled, such as in slash-and-burn systems, tree
plantations or urban and industrial areas, where these changes rapidly and seriously
affect the systems, thus influence the C&I reliability, which is designed to deal with
progressive but not sudden changes in parameters (Stork et al. 1997).
6.1.5 Criteria and Indicators Modification and Adaptation Tool (CIMAT)
The sustainable forest management assessment via the C&I approach was the focus of a
project by the Center for International Forestry Research (CIFOR), who incorporated
more than 1100 field-test locations in different systems in Austria, Brazil, Cameroon,
Germany, Indonesia and Ivory Coast, covering all aspects of forest management
(Prabhu et al. 1996).
As result of this project, the Criteria and Indicators Modification and
Adaptation Tool (CIMAT) software was created. It allows the creation, modification,
on-site assessment, ranking, weighting and navigation of criteria and indicator (C&I)
sets. Starting from templates created for different biophysical and socio-economic

Methodological approach
83
conditions, it is then possible to adapt the C&I sets to specific needs and local
conditions (Prabhu et al. 1996, Prabhu et al. 1999, Mendoza & Macoun 2002).
The CIMAT application depends strongly on external inputs, thus requiring
several accessory data gathering methods. While the participation of stakeholders is
very important, the involvement of experts in checking the validity, practicality,
measurability of each indicator is recommended (Mendoza et al. 1999, Prasad 2002,
Wolfslehner n/d.).
Although CIMAT has been developed for evaluation of forests, its structure is
based on multicriteria analysis, making feasible its application in any condition where
such an approach is considered, as in the case of the present study.
6.2 Multivariate Analysis (MVA)
6.2.1 Definitions and importance
Multivariate analysis (MVA) comprises a series of techniques for simultaneous analysis
of data sets with more than one variable, focusing on their interaction in the same time,
space and on how they influence one another in determining the degree and direction of
the outputs (Hair et al. 1995, Abdi 2003). Multivariate analysis measures, explains, and
predicts the degree of relationship among different variables; therefore its effectiveness
lies in how the variables are combined and not in their number. To apply MVA, a set of
variables should be variously and randomly interrelated in a way that the effect of each
variable cannot be meaningfully interpreted separately (Hair et al. 1995, Abdi 2003,
Preisinger 2005).
The results of MVA are not categorical in determining responses or
tendencies; instead, its final products are models, adjustable and subject to
interpretation, and thus they may not be right or wrong, but simply adequate or
inadequate for the particular situation (Hair et al. 1995).
The ability of MVA to deal with various components and different inferences
at the same time makes it useful for the analysis of complex data sets. MVA has been
applied successfully in exploration of large matrices, detection of the correlation
between complex factors (social, environmental, etc.), and in the development of
functioning hypotheses, such as maintaining natural correlation effects without isolating
individuals and variables (Abdi 2003).
Methodological approach
84
6.2.2 Applied protocols and tools
Cluster analysis
The term cluster analysis encompasses a number of different algorithms and methods
for grouping observations on the basis of meaningful, mutually exclusive properties,
while maintaining links among them (Hair 1995, Stockburger 1998). In other words, it
seeks sets of groups that both minimize within-group variation (association between two
objects is maximal, if they belong to the same group), and maximize between-group
variation (association between two objects is maximal, if they belong to the different
groups) (Garson 2007, STATSOFT 2007).
Cluster analysis does not refer to statistical significance testing, and thus
differs from other statistical procedures where typically a test is carried out. So it is
common to apply cluster analysis without having an a priori hypothesis, and to just
explore structures searching the most significant solution and data arrangement possible
(Stockburger 1998).
Factor analysis
Factor analysis compiles a series of multivariate statistical methods that assist in
defining the underlying structure in a data matrix with a large number of variables. It
starts from the premise of existence of correlations between subsets of variables
(eventually clusters).
Factor analysis summarizes the information contained in a number of original
variables into a smaller set of new, composite dimensions or variables (factors) with a
minimum loss of information, which should be able to replace partially or completely
the original set (Hair et al. 1995, Field 2000).
Statistical protocols and software applied
The protocols applied were data assumptions (missing value analysis, outliers detection
and data replacement, normality and linearity tests, data transformation, normalization,
and standardization), cluster analysis (similarity measures through Euclidean distance
and linkage rule using Ward’s method), and factor analysis (derived using principal
component analysis, factors extraction of higher eigenvalues and equamax as rotation

Methodological approach
85
method). The software Statistical Package for the Social Sciences (SPSS) v. 12.0.1 for
Windows was used (Apache Software Foundation 2003).
6.3 Linking MCA and MVA
The two analytical phases of this study were linked (Figure 6.3).
In a first phase, multicriteria analysis (MCA) on the one hand homogenizes
and converts diverse types of data into standardized inputs, and on the other hand,
through assembling and comparing all the participating factors, generates an assessment
protocol, which in turn, outputs an indicator of the system’s performance, i.e., the
sustainable management index (SMI). This index is applied to fulfill the first objective
in the present study.
In a second phase, the results of the MCA are processed with multivariate
analysis (MVA) in order to weight and filter the entire set of factors participating in the
process, thus obtaining the ones more relevant (F1, F2…) and rating their performances
(I1, I2…). These are the elements on which optimization of the overall performance of
the system is based. This fulfills the second objective of this study.
Eventually the optimization model should provide feedback to the assessment
protocol and/or the MCA, thus fine-tuning the evaluation protocol or upgrading it into a
monitoring protocol. The assessment protocol could also provide input to the MVA.

Methodological approach
86
Figure 6.3 Flowchart of MCA and MVA procedures inegration: data integration,
analysis, outputs generation and definition of an optimization model.
SMI
MVA F1
F2
F3
I1
I2
I3
Optimization model
MCA
$ #€i
@
i
Assessment protocol
i i i
i i
i i ii i

Results and discussion
87
7 RESULTS AND DISCUSSION Towards a functional biodiversity assessment protocol and its model
Besides the theoretical focus of this study, which is the development of a functional
biodiversity approach for agroforestry systems, a pragmatic goal is also pursued:
operationalization of the concept by converting it into a management tool for
understanding and optimizing system performance. Two specific objectives were
considered. First, based on the functional biodiversity approach and through the
application of multicriteria analysis, a protocol for evaluating functional biodiversity
was established. Second, based on the same principles, a procedure (model) for
detecting core spots was developed in order to boost system performance for functional
biodiversity maintenance and enhancement.
The developed evaluation protocol is described in section 7.1. Here, the
physical and conceptual boundaries are established, the procedures of data collection
and integration detailed and outlined, and a conceptual model is proposed, taking into
account the most significant groups of participant factors. Those factors are then
subdivided, each factor is briefly described, its importance explained, collection details
provided, and homogenization procedures applied. Finally, the administrative software
is detailed and its useful outputs highlighted. These are the sustainable management
index (partial and cumulative), weighting and scoring indices and pair-wise comparison
procedure.
The optimization model is described in section 7.2. The sustainable
management index is analyzed by functions, localities, and groups. The analysis of
variance test is carried out for the same parameters, while a cluster analysis is applied to
groups and functions. Finally, through factor analysis, the most representative issues are
extracted and, based on these, an interpretation is attempted and management
suggestions proposed.
7.1 Evaluation protocol
In the previous chapters it is shown how various agroforestry practices are compatible
with the conservation of biodiversity and the supply of other environmental services. Is
also reviewed how the concept of functional biodiversity enlarges and supports a more
Results and discussion
88
pragmatic and versatile view of the environmental services provision. Finally, the need
of an integrative and maneuverable approach is discussed and proposed as an alternative
multicriteria analysis.
These arguments were taken into account in the development of an evaluation
protocol, which attempts to fulfill the specific objective 1 which is: ‘To develop a
protocol for evaluating functional biodiversity in agroforestry systems …’
Based on multicriteria analysis, a procedure for data collection, integration and
analysis was developed. These steps were as follows.
7.1.1 Framing the study
The definition of multicriteria analysis levels (principles, criteria, indicators and
verifiers), was done classifying them into three conceptual types of functions, i.e.,
ecological, productive (biophysical and socioeconomic) and operational. These levels
were in turn re-classified with respect to their geographical scale of application, i.e.,
plot, regional and landscape. For example, operational functions, such as policy
decisions are seen at landscape level, while biophysical production functions, such as
the number of strata of tree species are considered at plot level.
The main social actors, the farmer-owners of the agroforestry systems, are also
classified into three groups: the well-established ‘CAMTA partners’, mid-size farm
owners associated with the The Mixed Agricultural Cooperative of Tomé-Açú, the long
ago ‘immigrated’ small-sized farm owners, independent and poorly organized, and the
recently immigrated ‘newcomers’, small-sized farm owners, not organized at all (see
section 5.3).
The above defined classifications were integrated into a single evaluation
protocol (Figure 7.1).

Results and discussion
89
Figure 7.1 Overview of the evaluation criteria and their geographical scope of
application on functional biodiversity assessment in agroforestry systems of Tomé-Açú, Pará State, Brazil
7.1.2 Data collection and integration
As the study area is defined politically (municipality of Tomé-Açú), most primary
information, i.e., field surveys and field assessment, were collected at the regional level.
Information, such as policy judgments, commercialization scale or proximity to
biogeographical islands, were taken at landscape level, keeping in mind as unit of
analysis, i.e., the farmer plot in the Tomé-Açú municipality with its inherent
peculiarities (see section 5.4) (Figure 7.2).
Functional biodiversity in land-use
systems
Operational functions (landscape level)
Ecological functions (regional level)
Biophysical functions
Socioeconomic functions
Production functions (plot level)
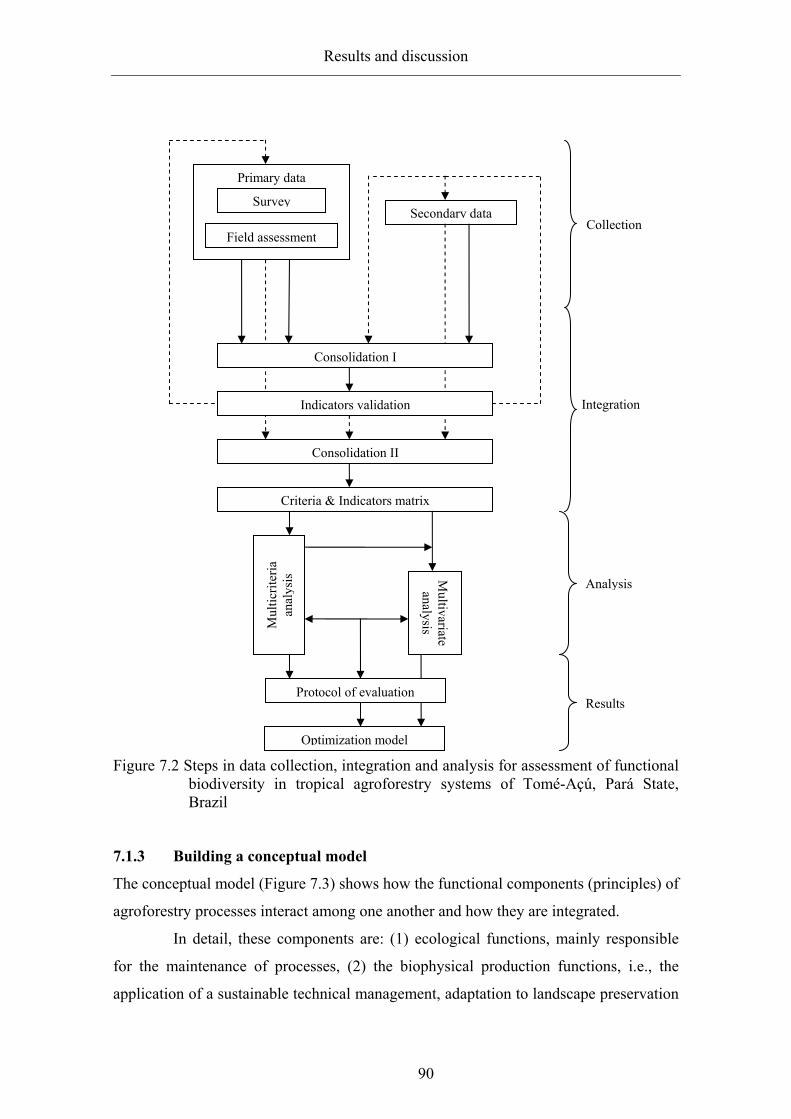
Results and discussion
90
Figure 7.2 Steps in data collection, integration and analysis for assessment of functional
biodiversity in tropical agroforestry systems of Tomé-Açú, Pará State, Brazil
7.1.3 Building a conceptual model
The conceptual model (Figure 7.3) shows how the functional components (principles) of
agroforestry processes interact among one another and how they are integrated.
In detail, these components are: (1) ecological functions, mainly responsible
for the maintenance of processes, (2) the biophysical production functions, i.e., the
application of a sustainable technical management, adaptation to landscape preservation
Primary data Survey
Field assessment
Secondary data
Criteria & Indicators matrix
Consolidation II
Mul
ticrit
eria
an
alys
is
Consolidation I
Indicators validation
Collection
Integration
Analysis Multivariate analysis
Protocol of evaluationResults
Optimization model

Results and discussion
91
functions, sustainable use of by-products, impact minimization of neighboring systems
and homeostasis maintenance are taken into account, (3) socioeconomic production
functions including mainly system rationality and orientation of the production, and (4)
operational functions, in which the most important item is a management plan.
This model portrays the framework on which the evaluation protocol is based,
i.e., the most influential functions and criteria, the interactions among them, and their
joint influence on functional biodiversity.
Figure 7.3 Conceptual model: main criteria and their integration into the evaluation
frame of the functional biodiversity in agroforestry systems of Tomé-Açú,Pará State Brazil (for a broader explanation see 7.1.5.)
Rationality & orientation of
production
Homeostasis maintenance
Adaptation to landscape
preservation
Impact minimization of neighboring syst.
Sustainable use of by-products
Functional Biodiversity in
AFS
Sustainable technical
management
Maintenance of processes
Existence of a land use system
management plan
Biophysical production functions
Socioeconomic production functions
Ecological functions
Operational functions
Interaction
Influence

Results and discussion
92
7.1.4 Establishing a hierarchy among components
As was previously stated, multicriteria analysis demands a hierarchical definition of
components, from the most general (principles) to the most specific (verifiers).
The factors are divided into more detailed components as they go down in the
level of hierarchy: principles (P) into criteria (C), criteria into indicators (I), and finally,
indicators into verifiers (V) (Figure 7.4).
The number of subordinate components is indeterminate, but in general, the
more factors, the better explained the focused phenomenon. However, the complexity of
their management also increases.
In the hierarchical arrangement of factors, the top-down approach is followed,
where lower-level items respond to the needs proposed by upper-level items. However,
the bottom-up approach facilitates interpretation of the model, where first-hand
information from lower levels supports more general information at upper levels.
Besides this vertical flux of information, horizontal interactions also occur among
components at different levels.

Res
ults
and
dis
cuss
ion
93
Figu
re 7
.4 H
iera
rchi
cal t
ree:
com
pone
nts’
inte
rdep
ende
nce
with
in th
e C
&I s
et o
f fun
ctio
nal b
iodi
vers
ity in
agr
ofor
estry
sys
tem
s of
Tom
é-A
çú, P
ará
Stat
e, B
razi
l (se
e 7.
1.5
for i
nter
pret
atio
n).
Mai
nten
ance
and
enha
ncem
ento
ffun
ctio
nalb
iodi
vers
ity
P1 E
colo
gica
l fun
ctio
ns
P2 B
ioph
ysic
al fu
nctio
nsP3
Soc
ioec
onom
ic fu
nctio
nsP4 O
pera
tiona
l fun
ct.
C11
C21
C22
C31
C41
I111
I113
I114
I311
I312
I313
I411
I412
I211
I212
I221
I222
I223
C23
I231
C24
I241
I242
I243
I112
V11
11V
1112
V11
21V
1122
V11
31 V11
41
V21
22V
2121
V21
23
V22
12V
2211 V
2213
V22
21
V23
11V
2312
V24
11 V24
31
V22
31V
2232
V24
21V
2422
V31
11
V31
22V
3121
V31
23
V31
31
V41
11 V41
13
V41
12
V41
21V
4122
PPr
oduc
tive
func
tions
V21
11

Results and discussion
94
7.1.5 Components characterization
The process of nomination, election and definition of components (principles, criteria,
indicators and verifiers), is based on selection of segments of several templates, similar
research, case studies, and own judgment. The components were thereafter refined and
consolidated through their conceptual re-evaluation, consultation with experts,
workshops with stakeholders and field evaluations in a feedback cycle that was repeated
several times (Figure 7.2).
The basis for selecting each component depended on its representativeness of
the focused phenomenon, application feasibility depending on logistics and limitations,
flexibility for extrapolation to a wider geographical area, and degree of integration into
one coherent framework of application. The final set compiled, from the highest to the
lowest level: 3 functions, 7 criteria, 18 indicators and 32 verifiers (from which have
been applied 27), however, the whole set is showed to maintain the coherence of the
approach.
(P.1.) Ecological functions
Ecological functions refer to the biomass and energy inflows and outflows in an
ecological system, without taking into account the factors related to production.
(C.1.1.) Ecological processes that affect, maintain, strengthen or restore
biodiversity are enhanced.
Focus on the ecological stability and resilience of the system as a function of the
biogeochemical processes acting upon it.
(I.1.1.1.) Nutrient cycling ratios are maintained in standards that allow the
efficiency and quality of the system’s processes.
The stability of these ranks indicates the stability of the processes performed on the
system (see sections 3.5.2 and 3.5.3).
(V.1.1.1.1.) Organic matter content in top soil
Soil organic matter (OM) is an indirect indicator of the degree of biological activity in
the soil above and belowground.

Results and discussion
95
The percentage of organic matter was measured within the first layer of soil (0-25 cm),
where the processes depend mostly on biological factors, and the results were divided
into quintiles in order to fit Criteria and Indicators Modification and Adaptation Tool
(CIMAT) demands (see section 6.1.5) (Table 7.1).
Table 7.1 Organic matter content in topsoil Score
(% O in soil) CIMAT
rate ≤ 0.66 1.0
> 0.66 < 1.14 2.0 > 1.14 < 1.40 3.0 > 1.40 < 1.67 4.0 > 1.67 < 4.09 5.0
(V.1.1.1.2.) Content of nitrogen in the topsoil
Nitrogen (N) and Phosphorus (P) are the primary elements for plant nutrition, and their
high demand in land-use systems is usually provided by fertilizers. Although the
nitrogen content fluctuates seasonally, it is still a good indicator of the intensity of soil
use.
The percentage of nitrogen was evaluated in the first layer of soil (0-25 cm) and
the results were divided into quintiles in order to fit the CIMAT demands (Table 7.2).
Table 7.2 Content of nitrogen in the topsoil
Score (% N in soil)
CIMAT rate
≤ 0,05 1.0 > 0.05 < 0.07 2.0 > 0,07 < 0.08 3.0 > 0,08 < 0.10 4.0
> 0,010 < 0.16 5.0
(I.1.1.2) Diversity of species is maintained at acceptable levels
The larger diversity of species indicates a wider net of interactions and indirectly
contributes to the stability of a system (see section 3.3.2).
Its evaluation focused on two of the three main levels of the study, on ecosystems and
species levels (putting aside the genetic diversity). Standard richness and abundance

Results and discussion
96
indices were applied to the two functional groups of species trees and small trees
(woody), and low herbs (non-woody).
(V.1.1.2.1) Richness and evenness of woody species
Woody species are a key component of agroforestry systems and their presence and
their diversity add complexity to the ecological processes and their diversity even more.
Therefore, perennial species diversity (richness and evenness) are indicators of the
degree of interactions that take place in an agroforestry system.
The Shannon index was calculated per plot and the results were divided into quintiles
(Table 7.3).
Table 7.3 Richness and evenness of woody species Shannon index CIMAT
Rate ≤ 0.006 1.0
> 0.00 < 0.23 2.0 > 0.23 < 0.30 3.0 > 0.30 < 0.47 4.0 > 0.47 < 0.68 5.0
(V.1.1.2.2). Richness and evenness of non-woody species
Herbaceous non-woody species, although non-targeted participants in the
agroecosystem are important participants in the ecological processes. These species are
important because of the farmers’ perception of them as crop competitors and their
tendency to eliminate them. Thus their presence and diversity in the plot is an indicator
of the system’s resilience and the continuance of intrinsic ecological processes.
The Shannon index was calculated per plot and the results divided into quintiles (Table
7.4).
Table 7.4 Richness and evenness of non-woody species Shannon index CIMAT
rate ≤ 0.00 1.0
> 0.00 < 0.27 2.0 > 0.27 < 0.57 3.0 > 0.57 < 0.74 4.0 > 0.74 < 1.10 5.0
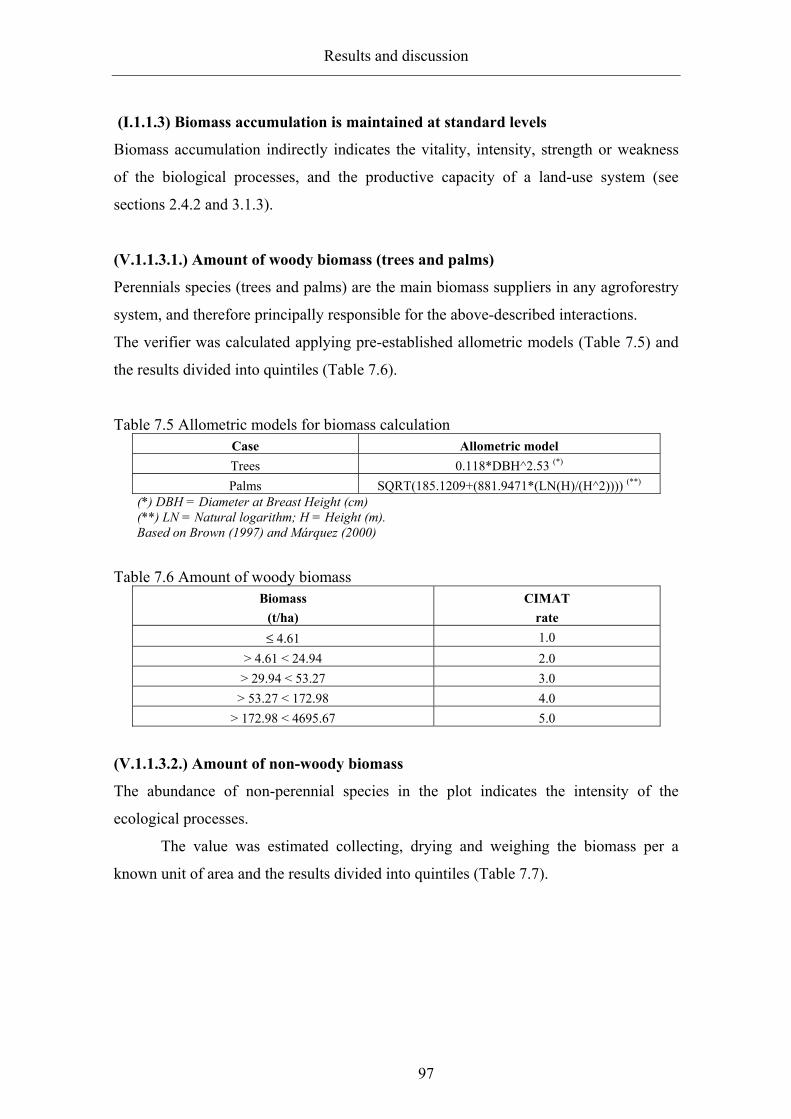
Results and discussion
97
(I.1.1.3) Biomass accumulation is maintained at standard levels
Biomass accumulation indirectly indicates the vitality, intensity, strength or weakness
of the biological processes, and the productive capacity of a land-use system (see
sections 2.4.2 and 3.1.3).
(V.1.1.3.1.) Amount of woody biomass (trees and palms)
Perennials species (trees and palms) are the main biomass suppliers in any agroforestry
system, and therefore principally responsible for the above-described interactions.
The verifier was calculated applying pre-established allometric models (Table 7.5) and
the results divided into quintiles (Table 7.6).
Table 7.5 Allometric models for biomass calculation Case Allometric model Trees 0.118*DBH^2.53 (*) Palms SQRT(185.1209+(881.9471*(LN(H)/(H^2)))) (**)
(*) DBH = Diameter at Breast Height (cm) (**) LN = Natural logarithm; H = Height (m). Based on Brown (1997) and Márquez (2000)
Table 7.6 Amount of woody biomass Biomass
(t/ha) CIMAT
rate ≤ 4.61 1.0
> 4.61 < 24.94 2.0 > 29.94 < 53.27 3.0
> 53.27 < 172.98 4.0 > 172.98 < 4695.67 5.0
(V.1.1.3.2.) Amount of non-woody biomass
The abundance of non-perennial species in the plot indicates the intensity of the
ecological processes.
The value was estimated collecting, drying and weighing the biomass per a
known unit of area and the results divided into quintiles (Table 7.7).

Results and discussion
98
Table 7.7 Amount of non-woody biomass Biomass
(t/ha) CIMAT
rate ≤ 0.08 1.0
> 0.08 < 0.89 2.0 > 0.89 < 1.36 3.0 > 1.36 < 2.06 4.0 > 2.06 < 4.88 5.0
(I.1.1.4) Soil erosion vulnerability
In tree-dominated ecosystems, soil is the second highest reservoir of biomass, and water
erosion the determinant soil-depleting factor in humid areas. As this research focuses on
systems that involve both characteristics, it makes sense to consider the level of soil
erosion susceptibility.
(V.1.1.4.1.) Percentage of herbaceous soil cover
The degree of herbaceous species cover is used as an indicator of the plot’s
vulnerability to erosion, because it acts as a buffer against the impact of raindrops and
provides adherent structures preventing the dragging of particles by water.
The covering parameters defined by Woda (2006) were used to quantify the verifier and
the results divided into quintiles (Table 7.8).
Table 7.8 Percentage of herbaceous soil covering Soil covering
(%) CIMAT
rate 0 1.0
0 – 25 2.0 25 – 50 3.0 50 – 75 4.0 75 – 100 5.0
Based on Woda (2006)
(P.2.) Biophysical production functions
These are the factors that influence productive features of the studied systems,
specifically the ones related to biophysical characteristics.
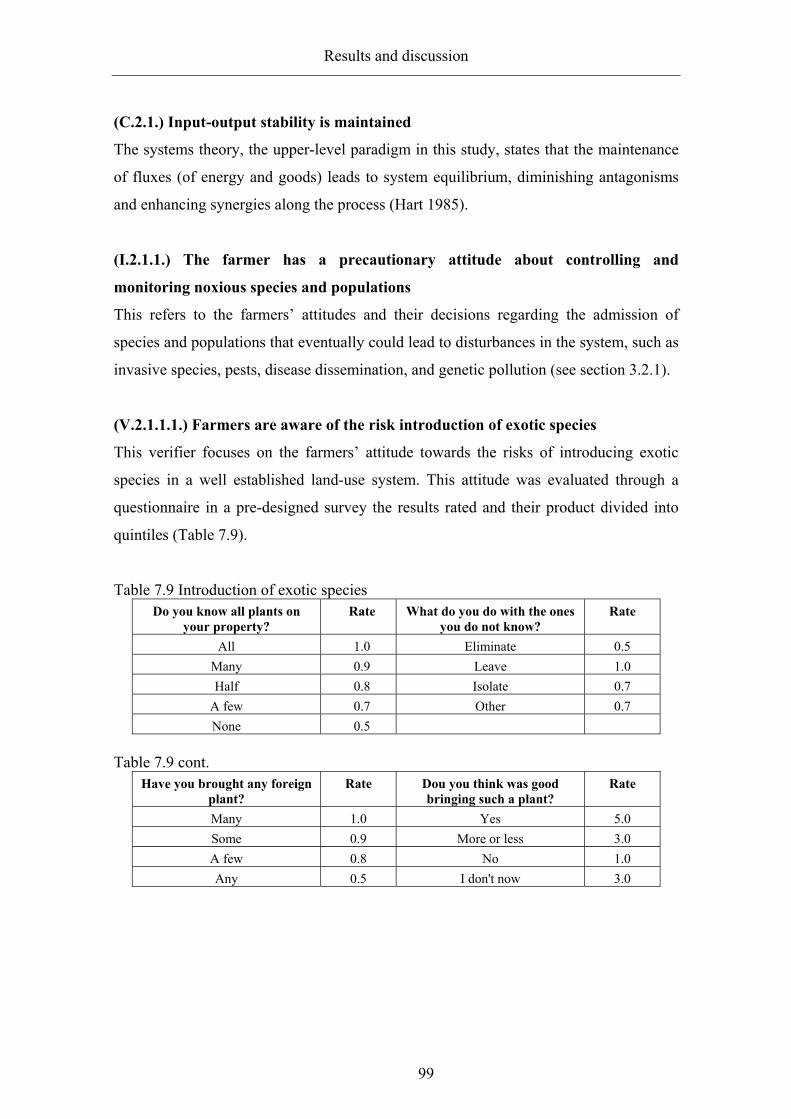
Results and discussion
99
(C.2.1.) Input-output stability is maintained
The systems theory, the upper-level paradigm in this study, states that the maintenance
of fluxes (of energy and goods) leads to system equilibrium, diminishing antagonisms
and enhancing synergies along the process (Hart 1985).
(I.2.1.1.) The farmer has a precautionary attitude about controlling and
monitoring noxious species and populations
This refers to the farmers’ attitudes and their decisions regarding the admission of
species and populations that eventually could lead to disturbances in the system, such as
invasive species, pests, disease dissemination, and genetic pollution (see section 3.2.1).
(V.2.1.1.1.) Farmers are aware of the risk introduction of exotic species
This verifier focuses on the farmers’ attitude towards the risks of introducing exotic
species in a well established land-use system. This attitude was evaluated through a
questionnaire in a pre-designed survey the results rated and their product divided into
quintiles (Table 7.9).
Table 7.9 Introduction of exotic species Do you know all plants on
your property? Rate What do you do with the ones
you do not know? Rate
All 1.0 Eliminate 0.5 Many 0.9 Leave 1.0 Half 0.8 Isolate 0.7
A few 0.7 Other 0.7 None 0.5
Table 7.9 cont.
Have you brought any foreign plant?
Rate Dou you think was good bringing such a plant?
Rate
Many 1.0 Yes 5.0 Some 0.9 More or less 3.0 A few 0.8 No 1.0 Any 0.5 I don't now 3.0

Results and discussion
100
(I.2.1.2.) Farmers maintain an attitude that supports intra- and inter-species
variability of the system
This indicator refers to the farmers’ awareness concerning the variability of land-use
system components, i.e., varieties and functional groups (see section 3.3.3).
(V.2.1.2.1.) Number of strata in the system
The number of vertical strata is a direct function of the number of functional groups and
the diversity of perennials, and has indirect influence on the degree of species’
interaction and soil erodibility (Glover 2003) (see sections 2.3.5 and 2.4.2).
The verifier was assessed with direct measurements in the field, using parameters from
ecological literature, and the rates ranked according to CIMAT requirements (Table
7.10).
Table 7.10 Number of strata in the system Number of strata – height range (m) CIMAT
Rate < 1,5 1.0
1,5 – 5 3.0 > 5 5.0
(V.2.1.2.2.) Number of varieties of main crops
Intra-specific variation is considered a key factor in agro-biodiversity, giving stability to
the system in biophysical terms through provision of horizontal resistance, cross
pollination, etc. (see section 3.3.2).
The factor was assessed through a questionnaire in a pre-designed survey and the
responses divided into quintiles to feed CIMAT (Table 7.11).
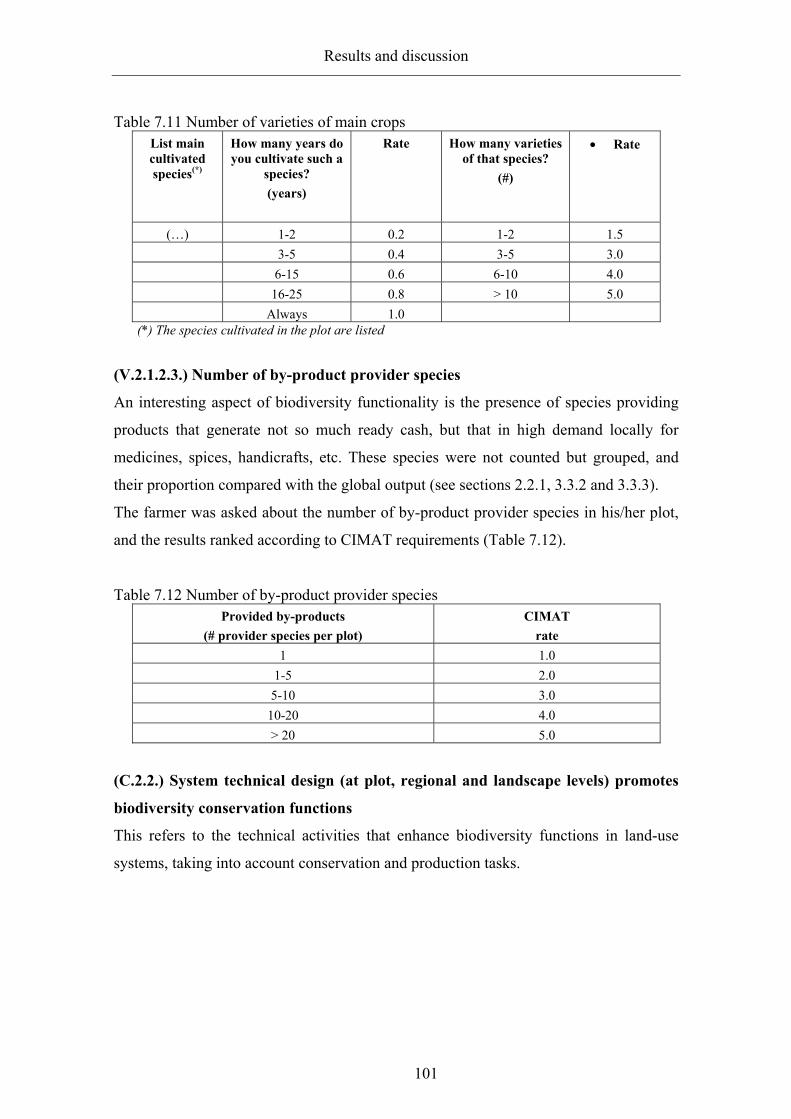
Results and discussion
101
Table 7.11 Number of varieties of main crops List main cultivated species(*)
How many years do you cultivate such a
species? (years)
Rate How many varieties of that species?
(#)
• Rate
(…) 1-2 0.2 1-2 1.5 3-5 0.4 3-5 3.0 6-15 0.6 6-10 4.0 16-25 0.8 > 10 5.0 Always 1.0
(*) The species cultivated in the plot are listed
(V.2.1.2.3.) Number of by-product provider species
An interesting aspect of biodiversity functionality is the presence of species providing
products that generate not so much ready cash, but that in high demand locally for
medicines, spices, handicrafts, etc. These species were not counted but grouped, and
their proportion compared with the global output (see sections 2.2.1, 3.3.2 and 3.3.3).
The farmer was asked about the number of by-product provider species in his/her plot,
and the results ranked according to CIMAT requirements (Table 7.12).
Table 7.12 Number of by-product provider species Provided by-products
(# provider species per plot) CIMAT
rate 1 1.0
1-5 2.0 5-10 3.0
10-20 4.0 > 20 5.0
(C.2.2.) System technical design (at plot, regional and landscape levels) promotes
biodiversity conservation functions
This refers to the technical activities that enhance biodiversity functions in land-use
systems, taking into account conservation and production tasks.

Results and discussion
102
(I.2.2.1.) Changes in habitats as result of human interventions are as restricted as
possible in order to prevent processes of fragmentation and conversion
This refers to the effect of conversion of existing ecosystems into new land-use systems
(see sections 2.4.1, 3.2.1 and 3.3.2).
(V.2.2.1.1.) Physical system borders and limits definition
Delimitation of the land-use system area (plot) is essential for the landscape evolution
in an environmental friendly framework. In an environmental services payment
program, such a unit should coincide with the plot unit of analysis.
These borders were defined through direct observation in the field (Table 7.13).
Table 7.13 Physical borders delimitation Delimitation of the plot border
(%) CIMAT
rate 80-100 5.0 60-80 4.0 40-60 3.0 20-40 2.0 0-20 1.0
(V.2.2.1.2) Definition of spatial and functional limits at regional level
The political borders (verifier V.2.2.1.1.) are compared with the natural (e.g., rivers)
and functional (e.g., roads) boundaries at community level, observing the degree of
overlapping.
The remote sensing images of the areas with the evaluated plots were overlayed with
the natural boundaries (Table 7.14).
Table 7.14 Correspondence of political and natural boundaries Correspondence of political with natural
boundaries (%)
CIMAT rate
80-100 5.0 60-80 4.0 40-60 3.0 20-40 2.0 0-20 1.0

Results and discussion
103
(I.2.2.2.) Management activities are carried out in order to promote biodiversity
conservation functions at landscape level
This refers to the impact of management activities related to production and biodiversity
conservation.
(V.2.2.2.1.) Proportion and closeness of land-use systems to biogeographical islands
at community level
It is well known that biogeographical islands (BI; forest patches, buffer strips,
biological corridors and water flows), provide the best buffer structures for agricultural
areas, through supplying habitats and corridors for species, and by enhancing
biogeochemical processes in landscapes that are affected by homogeneous large-scale
land-use systems. Therefore, the number, proportion and closeness of the BI to the
targeted land-use systems serve as an indicator of biodiversity activity (see sections
2.3.1, 2.3.1, 3.2.1 and 3.3.2).
For the evaluation remote sensing images were used and the size, proportion and
proximity of BI to the agroforestry plots (Table 7.15).
Table 7.15 Proportion and closeness of plot to BI Presence of BI at community
level (%)
Rate Closeness of the plot to BI (km)
Rate
40-50 5.0 > 5 0.2 30-40 4.0 4-5 0.4 20-30 3.0 3-4 0.6 10-20 2.0 2-3 0.8 0-10 1.0 1-2 1.0
(I.2.2.3.) Influence on biodiversity conservation functions of spatial and temporal
arrangements of land-use system components
This refers to the farmers’ decisions responding diversification of groups of species at
plot level (see section 4.2.3).
(V.2.2.3.1.) Proportion of monocultures (annuals) and polycultures (perennials)
The more functional groups present in a plot, the higher the spatial and temporal
occupation and the higher the level of interaction. The proportion between the areas

Results and discussion
104
occupied by polycultures (slash-and-burn systems, primary and secondary forest and
agroforestry systems) were contrasted with the total area of the property (see section
4.4.1).
For the calculation, an index of the different land management types was designed,
which is equal to five times the area assigned to polycultures divided by the total plot
area; the resulting values were divided into quintiles to feed CIMAT (Table 7.16).
Table 7.16 Proportion monocultures vs. polycultures Land-use
classification per plot (ha)
Area polycultures (slash-and-
burn, primary forest, AFS, …)
(ha)
Area monocultures
(cropfields, pastures, …)
(ha)
Total area (ha) Index
… a b c (a*5)/c
(C.2.3.) Impact on neighboring systems is minimized to maintain upper-level
ecosystem functionality
Harmful impacts from land-use systems toward neighboring areas can be sources of
stress and disruption of landscape stability.
(I.2.3.1.) Special protection of most sensitive, rare or less abundant systems
This refers to the level of protection provided to the conservation and buffer areas near
land-use systems, assuring their provision of ecological benefits (see sections 2.3.1 and
4.4.3)
(V.2.3.1.1.) Proportion of neighboring well managed sensitive systems
The vicinity to systems, such as plains, lagoons, primary forest or water springs is
important, since these perform as buffering structures and ecological reserves.
Evaluation was done with direct quantification of previously stratified types of borders
and a posterior division into quintiles of the responses to feed CIMAT (Table 7.17).

Results and discussion
105
Table 7.17 Neighboring well managed systems Type of neighboring systems Rate Proportion of covering
(%) CIMAT
rate
Road, house, urban area 0.2 80-100 5.0 Pasture, grassland, plain, mono-crop
field 0.4 60-80 4.0
Agroforestry system 0.6 40-60 3.0 Secondary forest, water spring, river 0.8 20-40 2.0
Primary forest 1.0 0-20 1.0
(V.2.3.1.2.) Proportion of borders installed to perform environmental functions
Linnear vegetation arrangements in agroforestry systems, e.g., hedgerows, living
fences, windbreaks, designed originally to perform protection and delimitation
functions, also contribute to optimization of system performance.
Evaluation was done with direct quantification of previously stratified types of borders
and a posterior division into quintiles of the responses to feed CIMAT (Table 7.18).
Table 7.18 Border types proportion Type of border
Rate Proportion of covering
(%) CIMAT rate
Wire, wood, metal, cement, fences
0.3 80-100 5.0
Living fence, hedgerow (light) 0.6 60-80 4.0 Living fence, windbreak,
hedgerow (dense) 1.0 40-60 3.0
20-40 2.0 0-20 1.0
(C.2.4.) Technical management is carried out in a sustainable way
Technical decisions based on a strong technical background and conservationist criteria
in the medium term can determine the sustainability of the production process.
(I.2.4.1.) Soil erosion is adequately managed
Soil hosts essential processes that affect production and biodiversity conservation, such
as decomposition or nitrogen transformation. Therefore, the measures for its protection
and sustainable management influence the generation of outputs.
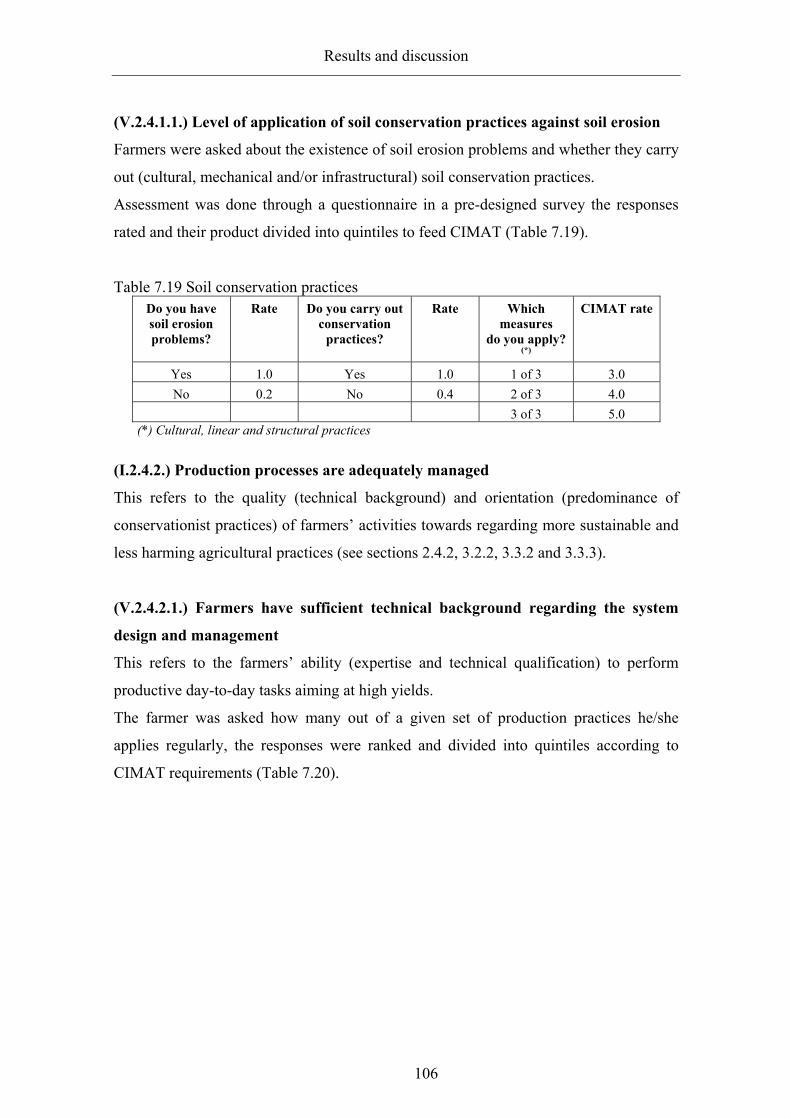
Results and discussion
106
(V.2.4.1.1.) Level of application of soil conservation practices against soil erosion
Farmers were asked about the existence of soil erosion problems and whether they carry
out (cultural, mechanical and/or infrastructural) soil conservation practices.
Assessment was done through a questionnaire in a pre-designed survey the responses
rated and their product divided into quintiles to feed CIMAT (Table 7.19).
Table 7.19 Soil conservation practices Do you have soil erosion problems?
Rate Do you carry out conservation
practices?
Rate Which measures
do you apply? (*)
CIMAT rate
Yes 1.0 Yes 1.0 1 of 3 3.0 No 0.2 No 0.4 2 of 3 4.0
3 of 3 5.0 (*) Cultural, linear and structural practices
(I.2.4.2.) Production processes are adequately managed
This refers to the quality (technical background) and orientation (predominance of
conservationist practices) of farmers’ activities towards regarding more sustainable and
less harming agricultural practices (see sections 2.4.2, 3.2.2, 3.3.2 and 3.3.3).
(V.2.4.2.1.) Farmers have sufficient technical background regarding the system
design and management
This refers to the farmers’ ability (expertise and technical qualification) to perform
productive day-to-day tasks aiming at high yields.
The farmer was asked how many out of a given set of production practices he/she
applies regularly, the responses were ranked and divided into quintiles according to
CIMAT requirements (Table 7.20).

Results and discussion
107
Table 7.20 Farmers’ technical background From the list (*)
how many activities do you carry out? (#)
CIMAT rate
1-4 1.0 5-7 2.0 8-10 3.0
11-15 4.0 > 15 5.0
(*) Seeding: seed collection, storing, germination test,…; nursering: design, watering, protection, reseeding, ...; planting: design (spacing), watering, protection, replanting, ...; management: weedding, fallowing, watering, protection, manuring, sanitary control, hewing, pruning.
(V.2.4.2.2.) Farmers apply low-impact techniques, treatments and methods to
maintain resources and yields
This refers to the farmers’ knowledge (expertise and technical qualification) on
productive day-to-day tasks in a conservationist frame.
The farmer was asked how many out of a given set of production practices he/she
carries out regularly and the responses ranked and divided into quintiles according to
CIMAT requirements (Table 7.21).
Table 7.21 Farmers’ low impact techniques application From the list (*)
how many practices do you carry out? (#)
CIMAT rate
1-2 1.0 3-4 2.0 5-6 3.0 7-8 4.0 > 8 5.0
(*) Weedding (e.g., manual vs. herbicides), protection (e.g., wire vs. living fence), manuring (synthetic vs. organic); phytosanitation (e.g., adequate dosage, alternative methods).
(I.2.4.3) There is a feedback process in order to react to changing conditions
This indicates the flexibility of farmers’ technical decisions regarding adaptation and
recovery of stability in changing conditions. Environmental, social and political factors
are taken into account (see sections 2.4.2, 3.2.2, 3.3.2 and 3.3.3).

Results and discussion
108
(V.2.4.3.1.) Technical management plan changed in the last 5 years to adapt to
changes
Farmers are asked about the changes in their production-related decisions due to
changes in environmental, social, political and economic factors during the last five
years. The responses were ranked and divided into quintiles according to CIMAT
requirements (Table 7.22).
Table 7.22 Environmental-driven management plan changes Have you changed your administration plan in the last 3-
5 years? CIMAT
rate Yes 5.0 No 1.0
We are always changing 3.0 Other answer 3.0
(P.3.) Socioeconomic production functions
This refers to the factors influencing the productive features of the studied systems,
focusing on socioeconomic characteristics only.
(C.3.1.) The land-use system satisfies the requirements for eligibility as an
environmental services provider
The following conditions should be satisfied: food security assurance, financial
feasibility through provision of supplementary income, and reinvestment assurance (see
section 1.3).
(I.3.1.1.) Food security is well maintained
This refers to the degree of food security of the households in terms of quantity and
quality, generated directly or indirectly by the land-use system itself (see sections 4.2.2
and 4.3.3).
(V.3.1.1.1.) Income re-invested in food acquisition
It is assumed that in commercially linked communities, food security satisfaction
extends, after the self-provision of basic supplies, to food acquisition in external
markets. Therefore, the relative amount of money invested in food acquisition should

Results and discussion
109
reflect the household degree of self-dependence, i.e., the more external acquisitions, the
more food-secure is the household.
Farmers were asked about their self-supply of key products, such as manioc, maize and
beans, the products he/she has to buy from external markets, the origin of the money
invested for such acquisition, and the balance of income-production vs. expenditure
external acquisition.
Assessment was through a series of questions in a pre-designed survey the responses
were ranked and divided into quintiles according to CIMAT requirements (Table 7.23).
Table 7.23 Income reinvestment in food acquisition Do you use some crops for your own consumption?
Rate Do you have to buy other food?
Rate
Yes 1.0 Yes 0.9 No 0.4 No 1.0
Table 7.23 cont.
Money for it comes from farming?
Rate Was it enough last year? Rate
Yes 4.0 Yes 1.0 No 2.0 No 0.4
(I.3.1.2.) Farmers actively seek the access to markets and diversification of their
production
This refers to the farmers’ access to markets and production diversification, and the
relation this has with the generation of income (see sections 2.4.3, 4.2.2 and 4.2.3).
(V.3.1.2.1.) The system is considered economically feasible
This refers to the profitability of the agroforestry system. Farmers were asked about the
production quantity and quality within the year of evaluation and their general opinion
about the system’s economic feasibility.
Its assessment was done through a questionnaire in a pre-designed survey, the responses
rated and their product divided into quintiles to feed CIMAT (Table 7.24).

Results and discussion
110
Table 7.24 Agroforestry system’s financial feasibility How was the production this
year? Rate Are AFS good business? Rate
Good 5.0 Yes 1.0 More or less good/bad 3.0 No 0.5
Bad 1.0 Other answer 3.0
(V.3.1.2.2.) Degree of farmers’ market access
The access to commercialization channels is the most forceful argument in searching
the economic sustainability of the production process, and a pre-requisite for economic
and social sustainability.
Farmers were asked about their participation in the market: frequency, type of
connection (individual, collective), presence of intermediaries and their current state of
satisfaction.
It was assessed through a questionnaire in a pre-designed survey, the responses rated
and their product divided into quintiles to feed CIMAT (Table 7.25).
Table 7.25 Farmers’ access to the market Do you bring
your production to the market?
Rate How frequently?
Rate Which type of access you find
best?
Rate
Yes 5.0 1-3 times/year 0.4 Associated 0.9 No 1.0 4-6 times/year 0.6 Individually 1.0
1-2 times/month 0.8 once a week 0.9 > once week 1.0
(V.3.1.2.3.) Diversity of products regularly brought to the market by the farmers
Diversification of production generates diversification of income and financial
assurance to the households through the creation of market niches.
Farmers were asked about the types and number of products that they took to the market
and whether he/she is satisfied or wishes to increase these.
This was assessed through a questionnaire in a pre-designed survey, the responses rated
and their product divided into quintiles to feed CIMAT (Table 7.26).

Results and discussion
111
Table 7.26 Diversity of products brought to the market How many products do you bring to the market usually?
Rate Would you like to increase them?
Rate
1-2 0.4 Yes 1.0 3-4 0.6 No 0.9 5-6 0.8 7-8 0.9 >8 1
(I.3.1.3.) System feedback processes keep the production at satisfactory levels
System sustainability requires processes that self-regulate themselves permanently,
maintaining a constant flux of inputs and outputs.
(V.3.1.3.1.) Farmers’ attitude towards reinvestment
Financial investment is essential for setting up and maintaining production factors
(labor, land, capital and entrepreneurship) in the medium or long term.
Farmers were asked about their disposition to invest financially on their own farm, and
whether they had done it in the past.
This was assessed through a questionnaire in a pre-designed survey, the responses rated
and their product divided into quintiles to feed CIMAT (Table 7.27).
Table 7.27 Farmers’ reinvestment attitude Do you invest
the earned money in the
same property?
Rate Do you find it important?
Rate Did you do it always?
Rate
Yes 5.0 Yes 1.0 Yes 1.0 No 1.0 No 0.4 No 0.8
(P.4.) Operational functions
This considers administrative and policy-related issues at local, regional, and national
levels.

Results and discussion
112
(C.4.1.) A landscape management plan appropriate to the environmental, social
and economic circumstances exists
Upper-level institutions (normally advising and monitoring instances of national or
local governments) perform an important role in monitoring environmental aspects of
agricultural activities. Their competence and influence is evaluated here.
(I.4.1.1.) Institutions dictate rules about controlling production activities and their
environmental implications
Institutions working on environmental issues related to productive activities are
spotlighted; their activities and orientation of the normative framework are evaluated
(see sections 4.2.1 and 4.2.3).
(V.4.1.1.1.) A technical institution is responsible for monitoring environmental
damages caused by productive activities, and farmers obey its rules
The existence of an institution in charge of observing, monitoring and regulating
environmental impacts of productive activities is evaluated. This was done through
documentation and interviews with local stakeholders about the institutions’
performance; farmers were asked about the presence and influence of such institutions
and their own disposition to obey rules.
This was assessed through a questionnaire in a pre-designed survey, the responses rated
and their product divided into quintiles to feed CIMAT (Table 7.28).
Table 7.28 Environmentalist institutional participation Is there an environmental
institution? Rate Its rules are obeyed by
farmers… Rate
Yes 1.0 No 1.0 No 0.2 Poorly 2.0
Partially 3.0 Fully 5.0
(V.4.1.1.2.) There is an institutional feedback based on technical and scientific
basis to define action strategies
This refers to the scientific and technical background on which the institutions base
their strategies and actions, and how they are maintained with time. The assessment was
done through documentation and interviews about such institutions with local

Results and discussion
113
stakeholders. The qualitative responses were categorized, ranked and assigned to
CIMAT frame (Table 7.29).
Table 7.29 Institutional feedback There is an institutional feedback based on
technical and scientific basis CIMAT
rate Yes 5.0
Sometimes 3.0 No 1.0
(V.4.1.1.3.) Institutional advice impacts substantially on farmers’ activities
The accuracy of the institutions’ advising is evaluated, contrasting their guidelines and
impacts in the field.
This was done through documentation and interviews with local stakeholders about the
institutions’ impacts. Farmers were asked about the orientation of the institutions’
advice, specifically about the provisory law 2166, which states that “… in the
Amazonian region it is allowed to use up to 20% of the area of a private property; 80%
must be kept as a reserve”.
This was assessed through a questionnaire in a pre-designed survey, the responses rated
and their product divided into quintiles to feed CIMAT (Table 7.30).
Table 7.30 Impact of institutional ruling The benefits of such a law are
beneficial mainly for
Rate Do you have contact with the institutions that
support that law?
Rate The situation improved after
the law came into force?
Rate
The farmer 1.0 Yes 1.0 Yes 5.0 The community 0.9 No 0.9 No 1.0
The region 0.8 The state 0.7
The country 0.6
(I.4.1.2.) Institutions provide incentives for diversifying the local economy, thus
avoiding the dependence on only one or few products
This refers to the existence of institutions and organizations in charge of commerce and
economic channeling, such as cooperatives, associations and government or private
brokering offices, which encourage farmers to diversify their productive activities (see
section 4.3.2).

Results and discussion
114
(V.4.1.2.1.) The diversification of the production is encouraged at organizational
and institutional levels
This pays special attention to local programs and their suitability with regard to the
local conditions.
Farmers were asked about the performance and impact of the relevant institutions;
stakeholders were also consulted, and the institutions mentioned were visited.
The qualitative responses were ranked and assigned according to CIMAT requirements
(Table 7.31).
Table 7.31 Production diversification enhancement Local organizations and institutions encourage the
diversification of the production CIMAT
Rate No 1.0
Poorly 2.0 Somehow 3.0
Yes 4.0 Always 5.0
(V.4.1.2.2.) There is a demand for the by-products generated by agroforestry
systems
Farmers sell their by-products at local markets and sometimes regional ones; the role of
such markets on farmers’ diversification decisions is evaluated.
Farmers were asked about the existence and impact of markets for their production;
stakeholders were also consulted, and eventually the mentioned institutions were
visited. The qualitative responses were compiled ranked and assigned according to
CIMAT requirements (Table 7.32).
Table 7.32 Demand for by-products Local and regional demand for agroforestry by-
products CIMAT
rate Any 1.0 Poor 2.0
Average 3.0 Good 4.0 High 5.0

Results and discussion
115
7.1.6 CIMAT: the data administration tool
Based on Criteria and Indicators Modification and Adaptation Tool (CIMAT; Figure
7.5), C&I data sets were developed for each sampling site. These data sets integrate the
data collected on each plot, and facilitate multicriteria analysis, i.e., construction of
hierarchies, ranking and rating processes, cross-wise comparisons and obtaining of the
Sustainability Management Index (SMI).
Figure 7.5 CIMAT data management interface: hierarchical weigting and scoring
(working space), sustainable management index (upper right: SFM score) and pairwise comparison (active window).
Sustainable Management Index (SMI)
The sustainable management index (SMI) shown in Figure 7.5 as SFM score, considers
the relative importance of each assessed component, and combines all of them into a
single index reflecting the overall performance of the land-use system at a particular
point in time.
SMI is calculated considering the weight of each component assessed on a
zero-to-hundred scale, and the score on a one-to-five scale. For example, the verifier

Results and discussion
116
V.1.1.1.1 content of organic matter represents two thirds {W: 66.667} of the weight of
its immediate upper indicator I.1.1.1 nutrients cycling (…) and is scored with {S:
4.273}. This process is repeated successively until reaching the highest level, which will
represent the overall performance of the system.
In the same way, it is possible to obtain partial indices of performance per
groups or types of activities, as in the example where P.1. Ecological functions are
maintained (…) has obtained {S: 3.578}, which indicates a considerably high
performance. In this way, one can compare the efficiency of each factor in the system,
or compare the performance of the same factor in various plots. The SMI can also be
used as a monitoring tool, evaluating periodically the same plots and observing the
evolution of the index (or indices) during a certain period of time.
Summarizing, this evaluation protocol can provide a basis for functional
biodiversity in agroforestry system evaluation, through defining the physical and
conceptual scopes of the work, collecting and integrating the required data, grouping
and ulterior disintegration on manageable components, and weighing, comparing and
scoring them.
7.2 Optimization model The evaluation protocol resulting from the integration of the above described successive
steps provides an analysis framework for a comprehensive view and understanding of
the process in a given agroforestry system. However a procedure for examining the
consistency of this evaluation protocol is also necessary. Such a procedure should be
able to point out the most influential components in the system’s performance as a
functional biodiversity (environmental services) provider.
Thus, we have compiled these arguments in the development of the specific
objective 2, which is ‘To define a management optimization model of agroforestry
systems for enhancing and maintaining functional biodiversity …’.
Based on multivariate statistical analysis, a series of analyses was carried out
to define the areas where farmers can change their practices to improve their
performance.
Results and discussion
117
7.2.1 SMI Statistics
SMI statistics per functions, localities and groups
The obtained sustainable management indices (SMI) of all evaluated plots were
compared as a global indicator of the system performance and as an indicator of
ecological, productive (biophysical and socioeconomic) and operational specific
functions (see section 7.1.3). The indices were also analyzed with respect to the six
studied localities (Miritipitanga, Tropicalia, Tomé-Açú, Quatro Bocas, Igapú-Açú and
Forquillas), and with respect to the three farmer groups (CAMTA partners, immigrated
and newcomers) (see section 7.1.1).
Statistics of SMI per locality
In general, the average SMI of the six localities reflect the three group averages.
Localities corresponding to the group of newcomers (Miritipitanga and Tropicalia)
show higher variations and lower averages, while in Tropicalia SMI scores are the
lowest. In the group immigrated (Tomé-Açú and Quatro Bocas), the variations are
smaller, the averages are higher than in the other four localities. In the third group
CAMTA partners, the variation in Igapú-Açú is very high, i.e., second highest after
Miritipitanga, although the average is similar to Tropicalia and Forquillas, which
indicates a more disperse sample. In five of the six localities, the sampling distribution
tends to be normal; Tropicalia is an exception, where the distribution is asymmetric and
tends to lower scores. In general, localities and groups overlap one another, therefore
working directly with groups instead of with localities is possible without a great loss of
data (Figure 7.6).
As a general interpretation, three of the six localities (Miritipitanga, Tropicalia
and Forquillas) perform in a disperse way and show high and low SMI, in contrast to
Tomé-Açú and Quatro Bocas, where the SMI show less variation and tend to be higher
than the average. Igapú-Açú scores are especially stable, maybe due to its small sample
size.

Results and discussion
118
13610131117N =
6.005.004.003.002.001.00
SMI t
otal
3.8
3.6
3.4
3.2
3.0
2.8
2.6
2.4
2.2
Figure 7.6 SMI for functional biodiversity per locality (1 = Miritipitanga, 2 =
Tropicalia, 3 = Tomé-Açú, 4=Quatro Bocas, 5 =Igapú-Açú, 6 = Forquillas)
Statistics of cumulative SMI per group
The newcomer group shows the greatest variation of SMI and CAMTA partners the
lowest. The SMI average in the three cases is located approximately in the center of the
boxplots (Figure 7.7), which indicates a regular (normal) distribution. The lowest score
(about 2.3) belongs to the newcomers group, and the highest (about 3.7) to the CAMTA
partners. In all three cases high performances were obtained (about 3.6). However,
concerning low extremes, CAMTA partners does better than the other two groups: 2.7
versus 2.3 and 2.5 in newcomers and immigrated respectively.There are no outliers,
thus, we can accept the range between 2.3 and 3.7 as the lowest and highest SMI scores
for any system’s performance. (Figure 7.7)
192328N =
3.002.001.00
SMI t
otal
3.8
3.6
3.4
3.2
3.0
2.8
2.6
2.4
2.2
Figure 7.7 Cumulative SMI for functional biodiversity per group (1 = Newcomers, 2 =
CAMTA partners, 3 = Immigrated).

Results and discussion
119
Statistics of SMI of ecological functions per group
The averages of ecological SMI of newcomers and CAMTA partners are similar
(around 3.5), although in theory, these two groups represent both extremes of the
sampling in terms of organization, time of permanence and technical capacity. This
means that newcomers have impacted the systems’ ecological functions as much as the
CAMTA partners, despite the fact that the first group arrived some 50 years later and
has only about 10 years of experience in the zone.
The third case, the immigrated group with a level of experience between the
other two groups, has an ecological SMI considerably lower (around 3.2), which is
interpreted to mean that they have been settled long enough to have negatively affected
the ecological quality of their systems, but not long enough to develop measures
(technological or financial) to cope with them (Figure 7.8).
192328N =
3.002.001.00
SMI e
colo
gica
l
5.0
4.5
4.0
3.5
3.0
2.5
2.0
Figure 7.8 Ecological SMI per group (1 = Newcomers, 2 = CAMTA partners, 3 =
Immigrated).
However, both the damage to the ecological systems and the recovery are both
long-term phenomena, only noticeable in medium to large time frames.
Statistics of SMI of biophysical production functions per group
The SMI related to biophysical production functions show smaller variations than other
functions among the three groups of farmers, which indicates a relative homogeneity
among the qualities of their practices.

Results and discussion
120
The group immigrated shows the highest average SMI, followed closely by CAMTA
partners, and newcomers, who show an average considerably lower than the other two.
Since the CAMTA partners are the better technically qualified group, the high value of
the group immigrated was unexpected. The reason could be the scale of the plots, i.e.,
CAMTA partners are middle-sized farmers and the immigrated own smaller farms,
which means that management in the first case is more extensive, and in the second case
more intensive (Figure 7.9).
192328N =
3.002.001.00
SMI b
ioph
ysic
al p
rodu
ctio
n
4.0
3.5
3.0
2.5
2.0
1.5
36
Figure 7.9 Biophysical-production SMI per group (1 = Newcomers, 2 = CAMTA
partners, 3 = Immigrated).
Statistics of SMI of socioeconomic production functions per group
The average SMI of socioeconomic production functions clearly distinguishes two
groups: newcomers with quite a high score against CAMTA partners and immigrated
with lower ones. Variations of SMI in the three groups are similar, and compared to the
SMI of other functions show a more sharp distribution.
Socioeconomic production functions deal mainly with the system’s capacity to
satisfy basic needs of a household. Thus, the superiority of the ‘newcomers’ could be
explained with their greater social cohesion, characteristic of small farm-plots and
communities recently established, compared to more developed and market-oriented
systems like CAMTA partners, where needs, such as food security and market
accessibility are taken for granted. Another factor explaining the newcomers superiority
could be that the survey was done based on small farmers, which could have lowered
the other groups’ scores (Figure 7.10).
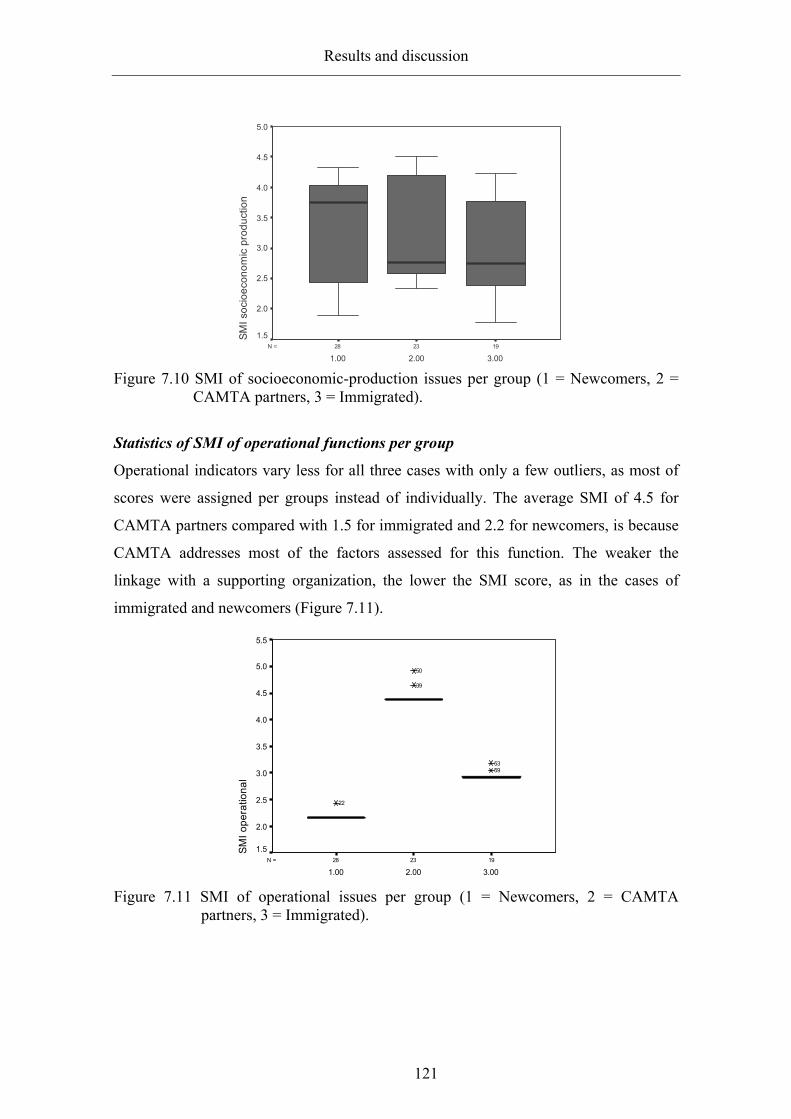
Results and discussion
121
192328N =
3.002.001.00
SMI s
ocio
econ
omic
pro
duct
ion
5.0
4.5
4.0
3.5
3.0
2.5
2.0
1.5
Figure 7.10 SMI of socioeconomic-production issues per group (1 = Newcomers, 2 =
CAMTA partners, 3 = Immigrated).
Statistics of SMI of operational functions per group
Operational indicators vary less for all three cases with only a few outliers, as most of
scores were assigned per groups instead of individually. The average SMI of 4.5 for
CAMTA partners compared with 1.5 for immigrated and 2.2 for newcomers, is because
CAMTA addresses most of the factors assessed for this function. The weaker the
linkage with a supporting organization, the lower the SMI score, as in the cases of
immigrated and newcomers (Figure 7.11).
192328N =
3.002.001.00
SMI o
pera
tiona
l
5.5
5.0
4.5
4.0
3.5
3.0
2.5
2.0
1.5
5953
39
50
22
Figure 7.11 SMI of operational issues per group (1 = Newcomers, 2 = CAMTA
partners, 3 = Immigrated).

Results and discussion
122
SMI analysis of variance: per functions against groups
One-way ANOVA was used to test the quantitative differences in the SMI described
above: considering the whole system performance (cumulative) and per function,
splitting in into ecological, productive (biophysical and socioeconomic), and
operational.
Test of homogeneity of variances
Since ANOVA assumes that samples have equal standard deviations or variances, it is
pertinent verifying the data homogeneity; Levene’s test was applied for this verification.
The values rejecting the null hypothesis in all cases have equal variances (P < 0.05)
means that the variances in the different groups are different. Therefore, the ANOVA
procedure is applicable (Table 7.33).
Table 7.33 Test of homogeneity of variances of SMI cumulative and per function
SMI Levene Statistic df1 df2 Sig. SMI cum .749 2 67 .477 (*) SMI eco 1.146 2 67 .324 (*) SMI bio .088 2 67 .916 (*) SMI soc .970 2 67 .384 (*) SMI ope 2.472 2 67 .092 (*)
(*) Sig. P<0.05 SMI cum (Sustainable Management Index cumulative), SMI eco (Sustainable Management Index of ecological functions), SMI bio (Sustainable Management Index of biophysical production functions), SMI soc (Sustainable Management Index of socioeconomic production functions), SMI ope (Sustainable Management Index of operational functions)
Analysis of Variance
Only the means of the cumulative sustainable management index (SMI cum), the index
of biophysical production functions (SMI bio), and the index of operational functions
(SMI ope) in three groups evaluated (newcomers, CAMTA partners and immigrated)
are statistically different at 95% significance. The index of ecological functions (SMI
eco) and the index of the socioeconomic production functions (SMI soc), although
arithmetically different, are similar statistically (Table 7.34).

Results and discussion
123
Table 7.34 Analysis of variance SMI cumulative and per function SMI Sum of
squares df Mean
square F Sig.
SMI cum Between groups 1.322 2 .661 7.047 .002 (*) Within groups 6.286 67 .094
Total 7.608 69 SMI eco Between groups 1.087 2 .543 1.624 .205 Within groups 22.412 67 .335 Total 23.499 69 SMI bio Between groups .732 2 .366 3.477 .037 (*) Within groups 7.052 67 .105 Total 7.784 69 SMI soc Between groups 1.138 2 .569 .823 .444 Within groups 46.325 67 .691 Total 47.463 69 SMI ope Between groups 64.124 2 32.062 4408.431 .000 (*) (#) Within groups .487 67 .007 Total 64.612 69
(*) Sig. P<0.05 (#) As was noted above, ‘SMI ope’ F value is very high and the differences evident; thus, the value was removed from further analysis. SMI cum (Sustainable Management Index cumulative), SMI eco (Sustainable Management Index of ecological functions), SMI bio (Sustainable Management Index of biophysical production functions), SMI soc (Sustainable Management Index of socioeconomic production functions), SMI ope (Sustainable Management Index of operational functions).
Post hoc analysis
Once the differences among means were determined, in a post hoc analysis the degree
of the difference among groups was calculated through pair-wise multiple comparisons
(P<0.05).
The LSD multiple comparison test was applied to SMI and SMI bio; SMI ope
was excluded for the reasons given above.
For cumulative SMI, the three comparison tests gave similar results. At 95%
interval of confidence CAMTA partners produce better SMI than newcomers and
immigrated, the latter two performing statistically equally. All other possible
comparisons are not significant at 0.05 (Table 7.35).

Results and discussion
124
Table 7.35 Multiple comparison tests of SMI cumulative functions per group
(*) Sig. P<0.05 SMI (Sustainable Management Index)
In the case of SMI bio, the results are significant under the LSD multiple
comparison test. The obtained differences show that CAMTA partners have higher SMI
bio than newcomers. Immigrated also perform better than newcomers, but there is no
difference between CAMTA partners and immigrated at 0.05 of significance (Table
7.36).
Table 7.36 Multiple comparison tests of SMI biophysical production functions per groups
(*) Sig. P<0.05 SMI bio (Sustainable Management Index of biophysical production functions).
7.2.2 Clusters analysis
Unlike in the ANOVA, in a cluster analysis it is possible to include the whole data set
and to observe the matching where clusters are formed. These clusters were developed
under two criteria: (1) per groups, CAMTA partners, immigrated and newcomers; and
(2) per function: SMI eco, SMI bio, SMI soc and SMI ope.
Dependent variable
Comparison test
(I)
(J)
Mean difference
(I-J)
Std. error
Sig. 95% Confidence interval
Lower bound
Upper bound
SMI cum LSD Newcomers CAMTA p. -.30791 (*) .08620 .001 -.4800 -.1359 Immigrated -.04382 .09104 .632 -.2255 .1379 CAMTA p. Newcomers .30791 (*) .08620 .001 .1359 .4800 Immigrated .26409 (*) .09496 .007 .0746 .4536 Immigrated Newcomers .04382 .09104 .632 -.1379 .2255 CAMTA p. -.26409 (*) .09496 .007 -.4536 -.0746
Dependent variable
Comparison test
(I)
(J)
Mean difference
(I-J)
Std. error
Sig. 95% Confidence interval
Lower bound
Upper bound
SMI bio LSD Newcomers CAMTA p. -.21329 (*) .09130 .022 -.3955 -.0311 Immigrated -.20284 (*) .09643 .039 -.3953 -.0104 CAMTA p. Newcomers .21329 (*) .09130 .022 .0311 .3955 Immigrated .01045 .10058 .918 -.1903 .2112 Immigrated Newcomers .20284 (*) .09643 .039 .0104 .3953 CAMTA p. -.01045 .10058 .918 -.2112 .1903

Results and discussion
125
Cluster analysis per group
Since the intention is to depict as well as possible the component clusters, the Ward’s
algorithm was the clustering method of choice, and the distances were measured using
the Squared Euclidean Distance. In this case, cluster analysis performs as a
confirmatory procedure, applied to the groups defined in advance, and the results
validate the accurateness of their grouping. Figure 7.12 shows the correspondence
between the dendrogram of cluster analysis and the predefined sampling groups (pies);
the first group is mainly composed of newcomers, the second of immigrated, and the
third of CAMTA partners.
Since cluster analysis only depicts the most similar groups, it is not able to
detail the influential factors, which were therefore dealt with using factor analysis.
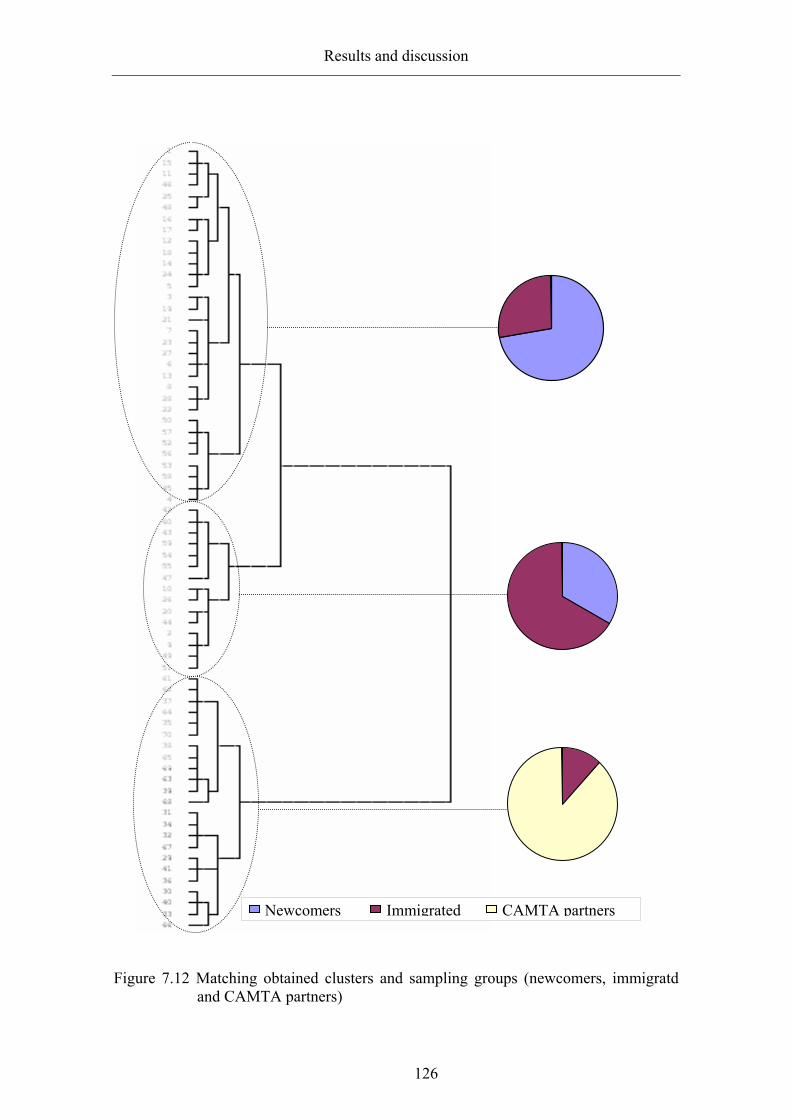
Results and discussion
126
Figure 7.12 Matching obtained clusters and sampling groups (newcomers, immigratd
and CAMTA partners)
Newcomers Immigrated CAMTA partners
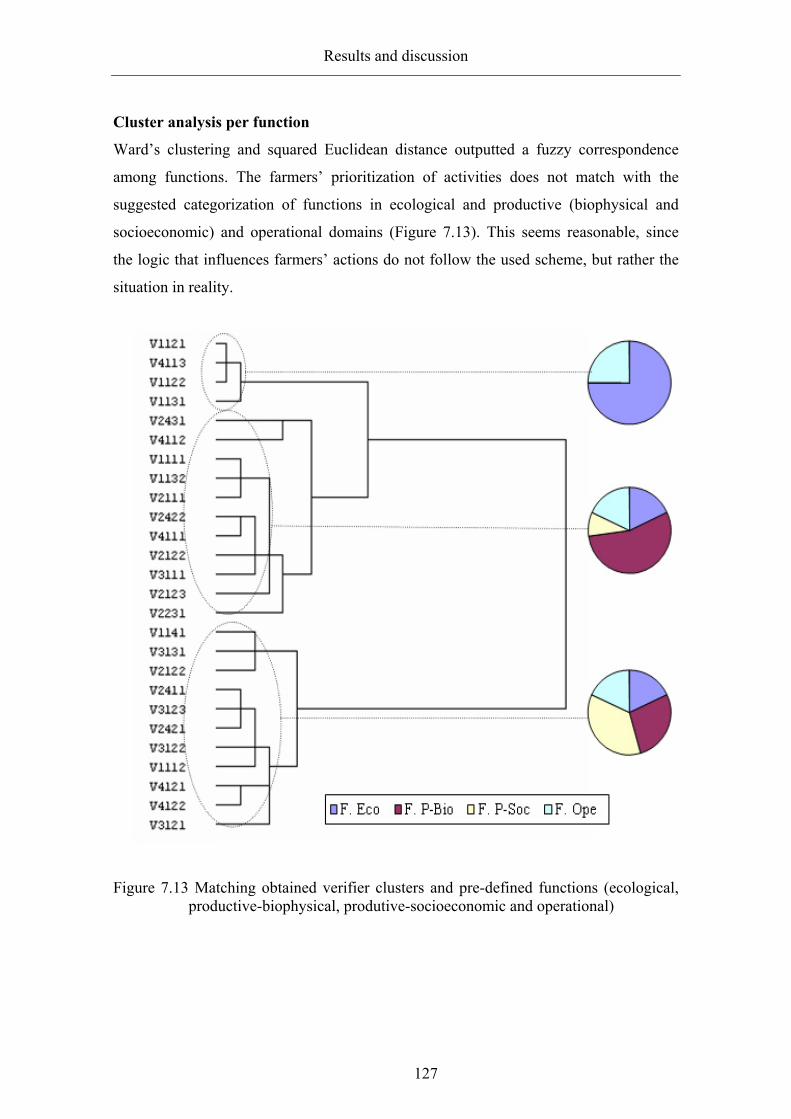
Results and discussion
127
Cluster analysis per function
Ward’s clustering and squared Euclidean distance outputted a fuzzy correspondence
among functions. The farmers’ prioritization of activities does not match with the
suggested categorization of functions in ecological and productive (biophysical and
socioeconomic) and operational domains (Figure 7.13). This seems reasonable, since
the logic that influences farmers’ actions do not follow the used scheme, but rather the
situation in reality.
Figure 7.13 Matching obtained verifier clusters and pre-defined functions (ecological,
productive-biophysical, produtive-socioeconomic and operational)

Results and discussion
128
7.2.3 Factor analysis
It is assumed that from the full array of evaluated components, a reduced number of
them exert stronger influence on the system performance (see section 6.2.1). Through
factor analysis these components can be detected and grouped.
The Principal Component Analysis (PCA) extraction method was applied, and
the number of factors was limited to four (with eigenvalues higher than one); the
rotation method used was varimax with Kaiser Normalization.
Correlation and reliability of the data
The Kaiser-Meyer-Olkin measure of sampling adequacy tests whether the partial
correlations among components are reliable. Values between 0.5-0.7 are considered
acceptable for experiments that involve social factors. In the present analysis the value
is 0.648.
The Bartlett test of sphericity evaluates whether the matrix is an identity
matrix, in which case a full correlation (100%) is expected. In our case it is significant
at 95%, which rejects such a possibility (Table 7.37).
Table 7.37 Kaiser-Meyer-Olkin and Bartlett tests KMO Measure of sampling adequacy. .648
Bartlett's test of sphericity Approx. chi-square 88.949 df 45 Sig. .000
Sig. P<0.05
Commonalities, variance per variable (verifiers)
The factor analysis attempts to reduce the number of components without losing
representativeness, and the results show the degree of the common variance retained by
each of the components after their extraction (Table 7.38).

Results and discussion
129
Table 7.38 Communalities of factors after extraction Code Verifier Initial Extraction V1121 Biodiversity indicator in woody species 1.000 .551 V1122 Biodiversity indicator in non woody sp. 1.000 .674 V1131 Biomass of woody species 1.000 .675 V2231 Monocultures vs. polycultures 1.000 .500 V2111 Introduction exotic species 1.000 .588 V2422 Low impact techniques 1.000 .638 V2421 Farmers technical background 1.000 .688 V2431 Administration plan change 1.000 .668 V3121 System considered profitable 1.000 .649 V4122 By-products provider 1.000 .560
From the 32 verifiers originally proposed, only 10 remained, with a high
proportion of retained variance after extraction. The lowest among them is ‘biodiversity
in woody species’ with about 55% of the original variance, and the highest ‘farmer’s
technical background’ with almost 69%. Values above 50% may be considered
indicators of a good representativeness, therefore the extracted components represent
the variables well.
Total variance in the whole set
The full set data variance is analyzed in three stages, giving initial, extracted and rotated
eigenvalues (Table 7.39).
Table 7.39 Total Variance Explained Variable Initial eigenvalues Extraction sums of squared
loadings Rotation sums of squared
loadings Total Variance
% Cumulat
% Total Variance
% Cumula
t % Total Variance
% Cumulat
% 1 2.412 24.117 24.117 2.412 24.117 24.117 1.711 17.111 17.111 2 1.591 15.907 40.024 1.591 15.907 40.024 1.568 15.682 32.794 3 1.194 11.937 51.961 1.194 11.937 51.961 1.557 15.568 48.362 4 .993 9.934 61.894 .993 9.934 61.894 1.353 13.532 61.894 5 .878 8.784 70.679 6 .699 6.988 77.666 7 .659 6.594 84.261 8 .595 5.947 90.208 9 .580 5.797 96.005
10 .400 3.995 100.000

Results and discussion
130
The first three variables with eigenvalues higher than 1 (minimum) constitute 48% of
the sample variation. When the fourth one is included, cumulative variance reaches
almost 62%. This means that four factors can explain almost 62% of the variability of
the original 10 variables, with a loss of only 38% of the information.
Figure 7.14 depicts the number of factors to be extracted by intersecting the
component number with the eigenvalues higher than one: the concavity of the curve
makes it difficult to decide whether to select three or four variables.
Figure 7.14 Scree plot crosscutting the number of defined factors vs. their respective
eigenvalues
Rotated factors
The final step of the factor analysis is the identification of groups of variables and their
interpretation in coherence with their eigenvalues and intrinsic linkages. Four factors
can be distinguished, each constituting a number of mutually interrelated variables
(verifiers).

Results and discussion
131
Table 7.40 Rotated component matrix Code Variable Component
1 2 3 4 V2422 Low impact techniques .653 V1121 Biodiversity indicator in woody sp. -.635 V2431 Administration plan change .633 V2111 Introduction exotic species .574 V1131 Biomass of woody species .815 V2231 Monocultures vs. polycultures .614 V4122 By-products provider -.729 V2421 Farmers technical background .722 V3121 System considered profitable -.724 V1122 Biodiversity indicator in non woody sp .674
Factors interpretation
Each of the four detected factors is interpreted according to the characteristics of the
component verifiers (see section 7.1.5) and their attributes as a whole:
Factor 1 The productive domain: ‘Farmers’ technical decisions are conservationist-
oriented and feedback is based on environmental, social and political changes’ is
emphasized.
- V2422 ‘Farmers use low-impact techniques to maintain yields and the resources
stock’. Farmers have developed an expertise that allows them to carry out their
production activities under ecological paradigms that prioritize the sustainability of
production processes.
- V2431 ‘Technical management plan changed in the last 5 years to adapt to
environmental-political-social changes’. Farmers consider their situation and react
to it (resilience, adaptation), which allows them to keep their systems working.
- V2111 ‘Farmers are attentive to the introduction of exotic species’. This refers to the
knowledge of the farmer about the risks of introducing new species into a controlled
frame, and the possible consequences, i.e., dissemination of pests, diseases, invasive
species, and genetic pollution.
- V1131 ‘Richness and equity of woody species’. Trees, palms and shrubs are
indispensable components of agroforestry systems, and their high diversity implies a
more intense components interaction and therefore a greater ecological stability of
the system.

Results and discussion
132
Production activities are carried out within a conservationist framework. Functional
biodiversity maintenance and enhancement are positively affected by the selection of
technical activities. Gray capital is essential; the knowledge for discriminating
technologies, techniques and practices counts; moreover, these decisions have to
feedback constantly; farmers, in order to optimize their results have to observe the
political, environmental and social surroundings, perceiving changes in them and
adjusting their action in order to maintain the standards that have gotten. Individual,
collective, and institutional memories are the basis for it.
The key issues related to Factor 1 were summarized, and recommendations
given concerning what the farmer should understand and do in order to optimize its
performance (Table 7.41).
Table 7.41 Key issues factor 1 Key topic Biophysical productive Key words ‘know how’ and ‘feedback’ Indicator Indices of richness and equity of woody species Conceptual suggestion To know more about ecological cycles and conservationist
procedures To be attentive to the changes in circumstances and react to them, do not be static
Technical recommendation To build capacities on technical issues
Factor 2 The ecological domain: ‘Agroforestry systems biomass and biodiversity
increase, in particular of woody species’ is emphasized.
- V1131 ‘Biomass of woody species’. Maintaining their capacity as producers of
biomass is a direct indicator of the efficiency of the biological processes in any
ecological system.
- V2231 ‘Proportion of monocultures (annuals) vs. policultures (perennials)’. A larger
number of functional groups mean a more intense interaction and therefore higher
ecological stability, i.e., the selection and specific arrangement of components aims
at inciting interactions for the subsequent increase in outputs (production).
There is extensive documentation that shows the following relationships: first,
the more biomass, the more interactions, and second the larger diversity, the more

Results and discussion
133
interactions. And therefore, the more interactions within a system, the more efficient it
is. Functional biodiversity aims to make the system more efficient, addressing its
production and conservation roles.
The Factor 2 narrows the attention to concrete ecological (non-productive)
matters, such as taking care of the ecological index, generating more biomass and
promoting interactions within a system to obtain more outputs.
The key issues related to Factor 2 were summarized, and recommendations
given concerning what the farmer should understand and do in order to optimize its
performance (Table 7.42).
Table 7.42 Key issues factor 2 Key topic Ecological Key words ‘how much biomass’, ‘how many woody species’ Indicator Amount of biomass, number of woody sp (per plot) Conceptual recommendation Increase the biomass in the plot. Interactions will increase,
production will increase and biodiversity will increase. Technical recommendation General: Enrich, diversify plot composition.
Specific: Allow and enhance woody species presence; increase the component that lacks: woody and non-woody.
Factor 3 The productive domain: ‘Farmers care about their technical capacities;
improving and promoting useful species diversity’ is emphasized.
- V4122 ‘Number of by-product-provider species’. The presence in agroforestry plots
of non-targeted species, which will outcome products with none, limited or
periodical commercial value, indicates the farmer’s priority with regard to satisfying
supplementary household demands.
- V2421 ‘Farmers have enough technical background about the system design and
management’. Farmers’ try to improve their technical capacity to produce more and
to produce well, based on conventional agricultural standards.
The farmer’s technical talents are focused, on the one hand, on technical
knowledge without any particular topic of interest, and on the other hand, addressed to a
specific decision, e.g., the diversification of the plot with useful species. Unlike Factor
2, where the ecological value was highlighted, in this case the attention centers on

Results and discussion
134
productive diversity, which involves the farmers’ technical ability to include species
providing by-products at the same time strengthening the system’s ecological stability.
The key issues related to Factor 3 were summarized, and recommendations
given concerning what the farmer should understand and do in order to optimize its
performance (Table 7.43).
Table 7.43 Key issues factor 3 Key topic Biophysical productive Key words ‘how much the farmer knows’, ‘how deep is the farmer’s
knowledge’ Indicator General: the day-by-day technical decisions
Specific: how many non-marketed species exist (per plot) Conceptual suggestion Learn more, know more, study more, train more Technical suggestion General: apply what has the farmer learnt
Specific: include in the plot local species of various uses
Factor 4: The operational domain: ‘Farmers pursue the profitability of the system
and encourage the low-strata species diversity’ is emphasized.
- V3121 ‘The system is considered economically feasible’. Profitability assurance
refers to another level of sustainability, where the farmers have a financial incentive
through getting closer to market mechanisms. Households that are profitable and
involved in a market scheme are ready to become environmental services providers.
- V1122 ‘Richness and equity in non-woody species’. Non-woody species even when
not the main crop species are still important components in ecological processes.
Despite this, farmers frequently try to eliminate them as they regard them as weeds.
Once any agricultural process ends, post-harvest activities begin. In order to
optimize the revenues, the activities, such as conservation, transformation, storage,
packaging, marketing, and distribution, require particular management skills and certain
levels of organization. A cumulative indicator of whether these actions are carried out
properly is the profitability of the system.

Results and discussion
135
The key issues related to Factor 4 were summarized, and recommendations given
concerning what the farmer should understand and do in order to optimize its
performance (Table 7.44).
Table 7.44 Key issues factor 4 Key topic Socioeconomic productive Key words ‘how much he knows’, ‘how well he knows’ (of post-
production) Indicator General: post-harvest technical decisions (many)
Specific: earning standards Conceptual suggestion Learn more, know more, study more, build more capacities Technical suggestion General: apply what has been learnt
Specific: organize better, add value to the product
General discussion
136
8 GENERAL DISCUSSION Conceptual and operational accomplishments and prospective research
The general discussion is organized in three sections. First, at the operative level, the
most relevant issues of the proposed protocol for functional biodiversity evaluation are
examined. Second, at the conceptual level, the findings that support the hypotheses in
relation to the functional biodiversity approach are detailed. Third, some
recommendations for further research are given.
8.1 Operational issues: protocol of functional biodiversity evaluation
Building a data administration tool based on functionality principles and with the aim of
understanding and optimizing system performance, demanded a series of intermediate
steps and inherent tradeoffs. The most relevant of these are summarized and discussed
below.
8.1.1 Definition of boundaries
Along the development of this research, it became clear that the conceptual definition of
principles, that should be wide enough to cover most influential issues and restricted
enough to be precise (Prabhu 1999, Mendoza et al. 1999, Prasad 2002). Thus,
ecological, productive (subdivided into biophysical and socioeconomic) and operational
groups of analysis were defined, based on their importance for the agroforestry
paradigm: prioritization of a production style which focuses on productive diversity,
environmental sustainability, economic profitability, social equity, and cultural diversity
(Callo-Concha 2003).
The definition of these groups of analysis was contrasted with the scale of
application of the protocol, seeking for an optimal fitting between the groups and their
spatial and temporal frame of application (Stork et al. 1997). In the case of production-
related functions, the indicators were mainly obtained at plot level, while ecological-
related functions were collected at regional level and operational-related functions at
landscape level. This stratification allowed both, a more versatile target-oriented data
collection, and later on, when the main influential factors were identified, a more
accurate determination of action pathways to influence functional biodiversity.

General discussion
137
Nonetheless, the intrinsic overlapping of processes was kept in mind along the
development of criteria, indicators and verifiers.
As a byproduct of this boundary definition, a conceptual model was obtained,
which framed the study within eight key criteria: (1) maintenance and enhancement of
natural processes, (2) application of sustainable plot management techniques, (3)
maintenance of the plot input-output stability, (4) minimization of the impact on
neighboring systems, (5) sustainable production and use of generated byproducts, (6)
adaptation of plot management decisions to higher-scale demands, (7) farmer rationality
and his/her decision making about production, and (8) existence of a mind-map about
the land-use system management and post-harvest use of agricultural products.
8.1.2 Establishing hierarchies and participative methods
A core matter in multicriteria analysis (MCA) is the construction of a set of C&I
(criteria and indicators) to characterize the studied systems. Although their number is
indeterminate, it is assumed that the more components dealt with, the better explained a
referred issue (Dogson et al. n/d). Concerning their focus, in this study there is an
evident bias towards biophysical productive issues, which fits with the aim of the
research: to portray the indicators that better represent the land-use system qualities
regarding biodiversity encouragement and conservation, and at the same time
generating profit through productive practices.
In the vertical arrangement of the C&I tree, top-down and bottom-up
approaches have been combined, and in their fine tuning, participative methods, such as
workshops with stakeholders at various levels were stressed (Mendoza & Macoun 2002)
(Appendix 3).
All these steps were framed within a scheme that allows a continuous feedback
on the components argumentation, formulation, and corresponding gathering methods
(CIFOR 1999, Stork et al. 1997), which is essential when seeking for extrapolation
possibilities for the proposed protocol.
8.1.3 Sustainable management index
An indicator of the system performance is the sustainable management index (SMI),
which compiles all subordinate weighted components of the protocol into a single

General discussion
138
comparable value (Purnomo et al. 2000). As the SMI can be obtained at the highest
level (the overall system performance), it can be also disaggregated to represent partial
weights of specific issue or group of issues, e.g., operational, impact on neighboring
systems, etc.
The advantage of SMI is that makes possible to compare different
management options at various levels, from the most detailed, e.g., organic matter
content or living fences contribution to system performance, to the overall system
functioning wit respect to environmental services. Then is possible to rate systems,
regions, technological practices and every quality attributable to any system, and
compare the results.
In this study, SMI is used for comparison of the land-use management profiles
(Section 8.2.2).
8.1.4 Protocol feasibility concerns
Across this research, a series of issues concerning the feasibility of the protocol arose,
such as whether the C&I set includes all key indicators or not, and therefore the
obtained results might not be representative. We assume that the selected indicators are
not the only ones; neither is there a right set of indicators, nor is there a set large enough
to represent precisely functional biodiversity in agroforestry systems. The indicators are
selected according to their relevance, reliability, representativeness, inclusiveness,
specificity and collection feasibility (Prasad 2002), and to whether they fit with the
circumstances where the set is applied (Kneshaw et al. 2002).
Another issue is whether extrapolation of this research might contrast with the
limited spatial conditions where it has been developed, and whether this could lead to
bias. The municipality of Tomé-Açú with its characteristic agroforestry model is
recognized as an exceptional case in Amazonia (Jordan 1987, Anderson 1990), and was
chosen as a study site based on the high number of spatial and temporal arrangements,
which are indispensable conditions for calibration purposes. In addition, plots with
different degrees of technological assimilation were sampled (newcomers, immigrated
and CAMTA partners), and agroforestry systems in an early stage of development,
representative of conventional Amazonian farms.

General discussion
139
The adaptability of the proposed protocol was observed, while most of its phases, i.e.,
indicator definition and structuring, hierarchy establishing, and data processing and
integration, are flexible enough to be adapted and refined to fit the demands of any
tropical land-use system.
It might also be questioned that the approach is very input-demanding, since it
requires a large amount and different types of data from several sources, different
collection methods and extended time schedules. It is known that data standardization is
one of the strengths of MCA (Dogson et al. n/d, Mendoza & Macoun 2002), and we
have shown how MCA outputs are easily accepted by multivariate analysis (MVA)
therefore, the constraint reduces to logistic rather than methodological terms. However,
these arguments have to be contrasted with the beneficial trade-off of the approach, and
it is better to invest in a detailed approach and obtain wide-based and supportive data,
than to simplify and thus obtain a simplified view of the studied issue.
8.1.5 Data gathering constraints and software applied
The protocol application depends strongly on the participation of stakeholders at
different levels via questionnaires, interviews and workshops. Here some logistical
constraints were detected, such as the stakeholders’ slow understanding of the
multicriteria approach, which can lead to delayed or erroneous feedback. This was
experienced in face-to-face cases, e.g., questionnaires and interviews, and was solved
through the formulation of neutral and topic-oriented questions (Appendix 2), and
during the workshops, by applying step-by-step subroutines (Appendix 3). Thus,
participants received orientation for developing the most representative indicators.
Especially during workshop development, a monitoring by specialists is highly
recommended.
Another perceived issue was that stakeholders might loose sight of the driving
concepts, such as ‘functional biodiversity enhancement’ or ‘environmental services
provision’, and substitute them by their own personal/professional/academic interests.
In this case, the previous definition of the research framework and a continuous
monitoring along the stakeholders’ participation are advisable.
Finally, since the protocol demands wide and diverse categories of data,
different collection methods were used that keeping in mind the limited logistical
General discussion
140
capacities of developing countries, might limit its applicability. For that reason,
procedures for data collection and management, i.e., laboratory methods, equipment and
software were simplified as much as possible.
Concerning the software used, the CIMAT (Criteria and Indicators
Modification and Adaptation Tool) was used as the main MCA data manager, since our
approach (functional biodiversity) shares some principles with the sustainable forest
management approach, such as conservation, use and sustainable management (Loyn &
McAlpine 2001, Kneshaw et al. 2002) for which CIMAT was designed. Therefore, few
modifications were necessary. Nevertheless, the creation of a specific C&I template for
CIMAT might be useful, or even better, the modification of CIMAT itself to cover
agroforestry systems and functional biodiversity demands. Concerning MVA, the
conventional statistical software packages can be applied.
8.2 Conceptual issues: functional biodiversity accomplishments
The theoretical contribution of this research is based on the concept of functional
biodiversity, its better aptitudes for enhancing the sustainability of land-use systems,
and the considerations to take into account in its evaluation. These issues were
addressed through the elucidation of the proposed hypotheses, which are discussed on
the basis of the obtained results.
8.2.1 General hypothesis
The general hypothesis states that: ‘Agroforestry systems maintain functional
biodiversity at levels sufficient to keep the production sustainable and the
environmental processes stable’.
Factor analysis results affirm that the productive issues: ‘strong technical
qualification, preference of conservationist choices, adaptation to environmental, social
and political changes, and enhancement of useful species’ are the most important
characteristics that a land-use manager has to have in mind when optimizing farm
performance in terms of functional biodiversity provision.
However, an adequate technical background, preference for environmentally-
friendly practices and awareness of changes in the surroundings are not qualities
attributable to agroforestry practitioners only, but to any farmer with an updated training

General discussion
141
and access to contemporary sustainable production concepts (Altieri & Nicholls 2004),
with the exception of the ‘preference for useful species’, which demands specific
knowledge and training in agroforestry topics and understanding of the local
circumstances (Nair 1997, Huxley 1999).
Nonetheless, some of the issues to be attended, e.g., pest management or
changes in commercialization channels, can only be addressed through a broader insight
of the problem and a widening of the scope of its management. This adds a crucial
factor to be taken into account, i.e., the organization and centralized planning that is
decisive for the success of agroforestry, as a productive and environmentally friendly
alternative (section 8.2.2).
The ecological issues detailed as ‘the system’s capacity for accumulating
biomass and hosting a high diversity of components, in particular woody species’ were
determined as being the most significant ecological characteristics that reflect functional
biodiversity strength in agroforestry systems.
By definition, agroforestry plots include more than one species and at least one
woody species (Nair 1985, Young 1989); woody species, by nature, store more biomass
than herbaceous ones. In addition the agroforestry systems (AFS) management stress on
their dynamism and at the same time pays attention to multiple objectives
(Krishnamurthy & Avila 1999, ICRAF 2000). These two issues are considered the most
relevant qualities of AFS with respect to biodiversity conservation (Sánchez 1995,
Dobson et al. 1997, Leakey 1999, Bates 1999).
In this study, although a positive correlation between ecological indicators
exists, the statistical tests indicate that operational issues are the most influential. This
supports our approach, which advocates a most integrative treatment as possible of all
involved factors, instead of focusing on only a few. Ecological factors are nevertheless
important, and greater diversity of components and higher biomass storing capacity are
still basic conditions for biodiversity conservation. However within the functional
biodiversity approach proposed, the attention on factors has to be diversified and a
series of other domains incorporated.
The operational issue stresses that ‘(…) pursuing the system’s financial
profitability’ is a characteristic that any land-use manager must posses to optimize the
system’s overall performance regarding enhancement of functional biodiversity.
General discussion
142
Economic profitability has proved to be a condition for the sustainability of any change
induced in land-use systems (Leakey 1999), and is therefore pursued as a primary aim
of most technological proposals, including the agroforestry one (ICRAF 2000).
As in the case of productive issues, factor analysis affirmed that the scope of
influence surpasses the individual decision frame, demanding a wider and organized
insight and attending to linking procedures, such as post-harvest management,
organization for commercialization or the search for market niches. Here again the
organization and central planning emerge as the key aspects for optimizing agroforestry
system performance as functional biodiversity providers.
Summarizing, it is not possible to affirm whether agroforestry-related practices
keep functional biodiversity on levels adequate for keeping production processes stable
and ecological processes sustainable, but it is accurate to say that some agroforestry
system characteristics, such as biomass storing capacity and species diversity, are very
important. However, these must be supported by a strong and updated technical
qualification of the system manager, and a market-oriented focus.
8.2.2 Specific hypothesis 1
The specific hypothesis 1 states that: ‘The degree of functional biodiversity in
agroforestry systems depends on the level of technical management’.
The factor analysis results point out technical qualification as a decisive factor
for maintaining higher levels of functional biodiversity in agroforestry systems.
Complementarily, the ANOVA of SMI allows linking this issue with the most relevant
characteristics of the three evaluated farmer groups; it was found that ‘CAMTA
partners’ were statistically superior to ‘immigrated’ and ‘newcomers’ only concerning
cumulative and operational SMI’s, and equivalent to ‘immigrated’ about productive
biophysical functions.
The importance of operative and productive biophysical issues in system
performance was revealed, and the better functioning of ‘CAMTA partners’ identified.
This indicates the influence of the CAMTA in strengthening the capacities of
agroforestry systems as functional biodiversity providers.

General discussion
143
The mandates of the CAMTA involve productive and operational matters, through
gradual building-up of the technical capacities of the farmers and strengthening of their
self-organization. CAMTA activities focus principally on sustainable production via
promotion of conservational and eco-friendly cultivation methods, postproduction
intensification through adding value to raw products, and improvement of market
orientation by channeling the production process towards higher commercial standards
and by searching for new market niches.
The results of this study can serve as guidelines for land-use systems’
management optimization for functional biodiversity enhancement and environmental
services provision. This is currently the case of the Tomé-Açú agroforestry model,
where its advantages have been perceived, and are progressively spreading from the
Tomé-Açú municipality to neighboring regions, with a variable degree of assimilation
depending on the physical proximity and time of permanence of the settlers (Jordan
1987, Anderson 1990, Yamada 1999, Yamada & Holz 2002).
Summarizing, the results demonstrate that better system performance
concerning functional biodiversity enhancement and conservation are linked with good
technical qualification of the farmers, and can be optimized when complemented by
administrative talents within an efficient organizational framework.
8.2.3 Specific hypothesis 2
The specific hypothesis 2 states that: ‘A model derived from the criteria and indicators
approach should provide a better understanding of agroforestry systems efficiency to
maintain functional biodiversity’.
Prerequisites for a model are first, that it must be able to represent the state-of-
the-art of a given case study, and second, that it must be able to simulate and eventually
predict the progress of the targeted study issue in time.
MCA through a vertical and horizontal integration of components at various
levels, via procedures, such as weighting, ranking and linking, provides a
comprehensive view and facilitates the understanding of agroforestry systems in
supporting and intensifying functional biodiversity. This should fulfill the first
conceptual demand of a model: to replicate what is happening in reality.

General discussion
144
The statistical analysis of SMI allowed defining the hotspots where the characterized
groups (CAMTA partners, immigrated and newcomers) differ. In a second phase, MVA
through principal component analysis narrows the participant components into a
reduced number of factors, well characterized and in consequence, susceptible to
influence. With this second step, an operational value is attached to the model, detecting
the most sensitive factors of an agroforestry system with regard to enhancement and
maintenance of functional biodiversity.
Nonetheless, this model is not iterative. Though it is able to depict a targeted
land-use system from multiple perspectives, establish connections among components,
and extract the most cost-effective ones on which to exert influence, it does not show
how components interact with each other, or predict the consequences of modifying a
component. This limitation and some others concerning the protocol itself need to be
attended to, thus, the following section provides some recommendations about.
8.3 Prospective issues and further research
Besides the conceptual contribution to functional biodiversity, this research is driven by
a pragmatic leitmotif: the development of a protocol for evaluation of functional
biodiversity in tropical agroforestry systems, and eventually its extension to a protocol
for evaluation of environmental services in tropical land-use systems.
The intrinsic flexibility of the protocol, an evaluation framework rather than a
fixed set of rules, which can be modified at almost every stage of analysis through fine
tuning and eventually widening components definition and related collection methods,
should permit coping with main environmental services, i.e., carbon stocks, watershed
functions and landscape beauty assessments with characteristics different to the ones
that affect biodiversity.
Bearing this in mind and assuming that the obtained results are reliable as an
initial platform, it is recommended:
- To convert some of the evaluated plots into permanent ones, where measurements
are taken periodically and continuously. This would provide a behavior trend of the
selected indicators, confirming the accuracy and stability of the C&I set and
suggesting changes for establishing a monitoring protocol.

General discussion
145
- To test the protocol in distant but similar sites, considering conceptual matters such
as indicator definition, calibration, consolidation and analysis, and logistical
matters such as data collection and integration. The use of case studies would
validate the indicators and procedures applied, and highlight the weak ones. The
flexibility of the protocol to adapt to new circumstances will be also tested.
- To standardize the data management procedure, since the number and type of
assessable indicators is variable. The inputting procedure is well defined by
CIMAT, and it would be useful to establish standard guidelines for data handling.
- To build a C&I set template for CIMAT, modify CIMAT to operate with functional
biodiversity or create a similar data administration tool. The C&I approach operates
more efficiently within pre-established templates for specific purposes and
ecological conditions, which assist the user in obtaining better and quicker
depictions of the studied systems. This also would facilitate its diffusion.
Additionally, such an administration tool would also set up the basis for its
upgrading into a template for environmental services evaluation in land-use
systems.
- Finally, although most relevant factors were considered, the interactive influences
among components were not determined. In other words, we know which the most
relevant factors are but we do not know how they interact. A complementary phase
compatible with MCA and MVA outputs might answer this question. Two
alternatives are foreseen: a model of sensitivity, e.g., the Sensitivitätsmodell
Vester ®, or a bioeconomic model, e.g., SEAMLESS.
Conclussions and Outputs
146
9 CONCLUSIONS AND OUTPUTS
9.1 Conclusions
9.1.1 General conclusion
The general objective was: ‘To assess the factors that influence the processes that
determine the capabilities of agroforestry systems to maintain functional biodiversity
(case study: municipality of Tomé-Açú, Pará state, northern Brazil), underlining the
management as a key factor to improve the systems towards making them more
productive and sustainable’.
The results of this study show that the most influential factors are ecological,
productive and operational issues.
The first factor stresses the system’s species diversity (particularly woody
species) and capacity for accumulating biomass as the main characteristics for
conserving and enhancing functional biodiversity. Therefore, farmers should be aware
of the status of these components and decide proactively to promote them on their
farms.
The second factor affirms that a farmer’s technical and management capacities
determine his/her ability to conserve and encourage functional biodiversity. It means
that the farmer should have a strong technical background, show preference for low
impact techniques, have an administration plan, aim at diversifying species
composition, prevent the introduction of exotic species, and be attentive to the
monoculture-polyculture balance in the plot.
The third factor emphasizes the role of the farmer’s internal organization and
the capacity to bond with external institutions. Thus, a successful farmer should care
about environmental-socio-political adaptation, and pay attention to market-related
matters such as postharvest, marketing, and information feedback.
9.1.2 Conclusion specific objective 1
The specific objective 1 stated: ‘To develop a protocol for evaluating functional
biodiversity in agroforestry systems …’.
Based on Multicriteria Analysis (MCA), a protocol for the evaluation of
functional biodiversity was developed. This protocol involves a wide array of data of

Conclussions and Outputs
147
different types determined with the participation of a diverse group of stakeholders.
This makes the protocol management highly demanding, but it is able to take various
factors into consideration. The proposed protocol demands the definition of a Criteria
and Indicator (C&I) set, which through a number of indicators, determines the
performance of the agroforestry systems. The protocol can output numeric indices
related to the performance of each system (sustainable management index) by types of
issues, groups of farmers, and as a whole, such an index can be used for ranking, rating,
comparing and monitoring land-use systems, and as a proxy for evaluating functional
biodiversity.
9.1.3 Conclusion specific objective 2
The specific objective 2 stated: ‘To define a management optimization model of
agroforestry systems for enhancing and maintaining functional biodiversity …’.
Through Multivariate Analysis (MVA) the most sensitive/important factors
were detected, i.e., those with greater influence in optimizing agroforestry system
performance related to functional biodiversity. Once these influential factors are
identified, it is possible to group them, thus deriving general and pragmatic
management recommendations for optimizing the performance of the whole system.
Nevertheless, neither MVA nor the designed protocol as a whole, allow us to
depict the inner cybernetics of the system, which is an essential issue, because only by
determining the flows and effects of factor interaction is it possible to set new action
pathways and to predict the behavior of the systems by means of simulation, and thus to
define an optimization model.
9.2 Expected outputs
9.2.1 Output 1: protocol of evaluation
The Output 1 is: ‘A protocol to characterize, evaluate, analyze, rate, weigh and
interpret functional biodiversity in agroforestry systems, able to extrapolate to similar
conditions’.
The proposed protocol for evaluation of functional biodiversity includes a
series of complementary steps to operationalize MCA, permitting the administration of
the database through a series of user-friendly routines.
Conclussions and Outputs
148
The extrapolation feasibility of the protocol is quite high, since there are no restrictions
for data collection or for their analysis. Each data gathering method can be applied, and
data procedures were designed bearing in mind ease of use. The Criteria and Indicators
Modification and Adaptation Tool (CIMAT) software permits creating, changing,
routing and standardizing different types of inputs at all levels; feedback procedures
(workshops and consultancy) can be carried out in any situation.
All mentioned procedures were tested and outputted satisfactory results.
However, monitoring and validation (new trials) are recommended when the protocol is
applied at new sites.
9.2.2 Output 2: criteria and indicators set
The Output 2 is: ‘A Criteria and Indicators (C&I) set for functional biodiversity
assessment in tropical agroforestry systems: clustered, hierarchized, and interrelated;
developed ad hoc but eventually able to extrapolate to similar conditions with some
arrangements’.
A C&I set for evaluating functional biodiversity in tropical agroforestry
systems was developed. The complete set of indicators consists of 3 functions
(ecological, productive -biophysical and –socioeconomic, and operational) at the
highest-conceptual level, 7 criteria, 18 indicators and 32 verifiers at the lowest farm-
application level. Such a C&I set was a template for the studied region, therefore when
extrapolation is considered, it must be modified.
9.2.3 Output 3: optimization model
The Output 3 is: ‘A dynamic model of the systems’ functioning, defining topics of
action, support and prediction, and eventually performing as a political negotiation
argument in an environmental services payment framework’.
As stated above (section 9.1.3), the proposed protocol lacks complete insight
on the systems’ internal dynamics, and therefore cannot respond to demands of
simulation and prediction. Nevertheless, it has been considered to link it with a
sensitivity or a bioeconomic model to satisfy such a demand.
On the other hand, we have obtained a static procedure that can highlight the
issues with the strongest influence on functional biodiversity. The main advantage of

Conclussions and Outputs
149
the model is that it can support decision making, as it can detect higher-ranked and
more rewarding indicators, thus enhancing indirectly system performance. When
repeatedly applied, it could serve as a monitoring tool and consequently support
negotiation schemes and rewards for environmental services payment whenever the
program paradigms agree with the MCA premises, as in the case of the Brazilian
program Proambiente.

References
150
10 REFERENCES
Abdi H (2003) Multivariate Analysis. Encyclopedia of Social Sciences Research Methods. In: Lewis-Beck M, Bryman A and Futing T (eds). California, US
Acharya B (1999) Forest biodiversity assessment; A spatial analysis of tree species diversity in Nepal. International Institute for Aerospace Survey and Earth Sciences ITC Enschede, the Netherlands
Albuquerque M & Dirven M and Vogelgesang F (2000) The Impact of the New Economic Model on Latin America's Agriculture. World Development 28(9):1673-1688
Alternative to Slash and Burn (ASB) (2007) http://www.asb.cgiar.org/
Altieri M and Nicholls C (1999) Ecosystem function and insect pest management in agricultural systems. In: Collins WW and Qualset CO (eds), Biodiversity in Agroecosystems. CRC Press, Boca Raton, US.
Altieri M (n/d) Agroecology: principles and strategies for designing sustainable farming systems. Agroecology in Action Project. http://cnr.berkeley.edu/~agroeco3/principles_and_strategies.html
Altieri MA and CI Nicholls (2004) Biodiversity and Pest Management in Agroecosystems, 2nd Ed. The Harworth Press Inc. New York, USA. 275 pp
Alvarado V, Antón E, Harvey C and Martínez R (2001) Aves y plantas leñosas en cortinas rompevientos en León, Nicaragua. Agroforestería en las Américas 8(31):18-22
Ammann K (2004) The impact of agricultural biotechnology on biodiversity, a review. Report Botanic Garden, University of Bern. Bern, Switzerland
Anderson, A (1990) Alternatives to Deforestation, Steps toward Sustainable Use of the Amazon Rain Forest. Columbia University Press. New York, USA
Apache Software Foundation (2003) Statistical Package for the Social Sciences (SPSS) v.12.0.1
Arnold JE and Dewees PE (1999) Trees in managed landscapes: factors in farmer decision making. In: Agroforestry in Sustainable Agri. Systems. James P, Lassoie LB and Fernandes ECM (eds). CRS Press, Lewis Publisher. Florida, USA
Ashton PS (2000) Ecological Theory of Diversity and its application to Mixed Species Plantation Systems. In: Ashton AS and Montagnini F (eds). The Silvicultural Basis for Agroforestry Systems. CRS Press, Florida, USA
Atta-Krah K, Kindt R, Skilton JN and Amaral W (2004) Managing Biological and Genetic Diversity in Tropical Agroforestry. In: Nair PKR, Rao MR, and Buck LE (eds) New Vistas in Agroforestry. A Compendium for the 1st World Congress of Agroforestry, Kluwer Academic Publishers, Dordrecht, the Netherlands

References
151
Bates DM (1999) Ethnobotanical Perspectives of Agroforestry. In: James P, Lassoie LB and Fernandes ECM (eds). Agroforestry in Sustainable Agricultural Systems. CRS Press, Lewis Publisher. Bocaraton, Florida, USA
Boumans RMJ, Costanza R, Farley J, Wilson MA, Rotmans J, Villa F, Portela R, and Grasso M (2002) Modeling the dynamics of the integrated earth system and the value of global ecosystem services using the GUMBO model. Ecological Economics 41.3: 529-560
Boyd J and S Banzhaf (2006) What are Ecosystem Services? The Need for Standardized Environmental Accounting Units. RFF Discussion Papers. Resources for the Future. Washington DC, USA. 25 p
Brookfield H, Padoch C, Parsons H, and Stocking M (2002) Cultivating Biodiversity: Understanding, Analysing and Using Agricultural Diversity. ITDG Press, in association with the United Nations University. London, UK. 292 p
Brown S (1977) Estimating biomass and biomass change in tropical forest. FAO Forestry Paper. Food and Agriculture Organization of the United Nations. Rome, Italy. 55 p
Brown TC, Bergstrom JC and Loomis JB (2006) Ecosystem Goods and Services: Definition, Valuation and Provision. United States Department of Agriculture (USDA). Rocky Mountains, USA. 48 p
Budowski G and R Russo (1993) Live fence posts in Costa Rica: a compilation of the farmer's beliefs and technologies. Journal of Sustainable Agriculture 3.2: 65-87
Callo-Concha D (2002) Biocolonialismo, una aproximación. Centro de Investigaciones Económicas, Sociales y Tecnológicas de la Agroindustria y la Agricultura Mundial and Universidad Autónoma Chapingo. Chapingo, Mexico. 45 p
Callo-Concha D (2003) Servicios Ambientales por Sistemas Agroforestales. In: Ayala SC, Pérez NJ and Mejía JM (eds). Proceedings VI Congreso Nacional Agronómico. Por una Revaloración del Campo Mexicano. Universidad Autónoma Chapingo, Departamento de Fitotecnia. Chapingo, México
CBD Convention on Biological Diversity (2007) UNEP. http://www.cbd.int/
Chadwick DH (1993) Seekings Meanings. http://www.defenders.org/bio-bi02.html
Chapin FS, Zavaleta E, Eviner TE, Naylor RL, Vitousek PM, Reynolds HL, Hooper DU, Lavorel S, Sala O, Hobbie SE, Mack M and Diaz S (2000) Consequences of changing biodiversity. Nature 405: 234-242
Chaves G and Lobo S (2000) El Pago de Servicios Ambientales en Costa Rica, Información General. Sistema Nacional de Áreas de Conservación (SINAC). www.inbio.ac.cr/es/biod/estrategia/Paginas/
CIFOR C&I Team (1999) The CIFOR Criteria and Indicators Generic Template 2. Center for International Forestry Research (CIFOR), The European Commission, Deutsche Gesellschaft für Technische Zusammenarbeit (GTZ) Jakarta, Indonesia. 55 p

References
152
CIFOR (2004) Causes of Deforestation of the Brazilian Amazon, Working report 22. CIFOR & World Bank. Washington D.C, USA
Coleman J (1988) Social Capital in the Creation of Human capital. American Journal of Sociology: 95-120
CONACIN (1998) Biodiversidad y derechos intelectuales, los dilemas del mañana. Coordinadora Nacional Indianista (eds). Renacer Indianista N 17. Santiago de Chile, Chile
Costanza R (2000) Visions of alternative (unpredictable) futures and their use in policy analysis. Conservation Ecology: 4(1), 5
Costanza R and Farber S (2002) Introduction to the special issue on the dynamics and value of ecosystem services: integrating economic and ecological perspectives. Ecological Economics 41: 367-373
Conway G (1997) The Doubly Green Revolution. Food for all in the 21st century. : Penguin. London, UK. 334 p
Costanza R, d'Arge R, de Groot R, Farber S, Grasso M, Hannon B, Limburg K, Naeem S, O'Neill RV, Paruelo J, Raskin RG, Sutton P and van den Belt M (1997) The value of the world's ecosystem services and natural capital. Nature 387.6230: 253-260
Daily G, Alexander S, Ehrlich P, Goulder L, Lubchenco J, Matson P, Mooney H, Postel S, Schneider SH, Tilman D, Woodwell GM (1997). Ecosystem Services: Benefits Supplied to Human Societies by Natural Ecosystems. Issues in Ecology, Ecological Society of America. Washington, US
de Groot R, Wilson M and Boumans R (2002) A tipology for the classification, description and valuation of ecosystem functions, goods and services. Ecological Economics 41: 393-408
de Groot RS (1994) Environmental Functions and the Economic Value of Natural Ecosystems. In: Jansson AM, Hammer M, Folke C and Costanza R (eds). Investing in Natural Capital: the ecological economics approach to sustainability. Island Press. Washington DC, USA
Detweiler RP and Hall ChAS (1988) Tropical Forests and the Global Carbon Cycle. Science 239.4835: 42-47
Dobson AP, Bradshaw AD, & Baker AJM (1997) Hopes for the future: restorarion ecology and conservation biology. Science 277: 512-522
Dogson J, Spackman M, Pearman A and Phillips L (n/d) DTLR multi-criteria analysis manual. NERA (National Economic Research Associates). 145 p
Dung B, Thanh Ha D. and Quoc Chinh N (2004) Rewarding Upland Farmers for Environmental Services. Experience, Constraints and Potential in Vietnam. The Program for Developing Mechanisms for Rewarding the Upland Poor in Asia for Environmental Services (RUPES). World Agroforestry Centre (ICRAF). Bogor, Indonesia
Ehrenfeld D (1972) Conserving Life on Earth. Oxford University Press. New York, USA. 360 p
References
153
Ehrenfeld D (1988) Why Put a Value on Biodiversity. Wilson EO (ed). Biodiversity. National Academy Press. Washington D.C., USA
Eisemberg JF and Harris D (1987) Agriculture, forestry, and wildlife resources… perspectives from the western hemisphere. In: Gholz HL (ed) Agroforestry: realities, possibilities and potentials. Martinus Nijhoff Publishers and Dordrecht in cooperation with ICRAF. the Hague, the Neederlands
Farber SC, Costanza R and Wilson M (2002) Economic and Ecologic Concepts of Valuing Ecosystem Services. Ecological Economics 41: 375-392
Field A (2000) Discovering Statistics using SPSS for Windows, Advanced Techniques for the Beginner. Sage Publications. Wiltshire, UK. 470 p
Finegan B and Nasi R (2004) The Biodiversity and Conservation Potential of Shifting Cultivation Landscapes. In: Schroth G, da Fonseca G, Harvey C, Gascon C, Vasconcelos L and Izac A (eds). Agroforestry and Biodiversity Conservation in Tropical Landscapes. Island Press, Washington, USA
Franklin JF (1988) Structural and functional diversity in temperate forests. In: Wilson EO (ed). Biodiversity. National Academy Press. Washington, D.C., USA
Garson D (2007) Statnotes: Topics in Multivariate Analysis. North Carolina State University. http://www2.chass.ncsu.edu/garson/pa765/statnote.htm.
Gascón C, da Fonseca G, Schrest W, Billmark KA and J Anderson (2004) Biodiversity Conservation in Deforested and Fragmented Tropical Landscapes: An Overview. In: Schroth G, da Fonseca G, Harvey C, Gascon C, Vasconcelos L and Izac A (eds). Agroforestry and Biodiversity Conservation in Tropical Landscapes. Island Press. Washington, USA
GEF (2007) Global Environmental Facility of the United Nations. http://www. gefweb. org
Glover J (2003) Characteristics of Annual vs. Perennial Systems. http://www. landinstitute. org/vnews/display.v/ART/2003/02/20/3e78b3f2d0336
Goicochea G (1998) Reservas Naturales en grave riesgo; tráfico ilícito internacional de germoplasma vegetal. : Editorial San Marcos. Lima, Peru. 335 p
Gollin D and Smale M (1999) Valuing Genetic Diversity: Crop Plants and Agroecosystems. In: Collins, W.W. and C.Q. Qualset. Biodiversity in Agroecosystems. CRC Press. London, UK
Gomez-Pompa A and Kraus A (1999) From the pre-Hispanic to future conservation alternatives: Lessons from Mexico. Conference: Plants and Population: Is There time. Natural Academy of Sciences. Irvine, California, USA
Gouyon A (2003) Rewarding the Upland Poor for Environmental Services: A Review of Initiatives from Developed Countries. World Agroforestry Center (ICRAF) Bogor, Indonesia
Guiracocha G, Harvey C, Somarriba E, Graus U and Carrillo E (2001) Conservación de la biodiversidad en sistemas agroforestales con cacao y banano en Salamanca Costa Rica. Agroforestería en las Américas 8.30: 7-11
References
154
Hair JF, Anderson RE, Tatham RL and Black WC (1995) Multivariate data analysis. Prentice-Hall Inc. New Jersey, US
Harris LD and Eisenberg J (1989) Enhanced linkages: Necessary steps for success in conservation of faunal diversity. In: Pearl, M.C. and D. Western. Conservation for the 21st century. Oxford University Press. New York, USA
Harrison I, Laverty M and Sterling E (2004) Introduction to the Importance of Biodiversity. Connexions. http://cnx.rice.edu/content/m12163/latest/
Harrison I, Laverty M and Sterling E (2004) Alpha, Beta, and Gamma Diversity. Connexions. http://cnx.rice.edu/content/m12147/latest/
Hart R (1985) Conceptos básicos sobre agroecosistemas. Centro Agronómico Tropical de Investigación y Enseñanza. San José, Costa Rica. 157 p
Harte J (n/d) Defining the 'B' word. 1996. Defenders. http://www.defenders.org/bio-bi03.htm
Harvey CA, Nigel I, Tucker J and Estrada A (2004) Live Fences, Isolated Trees and Windbreaks: Tools for Conserving Biodiversity in Fragmented Tropical Landscapes. In: Schroth G, da Fonseca G, Harvey C, Gascon C, Vasconcelos L and Izac A. (eds). Agroforestry and Biodiversity Conservation in Tropical Landscapes. Island Press. Washington, USA
Hector A and Bagchi R (2007) Biodiversity and ecosystem multifunctionality. Nature 448: 188-191
Hooper DU and Vitousek PM (1997) The effects of plant composition and Diversity on Ecosystem processes. Science 277: 1302-1305
Huang W, Luukkanen O, Johanson S, Kaarakka V, Räisänen S and Vihemäki H (2002) Agroforestry for biodiversity conservation of nature reserves: functional group identification and analysis. Agroforestry Systems 55: 65-72
Huxley P (1999) Tropical Agroforestry. Blackwell Science. Paris, France. 371 p
IBGE (2000) Censo 2000. http://www.ibge.gov.br/censo/
ICRAF (2000) Paths to prosperity through agroforestry. ICRAF's corporate strategy 2001-2010. International Centre for Research in Agroforestry. Nairobi, Kenia
ITTO (1998) Criteria and Indicators for Sustainable Management of Natural Tropical Forests. ITTO Policy Development Series N 15. Yokohama, Japan. 42 p
IUCN (2007) Vulnerable species, red lists. International Union for Conservation of Nature. http://www.iucn.org/themes/ssc/redlists /rlindex.htm
Izac A. and Swift M.J. 1994. On agricultural sustainability and its measurement in small-scale farming in sub-Saharan Africa. Ecological economics 11: 105-125.
Izac AMN and Sánchez PA (2001) Towards a natural resource management paradigm for international agriculture: the example of agroforestry research. Agricultural Systems 69: 5-25
Jordan C (1987) Amazonian Rainforests, Ecosystem Disturbance and Recovery. Ecological Studies. Springer-Verlag. New Jersey, USA

References
155
Kang BT and Wilson GF (1987) The development of alley cropping as a promising agroforestry technology. In: Steppler, H.A. and P.K.R. Nair (eds). Agroforestry a Decade of Development. ICRAF. Nairobi, Kenia
Kehlenbeck K and Maass BL (2004) Crop diversity and classification of homegardens in Central Sulawesi, Indonesia. Agroforestry Systems 63: 53-62
Kidd ChV and Pimentel D (eds) (1992) Integrated Resource Management. Agroforestry for Development. Academic Press Inc. San Diego, California, USA. 223 p
Kleinn C, Ramirez C, Chaves G and Lobo S (2000) Pilot forest inventory in Costa Rica. FAO. San José, Costa Rica
Kloppenburg JR (1988) First the seed: the political economy of plant technology, 1492-2000. Cambridge University Press. Cambridge, UK
Kneeshaw D, Messier C, Leduc A, Drapeau P, Carigan R, Pare D, Ricard J, Gauthier S, Doucet D and Greene D (2002) Towards Ecological Forestry: A proposal for Indicators of SFM inspired by Natural Disturbances. Sustainable Forest Management Network, Université du Québec à Montréal. Montreal, Canada. 60 p
Krishnamurthy L & Avila M (1999) Agroforestería Básica. Universidad Autónoma Chapingo, Programa de las Naciones Unidas para el Medio Ambiente, Chapingo, México. 340 p
Laurance SGW (2004) Landscape Connectivity and Biological Corridors. Agroforestry and Biodiversity Conservation in Tropical Landscapes. In: Schroth G, da Fonseca G, Harvey C, Gascon C, Vasconcelos L and Izac A (eds) Agroforestry and Biodiversity Conservation in Tropical Landscapes. Island Press, Washington, USA
Laurance WF and Vasconcelos HL (2004) Ecological Effects of Habitat Fragmentation in the Tropics. In: Schroth G, da Fonseca G, Harvey C, Gascon C, Vasconcelos L and Izac A (eds). Agroforestry and Biodiversity Conservation in Tropical Landscapes. Island Press. Washington, USA
LBA (2007) Experimento de Grande Escala da biosfera na Amazônia." Ministério da Ciência e Tecnologia, 2007. http://www.lba.cnpm.embrapa.br/index.html
Leakey R (1996) Definition of agroforestry revisited. Agroforestry Today 8.1: 5-7
Leakey RRB (1999) Agroforestry for Biodiversity in Farming Systems. In: Collins WW and Qualset CO (eds). Biodiversity in Agroecosystems CRC Press. Florida, USA
Lek S (2005) Diversité écologique utilisant R. Université Paul Sabatier. http://st24-cesac.ups-tlse.fr/R/DocCours/S3/TD3.pdf
Limburg K, O’Neill R, Costanza R and Farber S (2002) Complex system and valuation. Ecological Economics 41: 409-420
Loyn & McAlpine (2001) Spatial patterns and fragmentation: indicators for conserving biodiversity in forest landscapes. Criteria and Indicators for Sustainable Forest Management. In: Raison R, Brown AG and Flinn DW (eds). CAB International. Viena, Austria

References
156
MacMillan D, Hanley N and Daw M (2004) Costs and Benefits of Wild Goose Conservation in Scotland. Biological Conservation 119: 475-485
Márquez L (2000) Elementos técnicos para Inventarios de Carbono en Uso del Suelo. Fundación Solar. Guatemala, Guatemala. 36 p
McNeely JA (2004) Nature vs. nurture: managing relationships between forests agroforestry and wild biodiversity. Agroforestry Systems 61: 155-165
Mellor JK (2002) Poverty Reduction and Biodiversity Conservation: The Complex Role for Intensifying Agriculture. World Wildlife Foundation. Washington DC, USA
Mendoza G and P Macoun (2002) Guidelines for Applying Multi-Citeria Analysis to the Assessment of Criteria and Indicators. The Criteria & Indicators Toolbox Series. Center for International Forest Research (CIFOR). Washington DC, USA. 85 p
Mendoza GA and Martins H (2006) Multi-criteria decision analysis in natural resource management: A critical review of methods and new modeling paradigms. Forest Ecology and Management 230:1-22
Mendoza GA and Macoun with Prabhu R, Sukadri D, Purnomo H and Hartanto H (1999) Guidelines for Applying Multi-Criteria Analysis to the Assessment of Criteria and Indicators: C&I Toolbox No 9. Center for International Forestry Reseach (CIFOR). Jakarta, Indonesia. 82 p
Michon, G. & de Foresta H (1995) Agroforests: an original agro-forestry model from smallholder farmers for environmental conservation and sustainable development. In: Kozo Ishizuka, D. Sc., Shigeru Hisajima, D. Sc., Darryl R.J. Macer, Ph.D. (eds). University of Tsukuba International Seminar on Traditional Technology for Environmental Conservation and Sustainable Development in the Asian-Pacific Region. UNESCO, University of Tsukuba. Tsukuba Science City, Japan
Mooney A, Lubchenco J, Dirzo R. and Sala E (1995) Biodiversity and Ecosystem Functioning: Ecosystem Analysis. In: Heywood, V.H. and R.T. Watson (eds). Global Biodiversity Assessment. United Nations Environment Program, Cambridge University Press. Cambridge, UK
Mooney HA (2002) The debate on the role of biodiversity in ecosystem functioning. In: Loreau, M.. Naeem, S. and P. Inchausti (eds). Biodiversity and Ecosystem Functioning. Synthesis and Perspectives. Oxford University Press. Oxford, UK
Munasinghe M (2007) Multi-criteria analysis in environmental decision-making. Encyclopedia of Earth. http://www.eoearth.org/article/Multi-criteria_analysis_in_environmental_decision-making
Myers N (1980) Conversion of tropical moist forests: A report prepared for the Committee on Research Priorities in Tropical Biology of the National Research Council. National Academy of Sciences. Washington DC, USA
References
157
Naeem S, Loreau M and Inchausti P (2003) Biodiversity and ecosystem functioning: the emergence of a synthetic ecological framework. In: Naeem S, Loreau M and Inchausti P (eds). Biodiversity and Ecosystem Functioning. Oxford University Press. New York, USA
Nair PKR (1985) Classification of agroforestry systems. Agroforestry Systems 3: 97-128
Nair PKR (1987) The role of trees in soil productivity and protection. In: Nair PKR (ed). Agroforestry Systems in the Tropics Kluwer Academic Publishers. Dordrecht, The Neederlands
Nair PKR (1993) An Introduction to Agroforestry. Kluwer Academic Publishers. Dordrecht, The Netherlands. 499 p
Nair PKR (1997) Directions in tropical agroforestry research: past, present, and future. Agroforestry Systems 38 1-3: 223-245
Newman SM and Gordon AM (1997) Temperate Agroforestry: Synthesis and Future Directions. In: Temperate. Gordon AM and SM Newman (eds). Agroforestry Systems. Centre for Agriculture and Subsistence, (CAB) International. Wallingford, UK
Noss RF (1990) Indicators for monitoring biodiversity: a hierarchical approach. Conservation Biology 4: 355-364
Nunes PA, van den Bergh, J. and Nijkamp P (2001) Ecological-Economic Analysis and Valuation of Biodiversity. Working paper 74
OECD (2002) Handbook of Biodiversity Valuation: a guide for policemakers. Organisation for Economic Co-operation and Development. Paris, France. 156 p
Padoch C and Peters C (1993) Managed forest gardens in West Kalimantan, Indonesia. In: Potter CS, Cohen JI, and Janczewski D (eds). Perspectives on biodiversity: Case studies of genetic resource conservation and development. American Association for the Advancement of Science Press. Washington, DC, USA
Pagiola S, Bishop J, Landell-Mills N (2002) Selling Forest Environmental Services: Market-based Mechanisms for Conservation and Development. Earthscan Publications. London, UK
Pérez C (2004) Payment for hydrological services at a municipal level and its impact on rural development: the PASOLAC experience. Payment Scheme for environmental services in waterlands. FAO Regional Office for Latin America and the Caribbean. Arequipa, Peru
Perrings C, Maler KG, Folke C, Holling CS and Jansen BO (1995) Biodiversity Loss: Economic and Ecological Issues. Cambridge University Press. Cambridge, UK. 332 p
Pimentel D and Wightman A (1999) Economic and Environmental Benefits of Agroforestry and Fuelwood Production. In: James P, Lassoie LB and Fernandes ECM (eds). Agroforestry in Sustainable Agricultural Systems.: Lewis Publishers. Florida, USA

References
158
PLEC (2007) People, Land Management and Ecosystem Conservation. http://www.unu.edu/env/plec/index.htm
Podolsky R (1995) Biodiversity prospecting from digital Earth Imagery. Diversity 11.4: 16-17
Prabhu R, Colfer CJP and Dudley RG (1999) Guidelines for Developing, Testing and Selecting Criteria and Indicators for Sustainable Forest Management. The Criteria & Indicators Toolbox Series. Center for International Forestry Research (CIFOR). Jakarta, Indonesia. 183 p
Prabhu R, Colfer CJP, Venkateswarlu P, Tan LC, Soekmadi R and Wollenberg E (1996) Testing criteria and indicators for the sustainable management of forests. CIFOR (Center International for Forestry Research). Bogor, Indonesia
Prasad PM (2002) Assessment of Sustainable of Community Forestry through combined Analysis of Field and Remotely Sensed Indicators (A case study in Siraha and Saptari districts, Nepal). International institute for Geo-information Science and Earth Observation. Enschede, The Neederlands. 97 p
Preisinger H (2005) Multivariate methods in Ecology. Personal communication. Bonn, Germany
Proambiente (2004) Um novo Modelo de Desenvolvimento Rural para a Amazônia. Programa de Desenvolvimento Socioambiental da Produção Familiar Rural (eds). Instituto Brasileiro do Meio Ambiente e dos Recursos Naturales Renováveis e Ministerio do Meio Ambiente. Brasilia, Brazil
Proambiente (2005) Certificação de Serviços Ambientais do PROAMBIENTE. Programa de Desenvolvimento Socioambiental da Produção Familiar Rural (eds). Instituto Brasileiro do Meio Ambiente e dos Recursos Naturales Renováveis e Ministerio do Meio Ambiente. Brasilia, Brazil
Proambiente (2005) Plano de Utilização da Unidade de Produção PU. Programa de Desenvolvimento Socioambiental da Produção Familiar Rural (eds). Instituto Brasileiro do Meio Ambiente e dos Recursos Naturales Renováveis e Ministerio do Meio Ambiente. Brasilia, Brazil
Purnomo H. et al. (2000) CIMAT v. 2 (Criteria and Indicators Modification and Adaptation Tool). Center for International Forestry Research (CIFOR)
Richardson DM (1999) Commercial forestry and agroforestry as sources of invasive alien trees and shrubs. In: Sandlund O.T., Schei P.J. and A. Viken (eds). Invasive Species and Biodiversity Management. Kluwer Academic Publishers. Boston, USA
Rojas L, Godoy C, Hanson P, Kleinn C and Hilje L (1999) Diversidad de homópteros en plantaciones de café con diferentes tipos de sombra, en Turrialba, Costa Rica. Agroforestría en las Américas 6.23: 33-35
Ryan JC (1992) Life Support: Conserving biological Biodiversity. Worldwatch Institute. Washington, USA. 62 p

References
159
Samu F (2003) Can small-scale habitat diversification enhance functional biodiversity of generalist natural enemies in arable systems. In: Rossing, WAH, Poehling H and Burgio G (eds). Landscape Management for Functional Biodiversity. International organization for Biological and Integrated Control of Noxious Plants and Animals (IOCB). Bologna, Italy
Sánchez PA (1995) Science in Agroforestry. Agroforestry Systems 30: 5-55.
Sanguino CA (2004) Avaliação econômica da produção em sistemas agroflorestais na Amazônia: estudo de caso em Tomé-Açú. Tese de doutorado em Ciências Agrárias, Universidade Federal Rural da Amazônia. Belém, Brasil
Scherr S and McNeely J (2003) Ecoagriculture Strategies for Poverty reduction and Biodiversity Conservation. International workshop on Reconciling Rural Poverty Reduction and Resource Conservation: Identifying Relationships and Remedies. Cornell University. Ithaca, New York, USA
Schoeneberger MM (1993) Enhancing Biodiversity with and within Agroforestry Plantings. In: Landis, T.D. (ed). Western Forest Nursery Association. Department of Agriculture. Fort Collins, USA
Schroth G, da Fonseca G, Harvey C, Gascon C, Vasconcelos H, Izac A, Angelsen, A, Finegan B, Kaimowitz D, Krauss U, Laurance S, Laurance W, Nasi R, Naughton-Treves L, Niesten E, Richardson D, Somarriba E, and Tucker N (2004) Conclusion: Agroforestry and Biodiversity Conservation in Tropical Landscapes. In: Schroth G, da Fonseca G, Harvey C, Gascon C, Vasconcelos L and Izac A (eds). Agroforestry and Biodiversity Conservation in Tropical Landscapes. Island Press. Washington, USA
Schroth G, da Fonseca G, Harvey C, Vasconcelos HL, Gascon C and Izac A 2004. Introduction: The Role of Agroforestry in Biodiversity Conservation in Tropical Landscapes. In: Schroth G, da Fonseca G, Harvey C, Gascon C, Vasconcelos L and Izac A (eds). Agroforestry and Biodiversity Conservation in Tropical Landscapes. Island Press. Washington, USA
Schroth G, Harvey CA and Vincent G (2004) Complex Agroforests: Their Structure, Diversity, and Political Role in Landscape Conservation. In: Schroth G, da Fonseca G, Harvey C, Gascon C, Vasconcelos L and Izac A (eds) Agroforestry and Biodiversity Conservation in Tropical Landscapes. Island Press. Washington, USA
Shiki S (2007) Personal communication. Brasilia, Brazil
Shiva V (1993) Monocultures of the Mind: Perspectives on Biodiversity and Biotechnology. Zed Books and Third World Network. Penang, Malaysia
Smith NJH, Serrão EAS, Alvim PTA and Falesi IC (1995) Amazonia - Resiliency and Dynamism of the Land and its People. In: Kasperson JX, Kasperson, RE and Turner BL (eds). UNU Studies on Critical Environmental Regions. The United Nations University. II Tokyo, Japan

References
160
Somarriba E, Harvey CA, Samper M, Anthony F, Gonzáles J, Staver C and Rice RA (2004) Biodiversity Conservation in Neotropical Coffee (Coffea arabica) Plantations. In: Schroth, G., da Fonseca, G., Harvey, C., Gascon, C., Vasconcelos, L. and A. Izac (eds). Agroforestry and Biodiversity Conservation in Tropical Landscapes.: Island Press. Washington, USA
Srivastava JP, Smith NJH and Forno DA (1996) Agriculture as Friend and Foe of Biodiversity. In: Srivastava JP, Smith NJH and Forno DA (eds). Biodiversity and Agricultural Intensification. World Bank. Washington D.C., USA
STATSOFT (2007) Cluster Analysis. http://www.statsoft.com/
Stockburger DW (1998) Multivariate statistics: concepts, models and applications WWW version 1.0. Missouri State University. http://www .psychstat. missouristate.edu/multibook/mlt00.htm
Stocking M (2002) Agrodiversity, environmental protection and sustaining rural livelihoods: the global view. In: Brookfield H, Padoch C, Parsons H and Stocking M (eds). Cultivating Biodiversity. Understanding, Analysing and Using Agricultural Diversity. The United Nations University, ITDG Publishing. London, UK
Stocking MA (2003) Tropical soils and food security: the next 50 years. Science 302: 1356-1359
Stork NE (1997) Measuring global biodiversity and its decline. In: Ed. Reaka-Kudla ML and Wilson EO Biodiversity II. Joseph Henry Press. Washington D.C., USA
Stork NE, Boyle TJB, Dale V, Eeley H, Finegan B, Lawes M, Manokaran N, Prabhu R. and Soberon J (1997) Criteria and Indicators for Assessing the Sustainability of Forest Management: Conservation of Biodiversity. CIFOR Center for International Forestry Research. 35 p
Suzuki Foundation. (2007) http://www.davidsuzuki. org/WOL/ Biodiversity /Importance.asp
Swallow B (2006) Pan-Tropical Scoping Study of Compensation for Ecosystem Services: Conceptual Foundations. World Agroforestry Centre. Nairobi, Kenia
Swift MJ, Izac A and van Noordwijk M (2004) Biodiversity and ecosystem services in agricultural landscapes - are we asking the right questions? Agriculture, Ecosystems and Environment 104: 113-134
Takacs D (1996) The Idea of Biodiversity: Philosophies of Paradise. The John Hopkins University Press. Baltimore, US. 393 pp
Tilman D (1999) The ecological consequences of changes in biodiversity: a search for general principles. Ecology 80: 1455-1474
Tomich TP, Thomas DE and van Noordwijk M (2004) Environmental services and land use change in Southeast Asia: from recognition to regulation or reward? Agriculture, Ecosystems and Environment: 104:1-16

References
161
Tomich TP, van Noordwijk M. and Thomas D (2004) Environmental services and land use change in Southeast Asia: from recognition to regulation or reward? Agriculture, Ecosystems and Environment 104: 229-244
Torquebiau E (1990) Conceptos de Agroforestería, una introducción. Centro de Agroforestería para el Desarrollo Sostenible, Universidad Autónoma Chapingo. Chapingo, México
UN (2007) United Millenium Development Goals. http://www.un.org/millenniumgoals/
UNEP (2007) The Convention on Biological Diversity. http://www .cbd. int/default.shtml
Urquhart G, Chomentowski W, Skole D and Barber C (2007) Tropical deforestation. Earth Observatory, NASA. http://209.85.135.104/search? q=cache: HZUj4lXXe7QJ:earthobservatory.nasa.gov/Library/Deforestation/tropical_deforestation_2001.pdf+Urquhart+forest+rain+vanish&hl=en&ct=clnk&cd=3
van Noordwijk M, Chandler FJ and Tomich TP (2004) An introduction to the conceptual basis of RUPES: rewarding upland poor for the environmental services they provide. ICRAF-Southeast Asia. Bogor, Indonesia
van Noordwijk M, Tomich TP, de Foresta H and Michon G (1997) To segregate or to integrate: the question of balance between production and biodiversity conservation in complex agroforestry systems. Agroforestry Today 1997: 6-9
Vandermeer J (1995) The ecological basis of alternative agriculture. Ecological Systems Annual Review 26: 201-224
Vermeulen S and Koziell I (2002) Integrating global and local values: a review of biodiversity assessment. International Institute for Environment and Development. London, UK
Viana G, Vizentin R and Shiki S (2006) Bases Conceituais para uma Politica de Serviços Ambientais para o Desenvolvimento. Ministério do Meio Abiente; Secretaria de Políticas para o Desenvolvimento Sustentável. Brasilia, Brazil
Vietmeyer N (1996) Harmonizing Biodiversity Conservation and Agricultural Development. In: Srivastava JP, Smith NJH and Forno DA (eds). Biodiversity and Agricultural Intesification. World Bank. Washington D.C., USA
Villavicencio-Enríquez L and Valdéz-Hernández JI (2003) Análisis de la estructura arbórea del sistema agroforestal rusticano de café en San Miguel, Veracruz, México. Agrociencia 37.4: 413-423
Vitousek PM and Hooper DU (1993) Biological diversity and terrestrial ecosystem biogeochemistry. In: Schulze, E.-D. and H.A. Mooney. Biodiversity and ecosystem function. Springer-Verlag. Berlin, Germany
von Maydell HJ (1990) Trees and shrubs of the Sahel, their characteristics and uses. GTZ, Weikersheim, Germany. 525 pp
WCPA (2007) World Database on Protected Areas. World Commission on Protected Areas. http://sea.unep-wcmc.org/wdbpa/

References
162
Weesie P, and van Andel J (2003) On biodiversity and its valuation. Center of Development Studies, The University of Groningen. Groningen, The Neederlands
Weitzman ML (1974) Price vs. Quantities. Review of Economic Studies 41.4: 477-491
Wezel A and Bender S (2003) Plant species diversity of homegardens of Cuba and its significance for household food supply. Agroforestry Systems 57: 39-49
Wilkinson K. and Elevitch C (2000) Agroforestry and Biological Diversity. The Overstory # 21. http://www.agroforestry.net/overstory/overstory21.html
Williams PA, Gordon AM, Garret HE and Buck L (1997) Agroforestry in North America and its Role in Farming Systems. In: Gordon AM and Newman SM (eds). Temperate Agroforestry systems. Centre for Agriculture and Subsistence (CAB) International. Cambridge, UK
Woda C (2006) Indicadores para serviços ambientais em Sistemas Agroflorestais. Parte 1: Sistemas Agroflorestais-Prestadores de serviços ambientais? Personal communication. Belém, Brasil. 14 p
Wolfe M (2000) Crop strength trough diversity. Nature 406: 681-682
Wolfe M (2001) Functional biodiversity. Elm Farm Research Centre Bulletin 56: 6-7
Wolfslehner B, Vacik H, Lexer MJ, Würz A, Hochbichler E, Klumpp R and Spörk J (n/d) A System Analysis Approach for Assessing Sustainable Forest Management at Forest Management Unit Level. Insitute of Silviculture, BOKU, University of Applied Sciences. Vienna, Austria
Yamada M (1999) Japanese Immigrant Agroforestry in Brazilian-Amazon: A Case Study of Sustainable Rural Development in the Tropics. University of Florida. Gainsville, Florida, USA
Yamada M. and Gholz HL (2002) An evaluation of agroforestry systems land-use change on soil nutrient dynamics in Amazonia. Agroforestry Systems 55: 81-87
Young A (1989) Agroforestry for soil conservation. CAB International. Wallingford, UK. 276 p
Zarin DJ, Huijun G and Enu-Kwesi L (2002) Guidelines on the assessment of plant species diversity in agricultural landscapes. In: Brookfield H, Padoch C, Parsons H and Stocking M. Cultivating Biodiversity. Understanding, Analysing and Using Agricultural Diversity. United Nations University. London, UK

Appendices
163
11 APPENDICES Appendix 1: Field sheet
BIODIVERSIDADE FUNCIONAL NOS SISTEMAS AGROFLORESTAIS
(Folha para a coleção de dados de campo)
Nome do agricultor ..................................................................................... Código .................................
Nome da propriedade ....................................................... Coordenadas ..................................................
Declive ........................... Altitude ..................................... Tamanho da propriedade .......................(ha)
Tamanho do SAF …….......................(ha) Data ........./......../.........
Comentários ...............................................................................................................................................
.....................................................................................................................................................................
.....................................................................................................................................................................
I. Definição da parcela da amostra
1. Definição do ponto X (aleatoriamente), e geoposicionar. 2. Definição da parcela a estendendo uma corda de 5.65 m. 3. Definição dos pontos “o” (dois). Definição da direção N-S, três metros nas duas direções. 4. Definição das parcelas b 2 x 2m. 5. Definição das parcelas c 1x1. 6. Definição das parcelas d 0.5x0.5m. 7. Definição dos pontos e, f, g, h, i (aleatoriamente)
5.65m
N
3m
,5m1m
2m
x
o
cd
b
a
e
f
g
h
i

Appendices
164
II. Amostragem
1. Parcela a. (árvores e árvores pequenas, palmas: > 2m de altura; > 2.5 cm DAP) # Nome comum Variedade,
raça, clone Uso1
(1,2,3,4) Altura
(palmas) AP (cm) Fase de
crescimento2
(1,2,3)
2. Parcela b. (arbustos, cultivos anuais ou bi-anuais <2m de altura; < 2.5 cm DAP) # Nome comum Variedade, raça,
clone. Uso
(1,2,3,4) Fase de crescimento
(1,2,3)
1 1. alimento, 2. medicinal, 3. combustível, 4. outro. 2 1. jovem, 2. intermediário, 3. adulto.

Appendices
165
3. Parcela c. (Porcentagem de cobertura do solo) % Total 0
-25 5-50 0-75
5-100
4. Parcela c. (ervas: não lenhosas; < 0.5m de altura) Peso fresco total (g/m2)
Peso fresco sub-amostra (g)
5. Parcela d. (serrapilheira) Peso fresco total
(g/0,25 m2) Peso fresco sub-amostra
(g)
6. Pontos o-1, o-2. Densidade Peso fresco total (g/vol)
7. Pontos e, f, g, h, i (materia organica, nitrogênio total e fósforo) Peso fresco total (g/vol)
check
III. Esboço do sistema (horizontal em vertical): espaçamento, ordenamento, número de andares, etc.
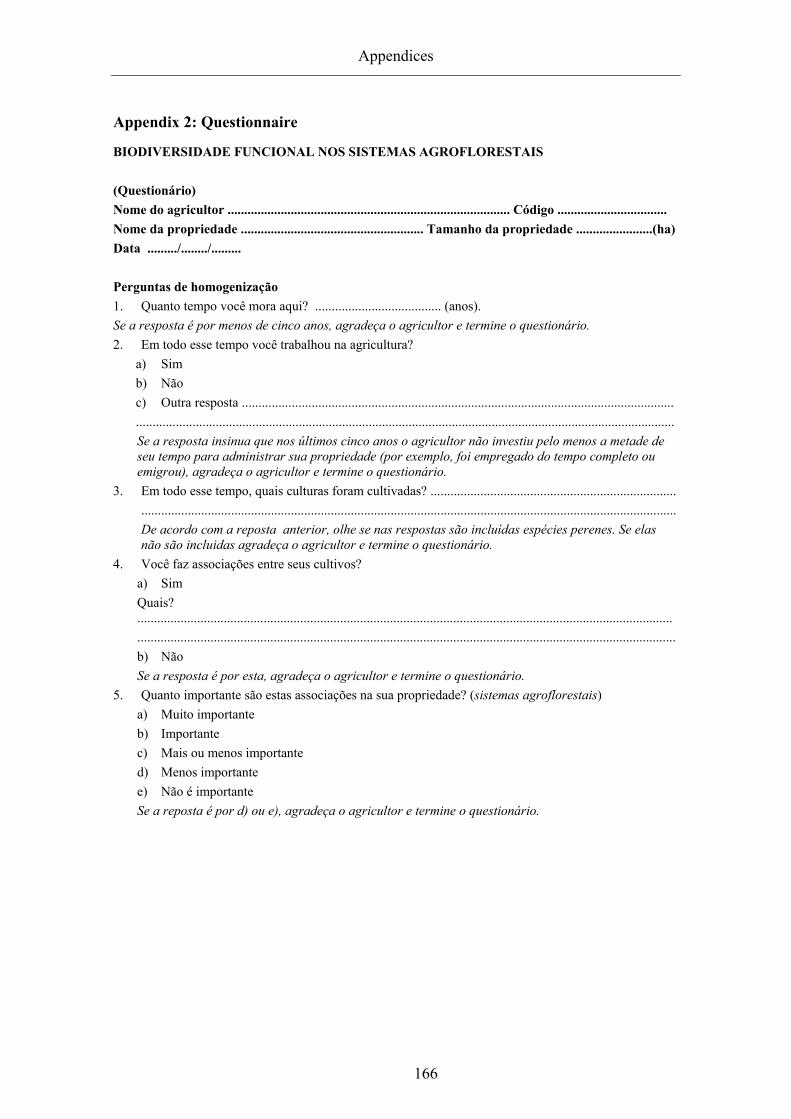
Appendices
166
Appendix 2: Questionnaire
BIODIVERSIDADE FUNCIONAL NOS SISTEMAS AGROFLORESTAIS (Questionário) Nome do agricultor ..................................................................................... Código ................................. Nome da propriedade ....................................................... Tamanho da propriedade .......................(ha) Data ........./......../......... Perguntas de homogenização 1. Quanto tempo você mora aqui? ...................................... (anos). Se a resposta é por menos de cinco anos, agradeça o agricultor e termine o questionário. 2. Em todo esse tempo você trabalhou na agricultura?
a) Sim b) Não c) Outra resposta .................................................................................................................................. .................................................................................................................................................................. Se a resposta insinua que nos últimos cinco anos o agricultor não investiu pelo menos a metade de seu tempo para administrar sua propriedade (por exemplo, foi empregado do tempo completo ou emigrou), agradeça o agricultor e termine o questionário.
3. Em todo esse tempo, quais culturas foram cultivadas? .......................................................................... ................................................................................................................................................................. De acordo com a reposta anterior, olhe se nas respostas são incluídas espécies perenes. Se elas não são incluidas agradeça o agricultor e termine o questionário.
4. Você faz associações entre seus cultivos? a) Sim Quais? ................................................................................................................................................................. .................................................................................................................................................................. b) Não Se a resposta é por esta, agradeça o agricultor e termine o questionário.
5. Quanto importante são estas associações na sua propriedade? (sistemas agroflorestais) a) Muito importante b) Importante c) Mais ou menos importante d) Menos importante e) Não é importante Se a reposta é por d) ou e), agradeça o agricultor e termine o questionário.

Appendices
167
BIODIVERSIDADE FUNCIONAL NOS SISTEMAS AGROFLORESTAIS (Questionário) Nome do agricultor ..................................................................................... Código ................................. Nome da propriedade ....................................................... Tamanho da propriedade .......................(ha) Data ........./......../......... Os produtores estão atentos aos riscos da introdução de espécies exóticas (2.1.1.1.) 6. Você conhece as plantas que estam na sua propriedade?
a) Todas b) Muitas c) A metade d) Poucas e) Nehuma
7. Que você faz com as plantas que você não conhece, mas ficam na sua propriedade? a) Elimino b) Deixo-as c) Isolo-as d) Outra resposta ...................................................................................................................................
........................................................................................................................................................... 8. Você ha trazido alguma planta estrangeira?
a) Muitas b) Algumas c) Poucas d) Nehuma
9. Você pensa foi bom trazer esas plantas? a) Bom b) Isso depende da planta c) Mais ou menos d) Mau e) Não sei
Presença de espécies provedoras de sub-produtos nos SAFs (2.1.2.2.) 10. Você mantém plantas para outros propósitos no seu SAF?
a) Sim b) Não (pule a pergunta 13)
11. Quantas dessas plantas existem no seu SAF? a) 1 b) 1-5 c) 5-10 d) 10-20 e) > 20
12. Quais propósitos? -comida, forragem, medicinas, ...................................................................................................................................................................................................................................................................................................................................................................................................................................................................................................... ..................................................................................................................................................................

Appendices
168
Número e proporção de variedades das colheitas principais dentro do campo de cultivo. (SAF) (2.1.2.1.) 13. Quantos anos você cultiva esse(s) cultivo(s) (Defina sobre as espécies predominantes no seu SAF)
Sp1 Sp2 Sp3 a) 1-2 anos b) 3-5 anos c) 6-15 anos d) 16-25 anos e) Sempre 14. Quantas variedades dessa espécie ficam no seu SAF?
Sp1 Sp2 Sp3 a) 1-2 variedades b) 3-5 variedades c) 6-10 variedades d) > 10 variedades Os índices de aproveitamento sustentável estão claramente definidos para cada subproduto específico. (2.4.1.1.) Sobre as mesmas espécies mencionadas arriba. 15. Esse cultivo é muito importante, não é?
Sp1 Sp2 Sp3 a) E essencial! b) Sim é importante c) E mais ou menos importante d) Menos importante e) Não é importante 16. Comparado com anos anteriores, este ano a colheita foi...?
Sp1 Sp2 Sp3 a) Melhor b) Pior c) Mesma A regeneração das espécies provedoras não diminui. (2.4.1.2.) Sobre a(s) mesma(s) especie(s) da pregunta anterior 17. Você deixa essas plantas crescerem novamente? (observe a atitude e razões)
Sp1 Sp2 Sp3 a) Sim, deixo b) Sim, planto c) Só as aguardo
cresceram sozinhas
d) Outra resposta 18. Têm problemas de regeneração com essas plantas? Quais? (propagação, crescimento, enfermidade,
etc.) a) Sim, quais? ........................................................................................................................................ b) Não, nenhum (pule a pergunta 19)

Appendices
169
Proporção entre monoculturas e policulturas no sistema (2.2.3.1.) Proporção entre espécies anuais e perenes no sistema (2.2.3.2.) 19. Como é classificado o uso da terra na sua propriedade? (Podem ser valores aproximados)
Uso da terra (ha) Mata primária, floresta Capoeira em uso Capoeira em descanso Lavouras permanentes Pastagens ... Total 20. Das terras dedicadas a lavouras permanentes, quantas são dedicadas a mono-cultivos e quantas são
dedicadas a poli-cultivos? E quais são essos: 21. Das terras de lavouras permanentes, quantas são dedicadas para policulturas com espécies perenes?
(SAF)
Uso da terra Nome do(s) cultivo(s) (ha)
Monocultura
Policultura
1 2 3 4 5 6
São desenvolvidas práticas de conservação que tomam cuidado da erosão do solo (2.5.1.1.) 22. Tem algum problema de dano do solo na sua propriedade? (a pergunta tem que ser feita para que
seja entendida pelo produtor) a) Sim b) Não, tudo está bem (pule a pergunta 25)
23. Faz alguma atividade para tentar resolver o problema? a) Sim, qual? ........................................................................................................................................ ................................................................................................................................................................... b) Não, (pule a pergunta 25)
24. Quais são as atividades que você está desenvolvendo? (considere práticas culturais, medidas técnicas, etc.)
Atividades do controle Sim Não a) Práticas culturais (cobertura com resíduos de colheita, rotações, etc.) b) Práticas lineais (cultivos do contorno, cercas vivas, poda, etc.) c) Práticas estruturais (muros de contenção, obras de engenharia, etc.) d) Outras

Appendices
170
Os agricultores têm conhecimento técnico suficiente sobre o desenho do sistema. (2.5.2.1.)
25. Da lista de atividades (tabela abaixo), quais você pratica no seu SAF?
(O entrevistador tem que tomar cuidado que o agricultor fale baseado sobre atividades fixas-que faz
habitualmente-)
Atividades Realiza? Grupo Detalhe Sim Não a) Semente Coleta
Armazenamento Prova da germinação
b) Viveiro Desenho Rega Proteção Reposição
c) Plantação Desenho (espaços) Rega Proteção Reposição
d) Manejo Capina Rega Proteção Adubação Controle sanitário Desbaste Poda

Appendices
171
Os agricultores aplicam técnicas, tratamentos e métodos de baixo-impacto, para manter os recursos e rendimentos. (2.5.2.2.) viveiro 26. Das atividades listadas (tabela abaixo), quais são feitas de modo que promoven a sustentabilidade e o
mantimento da produção e produtividade do SAF? (O entrevistador tem que tomar cuidado sobre a relatividade das repostas dos agricultores; as que dependem das caracteristicas do sistema. Critique tecnicamente)
Atividades
☺
Capina (P.ex. manual vs. herbicida?) Proteção (P.ex.. arame vs. cerca viva) Adubação (P.ex.. químico vs. orgânico) Controle sanitário (P.ex.. dose adequada vs. abuso)
Desbaste Poda Rega O plano de administração mudou nos últimos 3 anos para se adaptar as variações ambientais. (2.5.3.1.) 27. Você mudou sua administração (manejo técnico, financeiro, político, etc.) por assuntos naturais nos últimos 5 anos? a) Sim b) Não c) Um poquinho, sempre estamos mudando d) Outra resposta............................................................................................................................................ Por quê? ................................................................................................................................................... .......................................................................................................................................................................... .......................................................................................................................................................................... Parte da renda investida na compra de comida. (3.1.1.1.) 28. Usa algumas das suas colheitas para seu próprio consumo? a) Sim b) Não 29. Mais algumas outras tem que comprar? a) Sim b) Não Quais são essas?........................................................................................................................................ .......................................................................................................................................................................... .......................................................................................................................................................................... (Tente fazer uma lista curta; nao é importante o conteúdo, importa a familiaridade –a frequência, importância,etc. na compra)
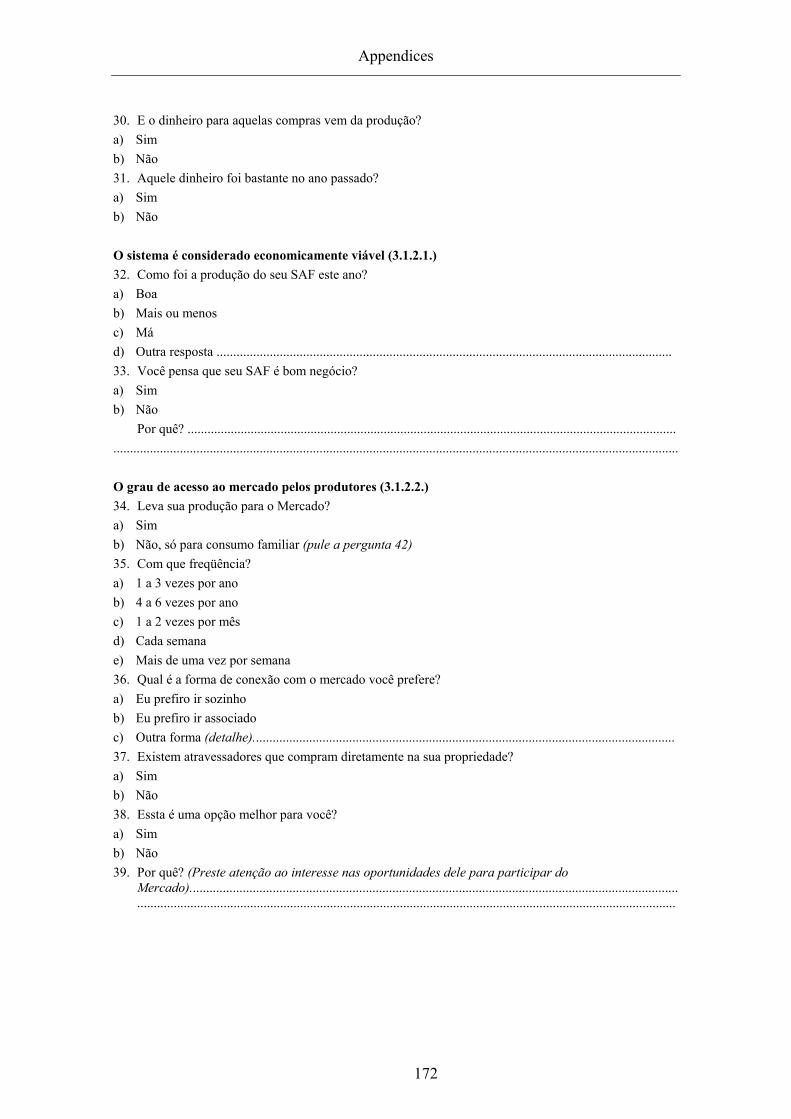
Appendices
172
30. E o dinheiro para aquelas compras vem da produção? a) Sim b) Não 31. Aquele dinheiro foi bastante no ano passado? a) Sim b) Não O sistema é considerado economicamente viável (3.1.2.1.) 32. Como foi a produção do seu SAF este ano? a) Boa b) Mais ou menos c) Má d) Outra resposta ......................................................................................................................................... 33. Você pensa que seu SAF é bom negócio? a) Sim b) Não Por quê? ................................................................................................................................................... .......................................................................................................................................................................... O grau de acesso ao mercado pelos produtores (3.1.2.2.) 34. Leva sua produção para o Mercado? a) Sim b) Não, só para consumo familiar (pule a pergunta 42) 35. Com que freqüência? a) 1 a 3 vezes por ano b) 4 a 6 vezes por ano c) 1 a 2 vezes por mês d) Cada semana e) Mais de uma vez por semana 36. Qual é a forma de conexão com o mercado você prefere? a) Eu prefiro ir sozinho b) Eu prefiro ir associado c) Outra forma (detalhe)............................................................................................................................... 37. Existem atravessadores que compram diretamente na sua propriedade? a) Sim b) Não 38. Essta é uma opção melhor para você? a) Sim b) Não 39. Por quê? (Preste atenção ao interesse nas oportunidades dele para participar do
Mercado).....................................................................................................................................................................................................................................................................................................................

Appendices
173
A diversidade de produtos que os agricultures trazem ao mercado normalmente. (3.1.2.3.) 40. Quais produtos você traz para o Mercado normalmente, - pelo menos uma vez por ano?- (Tente fazer
uma lista que considera a orden de importancia) 1. ..................................................... 2. ..................................................... 3. ..................................................... ☺ 4. ..................................................... 5. ..................................................... 6. ..................................................... ☺ ☺ 7. ..................................................... 8. ..................................................... 9. ..................................................... ☺ ☺ ☺ 41. Gostaria aumentar o numero e a diversidade dos produtos que traze para o mercado? a) Sim b) Não Por quê? ................................................................................................................................................... .................................................................................................................................................................. Há uma atitude de re-investimento no agricultor. (3.1.3.1.) 42. Você re-investe em sua propriedade o dinheiro ganhado pela mesma propriedade? a) Sim b) Não (pule a pregunta 45) 43. Considera importante re-investir na sua propriedade? a) Sim b) Não Por quê? ...................................................................................................................................................
.................................................................................................................................................................. 44. Sempre fez essto? a) Sim b) Não Por quê?.................................................................................................................................................... .................................................................................................................................................................. Os regulamentos normalmente são obedecidos pelos agricultores. (4.1.1.3.) (Pergunte sobre 1. A medida provisória 2166: averbação da mata só pode usar 20% y tem que deixar 80% como reserva) 45. Sobre aquela regra (ou jogo da regras) que você acha? a) É boa b) É má Por quê? ...................................................................................................................................................
.................................................................................................................................................................. 46. Você pensa que estas regras são importantes? a) Sim b) Não Por quê? ...................................................................................................................................................
..................................................................................................................................................................

Appendices
174
47. Você as aplica? a) Sim b) Não (termine a entrevista e agradeca o agricultor) 48. Pensa que seria necessário ter mais desstas regras? a) Sim b) Não c) Outra resposta............................................................................................................................................ Há um impacto real das sugestões dadas pelas instituições aos agricultores. (4.1.3.2.) (Sobre a mesma regra discutida anteriormente) 49. Os benefícios da regra são principalmente para:
(Pode marcar mais da uma opção) a) A pessoa (o agricultor) b) A comunidade c) A região d) O estado e) O país f) Outra resposta........................................................................................................................................... 50. Tem contato com as instituições que apoiam estas regras a) Sim b) Não (termine a entrevista) 51. Pensa que a situação tem melhorado desde que as regras foram projetadas e aplicadas a) Sim b) Não (termine a entrevista) Por quê? ................................................................................................................................................... .................................................................................................................................................................. 52. E feliz? .....................................................................................................................................................
Muito obrigado pela sua colaboração!

Appendices
175
Appendix 3: Workshops guidelines
Definition and validation of indicators
A core element of this approach is the definition and refinement of the criteria and
indicators set; one of the supporting procedures based on the participation of local
experts on their detection, filtering and weighting.
Below the diagram shows the steps and linked activities to them; complementary the
formats cited in the diagram are attached.
Handling working-material: C&I def., C&I set (sheet 1,2)
Description of the approach
Fill formats 1,2 (individually)
Summarize results: fill format 3 (collectively)
Introduction
Formats 1,2
Fill format 4 (collectively)
Discussion
Grouping participants
Participants received an outline
of the project
Analysis, conclusions, suggestions
Format 3
Format 4

Appendices
176
Definição de Critérios e Indicadores
Princípios: "Uma suposição básica que apoia um raciocínio ou uma ação". No contexto de ASF é visto como o vigamento administrando primário.
Critério: "Um aspecto que é considerado importante pelo qual administração de floresta sustentável pode ser avaliada". Os critérios dá os “standards” pelos quais a evolución para atingir os princípios pode ser julgado.
Indicador: "Um atributo quantitativo, qualitativo ou descritivo que periodicamente medido indica a direção da mudança"; indica o estado ou condição requereda pelo critério.
Verificadores: "São os dados ou informações precisadas para avaliar um indicador".
(Mendoza et al., 1999; ITTO, 1998 e Ritchie al de et., 2000 cit. por Prasad, 2002; Prasad, 2002).
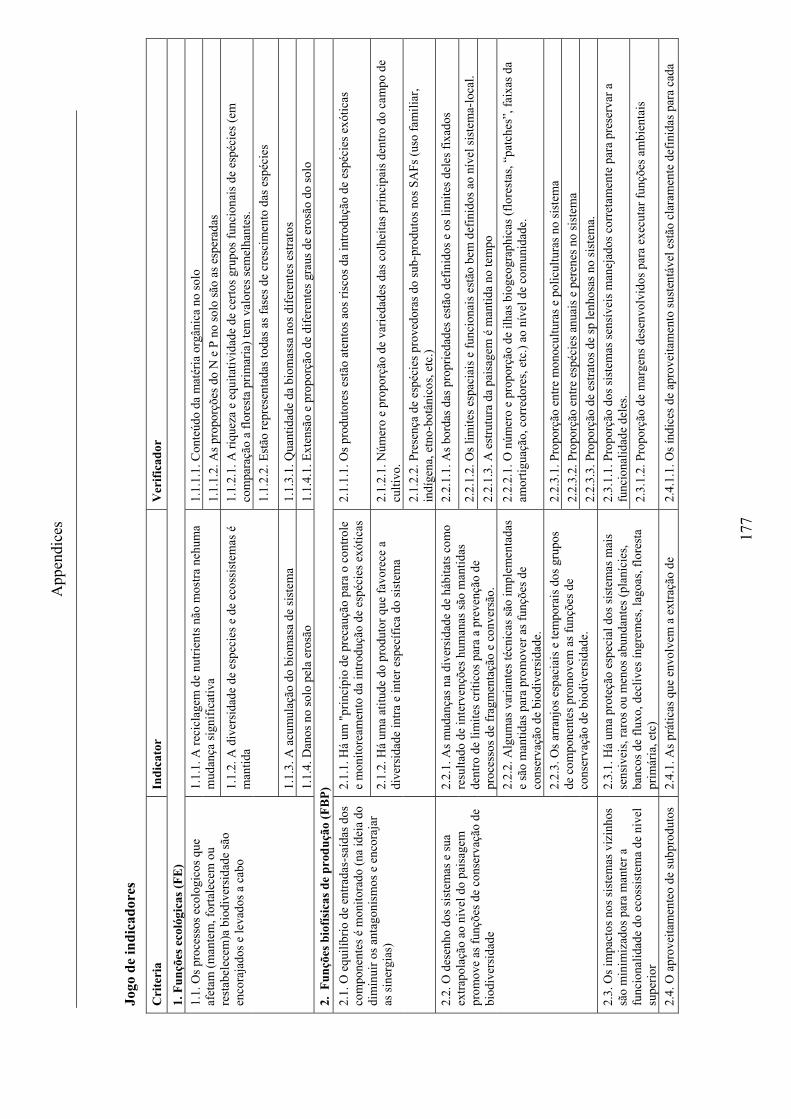
App
endi
ces
177
Jogo
de
indi
cado
res
Cri
teri
a In
dica
tor
Ver
ifica
dor
1. F
unçõ
es e
coló
gica
s (FE
) 1.
1. O
s pro
cess
os e
colo
gico
s que
af
etam
(man
tem
, for
tale
cem
ou
rest
abel
ecem
)a b
iodi
vers
idad
e sã
o en
cora
jado
s e le
vado
s a c
abo
1.1.
1. A
reci
clag
em d
e nu
trien
ts n
ão m
ostra
neh
uma
mud
ança
sign
ifica
tiva
1.
1.1.
1. C
onte
údo
da m
atér
ia o
rgân
ica
no so
lo
1.1.
1.2.
As p
ropo
rçõe
s do
N e
P n
o so
lo sã
o as
esp
erad
as
1.1.
2. A
div
ersi
dade
de
espe
cies
e d
e ec
ossi
stem
as é
m
antid
a
1.1.
2.1.
A ri
quez
a e
equi
tativ
idad
e de
cer
tos g
rupo
s fun
cion
ais d
e es
péci
es (e
m
com
para
ção
a flo
rest
a pr
imar
ia) t
em v
alor
es se
mel
hant
es.
1.1.
2.2.
Est
ão re
pres
enta
das t
odas
as f
ases
de
cres
cim
ento
das
esp
écie
s
1.1.
3. A
acu
mul
ação
do
biom
asa
de si
stem
a 1.
1.3.
1. Q
uant
idad
e da
bio
mas
sa n
os d
ifere
ntes
est
rato
s 1.
1.4.
Dan
os n
o so
lo p
ela
eros
ão
1.1.
4.1.
Ext
ensã
o e
prop
orçã
o de
dife
rent
es g
raus
de
eros
ão d
o so
lo
2. F
unçõ
es b
iofís
icas
de
prod
ução
(FB
P)
2.1.
O e
quilí
brio
de
entra
das-
saíd
as d
os
com
pone
ntes
é m
onito
rado
(na
idei
a do
di
min
uir o
s ant
agon
ism
os e
enc
oraj
ar
as si
nerg
ias)
2.1.
1. H
á um
"pr
incí
pio
de p
reca
ução
par
a o
cont
role
e
mon
itore
amen
to d
a in
trodu
ção
de e
spéc
ies e
xótic
as
2.1.
1.1.
Os p
rodu
tore
s est
ão a
tent
os a
os ri
scos
da
intro
duçã
o de
esp
écie
s exó
ticas
2.1.
2. H
á um
a at
itude
do
prod
utor
que
favo
rece
a
dive
rsid
ade
intra
e in
ter e
spec
ífica
do
sist
ema
2.
1.2.
1. N
úmer
o e
prop
orçã
o de
var
ieda
des d
as c
olhe
itas p
rinci
pais
den
tro d
o ca
mpo
de
culti
vo.
2.1.
2.2.
Pre
senç
a de
esp
écie
s pro
vedo
ras d
o su
b-pr
odut
os n
os S
AFs
(uso
fam
iliar
, in
díge
na, e
tno-
botâ
nico
s, et
c.)
2.2.
O d
esen
ho d
os si
stem
as e
sua
extra
pola
ção
ao n
ivel
do
pais
agem
pr
omov
e as
funç
ões d
e co
nser
vaçã
o de
bi
odiv
ersi
dade
2.2.
1. A
s mud
ança
s na
dive
rsid
ade
de h
ábita
ts c
omo
resu
ltado
de
inte
rven
ções
hum
anas
são
man
tidas
de
ntro
de
limite
s crít
icos
par
a a
prev
ençã
o de
pr
oces
sos d
e fr
agm
enta
ção
e co
nver
são.
2.2.
1.1.
As b
orda
s das
pro
prie
dade
s est
ão d
efin
idos
e o
s lim
ites d
eles
fixa
dos
2.2.
1.2.
Os l
imite
s esp
acia
is e
func
iona
is e
stão
bem
def
inid
os a
o ní
vel s
iste
ma-
loca
l. 2.
2.1.
3. A
est
rutu
ra d
a pa
isag
em é
man
tida
no te
mpo
2.
2.2.
Alg
umas
var
iant
es té
cnic
as sã
o im
plem
enta
das
e sã
o m
antid
as p
ara
prom
over
as f
unçõ
es d
e co
nser
vaçã
o de
bio
dive
rsid
ade.
2.2.
2.1.
O n
úmer
o e
prop
orçã
o de
ilha
s bio
geog
raph
icas
(flo
rest
as, “
patc
hes”
, fai
xas d
a am
ortig
uaçã
o, c
orre
dore
s, et
c.) a
o ní
vel d
e co
mun
idad
e.
2.2.
3. O
s arr
anjo
s esp
acia
is e
tem
pora
is d
os g
rupo
s de
com
pone
ntes
pro
mov
em a
s fun
ções
de
cons
erva
ção
de b
iodi
vers
idad
e.
2.2.
3.1.
Pro
porç
ão e
ntre
mon
ocul
tura
s e p
olic
ultu
ras n
o si
stem
a
2.2.
3.2.
Pro
porç
ão e
ntre
esp
écie
s anu
ais e
per
enes
no
sist
ema
2.2.
3.3.
Pro
porç
ão d
e es
trato
s de
sp le
nhos
as n
o si
stem
a.
2.3.
Os i
mpa
ctos
nos
sist
emas
viz
inho
s sã
o m
inim
izad
os p
ara
man
ter a
fu
ncio
nalid
ade
do e
coss
iste
ma
de n
ivel
su
perio
r
2.3.
1. H
á um
a pr
oteç
ão e
spec
ial d
os si
stem
as m
ais
sens
ivei
s, ra
ros o
u m
enos
abu
ndan
tes (
plan
ície
s, ba
ncos
de
fluxo
, dec
lives
íngr
emes
, lag
oas,
flore
sta
prim
ária
, etc
)
2.3.
1.1.
Pro
porç
ão d
os si
stem
as se
nsív
eis m
anej
ados
cor
reta
men
te p
ara
pres
erva
r a
func
iona
lidad
e de
les.
2.3.
1.2.
Pro
porç
ão d
e m
arge
ns d
esen
volv
idos
par
a ex
ecut
ar fu
nçõe
s am
bien
tais
2.4.
O a
prov
eita
men
teo
de su
bpro
duto
s 2.
4.1.
As p
rátic
as q
ue e
nvol
vem
a e
xtra
ção
de
2.4.
1.1.
Os í
ndic
es d
e ap
rove
itam
ento
sust
entá
vel e
stão
cla
ram
ente
def
inid
as p
ara
cada

App
endi
ces
178
é fe
ito n
uma
base
sust
entá
vel
subp
rodu
tos r
enov
ávei
s (ól
eos,
seiv
as, l
átex
, res
inas
, pr
odut
os e
tnob
otan
icos
, ani
mai
s, et
c.) s
ão fe
itas
cons
ider
ando
suas
qua
lidad
es d
e re
gene
raçã
o.
subp
rodu
to e
spec
ífico
.
2.4.
1.2.
A re
gene
raçã
o da
s esp
écie
s pro
vedo
ras n
ão é
dim
inuí
da.
2.5.
A a
dmin
istra
ção
técn
ica
do si
stem
a é
feita
num
a ba
se su
sten
táve
l.
2.5.
1. A
ero
são
do so
lo é
cor
reta
men
te m
anej
ada.
2.
5.1.
1. S
ão d
esen
volv
idas
prá
ticas
de
cons
erva
ção
que
tom
am c
uida
do d
a er
osão
do
solo
2.5.
2. O
pro
cess
o de
pro
duçã
o é
corr
etam
ente
m
anej
ado.
2.
5.2.
1. O
s agr
icul
tore
s têm
con
heci
men
to té
cnic
o su
ficie
nte
sobr
e o
dese
nho
do si
stem
a.
2.5.
2.2.
Os a
gric
ultu
res a
plic
am té
cnic
as, t
rata
men
tos e
mét
odos
de
baix
o-im
pact
o, p
ara
man
ter o
s rec
urso
s e re
ndim
ento
s.
2.5.
2.3.
São
leva
das a
cab
o m
edid
as p
ara
o au
men
to d
e re
ndim
ento
s agr
ícol
as
2.5.
3. H
á um
pro
cedi
men
to d
e re
troal
imen
taçã
o pa
ra
enfr
enta
r o m
anej
o do
s dan
os a
mbi
enta
is.
2.5.
3.1.
O p
lano
de
adm
inis
traçã
o m
udou
nos
últi
mos
5 a
nos p
ara
se a
dapt
ar a
s var
iaçõ
es
ambi
enta
is.
3. F
unçõ
es so
cioe
conó
mic
as d
e pr
oduç
ão (F
SP)
3.1.
As a
tivid
ades
de
prod
ução
dos
si
stem
as d
ever
iam
se e
sfor
çar p
ara:
1ª
segu
ranç
a al
imen
tar,
2ª v
iabi
lidad
e ec
onôm
ica
(ingr
esso
s sup
lem
enta
rios)
e
3º a
sseg
urar
os i
nves
timen
tos p
ara
man
ter a
pro
duçã
o bi
ofís
ica.
3.1.
1. A
segu
ranç
a al
imen
taria
é b
em m
antid
a.
3.1.
1.1.
Par
te d
o in
gres
so in
vest
ido
no c
ompr
a de
com
ida.
3.
1.2.
Há
uma
atitu
de d
os a
gric
ultu
res p
ara
a di
vers
ifica
ção
da p
rodu
ção
e ac
esso
ao
mer
cado
3.
1.2.
1. O
sist
ema
é co
nsid
erad
o ec
onom
icam
ente
viá
vel
3.1.
2.2.
O g
rau
de a
cess
o ao
mer
cado
pel
os p
rodu
tore
s 3.
1.2.
3. A
div
ersi
dade
de
prod
utos
que
os a
gric
ultu
res t
raze
m a
o m
erca
do n
orm
alm
ente
. 3.
1.3.
O si
stem
a é
retro
alim
enta
do p
ara
man
ter s
eu
níve
l de
prod
ução
em
niv
eis a
ceitá
veis
. 3.
1.3.
1. H
á um
a at
itude
de
re-in
vest
imen
to n
o ag
ricul
tor.
4. F
unçõ
es o
pera
cion
ais (
FO)
4.1.
Há
um p
lano
de
adm
inis
traçã
o da
pa
isag
em a
just
ado
às c
ircun
stân
cias
am
bien
tais
, soc
iais
e e
conô
mic
as.
4.1.
1. H
á re
gula
men
tos i
nstit
ucio
nais
sobr
e as
at
ivid
ades
de
prod
ução
e su
as im
plic
açõe
s am
bien
tais
.
4.1.
1.1.
Há
uma(
s) in
stitu
ição
técn
ica
resp
onsá
vel p
ara
mon
itora
r os d
anos
am
bien
tais
de
vido
as a
tivid
ades
pro
dutiv
as.
4.1.
1.2.
Há
um jo
go d
e re
gula
men
tos s
obre
os d
anos
am
bien
tais
dev
idos
as a
tivid
ades
pr
odut
ivas
. 4.
1.1.
3. O
s reg
ulam
ento
s nor
mal
men
te sã
o ob
edec
idos
pel
os a
gric
ulto
res.
4.1.
1.4.
Há
uma
retro
alim
enta
ção
inst
ituci
onal
bas
eada
em
fund
os c
ient
ífico
s e té
cnic
os
para
def
inir
as e
stra
tégi
as d
e aç
ão.
4.1.
2. H
á um
ince
ntiv
o in
stitu
cion
al p
ela
dive
rsifi
caçã
o da
eco
nom
ia lo
cal,
evita
ndo
a de
pend
ênci
a de
um
úni
co p
rodu
to o
u po
ucos
.
4.1.
2.1.
A d
iver
sific
ação
da
prod
ução
é e
ncor
ajad
a pe
los n
ívei
s org
aniz
acio
nais
e
inst
ituci
onai
s. 4.
1.2.
2. H
á um
a de
man
da lo
cal d
os su
bpro
duto
s que
vêm
dos
SA
Fs
4.1.
3. H
á um
sist
ema
de m
onito
ram
ento
da
pais
agem
, co
nsis
tent
e e
repr
oduz
ible
no
tem
po p
ara
perm
itir
com
para
ções
.
4.1.
3.1.
Há
um si
stem
a de
map
eam
ento
din
âmic
o qu
e pe
rmite
reco
nheç
er e
faci
litar
o
man
ejo
de li
mite
s fís
icos
, uso
atu
al d
a te
rra,
funç
ões d
e pr
oduç
ão, e
tc.
4.1.
3.2.
Há
um im
pact
o re
al d
as su
gest
ões d
adas
pel
as in
stitu
ções
aos
agr
icul
tore
s.

Appendices
179
Formato 1. Avaliação individual de indicadores3,4 C
lase
In
dica
dor
Cha
ve
O objetivo é alcançado
direito e sem dúvidas (1-5) 5
O indicador é fácil do aplicar,
registrar e interpretar
(1-5)
O indicador provê duma
medida integral e resumida
(1-5)
O indicador é adequado a
uma gama da mudanças do nivel do stress
(1-5)
O indicador é importante e
prioritario (sim = 1 não = 0)6
Fu
nç.õ
es
am
bien
tais
F
unçõ
es b
iofís
icas
F.
soc-
ec.
F.op
er.s
3 Considere-se os seguites pontos definição dos items:
- É um indicador pertinente para a região? - É um indicador pertinente para a avaliação da sostenibilidade? - Há outro indicador que seja melhor para expressar o criterio ou indicador? - É possivel sugerir limites superiores e inferiores para o indicador analisado?
4 Dê preferência aos: - Indicadores fáciles de medir e de entender - Indicadores integradores vs. os mais detalhados
5 1=Pobre, 2=Justo, 3=Satisfatório, 4=Bom, 5=Muito bom 6 0=Não aceito para avaliações posteriores, 1=Aceito para avaliações posteriores

Appendices
180
Formato 2. Avaliação individual de verificadores C
lase
Indi
cado
r
Ver
ifica
dor
Cha
ve
O objetivo é alcançado
direito e sem dúvidas7
O verificador é facil de aplicar,
registrar e interpretar
O verificador provê duma
medida integral e resumida
O verificador é adequado a uma gama de mudanças no nível de stress
Média
Funç
ões
ambi
enta
is
1.1.1. 1.1.1.1. 1 1.1.1.2. 2
1.1.2. 1.1.2.1. 3 1.1.2.2. 4
1.1.3. 1.1.3.1. 5 1.1.4. 1.1.4.1. 6
Funç
ões b
iofís
icas
2.1.1. 2.1.1.1 7
2.1.2. 2.1.2.1 8 2.1.2.2 9
2.2.1. 2.2.1.1 10 2.2.1.2 11 2.2.1.3 12
2.2.2. 2.2.2.1 13
2.2.3. 2.2.3.1. 14 2.2.3.2. 15 2.2.3.3. 16
2.3.1. 2.3.1.1. 17 2.3.1.2. 18
2.4.1. 2.4.1.1. 19 2.4.1.2. 20
2.5.1. 2.5.1.1. 21
2.5.2. 2.5.2.1. 22 2.5.2.2. 23 2.5.2.3. 24
2.5.3. 2.5.3.1. 25
Funç
ões s
oc-
econ
.
3.1.1. 3.1.1.1. 26
3.1.2. 3.1.2.1. 27 3.1.2.2. 28 3.1.2.3. 29
3.1.3. 3.1.3.1. 30
Funç
ões o
pera
cion
ais
4.1.1.
4.1.1.1. 31 4.1.1.2. 32 4.1.1.3. 33 4.1.1.4. 34
4.1.2. 4.1.2.1. 35 4.1.2.2. 36
4.1.3. 4.1.3.1. 37 4.1.3.2. 38
7 1=Pobre, 2=Justo, 3=Satisfatório, 4=Bom, 5=Muito bom

Appendices
181
Formato 3. Consolidação das avaliaçãos individuais dos verificadores das funções ambientais
Score
Verif.
1 2 3 4 5 6 7 8 9 10 11 12 13 14 15 χ
1
2 3 4 5 6

App
endi
ces
18
2
Form
ato
4. A
valia
ção
cole
tiva
dos v
erifi
cado
res d
as fu
nçõe
s am
bien
tais
Clase
Verificador
Chave
Ava
liaçã
o
Dis
cuss
ão (i
tem
s cha
ve)
O v
erifi
cado
r é im
porta
nte
e p
riorit
ario
(s
im =
1, n
ão =
0)
☺ (v
erde
) (v
erm
elho
)
Funções ambientais
1.1.
1.1.
- - -
- - -
1.1.
1.2.
- - -
- - -
1.1.
2.1.
- - -
- - -
1.1.
2.2.
- - -
- - -
1.1.
3.1.
- - -
- - -
1.1.
4.1.
- - -
- - -

12 ACKNOWLEDGEMENTS
This dissertation has been done with the sponsorship of the German government
through the German Academic Exchange Service (DAAD) and the Federal Ministry for
Economic Cooperation and Development (BMZ). I want to thank here to Ms Brigitt
Skailes, our DAAD counterpart, for her continuous support; and to the German people
in general.
Academically (and personally), I am obliged to Dr. Manfred Denich, his
patient academic support and exceptional human quality were fundamental for finishing
this dissertation. My gratitude as well to Prof. Paul Vlek, Director of the Department of
Ecology and Resource Management at ZEF and Prof. Marc Janssens of the Institute of
Horticulture of the University of Bonn, both supervisors of this study. I am also grateful
to Dr. Ravi Prabhu of the Center for International Forestry Research (CIFOR) for his
early advising concerning the criteria and indicators approach, to Dr. Guido Lüchters for
his advising in Statistics, and to Christine Wooda for sharing her advances in the
Amazonian indicators definition.
The logistical and academic conditions in Germany were provided mainly by
the Center for Development Research (ZEF) and the University of Bonn. I want to
express my gratitude to Dr. Günter Manske coordinator of the Bonn International
Graduate School (BIGS) and especially to Mrs. Rosemarie Zabel, (the kindest Fairy of
us, bunch of confused foreigners in Bonn). I also thank Dr. Kashyapa Yapa and Ms.
Margaret Jend’s efforts for editing my writing, and Sabine Aengenendt-Baer,
Bernadette Olderdissen, Doris Fuß and Miriam Schneider of ZEF c secretariat for their
always polite assistance.
In Brazil, I have to thank to the Eastern Amazon office of the Brazilian
Agricultural and Cattle-Breeding Research Company (EMBRAPA-CPATU) for the
chance of working under its professional and logistical framework. To Dr. Osvaldo
Kato and his team at the Tipitamba project: Socorro(+), Celinha, Valdirene, Eliana,
Paulo, (…), for their hospitality and logistical support; to The Mixed Agricultural
Cooperative of Tomé-Açú (CAMTA) through his technical leader Jailson Takamatsu,
for sharing his database and support on contacting the farmers integrants of the sample;
to Klinger Costa Cruz of the state of Acre representation in Brasilia, for contacting me
with the heads of the Ministry of Environment; to Dr. Shigeo Shiki and Shirley Mendes
of the Brazilian Ministry of Environment for sharing with me the Proambiente internal
guidelines; to Dr. Pedro Marques of the Luiz de Queiroz College of Agriculture
(ESALQ) for smoothing my agenda in Piracicaba; to Mr. Michinori Konagano of the
secretariat of agriculture of Tomé-Açú for his gracious Brazilian-Japanese good offices,
and to the Planning and Rural Technical Assistance Office (PLANTAR) in Tomé-Açú
through Cosmo Ferreira, Socorro, Selma, (…) for their help in detecting small
agroforesters and their always pertinent advising. I am especially thankful to my field
team, Edilene Santana de Oliveira, Ivanildo Santana de Oliveira, Luiz dos Santos
Rodrigues and Antonio de Castro Rocha, their talent, professionalism and good will
were determinant for the completion of the field-phase.
Personally, I was lucky of having the emotional support of many people,
starting with my dearest Denisa Alexandroaiei who took care of me almost all the time;
also during the Brazilian stage my gratitude goes to my ‘muy/muito’ queridos Eugenia
and Lucivaldo for their overwhelming human quality and adopting me for one full year!
At ZEF I have to name my fair ladies: Adelina Mensah, Xiao Meng-Shen, Hong Ching
Goh and Carme Costa; and my colleague-friends: Miguel Ángel Alva and Roswitha
Wyrwich, René Redondo, Irit Eguavoen, Carlos Nupia, Iván Velásquez, Javier Puig,
Makarius Mdemu, René Capote, Israt Rayhan and Nayeem Sultana, Inna Rudenko,
Andrea Dörr, Seid Nuru, Dahlia Hassan, Jackie Garcia and Felipe Carreras, Anabelle
Ragsag, Renata Saizaki, Ellen Pfeiffer, Paul Guthiga, Thorsten Arnold (...); and outside
ZEF, my friends Viola Teschner, Roderick Debück, Marvin Acurio and Catrinel
Berindei, Suni Terre, Monika Driller, Ana Saldaña, Stéphanie Cassilde, Astrid Möller,
Lisa Lernborg, Karun Thanjavur, Nodoka Yanagisawa, Ilyas Siddique, Antti Seelaf,
Raquel Poça, Marinho (...),
Last but not least, I have to thank to the local farmers of Miritipitanga:
Francisco Madeira de Arruda, Bacilio Victorio Lopes, Laerce Correia Ferreira,
Waldecir Mendes de Freitas, Paulo Vidal dos Santos, Eliesio de Aruda, Francisco
Ferreira Sombrinho, Roseni Brasil Mendes, Odenir da Silva Lima, Antonio Pereyra
Pinto, Daniel Lopes da Silva, Jose Carlos Ferreira Macedo, Antonio Jose Oliveira,
Helena da Silva, M. Reis, Antonio Ferreira Magalhães, Jose Denílson, Antonio da Silva;
in Tropicália: Reginaldo Deniche

da Silva, Francisco de Asis Carvalho, Miguel Reis Pereira, Severino dos Santos
Nascimento, Bernardino Dos Santos Nascimento, Gerson da Silva Gonçalves, Jose
Pereira Dultra, Floriano Goncalves Macil, Mazoniel das Gracas Francas, Ailton de
Aguino Maciel, Raimundo Borges Pereira; in Igapú-Açú: Maria Helena Santana de
Oliveira, Manuel Valente Jilgueira, Antonio Gaspar de Oliveira, Carlos Ribeiro de
Oliveira, Antonio Carlos Gomes, Luiz Xavier de Oliveira; in Forquilla: Reginaldo da
Silva, Manoel Antonio de Carvalho, Miguel Carlos Barroso da Silva, Claudionor
Barroso da Silva, Raimundo Eraldo Barroso da Silva, Francisco Araujo Nascimento,
Geraldo Araujo Santos, Bernardo Batista Costa, Jose Silva Sanches, Valdenis Gomes de
Oliveira, Natal da Silva Sanches, Raimundo Ed Junior Barbosa de Oliveira, Tereza
Cristina Barroso da Silva; and the CAMTA partners: Valter Oppata, Jorge Ito,
Toshihiko Takamatsu, Motoshi Endo Takada, Kozaburo Mineshita, Noboru Sacaguchi,
Noriaki Arai, Koji Konagano, Tamyo Ito, Edegar Sasahara, Shigo Takahashi, Seika
Takaki, Koji Inada, Ryuemon Yokoyama, Ke-ichi Oppata, Yoichi Inada, Silvio Shibata,
Flavio Yoshimura, Eduardo Uwamori, Michinori Konagano, Antonio Destro, Minoru
Konagano and Yukio Eikawa for allowing us working in their homes and their
hospitality.
Finally, I am due to my parents Hilda and Waldo and my little sister Hildita,
for everything.
