ecological risk assessment of pelagic sharks caught in ... · ecological risk assessment of pelagic...
TRANSCRIPT

Aquat. Living Resour. 23, 25–34 (2010)c© EDP Sciences, IFREMER, IRD 2009DOI: 10.1051/alr/2009044www.alr-journal.org
AquaticLivingResources
Ecological risk assessment of pelagic sharks caught in Atlanticpelagic longline fisheries
Enric Cortés1,a, Freddy Arocha2, Lawrence Beerkircher3, Felipe Carvalho4, Andrés Domingo5,Michelle Heupel6, Hannes Holtzhausen7, Miguel N. Santos8, Marta Ribera1 and Colin Simpfendorfer9
1 National Oceanographic and Atmospheric Administration, National Marine Fisheries Service, Southeast Fisheries Science Center,Panama City Laboratory, 3500 Delwood Beach Road, Panama City, Florida 32408, USA
2 Instituto Oceanográfico de Venezuela, Universidad de Oriente, Cumaná 6101, Venezuela3 National Oceanographic and Atmospheric Administration, National Marine Fisheries Service, Southeast Fisheries Science Center, Miami,
Florida 33149, USA4 University of Florida, Department of Fisheries and Aquatic Sciences, Florida Program for Shark Research, Gainesville, Florida 32653, USA5 DINARA, Area de Recursos Pelágicos, CP 11200 Montevideo, Uruguay6 School of Earth and Environmental Sciences, James Cook University, Queensland 4811, Australia7 Ministry of Fisheries and Marine Resources, Namibia8 INRB I.P./IPIMAR, 8700-305 Olhão, Portugal9 Fishing and Fisheries Research Centre, School of Earth and Environmental Sciences, James Cook University, Queensland 4811, Australia
Received 18 April 2009; Accepted 16 June 2009
Abstract – An ecological risk assessment (ERA; also known as productivity and susceptibility analysis, PSA) wasconducted on eleven species of pelagic elasmobranchs (10 sharks and 1 ray) to assess their vulnerability to pelagiclongline fisheries in the Atlantic Ocean. This was a level-3 quantitative assessment consisting of a risk analysis toevaluate the biological productivity of these species and a susceptibility analysis to assess their propensity to captureand mortality in pelagic longline fisheries. The risk analysis estimated productivity (intrinsic rate of increase, r) us-ing a stochastic Leslie matrix approach that incorporated uncertainty in age at maturity, lifespan, age-specific naturalmortality and fecundity. Susceptibility to the fishery was calculated as the product of four components, which werealso calculated quantitatively: availability of the species to the fleet, encounterability of the gear given the species ver-tical distribution, gear selectivity and post-capture mortality. Information from observer programs by several ICCATnations was used to derive fleet-specific susceptibility values. Results indicated that most species of pelagic sharkshave low productivities and varying levels of susceptibility to pelagic longline gear. A number of species were groupednear the high-risk area of the productivity-susceptibility plot, particularly the silky (Carcharhinus falciformis), short-fin mako (Isurus oxyrinchus), and bigeye thresher (Alopias superciliosus) sharks. Other species, such as the oceanicwhitetip (Carcharhinus longimanus) and longfin mako (Isurus paucus) sharks, are also highly vulnerable. The blueshark (Prionace glauca) has intermediate vulnerability, whereas the smooth hammerhead (Sphyrna zygaena), scal-loped hammerhead (Sphyrna lewini), and porbeagle (Lamna nasus) sharks are less vulnerable, and the pelagic stingray(Pteroplatytrygon violacea) and common thresher (Alopias vulpinus) sharks have the lowest vulnerabilities. As a group,pelagic sharks are particularly vulnerable to pelagic longline fisheries mostly as a result of their limited productivity.
Key words: Ecological risk assessment / Leslie matrix / Shark life history / Vulnerability / Pelagic fisheries
Résumé – Une évaluation des risques écologiques (ERA) et/ou analyse de productivité – sensibilité/vulnérabilité(PSA), pour les pêcheries capturant plusieurs espèces, est mise en œuvre pour douze espèces d’Elasmobranches péla-giques (10 requins et une raie) afin d’estimer leur vulnérabilité à la pêche à la palangre en Atlantique. Trois approchesd’évaluation quantitative consistant en une analyse de risque pour évaluer la productivité biologique de ces espèces,l’analyse de leur vulnérabilité à la capture et leur mortalité lors de ces pêches hauturières à la palangre. Les analyses derisques estiment la productivité (taux de croissance intrinsèque de la population, r) en utilisant une matrice stochastiquede Leslie et en incorporant une incertitude au niveau de l’âge à la maturité sexuelle, la durée de vie, l’âge à la mortaliténaturelle et la fécondité. La vulnérabilité à la pêche est calculée comme le produit de 4 composantes, qui sont également
a Corresponding author: [email protected]
Article published by EDP Sciences

26 E. Cortés et al.: Aquat. Living Resour. 23, 25–34 (2010)
calculées : disponibilité de l’espèce à la flottille, à la rencontre de l’engin de pêche d’après la répartition verticalede l’espèce, la sélectivité de l’engin de pêche et la mortalité après capture. Des informations des observateurs de laCommission internationale pour la Conservation des Thonidés (ICCAT) chargés du suivi des programmes de plusieurspays sont utilisées pour en déduire la valeur de vulnérabilité spécifique à chaque flottille. Les résultats indiquent que laplupart des espèces de requins pélagiques ont une faible productivité et des niveaux divers de vulnérabilité aux palangreshauturières. Un certain nombre d’espèces sont groupées près de la zone de haut risque de productivité-vulnérabilité,en particulier le requin soyeux (Carcharhinus falciformis), le requin taupe bleu (Isurus oxyrinchus), et le requin renardà gros yeux (Alopias superciliosus). D’autres espèces telle que le requin océanique (Carcharhinus longimanus) etpetite taupe (Isurus paucus), sont aussi très vulnérables. Le requin peau bleue (Prionace glauca) a une vulnérabilitéintermédiaire tandis que le requin-marteau commun (Sphyrna zygaena), le requin-marteau halicorne (Sphyrna lewini),et le requin-taupe commun (Lamna nasus) sont moins vulnérables ; la raie pélagique (Pteroplatytrygon violacea) etle requin renard (Alopias vulpinus) ont les plus faibles vulnérabilités. En tant que groupe, les requins pélagiques sontparticulièrement vulnérables à la pêche hauturière à la palangre, principalement due à leur productivité limitée.
1 Introduction
Ecological risk assessment (ERA), also known as produc-tivity and susceptibility analysis (PSA), is a tool that can beused to evaluate the vulnerability of a stock to becoming over-fished, based on its biological productivity and susceptibilityto the fishery or fisheries exploiting it. Its most practical use isto help management bodies identify the stock(s) that are mostvulnerable to overfishing so that they can monitor and assessmanagement measures to protect the viability of these stocks.ERA can also be used to prioritize research efforts by focus-ing on species with high susceptibility about which we havelittle biological information, or by identifying and excludingspecies with low vulnerability from data-intensive assessments(Braccini et al. 2006).
The approach is flexible because it can be undertaken atdifferent levels (qualitative or level 1, semi-quantitative orlevel 2, and quantitative or level 3) according to the degreeof data availability (Hobday et al. 2007), and results can eas-ily be presented as X-Y scatter plots. Several studies have ap-plied this methodology, mostly to bycatch species for whichbiological and fishery information is often sparse (Stobutzkiet al. 2002; Milton 2001), but in at least one case a quantita-tive (level-3) approach was used for a shark species (Bracciniet al. 2006). The methodology has also been recommended foruse by several entities, including the Australian Fisheries Man-agement Authority (Hobday et al. 2007, Smith et al. 2007),Lenfest Working Group (Rosenberg et al. 2007), the Inter-national Commission for the Conservation of Atlantic Tu-nas (ICCAT) Ecosystems Working Group (ICCAT 2008), andthe United States National Oceanographic and AtmosphericAdministration. Currently, it is also being applied to Atlanticcoastal shark species (Cortés et al. 2008).
The purpose of the present study was to provide a rangeof vulnerabilities for the most important pelagic shark speciessubject to ICCAT surface longline fisheries in the AtlanticOcean. Given the paucity of data series on catch and effort nec-essary to conduct analytical stock assessments and our uncer-tainty about these data for many of these species, this approachcan be used to identify those species which are more, or less, atrisk. We applied a fully quantitative analysis because biologi-cal information was sufficient to estimate a direct measure ofproductivity (r, the intrinsic rate of population increase). Ad-ditionally, susceptibility was estimated using Walker’s (2004)approach, where it is expressed as the product of four con-
ditional probabilities (availability, encounterability, selectivityand post-capture mortality).
2 Materials and methods
2.1 Productivity
Productivity, expressed through the intrinsic rate of pop-ulation increase (r), was estimated through a Leslie matrixapproach (Caswell 2001). Models were age-structured, basedon a birth-pulse, prebreeding census (i.e., in the Leslie ma-trix, each element in the first row is expressed as Fx = mx p0,where p0 is the probability of survival of age-0 individualsand mx is the number of female offspring produced annuallyby a female of age x), and a yearly time step applied to fe-males only. Life history variables were obtained from a ded-icated shark life history database maintained by the first au-thor (references used are available upon request). Uncertaintyin life history variables (age at maturity, maximum age, age-specific fecundity and age-specific survival) was incorporatedthrough Monte Carlo simulation by randomly drawing valuesfrom assumed statistical distributions for each of these vari-ables. Typically, age at maturity (α) was represented by a tri-angular distribution with the likeliest value set equal to thatreported in the literature, and upper and lower bounds set to±1 or more years. Maximum age (ω) was represented by alinearly decreasing distribution scaled to 1, wherein the high-est empirical value of lifespan reported in the literature wasgiven the likeliest (maximum) value, and the minimum valuewas set by arbitrarily adding 30% to the likeliest value (Cortés2002). Fecundity at age was generally represented by a nor-mal distribution, with mean and standard deviation obtainedfrom the literature, and further truncated with lower and up-per bounds set to the minimum and maximum litter sizes re-ported. A 1:1 female to male ratio was used in all cases and,due to the lack of maturity ogives in most cases, the propor-tion of mature females at age was assumed to be zero for ages0 to α − 1, 0.5 for α, and 1 for ages α + 1. A one-year timelapse was allowed, to account for the fact that females haveto mate and gestate after becoming mature and before con-tributing offspring to the population. Fecundity at age was fur-ther divided by the length of the reproductive cycle (i.e., bian-nual, annual, biennial or triennial). The probability of annual

E. Cortés et al.: Aquat. Living Resour. 23, 25–34 (2010) 27
survival at age was represented by a linearly increasing dis-tribution, in which the lower and upper bounds were set tothe minimum and maximum values estimated from six indi-rect life history methods (see Cortés 2002, 2004; Simpfendor-fer et al. 2004 and references therein for details). Giving thehighest probability to the highest estimates of survival at agewas intended to simulate a compensatory density-dependentresponse. The productivity estimates obtained with this ap-proach should, thus, be regarded as maximum values. The val-ues of r reported and used in the ERA/PSA are the median of10 000 iterations. Approximate 95% confidence intervals arealso reported as the 2.5th and 97.5th percentiles.
2.2 Susceptibility
Susceptibility, in this case a measure of the potential im-pact of surface pelagic longline fisheries, can be expressed asthe product of four conditional probabilities: availability, en-counterability, selectivity, and post-capture mortality (Walker2004). Availability is the probability that the fleet will inter-act with the stock on the horizontal plane; encounterability isthe probability that one unit of fishing effort will encounter theavailable stock; selectivity is the probability that the encoun-tered population is actually captured by the fishing gear; andpost-capture mortality is the probability that the fraction of thepopulation captured dies as a result of its interaction with thegear.
Availability was estimated as the proportion of the spatialdistribution of the fleet that overlaps that of the stock. Spatialeffort distribution of pelagic longlines was available as the totalnumber of observed hooks for a number of ICCAT flags for theperiod 1950-2005 (H. Arrizabalaga, ICCAT Sub-Committeeon Ecosystems, February 2008, pers. comm.). Additionally, ef-fort data for Uruguay was provided by the scientific observerprogram of their tuna fleet for 1998-2007. Species distribu-tions were made available by the International Union for theConservation of Nature (IUCN; Global marine species assess-ment distribution maps). Both effort and species distributiondata were summarized on 5◦ × 5◦ grids.
We initially attempted to estimate encounterability as thedegree of overlap between the depth distribution of the stockand that of the hooks, but because of the paucity of informa-tion on depth preferences of pelagic sharks and the variabilityof the depths at which pelagic longline gear is deployed basedon target species and other factors, we assigned an encounter-ability value of 1 whenever the depth distributions of the stockand fishing gear overlapped. Information on species verticaldistribution was obtained from various published and ongoing(and as yet unpublished) studies using archival satellite tags,whereas pelagic longline gear depth came from informationcollected in scientific observer programs by pelagic longlinefleets of the USA, Venezuela, Brazil, Uruguay, Portugal andNamibia.
Measures of selectivity are also very rare for pelagic sharksand necessarily vary with animal size. Hence, we estimatedselectivity by 1) determining the size range of animals caughtin the fishery from the corresponding scientific observer pro-gram, 2) transforming the stable age distribution obtained
from the Leslie matrix (an output of the productivity analy-sis, see Sect. 2.1) into a length distribution using publishedvon Bertalanffy growth function parameter estimates for eachspecies, and 3) summing the frequencies of the “stable lengthdistribution” covering the range of lengths observed caught in(1). Post-capture mortality was calculated as the sum of theproportions of animals retained and discarded dead from scien-tific observer programs. For the US observer program we werealso able to estimate the proportion of animals that would die,out of those whose disposition was designated as “lost” (cryp-tic mortality), by applying the observed proportion of dead an-imals upon gear retrieval.
As originally conceived (Walker 2004), this method of es-timating catch susceptibility assigns arbitrary risk categories(e.g., low, moderate, high) to each of the four attributes, whichare then given a corresponding categorical value (e.g., 0.33,0.66, and 1.00). Instead, we calculated a probability valueranging between 0 and 1 for each of them, as described above.
2.3 Analysis
We included eleven species of pelagic elasmobranchs inour analysis: blue (Prionace glauca; BSH), shortfin mako(Isurus oxyrinchus; SMA), longfin mako (Isurus paucus;LMA), bigeye thresher (Alopias superciliosus; BTH), com-mon thresher (Alopias vulpinus; ALV), oceanic whitetip (Car-charhinus longimanus; OCS), silky (Carcharhinus falciformis;FAL), porbeagle (Lamna nasus; POR), scalloped hammerhead(Sphyrna lewini; SPL), and smooth hammerhead (Sphyrna zy-gaena; SPZ) sharks, and the pelagic stingray (Pteroplatytrygonviolacea; PST). We did not include the crocodile shark (Pseu-docarcharias kamoharai) because the biological informationavailable was insufficient to allow a Leslie matrix approachto be used with this species. It could be evaluated at a lowerERA level but the results would not be directly comparable tothose reported herein. Also, although longfin mako and smoothhammerhead sharks were included in the analysis, the qualityand extent of the biological information available for these twospecies were considerably lower than those available for theother species, particularly for longfin makos, for which pro-ductivity was set equal to that of shortfin makos.
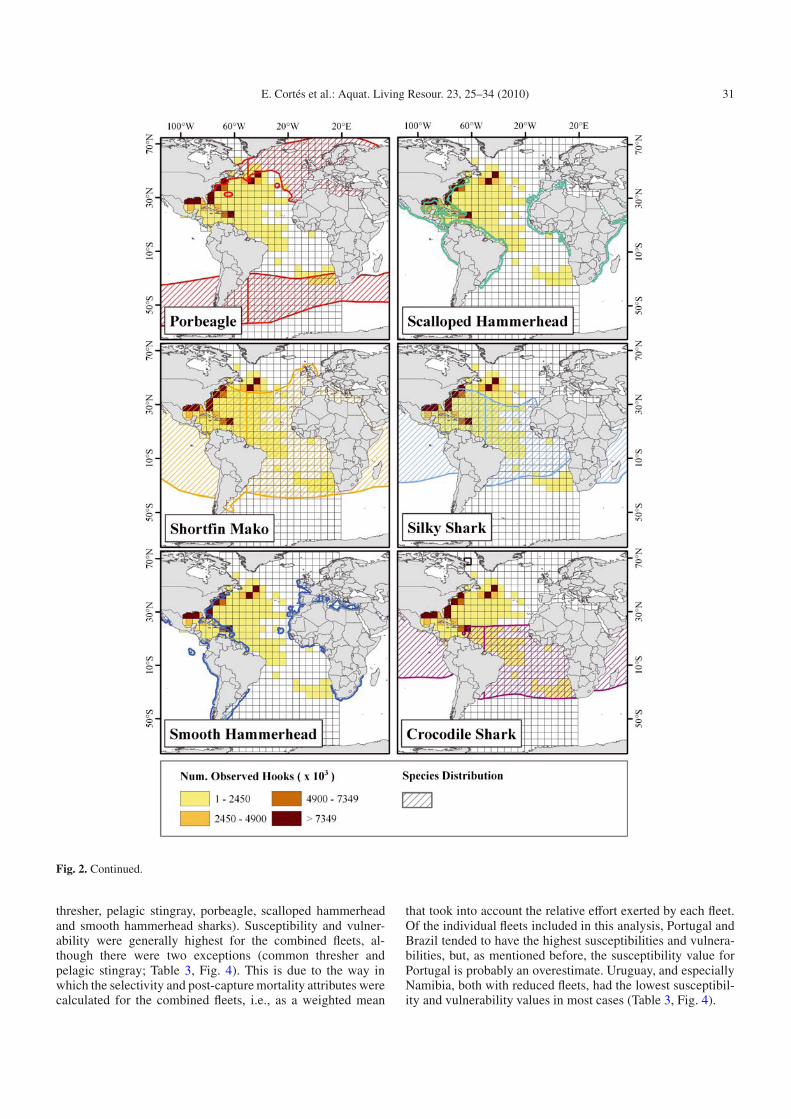
The susceptibility analysis was conducted separately forseveral fleets for which information from observer programswas made available. Thus, we conducted analyses for fleetsfrom the USA, Venezuela, Brazil, Uruguay, Portugal, andNamibia and on all fleets combined. Because the spatial ef-fort distribution for Portugal was not available, we used thatof Spain as a proxy, but the value of availability for Por-tugal is probably an overestimate because this fleet is fivetimes smaller than its Spanish counterpart (MS, unpublisheddata, Fig. 1). The availability value for all fleets combinedincluded spatial effort distribution for eighteen fleets (Belize,Brazil, China, Taiwan, Cuba, Cyprus, Spain, Greece, Japan,Korea, Mexico, Namibia, Panama, South Africa, Uruguay,USA, Vanuatu, and Venezuela and a collection of several smallfleets). As an example, the spatial distribution of the elevenspecies included in the analysis (and that of the crocodileshark) in relation to the effort distribution of the USA pelagiclongline fleet is shown in Figure 2.

28 E. Cortés et al.: Aquat. Living Resour. 23, 25–34 (2010)
Fig. 1. Effort (number of observed hooks) distribution for the USA, Venezuela, Brazil, Uruguay, Spain, Namibia, and all fleets combined.
The value of post-capture mortality for Portugal was themean of those for the Equatorial Area and Northeastern At-lantic fleets, which tended to be identical. Similarly, the rangeof lengths observed by the Portuguese observer program ac-counted for both the Equatorial Area and Northeastern Atlanticfleets. The values of selectivity and post-capture mortality forthe analysis with all fleets combined were the means of valuesfor the individual fleets weighted by the effort (total numberof observed hooks) for each fleet. For the Portuguese fleet, thetotal number of observed hooks corresponding to the Spanishfleet was divided by five to account for the smaller size of thePortuguese fleet.
Vulnerability (v), a measure of the extent to which the im-pact of a fishery on a species will exceed its biological abilityto renew itself (Stobutzki et al. 2002), was calculated as theEuclidean distance from the focal point (r = 0, s = 1), or
v =
√(p − 0)2 + (s − 1)2, in the productivity (p) and suscepti-
bility (s) scatter plot and the values were ranked.
3 Results
According to this analysis, most species of pelagic sharkhave low productivity and variable levels of susceptibility to

E. Cortés et al.: Aquat. Living Resour. 23, 25–34 (2010) 29
Fig. 1. Continued.
the combined pelagic longline fisheries in the Atlantic Ocean(Fig. 3, Table 1). Blue sharks have relatively high productivityand intermediate susceptibility, whereas common threshersand pelagic stingrays are relatively productive species thatshow very low susceptibility. The two hammerhead speciesincluded and the porbeagle show variable productivity butlow susceptibility, whereas the oceanic whitetip and longfinmako (by proxy) sharks have similar levels of rather highsusceptibility and varying productivity. The shortfin mako,bigeye thresher, and silky sharks have high susceptibility, butthe silky shark is more productive than the first two species.The more recent life history variables used in the productivity
analysis show that the shortfin mako is less productive thanpreviously thought (see SMA(i) data point in Figure 3 cor-responding to the r value used in the 2004 ICCAT stock as-sessment). A cluster analysis, using k-means and specifying 4clusters, identified the same groupings of species as describedabove and visible on Figure 3. The most vulnerable specieswere the silky, shortfin mako, and bigeye thresher sharks,whereas the common thresher and pelagic stingray were theleast vulnerable (Table 1).
Availability varied widely among species and fleets, butfor the analysis of all fleets combined it was very high, rangingfrom a minimum of 72% for the porbeagle shark to a maximum

30 E. Cortés et al.: Aquat. Living Resour. 23, 25–34 (2010)
Fig. 2. Spatial distribution of the 11 species of pelagic elasmobranch included in the analysis, plus the crocodile shark superimposed on theeffort distribution of the USA pelagic longline fleet.
of 100% for the pelagic stingray (Table 2). Encounterabilitywas 100% in all cases because there was always some degreeof overlap between the depth distributions of each species andpelagic longline gear. Estimated selectivity ranged from 14%in the common thresher shark to 91% in the silky shark, andpost-capture mortality spanned from 18% in both the commonthresher shark and pelagic stingray to 92% in the shortfin makoshark (Table 2). In all, the silky shark had the highest sus-
ceptibility values and the common thresher shark and pelagicstingray, the lowest (Table 2, Fig. 4).
Fleet-specific plots for the individual species show thatsusceptibility varies with fleet within and among species(Fig. 4). Several species showed considerable spread in sus-ceptibility values among fleets (bigeye thresher, blue, longfinmako, oceanic whitetip, shortfin mako and silky sharks),whereas other species showed much less variability (common
E. Cortés et al.: Aquat. Living Resour. 23, 25–34 (2010) 31
Fig. 2. Continued.
thresher, pelagic stingray, porbeagle, scalloped hammerheadand smooth hammerhead sharks). Susceptibility and vulner-ability were generally highest for the combined fleets, al-though there were two exceptions (common thresher andpelagic stingray; Table 3, Fig. 4). This is due to the way inwhich the selectivity and post-capture mortality attributes werecalculated for the combined fleets, i.e., as a weighted mean
that took into account the relative effort exerted by each fleet.Of the individual fleets included in this analysis, Portugal andBrazil tended to have the highest susceptibilities and vulnera-bilities, but, as mentioned before, the susceptibility value forPortugal is probably an overestimate. Uruguay, and especiallyNamibia, both with reduced fleets, had the lowest susceptibil-ity and vulnerability values in most cases (Table 3, Fig. 4).
32 E. Cortés et al.: Aquat. Living Resour. 23, 25–34 (2010)
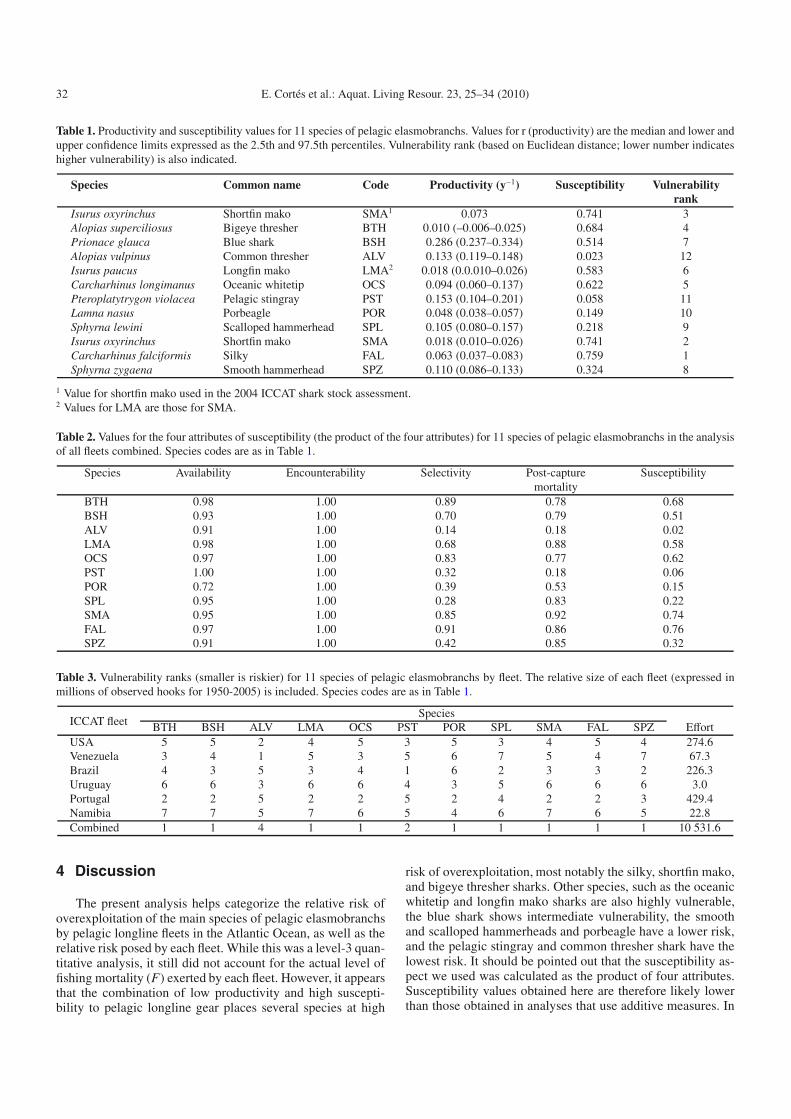
Table 1. Productivity and susceptibility values for 11 species of pelagic elasmobranchs. Values for r (productivity) are the median and lower andupper confidence limits expressed as the 2.5th and 97.5th percentiles. Vulnerability rank (based on Euclidean distance; lower number indicateshigher vulnerability) is also indicated.
Species Common name Code Productivity (y−1) Susceptibility Vulnerabilityrank
Isurus oxyrinchus Shortfin mako SMA1 0.073 0.741 3Alopias superciliosus Bigeye thresher BTH 0.010 (–0.006–0.025) 0.684 4Prionace glauca Blue shark BSH 0.286 (0.237–0.334) 0.514 7Alopias vulpinus Common thresher ALV 0.133 (0.119–0.148) 0.023 12Isurus paucus Longfin mako LMA2 0.018 (0.0.010–0.026) 0.583 6Carcharhinus longimanus Oceanic whitetip OCS 0.094 (0.060–0.137) 0.622 5Pteroplatytrygon violacea Pelagic stingray PST 0.153 (0.104–0.201) 0.058 11Lamna nasus Porbeagle POR 0.048 (0.038–0.057) 0.149 10Sphyrna lewini Scalloped hammerhead SPL 0.105 (0.080–0.157) 0.218 9Isurus oxyrinchus Shortfin mako SMA 0.018 (0.010–0.026) 0.741 2Carcharhinus falciformis Silky FAL 0.063 (0.037–0.083) 0.759 1Sphyrna zygaena Smooth hammerhead SPZ 0.110 (0.086–0.133) 0.324 8
1 Value for shortfin mako used in the 2004 ICCAT shark stock assessment.2 Values for LMA are those for SMA.
Table 2. Values for the four attributes of susceptibility (the product of the four attributes) for 11 species of pelagic elasmobranchs in the analysisof all fleets combined. Species codes are as in Table 1.
Species Availability Encounterability Selectivity Post-capture Susceptibilitymortality
BTH 0.98 1.00 0.89 0.78 0.68BSH 0.93 1.00 0.70 0.79 0.51ALV 0.91 1.00 0.14 0.18 0.02LMA 0.98 1.00 0.68 0.88 0.58OCS 0.97 1.00 0.83 0.77 0.62PST 1.00 1.00 0.32 0.18 0.06POR 0.72 1.00 0.39 0.53 0.15SPL 0.95 1.00 0.28 0.83 0.22SMA 0.95 1.00 0.85 0.92 0.74FAL 0.97 1.00 0.91 0.86 0.76SPZ 0.91 1.00 0.42 0.85 0.32
Table 3. Vulnerability ranks (smaller is riskier) for 11 species of pelagic elasmobranchs by fleet. The relative size of each fleet (expressed inmillions of observed hooks for 1950-2005) is included. Species codes are as in Table 1.
ICCAT fleetSpecies
BTH BSH ALV LMA OCS PST POR SPL SMA FAL SPZ EffortUSA 5 5 2 4 5 3 5 3 4 5 4 274.6Venezuela 3 4 1 5 3 5 6 7 5 4 7 67.3Brazil 4 3 5 3 4 1 6 2 3 3 2 226.3Uruguay 6 6 3 6 6 4 3 5 6 6 6 3.0Portugal 2 2 5 2 2 5 2 4 2 2 3 429.4Namibia 7 7 5 7 6 5 4 6 7 6 5 22.8Combined 1 1 4 1 1 2 1 1 1 1 1 10 531.6
4 Discussion
The present analysis helps categorize the relative risk ofoverexploitation of the main species of pelagic elasmobranchsby pelagic longline fleets in the Atlantic Ocean, as well as therelative risk posed by each fleet. While this was a level-3 quan-titative analysis, it still did not account for the actual level offishing mortality (F) exerted by each fleet. However, it appearsthat the combination of low productivity and high suscepti-bility to pelagic longline gear places several species at high
risk of overexploitation, most notably the silky, shortfin mako,and bigeye thresher sharks. Other species, such as the oceanicwhitetip and longfin mako sharks are also highly vulnerable,the blue shark shows intermediate vulnerability, the smoothand scalloped hammerheads and porbeagle have a lower risk,and the pelagic stingray and common thresher shark have thelowest risk. It should be pointed out that the susceptibility as-pect we used was calculated as the product of four attributes.Susceptibility values obtained here are therefore likely lowerthan those obtained in analyses that use additive measures. In

E. Cortés et al.: Aquat. Living Resour. 23, 25–34 (2010) 33
BSH
SPZ
SPL
POR
PSTALV
LMAOCS
BTH
FAL
SMA(i) SMA
BSH
SPZ
SPL
POR
PSTALV
LMAOCS
BTH
FAL
SMA(i) SMA
Fig. 3. Productivity and susceptibility plot for 11 species of Atlanticpelagic elasmobranch. Productivity is expressed as r (intrinsic rate ofincrease of the population) and susceptibility to pelagic longline fish-eries as the product of availability, encounterability, selectivity andpost-capture mortality (see text for details). Error bars denote lowerand upper confidence limits of r expressed as the 2.5th and 97.5th per-centiles. The upper right corner of the graph denotes the area of highrisk, whereas the lower left corner denotes the low risk area. Speciescodes are as in Table 1.
0.0
0.5
1.0
1.5
2.0
2.5
3.0
BTH BSH ALV LMA OCS PST POR SPL SMA FAL SPZ
Species
Sus
cept
ibili
ty to
pel
agic
long
lines
(s
tack
ed)
USA Venezuela Brazil Uruguay Portugal Namibia Combined
Fig. 4. Susceptibility (expressed as stacked proportions) for the 11species of Atlantic pelagic elasmobranch by fleet (see text for details).Species codes are as in Table 1.
all, pelagic sharks as a group are considerably vulnerable tothe effect of pelagic longline fisheries, owing mostly to theirlimited productivity.
The analysis also highlights the need for better basic bio-logical information, notably for species like the longfin makoand crocodile shark, but also for most of the other species in-cluded in the analysis, for which the life history variables usedto construct Leslie matrices came only from one hemisphereor, in some cases, from a different ocean (e.g., smooth ham-merhead and bigeye thresher). It also became apparent thatvery little is known about the vertical distribution and habitat
preferences of pelagic sharks, although archival satellite tagsdeployed on a number of species are slowly providing valu-able information. The data gathered by the various observerprograms around the Atlantic is also variable, but an effortshould be made to standardize and maximize the amount andquality of information collected, regardless of funding con-straints. For example, measurement of as many observed ani-mals as possible should be encouraged, as should the recordingof the status of each animal before it is brought on board.
Ecological risk assessments attempted thus far provideonly a snapshot of a complex combination of dynamic pro-cesses that lead to the death of an animal. By necessity, weattempted to capture an average value for each of the four fac-tors considered in our susceptibility parameter. For example,the availability of a given stock to pelagic longline gear willvary in space and time as a function of the stock and fleet dis-tributions. The spatial effort distribution of the fleets we con-sidered was an aggregated value that is a better reflection ofthe historical distribution of the fleets from 1950 to 2005 thanof current fishing grounds, which have likely changed owingto regulations, market conditions, and other factors. Encoun-terability of the gear by the fish is influenced by many factors,including target species (depth of gear), time of operation, vis-ibility conditions, bait type, and attractants (e.g., lightsticks)to cite a few. Selectivity or vulnerability to the gear is also afunction of multiple factors, including attractants, hunger, baittype, gear saturation, bait loss, hook size and type, line ten-sion, and animal strength (Ward 2008). Finally, post-capturemortality may also depend on animal size and quality, mar-ket conditions, and safety and regulatory considerations. WhileERA should be updated periodically as new, more modern,and more accurate biological and fishery information becomesavailable, the approach will inevitably provide only a snapshotof a combination of time- and space-dependent factors deter-mining the vulnerability of a stock to the fishing gear.
The ERA we conducted is not intended to replace for-mal analytical stock assessments because it does not informus about the status of the stocks, i.e., whether they are aboveor below overfished and overfishing thresholds. However, it isa convenient first step to help identify which species are moreat risk based on our present knowledge of their biology and theeffect that fleets operating in the Atlantic Ocean can have ontheir stocks.
Acknowledgements. We thank Haritz Arrizabalaga for providing there-estimated effort information for ICCAT fleets and the IUCN SSGfor providing the GMSA species distribution maps. We also thank S.Campana, J. Loefer, M. Musyl, G. Skomal and J. Stevens for makingunpublished archival satellite tag data available. We are indebted toDon Kobayashi for his assistance in developing the scatter plot.
References
Braccini J.M., Gillanders B.M. Walker T.I., 2006, Hierarchical ap-proach to the assessment of fishing effects on non-target chon-drichthyans: case study of Squalus megalops in southeasternAustralia. Can. J. Fish. Aquat. Sci. 63, 2456–2466.
Caswell H., 2001, Matrix population models. 2nd edition, SinauerAssociates, Sunderland, MA.

34 E. Cortés et al.: Aquat. Living Resour. 23, 25–34 (2010)
Cortés E., 2002, Incorporating uncertainty into demographic mod-eling: Application to shark populations and their conservation.Cons. Biol. 16, 1048–1062.
Cortés E., 2004, Life history patterns, demography, and populationdynamics. In: Carrier J.C., Musick J.A., Heithaus M.R. (Eds.)Biology of sharks and their relatives, CRC Press, pp. 449–469.
Cortés E., Heupel M., Ribera M., Simpfendorfer C.A., 2008,Productivity and susceptibility analysis (ecological risk as-sessment) of Atlantic sharks. 88th Annual Meeting of theAmerican Society of Ichthyologists and Herpetologists (ASIH),24th Annual Meeting of the American Elasmobranch Society(AES), Montreal, Canada, July 23–28.
Hobday A.J., Smith A., Webb H., Daley R., Wayte S., Bulman C.,Dowdney J., Williams A., Sporcic M., Dambacher J., Fuller M.,Walker T.I., 2007, Ecological risk assessment for the effectsof fishing: methodology. Report R04/1072 for the AustralianFisheries Management Authority, Canberra.
International Commission for the Conservation of Atlantic Tunas(ICCAT), 2008, Report of the 2007 inter-sessional meeting ofthe sub-committee on ecosystems. SCRS 2007/010 Col. Vol. Sci.Pap. ICCAT 62, 1671–1720.
Milton D.A., 2001, Assessing the susceptibility to fishing of popu-lations of rare trawl bycatch: sea snakes caught by Australia’sNorthern Prawn Fishery. Biol. Cons. 101, 281–290.
Rosenberg A, Agnew D., Babcock E., Cooper A., Mogensen C.,O’Boyle R., Powers J., Stefansson G., Swasey J., 2007, Settingannual catch limits for US fisheries: An expert working groupreport. MRAG Americas, Washington, DC.
Simpfendorfer C.A., Bonfil R., Latour R.J., 2004, Mortality estima-tion. In: Musick J.A., Bonfil R. (Eds.) Elasmobranch FisheriesManagement Techniques, APEC Secretariat, Singapore, pp. 165–186.
Smith A.D.M., Fulton E.J., Hobday A.J., Smith D.C., Shoulder P.,2007, Scientific tools to support the practical implementation ofecosystem-based fisheries management. ICES J. Mar. Sci. 64,633–639.
Stobutzki I.C., Miller M.J., Heales D.S., Brewer D.T., 2002,Sustainability of elasmobranchs caught as bycatch in a tropicalprawn (shrimp) trawl fishery. Fish. Bull. 100, 800–821.
Walker T.I., 2004, Management measures. In: Musick J.A., Bonfil R.(Eds.) Elasmobranch Fisheries Management Techniques, APECSecretariat, Singapore, pp. 285–321.
Ward P., 2008, Empirical estimates of historical variations in thecatchability and fishing power of pelagic longline gear. Rev. Fish.Biol. Fish. 18, 409–426.