ecological influence and pathways of land use in...
TRANSCRIPT

CHAPTER TWELVE
Ecological Influence and Pathways of Land Use in Sagebrush
Steven T. Knick, Steven E. Hanser, Richard F. Miller, David A. Pyke, Michael J. Wisdom, Sean P. Finn,
E. Thomas Rinkes, and Charles J. Henny
Abstract. Land use in sagebrush (Artemisia spp.) landscapes influences all sage-grouse (Centrocer-cus spp.) populations in western North America. Croplands and the network of irrigation canals cover 230,000 km2 and indirectly influence up to 77% of the Sage-Grouse Conservation Area and 73% of sagebrush land cover by subsidizing synanthropic predators on sage-grouse. Urbani-zation and the demands of human population growth have created an extensive network of con-necting infrastructure that is expanding its influ-ence on sagebrush landscapes. Over 2,500 km2 are now covered by interstate highways and paved roads; when secondary roads are included, 15% of the Sage-Grouse Conservation Area and 5% of existing sagebrush habitats are �2.5 km from roads. Density of secondary roads often exceeds 5 km/km2, resulting in widespread motorized access for recreation, creating extensive travel corridors for management actions and resource development, subsidizing predators adapted to human presence, and facilitating spread of exotic or invasive plants. Sagebrush lands also are being used for their wilderness and recreation values, including off-highway vehicle use. Approximately 12,000,000 animal use months (AUM � amount of forage to support one livestock unit per month)
are permitted for grazing livestock on public lands in the western states. Direct effects of graz-ing on sage-grouse populations or sagebrush landscapes are not possible to assess from cur-rent data. However, management of lands grazed by livestock has influenced sagebrush ecosys-tems by vegetation treatments to increase forage and reduce sagebrush and other plant species unpalatable to livestock. Fences (�2 km/km2 in some regions), roads, and water developments to manage livestock movements further modify the landscape. Oil and gas development influences 8% of the sagebrush habitats with the highest intensities occurring in the eastern range of sage-grouse; �20% of the sagebrush distribution is indirectly influenced in the Great Plains, Wyoming Basin, and Colorado Plateau SMZs. Energy development physically removes habitat to construct well pads, roads, power lines, and pipelines; indirect effects include habitat frag-mentation, soil disturbance, and facilitation of exotic plant and animal spread. More recent development of alternative energy, such as wind and geothermal, creates infrastructure in new regions of the sage-grouse distribution. Land use will continue to be a dominant stressor on sage-brush systems; its individual and cumulative
Knick, S. T., S. E. Hanser, R. F. Miller, D. A. Pyke, M. J. Wisdom, S. P. Finn, E. T. Rinkes, and C. J. Henny. 2011.Ecological influence and pathways of land use in sagebrush. Pp. 203–251 in S. T. Knick and J. W. Connelly (editors). Greater Sage-Grouse: ecology and conservation of a landscape species and its habitats. Studies in Avian Biology (vol. 38), University of California Press, Berkeley, CA.
203
Knick_ch12.indd 203Knick_ch12.indd 203 3/1/11 11:19:48 AM3/1/11 11:19:48 AM
#713

STUDIES IN AVIAN BIOLOGY NO. 38 Knick and Connelly204
effects will challenge long-term conservation of sage-grouse populations.
Key Words: agriculture, Conservation Reserve Pro-gram, energy development, land use, livestock grazing, off-highway vehicle, prescribed fire, sage-brush, sage-grouse, urbanization.
Influencia Ecológica y Circuitos del Uso del Suelo en Artemisa
Resumen. La utilización del suelo en paisajes de artemisa (Artemisia spp.) influencia a todas las poblaciones de sage-grouse (Centrocercus spp.) en Norteamérica occidental. Las tierras de cultivo y la red de canales de irrigación cubren 230,000 km2 e influencian indirectamente hasta un 77% del Área de Conservación del Sage-Grouse (Sage-Grouse Conservation Area) y el 73% de la cubierta de suelo de artemisa, al subvencionar a depreda-dores sinántropos sobre el sage-grouse. La urban-ización y las demandas del crecimiento demográ-fico humano han creado una extensa red de infraestructura de conexión la cual está ampli-ando su influencia en paisajes de artemisa. Hoy en día más de 2,500 km2 se encuentran cubiertos por carreteras interestatales y caminos pavimen-tados; cuando se incluye a los caminos secundar-ios, el 15% del Área de Conservación del Sage-Grouse y el 5% de los hábitats existentes de sagebrush se encuentran a �2.5 km de los cami-nos. La densidad de caminos secundarios a men-udo excede los 5 km/km2, dando como resultado el acceso motorizado extensivo para fines recrea-tivos, creando extensos corredores para acciones de manejo y desarrollo de recursos, subvencion-ando a depredadores adaptados a la presencia humana, y facilitando la expansión de plantas exóticas o invasoras. Las tierras de artemisa tam-bién están siendo utilizadas por sus valores natu-rales y recreativos, incluyendo el uso de vehículos fuera de las carreteras. Aproximadamente se per-mitieron 12,000,000 de meses de uso animal
( animal use months o AUM � cantidad de forraje necesario para soportar una unidad de ganado por mes) para el ganado de pastoreo en tierras públicas en los estados occidentales. Los efectos directos del pastoreo sobre poblaciones del sage-grouse o paisajes de artemisa no son posiblesde determinar utilizando datos actuales. Sin embargo, el manejo de tierras pastadas por el ganado ha influenciado ecosistemas de artemisa mediante el uso de tratamientos de la vegetación para aumentar el forraje y reducir el sagebrush y otras especies vegetales desagradables para el ganado. Las cercas (�2 km/km2 en algunas regiones), los caminos, y las obras sobre los recur-sos de agua para manejar los movimientos del ganado han modificado el paisaje aun más. El desarrollo del petróleo y el gas influencian el 8% de los hábitats de artemisa con las intensidades más altas encontrándose en la extensión este del territorio de sage-grouse; �20% de la distribución del sagebrush se encuentra indirectamente in fluenciada en las áreas de manejo de los Great Plains, Wyoming Basin, and Colorado Plateau. El desarrollo de energía físicamente remueve el hábitat para construir las plataformas para los pozos, los caminos, las líneas eléctricas, y las tuberías; los efectos indirectos incluyen la frag-mentación del hábitat, disturbio del suelo, y la facilitación de la expansión de plantas y animales exóticos. El reciente desarrollo de energías alter-nativas, tales como la eólica y geotérmica, crea la infraestructura en nuevas regiones de la dis-tribución del sage-grouse. La utilización del suelo continuará siendo un factor de estrés dominante en sistemas de artemisa sus efectos individuales y acumulativos desafiarán la conservación a largo plazo de las poblaciones de sage-grouse.
Palabras Clave: agricultura, artemisa, desarrollo energético, fuego prescrito, pastoreo de ganado, Pro-grama Reserva para la Conservación (Conservation Reserve Program), sage-grouse, urbanización, uso de la tierra, vehículos fuera de carretera.
Knick_ch12.indd 204Knick_ch12.indd 204 3/1/11 11:19:48 AM3/1/11 11:19:48 AM

LAND USE IN SAGEBRUSH 205
Lands dominated by sagebrush (Artemisia spp.) provide a broad array of resources used by humans. Areas used primarily for tradi-
tional industries, such as mining, livestock graz-ing, and energy development, are juxtaposed with urban areas, crossed by infrastructure network to transport people and resources, or fragmented by agriculture and expanding exurban development. Recreation, wildlife conservation, and wilderness amenities also have intangible values, impose physical demands on sagebrush and surrounding landscapes, and often have legal designations or restrictions that can affect land management and other uses. Thus, resources contained in sagebrush systems range from consumptive com-modities having a negotiated market value to aesthetic qualities that defy monetary currency despite efforts of natural resource economists. Human land use has been a significant force shaping sagebrush systems, particularly since Euro-American settlement (West 1999, Griffin 2002). However, quantifying and understanding effects of land use across the range-wide distribu-tion of Greater Sage-Grouse (Centrocercus uropha-sianus; hereafter, sage-grouse) is challenging because of the following conditions:
1. Demand for different resources and inten-sity of use have changed over time due to local, national, and global needs coupled with changes in technological capabilities to extract and use resources.
2. Social and economic importance of tradi-tional use varies spatially and temporally relative to nonconsumptive use.
3. Effects of land use differ from distinct impacts occurring at delineated loca-tions to more diffuse spatial and temporal influences.
4. Multiple land uses often combine in syn-ergistic relationships with environmental factors to create a cumulative effect.
5. Sagebrush systems vary spatially along gradients of elevation, annual patterns of precipitation, and soils that influence their resistance and resilience to disturbance.
6. Complex dynamics of sagebrush systems can result in less predictable transitions to alternate states of vegetation communities rather than following well-defined trajecto-ries of vegetation succession.
Adopting narrow management paradigms or espousing single solutions ignores these com-plexities (Crawford et al. 2004). We described the dominant anthropogenic land uses in the Sage-Grouse Conservation Area (SGCA; the pre-settlement distribution of sage-grouse buff-ered by 50 km [Connelly et al. 2004, Schroeder et al. 2004]) and their influence on patterns and processes of sagebrush habitats and sage-grouse populations. We organized land uses into broad categories of agri-culture, urbanization and infrastructure, livestock grazing, energy development (nonrenewable and renewable), and military training. The cumulative influence of anthropogenic land use is presented elsewhere as the human footprint (Leu et al. 2008; Johnson et al., this volume, chapter 17; Leu and Hanser, this volume, chapter 13). Land uses have impacted sagebrush ecosystems at multiple temporal and spatial scales. Our first objective was to provide the historical development of each category of land use and the background against which it became a significant influence. We present temporal information on changes in fre-quency, intensity, or location of the land use when data were available. Our second objective was to describe the current status of land use. We mapped the distribution of land use and quantified, when possible, the potential area altered directly by physi-cal habitat displacement or influenced indirectly through changes in plant or wildlife dynamics (Leu et al. 2008). Our last objective was to discuss the influence of each land use on sagebrush habitats or sage-grouse populations. We have presented a sig-nificant amount of background information, when available from published literature, because many of these interactions require a detailed understanding of the dynamics of sagebrush ecosystems. We recognized but did not evaluate resource commodity needs or demand, nor did we assess public perceptions of land use (Kennedy et al. 1995, Donahue 1999). We did not determine soci-etal benefits and costs associated with a land use. We also did not present strategies for mitigating use or recommend alternative levels of use. Rather, we attempted to answer the ecological questions about land uses (actions or choices), and how they influence pattern and functions of sagebrush sys-tems (reactions or consequences). Thus, we pre-sented the ecological context for management and land use discussions that also include political, economic, and social considerations (Mills and Clark 2001, Foley et al. 2005, Lackey 2007).
Knick_ch12.indd 205Knick_ch12.indd 205 3/1/11 11:19:48 AM3/1/11 11:19:48 AM

STUDIES IN AVIAN BIOLOGY NO. 38 Knick and Connelly206
METHODS
Study Area
We considered the primary land uses within the range-wide distribution of Greater Sage-Grouse, which encompasses �2,000,000 km2 (Connelly et al. 2004). Regional analyses were based on seven Sage-Grouse Management Zones (SMZs; Stiver et al. 2006), which were delineated from floristic regions that contain similar environmen-tal influences on vegetation communities (Miller and Eddleman 2001). SMZs also reflected bound-aries of broad regional populations of sage-grouse within the range-wide distribution. Estimated connectivity among sage-grouse leks primarily was contained within each SMZ rather than among zones (Garton et al., this volume, chap-ter 15; Knick and Hanser, this volume, chap-ter 16). State-wide summaries are presented when source data could not be delineated into SMZs. Sagebrush is the dominant land cover on 530,000 km2 within the sage-grouse range (Knick, this volume, chapter 1) and consists primarily of 20 taxa encompassing 11 major Artemisia species and subspecies groups (McArthur and Plummer 1978). Vegetation and wildlife communities vary greatly across the range covered by sagebrush as a function of differences in underlying soils, cli-mate, topographic position, landform, and geo-graphic location (West and Young 2000; Miller and Eddleman 2001; Davies et al. 2007a; Miller et al., this volume, chapter 10). Approximately 70% of the sagebrush land cover is on public land man-aged by state or federal agencies (Knick, this vol-ume, chapter 1); reserves or landscapes managed to maintain a natural character represent �1% of the total land surface covered by sagebrush. We assumed that land use at local scales can be aggregated across regional or range-wide extents (Allen and Starr 1982, Wiens 1989b, Peterson and Parker 1998) to assess broader influences on Greater Sage-Grouse populations or sagebrush landscapes. Dominant patterns then can form the basis for regional or range-wide conservation actions, such as prioritizing restoration (Wisdom et al. 2005c, Meinke et al. 2009), developing moni-toring approaches (Connelly et al. 2003b, Washington-Allen et al. 2006), or relating envi-ronmental factors to sage-grouse population trends (Reese and Bowyer 2007; Garton et al., this volume, chapter 15).
Data Sources
Spatial Information
Most spatial information used in this study was developed initially for the range-wide Conservation Assessment for Greater Sage-Grouse and Sage-brush Habitats (Connelly et al. 2004) and was updated when new data became available. Analy-ses using land cover information first derived from the SageStitch map (Comer et al. 2002) now have been conducted using the more recent LANDFIRE Existing Vegetation Map (LANDFIRE 2006). We did not compare results to assess changes in land cover or other land-use estimates and accuracies when different methods were used. Our primary challenge was obtaining compre-hensive data spanning a study area that included all or part of 14 states and three provinces. Spa-tially explicit data (one or more values referenced to a map location) of important environmental and land-use factors often were limited to admin-istrative boundaries such as counties, states, or Bureau of Land Management (BLM) field offices. Thus, we often merged spatial data from multiple sources to create seamless data layers in a geo-graphic information system (GIS) for regional or range-wide analyses. We used the coarsest resolu-tion when resolving GIS layers, thematic classifi-cations, and terminology when compiling infor-mation from different sources. We converted linear features to unit length/unit area to map relative density and create more meaningful measures of distribution across the landscape. We also converted point data to a con-toured distribution of densities. Specific methods and values used for individual coverages are shown in figure or table captions, accompanying text, or included in online metadata. Disturbance can influence an area beyond its immediate boundaries, although the function relat-ing distance and magnitude of effect can be diffi-cult to define (Turner and Dale 1991). For example, roads can provide dispersal corridors for invasive plants to spread into the surrounding region, influ-encing plant community dynamics beyond the physical road itself (Belcher and Wilson 1989, Gelbard and Belnap 2003). Other disturbances or threats (e.g., insecticide use on specific crops) may be confined locally, but long movements by sage-grouse among widely spaced seasonal ranges may result in exposure during a critical period in the
Knick_ch12.indd 206Knick_ch12.indd 206 3/1/11 11:19:48 AM3/1/11 11:19:48 AM

LAND USE IN SAGEBRUSH 207
annual life cycle or at a small location in the annual home range (Blus et al. 1989, Walker et al. 2007a, Doherty et al. 2008). We used an ecological ration-ale for estimating the area around points, lines, or polygons from which land use potentially influ-enced land cover or sage-grouse populations. Esti-mates for effect sizes into surrounding areas were based on foraging movements of human- subsidized predators, distance of exotic plant species spread, or on distribution data relative to land-use features (Gelbard and Belnap 2003, Connelly et al. 2004, Bradley and Mustard 2006, Leu et al. 2008). Many of our primary analyses quantified overlap between land use or its influence and sagebrush cover types or other environmental variables. This approach can be appropriate for land uses or dis-turbances that have well-defined effects in space and time (Pickett and White 1985). Diffuse distur-bances, such as livestock grazing, that alter plant composition or influence community processes may not result in altered landscape patterns readily mapped in a GIS and are more difficult to quantify at broad scales (Turner and Bratton 1987).
Nonspatial Information
Tabular and summaries of nonspatial data were created from online sources, field records or archives, or published literature (Connelly et al. 2004). We often relied on statistics available from or estimated for a single management entity. Pub-lic land statistics presented in annual reports by the BLM represent activities by the largest federal land management steward for sagebrush lands in the United States (Knick et al. 2003, Wisdom et al. 2005b). However, these statistics cannot be extrap-olated to activities on private lands or to other agencies because environmental characteristics of lands differ among stewards (Knick, this vol-ume, chapter 1). Thus, they represent only part of the collective scenario for sagebrush regions. We also used public land statistics to assess land uses, management issues, habitat character-istics, and treatments. Public land statistics often compile summary numbers that may not ade-quately represent land use, may contain data that were not updated from previous years, or may fail to capture many complexities inherent in man-agement and response of sagebrush ecosystems. We used that information to characterize man-agement actions and use of sagebrush lands because these reports are used to document
agency activities on public lands. Agency person-nel reviewed our use of public land statistics, but interpretations and conclusions remain our own.
Documentation of Data and Sources
All nonproprietary and nonsensitive spatial data sets used in our analysis are available for down-load on the SAGEMAP website (United States Department of the Interior 2001c). Each data set is accompanied by a metadata record document-ing original source and GIS procedures.
AGRICULTURE
Agriculture can include many types of production of food and goods through practices such as culti-vating soils, producing crops, and raising livestock. The mapped category of agriculture used in our analysis was principally cropland although mapped pasturelands also were included in the land cover definition. We discuss agricultural land uses prima-rily related to croplands unless otherwise noted.
Historical Development and Current Status
Most lands dominated by sagebrush in the western United States were acquired by the federal govern-ment through purchases and cessions of large ter-ritories in the early and mid-1800s (Dombeck et al. 2003). The United States government followed policies to transfer these vast acquisitions to private entities by encouraging conversion and develop-ment of sagebrush and other arid lands (Clawson and Held 1957). Public lands were given to private entities under a succession of homestead acts (1862, 1877, 1909, 1912, and 1916) that required settlers to build homes and develop land for agri-culture. The prime areas for growing crops, charac-terized by deep, fertile soils and available waterfor irrigation, were claimed early during Euro- American settlement. The initial establishment of settlements throughout the Great Basin occurred between the 1850s and 1860s (Oliphant 1968, Miller et al. 1994, Flores 2001, Young and Sparks 2002). Lands transferred to private entities and converted to cropland were also predominantly at lower elevations and on relatively flat terrain ( Talbert et al. 2007; Knick, this volume, chapter 1). Homesteaders arrived in Washington state by the late 1800s, and the proportion of virgin prairie and brush in southeastern Washington under cultivation
Knick_ch12.indd 207Knick_ch12.indd 207 3/1/11 11:19:48 AM3/1/11 11:19:48 AM

STUDIES IN AVIAN BIOLOGY NO. 38 Knick and Connelly208
increased from 25% in 1890 to �80% in 1920 (Buss and Dziedic 1955). Use of tractors for wheat farm-ing further increased technological capabilities, and almost all available lands were cultivated by 1945 (Buss and Dziedic 1955). Grasslands, which once covered 25% of eastern Washington, were reduced to 2% (McDonald and Reese 1998). Approximately 170,000 km2 of the pre-settlement distribution of 420,000 km2 of shrub steppe in Washington was present in 1986 (Dobler et al. 1996). The Carey Act, passed in 1894, transferred addi-tional lands to states, which then could be priva-tized provided that irrigation was developed. Large irrigation projects too expensive for private enterprise were developed with federal funding through the Newlands Reclamation Act passed in 1902 (Clawson and Held 1957). The first private irrigation projects in southwestern Idaho were started in the 1840s and on the upper Snake River in Idaho near Wyoming in the 1870s (Nokkentved 2008). Almost all of the Snake River Plain in southern Idaho that contains deep loamy soils and once supported basin big sagebrush (Artemi-sia tridentata ssp. tridentata) now has been con-verted to cropland (Hironaka et al. 1983). An estimated 10% of sagebrush steppe that existed prior to Euro-American settlement has been converted to agriculture; irrigation is not feasible on the remaining 90%, topography and soils are limiting, or temperatures are too extreme for certain crops (West 1996). However, economic advantages or technological improve-ments in irrigation methods now permit agricul-ture development on steeper terrains and in regions further from river floodplains (Brown et al. 2005, Vander Haegen 2007). For example, it was economically feasible for an additional 800 km2 of public land in the Snake River Plain to be developed for irrigation in the late 1980s ( Hamilton and Gardner 1986). Agriculture, mostly mapped croplands, cur-rently covers �230,000 km2 (11%) of the Sage-Grouse Conservation Area (Table 12.1). The total area influenced by agriculture was �1,600,000 km2 when a high effect buffer was used to include potential movements out to 6.9 km away from agricultural developments by human-subsidized predators (Boarman and Heinrich 1999, Leu et al. 2008). Almost three-fourths of all sagebrush within the range of Greater Sage-Grouse was influ-enced by agriculture at this level of effect (Table 12.1). Proportion of agricultural lands within
SMZs varied due to topography, soil characteristics, temperature, water availability, and type of crop grown. Primary agricultural regions were within the Columbia Basin (32% of total area in agricul-ture) and Great Plains (19%) SMZs (Fig. 12.1). Less than 5% of the land area in the Wyoming Basin, Southern Great Basin, Northern Great Basin, and Colorado Plateau was mapped as agri-culture land cover. Irrigation canals covered �0.1% of the land area within the SGCA or SMZ (Table 12.1).
Government Conservation Programs
The Conservation Reserve Program (CRP) is a voluntary program, authorized in 1985 under the Food Security Act, in which landowners receive annual payments in return for establishing per-manent vegetation on idle or erodible lands that previously had been used for growing crops ( Barbarika et al. 2004). The purpose of the pro-gram is to control soil erosion, improve water retention, and provide wildlife habitat. Lands placed into the program are to be set aside for 10 years and cannot be grazed except under emer-gency drought conditions. The amount of lands placed in CRP has markedly increased sincethe program inception in 1987 (Fig. 12.2). The increase was primarily in agricultural regions of the Columbia Basin and Great Plains SMZs. Other federal government programs, such as the Wildlife Habitat Incentives Program authorized in 1996, provide support to landowners to imple-ment measures specific to conserving wildlife habitat (Riley 2004, Gray and Teels 2006). The Permanent Cover Program was established in Canada in 1986 as part of the National Agricul-tural Strategy to reduce soil degradation by planting perennial vegetation. Lands placed in the Permanent Cover Program through 10- or 21-year agreements can be used for hay or pasture, unlike CRP under which lands set aside can be grazed only during emergency drought (McMaster and Davis 2001).
Ecological Influences and Pathways
The capability of agricultural regions within the sage-grouse range to support viable populations likely depends on the quantity and configura-tion of sagebrush remaining within the mosaic ( Wisdom et al. 2002a,b; Aldridge et al. 2008;Johnson et al., this volume, chapter 17; Wisdom
Knick_ch12.indd 208Knick_ch12.indd 208 3/1/11 11:19:48 AM3/1/11 11:19:48 AM

LAND USE IN SAGEBRUSH 209
et al., this volume, chapter 18). Range-wide, sage-grouse were more likely to be extirpated from areas containing �25% cultivated cropland and in which �25% of the landscape was dominated by sagebrush (Aldridge et al. 2008). Sage-grouse populations declined by 73% on a study area in south-central Montana concurrent with a 16% decrease in sagebrush land cover, including 30% of the wintering habitat, which was plowed and converted to croplands (Swenson et al. 1987). Declining populations of sage-grouse in the upper
Snake River Plain of southeastern Idaho were cor-related with amount of cropland area (Leonard et al. 2000). Little residual sagebrush was leftin areas converted to croplands. Cropland area increased 74% from 403 km2 in 1975 to 635 km2 in 1985 and to 701 km2 in 1992. Cropland as a percentage of the 2,249 km2 study area increased from 18% in 1975 to 28% in 1985 and was 31% of the land surface in 1992. Loss of 20% of the sagebrush between 1958 and 1993 within the range of Gunnison Sage-Grouse
TABLE 12.1Area (km2) and percent of area infl uenced by agriculture (cropland and irrigation canals) in Sage-Grouse
Management Zones and the Sage-Grouse Conservation Area (SGCA).
Effect area was the total area of land use and surrounding buffer.
Effect area
Area Low High Sagebrush areaa (%)
Agriculture km2 (%) km2 (%) km2 (%) Low High
Croplandb
Great Plains 66,052 (18.7) 240,021 (68.1) 319,483 (90.7) 47.4 83.7
Wyoming Basin 8,723 (3.6) 100,300 (41.5) 169,011 (69.8) 36.4 67.6
Southern Great Basin 6,943 (2.2) 87,437 (27.4) 196,668 (61.6) 24.4 61.1
Snake River Plain 28,657 (9.5) 156,729 (51.8) 254,539 (84.2) 48.1 83.1
Northern Great Basin 5,467 (3.8) 45,061 (31.1) 94,308 (65.1) 27.7 61.3
Columbia Basin 20,759 (32.3) 53,984 (83.9) 58,085 (90.3) 95.8 99.2
Colorado Plateau 6,804 (4.7) 73,353 (51.1) 115,933 (80.8) 58.2 85.4
SGCA 232,643 (11.2) 1,049,310 (50.4) 1,603,517 (77.0) 40.7 73.1
Irrigation canalsc
Great Plains 58 (�0.1)
Wyoming Basin 158 (0.1)
Southern Great Basin 101 (�0.1)
Snake River Plain 430 (0.1)
Northern Great Basin 119 (0.1)
Columbia Basin 50 (0.1)
Colorado Plateau 75 (0.1)
SGCA 1,093 (�0.1)
a Sagebrush area was delineated from the LANDFIRE (2006) map of land cover and covered 529,708 km2 (25.4%) of the Sage-Grouse Conservation Area.b Areas for low (2.5 km) and high (6.9 km) ecological effect were estimated around agriculture lands based on spread of exotic plant species (Bradley and Mustard 2006) and foraging distances of mammalian and corvid predators (Boarman and Heinrich 1999,Leu et al. 2008).c Area of irrigation canals estimated by linear distance � width (12.8 m). We did not delineate areas for ecological effect associated with irrigation canals.
Knick_ch12.indd 209Knick_ch12.indd 209 3/1/11 11:19:49 AM3/1/11 11:19:49 AM

Sage-GrouseManagementZones
State/provinceboundaries
Figure 12.1. Agricultural lands within the Sage-Grouse Conservation Area. Mapped land cover primarily depicts croplands, although pasture was included in the agriculture category (LANDFIRE 2006).
Figure 12.2. Total area (ha) under contract within the Conservation Reserve Program for counties in the United States by five-year intervals from 1987 through 2004 (United States Department of Agriculture 2009).
Knick_ch12.indd 210Knick_ch12.indd 210 3/1/11 11:19:49 AM3/1/11 11:19:49 AM

LAND USE IN SAGEBRUSH 211
(Centrocercus minimus) in southwestern Colorado was coupled with increased landscape fragmenta-tion by conversion to cropland (Oyler-McCance et al. 2001). This study was not directly linked to population trends, but Gunnison Sage-Grouse now occupy 10% of their historical range prima-rily due to habitat loss (Schroeder et al. 2004). Numerous patches of sagebrush interspersed at small scales potentially can provide sufficient habitat if the landscape maintains sufficient sage-brush land cover at broader scales. Shrub steppe was increasingly isolated and mean size of remaining patches decreased in the Columbia Basin due to conversion to agriculture (McDonald and Reese 1998). Sage-grouse persist within this matrix (Schroeder and Vander Haegen, this vol-ume, chapter 22), although populations are under-going long-term declines (Garton et al., this volume, chapter 15) and are genetically isolated from populations in neighboring SMZs (Oyler-McCance et al. 2005b) by regions more intensively developed for agriculture. Near-total conversion to cropland and other agriculture practices in southern Idaho has sepa-rated sagebrush-dominated landscapes into higher-elevation, less-productive, and less-arable regions north and south of the Snake River Plain (Knick et al. 2003). Sage-grouse populations that once were continuous across this region now are disconnected (Schroeder et al. 2004; Knick and Hanser, this volume, chapter 16). In comparison, agricultural regions of the Great Plains contain-ing smaller-scale dispersion of sagebrush habitat of the Great Plains still support sage-grouse populations.
Cropland Insecticides
Cropland expansion into historic sagebrush habi-tat has resulted in some sage-grouse using irri-gated lands in summer. Sage-grouse typically avoid cultivated croplands and areas dominated by human development (Aldridge and Boyce 2007). However, green vegetation, such as alfalfa, and insects associated with crops or livestock operations can be attractive foods during brood-rearing when forbs in native sagebrush commu-nities become desiccated (Patterson 1952; Hagen et al. 2007; Connelly et al., this volume, chapter 4). At least 18% of 82 radio-marked birds in southern Idaho were attracted to lush croplands adjacentto sagebrush habitat that were sprayed with the
insecticides dimethoate and methamidophos (Blus et al. 1989). Intoxicated or dead sage-grouse were found in or near six fields. Brain cholineste-rase activities and residue analysis of crop con-tents indicated that 5% of the marked sage-grouse in 1985 and 16% in 1986 died from these organo-phosphorus insecticides. Another 63 of an esti-mated 200 sage-grouse using a block of alfalfa sprayed with dimethoate died of organophospho-rus poisoning. Croplands and insecticide spraying potentially influence sage-grouse populations over broad regions. Sage-grouse in southern Idaho are migra-tory; individuals can move �80 km from winter areas and leks to summer ranges and have annual ranges �2,500 km2 (Dalke et al. 1963, Connelly et al. 1988). Distances traveled by females with broods from nesting areas to late brooding areas ranged from 3 to 21 km (Gates 1983). Total extent of the area of effect cannot be estimated because actual distances that sage-grouse move to irri-gated and sprayed fields is unknown. Similarly, the impact on sage-grouse populations from expo-sure to organophosphorus insecticides has not been estimated relative to other causes of mortal-ity or their timing within an annual cycle.
Government Conservation Programs
The CRP places vegetation cover on lands that otherwise would not be used by many species of wildlife. Large-area set-asides in CRP, however, are constrained by limits on total area that can be enrolled within a region. Instead, CRP set-asides typically focus on providing riparian or grassland buffer strips rather than large areas of upland vegetation (Riley 2004). Consequently, species that have benefited from CRP primarily include grassland birds with relatively small home ranges that use early successional vegetation or a mosaic of cropland bordered by grassland buffers (Haroldson et al. 2006). Sage-grouse respond to vegetation and land-scape structure, not program or landownership. Thus, the value of lands placed in the CRP pro-gram for sage-grouse likely is related to size and quality of individual CRP patches as well as the cumulative amount and distribution of CRP lands within a larger matrix of croplands and sagebrush. Sage-grouse in the Columbia Basin used CRP lands that had been set aside sufficiently longto permit perennial grasses and sagebrush to
Knick_ch12.indd 211Knick_ch12.indd 211 3/1/11 11:19:53 AM3/1/11 11:19:53 AM

STUDIES IN AVIAN BIOLOGY NO. 38 Knick and Connelly212
become dominant vegetation (Schroeder and Vander Haegen, this volume, chapter 22). Sage-grouse populations stabilized in the region con-taining 17% CRP, compared to a population that continued to decline in an adjacent region con-taining �2% CRP (Schroeder and Vander Haegen, this volume, chapter 22). Capability of lands placed in CRP to benefit sage-grouse also should be considered relative to other alternative uses for those sites. Lands set aside in CRP provide some habitat components in contrast to cropland, development, or barren land susceptible to erosion. Gunnison Sage-Grouse used CRP lands in proportion to their availability in southeastern Utah (Lupis et al. 2006). Suitable, if not optimal, habitat was available through CRP on �30% of the study area that otherwise would have been used for crops and would not be likely to have supported sage-grouse.
URBANIZATION AND INFRASTRUCTURE
Historical Development and Current Status
Indigenous people have inhabited sagebrush regions for 13,000 years BP or earlier ( Thomas 1973, Grayson 1993). Local densities of humans esti-mated for pre-American settlement periods were 0.3 persons/km2 in the Columbia Plateau, 0.08 in the Great Basin, and 0.13 in the Great Plains (Vale 2002a). Low densities limited their impact on the biophysical landscape, although hunting, gather-ing, and burning may have had a locally significant influence (Flores 2001, Griffin 2002, Vale 2002b, Kay 2007). Human populations have increased and ex panded, primarily over the past century and in the western portion of the sagebrush distribution (Fig. 12.3). In 1900, 51% of the 325 counties within the historical distribution of sage-grouse had �1 person/km2 and 4% of the counties had densities of �10 persons/km2. By 1950, 39% of the counties had �1 person/km2 and 9% had �10 persons/km2. In the most recent census in 2000, 31% of the counties had �1 person/km2 and 22% had �10 persons/km2. The Columbia Basin has the highest density of humans (Fig. 12.4) in contrast to the low densi-ties in the Great Plains. Differences in population trends among SMZs reflect a general movement in the United States from midwestern plains to western states (Brown et al. 2005). Population densities in the Great Plains in the 2000 census
had increased more slowly since 1990 (7%) and 1920 (49%) relative to other management zones (Fig. 12.4). In comparison, population densities have increased between 19% (Wyoming Basin) and 31% (Colorado Plateau) from 1990–2000, and between 166% (Wyoming Basin) and666% (Northern Great Basin) from 1920–2000 (Fig. 12.4). Availability of resources often limited areas that could be settled by early inhabitants of arid regions (West 1999). Early settlements by Euro-Americans were along transportation corridors, such as rivers or railroad lines, or in regions where minerals had been discovered (Young and Sparks 2002). The dominant urban areas in the sage-grouse range are in the Columbia River Val-ley of Washington, the Snake River Valley of southwestern Idaho, and the Bear River Valley of northern Utah. Most urban areas within the sage-grouse range are on the edge of regions domi-nated by sagebrush land cover with the exception of cities and towns in the Southern Great Basin SMZ. Area of influence of urban development ranged from 16% of the area within the Great Plains to 49% of the Columbia Basin (Table 12.2). Rural areas also have been developed through-out the sagebrush region, particularly around urban centers and major highways. Much of this development has been in recent decades. The amount of uninhabited area (0 people/km2) within the Great Basin ecoregion decreased from 90,000 km2 in 1990 to �12,000 km2 in 2004 ( Torregrosa and Devoe 2008). Economic opportu-nities combined with availability of public lands for recreation and other natural or wilderness qualities are major reasons for this population expansion (Hansen et al. 2002, Brown et al. 2005). Increased affluence, change in social values, and ability to conduct business from remote locations through electronic commerce also has resulted in home development on large acreages surround-ing cities. Many existing ranches that had been used primarily for livestock production are being sold for the rural or wildland amenities that they provide and subdivided into ranchettes (Riebsame et al. 1996, Holechek 2001, Gosnell and Travis 2005, Holechek 2006). This is best documented for the Colorado Front Range and the greater Yellowstone ecosystem, but ranchette and subdi-visions are being developed throughout the sage-grouse range, particularly in the Great Basin (Torregrosa and Devoe 2008).
Knick_ch12.indd 212Knick_ch12.indd 212 3/1/11 11:19:54 AM3/1/11 11:19:54 AM

LAND USE IN SAGEBRUSH 213
Infrastructure
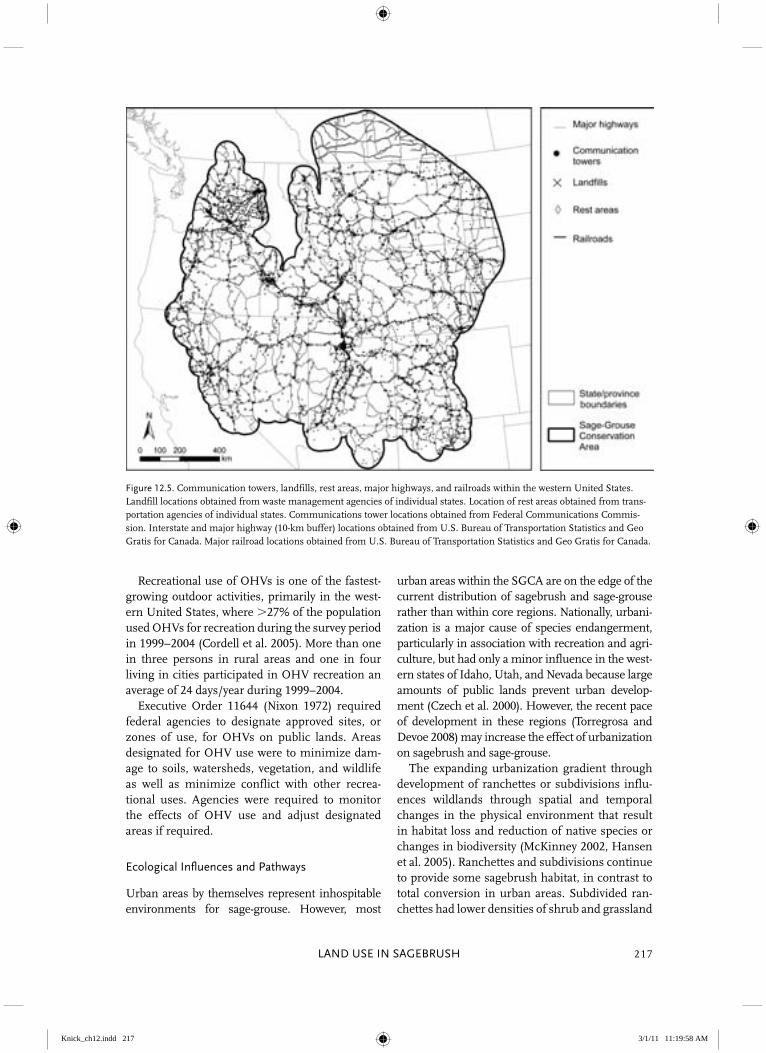
Interstate and other major paved highways cov-ered an estimated 2,500 km2 (0.1%) of the SGCA (Table 12.3). Interstates and highways influenced 851,044 km2 (41%) of the total area and 38% of the sagebrush land cover (Table 12.3, Fig. 12.5). These major roads tend to follow river valleys and traverse lower elevations. In contrast, secondary paved roads exist throughout most sagebrush regions (Fig. 12.6) in densities up to �5 km/km2. Less than 5% of the entire sage-grouse range was �2.5 km from a mapped road, and almost no area of sagebrush was �6.9 km (Table 12.3). Railroads
covered 487 km2 (�0.1%) of the landscape but influenced 10% of the SGCA and 7% of the sage-brush (Table 12.3). Power lines covered a minimum of 1,089 km2 (Fig. 12.7, Table 12.3) and had an ecological influ-ence on almost 50% of all sagebrush within the SGCA. We were unable to map or estimate the density of smaller distribution lines in rural areas. Similar to roads, power lines also followed major river valleys and crossed lower elevations. The Energy Policy Act of 2005 directed that corridors for transporting energy (oil, gas, hydro-gen, electricity) be designated on federal land (United States Departments of Energy and the
Figure 12.3. Change in population density for coun-ties within the Sage-Grouse Conservation Area from 1920 (top) to 2000 (bottom). http://arcdata.esri.com/data/tiger2000/tiger_download.cfm; http://www.census.gov/population/www/census-data/cencounts/index.html
Knick_ch12.indd 213Knick_ch12.indd 213 3/1/11 11:19:54 AM3/1/11 11:19:54 AM

Figure 12.4. Population density (ind/km2) within the Sage-Grouse Management Zones in the Sage-Grouse Conservation Area (United States Census Statistics 1900–2000). Densities were averaged from census results for individual counties within Sage-Grouse Management Zones. http://arcdata.esri.com/data/tiger2000/tiger_download.cfm; http://www.census.gov/population/www/censusdata/cencounts/index.html
TABLE 12.2Area (km2) and percent of area infl uenced by urban development in Sage-Grouse Management Zones and
the Sage-Grouse Conservation Area (SGCA).
Effect area was the total area of land use and surrounding buffer.
Area Effect areaa
Urban development km2 (%) km2 (%) Sagebrush areab (%)
Great Plains 653 (0.2) 57,652 (16.4) 16.0
Wyoming Basin 457 (0.2) 49,970 (20.7) 18.4
Southern Great Basin 1,824 (0.6) 54,587 (17.1) 13.5
Snake River Plain 1,131 (0.4) 78,159 (25.8) 18.8
Northern Great Basin 741 (0.5) 28,694 (19.8) 12.5
Columbia Basin 679 (1.1) 31,185 (48.5) 48.4
Colorado Plateau 780 (0.5) 42,288 (29.5) 29.2
SGCA 8,612 (0.4) 454,193 (21.8) 18.6
a Area for ecological effect (6.9 km) was estimated from foraging distances of mammalian and corvid predators (Boarman and Heinrich 1999, Leu et al. 2008).b Sagebrush area delineated from the LANDFIRE (2006) map of land cover and included 529,708 km2 (25.4%) of the Sage-Grouse Conservation Area.
Knick_ch12.indd 214Knick_ch12.indd 214 3/1/11 11:19:56 AM3/1/11 11:19:56 AM

TABLE 12.3 (continued)
TABLE 12.3Area (km2) and percent of area infl uenced by infrastructure in Sage-Grouse Management Zones and
the Sage-Grouse Conservation Area (SGCA).
Effect area was the total area of land use and surrounding buffer.
Effect area
Area Low High Sagebrush areaa (%)
Land use km2 (%) km2 (%) km2 (%) Low High
Interstates/highwaysb
Great Plains 371 (0.1) 52,524 14.9 129,582 (36.8) 13.1 35.0
Wyoming Basin 283 (0.1) 42,431 17.5 103,479 (42.8) 17.9 45.5
Southern Great Basin 403 (0.1) 52,192 16.4 126,224 (39.5) 14.6 36.8
Snake River Plain 368 (0.1) 46,565 15.4 110,650 (36.6) 12.7 32.8
Northern Great Basin 125 (0.1) 20,314 14.0 50,160 (34.6) 11.5 29.5
Columbia Basin 168 (0.3) 17,904 27.8 39,338 (61.1) 28.3 61.6
Colorado Plateau 185 (0.1) 27,792 19.4 66,095 (46.0) 20.8 47.6
SGCA 2,552 (0.1) 353,803 17.0 851,044 (40.9) 15.3 38.3
All roadsb
Great Plains 2,738 (0.8) 302,754 (85.9) 323,551 (91.8) 91.3 98.7
Wyoming Basin 2,228 (0.9) 214,456 (88.6) 231,103 (95.5) 98.5 99.7
Southern Great Basin 2,495 (0.8) 285,839 (89.5) 313,396 (98.2) 94.3 99.8
Snake River Plain 2,575 (0.9) 272,400 (90.1) 297,782 (98.5) 94.7 99.7
Northern Great Basin 1,599 (1.1) 138,158 (95.4) 144,469 (99.7) 95.6 100.0
Columbia Basin 870 (1.4) 63,097 (98.1) 64,270 (99.9) 98.7 100.0
Colorado Plateau 1,210 (0.8) 127,848 (89.1) 142,121 (99.0) 95.3 99.3
SGCA 17,681 (0.8) 1,776,936 (85.3) 1,923,694 (92.3) 95.2 99.6
Railroadsc
Great Plains 65 (�0.1) 34,805 (9.9) 8.8
Wyoming Basin 34 (0.0) 17,391 (7.2) 7.4
Southern Great Basin 48 (�0.1) 20,646 (6.5) 3.8
Snake River Plain 110 (�0.1) 28,668 (9.5) 7.0
Northern Great Basin 57 (�0.1) 13,927 (9.6) 5.7
Columbia Basin 34 ( 0.1) 15,013 (23.3) 26.2
Colorado Plateau 20 (�0.1) 7,326 (5.1) 4.2
SGCA 487 (�0.1) 200,109 (9.6) 7.1
Power linesd
Great Plains 159 �0.1 52,362 14.9 112,697 32.0 15.4 33.5
Wyoming Basin 162 0.1 53,545 22.1 107,774 44.5 27.7 54.2
Southern Great Basin 124 �0.1 43,799 13.7 98,506 30.9 11.8 27.8
Snake River Plain 158 0.1 53,217 17.6 112,855 37.3 17.1 36.8
Knick_ch12.indd 215Knick_ch12.indd 215 3/1/11 11:19:58 AM3/1/11 11:19:58 AM

STUDIES IN AVIAN BIOLOGY NO. 38 Knick and Connelly216
Interior 2008). New corridors, as currently proposed (Fig. 12.7), would affect an additional 2% (12,000 km2) of the sagebrush across the SGCA currently not influenced by a mapped power line. Amount of additional sagebrush habitat that would be affected by new corridors ranged from �0.2% in the Columbia Basin (13 km2) and Great Plains (85 km2), which already have a large proportion influenced by power lines and infrastructure, to �5% in the Northern Great Basin (3,552 km2). A minimum of 10,182 communications towers �62 m in height were present in the SGCA (Fig. 12.5). The area potentially influenced included 4% of the current sagebrush distribu-tion (Table 12.3).
Recreation and Off-highway Vehicle Use
Off-highway vehicle (OHV) use is defined as any motorized use by motorcycles, all-terrain vehicles, four-wheel-drive jeeps, and other vehicles capable of off-highway terrestrial travel, and which occurs predominantly on unpaved roads and single-track and two-track motorized trails (Ouren et al. 2007). A major part of OHV use on public lands is for recrea-tion. Off-highway vehicle use and recreation, how-ever, have not been well-documented for the SGCA or for sagebrush ecosystems. Over 8,400,000 people live within 5 km of sagebrush, and 7,600,000 live within 5 km of public lands. Many people live in these locations primarily because of access to public lands for recreation (Hansen et al. 2002, 2005).
Effect area
Area Low High Sagebrush areaa (%)
Land use km2 (%) km2 (%) km2 (%) Low High
Northern Great Basin 64 �0.1 22,275 15.4 49,634 34.3 13.8 31.4
Columbia Basin 85 0.1 25,280 39.3 44,116 68.6 43.8 76.1
Colorado Plateau 67 �0.1 24,364 17.0 55,635 38.8 21.4 46.9
SGCA 1,089 �0.1 366,298 17.6 777,983 57.3 18.7 39.0
Communication towerse
Great Plains 9 �0.1 14,544 4.1 4.0
Wyoming Basin 6 �0.1 11,775 4.9 4.9
Southern Great Basin 12 �0.1 14,293 4.5 3.0
Snake River Plain 12 �0.1 16,615 5.5 3.6
Northern Great Basin 5 �0.1 6,556 4.5 2.7
Columbia Basin 6 �0.1 8,573 13.3 12.2
Colorado Plateau 5 �0.1 7,934 5.5 5.5
SGCA 74 �0.1 106,795 5.1 4.2
a Sagebrush area was delineated from the LANDFIRE (2006) map of land cover and included 529,708 km2 (25.4%) of the Sage-Grouse Conservation Area.b Effect area of 7 km estimated from distribution of Greater Sage-Grouse leks relative to Interstate 80 in Wyoming (Connelly et al. 2004). Surface area of roads was estimated from linear distance � width (interstate highways 73.2 m; federal and state highways 25.6 m; secondary roads 12.4 m).c Surface area of railroads estimated from linear distance � width (9.4 m). Buffer size for ecological effect was 3 km to estimate spread of exotic plants. We did not estimate a high effect area for railroads.d Low (2.5 km) and high (6.9 km) effect areas were estimated based on spread of exotic plant species (Bradley and Mustard 2006) and foraging distances of mammalian and corvid predators (Boarman and Heinrich 1999, Leu et al. 2008).e We combined three categories of communications towers, which are based on height and location relative to glide paths around airports. Surface area was estimated at 1 ha/tower.
TABLE 12.3 (CONTINUED)
Knick_ch12.indd 216Knick_ch12.indd 216 3/1/11 11:19:58 AM3/1/11 11:19:58 AM
LAND USE IN SAGEBRUSH 217
Recreational use of OHVs is one of the fastest-growing outdoor activities, primarily in the west-ern United States, where �27% of the population used OHVs for recreation during the survey period in 1999–2004 (Cordell et al. 2005). More than one in three persons in rural areas and one in four living in cities participated in OHV recreation an average of 24 days/year during 1999–2004. Executive Order 11644 (Nixon 1972) required federal agencies to designate approved sites, or zones of use, for OHVs on public lands. Areas designated for OHV use were to minimize dam-age to soils, watersheds, vegetation, and wildlife as well as minimize conflict with other recrea-tional uses. Agencies were required to monitor the effects of OHV use and adjust designated areas if required.
Ecological Influences and Pathways
Urban areas by themselves represent inhospitable environments for sage-grouse. However, most
urban areas within the SGCA are on the edge of the current distribution of sagebrush and sage-grouse rather than within core regions. Nationally, urbani-zation is a major cause of species endangerment, particularly in association with recreation and agri-culture, but had only a minor influence in the west-ern states of Idaho, Utah, and Nevada because large amounts of public lands prevent urban develop-ment (Czech et al. 2000). However, the recent pace of development in these regions (Torregrosa and Devoe 2008) may increase the effect of urbanization on sagebrush and sage-grouse. The expanding urbanization gradient through development of ranchettes or subdivisions influ-ences wildlands through spatial and temporal changes in the physical environment that result in habitat loss and reduction of native species or changes in biodiversity (McKinney 2002, Hansen et al. 2005). Ranchettes and subdivisions continue to provide some sagebrush habitat, in contrast to total conversion in urban areas. Subdivided ran-chettes had lower densities of shrub and grassland
Figure 12.5. Communication towers, landfills, rest areas, major highways, and railroads within the western United States. Landfill locations obtained from waste management agencies of individual states. Location of rest areas obtained from trans-portation agencies of individual states. Communications tower locations obtained from Federal Communications Commis-sion. Interstate and major highway (10-km buffer) locations obtained from U.S. Bureau of Transportation Statistics and Geo Gratis for Canada. Major railroad locations obtained from U.S. Bureau of Transportation Statistics and Geo Gratis for Canada.
Knick_ch12.indd 217Knick_ch12.indd 217 3/1/11 11:19:58 AM3/1/11 11:19:58 AM

Figure 12.6. Contoured secondary roads in the Sage-Grouse Conservation Area (density [km/km2] within an 18-km radius) (GIS coverages obtained from U.S. Census Bureau).
Figure 12.7. Power lines and proposed energy corridors within the Sage-Grouse Conservation Area (compiled from GIS cover-ages obtained from individual state, provincial, and federal sources).
Knick_ch12.indd 218Knick_ch12.indd 218 3/1/11 11:20:00 AM3/1/11 11:20:00 AM

LAND USE IN SAGEBRUSH 219
birds, more domestic than native predators, and fewer native plant species when compared to full-scale ranches (Maestas et al. 2003, Hansen et al. 2005). Consequently, road fragmentation and dis-turbance from human activities in and around human dwellings (Mitchell et al. 2002) probably make many of these areas inhospitable to sage-grouse and other wildlife that depend on land-scape arrangement and amount of sagebrush land cover (Aldridge et al. 2008; Hanser and Knick, this volume, chapter 19). The physical boundaries of cities may be small relative to total area in the SGCA, but people living in cities require resources from immediately sur-rounding regions or that need to be transported from elsewhere. Often, the needs supporting urbanization extend well beyond the city (Theobald 2001). Increases in technological capabilities have reduced limitations to moving resources and increased connectivity between supply and demand. Proposed water development to support the growth of Las Vegas (located outside of the southern Great Basin SMZ) would potentially trigger declines in groundwater across at least 78 basins covering nearly 130,000 km2, including areas within the Southern Great Basin (Deacon et al. 2007). The connecting infrastructure of roads, motor-ized trails, railways, power lines, and communica-tions corridors fragment or remove sagebrush land cover (Leu and Hanser, this volume, chap-ter 13). The ecological impact of roads and motor-ized trails include: (1) increased mortality of wildlife from collisions with vehicles, (2) modifi-cation of animal behavior because of habitat changes or noise disturbance, (3) alteration of physical environment, (4) alteration of chemical environment through leaching or erosion, (5) spread of exotic and invasive plant and wild-life, and (6) increased habitat alteration and use by humans (Forman and Alexander 1998, Forman 2000, Trombulak and Frissell 2000, Ouren et al. 2007). Unpaved roads fragment sagebrush land-scapes as well as provide disturbed surfaces that facilitate spread of invasive plant species (Belcher and Wilson 1989, Gelbard and Belnap 2003). Recreation, including hiking, hunting, fishing, and OHV use, was a major cause of species endan-germent in the Great Basin and was a primary fac-tor endangering 12 species in Utah and Nevada (Czech et al. 2000). Even activities that often are per-ceived as low impact or benign, such as hiking and mountain biking, have an influence on wildlife
(Miller et al. 1998, Taylor and Knight 2003). Any human activity of high frequency along established roads or corridors, whether motorized or nonmo-torized, can affect wildlife habitats and species neg-atively through habitat loss and fragmentation, facilitation of exotic plant spread, population dis-placement or avoidance, establishment of popula-tion barriers, or increased human-wildlife encoun-ters that increase wildlife mortality (Gaines et al. 2003). These effects appear to be common across a variety of habitats and species that span the full range of forested to arid terrestrial environments (Gaines et al. 2003, Ouren et al. 2007). Nationally, recreation was listed in the Federal Register as a pri-mary factor for 27% of the endangered, threatened, or proposed species ( Wilcove et al. 1998). Off-highway vehicle use can increase noise dis-turbance while also increasing soil compaction and erosion through surface disturbance and veg-etation loss or alteration (Webb and Wilshire 1983, Lovich and Bainbridge 1999). OHVs were a primary factor given in the Federal Register for 13% of the species listed as endangered or threat-ened or proposed for listing (Wilcove et al. 1998). Direct effects of OHV use on wildlife populations have varied by species but appear similar to effects from motorized use of roads (Havlick 2002). Reduced nesting success of songbirds near OHV trails was offset by lower numbers of predators using these areas (Barton and Holmes 2007). Despite widespread and increasing use of OHVs (Cordell et al. 2005), potential effects on sage-brush habitats and most obligate wildlife species, including sage-grouse, have not been studied.
LIVESTOCK GRAZING
Historical Development and Current Status
Livestock grazing is the most widespread land use across the sage-grouse range (Brussard et al. 1994, Noss 1994, Crawford et al. 2004). Almost all sage-brush habitats have been grazed in the past century (Saab et al. 1995, West 1996, West and Young 2000, Hockett 2002). Areas ungrazed by livestock exist only in regions in which natural or human- developed water sources are not available, such as in inaccessi-ble kipukas or tops of physically isolated buttes. Even lands on which grazing is currently restricted often have a previous history of livestock grazing (e.g., United States Department of Energy Idaho National Laboratory; Anderson and Holte 1981).
Knick_ch12.indd 219Knick_ch12.indd 219 3/1/11 11:20:07 AM3/1/11 11:20:07 AM

STUDIES IN AVIAN BIOLOGY NO. 38 Knick and Connelly220
Livestock grazing in western shrublands became significant in the ecological and political landscape in the late 1800s (Oliphant 1968, Young and Sparks 2002). Completion of the first transcontinental railroad in the 1860s greatly expanded the livestock industry, because products could be shipped to markets on the East and West Coasts (Holechek 1981, Mitchell and Hart 1987, Flores 2001). Early grazing was largely unregulated by either fences or a legal system, and competition was intense among ranchers, homesteaders, and free-rangers as well as between cattle grazers and sheepherders (Carpenter 1981, Poling 1991, Donahue 1999). Major increases in numbers of livestock and areas grazed from 1880 to 1905 altered the condition of western landscapes (Griffiths 1902, Mitchell and Hart 1987, Box 1990). Grazing on public lands was unregulated during this period without boundaries or controls on number or kind of livestock grazed (Carpenter 1981). Number of livestock increased from 4,100,000 cattle and 4,800,000 sheep in 1870 to 19,600,000 cattle and 25,100,000 sheep in 1900 (Donahue 1999). Native perennial bunchgrasses in the Intermountain West lacked seed production and morphological characteristics to sustain anything greater than low levels of grazing disturbance (Mack and Thompson 1982, Miller et al. 1994). Large declines of native grasses and winterfat (Kraschenin-nikovia lanata) occurred between 1870 and 1900 (Griffiths 1902, Cottam and Stewart 1940, Chris-tiansen and Johnson 1964); reduction and loss of palatable forage species and increases in plant spe-cies of low palatability may have taken only 10–15 years at any given site under heavy uncontrolled grazing (Hull 1976). Forage production that would support livestock dropped between 60% and 90% of the site potential following depletion of the vegeta-tion community by the early 1930s (Aldous and Shantz 1924, McArdle et al. 1936). A drought in the 1920s followed the period of heavy grazing and became severe in the 1930s. Native grasses and forbs were depleted from the vegetation community and replaced in much of the Great Basin and surrounding region by exotic annual grasses (Robertson and Kennedy 1954, Young et al. 1972, Yensen 1981, Billings 1990, Miller et al. 1994). Loss of protective vegetation cover and trampling in some communities resulted in extensive soil disturbance and erosion (McArdle et al. 1936, Cottam and Stewart 1940). Shrub density also increased with heavy grazing and loss of understory grasses and forbs, although
total distribution of shrubs across a landscape or region likely remained similar (Vale 1975). The Taylor Grazing Act (1934) created grazing districts on public lands, established a permit and fee system to limit numbers of livestock, and devel-oped administration of public land grazing under the United States Grazing Service, which became the BLM in 1946 (Poling 1991). A portion of the grazing fees was returned to the grazing districts for land improvements. Prescriptive management of grazing also was introduced to reduce grazing impacts through periodic rest and rotations rather than season-long grazing. Land improvements were implemented primarily to restore grasses in the herbaceous understory to maximize forage pro-duction for livestock. Other management objec-tives were to reduce plants poisonous to livestock, stabilize soils, and reduce shrub cover. Herbicides, plowing, burning, and a diversity of other methods were used to remove the competi-tive woody overstory, particularly sagebrush, to maximize forage production for livestock by encouraging growth of grasses and forbs over large areas of the western states (Pechanec et al. 1965, Vale 1974, Young et al. 1981, Cluff et al. 1983). Esti-mates vary on how much sagebrush was treated or eradicated. Between 200,000 and 240,000 km2 were estimated to have been treated over a 30-year period beginning in the 1940s (Schneegas 1967). Other studies estimated that 10–12% of the total sage-brush distribution (400,000–480,000 km2) was treated by the 1970s (Vale 1974, Pechanec et al. 1965). Total area of sagebrush treated on lands managed by the BLM was 180,000 km2 between 1940 and 1994; during the peak period of sage-brush removal in the 1960s, 11,000 km2/year were treated (Miller and Eddleman 2001). Replanting areas after sagebrush was removed with nonnative perennial grasses such as crested wheatgrass (Agropyron cristatum), desert wheat-grass (A. desertorum), and Siberian wheatgrass (A. fragile) reduced the necessity of a preexisting understory and was particularly successful at increasing forage that could be grazed by livestock (Shane et al. 1983). The first reseedings in south-ern Idaho were conducted in 1932 (Hull 1974). Land treatments or burned areas currently are reseeded to reduce the spread of invasive plants, stabilize soils and reduce erosion, and create wildlife habitat (Monsen et al. 2004). With the exception of mineland reclamation, revegetation guidelines currently emphasize introduced species,
Knick_ch12.indd 220Knick_ch12.indd 220 3/1/11 11:20:07 AM3/1/11 11:20:07 AM
LAND USE IN SAGEBRUSH 221
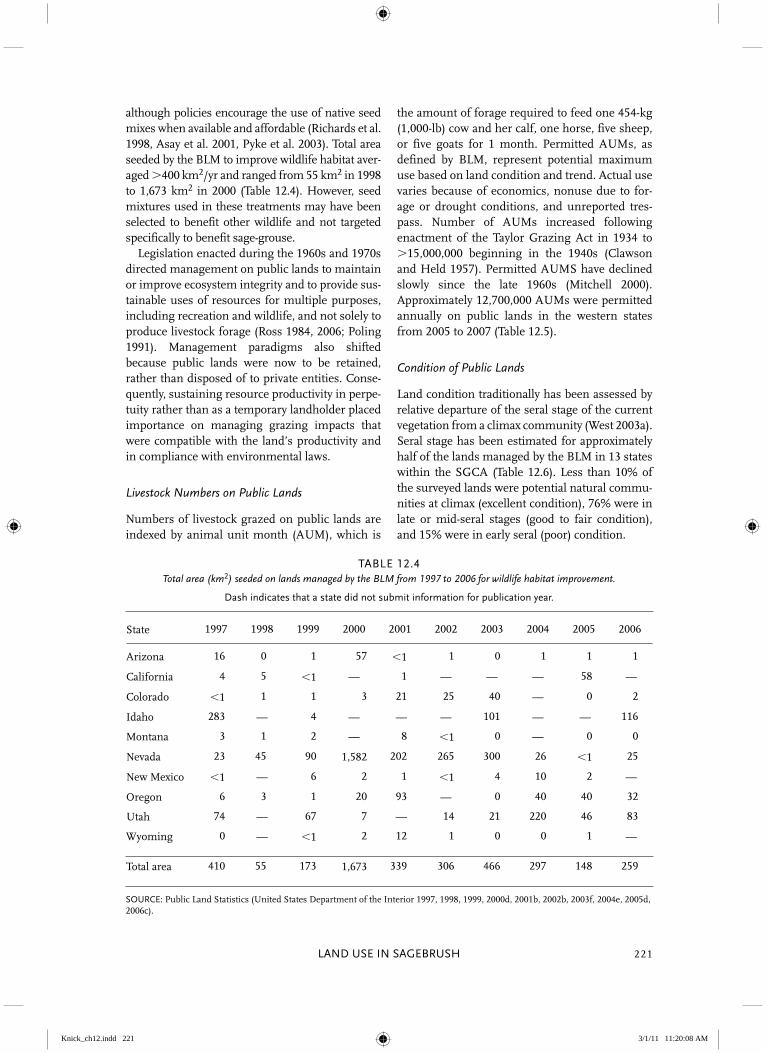
although policies encourage the use of native seed mixes when available and affordable (Richards et al. 1998, Asay et al. 2001, Pyke et al. 2003). Total area seeded by the BLM to improve wildlife habitat aver-aged �400 km2/yr and ranged from 55 km2 in 1998 to 1,673 km2 in 2000 (Table 12.4). However, seed mixtures used in these treatments may have been selected to benefit other wildlife and not targeted specifically to benefit sage-grouse. Legislation enacted during the 1960s and 1970s directed management on public lands to maintain or improve ecosystem integrity and to provide sus-tainable uses of resources for multiple purposes, including recreation and wildlife, and not solely to produce livestock forage (Ross 1984, 2006; Poling 1991). Management paradigms also shifted because public lands were now to be retained, rather than disposed of to private entities. Conse-quently, sustaining resource productivity in perpe-tuity rather than as a temporary landholder placed importance on managing grazing impacts that were compatible with the land’s productivity and in compliance with environmental laws.
Livestock Numbers on Public Lands
Numbers of livestock grazed on public lands are indexed by animal unit month (AUM), which is
the amount of forage required to feed one 454-kg (1,000-lb) cow and her calf, one horse, five sheep, or five goats for 1 month. Permitted AUMs, as defined by BLM, represent potential maximum use based on land condition and trend. Actual use varies because of economics, nonuse due to for-age or drought conditions, and unreported tres-pass. Number of AUMs increased following enactment of the Taylor Grazing Act in 1934 to �15,000,000 beginning in the 1940s (Clawson and Held 1957). Permitted AUMS have declined slowly since the late 1960s (Mitchell 2000). Approximately 12,700,000 AUMs were permitted annually on public lands in the western states from 2005 to 2007 (Table 12.5).
Condition of Public Lands
Land condition traditionally has been assessed by relative departure of the seral stage of the current vegetation from a climax community (West 2003a). Seral stage has been estimated for approximately half of the lands managed by the BLM in 13 states within the SGCA (Table 12.6). Less than 10% of the surveyed lands were potential natural commu-nities at climax (excellent condition), 76% were in late or mid-seral stages (good to fair condition), and 15% were in early seral (poor) condition.
TABLE 12.4Total area (km2) seeded on lands managed by the BLM from 1997 to 2006 for wildlife habitat improvement.
Dash indicates that a state did not submit information for publication year.
State 1997 1998 1999 2000 2001 2002 2003 2004 2005 2006
Arizona 16 0 1 57 �1 1 0 1 1 1
California 4 5 �1 — 1 — — — 58 —
Colorado �1 1 1 3 21 25 40 — 0 2
Idaho 283 — 4 — — — 101 — — 116
Montana 3 1 2 — 8 �1 0 — 0 0
Nevada 23 45 90 1,582 202 265 300 26 �1 25
New Mexico �1 — 6 2 1 �1 4 10 2 —
Oregon 6 3 1 20 93 — 0 40 40 32
Utah 74 — 67 7 — 14 21 220 46 83
Wyoming 0 — �1 2 12 1 0 0 1 —
Total area 410 55 173 1,673 339 306 466 297 148 259
SOURCE: Public Land Statistics (United States Department of the Interior 1997, 1998, 1999, 2000d, 2001b, 2002b, 2003f, 2004e, 2005d, 2006c).
Knick_ch12.indd 221Knick_ch12.indd 221 3/1/11 11:20:08 AM3/1/11 11:20:08 AM

STUDIES IN AVIAN BIOLOGY NO. 38 Knick and Connelly222
Current assessment of land condition is based on ecological criteria rather than on seral stages of plant communities, livestock preferences for a plant species, or a plant species resistance to live-stock grazing (National Research Council 1994). Indicators of soil characteristics and erosion, hydrologic function, biotic integrity, and ecologi-cal processes are integrated into evaluations of the upland’s functioning (Whitford et al. 1998, Pyke et al. 2002, West 2003b). Evaluation of land condition is not directly transferrable to assess-ments for seral stage. Similarly, riparian areas are evaluated for different criteria using techniques that reflect stream geomorphology, stream bank stability, and plant community potential ( Pritchard et al. 1998). Standards and guidelines for management of public grazing lands are established by local
resource advisory councils and also must ad dress habitats and conservation measures for endan-gered, threatened, proposed, candidate, or other at-risk or special status species (United States Department of the Interior 2003d,e). Sixty-three percent (�402,000 km2) of the public lands managed by the BLM have been assessed accord-ing to standards and guidelines. Under estab-lished criteria, 40% of assessed lands (25% of all lands under management by the BLM, includ-ing nonsagebrush habitats) met standards or were making progress toward meeting those standards (category A, Table 12.7). Livestock were a factor in 19% of the assessed lands not meeting standards (categories B and C). Another 5% of the assessed lands were not meeting standards for causes other than livestock graz-ing (category D).
TABLE 12.5Grazing permits and leases in force on public lands from 2005–2007.
AUMs � animal units/month.
2005 2006 2007
State Permits AUMs Permits AUMs Permits AUMs
Arizona 758 660,528 757 660,007 765 660,086
California 555 361,430 548 355,726 541 345,164
Colorado 1,594 664,003 1,591 650,168 1,575 641,314
Idaho 1,889 1,351,806 1,890 1,348,526 1,889 1,358,417
Montana 3,743 1,283,126 3,755 1,281,144 3,765 1,281,748
Nebraska 17 578 17 578 17 578
Nevada 662 2,187,729 644 2,137,635 650 2,132,155
New Mexico 2,286 1,861,231 2,275 1,856,795 2,275 1,862,572
North Dakota 75 9,226 76 9,233 76 9,233
Oklahoma 4 138 4 132 4 132
Oregon 1,284 1,026,548 1,277 1,026,463 1,275 1,028,553
South Dakota 470 73,924 472 73,828 475 73,737
Utah 1,519 1,238,877 1,499 1,239,786 1,490 1,225,890
Washington 294 32,144 283 33,603 279 33,078
Wyoming 2,790 1,949,789 2,792 1,960,956 2,798 1,937,041
Total 17,940 12,701,077 17,880 12,634,580 17,874 12,589,698
SOURCE: Public Land Statistics (United States Department of the Interior 2005d, 2006c, 2007a).
NOTE: Number of grazing permits were combined for Section 15 (lands within grazing districts) and Section 3 (isolated tracts outside of grazing districts).
Knick_ch12.indd 222Knick_ch12.indd 222 3/1/11 11:20:08 AM3/1/11 11:20:08 AM

LAND USE IN SAGEBRUSH 223
Management Actions on Public Lands
Large numbers of treatments are conducted on public lands, including those dominated by sage-brush, for different purposes (Table 12.8). The BLM addressed use of habitat treatments and concluded that treating vegetation was necessary to develop or restore a desired plant community, create biological diversity, increase forage or cover for animals, protect buildings and other facilities, manage fuels to reduce wildfire hazard, manage vegetation community structure, rejuvenate late successional (old-growth) vegetation, enhance forage/browse quality, or remove noxious weeds and poisonous plants (United States Department of the Interior 1991). Over 24,000 km2 managed by the BLM, most of it in Nevada, Idaho, Oregon, and Wyoming, would be treated annually as the preferred strategy to reduce fire risk and to con-trol unwanted vegetation (United States Depart-ment of the Interior 2007b,c). Different combinations of herbicides and sea-sons of applications have been developed to
remove sagebrush, other unwanted woody shrubs, and weedy annuals (Tueller and Evans 1969; Evans and Young 1975, 1977; McDaniel et al. 1991). More recent treatment objectives have emphasized thinning density of sagebrush and control of noxious weeds. Small irregular patch-works of habitat are created in some regions, in contrast to total removal of sagebrush from large areas. The most common herbicides used on lands managed by the BLM are 2,4-D, picloram, and tebuthiuron (United States Department of the Interior 2007c). Under the preferred alterna-tive to reduce fire risk and control unwanted veg-etation, tebuthiuron would be used on 25%, 2,4-D on 18%, and picloram on 15% of the 3,770 km2 treated annually by the BLM (United States Department of the Interior 2007c). Herbicide use can result in short-term decreases in exotic plants. However, long-term benefits (4–16 years) may not be obtained because exotic plants are capable of recolonizing treated sites, particularly when native plant species have also been reduced by herbicide treatments (Rinella et al. 2009).
TABLE 12.6Percent of lands inventoried and by seral condition on public lands managed by the BLM in 2007.
Similarity to the climax vegetation community at a site was 76–100% for potential natural communities, 51–75% for late seral, 26–50% for mid-seral, and 0–25% for early seral stagesa.
State InventoriedPotential natural
community Late seralMid seral Early seral
Unclassified/not inventoried
Arizona 56 8 44 37 11 37
California 15 3 21 45 31 72
Colorado 47 7 27 41 25 50
Idaho 74 2 25 41 33 9
Montanab 74 9 66 24 1 25
Nevada 40 4 38 46 12 58
New Mexico 76 4 24 43 30 24
Oregon and Washington 57 1 28 59 12 36
Utah 61 12 30 44 13 33
Wyoming 59 27 38 30 5 41
Total 54 8 35 41 15 42
SOURCE: United States Department of the Interior (2007a). Statistics were reported for 2007, although surveys to classify sites may have been conducted in previous years or decades.a Potential natural communities are considered by BLM to be in excellent condition, late seral stages to be good, mid-seral to be fair, and early seral to be poor, based on the relationship of current conditions relative to a perceived natural climax condition (West 2003a).b Montana statistics also include North Dakota and South Dakota.
Knick_ch12.indd 223Knick_ch12.indd 223 3/1/11 11:20:08 AM3/1/11 11:20:08 AM

STUDIES IN AVIAN BIOLOGY NO. 38 Knick and Connelly224
Primary actions to facilitate prescriptive livestock grazing on lands managed by the BLM include construction of fences, development or control of water, and habitat modifications (Table 12.8). From 1962 to 1997, �51,000 km of fence were con-structed on land administered by the BLM in states supporting sage-grouse populations (Connelly et al. 2000c). More than 1,000 km of fences were constructed each year from 1996 through 2002, and density of fences exceeds 2 km/km2 in some regions; most fences were constructed in Montana, Nevada, Oregon, and Wyoming (Table 12.8, Fig. 12.8). Water developments were also widespread throughout public lands (Fig. 12.9). Prescribed fire is one of the most common management tools for reducing density of sage-brush, facilitating growth of grasses and forbs, and controlling juniper (Juniperus spp.) and
pinyon (Pinus spp.) woodland expansion into sagebrush habitats (Miller and Eddleman 2001, Baker and Shinneman 2004, Baker 2006a), and for assisting in controlling annual grasses (DiTo-maso et al. 2006). Prescribed fires were conducted on �3,700 km2 of public lands from 1997 through 2006 (Table 12.9). Most areas treated by prescribed fire were in Oregon and Idaho. Area treated under the Emergency Stabilization and Rehabilitation program, designed to rehabili-tate areas following fire, varied from 281 km2 in 1997 to 16,135 km2 in 2002 (Table 12.10). The majority of areas treated after burning were reseeded with differing mixes of shrubs, forbs, and grasses following extensive fires in Idaho, Nevada, and Oregon. The main purpose of this program is to stabilize soils and maintain site pro-ductivity, not to regain site suitability for wildlife.
TABLE 12.7Total area (km2) and percent of assessed landsa managed by the BLM meeting standards and
guidelines established for rangeland healthb.
Category Ac Category Bd Category Ce Category Df Assessed Not assessed Total area
State km2 % km2 % km2 % km2 % km2 % km2 % km2
Arizona 28,839 62 1,452 3 1,035 2 83 0 31,409 68 14,793 32 46,203
California 10,561 32 5,824 18 2,524 8 2,535 8 21,444 65 11,427 35 32,871
Colorado 19,013 60 5,418 17 272 1 4,284 14 28,987 92 2,621 8 31,609
Idaho 13,694 29 15,766 34 2,736 6 4,608 10 36,804 79 10,018 21 46,822
Montanag 25,740 77 3,997 12 420 1 1,598 5 31,755 96 1,478 4 33,233
Nevada 60,572 34 35,726 20 3,524 2 5,060 3 104,882 58 74,488 42 179,370
New Mexico 8,439 17 1,072 2 53 0 397 1 9,961 20 40,816 80 50,777
Oregon/Washington
19,763 35 5,833 10 4,645 8 1,944 3 32,184 58 23,775 42 55,959
Utah 33,961 39 5,147 6 1,576 2 6,508 7 47,191 54 40,624 46 87,816
Wyoming 32,536 45 20,192 28 2,715 4 2,071 3 57,513 80 14,139 20 71,653
Total 253,117 40 100,427 16 19,499 3 29,088 5 402,131 63 234,181 37 636,312
a Percentages were calculated from total assessed area because data do not represent random or stratifi ed sampling of lands managed by the BLM, and no inference could be assumed for lands that have not been assessed.b http://www.blm.gov/nstc/rangeland/rangelandindex.html.c Category A � Meeting standards or making signifi cant progress toward meeting standards.d Category B � Not meeting all standards or making signifi cant progress, but appropriate action has been taken to ensure signifi cant progress toward meeting standards (livestock is a signifi cant factor).e Category C � Not meeting standards or making signifi cant progress toward meeting the standards, and no appropriate action has been taken to ensure signifi cant progress (livestock is a signifi cant factor).f Category D � Not meeting standards or making signifi cant progress toward meeting the standards, due to causes other than livestock grazing.g Montana statistics include North Dakota and South Dakota.
Knick_ch12.indd 224Knick_ch12.indd 224 3/1/11 11:20:08 AM3/1/11 11:20:08 AM

TAB
LE 1
2.8
Num
ber o
f hab
itat
trea
tmen
ts (
1929
–200
4) o
n la
nds
man
aged
by
the
BLM
.
Hab
itat
trea
tmen
tA
ZC
AC
OID
MT
ND
NM
NV
OR
SDU
TW
AW
YTo
tals
Un
know
n9
20
15
23
30
12
40
18
91
25
283
Fen
ces
1,489
669
3,051
3,717
5,790
48
1,445
3,489
3,451
357
3,265
239
5,278
32,288
Fen
ce m
odifi
cat
ion
16
9149
17
7
23
89
17
423
345
Haz
ard
redu
ctio
n1
828
47
9
15
10
2
4
115
Lake
/wet
lan
d im
prov
emen
t21
8
817
2
7
12
10
884
Lan
d tr
eatm
enta
30
15
253
158
82
78
77
54
4141
11
73
976
Mis
c. f
acili
ty im
prov
emen
t468
173
1,038
1,254
1,420
368
1,480
1,263
10
1,300
41
644
9,459
Per
ch/n
esti
ng
stru
ctu
re
2
67
2
33
6
11
44
84
Stre
am b
ank
stab
iliza
tion
1
18
413
1
211
1
32
56
Stre
am im
prov
emen
t
835
11
13
3
114
17
422
128
Tim
ber
stan
d im
prov
emen
t
823
91
3
115
1
112
74
Veg
etat
ion
man
ipu
lati
on220
207
880
1,585
445
9681
895
1,089
14
824
66
481
7,396
Wee
d co
ntr
olb
2
138
67
320
331
12
126
15
14
294
42
1,064
Wat
er d
evel
opm
ent/
con
trol
2,180
1,180
9,189
5,01710,587
56
2,247
5,163
7,555
561
5,292
130
7,813
56,970
Wat
er f
acili
ties
mod
ifi e
d
15
49
65
15
3
3126
120
238
337
Tota
l hab
itat
trea
tmen
ts4,420
2,311
14,736
12,12018,766
116
4,884
11,19413,831
963
10,995
816
14,509109,661
SOU
RC
E: B
ure
au o
f La
nd
Man
agem
ent R
ange
Im
prov
emen
t Pro
ject
s da
taba
se.
a In
clu
des
con
tou
r fu
rrow
ing,
rip
pin
g an
d de
ep ti
llage
, pit
tin
g, te
rrac
ing,
ch
ecks
, an
d sc
alpi
ng.
b In
clu
des
biol
ogic
al a
nd
chem
ical
trea
tmen
ts, b
ladi
ng,
cu
ttin
g or
bea
tin
g, c
hai
nin
g or
cab
ling,
ch
ippi
ng,
log
and
scat
ter,
plow
ing,
pre
scri
bed
fi re
, an
d w
ildfi
re.
Knick_ch12.indd 225Knick_ch12.indd 225 3/1/11 11:20:08 AM3/1/11 11:20:08 AM

Figure 12.9. Water developments on lands managed by the Bureau of Land Management (Bureau of Land Management Range Improvement database). Locations of water development are recorded to the nearest 2.59 km2.
Figure 12.8. Linear density (km/km2) of fences (estimated from allotment and pasture boundaries) on public lands in the Sage-Grouse Conservation Area (GIS coverages obtained from Bureau of Land Management Geocommunicator).
Knick_ch12.indd 226Knick_ch12.indd 226 3/1/11 11:20:08 AM3/1/11 11:20:08 AM

TABLE 12.9Total area (km2) treated by prescribed fi re on lands managed by the BLM from 1997–2006.
Dashes indicate states that did not submit information for publication year.
State 1997 1998 1999 2000 2001 2002 2003 2004 2005 2006
Arizona 8 95 94 40 48 52 15 3 57 0
California 16 45 21 22 3 7 — — 4 —
Colorado 3 56 46 2 2 24 4 — 0 2
Idaho 11 64 102 43 100 59 8 — — 6
Montana 3 18 31 15 34 12 10 — 0 20
Nevada 10 2 3 �1 10 28 13 7 24 2
New Mexico 60 131 71 15 34 53 95 3 8 —
Oregon 72 169 225 55 86 223 59 81 81 73
Utah 11 24 30 33 64 19 25 19 15 32
Wyoming 59 117 138 23 11 20 43 43 74 —
Total area 253 720 764 251 393 497 272 156 263 135
SOURCE: Public Land Statistics (United States Department of the Interior 1997, 1998, 1999, 2000d, 2001b, 2002b, 2003f, 2004e, 2005d, 2006c).
TABLE 12.10Number of projects (N) and total area (km2) treated for emergency fi re rehabilitation
on lands managed by the BLM from 2002–2007.
2002 2003 2004 2005 2006 2007
State N km2 N km2 N km2 N km2 N km2 N km2
Arizona 0 0 2 1 4 9 15 4 17 138 15 6
California 19 34 11 278 37 467 27 432 27 396 21 476
Colorado 16 52 7 170 18 138 15 99 19 9 20 26
Idaho 85 2,900 51 1,524 53 1,345 52 926 92 3,611 115 5,943
Montana 3 8 4 82 6 601 6 311 11 335 4 211
Nevada 103 11,226 111 3,099 108 2,235 65 278 182 6,926 176 15,697
New Mexico 0 1 3 1 1 5 1 10 1 7 1
Oregon 50 1,392 46 2,858 39 2,318 24 493 58 593 63 1,689
South Dakota 0 1 8 1 4 1 �1 1 8 0 0
Utah 27 409 54 925 76 627 77 974 115 1,931 122 2,124
Washington 0 2 1 2 32 2 35 1 2 2 9
Wyoming 5 113 6 301 6 17 6 0 5 25 4 0
Total 308 16,134 296 9,250 351 7,794 295 3,553 538 13,975 549 26,182
SOURCE: Public Land Statistics (United States Department of the Interior 2002b, 2003f, 2004e, 2005d, 2006c, 2007a).
Knick_ch12.indd 227Knick_ch12.indd 227 3/1/11 11:20:17 AM3/1/11 11:20:17 AM