ecological effects of wave energy development in the
TRANSCRIPT

Ecological Effects of Wave Energy Development in the Pacific Northwest
A Scientific Workshop, October 11–12, 2007
George W. Boehlert, Gregory R. McMurray, and Cathryn E. Tortorici, editors
U.S. Department of Commerce National Oceanic and Atmospheric Administration National Marine Fisheries Service
NOAA Technical Memorandum NMFS-F/SPO-92


Ecological Effects of Wave Energy Development in the Pacific Northwest
A Scientific Workshop, October 11–12, 2007
George W. Boehlert1, Gregory R. McMurray2, and Cathryn E. Tortorici3, editors
Workshop Steering Committee: George Boehlert, OSU Hatfield Marine Science Center; Robin Hartmann, Oregon Shores Conservation Coalition; Maurice Hill, U.S. Minerals Management Service; Justin Klure, Oregon Wave Energy Trust; Greg McMurray, Oregon Department of Land Conservation and Development; John Meyer, Communication Partnership for Science and the Sea, OSU; Cathy Tortorici, NOAA-NMFS
1Oregon State University, Hatfield Marine Science Center, 2030 SE Marine Science Dr., Newport, Oregon 97365 2Oregon Department of Land Conservation and Development, Ocean and Coastal Services Division, 635 Capitol
Street NE, Suite 150, Salem, Oregon 97301-2540 3NOAA-NMFS Northwest Region, 1201 NE Lloyd Blvd., Portland, Oregon 97232
NOAA Technical Memorandum NMFS-F/SPO-92 September 2008
U.S. Department of Commerce Carlos M. Gutiérrez, Secretary
National Oceanic and Atmospheric Administration Vice Admiral Conrad C. Lautenbacher, Jr., USN (Ret.) Under Secretary for Oceans and Atmosphere
National Marine Fisheries Service James W. Balsiger, Acting Assistant Administrator for Fisheries

ii
Suggested citation: Boehlert, G. W, G. R. McMurray, and C. E. Tortorici (editors). 2008. Ecological effects of wave energy in the Pacific Northwest. U.S. Dept. Commerce, NOAA Tech. Memo. NMFS-F/SPO-92, 174 p.
A copy of this report may be obtained from: Northwest Fisheries Science Center NMFS, NOAA 2725 Montlake Boulevard East Seattle, Washington 98112
Or online at: http://spo.nmfs.noaa.gov/tm/
iii
Contents
Executive Summary ...................................................................................................................................... v Acknowledgments........................................................................................................................................ ix Introduction and Workshop Objectives George W. Boehlert, Oregon State University, Hatfield Marine Science Center ......................................... 1 Presentations—Extended Abstracts .............................................................................................................. 5
Wave Energy Interest in the Oregon Coast: Policy and Economic Considerations Justin Klure, Oregon Wave Energy Trust................................................................................................. 5 The Oregon Shelf/California Current System’s Ecological Setting Bill Peterson, NOAA-NMFS, NWFSC ...................................................................................................... 7 The Technology: Wave Energy Development on the West Coast Mirko Previsic, re vision consulting, LLC.............................................................................................. 15 Environmental Risk Analysis and Wave Energy: Examples of How to Assess Potential Impacts of Wave Energy on the Environment Maurice L. Hill and Fred M. Piltz, U.S. Minerals Management Service ............................................... 22
Wave Energy Ecological Effects Workshop Ecological Assessment Briefing Paper Gregory McMurray, Oregon Department of Land Conservation and Development.................................. 25
Introduction ............................................................................................................................................ 25 The Technology...................................................................................................................................... 25 The Affected Environment: Oregon’s Continental Shelf ....................................................................... 32 Environmental Effects ............................................................................................................................ 51 Bibliography and Literature Cited .......................................................................................................... 63
Breakout Groups ......................................................................................................................................... 67 Introduction to the Breakout Groups John Meyer, Oregon State University, and Robin Hartmann, Oregon Shores Conservation Coalition ................................................................................................................................................. 67 Receptor Breakout Group Report: The Physical Environment .............................................................. 69 Receptor Breakout Group Report: Pelagic Habitat................................................................................. 74 Receptor Breakout Group Report: Benthic Habitat ................................................................................ 78 Receptor Breakout Group Report: Fish and Fisheries ............................................................................ 84 Receptor Breakout Group Report: Marine Birds.................................................................................... 89 Receptor Breakout Group Report: Marine Mammals............................................................................. 95 Stressor Breakout Group Report: Energy Absorbing Structures .......................................................... 101 Stressor Breakout Group Report: Chemical Effects ............................................................................. 106 Stressor Breakout Group Report: Hard Structures and Lighting.......................................................... 110 Stressor Breakout Group Report: Acoustics......................................................................................... 114 Stressor Breakout Group Report: Electromagnetic Effects .................................................................. 121 Breakout Group Report: System View and Cumulative Effects .......................................................... 125
Workshop Integration and Synthesis Cathy Tortorici, NOAA-NMFS ................................................................................................................. 133 Glossary, Abbreviations, and Acronyms .................................................................................................. 139 Appendix 1: Workshop Agenda............................................................................................................... 147

iv
Appendix 2: Ecological Effects of Wave Energy Development in the Pacific Northwest: Prospectus for a Science Workshop.......................................................................................................... 149 Appendix 3: Workshop Participants ........................................................................................................ 153 Appendix 4: Keynote Address— Ocean Zoning: Implications for Wave Energy Development (WED) Richard G. Hildreth .................................................................................................................................. 159 Appendix 5: Environmental Consequences of Wave Energy Extraction along the Shores of the U.S. Pacific Northwest: The Physical Environment ......................................................................................... 163

v
Executive Summary
Background
The Pacific Northwest has significant opportunity to develop the capacity to harvest wave energy off its coast as a clean, renewable resource. While the technology and interest is advancing rapidly, it is important to understand the potential effects of wave energy technology on the ecological and physical components of coastal ecosystems. A workshop to address these issues was organized at Oregon State University’s Hatfield Marine Science Center in Newport, Oregon, on October 11–12, 2007. The workshop’s problem statement was as follows:
The conversion of ocean waves into electricity has the potential to provide clean, reliable, and low-cost electricity to the economy while producing minimal impacts on the environment. However, in order for wave energy to develop and fulfill these assumptions, we must reduce the uncertainties about the technology's effects on the marine environment. We must assess the potential environmental impacts of wave energy, determine what is known and unknown, and identify a rigorous set of scientific studies to address concerns. This information is needed to support the permitting process as well as to make responsible decisions to site facilities and to minimize environmental impacts.
Workshop Objectives and Structure
A diverse group of some 50 marine scientists from around the country participated in the workshop. Principal objectives were 1) to develop an initial assessment of the potential impacting agents and ecological effects of wave energy development, and 2) to formulate a general conceptual framework of physical and biological relationships that can be applied to specific wave energy projects. Presentations on the physical and biological environment, the
wave energy technologies being considered, and frameworks for environmental risk analysis (which were adopted for this workshop) set the stage for a common understanding among participants. This was followed by a series of breakout sessions to address these questions:
• What is known about important wave energy facilities, their associated components (such as cables, anchors, and buoys), and their effect on the physical and biological systems?
• What is unknown about these relationships, and what are key information gaps?
• What is the level of uncertainty or agreement among scientists about these interactions?
• Can we prioritize important ecological issues (e.g., key interactions)?
• What studies, monitoring, or mitigation measures should be employed to help minimize or better understand effects?
Two sets of breakout sessions were convened. The first dealt with “receptors,” or specific elements of the ecosystem where the potential for a demonstrable response to wave energy development may exist. The second focused on “stressors,” specific wave energy components that may interact with a suite of ecosystem elements. Stressors may occur during installation, operation, or decommissioning of facilities. A summary of the initial key findings from each group as reported during the workshop follows.
Results
Receptor breakout groups
For the Physical Environment, workshop participants suggested there could be significant wave reduction resulting from wave energy production, with possible beach effects (e.g., changes to sediment transport processes); pilot

vi
projects to understand and model wave reduction effects are needed. Mitigation for physical changes should be developed through analysis of project geometry, density, and distance from shore; additionally, it was suggested that buoys should not be placed in sensitive areas (i.e., closer to shore than 40 m depth).
In the Pelagic Habitat, buoys will likely have a minimal impact on phytoplankton, but positive effects (through aggregation) on forage fish species—this in turn could result in attraction of larger predators. Structures need to minimize loose lines to reduce potential entanglement of marine turtle species. Adding structure may induce increased settlement of meroplankton species, and potential effects of electromagnetic fields (EMF) are currently unknown.
Immediate changes to the Benthic Habitat will likely result from modifications to water circulation and currents. Larval distribution and sediment transport may change both in the benthos and on beaches. Additionally, the fouling community growth on buoys, anchors, and lines may adversely affect the benthic environment if deposited into accumulations on the seafloor (e.g., by sloughing off or by routine maintenance of mooring lines and buoy structures). Effects on the benthos will likely scale in a nonlinear fashion, affected by connectivity as multiple facilities interact—for example, as stepping stones for invasive species.
Wave energy development can affect community structure for Fish and Fisheries through changes in species composition and predator effects (e.g., attraction of predators that were previously absent). New structures may affect migration corridors (e.g., for salmon, Dungeness crabs, elasmobranchs, and sturgeon), potentially mediated through behavioral effects resulting from EMF, chemical, and acoustic signals. Effects on fishery access and gear entanglement are also anticipated, but were not topics of this workshop.
For Marine Birds, lighting and above-water structures may result in collisions and attraction
to buoys. Structures may also alter food webs and beach processes, in turn affecting shorebirds. Data gaps to be filled include spatial and temporal abundance of birds, bird activity at night, important areas of bird activity that should be avoided, important migration patterns, and potential effects on seabird prey.
A diversity of concerns exists for Marine Mammals; the nature of mooring cables (slack v. taut; horizontal v. vertical; diameter) is critical to entanglement issues. Fundamental baseline data will be needed (mammal biology, presence/absence/species diversity, information on prey species) to understand projects’ impacts and long-term buildout scenarios. There is some need for immediate monitoring of cetaceans (e.g., videography, beachings, tagging, vessel surveys) to understand how they interact with wave energy facilities.
Stressor breakout groups
Energy Absorbing Structures (e.g., buoys, wave snakes, etc.) affect a suite of receptors, and consequently should not be established within sensitive habitats and areas. (Shallow coastal waters are sensitive ecologically; some suggested that wave energy facilities should stay outside 100 m.) Impacts can be minimized by working with industry ahead of time. Energy devices that focus or trap water in the nearshore environment will be especially problematic due to the sensitive areas nearshore.
When addressing Chemical Effects, it is important to distinguish between spills as a source of chemicals (low probability but high impact) versus continuous release of chemicals, for example in fouling paints. It will be important to understand effects at the community level—do chemicals bioaccumulate and pass through trophic levels? Chemicals can move over a large area, depending on the currents. Information is needed on the nature of toxic compounds to be used, potential amounts that could be released, responses of receptors, and the fate of the contaminants.
New Hard Structures and Lighting will be a part of any wave energy structure, requiring the

vii
industry to consider mitigation measures for devices breaking loose and debris accumulation. Important regulations under several laws (e.g., the ESA, EFH, MMPA, NEPA, and MBTA) must be closely followed as the industry develops. It is important to understand how new hard surfaces may alter bottom communities, as well as to synthesize existing data and use it to help answer questions about impacts and identify important environmentally sensitive areas that can be avoided.
The Acoustics group noted that understanding noise coming from the buoys and cables and how fish and marine mammals will or could react is critical. It is possible to model noise from buoys and cables and use that information to assess impacts from various scales of wave energy facility buildout, but it was noted that the synchrony of noise from buoys could exacerbate noise or create noise not previously considered. Wave energy facilities, depending on their size and layout, could create a sound barrier that mammals would avoid. Some fish species are especially sensitive to acoustics; this could result in food chain effects since some species are prey for marine mammals.
Electromagnetic Effects from both induced and galvanic fields are most likely to affect animals that use EMF for orientation or feeding. Induced or galvanic fields are most likely to affect feeding, whereas magnetic fields will likely have greater effects on orientation. Salmon, crab, sturgeon, and sharks and rays (and
albacore under certain oceanographic conditions) are the species most likely to be affected. Major areas of uncertainty exist on the effect of EMF on receptors, so before-and-after baseline assessment of local magnetic fields is needed. Controlled experiments are difficult and complex (confounded with other stressors).
The System View/Cumulative Effects group focused on issues likely to occur as projects scale up; risks are a function of the extent, density, and duration of project operation. In order to understand effects, impact thresholds need to be established. As projects scale up in location or implementation, new risk end points come into play that were not initially part of the assessment. Other activities can be displaced (e.g., fishing pressure allocated to other areas, marine mammals altering migration paths, etc.). Therefore, adaptive management is critical to address long-term impacts.
Conclusions
There is an urgency to the need for environmental studies of wave energy conversion. Throughout the workshop, the importance of evaluating ecological effects at any wave energy demonstration study sites or pilot scale facilities was stressed. These evaluations will help reduce uncertainty of effects for all stressors and all receptor groups, leading to improvements in the best practices for design of devices and arrays and to performance standards and monitoring requirements that can be applied to commercial-scale development.


ix
Acknowledgments
It took a great deal of work to develop this workshop; it would not have been possible without the support of many organizations and individuals. Organization of the workshop was developed by a Steering Committee consisting of seven individuals: George Boehlert, OSU; Robin Hartmann, Oregon Shores Conservation Coalition; Maurice Hill, U.S. Minerals Management Service; Justin Klure, Oregon Wave Energy Trust; Greg McMurray, Oregon DLCD; John Meyer, COMPASS; and Cathy Tortorici, NOAA-NMFS. Amy Windrope, formerly of COMPASS, was involved in the early organization. We also thank Keith Kirkendall of NOAA-NMFS for stepping in at the last minute as one of our breakout group facilitators.
For financial support of workshop costs (e.g., logistics, travel, editing and publication), we gratefully acknowledge the federal agencies (NOAA National Marine Fisheries Service, Minerals Management Service, Department of Energy’s National Renewable Energy Laboratory), State of Oregon agencies (Department of Land Conservation and Development, Department of State Lands, Department of Energy, Parks and Recreation Department), Oregon State University (Institute for Natural Resources, Hatfield Marine Science Center), private and public utilities (Portland General Electric, PacifiCorp, Central Lincoln People’s Utility District), Lincoln County, the Communication Partnership for Science and the Sea, Oregon Wave Energy Trust, and the Yaquina Bay Economic Foundation.
We thank OSU’s Hatfield Marine Science Center for hosting the workshop; arrangements and logistics were ably supported there by Ken Hall, Joel Colvin, Dann Cutter, and Shawn Brateng. The Oregon Coast Aquarium hosted the evening event. Peter Vince and the Toledo High School Video Production Team did a great job of recording the proceedings of the plenary and keynote presentations. Michele Redmond of Scientific Notations LLC, South Beach, Oregon, edited the proceedings, bringing many disparate reports to a common and understandable format. Finally, we thank several anonymous reviewers for comments on selected breakout groups, and for review of the entire document, we thank Rod Fujita (Environmental Defense Fund) and Roger Bedard (Electric Power Research Institute).


Introduction and Workshop Objectives
George W. Boehlert, Oregon State University, Hatfield Marine Science Center
Development of renewable energy resources is a major priority in many parts of the world, and some contend that it represents one of mankind’s best hopes of minimizing global warming (Krupp and Horn 2008). Wind, solar, and biomass energy are all in various stages of development. Ocean energy is an area of great promise that has yet to be highly developed. Hydrokinetic energy from tidal, current, and wave sources represents immense potential for electrical energy generation; ocean thermal energy conversion in tropical regions also holds promise. Marine wind energy in coastal areas is under active development, particularly in regions where terrestrial wind farms are not appropriate due to lack of wind or lack of usable land area. In this context, development of renewable ocean energy is occurring rapidly, but is not without environmental and social concerns (Pelc and Fujita 2002, EMEC 2005, Cada et al. 2007, Weiss et al. 2007). Displacement of other ocean uses and environmental concerns must be taken into account.
Ocean wave energy can provide clean and renewable power in many parts of the world. The wave climate along the west coast of North America represents one of the best prospects for development. In addition to the relatively consistent and predictable wave energy produced across the long fetch in the North Pacific, this region possesses the coastal infrastructure and the demand for electrical power generation (Bedard et al. 2005). Accordingly, the move to develop wave energy has been proceeding rapidly. Directed government action has been taken to move this activity forward. In Oregon, for example, the establishment of the Oregon Wave Energy Trust (OWET) highlights the importance of wave energy resources, and tax benefits for renewable energy projects (such as the existing Business Energy Tax Credit) add stimulus for
development. Concurrent development of the technologies for wave energy extraction is evident in both the private sector and in academic institutions. Power companies and others are rapidly establishing claims to regions of the coastal ocean through applications to the Federal Energy Regulatory Commission (FERC).
Lagging behind the development of technology and movements to identify the location of coastal wave energy facilities, however, has been the assessment of potential impacts. Any renewable ocean energy project will have associated environmental effects as well as other costs and benefits (Pelc and Fujita 2002, Weiss et al. 2007). More effort is required in two broad areas, either of which has the potential to stall or hinder projects in the coastal ocean (see, for example, Williams and Whitcomb 2007). First, the socioeconomic and cultural impacts on other ocean users and on coastal communities are far-reaching. Wave energy installations have the potential to displace existing ocean uses, and stakeholders from those user groups must be consulted in a participatory manner as plans for a project are developed. Second, as with any new technology, insufficient information on the environmental effects of wave energy extraction is available. Little is known about the technology, much of which is under development (Callaway 2007; Previsic, this volume). Construction processes and site preparation, deployment, operation, power transmission, servicing, decommissioning, and the physical structures of the wave energy devices and the mooring systems all may have an uncertain level of impact on the marine environment. The most comprehensive examination of potential environmental effects to date has been in Scotland (e.g., Wilson and Downie 2003, Faber Maunsell and METOC

2
PLC 2007a). A flow chart (Figure 1) from the Scottish Environmental Assessment demonstrates the degree of complexity. Similar efforts in the United States have been instituted by the U.S. Minerals Management Service (Michel et al. 2007).
This workshop was designed with a focus on the Pacific Northwest. A steering committee* was formed to develop the workshop concept, and decided to limit the scope to environmental issues associated with wave energy development. Socioeconomic questions broaden the area of discussion and the number of stakeholders who must participate—they are thus deserving of a separate, focused discussion. The committee identified two principal goals for the workshop: 1) to develop an initial assessment of the potential impacting agents and ecological effects of wave energy development in the coastal ocean, and 2) to develop a general framework that can applied to specific wave energy projects. We also identified the following problem statement:
The conversion of ocean waves into electricity has the potential to provide clean, reliable, and low-cost electricity to the economy while producing minimal impacts on the environment. However, in order for wave energy to develop and fulfill these assumptions, we must reduce the uncertainties about the technology’s effects on the marine environment. We must assess the potential environmental impacts of wave energy, determine what is known and unknown, and identify a rigorous set of scientific studies to address concerns. This information is needed to support the permitting process as well as to
* Steering Committee: George Boehlert, OSU Hatfield Marine Science Center; Robin Hartmann, Oregon Shores Conservation Coalition; Maurice Hill, U.S. Minerals Management Service; Justin Klure, Oregon Wave Energy Trust; Greg McMurray, Oregon Department of Land Conservation and Development; John Meyer, Communication Partnership for Science and the Sea, OSU; Cathy Tortorici, NOAA-NMFS.
make responsible decisions to site facilities and to minimize environmental impacts.
The general framework was laid out in a plenary presentation (see Hill and Piltz, this volume). The workshop was structured to evaluate a broad range of environmental impacts as they relate to the development and operation of wave energy facilities. Workshop participants were chosen for their technical and ecological expertise, as opposed to knowledge of wave energy; this resulted in a diverse group of scientists from academia, government, industry, and nongovernmental organizations (see Appendix 3). They were provided with background on wave energy in two ways. First, all participants were sent a background paper explaining the concepts and technology associated with wave energy development, and a preliminary assessment of potential environmental and ecological considerations; that paper is included in this volume. Second, the first half-day of the workshop was devoted to plenary presentations on technology, policy, the ecological and physical setting of the coastal ocean in the Pacific Northwest, and the context for environmental risk analysis (Agenda, Appendix 1).
Specific focus for the workshop was developed through breakout groups examining receptors (elements of the ecosystem potentially impacted by wave energy development) and stressors (changes that wave energy will bring that may have impacts). These small groups addressed specific questions with the intent of examining the risks and uncertainty associated with wave energy development, as well as ways to mitigate those risks.
This workshop developed a framework to evaluate the possible environmental and ecological impacts of wave energy development. As the product of the workshop, this document is intended to serve as a starting point for further discussion. The breakout groups have identified the principal issues in their respective areas, but we acknowledge that a workshop less than two days in duration cannot comprehensively identify the issues within each specific topic. As

3
we move forward with the development of sustainable, renewable energy in the coastal ocean, we hope that this document can serve as a basis for evaluating projects along our coast.
Literature Cited
Bedard, R., G. Hagerman, M. Previsic, O. Siddiqui, R. Thresher, and B. Ram. 2005. Offshore wave power feasibility demonstration project: Final summary report, project definition study, EPRI Global WP 009–US Rev 1, Jan. 14, 2005. Electrical Power Research Institute, Palo Alto, CA.
Cada, G., J. Ahlgrimm, M. Bahleda, T. Bigford, S. D. Stavrakas, D. Hall, R. Moursund, and M. Sale. 2007. Potential impacts of hydrokinetic and wave energy conversion technologies on aquatic environments. Fisheries 32:174–181.
Callaway, E. 2007. To catch a wave. Nature 450:156–159.
EMEC. 2005. Environmental impact assessment (EIA) guidance for developers at the European Marine Energy Centre. European Marine Energy Centre, Ltd., Orkney, Scotland. Online at http://www.emec.org.uk/emec_documents.asp [accessed 23 August 2008].
Faber Maunsell and METOC PLC. 2007a. Scottish marine renewables strategic environmental assessment report. Prepared for the Scottish Executive by Faber Maunsell and METOC PLC. Online at http://www.seaenergyscotland.co.uk/ [accessed 7 May 2008].
Faber Maunsell and METOC PLC. 2007b. Informing the future development of marine renewable energy. Environmental report section E: Scottish marine renewables strategic
environmental assessment report. Prepared for the Scottish Executive by Faber Maunsell and METOC PLC. Online at http://www .seaenergyscotland.co.uk/ [accessed 7 May 2008].
Pelc, R., and R. Fujita. 2002. Renewable energy from the ocean. Mar. Pol. 26:471–479.
Krupp, F., and M. Horn. 2008. Earth: The sequel: The race to reinvent energy and stop global warming. Norton and Company, New York.
Michel, J., H. Dunagan, C. Boring, E. Healy, W. Evans, J. M. Dean, A. McGillis, and J. Hain. 2007. Worldwide synthesis and analysis of existing information regarding environmental effects of alternative energy uses on the outer continental shelf. MMS OCS Report 2007-038. U.S. Dept. of the Interior, Minerals Management Service, Herndon, VA.
Weiss, J. C., B. B. Boehlert, and R. E. Unsworth. 2007. Assessing the costs and benefits of electricity generation using alternative energy resources on the outer continental shelf. OCS Study MMS 2007-013. U.S. Dept. of the Interior, Minerals Management Service, Offshore Environmental Division, Herndon, VA.
Williams, W., and R. Whitcomb. 2007. Cape Wind: Money, celebrity, class, politics, and the battle for our energy future on Nantucket Sound. Perseus Books, Cambridge, MA.
Wilson, S., and A. J. Downie. 2003. A review of possible marine renewable energy development projects and their natural heritage impacts from a Scottish perspective. Scottish Natural Heritage Commissioned Report F02AA414.

4
Figure 1. Factors that must be considered in the development of wave energy. From Faber Maunsell and
METOC PLC (2007b).

5
Presentations—Extended Abstracts
Wave Energy Interest in the Oregon Coast: Policy and Economic Considerations
Justin Klure, Oregon Wave Energy Trust
There is a need to develop new forms of
energy to meet worldwide demand for electricity, which the Energy Information Administration estimates will increase approximately two percent each year. Investments in renewable energy, including wave energy, can create new jobs and economic development while producing no carbon dioxide emissions. The United States currently relies on fossil energy (coal, oil, and natural gas) to supply over 87% of its energy needs. Fossil resources are finite and are currently facing global supply constraints. Oregonians spent $10 billion on energy in 2006. The northwestern region of the United States generates approximately 45% of its energy from hydroelectric facilities in rivers. However, a significant amount of this energy is sold into other regions of the United States and compensated by electricity produced from coal to meet the Northwest demand.
The Oregon Wave Energy Trust (OWET) is a newly formed not-for-profit organization designed to help guide the development of wave energy in Oregon. The mission of OWET is to build and share the expertise needed to accelerate the development of the wave energy industry in a responsible manner. Goals of the organization include developing safe, reliable, renewable energy; promoting the industry and creating new jobs; ensuring responsible development; diversifying Oregon’s technology; and leveraging Oregon’s investment. OWET is sponsored by the Oregon Community Development Fund and guided by the Oregon Innovation Council.
The Energy Information Administration estimates national energy demand to be 4,200 terawatt hours per year (TWh/yr) by the year
2010. The Electric Power Research Institute estimates the amount of wave energy potential along the U.S. West Coast to be 440 TWh/yr, representing approximately 10% of U.S energy demands in the year 2010.
Currently over 1,000 patents have been filed for the multiple technologies capable of harnessing energy from the ocean waves. Wave energy technologies can be categorized into four main areas: point absorbers, oscillating water columns, attenuators, and overtopping devices. A point absorber utilizes the heaving motion (up and down) of the ocean wave to produce electricity. The oscillating water column takes advantage of the pressure variance of the ocean wave as it moves in and out of the device. The overtopping device takes advantage of the wave as it crests over the device and then is gravity-fed into a turbine. The attenuator utilizes both the up-and-down and side-to-side motions as it interacts with the ocean wave to generate electricity.
The ocean is the largest, most concentrated source of renewable energy on Earth. Wave energy is a form of solar energy. Water is extremely dense when compared to air, and therefore contains more energy. Wave energy has many advantages including but not limited to availability (stable resource), predictability, close proximity to electrical load centers, transmission grid firming, low visual impact, no fuel input or price volatility, and no carbon dioxide emissions. Ocean energy has the potential to provide a significant amount of the United States’ electricity needs.
Significant challenges exist to the development of wave energy in Oregon. Education and outreach to local coastal

6
communities are critical for the development of the industry. Local communities must be engaged in the process of siting ocean wave projects. The cost of converting the ocean waves into electricity is more expensive than conventional resources, and the optimal technology for conversion of energy into electricity has yet to be identified. There is a significant lack of environmental data for the Oregon coast and the interaction of wave energy facilities with the ocean ecosystem is unknown. The territorial sea and waters beyond are heavily utilized for fishing, recreation, and other activities. Wave energy projects must be compatible with other ocean uses. The regulatory framework for wave energy projects relies on existing state and federal hydroelectric laws designed for dams in rivers, and does not apply to the issues of siting a wave energy project. An Oregon-coast-wide comprehensive plan is needed that will incorporate past, present, and future uses of the ocean resource.
The most significant Oregon policy driver for the development of renewable energy is the Renewable Portfolio Standard (RPS) established by the 2007 Oregon State Legislature. The RPS requires that investor-owned utilities must generate 25% of their electricity supplies from renewable energy resources by the year 2025. The State of Oregon also administers tax credits and energy loans that support renewable energy
development. In addition, utility policy considerations are being discussed at Bonneville Power Administration regarding public power contracts and transmission issues. The Ocean Policy Advisory Council (appointed by the Governor) is responsible for developing ocean policy for Oregon’s ocean resource.
Seven wave energy projects are currently proposed in Oregon. The Federal Energy Regulatory Commission (FERC) has jurisdiction for licensing hydrokinetic energy projects. The FERC licensing process is extensive and requires public outreach and a robust environmental study and monitoring plan prior to the awarding of a hydroelectric license.
The wave energy industry is commonly compared to the wind industry of 15–20 years ago. The wind industry currently represents a $60 billion (and growing) market, and is now cost-competitive with other conventional energy resources. Wave energy development in Oregon has the potential to create new jobs and other forms of economic development. Oregon has the potential to lead the development of the wave energy industry in the United States. However, the burden of proof remains on the industry to create new jobs, deliver clean energy to consumers, and exist and operate in harmony with the natural environment and existing ocean users.

7
The Oregon Shelf/California Current System’s Ecological Setting
Bill Peterson, NOAA-NMFS, NWFSC
Upwelling and Productivity
The purpose of this presentation is to broadly set the stage of the ecological setting and the major processes in the coastal ocean off the Pacific Northwest. The marine and anadromous resources along the west coast of the United States occupy diverse habitats in the coastal ocean off Washington, Oregon, and California—a biogeographic region that is collectively termed the Coastal Upwelling Domain (Ware and McFarlane 1989). Within this domain, several smaller-in-scale physical zones are recognized:
1. A nearshore zone where mysids, juvenile fall Chinook salmon (Oncorhynchus tshawytscha), sand lance (Ammodytes hexapterus), smelts, Dungeness crabs (Cancer magister), and gray whales (Eschrichtius robustus) reside, and which includes sand, rocky shore, and intertidal habitats. Small estuaries and river mouths also play a role in this zone.
2. The middle and outer continental shelf where juvenile and adult coho (Oncorhychus kisutch) and Chinook salmon reside along with abundant krill and seasonally changing fish and plankton communities.
3. The upper 10–20 m of the water column across the continental shelf and slope where many of the pelagic fishes, including juvenile coho and Chinook, reside.
4. The benthic and demersal habitats where various fishery resources reside, including the continental shelf (Dungeness crabs, English sole [Parophrys vetulus]), the shelf break (whiting, rockfish), and beyond the shelf break to depths of 1,500 m (sablefish
[Anoplopoma fimbria], Dover sole [Microstomus pacificus], and thornyheads [Sebastolobus spp.]).
Each of these physical zones has unique circulation patterns that affect spawning and larval transport, and each is subject to different types of physical forcing that lead to species-specific variations in growth, survival, and recruitment. Moreover, since many of the species have pelagic larval and/or juvenile stages, broad-scale variations in ocean productivity (that affect the feeding environment of larval and juvenile fish) and variations in large-scale ocean circulation (that affect transport of eggs and larvae) can both affect recruitment.
The very nearshore zone is strongly affected by alongshore currents, sediment transport, wave energy, and tides. From a system production standpoint, the physical process that is probably most important to plants and animals residing in continental shelf waters is coastal upwelling. A key fact related to the upwelling process is that the water that upwells only reaches the sea surface within the first few miles of the beach. Thus when upwelling is strong, temperatures are very cold on the beach and in surface waters out to about 5 miles (8 kilometers) from shore, dipping as low as 46°F (7.8°C) when the winds are strong. The upwelled water is rich in nutrients required for growth of microscopic planktonic plants (phytoplankton) and as a result phytoplankton biomass is highest closest to shore (Figure 1). These plants fuel a productive food chain, resulting in high abundances of copepods (the next step in the food chain above phytoplankton) in this nearshore zone (Figure 2). Large jellyfish are abundant and conspicuous in this nearshore zone, particularly in mid to late summer. Abundances of copepods are also high farther to sea, out to water depths of at least 100 m (50 fathoms). It is in this region the euphausiids (krill) start to become abundant.

8
June
Water Depth (m)0 100 200 300 400 500 600
0
20
40
60
110May
0 100 200 300 400 500 600
Chl
orop
hyll
a (µ
g L-
1 )
0
5
10
15
20September
0 100 200 300 400 500 6000
10
20
30
40Chlorophyll (an index of phytoplankton biomass)
May
0 50 100 150 200
Chl
orop
hyll
a (µ
g L-
1 )
0
5
10
15
20June
Water Depth (m)0 50 100 150 200
0
20
40
60
110September
0 50 100 150 2000
10
20
30
40
Figure 1. Phytoplankton biomass as indexed by chlorophyll-a concentration, measured at stations from the
nearshore zone out to beyond the continental shelf. The lower panel shows data from the continental shelf only, so as to see the cross-shelf distributions in greater detail.
Copepod Biomass
Water Depth (m)
0 200 400 600 800 1000 1200
Cop
epod
Bio
mas
s (m
g m
-3)
0
10
20
30
40
50
60
70JuneSeptemberNeg exp model
Water Depth (m)
0 50 100 150 200
Cop
epod
Bio
mas
s (m
g m
-3)
0
10
20
30
40
50
60
70
Figure 2. Copepod biomass measured at stations from the nearshore zone out to water depths of 1,200 m in
June and September during salmon sampling cruises at stations from Newport, Oregon, north to La Push, Washington (see Figure 3). The panel on the right shows only the continental shelf stations so as to highlight the cross-shelf distributions.

9
Beyond that point in an offshore direction, copepod biomass begins to decline quickly, but krill biomass increases. Krill seem to have their maximum biomass offshore at the shelf break and beyond, in water depths of 200 to 800 m.
Furthermore, the high biomass and rates of production by plankton in the inner-to-middle continental shelf zone, from the beach out to about 100 m, fuel a productive food chain that supports high numbers of baitfish such as herring, anchovy and smelt (Figure 3). These fishes are in turn fed upon by salmon and seabirds such as murres, shearwaters, cormorants, and pelicans. Also, a large proportion of the production by plankton sinks to the sea floor where it is consumed by mysids, amphipods, and small clams; these in turn support gray whales and vast quantities of Dungeness crabs. Close to shore, the pounding surf chops up seaweeds into bits and pieces that become detritus upon which mysids and amphipods also feed. This process further contributes to high productivity within the first few miles of the shores.
Long-term Variability in Upwelling and Plankton Production
Variability in productivity of the California Current occurs at interannual and decadal time scales, due to variations in the strength of the atmospheric pressure fields. These variations must be taken into account when considering upwelling-induced productivity. Years of weak upwelling result in lower salmon production. When upwelling is weak, however, offshore oceanic waters move onshore, and with this warm water come albacore tuna (Thunnus alalunga) that can be easily exploited. It has now been well established that the entire North Pacific experiences dramatic climate shifts caused by eastward-westward jumps in the location of the Aleutian Low in winter (and the North Pacific High in summer) that result in changes in wind strength and direction. Changes in large-scale wind patterns lead to alternate states of either “a warm ocean climate regime” or “cold water regime,” with a warm ocean less productive than a cold ocean. Recently the northern California Current has
oscillated between warm and cold states every four years (cold regime from 1999–2002; warm from 2003–2006; cold from 2007–?). One must keep these longer term states in mind when considering harvest levels of marine fishes, and of course when evaluating the impacts of man-made structures such as wave energy buoys. For example, if the cause of some “negative ecosystem impact” is thought to be a cluster of wave energy buoys, one would want to make certain that the impact was not due to the ocean being in a warm and unproductive regime. This of course argues for the need to include ocean monitoring sites near a cluster of buoys as well as at control sites far away from the buoys.
El Niño events also disrupt coastal marine ecosystems and as with the alternating cold and warm regimes, one must be attentive to the occurrence of El Niño when evaluating potential impacts of clusters of wave energy buoys. Since the early 1980s, the California Current has been experiencing an increased frequency of El Niño events, with large El Niño events occurring every 5–6 years: 1976–1977, 1982–1983, 1986–1987, 1991–1992, 1997–1998, and again in 2002–2004. A higher frequency of El Niño events appears to be a characteristic of the extended periods of warm ocean conditions. Prior to 1982, El Niño events seldom reached as far north as Oregon. However the events of 1982–1983, 1986–1997, and the extended period of El Niño-like conditions from 1992–1998 clearly led to the demise of coho and Chinook stocks in coastal waters.
Climate change is another variable that must be accounted for, especially in light of the recent IPCC Climate Assessment Report. Climate models project the 21st century will feature greater annual precipitation in the Pacific Northwest, extreme winter precipitation events in California, and a more rapid spring melt leading to a shorter, more intense spring period of river flow and freshwater discharge. This will greatly alter coastal stratification and mixing, riverine plume formation and evolution, and the timing of transport of anadromous populations to and from the ocean. Current allocation of western U.S. water resources between salmon and human requirements has been a critical

10
Pacific sardine
0-10 10-20 20-30 30-40 40-50 50-600
500
1000
1500
2000
2500
Distance from shore (km)
Num
ber
(106 m
3 )-1Northern anchovy
0-10 10-20 20-30 30-40 40-50 50-600
2500
5000
7500
Distance from shore (km)
Num
ber
(106 m
3 )-1Pacific herring
0-10 10-20 20-30 30-40 40-50 50-600
1000
2000
3000
4000
5000
Distance from shore (km)
Num
ber
(106 m
3 )-1
Whitebait smelt
0-10 10-20 20-30 30-40 40-50 50-600
3000
6000
9000
12000
Distance from shore (km)
Num
ber
(106 m
3 )-1
199819992000
20022001
2003
Figure 3. Cross-shelf distribution of baitfish measured in waters off the Columbia River and Willapa Bay
(see Figure 4) by Dr. Bob Emmett, NOAA-NMFS, NWFSC, Hatfield Marine Science Center. Each of these baitfish can be most abundant very close to shore; smelt and anchovies are particularly abundant within 10–20 km of shore.
factor in the success of many salmon populations, and will be more so if future water availability is altered.
Some global climate models predict that global warming will lead to a higher frequency of El Niño events, while others predict the intensity of these events will be stronger. In either event, primary and secondary production will be greatly reduced in the California Current ecosystem, with negative effects transmitted up the food chain. The potential for differences in coastal upwelling in a warmer world is still being debated. Some argue that upwelling may become stronger because of greater contrasts
between warming of the land (resulting in lower atmospheric pressure over the continent) relative to ocean warming. The greater cross-shelf pressure gradient will result in higher alongshore wind speeds and the potential for more upwelling (Bakun 1990). One regional climate model projects that upwelling-favorable winds will be stronger in summer, but that the peak in seasonal upwelling will occur later in the summer (Snyder et al. 2003). If upwelling is delayed, the annual cycle of production will shift to later in the year, thus animals that rely upon a dependable seasonal cycle of production for their reproduction will have to make adjustments

11
Figure 4. Location of Newport Line (at lat
44°40′N). Since 1996 the inner portion, to 25 miles from shore, has been sampled biweekly for hydrography and zooplankton. Since 1998, hydrography-zooplankton-salmon surveys have been conducted along eight transects from Newport north to LaPush, in May, June, and September. Transects from Newport south to Crescent City were sampled for hydrography and zooplankton from 1998 to 2003, and are now sampled 1–3 times per year.
in the timing of their spawning or reproductive cycles.
Finally, generally warmer ocean conditions will cause a northward shift in the distribution of most species, and possibly the creation of reproductive populations in new regions. Existing faunal boundaries are likely to remain as strong boundaries, but their resiliency to shifts in ocean conditions due to global climate change is not known.
Transport
Despite the existence of high plankton biomass and productivity, coastal upwelling environments present unique problems to fish and invertebrate populations who must complete their life cycles there. This is because the upwelling process transports surface waters and the associated pelagic larvae and juvenile life stages away from the coast and towards the south, and away from productive habitats. Typical transport rates of surface waters are 1 km per day in an offshore direction and 20–30 km per day southward. Zooplankton and larval and juvenile fishes that live in the food-rich surface layers (i.e., the upper 15 m of the water column) can be transported rapidly offshore, out of the upwelling zone, and into relatively oligotrophic waters. Bakun (1996) argues that for any animal to be successful in such environments, the adults must locate habitats that are characterized by enrichment, with some mechanism for concentrating food for larvae, and that offer a way for larvae to be retained within the system.
Perhaps because of problems related to transport and loss, many species do not spawn during the upwelling season. They either spawn during winter months before the onset of upwelling (Dover sole, sablefish, Dungeness crabs, and pink shrimp); perform an extended spawning migration and spawn in regions where there is no upwelling (hake); spawn in restricted parts of an upwelling system where advective losses are minimized, such as in bays or estuaries (English sole); spawn in rivers (salmonids and eulachon smelt [Thaleichthys pacificus]); or bypass the egg and larval stage and give birth to live precocious “juvenile” individuals (most rockfish). Hake, for example, undertake an extended spawning migration during which the adults swim south to spawn in the South California Bight in autumn and winter, outside of the upwelling region and season. The migration is from as far north as Vancouver Island (about lat 49º N) to southern California (lat 35º N), a distance of several thousand kilometers. The return migration of adults and the northward drift of larvae and juveniles takes

12
place at depth where fish take advantage of the poleward undercurrent.
Ongoing Monitoring of Coastal Waters off Oregon
The nearshore and intertidal environment in waters off the central Oregon coast has been monitored for several years by the PISCO (Partnership for Interdisciplinary Science in the Coastal Ocean) program (see http://www .piscoweb.org/what/campuses/osu). This program, added to a variety of other, but less systematic studies, could provide valuable reference points for evaluation and monitoring of new wave energy facilities. In the pelagic environment, a joint OSU-NOAA research program led by members of the Fish Ecology Division of the Northwest Fisheries Science Center is monitoring seasonal to interannual variations in ocean conditions in coastal waters of the Pacific Northwest. This program has resulted in a solid fundamental understanding of the ecology of hydrography, zooplankton, and pelagic fishes; and provides a baseline set of measurements of ocean conditions that can be used to evaluate impacts of a large cluster of wave energy buoys.
Two parts of the program are germane. First, monitoring off Newport, Oregon (Figure 4), has included oceanographic cruises that have sampled hydrography and zooplankton every two weeks since 1996. We began the thirteenth year of these efforts in January 2008. Seven stations are sampled across the continental shelf, from 1 mile (1.6 km) from shore (water depth 20 m) to 25 miles (40.2 km) from shore (300 m water depth). Measurements at each station include vertical profiles of temperature, salinity, fluorescence, and oxygen; water transparency with a Secchi disc; and plankton net tows for zooplankton, euphausiids, and fish eggs and larvae. In addition to the biweekly cruises off Newport, sampling of hydrography and zooplankton took place along the Newport transect to 85 miles (137 km) from shore and along the Heceta Head, Coos Bay, Rogue River, and Crescent City, California, transects (Figure 4) five times per year from
1998 to 2003. We continue to sample these transects, but only one to three times per year.
A second research effort involves sampling juvenile salmonids along eight transects from Newport, Oregon, north to La Push, Washington (Figure 4), in May, June, and September. This program was initiated in 1998 and will continue into the future. Sampling at each station is similar to the Newport time series and includes water column profiles of temperature, salinity, fluorescence, oxygen, and transparency; and plankton tows for zooplankton, fish eggs and larvae, and macrozooplankton.. In addition, pelagic fish (including salmon) are sampled with a large rope trawl, 20 m high by 30 m wide by 200 m long. The height of the net is equivalent to a five-story building. This sampling effort is augmented by a time series of sampling along two transects (Columbia River and Willapa Bay, Figure 3) from late April through August, in which all of the above measurements are made. This generates a time series of difference in abundance of zooplankton, small pelagic fish (including salmon), and piscine predators of juvenile salmon (mackerels and hake). The work is done at night to better sample the larger adult predatory fishes.
Because of these long-term studies we have a very good understanding of the local hydrography and the ecology of zooplankton, small pelagic fishes, juvenile salmonids, and predatory fishes. Moreover, we have a good understanding of seasonal and interannual variability, important if we are to evaluate the long-term impacts of wave energy facilities.
The nearshore zone is a “hot spot” for biological activity up and down the coast; however little is known about feeding, growth, reproduction, or mortality rates of any of the nearshore species due to difficulty in sampling so close to shore. Of particular interest and concern are the fall Chinook salmon because they live very close to shore as juveniles, from the surf zone out to distances of a few kilometers. Other key species include mysids, Dungeness crabs, gray whales, and nearshore seabirds such as murres and cormorants.

13
What Kinds of Monitoring may be Necessary for Wave Energy Facilities?
Zooplankton—Measurements of hydrography; and the distribution and abundance of zooplankton (emphasis on euphausiids and mysids, and on the seasonal cycle of occurrence of larvae of benthic invertebrates that will settle on the buoy and cause fouling), fish eggs and larvae, and small pelagic fishes (emphasis on juvenile salmonids) made at and near the locations of wave energy complexes are needed so as to compare to baselines for Newport and waters to the north.
Oxygen—Oxygen measurements are also critical. Low oxygen has come to be identified as a problem in shelf waters (Chan et al. 2008) from Newport north to Grays Harbor, Washington. We need to determine if regions to the south of Newport, such as that off the Reedsport area, are also subject to low oxygen conditions (and hypoxia) before any wave energy facility becomes operational. This is needed so that we can determine if the cleaning of fouling organisms from the buoys and mooring lines results in rapid deposition of massive quantities of organic debris to the sea floor, and subsequently results in low oxygen conditions. That is, if fish kills are observed in the vicinity of the wave energy facility, are they due to low oxygen and hypoxia caused by the increased load of organic matter falling to the sea floor because of the wave buoys, or is low oxygen a general problem all along the coast? If there are fish kills, we will need to know if the wave energy facilities caused them, or if low oxygen in general caused them.
New research—Emphasis should be placed on new research directed at the ecology of the nearshore region, especially on fall Chinook salmon, mysids, euphausiids, the small baitfish that inhabit the nearshore zone, and seabirds. We define the nearshore region as extending from the surf zone out to water depths of approximately 100 m (8–16 km from shore). The very nearshore zone (within a kilometer or two of the beach) is the habitat of the fall Chinook during their first year at sea, and of the spring Chinook during their first few months at
sea. The inshore part of this zone is among the least-studied regions of the coast, primarily because large research vessels do not usually work closer to shore than the 25-m isobath.
Long-term monitoring—The overall goal of the baseline observations is to develop metrics that could capture any changes caused by a wave energy project. Because ocean conditions change greatly from year to year, long-term monitoring will be needed. Because long time-series of past ocean and ecological conditions are available from Newport, we can use this knowledge to assess differences that may be caused by a wave energy complex.
Special studies—Apart from the studies discussed above, special studies will be required:
• Vertical flux of organic matter—We should measure the rate at which organic matter is deposited on the sea floor within a wave energy complex. This would involve launching sediment traps during oceanographic cruises. We need to establish “normal” flux to evaluate the potential for the excess organic debris sloughing from buoys and mooring lines, events that could cause hypoxic or anoxic conditions in and near the wave energy complexes.
• Wave energy facilities as fish attraction devices—Video and diver surveys will be needed, perhaps as frequently as monthly, once the first wave energy buoys are launched.
• Wave energy facilities and Dungeness crabs—The Dungeness crab fishery is among Oregon’s most lucrative, thus study of the impact of the facilities on these crabs is essential.
• Fish tagging studies—It would be beneficial to determine residence time of fishes in the vicinity of a wave energy complex. Tagging studies would reveal if fishes chose to remain near the buoys, and/or if the facilities disrupt normal migration patterns, e.g, of salmonids.

14
Literature Cited
Bakun, A. 1990. Global climate change and intensification of coastal ocean upwelling. Science 247:198–201.
Bakun, A. 1996. Patterns in the Ocean: Ocean processes and marine population dynamics. California Sea Grant College System, NOAA and Centro de Investigaciones Biological del Noroests, La Paz, BCS, Mexico.
Chan, F., J. A. Barth, J. Lubchenco, A. Kirincich, H. Weeks, W. T. Peterson, and B. A. Menge. 2008. Emergence of anoxia in the California current large marine ecosystem. Science 319:320.
Snyder, M. A., L. C. Sloan, N. S. Diffenbaugh, and J. L. Bell. 2003. Future climate change and upwelling in the California Current. Geophys. Res. Lett. 30(15):1823. Online at http://dx .doi.org/ [DOI number 10.1029/2003GL017647, accessed 20 August 2008].
Ware, D. M., and G. A. McFarlane. 1989. Fisheries production domains in the northeast Pacific Ocean. In R.J. Beamish and G.A. McFarlane (eds.), Effects of ocean variability on recruitment and an evaluation of parameters used in stock assessment models. Can. Spec. Publ. Fish. Aquat. Sci. 108:359–379.

15
The Technology: Wave Energy Development on the West Coast
Mirko Previsic, re vision consulting, LLC
Introduction
The total electricity generation potential along the U.S. West Coast (California, Oregon and Washington) is significant. The annual average energy meeting these shorelines is greater than 440 TWh per year. The upper limit that is extractable economically is estimated at about 15%, which results in an electricity generation potential of more than 66 TWh per year. To put this number into perspective, Oregon’s electricity consumption in 2006 was about 53 TWh.
In 2004, the Electric Power Research Institute (EPRI) performed an offshore wave energy conversion (WEC) feasibility definition study examining five locations and two WEC technologies. Design, performance, cost, and economic assessments have been made for sites in Hawaii, Oregon, California, Massachusetts, and Maine for both demonstration-scale and commercial-scale power plants. These studies showed that the Oregon coast has an excellent wave energy resource and good infrastructure (grid interconnection and port infrastructure) in place to take advantage of this resource.
The advantages of ocean energy are numerous, including providing clean and renewable energy with the associated benefit of displacing pollution-generating alternatives; easing transmission constraints with minimal, if any, aesthetic concerns; reducing dependence on imported energy supplies and increasing national energy security; reducing the risk of future fossil-fuel price volatility; and stimulating local job creation and economic development.
The Wave Energy Resource
Ocean waves are generated under the influence of wind on the ocean surface. Once
ripples are created on the surface, there is a steep side available against which the wind can push and waves begin to grow. In deep water, waves can travel for thousands of miles without losing much power until their energy is dissipated on a distant shore. Representing an integration of all the winds on an ocean surface, ocean waves represent a consistent energy resource that has less variability than wind, and sea states can be predicted accurately more than 48 hours in advance using computational models.
Ocean waves are an oscillatory system in which water particles travel in orbits (Figure 1). As the water depth decreases, the oscillation becomes smaller. Close to shore, in shallow water, the ocean waves lose energy because of the friction of water particles on the ocean floor.
Short-term, wave-to-wave variability is significant (Figure 2); waves vary considerably in height, period and direction. However, average power levels remain relatively constant over periods of hours; typically wave grouping occurs with repeating patterns having a timeframe of a few minutes. Over a period of a few hours, they comprise a sea state that can be described by a directional spectrum. In order to describe such sea states and to determine their characteristics relevant to wave energy utilization, statistical parameters derived from the wave energy spectrum must be used. Sea states are often summarized in terms of wave height, period, and direction parameters. The variation in sea states during a period of time (e.g., month, season, year) can be represented by a scatter diagram (Figure 3), which indicates how often a sea state with a particular combination of the significant wave height (Hs) and energy period (Te) occurs.

16
Figure 1. Water particle orbits of an ocean wave.
Figure 2. Short-term variability of ocean waves.
Figure 3. Typical scatter diagram.
In deep water (i.e., when the wavelength is smaller than twice the water depth), the power level (P) in each sea state can be computed by
P = 0.49 Hs2 Te = 0.412 Hs
2 Tp
If Hs is expressed in meters and Tp in seconds, P is given in kW/m. The average wave power level Pave during a period of time can be determined from a scatter diagram corresponding to the same time period by
Pave = ΣPi Wi / ΣWi
where Wi is the number of times that sea states with power levels Pi occur. Due to the strong seasonal and interannual variability of ocean waves, assessment of wave energy resources should be based on a long time-series of wave data.
In the deep waters of the open ocean, the wave energy resource is consistent over distances on the order of a few hundred kilometers. This applies to large ocean basins, such as the Pacific Ocean. As waves approach the shore through waters of decreasing depth, waves are modified by a number of phenomena such as refraction and diffraction. As a result, the wave energy resource can vary significantly over distances of 1 km or much less in shallow waters, depending on the local bathymetry. The energy level close to shore is usually

17
significantly lower than offshore due to bottom friction. In addition, wave crests tend to become parallel to the shoreline in shallow waters. The local influence of the bathymetry can also have a focusing effect on ocean waves, resulting in local “hot-spots” that are favorable for nearshore or shore-based wave power conversion.
Wave power density is the most significant consideration when determining the economic viability (and therefore attractiveness) of a wave power deployment site. Figure 4 shows relative wave power densities (measured in kW/m) in different parts of the world.
Figure 4. Annual average wave power densities worldwide in kW/m.
Wave Power Technologies
There are many wave power conversion devices in conceptual stages of development. However, only a few dozen have progressed to rigorous subscale laboratory tow or wave-tank model testing; only two dozen have advanced to short-term (days to months) tests in natural waters. Even fewer have progressed to long-term (>1 year) testing of full-scale prototypes in natural waters. The time period for a technology to progress from a conceptual level to deployment of a long-term full-scale wave prototype tested in natural waters has historically been on the order of 5 to 10 years. This is largely due to the immense engineering and financial challenges companies that are developing these technologies face.
Wave energy conversion technologies have made great strides in the past few years toward commercial readiness. Policy makers in the United Kingdom and Portugal responded to early pilot testing successes with incentive programs to support the implementation of the first commercial wave farms. As a direct result of such programs, the first commercial multi-megawatt (2.25 MW) wave farm is being constructed in Portugal and several more are in the planning stages in Portugal and the United Kingdom.
Despite significant progress in recent years, ocean wave energy conversion technology remains in an early stage of development. Similar to wind power 20 years ago, a large number of very different device concepts are

18
being pursued at various scales by different developers and there is no consensus as to which technology is superior. This is typical for emerging industries and it will take full-scale in-ocean testing for industry to optimize their technology and find ways to drive down cost.
Economic projections indicate that ocean wave energy can become cost-competitive with other forms of energy generation in Oregon in the long term if appropriate policies are created to support early adoption of technologies. As with any renewable technology, the economics of wave power generation schemes are sensitive to energy levels at the deployment site and as a result the choice of appropriate site is critical. Although Scotland and Ireland, where most of these technologies are being developed, feature higher wave power densities offshore (50–60 kW/m) than Oregon, the wave energy climate in Oregon can be considered good from a wave farm developer’s point of view (20–40 kW/m).
As with any power generation technology, cost of energy from early systems is high and is subsequently reduced as the installed capacity base grows. Learning curves in the wind industry indicate progress ratios of 82%. If the same progress ratios hold true for wave energy, it can be expected that the economic performance of wave energy systems would be on par with that of wind energy in the long term.
Pilot wave farms will likely start with a few units and installed capacities of less than 10 MW. This is required to reduce technical uncertainties and proof the technologies and associated cost profiles (i.e., operation and maintenance, and capital cost). Small-scale initial adoption is also required to properly demonstrate and measure environmental impacts of these technologies. Grid interconnection and other infrastructure expenses are often fixed expenses that impact the cost of electricity of small developments more prominently than larger scale adoptions. In addition, the small scale results in higher manufacturing cost and the higher risk perceived by investors will require a shorter payback period than for large-scale projects. All the above issues compound and result in a significantly higher cost of
electricity for the first commercial installations. These early stage wave farms are, however, a very important learning tool from a commercial as well as from an environmental point of view.
Environmental Effects
Environmental impacts from wave energy conversion devices are site- and technology-specific. Structures associated with wave energy can have environmental impacts similar to other structures placed offshore, by virtue of their physical presence in the water, as well as environmental effects unique to wave energy devices. Adverse impacts to the environment can often be avoided or reduced by careful project design and site location. Potential environmental issues posed by wave energy devices can occur in the areas of
• Coastal processes
• Marine biology
• Onshore effects
• Water quality
• Air quality
• Visual resources
• Use conflicts
• Geology
The construction, operation, and decommissioning of structures in the water and on land have the potential to affect terrestrial and marine environmental resources. Each project will have unique effects on the environment, depending on two things: the design of the device (including the size of the array), and the specific environmental characteristics of the project site. This paper cannot assess the potential environmental impacts of all wave energy devices anywhere off the coast of Oregon. Rather, the goal of this section is to alert the reader to the different types of potential impacts wave energy structures might have on the environment. In many cases, adverse impacts can be avoided or reduced by careful project design (e.g., structural design, site location, materials used, and construction and operation requirements).

19
To date, there is very little data available specifically on the environmental impacts of wave energy conversion devices. Some studies in Europe are beginning to examine environmental impacts and to document demonstrations. We refer the reader to Section E (Generic Technologies) of the European Wave Energy Thematic Network at http://www .wave-energy.net. In the United States, EPRI has published several reports on wave energy conversion, available for download at http://oceanenergy.epri.com (see Literature Cited below).
In 2003, the U.S. Department of the Navy prepared an Environmental Assessment under the National Environmental Policy Act (NEPA) for the proposed installation and testing of a wave energy technology project at Marine Corps Base Hawai‘i (MCBH) Kane‘ohe Bay. The proposed project involved the phased installation and operational testing of up to six WEC buoys off the North Beach at MCBH Kane‘ohe Bay for a period of up to 5 years. Each buoy was expected to produce an average of 20 kW of power, with a peak output of 40 kW. The WEC buoys would be anchored in about 100 feet (30.5 m) of water at a distance from shore of approximately 3,900 feet (1,189 m). Mechanical energy generated from the up and down motion of the buoy would be converted into electrical energy. The power would be transmitted to shore by means of an armored and shielded undersea power cable connected to a land transmission cable. The land cable would be routed to the existing MCBH Kane‘ohe Bay electrical grid system.
In the Environmental Assessment, the Navy identified the following issue areas for analysis under NEPA: shoreline physiography, oceanographic conditions (i.e., coastal processes), marine biological resources, terrestrial biological resources, land and marine resource use compatibility, cultural resources, infrastructure, recreation, public safety, and visual resources. None of these were found to be significantly affected by the proposed installation and operational testing. Installation procedures were designed to minimize impacts on living coral and benthic communities by
avoiding areas of rich biological diversity and high coral coverage.
While the detailed discussion of environmental impacts is beyond the scope of this technology overview paper, some focus is given to the level of wave energy removed from the shoreline as a direct result of offshore wave farms. The removal of wave energy will likely be too small to have any environmental effects for small wave energy facilities, but could prove to have cumulative impacts as deployment scales increase.
Level of Wave Energy Removed
One of the key discussions during the workshop was how much energy we can expect a typical wave energy facility to extract from the ocean. To address the concerns raised during discussions and to understand the likely level of energy removal from a wave farm, three examples using different technologies are outlined based on feasibility design studies carried out by the author. The technologies chosen provide a range of significant extraction levels that cover most devices under development today.
A wave farm needs to face the principal wave direction and is installed at a suitable water depth. In Oregon, the principal wave direction is between W and NW and wave energy facilities will ideally be arranged in rows of devices along the coastline at a suitable water depth. A wave energy conversion device needs to be exposed directly to the wave action. If a device is placed behind a row of wave energy converters that already take power from the waves, the performance will be reduced and as a result economics are suboptimal. Some floating technologies require large interdevice spacing, because the device is able to swing around a slack mooring, which allows for some “device-stacking” without reducing device performance.
A wave farm consisting of 40 Pelamis devices would occupy an area 0.6 km wide by 2.1 km long. Based on EPRI’s work, a Pelamis device in a 21 kW/m wave climate would put out 1,337 MWh/year. For a wave farm

20
consisting of 40 devices, the total annual output would be 53,480 MWh/year. In other words, each kilometer of coastline would produce about 25,467 MWh per year. This results in an average power delivered of 2.9 MW for each kilometer of coastline.
A wave farm consisting of Wave Dragons would require devices lined up in a row with centerline spacing of 700 m. Based on the performance estimates made by Wave Dragon, each device would put out roughly 12,000 MWh per year. As a result, each kilometer of coastline would produce about 17,142 MWh per year. This results in an annual average power delivered to the bus bar of 1.9 MW for each kilometer of coastline.
The first stage of the OPT wave facility planned for Oregon consists of 14 units with a rated capacity of 150 kW each and a capacity factor of about 30%. In other words, an average 630 kW are extracted from the 800-m-wide wave farm or 0.8 MW for each kilometer of coastline.
Given a typical Oregon deep-water wave power density of 30 MW/km of coastline, the above examples show that between 2.1% and 9.7% of the available resource is converted into electricity. Adding electrical, mechanical, and hydraulic losses of about 20% as well as 30% energy reflection results in a net wave energy blockage effect of between 4% and 17% towards the shoreline. Refraction will further disperse those impacts towards the shoreline. It is important to realize that the removal of energy can be influenced by increasing the spacing between individual units within a wave farm.
Conclusions
Ocean waves could provide a significant amount of renewable nonpolluting power to the Pacific coastal states (CA, OR and WA). However, ocean wave energy technology remains in an early stage of development and adoption will likely be slow over the next decade before large-scale deployments can occur (hundreds of MW). This early adoption process is an important stepping-stone from a technical,
economic, and environmental point of view and will require a regulatory framework that is set up to allow for an adaptive and iterative management approach with incentives for research and innovative ways to meet stringent performance standards. During this phase, it will be important that all stakeholders are involved in the process to arrive at an energy extraction solution that best meets technical, economic, and environmental considerations and allows for an optimal use of Oregon’s coastal resources.
Literature Cited
EPRI (Electric Power Research Institute). c2001–2008. Ocean energy web page. Online at http://oceanenergy.epri.com [accessed 1 March 2008]. From this site, the following reports can be downloaded for free:
Bedard, R. 2005. Oregon offshore wave power demonstration project: Bridging the gap between the completed phase 1 project definition study and the next phase—phase 2 detailed design and permitting. Report EPRI-WP-010-OR. Online at http:// oceanenergy.epri.com/attachments/wave /reports/Ph_15_Oregon_Wave_Final_RB _121305.pdf [accessed 1 March 2008].
Hagerman, G., and R. Bedard. 2004. Offshore wave power in the US: Environmental issues. Report E2I Global EPRI-007-US. Online at http://oceanenergy.epri.com/ attachments/wave/reports/007_Wave _Envr_Issues_Rpt.pdf [accessed 1 March 2008].
Hagerman, G., R. Bedard, and M. Previsic. 2004. E2I EPRI survey and characterization of potential offshore wave energy sites in Oregon. Report E2I EPRI WP-OR-003. Online at http://oceanenergy.epri.com/ attachments/wave/reports/003_Oregon _Site_Report.pdf [accessed 1 March 2008].
Previsic, M., R. Bedard, and G. Hagerman. 2004. E2I EPRI assessment: Offshore wave energy conversion devices. Online at http://oceanenergy.epri.com/attachments/ wave/reports/004_WEC_Device_Assess _Report_Rev1_MP_6-16-04.pdf [accessed 1 March 2008].

21
Previsic, M., R. Bedard, G. Hagerman, and O. Siddiqui. 2004. System level design, performance and costs—Oregon State offshore wave power plant. Online at http://oceanenergy.epri.com/attachments/ wave/reports/006_Oregon_System_Level _Design_RB_11-29-04.pdf [accessed 1 March 2008].
European Wave Energy Thematic Network. No date. The European thematic network. Online at http://www.wave-energy.net/index3.htm [accessed 1 March 2008].
22
Environmental Risk Analysis and Wave Energy: Examples of How to Assess Potential Impacts of Wave Energy on the Environment
Maurice L. Hill and Fred M. Piltz, U.S. Minerals Management Service
This presentation provides an introduction
and overview of an approach to the analysis of impacts of offshore wave energy projects on the environment. The approach is directed specifically to the “Ecological Effects of Wave Energy Development in the Pacific Northwest” workshop, but is similar to that used by analysts in the preparation of National Environmental Policy Act (NEPA) and other similar reviews. It draws heavily from the “Wave Energy Ecological Effects Workshop Ecological Assessment Briefing Paper” (this volume); the European Marine Energy Centre document (EMEC 2005); the European Union’s research and development center for alternative energy development; and the framework for ecological risk assessment that was developed by the U.S. Environmental Protection Agency during the early 1990s (USEPA 1998).
The process begins with the development of a complete and detailed project description. All aspects of the project that could potentially result in ecological effects should be identified—from initial site assessment activities (e.g., biological, archaeological, geophysical, and geotechnical surveys), construction activities, operational activities, and nonroutine activities to decommissioning. It is critical to work closely with a project applicant to determine the full extent and details of the entire project—from “cradle to grave.”
The next step is to identify the impact agents (or “stressors”) for each of the project activities. The key sources of stressors for wave energy projects are emplacement, operation (buoys, transmission system, anchoring system), decommissioning, and routine and emergency maintenance.
The major stressors associated with these activities are wave and current modification, new hard structures (water column and benthic),
electromagnetic fields, chemical toxicity, acoustics, and cumulative effects.
With the knowledge of the project description and stressors, the geographic scope of the project can be identified. This scope delineates the area or boundary in which potential impacts may occur. Also, the temporal scope of the project is identified—the period of time that impacts may occur. Note that this period may extend beyond the actual project activities to cover any residual impacts.
The biological resources (or “receptors”) that could be affected by the project and are within the geographical scope are identified and their baseline is described. A receptor’s baseline should describe the current status of the receptor—e.g., the size of the population, its distribution, and other stressors that may be affecting the receptor. Impact significance threshold(s) for the receptors are developed.
A critical component of any environmental review is to conduct a public scoping process to identify issues and concerns, data sources, etc. This process may take place throughout the environmental review.
Once the above information is obtained, the identification of direct and indirect impacts to the receptor may be made for each project stressor. The probability or risk of these impacts actually occurring should also be presented. An overall impact level should be derived based on the current status of the receptor and a summation of all the project-related stressor effects. This overall impact level should be discussed on both a local and regional basis and the significance of this impact to the receptor should be stated. Finally, a cumulative impact analysis should be made for the receptor. Cumulative impacts are defined in the Council on Environmental Quality regulations as “the
23
impact on the environment [or receptor] which results from the incremental impact of the action when added to other past, present, and reasonably foreseeable future actions regardless of what agency or person undertakes such other actions.” Reasonably foreseeable future actions may be defined as those actions that have proposals that have been submitted to an agency for review and decision.
Mitigation measures (impact avoidance, minimization, reduction, elimination, etc.) should be developed where feasible for each impact. Also, alternative approaches to the proposed action should be developed, when feasible.
Because wave energy development is in its infancy, the use of an adaptive management strategy is critical to the successful conduct of projects. A monitoring plan should be developed for the project. Methods to measure mitigation effectiveness should also be developed. Real-time monitoring may result in the need to adjust components of the project on a
real-time basis. Additional research or study may be necessary when data gaps are identified for specific projects.
The European Marine Energy Centre (EMEC 2005) impact matrix was introduced and discussed. The columns of the impact matrix correspond to groups of receptors, and the rows correspond to groups of stressors. The matrix may be filled in to show levels of impact, risk of impact, levels of concern, levels of residual impact following mitigation, etc.
Literature Cited
EMEC. 2005. Environmental impact assessment (EIA) guidance for developers at the European Marine Energy Centre. European Marine Energy Centre, Ltd., Orkney, Scotland. Online at http://www.emec.org.uk/emec_documents.asp [accessed 23 August 2008].
USEPA. 1998. Guidelines for ecological risk assessment. U.S. Environmental Protection Agency, Risk Assessment Forum, Washington, DC. EPA/630/R-95/002F.


25
Wave Energy Ecological Effects Workshop Ecological Assessment Briefing Paper
Gregory McMurray,
Oregon Department of Land Conservation and Development
Introduction
Wave Energy Development and the Larger Policy Context
There are a myriad of federal and state laws and regulations that must be addressed in order for wave energy development to take place on Oregon’s continental shelf. The agencies responsible for implementing these requirements are under an increasing number of mandates to manage for communities instead of species, and wide geographic areas and multiple habitats instead of narrow areas. These mandates are essentially a charge to manage on the basis of large ecosystems (so-called ecosystem-based management) and in a manner that will provide sustainable ocean resources for future generations (sustainability).
The precautionary approach has also become an important part of the policy context. In practical terms, it focuses the burden of proof of acceptable environmental effects onto the proponents of proposals for ocean activities, and the agencies permitting them. The precautionary approach is also important as agencies attempt to manage resources in an ocean that may be changing in fundamental and unpredictable ways. Hence, the mandates in the policy context are driving the management community towards more rigorous and complete consideration of environmental issues.
Content of This Briefing Paper
The approach for this briefing paper was to get the technology, ecological setting, and effects issues documented, with needed public sector documents provided to the workshop participants. The paper is organized in a format
parallel to a NEPA Environmental Assessment or Environmental Impact Statement: the Proposed Action (i.e., the technology, since this is a programmatic approach); the Affected Environment; and the approach to considering the Environmental Consequences (effects). Alternative development proposals, except for the differing technologies, are not discussed in this paper, but it was hoped that workshop participants would consider possible development alternatives with differing environmental effects. As stated above, the Technology section is presented at the programmatic level, but concludes with a specific description of one proposed project.
Key to the workshop process was the use of the impact matrix described in the Environmental Effects section, which forms a deconstructed conceptual approach to the ecological risk analysis (e.g., USEPA 1998). It allows explicit treatment of stressors and receptors at any level of specificity, as well as uncertainty and mitigation potential. The Bibliography and Literature Cited section is a key to papers cited in the briefing paper or available in the public sector.
The views, premises, hypotheses, and any conclusions expressed in this briefing paper are solely those of the author, and do not represent the views of any of the participating or sponsoring individuals, agencies, or entities.
The Technology
The review of existing technology is followed by a more detailed description of the intended Reedsport Wave Energy Park as a case in point. This information is intended to introduce some consideration of the types of

26
stressors that will be expressed through wave energy development.
Existing Technology
The following section has been extracted from the Minerals Management Service’s Technology White Paper on Wave Energy Potential on the U.S. Outer Continental Shelf (2006). At the time of writing, Finavera
(AquaBuoy® – point absorber), Energetech (terminator – oscillating water column) , Ocean Power Delivery (attenuator), and Ocean Power Technology (PowerBuoy® – point absorber) have all expressed interest in, or applied for FERC (Federal Energy Regulatory Commission) Preliminary Permits, on the Oregon coast.
RESOURCE UTILIZATION TECHNOLOGIES
A variety of technologies have been proposed to capture the energy from waves; however, each is in too early a stage of development to predict which technology or mix of technologies would be most prevalent in future commercialization. Some of the technologies that have been the target of recent developmental efforts and are appropriate for the offshore applications being considered in this assessment are terminators, attenuators, point absorbers, and overtopping devices.
Terminators
Terminator devices extend perpendicular to the direction of wave travel and capture or reflect the power of the wave. These devices are typically installed onshore or nearshore; however, floating versions have been designed for offshore applications. The oscillating water column (OWC) is a form of terminator in which water enters through a subsurface opening into a chamber with air trapped above it. The wave action causes the captured water column to move up and down like a piston to force the air through an opening connected to a turbine. A full-scale, 500-kW, prototype OWC designed and built by Energetech (2006)(Figure 1) is undergoing testing offshore at Port Kembla in Australia, and a further project is under development for Rhode Island.
In an Electric Power Research Institute (EPRI)-cosponsored study (Bedard et al. 2005), a design, performance, and cost assessment was conducted for an Energetech commercial-scale OWC with a 1,000-kW rated capacity, sited 22 km from the California shore. With the wave conditions at this site (20 kW/m average annual), the estimated annual energy produced was 1,973 MWh/yr. For a scale-up commercial system with multiple units producing 300,000 MWh/yr, the estimated cost of electricity would be on the order of $0.10/kWh.
Another floating OWC is the “Mighty Whale” offshore floating prototype, which has been under development at the Japan Marine Science and Technology Center since 1987 (JAMSTC 2006).
Attenuators
Attenuators are long multisegment floating structures oriented parallel to the direction of the wave travel. The differing heights of waves along the length of the device causes flexing where the segments connect, and this flexing is connected to hydraulic pumps or other converters. The attenuators with the most advanced development are the McCabe wave pump and the Pelamis by Ocean Power Delivery, Ltd. (2006).
The McCabe wave pump (Figure 2) has three pontoons linearly hinged together and pointed parallel to the wave direction. The center pontoon is attached to a submerged damper plate, which causes it to remain still relative to fore and aft pontoons. Hydraulic pumps attached between the center and end pontoons are activated as the waves force the end pontoons up and down. The pressurized hydraulic fluid

27
can be used to drive a motor generator or to pressurize water for desalinization. A full-size 40-m prototype was tested off the coast of Ireland in 1996, and commercial devices are being offered by the manufacturer.
A similar concept is used by the Pelamis (designed by Ocean Power Delivery Ltd. [2006]), which has four 30-m long by 3.5-m diameter floating cylindrical pontoons connected by three hinged joints (Figure 3). Flexing at the hinged joints due to wave action drives hydraulic pumps built into the joints. A full-scale, four-segment production prototype rated at 750 kW was sea tested for 1,000 hours in 2004. This successful demonstration was followed by the first order in 2005 of a commercial WEC system from a consortium led by the Portuguese power company Enersis SA. The first stage, scheduled to be completed in 2006, consists of three Pelamis machines with a combined rating of 2.25 MW to be sited about 5 km off the coast of northern Portugal. An expansion to more than 20-MW capacity is being considered. A Pelamis-powered 22.5-W wave energy facility is also planned for Scotland, with the first phase targeted for 2006.
FIGURE 1 Oscillating Water Column (Source: Energetech 2006)
FIGURE 2 McCabe Wave Pump (Source: Pulaski 2003)

28
FIGURE 3 Pelamis Wave Energy Converter (Source: Ocean Power Delivery Ltd. 2006)
The EPRI wave energy feasibility demonstration project has selected the Pelamis as one of the technologies for design, performance, cost, and economic assessment (Bedard et al. 2005). Sites for evaluation were selected off the coasts of Hawaii (15.2 kW/m average annual wave energy), Oregon (21.2 kW/m), California (11.2 kW/m), Massachusetts (13.8 kW/m), and Maine (4.9 kW/m). For systems at these sites scaled to a commercial level generating 300,000 MWh/yr, the cost of electricity ranged from about $0.10/kWh for the areas with high wave energy, to about $0.40/kWh for Maine, which has relatively lower levels of wave energy.
FIGURE 4 PowerBuoy Point Absorber Wave Energy Converter (Source: Ocean Power Technologies 2006)
Point Absorbers
Point absorbers have a small horizontal dimension compared with the vertical dimension and utilize the rise and fall of the wave height at a single point for WEC.
One such device is the PowerBuoy™ developed by Ocean Power Technologies (2006) (Figure 4). The construction involves a floating structure with one component relatively immobile, and a second component with movement driven by wave motion (a floating buoy inside a fixed cylinder). The relative motion is used to drive electromechanical or hydraulic energy converters. A PowerBuoy demonstration unit rated at 40 kW was installed in 2005 for testing offshore from Atlantic City, New Jersey. Testing in the Pacific Ocean is also being conducted, with a unit installed in 2004 and 2005 off the coast of the Marine Corps Base in Oahu, Hawaii. A commercial-scale PowerBuoy system is planned for the northern coast of Spain, with an initial wave park (multiple units) at a 1.25-MW rating. Initial operation is expected in 2007.
The AquaBuOY™ WEC (Figure 5) being developed by the AquaEnergy Group, Ltd. (2005) is a point absorber that is the third generation of two Swedish designs that utilize the wave energy to pressurize a fluid that is then used to drive a turbine generator. The vertical movement of the buoy drives

29
FIGURE 5 AquaBuOY Point Absorber Wave Energy Converter (Source: AquaEnergy Group, Ltd. 2005)
a broad, neutrally buoyant disk acting as a water piston contained in a long tube beneath the buoy. The water piston motion in turn elongates and relaxes a hose containing seawater, and the change in hose volume acts as a pump to pressurize the seawater. The AquaBuOY design has been tested using a full-scale prototype, and a 1-MW pilot offshore demonstration power plant is being developed offshore at Makah Bay, Washington. The Makah Bay demonstration will include four units rated at 250 kW placed 5.9 km (3.2 nautical miles) offshore in water approximately 46 m deep.
Other point absorbers that have been tested at prototype scale include the Archimedes Wave Swing (2006), which consists of an air-filled cylinder that moves up and down as waves pass over. This motion relative to a second cylinder fixed to the ocean floor is used to drive a linear electrical generator. A 2-MW capacity device has been tested offshore of Portugal.
Overtopping Devices
Overtopping devices have reservoirs that are filled by impinging waves to levels above the average surrounding ocean. The released reservoir water is used to drive hydro turbines or other conversion devices. Overtopping devices have been designed and tested for both onshore and floating offshore applications. The offshore devices include the Wave Dragon™ (Wave Dragon 2005), whose design includes wave reflectors that concentrate the waves toward it and thus raises the effective wave height. Wave Dragon development includes a 7-MW demonstration project off the coast of Wales and a precommercial prototype project performing long-term and real sea tests on hydraulic behavior, turbine strategy, and power production to the grid in Denmark. The Wave Dragon design has been scaled to 11 MW (Christensen 2006), but larger systems are feasible since the overtopping devices do not need to be in resonance with the waves as is the case for point absorbing devices.
FIGURE 6 Wave Dragon Overtopping Device (Source: Wave Dragon 2005)
The WavePlane™ (WavePlane Production 2006) overtopping device has a smaller reservoir. The
waves are fed directly into a chamber that funnels the water to a turbine or other conversion device.

30
Case Study: The Reedsport Wave Energy Facility
At the time of writing, Ocean Power Technology (OPT) is working towards applying for a FERC operating license for 14 buoys (a 2.1-MW facility) during late fall 2007, with intended deployment during spring 2009. The 14-buoy project would encompass approximately ½ square mile (1.3 km2) in area. OPT proposes that the 14 buoys would be built out to approximately 200 units, for a 50-MW facility in the ensuing years. OPT manufactures the PowerBuoy®, which at the intended scale (150 kW) is 41 m high, 12 m at the widest point (the surge plate) and 11 m at the floating collar; and has 8 m above the surface and 34 m below the surface (Figure 7). The wave energy facility would be centered over the 50-m isobath, about 2 ½ miles (4.0 km) offshore of Reedsport, Oregon. The 14 buoys would be arranged in a grid as shown in Figure 8 below. The full build-out of 200 buoys (four rows of 50, parallel to shore) would have a footprint of about ½ mile by 3 miles (0.8 km by 4.8 km), plus any required standoff zone.
The spacings between the buoys are intended to be about 100 m. The anchoring system for a single buoy is shown in Figure 9. The subsurface buoys between the tendon and catenary lines are intended to have significant positive buoyancy in order to limit the buoys to a small area. Anchors are now intended to be precast concrete blocks measuring 6 x 6 x 3 m.
The power will be generated as asynchronous alternating current (1/8 to 1/12 Hertz AC) , but will be converted to 60-cycle, three-phase AC at the subsea pod. The buoys’ electrical cables will be joined at the subsea pod, which houses a transformer and switchgear and steps up the voltage. That unit is now designed to be 6 ft (about 1.8 m) in diameter and 15 ft (4.6 m) long, and is held down with concrete ballast blocks. A sketch is shown in Figure 10.
Figure 7. PowerBuoy® layout and dimensions.
(FERC 2007).
Figure 8. Proposed PowerBuoy® Array (FERC
2007).

31
Figure 9. Reedsport Wave Energy Park anchoring schematic (FERC 2007); anchor spacing at about 100
meters.
Figure 10. Reedsport Wave Energy Park subsea pod schematic (FERC 2007).
32
The Affected Environment: Oregon’s Continental Shelf
The area of interest is the nearshore zone along Oregon’s coast, from near the 50-meter depth contour to the shoreline. The “sweet spot” for wave energy development along Oregon’s coast, at least for most of the technologies proposed at this time, is about 50 m depth, or just inside 30 fathoms. This depth is roughly the closest distance from shore that long-period, large wave forms have yet to begin to react to shoaling. This area is also the focus of the Oregon Department of Fish & Wildlife’s recently published Nearshore Strategy (ODFW Nearshore Team 2006), and this section of the briefing paper relies heavily on the content of that report. Figure 11 is taken from the Nearshore Strategy and shows the area of interest, depth, and rocky versus sandy shoreline types (ODFW Nearshore Team 2006).
Wave Climate and Currents
Oregon’s wave climate is the major reason for the high level of industry interest, along with easy access to transmission infrastructure. The relative amount of annual wave energy worldwide is shown in Figure 12 (Bedard 2005), and shows that the best U.S. resource is the West Coast, resulting from the prevailing Westerlies and the large fetch of the open Pacific. Significant wave heights (the average height, trough to crest, of the one-third highest waves valid for the time period) at Coquille from 1984 to 1996 reached 7.8 m, with a maximum wave height on the order of 15 m (Bedard 2005). The monthly average wave energy flux, shown in Figure 13, illustrates that the seasonal energy during winter and summer differs by a factor of about eight. Whereas other markets are characterized by higher demands in summer for air conditioning, the Oregon coast market corresponds roughly to the resource.
Currents on the Oregon shelf are strongly seasonal. Winter is characterized by low pressure systems that drive episodic, strong southwesterly winds, and result in the northerly flowing Davidson Current and downwelling
conditions. Summer is characterized by episodes of high pressure offshore and strong northerly or northwesterly winds that drive the California Current and upwelling conditions. The spring transition takes place in March–April and fall transition in late September–October; both are characterized by very calm local weather and seas. The seasonal prevailing winds and resulting sea surface temperatures are illustrated in Figure 14, from the Reedsport Wave Energy Preliminary Application Document (FERC 2007).
Littoral Transport System
There exist eighteen identified littoral circulation cells on the Oregon coast, as shown in a map developed by the Oregon Department of Geology and Mineral Industries (DOGAMI; Figure 15). Reedsport, location of the intended first wave energy facility in Oregon, is in the middle of the Coos cell. Subcell information is not available at the time of writing.
Pelagic Habitat Physical Characterization
The pelagic habitat on Oregon’s nearshore continental shelf is generally reflective of either winter or summer conditions. During winter, very nearshore surface temperatures are on the order of 9–10°C and salinities on the order of 30–32 PSU (Landry et al. 1989). Winter currents nearshore are generally northwards with the Davidson current, and large waves come from the southwest and west, corresponding to episodic major winter storms (see Figure 14). During summer upwelling, surface temperatures are on the order of 12–14°C and salinities on the order of 30–32 PSU with colder, more saline water on the inner shelf (see Figure 14; Landry et al. 1989). During upwelling relaxation events, warmer surface water moves towards shore. In winter, the Columbia River plume swings north very close to shore, and during summer, swings south and offshore covering a very large area (Landry et al. 1989). Light transmission is generally higher in winter (away from river mouths) and lower after the spring transition, when phytoplankton begin to bloom.

33
Figure 11. Oregon’s nearshore ocean showing the 30-fathom (about 50 m) depth contour and the 3-nautical
mile (about 5.6 km) demarcation of the Territorial Sea (ODFW Nearshore Team 2006). Red areas are rocky shore habitats; areas not blocked in red are sedimented shorelines.

34
Figure 12. Annual wave energy averages worldwide in kW/m wave front (Bedard 2005).
Figure 13. Monthly average wave energy flux in KW/m (Bedard 2005).

35
Figure 14. Visual display of current patterns along the Oregon coast (left); and winds and correlating water
temperatures along the southern Oregon coast (right)(FERC 2007).

36
Figure 15. Map of the littoral cells of the Oregon coast (DOGAMI).

37
Table 1. Grain size distributions from seabed surface sediment samples collected in the vicinity of the Reedsport Wave Energy Project (FERC 2007).
Ocean “fronts” (regions of high rates of change in temperature and salinity) on the edges of upwelling surface structure are well known as biological hotspots and may be bathymetrically controlled (and geographically recurrent) in some locations (see for example GLOBEC 1996). Regime transitions during spring (March–April) and fall (September–October) exhibit generally calm conditions of wind and waves.
Benthic Habitat Physical Characterization
The wave energy industry has thus far shown a strong preference for locating in sedimented areas with no known rocky outcrops, so that concrete block can be used as anchors. The high energy coastline yields a gradient in sediment size from sand on the beaches to mud in deep water. The sediment at 50–100 m varies from fine sand at 50 m to sandy silt towards 100 m depth, as shown by Table 1 from the Reedsport preliminary application (FERC 2007). Samples from the EPA’s Environmental Assessment and Monitoring Program (EMAP) from depths of 20 to 120 m during 2003 yielded similar sediment size results (from 50.1% to 99.1% sand), and organics percentages from 0.30 to 1.4 (LASAR 2007).
The Biota
For purposes of this briefing paper, the biota will be addressed as assemblages in the habitat, including the assemblages in the water column (pelagic), those at the bottom of the water
column (demersal/epibenthic) and those within the sediment (benthic infauna). Seabirds and marine mammals are treated in their own sections. This section leans heavily on the ODFW Nearshore Strategy (ODFW Nearshore Team 2006), as that work is the most recent and complete synthesis of nearshore biology, especially as it relates to Oregon’s fish resources.
Epipelagic/pelagic species assemblage
Phytoplankton—Phytoplankton are the base of the food web and thrive in Oregon’s nutrient-rich upwelling conditions. Spring transition (March–April) generally leads to an annual diatom bloom that is an important component of the food base for copepods, euphausiids, mysids, and other grazers in the plankton community. Many other groups of phytoplankton are found in the community, including toxic diatoms (Pseudonitzschia sp.) that can cause amnesiac shellfish poisoning (ASP) and certain species of dinoflagellates that can cause paralytic shellfish poisoning (PSP). The phytoplankton species respond to major ocean changes as do the zooplankton (below).
Zooplankton—The zooplankton include holozooplankton (animals found in the water column throughout their life history) and meroplankton (animals found in the water column during an early part of their life history). The Reedsport Wave Energy project briefly reviewed the holozooplankton (FERC 2007):

38
Plankton is found throughout the Oregon Coast, but concentrated populations generally occur near the continental shelf. Lamb and Peterson (2005) found the highest concentration of zooplankton inshore of the 300-foot isobath. Within that isobath, species are separated by preferences in water temperature and salinity (Sutor et al. 2005). Actual offshore location and density of plankton is directly affected by seasonal variations in wind and current (Keister and Peterson 2003). Generally, upwelling events occur in late summer. Uncommon El Niño years tend to upset the usual pattern of upwelling events and can alter timing and occurrence of plankton abundance, species composition, and blooms (Keister and Peterson 2003).
Fouling community—The fouling community consists of meroplanktonic invertebrates whose larvae have evolved to settle on hard substrates, and thus will settle on man-made surfaces as well. Many of these meroplanktonic organisms are found in the neuston, plants and animals that are attracted to and often found in the upper 10 cm of the water column, at least during calm weather and seas. There are also some invasive species in this community that may make opportunistic use of new hard structures, like wave energy devices, to extend their range.
Krill—Krill is a term applied to numerous species of euphausiids, vertically migrating shrimp-like crustaceans; they are a very important source of forage for many small fish and invertebrates, as well as some baleen whales. Key species on the Oregon shelf are Euphausia pacifica and Thysanoessa spinifera 1. The Pacific Fishery Management Council (PFMC) recently took action to preclude any krill fisheries on the West Coast of the United States (PFMC 2006).
1 W. T. Peterson, NOAA-NMFS, NWFSC, Newport, OR. Pers. commun., July 2007
Market squid—The market squid (Doryteuthis opalescens, formerly Loligo opalescens) is a key, schooling invertebrate species that provides important forage for Oregon’s fish communities and is included in ODFW’s list of watch species (see below).
Fish—The Pacific Fisheries Management Council (PFMC) is given authority over West Coast fisheries under the Magnusen-Stevens Fishery Conservation Act (MSA). In its latest iteration, the MSA requires the regional councils to identify Essential Fish Habitat (EFH): “those waters and substrates necessary to fish for spawning, breeding, feeding, or growth to maturity.” All aquatic habitat that was historically accessible to groundfish species, coastal pelagic species, coho salmon, Chinook salmon, and pink salmon is designated as EFH. NOAA Fisheries has listed the species (both pelagic and demersal) with essential fish habitat in the nearshore area (Table 2).
ODFW’s Nearshore Strategy (ODFW Nearshore Team 2006) listed the key pelagic species with respect to nearshore fisheries planning. Their table is show in its entirety as Table 3. Strategy species are defined as important nearshore species in need of greatest management attention, and watch list species are defined as those that do not require immediate management attention, but may in the future. Note that some invertebrate species (e.g, market squid) are included in the ODFW tables, and that there is some crossover between the pelagic and epibenthic/demersal table species.

39
Table 2. Species with designated Essential Fish Habitat (EFH) in the nearshore area.
Groundfish Species Species
Common Name Species Scientific
Name Lifestage Activity Prey Arrowtooth flounder
Atheresthes stomias Adults Clupeids, gadids, krill, shrimp, Theragra chalcogramma
Atheresthes stomias Larvae Copepod eggs, copepod nauplii, copepods
Bank rockfish Sebastes rufus Adults gelatinous plankton, krill, small fishes, tunicates
Sebastes rufus Juveniles gelatinous plankton, krill, small fishes, tunicates
Big skate Raja binoculata Adults Crustaceans, fish Black rockfish Sebastes melanops Adults Amphipods, cephalopods,
clupeids, euphausiids, mysids, polychaetes, salps
Blue rockfish Sebastes mystinus Adults Feeding algae, crab, juvenile fish, fish larvae, hydroids, jellyfish, krill, salps, tunicates
Sebastes mystinus Juveniles Feeding algae, copepods, crab, euphausiids, juvenile fish, hydroids, krill, salps, tunicates
Sebastes mystinus Juveniles All algae, copepods, crab, euphausiids, juvenile fish, hydroids, krill, salps, tunicates
Bocaccio Sebastes paucispinis Adults Feeding Juvenile rockfish, molluscs, small fishes
Sebastes paucispinis Juveniles Feeding Copepods, euphausiids Butter sole Isopsetta isolepis Adults Amphipods, decapod crustaceans,
molluscs, polychaetes, sea stars, shrimp
Cabezon Scorpaenichthys marmoratus
Adults Crabs, fish eggs, lobsters, molluscs, small fishes
Canary rockfish Sebastes pinniger Adults Euphausiids, fish, krill Chilipepper Sebastes goodei Adults Clupeids, euphausiids, krill,
Merluccius productus,squids Sebastes goodei Juveniles Copepods, euphausiids Copper rockfish Sebastes caurinus Adults Crustaceans, fish, molluscs,
shrimp Cowcod Sebastes levis Adults Fish, octopi, squids Curlfin sole Pleuronichthys
decurrens Adults All Crustacean eggs, echiurid
proboscises, nudibranchs, polychaetes
Darkblotched rockfish
Sebastes crameri Adults Amphipods, euphausiids, octopi, salps, small fishes
English sole Parophrys vetulus Adults Amphipods, crustaceans, cumaceans, molluscs, ophiuroids, polychaetes
Parophrys vetulus Juveniles Amphipods, copepods, cumaceans, molluscs, mysids, polychaetes
Flag rockfish Sebastes rubrivinctus Adults Crabs, fish, octopi, shrimp

40
Table 2 continued. Species with designated Essential Fish Habitat (EFH) in the nearshore area.
Groundfish Species Species
Common Name Species Scientific
Name Lifestage Activity Prey Flathead sole Hippoglossoides
elassodon Adults Clupeids, fish, molluscs, mysids,
polychaetes, shrimp Grass rockfish Sebastes rastrelliger Adults Cephalopods, crabs, crustaceans,
fish, gastropod, shrimp Greenstriped rockfish
Sebastes elongatus Adults Copepods, euphausiids, shrimp, small fishes, squids, tunicates
Kelp greenling Hexagrammos decagrammus
Adults Brittle Stars, crabs, octopi, shrimp, small fishes, snails, worms
Hexagrammos decagrammus
Larvae Amphipods, brachyuran, copepod nauplii, copepods, euphausiids, fish larvae
Lingcod Ophiodon elongatus Adults Unknown Demersal fish, juvenile crab, octopi, squid,
Ophiodon elongatus Larvae Unknown amphipods, copepod eggs, copepod nauplii, copepods, decapod larvae, euphausiids
Pacific cod Gadus macrocephalus Adults Amphipods, crabs, mysids, sandlance, shrimp, Theragra chalcogramma
Gadus macrocephalus Juveniles Amphipods, copepods, crabs, shrimp
Gadus macrocephalus Larvae Copepods Gadus macrocephalus Larvae Copepods Pacific hake Merluccius productus Juveniles Euphausiids Merluccius productus Adults All Amphipods, clupeids, crabs,
Merluccius productus, rockfish, squids
Pacific ocean perch
Sebastes alutus Adults Copepods, euphausiids, mysids, shrimp, small fishes, squids
Sebastes alutus Juveniles Copepods, euphausiids, Pacific sanddab Citharichthys
sordidus Adults Clupeids, crab larvae, octopi,
squids Petrale sole Eopsetta jordani Adults Eopsetta jordani, euphausiids,
ophiuroids, pelagic fishes, shrimp Quillback rockfish
Sebastes maliger Adults Amphipods, clupeids, crabs, euphausiids, juvenile fish, molluscs, polychaetes, shrimp
Redstripe rockfish
Sebastes proriger Adults Clupeids, juvenile fish, squid
Rex sole Glyptocephalus zachirus
Adults Cumaceans, euphausidds, larvacea, polychaetes
Rock sole Lepidopsetta bilineata Adults echinoderms, echiurans, fish, molluscs, polychaetes, tunicates
Rosethorn rockfish
Sebastes helvomaculatus
Adults Amphipods, copepods, euphausiids
Rosy rockfish Sebastes rosaceus Adults Crabs, shrimp

41
Table 2 continued. Species with designated Essential Fish Habitat (EFH) in the nearshore area.
Groundfish Species Species
Common Name Species Scientific
Name Lifestage Activity Prey Sablefish Anoplopoma fimbria Juveniles Growth
to Maturity
Amphipods, cephalopods, copepods, demersal fish, euphausiids, krill, small fishes, squids, tunicates
Anoplopoma fimbria Larvae Feeding Copepod eggs, copepod nauplii, copepods
Sand sole Psettichthys melanostictus
Adults Clupeids, crabs, fish, molluscs,mysids, polychaetes, shrimp
Sand sole Psettichthys melanostictus
Juveniles Euphausiids, molluscs, mysids, polychaetes, shrimp
Sharpchin rockfish
Sebastes zacentrus Adults Amphipods, copepods, euphausiids, shrimp, small fishes
Sebastes zacentrus Juveniles Amphipods, copepods, euphausiids, shrimp, small fishes
Shortbelly rockfish
Sebastes jordani Adults Copepods, euphausiids
Shortraker rockfish
Sebastes borealis Adults bathylagids, cephalopods, decapod crustaceans, fish, molluscs, myctophids, mysids, shrimp
Shortspine thornyhead
Sebastolobus alascanus
Adults Amphipods, copepods, crabs, fish, polychaetes, Sebastolobus alascanus, Sebastolobus altivelis, shrimp
Soupfin shark Galeorhinus galeus Juveniles Growth to Maturity
Fish, invertebrates
Galeorhinus galeus Adults Fish, invertebrates Spiny dogfish Squalus acanthias Adults All Invertebrates, pelagic fishes Squalus acanthias Adults Feeding Invertebrates, pelagic fishes Splitnose rockfish
Sebastes diploproa Juveniles Amphipods, cladocerans, copepods
Spotted ratfish Hydrolagus colliei Adults algae, amphipods, annelids, brittle stars, fish, hydrolagus collei, molluscs, nudibranchs, opisthobranchs, ostracods, small crustacea, squid
Hydrolagus colliei Juveniles algae, amphipods, annelids, brittle stars, fish, hydrolagus collei, molluscs, nudibranchs, opisthobranchs, ostracods, small crustacea, squid
Starry flounder Platichthys stellatus Adults Crabs, fish juveniles, molluscs, polychaetes
Platichthys stellatus Juveniles Amphipods, copepods, polychaetes
Stripetail rockfish
Sebastes saxicola Adults Copepods, euphausiids

42
Table 2 continued. Species with designated Essential Fish Habitat (EFH) in the nearshore area.
Groundfish Species Species
Common Name Species Scientific
Name Lifestage Activity Prey Sebastes saxicola Juveniles Copepods Tiger rockfish Sebastes nigrocinctus Adults Amphipods, clupeids, crabs,
juvenile fish, juvenile rockfish, shrimp
Vermilion rockfish
Sebastes miniatus Adults Clupeids, juvenile rockfish, krill, octopi, squid
Widow rockfish Sebastes entomelas Adults Amphipods, copepods, euphausiids, Merluccius productus, salps, shrimp, squids
Sebastes entomelas Juveniles Copepod eggs, copepods, euphausiid eggs
Yelloweye rockfish
Sebastes ruberrimus Adults Clupeids, cottids, crabs, gadids, juvenile rockfish, sea urchin, shrimp, snails
Yellowtail rockfish
Sebastes flavidus Adults Clupeids, euphausiids, krill, Merluccius productus, mysids, salps, squids, tunicates
Pacific Salmon Coho salmon Oncorhynchus kisutch
Chinook salmon Oncorhynchus tshawytscha
Coastal Pelagic Species Pacific sardine Sardinops sagax
Pacific (chub) mackerel
Scomber japonicus
Northern anchovy
Engraulis mordax
Jack mackerel Trachurus symmetricus
California market squid
Loligo opalescens*
* now Doryteuthis opalescens
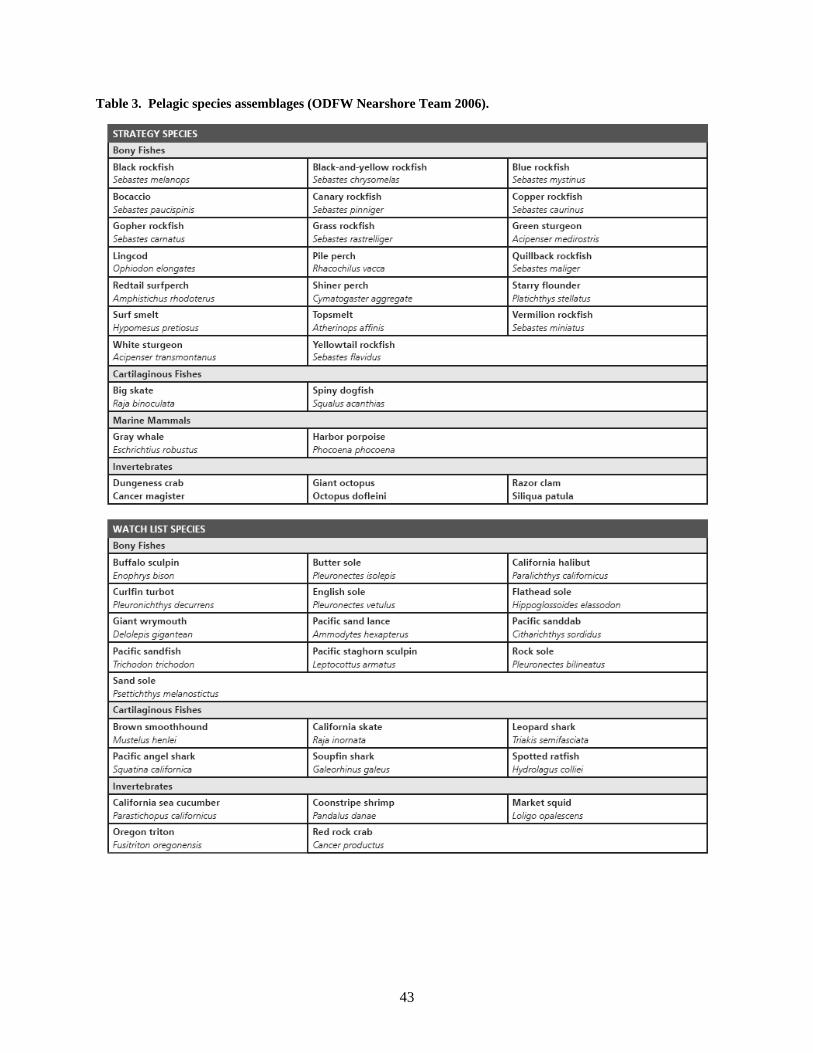
43
Table 3. Pelagic species assemblages (ODFW Nearshore Team 2006).

44
Table 3 continued. Pelagic species assemblages (ODFW Nearshore Team 2006).
Epibenthic/demersal organisms
ODFW’s Nearshore Strategy (ODFW Nearshore Team 2006) also listed the strategy and watch list soft-bottom demersal/epibenthic species with respect to nearshore fisheries planning. Their table is show in its entirety as Table 4.
Epibenthic macroinvertebrates—Decapod crustaceans in this group are commercially important and include the Pacific pink shrimp (Pandalus jordani) and Dungeness crab (Cancer magister). Other important groups include both cephalopod and bivalve mollusks, and echinoderms, represented by seastars and sea urchins.
Forage fishes—In addition to the forage fishes that are treated above, Pacific sandlance (Ammodytes hexapterus) are also important in the region, but are characteristically
undersampled or not sampled, because they can burrow into the sediment to avoid trawl capture2.
Demersal fishes—Groundfish in the managed community are numerous, including the principally Sebastes complex, which includes the many rockfish species and the kelp greenling and lingcod (see Table 3). There are also a number of flatfish species, such as sanddabs, in the assemblage.
Elasmobranchs—Common soft-boned fishes (elasmobranchs) on the Oregon shelf include the dogfish shark (Squalus acanthias), bat ray (Myliobatis californica), and the big skate (Raja binoculata). White sharks (Carcharadon carcharias) inhabit the Oregon coast year round, and are of great concern to the surfing community. Elasmobranchs are of interest here because of their ability to perceive electromagnetic fields.
2 R. Emmett, NOAA-NMFS, NWFSC, Newport, OR. Pers. commun., July 2007

45
Table 4. Soft-bottom epibenthic/demersal species assemblages (ODFW Nearshore Team 2006).

46
Table 4 continued. Soft-bottom epibenthic/demersal species assemblages (ODFW Nearshore Team 2006).
Benthic infauna
EPA’s Environmental Assessment and Monitoring Program conducted a random stratified sampling program on the Oregon shelf in 2003 that included benthic infauna analysis. Fifty stations between 20 m and 120 m water depth were sampled, and the benthic infauna identified to species or to the most specific taxonomic group feasible. The results are still provisional, but a 79-m sample was taken very near the intended Reedsport wave energy project. The infauna was numerically and taxonomically dominated by polychaete worms, and also included gastropods, amphipods, brittle stars, bivalves, ribbon worms, shrimp, scaphopods, cumaceans, oligochaete worms, and anemones in the 76 taxa identified3. The most numerous species were Magelona longicornis, Galathowena oculata and Scoletoma luti—all polychaetes.
Braun (2005) recently reviewed the existing literature for the area near the mouth of the Columbia River with a focus on depths under 30m, and offered some insight into the life histories of the dominant species found in sand to mud substrates in high energy environments:
Spiophanes bombyx, a small, slender bristleworm (5 to 6 cm long by 0.15 cm wide), is found in clean sand from the low water mark to about 60 meters. Spiophanes bombyx is regarded as a
3 L. Edmond, EPA Region X, Seattle, WA. Pers. commun., June 2007
typical 'r'-selected species with a short life span, high dispersal potential, and a high reproductive rate (Kröncke 1980, Niermann et al. 1990). It is often found at the early successional stages of variable, unstable habitats that it is quick to colonize following perturbation (Pearson and Rosenberg 1978). Its larval dispersal phase may allow the species to colonize remote habitats. Tube-building worms, including Spiophanes bombyx, modify the sediment making it suitable for later colonization and succession (Gallagher et al. 1983).
Magelona spp. typically burrows in fine sand at low water and in the shallow sublittoral. It does not produce a tube. Magelona spp. is adapted for life in highly unstable sediments, characterized by surf, strong currents, and sediment mobility.
Owenia fusiformis is a thin, cylindrical, segmented worm, up to 10 cm long, that lives in a tough, flexible tube buried in the sand with its anterior end just protruding from the surface. It is found buried in sand or muddy sand, at or below low water, on fairly sheltered beaches.
Spio filicornis is found in clean sand, from the low water mark into the shallow sublittoral. It inhabits a tube made of sediment grains and detritus stuck together with mucus. Tube-building worms, including Spio
47
filicornis, modify the sediment, making it suitable for later colonization and succession (Gallagher et al. 1983).
Hippomedon denticulatus is a lysianassid amphipod. They are scavengers on muddy and sandy sediments in bays, the continental shelf, and the deep sea where they clean up the carcasses of dead fishes and invertebrates. This species of lysianassid amphipod is large (14 mm), shiny, and white, with a pair of fat antennae attached to the front of the head and a small hook on the last side-plate of the abdomen.
This is useful context when considering the response of the benthic infaunal community to physical disturbances.
Turtles
Turtles that can be found on the Oregon nearshore shelf, and could thus be affected by wave energy development, include the leatherback turtle (Dermochelys coriacea) and loggerhead turtle (Caretta caretta).
Seabirds
The Reedsport Wave Energy Project has recently reviewed seabird observations from the central Oregon coast. Dominant species in 1989 surveys are shown in Table 5 (FERC 2007); and timing of occurrence for common species offshore Douglas County is shown in Table 6.
Marine mammals
The Reedsport Wave Energy Project provided a good summary table of marine mammals possibly found in the Reedsport vicinity (FERC 2007). This is presented as Table 7, and includes information on prior sightings, distribution and preferred habitat, and
population status. Whale species found on the Oregon continental shelf include the gray whale (Eschrichtius robustus), humpback whale (Megaptera novaeangliae), blue whale (Balaenoptera musculus), fin whale (B. physalis), sei whale (B. borealis), and sperm whale (Physeter macrocephalus).
Gray whales—Gray whales are of particular concern because the entire population of 18,000–20,000 animals in the eastern North Pacific transits the length of the Oregon coast twice a year (Herzing and Mate 1984). Mate and Harvey (1984) used VHF radio tags to track northbound migrating whales during 1979 and 1980 from Mexico to Alaska. More recently, gray whales have been tagged in Mexico to estimate use of reproductive habitats (Mate et al. 2003) and tracked northward with satellite-monitored radio tags (Mate and Urban 2003). These studies provide more locations and precision about distances from shore, water depths, and speeds than previous research. Some gray whale mothers with calves were tracked up to 77º N and for as long as 320 days. The tracks have established the first good estimates of home ranges for the entire summer feeding season as well as individual estimates characterizing the southbound migration.
Sea otters—Sea otters (Enhydra lutris) were extirpated in Oregon’s nearshore waters by the end of the 19th century (Lance et al. 2004). They are thought to be a keystone species in the California Current’s kelp forest environments, mediating kelp grazing by controlling sea urchin populations (Lance et al. 2004). Although sea otter issues were not a focal point of this workshop, any predictions of wave energy development effects on the success of local individuals or possible future reintroductions would be of value to natural resource managers.

48
Table 5. Seabirds identified during the 1989 Oregon and Washington marine mammal and seabird survey (FERC 2007).
Table 6. Expected abundance and timing of select seabird species found along the Oregon coast of Douglas County (FERC 2007).

49
Table 7. Summary of marine mammals potentially in the Reedsport project area; from NOAA stock assessment reports (FERC 2007).

50
Table 7 continued. Summary of marine mammals potentially in the Reedsport project area; from NOAA stock assessment reports (FERC 2007).

51
Environmental Effects
Conceptual Approach
A generic framework for ecological risk assessment was developed by the U.S. Environmental Protection Agency during the early 1990s (USEPA 1998). This approach provides a simple conceptual model of ecological risk that is valuable in the context of developing a systematic view of possible ecological effects. For purposes of this workshop, a “conceptual model” was defined as an ecosystems-based diagram that illustrates integrated physical and biological relationships for understanding the potential ecological effects on the ecosystem off the Oregon coast. The conceptual model also helps to clarify risks and uncertainties, guides the analysis of effects, and could provide a framework for an adaptive management program.
The needed terminology for this model requires defining stressors and receptors: stressors are agents of change in the environment; and receptors are characteristics of the environment (generally ecological entities) in which change from stressors can result and, hopefully, be measured. The terms stressor and agent are synonymous in the parlance of ecological risk assessment.
The assessment of ecological risk additionally requires the characterization of two complementary components of the risk in the model. First, exposure is defined as “the contact or co-occurrence of a stressor with a receptor” (USEPA 1998). Hence, a very important part of ecological risk assessment is the analysis that leads to estimates of exposure for key species or assemblages or habitats. Second, the “characterization of ecological effects describes the ability of a stressor(s) to cause adverse effects under a particular set of circumstances” (USEPA 1998). An ecological effect may be as simple as a basic toxicological dose-response curve, or as complicated as the modification of a complex behavioral repertoire. An estimate of ecological risk accordingly requires estimates of the magnitudes of both the exposure and the effects. The focus of this briefing paper, and the
related workshop exercise, is principally to assess the magnitude of the exposure of the receptors to the stressors. In some cases it may be appropriate to begin to assess the magnitude of the effects.
In order to be comprehensive, many environmental analyses utilize one or a set of impact matrices. Such a matrix is employed by the European Marine Energy Centre (EMEC 2005), the European Union’s research and development center for alternative energy development, to summarize the possible effects of wave energy devices deployed at the center. Table 8 is a wave energy development summary impact matrix modified from the EMEC model. The columns correspond to groups of receptors, whereas the rows correspond to groups of stressors. It may be helpful to differentiate between the exposure and effects factors for each box in the matrix, however specific. Table 9 shows a hypothetical summary matrix for the operations stressors that could be used to communicate information about level of concern, possible mitigation effectiveness, and level of confidence.
The summary matrix lumps stressors and receptors, but in practice, it may be expanded to the level specific to the risk analysis. For example, the mooring lines, not the anchors or subsurface floats, may be the Mooring System stressor of concern for whale entanglement. However, different species of whales (e.g., baleen whales or toothed whales) may have different levels of exposure or different responses to the stressor, whereas the summary matrix includes only a column for cetaceans. The matrix may be expanded to the level necessary at the appropriate level of the assessment (the present level is regional). Table 10 shows a matrix that addresses the acoustics stressor at a more specific level that may be useful in considering specific stressors or receptors.
Finally, it may be helpful to use a small submatrix to structure the discussion. Table 11 shows a submatrix that includes estimates of exposure and response to a given stressor, potential effectiveness of mitigation, and

52
Table 8. Summary impact matrix for wave energy development on the Oregon continental shelf.
Activity (agent or stressor) Receptors
Oce
an W
aves
Oce
an C
urre
nts
Sedi
men
ts
Plan
kton
Foul
ing
Com
mun
ity
Mig
rato
ry F
ish
Fora
ge F
ish
and
Inve
rtebr
ates
D
emer
sal F
ish
Epib
enth
ic
Mac
roin
verte
brat
es
Ben
thic
Infa
una
Seab
irds
Pinn
iped
s
Cet
acea
ns
Emplacement Mooring System Electrical Transmission Infrastructure Operation Mooring System Buoy or Other Generation Device Electrical Transmission Infrastructure Chemical Coatings Decommissioning Buoy or Device Removal Transmission Infrastructure Removal Anchor Removal or Decommissioning

53
Table 9. Portion of hypothetical summary impact matrix for project operations with annotations for level of concern (colors: green – of minor concern; yellow – of moderate concern; orange – of major concern), level of confidence (?), and possible mitigation effectiveness (m). Indications in the boxes are only for presentation purposes.
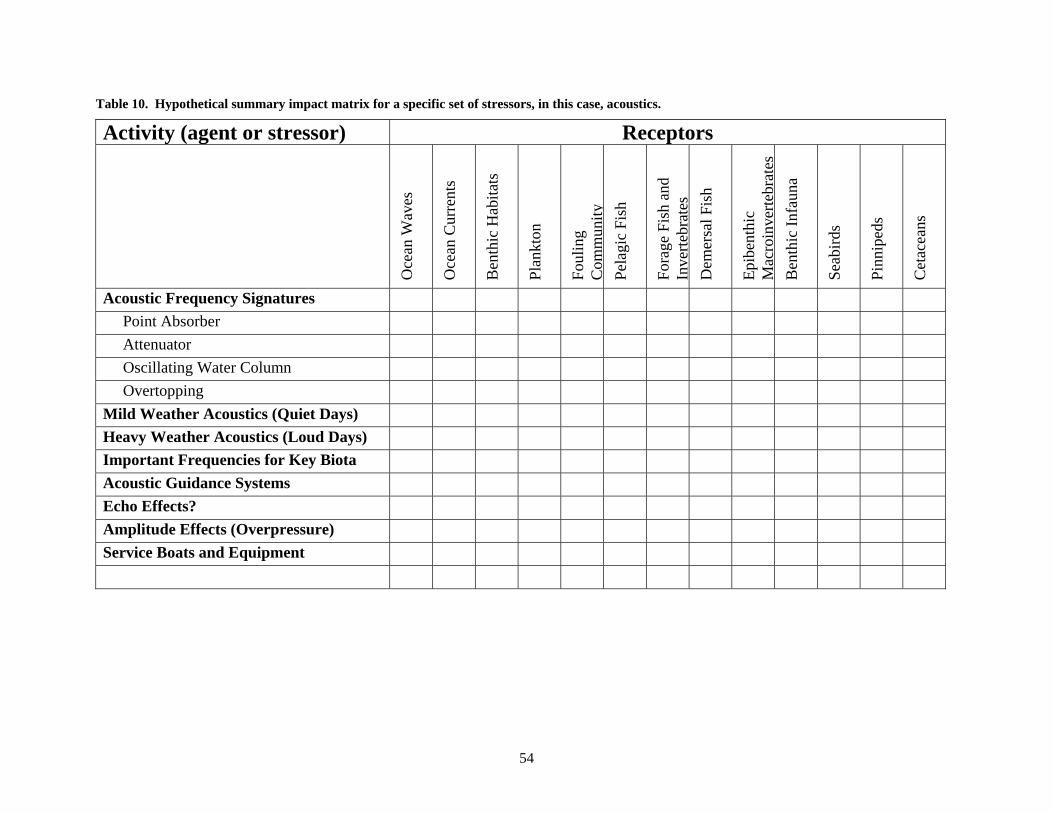
54
Table 10. Hypothetical summary impact matrix for a specific set of stressors, in this case, acoustics.
Activity (agent or stressor) Receptors
Oce
an W
aves
Oce
an C
urre
nts
Ben
thic
Hab
itats
Plan
kton
Foul
ing
Com
mun
ity
Pela
gic
Fish
Fora
ge F
ish
and
Inve
rtebr
ates
D
emer
sal F
ish
Epib
enth
ic
Mac
roin
verte
brat
es
Ben
thic
Infa
una
Seab
irds
Pinn
iped
s
Cet
acea
ns
Acoustic Frequency Signatures Point Absorber Attenuator Oscillating Water Column Overtopping Mild Weather Acoustics (Quiet Days) Heavy Weather Acoustics (Loud Days) Important Frequencies for Key Biota Acoustic Guidance Systems Echo Effects? Amplitude Effects (Overpressure) Service Boats and Equipment

55
Table 11. Submatrix for discussion and evaluation of specific matrix intersection points.
Category/Rank Low Medium High Level of
confidence Potential for Exposure to Stressor Potential for Response to Stressor Potential Effectiveness of Mitigation Residual Environmental Effect
residual effect—that is, effect after any mitigation. Levels of confidence may be estimated as low, medium, or high for each row; this would ultimately affect the prioritization of effects and a gap analysis. Stochastic components might take part in predictions of both exposure (e.g., proportion of a whale population actually encountering a stressor wave energy buoy) and response (e.g., proportion of a population seriously injured by a collision). Level of confidence is meant to include level of uncertainty (measured or not) and level of scientific agreement. Ideally, such a submatrix might underpin each call made in an overall effects matrix.
Reasonably Likely and Foreseeable Effects
Reasonably likely and foreseeable effects may be considered as a product of exposure and response in a four-way contingency table. Where both exposure and response are minor or of low likelihood, the issue may well be scoped out of the analysis. Where either the level of exposure or the response is of great cause for concern, the issue will not likely be scoped out of the analysis. Ultimately, the intent is to give a sense of priority for the meaningful allocation of limited resources to the right issues.
Emplacement/Deployment Effects
Deployment of wave energy devices will include service boat and barge use and their attendant risks; and considerable bottom disturbance during deployment of bottom structures, including the anchoring systems or mooring and the transmission systems. This bottom disturbance will impact the infauna and
the epifauna that are not motile enough to leave the area.
Operational Stressor Signals
The operational stressors are considered in turn below, and high points of the findings of the significant reviews or syntheses are very briefly reported. The key references for this section are the Scottish Executive’s Strategic Environmental Assessment (Faber Maunsell and METOC PLC 2007), with two supporting documents on vertebrate collisions (Wilson et al. 2007) and acoustics (Richards et al. 2007); the Environmental Assessment for the Makah Bay (WA) project (FERC 2006); the preliminary application for the Reedsport (OR) project (FERC 2007); the Minerals Management Service’s (MMS) worldwide assessment (Michel et al. 2007); MMS’ programmatic draft EIS for alternative energy (MMS 2007); a technical review in support of the Kaneohe Bay (HI) project (Sound & Sea Technology 2002); and a memorandum on electromagnetic field in support of the Cape Wind (MA) wind energy project (Valberg 2005).
In applying the evolving literature on alternative energy effects in coastal seas, particularly the work coming from Europe (e.g., Faber-Maunsell and METOC PLC 2007), a focal consideration is the effect of the array. Buoy or device effects may be considered individually, but the effect of a full commercial array, up to three miles long and comprised of hundreds of buoys or other devices, may create more than an additive risk for a given stressor. Long, linear arrays may, in fact, act as barriers to certain groups of biota, depending on the signature of concern; for example, sound. The distance of

56
the devices from one another (e.g., 100 m at Reedsport) will also be a major factor in array effects. Moreover, the effects of the array need to be considered in the context and scale of the ecosystem component, whether it is the littoral cell, or subcell, in the physical process, or the life history context of migratory species such as whales, seabirds, or anadromous fish. Mitigation is intended in the following section to mean minimization or avoidance of effects, not to mean ecological or monetary compensation. Mitigation may be very effective in some cases, especially through siting decisions that take into account the physical or ecological process context.
Physical signatures on wave energy, currents, and sediment transport
Issue: Wave energy devices will necessarily remove some energy from the wave train, and thus, the littoral system. Resultant effects may include alterations in currents and sediment transport.
Findings:
Makah Bay: The environmental assessment for Makah Bay concluded that there would be a negligible effect on littoral transport from a single buoy and that the deployment depth (150 ft, about 46 m) was well below the so-called wave closure depth of about 56 ft (about 17 m; 2.28 times the maximum 12 hour wave height) such that changes in bathymetry would not be expected (FERC 2006).
Programmatic Draft EIS: MMS’ PDEIS for alternative energy estimated that a wave energy facility could reduce wave height by 10% to 15% with maximum effect within 2 km inshore, and could result in an interruption of littoral drift depending on placement in the littoral cell. Structural drag on currents is not expected to be a significant component (MMS 2007).
Worldwide Assessment: This assessment found that wave energy reduction has been estimated at between 3% and 13% at the shoreline and recognized that the effect on waves, currents, and sediment transport will be technology- and location-specific; hence,
underscoring the importance of appropriate siting (Michel et al. 2007).
Reedsport Project: The Preliminary Application Document (PAD) cites cumulative wave strength attenuation of up to 12% to 15% for an array of 14 buoys. Modeling predicted a maximum instantaneous attenuation of wave amplitude of 2.1%, and OPT concluded that the project will have an insubstantial effect on erosion/accretion at the shoreline (FERC 2007).
Scottish Executive: The strategic environmental analysis found that, with realistic calculations, a maximum of 10% of the energy and 5% of the wave height arriving at the shoreline might be absorbed by a wave energy array 3 km long. The report concluded there would be only minor effects, but with low confidence, and recommended appropriate analysis and siting within local littoral cells (Faber Maunsell and METOC PLC 2007).
Mitigation: Some mitigation of the physical effects of energy absorption may be achieved by appropriate siting and choice of appropriate technologies.
Hard surfaces: buoys and anchoring systems—collision, entanglement and/or entrapment
Issue: The deployment of structures in a previously clear area brings the risk of collision and/or entanglement of animals; primarily the larger fish, the seabirds, and the marine mammals.
Findings:
Kaneohe Bay: The risk of cetacean entanglement was considered minimal for this project because the four buoys were attached to the seafloor instead of being anchored by buoys with lines, and the cable was intended to run along the seafloor. Entrapment risk was minimized by buoy design, and collision risk was not assessed (Sound & Sea Technology 2002).
Makah Bay: The Environmental Assessment concluded that risk of cetacean entanglement

57
was minimal because the exposure of a single buoy was low, and the anchor lines would have sufficient tension to avoid the entanglement characteristically seen with smaller and lighter tensions (FERC 2006).
Programmatic Draft EIS: The MMS PDEIS for alternative energy (MMS 2007) states that wave energy facilities may have as many as 2,500 mooring lines securing the wave energy devices to the ocean floor. Thus, marine mammals swimming through a wave energy facility may strike and become entangled in these lines, becoming injured or drowning. Depending on the species affected, entanglement may result in minor to major impacts to marine mammals.
Worldwide Assessment: This assessment found it likely that migrating gray whales would interact with wave energy devices on the U.S. West Coast and that entanglement in mooring cables could cause an impact. It also found that seabird exposure would likely increase due to attraction to fish responding to the Fish Attraction (or Aggregation) Devices (FAD) (see below) effect (Michel et al. 2007).
Reedsport Project: This document addresses the possible collision or entanglement of cetaceans by recommending mitigation via acoustic “guidance” devices. Seabirds are not expected to have significant collision risk because all structures will be large enough to be visible. The document also states that design characteristics of the buoys themselves will prevent hauling-out by pinnipeds (FERC 2007).
Scottish Executive: This report dealt with vertebrate collision risk in some detail, citing many conclusions of a supporting study by the Scottish Association for Marine Science that made clear the complexity of vertebrate behavioral responses (Wilson et al. 2007). The strategic environmental assessment concluded that risk of collision for marine mammals and seabirds was very uncertain and that the conclusion was made with very low confidence (Faber Maunsell and METOC PLC 2007).
Mitigation: Mitigation for collision and entanglement can include visual cues, such as highly visible paints, and acoustic “guidance” to cause animals to perceive the structures or avoid them. Entanglement may also be avoided by using thick, high-tension mooring lines. Entrapment mitigation may be achieved both by visual or acoustic avoidance, but more likely by appropriate device design considerations.
Hard surfaces: buoys and anchoring systems—trophic effects
Issue: Wave energy arrays will provide a matrix of hard structures in areas previously devoid of any hard structure: this will include buoys at the surface and through much of the water column, subsea pods (see Figure 10), and anchors on sedimented substrates. This will likely have ecological consequences from the fouling community up through the highest levels of trophic structure.
Findings:
Makah Bay: The Environmental Assessment concluded that there would be no effect of the four buoys on rockfish, surf smelt, or other marine fish. It further concluded that “Instead, project construction may result in a net gain for fish and other marine life that will benefit from the protection from fishing……and potential development of small artificial reef areas along the transmission cable” (FERC 2006).
Programmatic Draft EIS (MMS 2007): The MMS PDEIS states that placement of structures, such as pilings on the OCS, would introduce an artificial hard substrate that opportunistic benthic species that prefer such substrate could colonize; and that minor changes in species associated with softer sediments could occur due to scouring around the pilings. Fishes, including pelagic species, would likely be attracted to these artificial habitats, and fish population numbers in the immediate vicinity of the platforms are likely to be higher than in surrounding waters away from the structures. The overall change in habitat could result in changes in local community assemblage and diversity. Although the anchors or pilings

58
needed to install an individual wave energy unit would represent only a small amount of artificial habitat that would likely have little effect on overall fish populations, there is a possibility that major projects that cover large areas could result in substantial changes in the abundance and diversity of particular fish species within the area. Effects on diversity and fish abundance would be project-specific since they would be largely dependent on the prevalence of various types of habitats and fish species within surrounding areas.
Worldwide Assessment: This assessment concludes that wave energy device arrays will function as Fish Attraction (or Aggregation) Devices (FADs), and that the ultimate community of resident fish will change to an assemblage with more place-based affinity (Michel et al. 2007).
Reedsport Project: This document recognizes the potential for the anchoring system to act as hard substrate for the fouling community and consequent potential for changes in the other resident biota, especially fish species. The fouling community is also expected to colonize the mooring lines, which will need periodic maintenance for removal (FERC 2007).
Scottish Executive: The report on collision risks detailed the effect of arrays as FADs, and concluded that this effect might attract birds and marine mammals as well as fish (Wilson et al. 2007).
Mitigation: The mitigation potential for trophic changes due to hard surfaces and structure is not known at this time.
Chemicals: coatings, metals, and organics
Issue: Wave energy devices will create the potential for chemical effects from a variety of sources, including toxins in antifouling paints; metals including lead and zinc; and organics, such as those used for hydraulic fluids.
Findings:
Makah Bay: The environmental assessment noted that the Aquabuoy® uses seawater as its hydraulic fluid, and the project applicant agreed to “try different brands of antifouling paints to identify those that work best.” (FERC 2006).
Programmatic Draft EIS (MMS 2007): The PDEIS for alternative energy stated that copper- or tin-containing compounds could be used to control fouling, and that tin would remain effective for longer, but no attempt was made to assess the environmental impact. Hydraulic spills are also a risk (MMS 2007).
Worldwide Assessment: This assessment recognized the importance of nonimpacting antifouling coatings, noting that the United States has banned domestic use of tributyl tin (TBT) products and is working to have their use banned worldwide (Michel et al. 2007).
Reedsport Project: This document addresses the issue of hydraulic leaks by stating that no device will contain more than 400 gallons of vegetable-based, biodegradable hydraulic fluid (FERC 2007). Other sources of toxicity are not discussed.
Mitigation: Partial mitigation for hydraulic spills is achieved through the use of vegetable-based, rather than petroleum-based, hydraulic fluids. New, less toxic antifouling chemicals are continuously being tested in an effort to find less toxic and more specifically targeted agents.
Electromagnetic fields
Issue: Wave energy devices will necessarily generate electrical (E) and magnetic (B) fields (EMF) as they produce and transmit electrical currents. At issue is the sensitivity of particular groups of the biota, especially the potential responses of elasmobranchs (attraction, repulsion, or other behavioral taxis), and the effectiveness of mitigation, primarily through shielding.

59
Findings:
Cape Wind: The Cape Wind study concludes that trenching and shielding would effectively prevent any effects to the biota (Valberg 2005), but this report considered only the cabling.
Kaneohe Bay: This report found that effects of electrical fields could be minimized by shielding, as shown by studies on existing cables (e.g., in New Zealand). It also found that elasmobranchs, sea turtles and cetaceans might sense the magnetic field surrounding the cabling from the project, but any effects were uncertain (Sound & Sea Technology 2002). This study did not consider the EMF effects of the buoys themselves.
Makah Bay: The Makah Bay Environmental Assessment concluded that EMF effects would be “minor and temporary ranging from no impact to avoidance for organisms inhabiting the seafloor near the cable.” This conclusion was based on the Kanehoe Bay findings, the amount of power passing through the cable, and the fact that the signal would be DC, thereby creating less of an EMF than AC (FERC 2006). No analysis was made of the EMF signature or effects of the buoy itself.
Programmatic Draft EIS: The PDEIS for alternative energy found that EMF effects from a submarine power cable would be negligible, but underscored the lack of information on effects (MMS 2007). Again, no analysis was made of the EMF signature or effects of the buoys themselves.
Worldwide Assessment: This assessment notes that Pacific salmon may be affected by magnetic fields and also that there is substantial uncertainty about the response of marine mammals to EMF (Michel et al. 2007).
Reedsport Project: The Preliminary Application Document for the Reedsport project includes a good review of the literature also cited here. It states that the electricity generated by the buoys will be at 1/12 to 1/8 Hertz, presumably corresponding to an 8- to 12-second period reciprocation time. (This is well below the 7–8 Hertz lower limit above which sharks
and rays apparently cannot perceive AC.) The current will be rectified at the subsea pod to 60 Hertz. The report states categorically that the electrical field around the buoys and the subsea pods will be completely eliminated by the Faraday cage effect of the surrounding steel structures. Any EMF impacts to migrating salmon are expected to be minimal due to this group’s brief period of exposure. Magnetic fields around the transmission cables are expected to be minimal (FERC 2007).
Scottish Executive: The strategic environmental assessment concludes that DC and low-frequency AC electrical fields are of concern, mainly for elasmobranchs. The report noted that wave energy “devices themselves will also have an electrical signature, however this will be specific to the individual devices” and that this is an unknown at the present time (Faber Maunsell and METOC PLC 2007).
Mitigation: Armoring and trenching are claimed to be effective EMF mitigation for submarine cables. The use of so-called Faraday cages to eliminate EMF fields around wave energy devices or subsea pods has a basis in theory, but has not to date been demonstrated in practice.
Acoustics
Issue: Wave energy devices will have acoustic signatures, from the impingement of waves on above-water structures to generators and switching systems. Fish and seabirds are sensitive to sounds and many marine mammals are dependent on sound for life processes from feeding to mating. Acoustic guidance systems themselves may also have ecological effects other than those intended.
Findings:
Kaneohe Bay: This report treats acoustics in some detail and provides a good review of the sensitivity of the biota in the area. The report concludes that only humpback whales, two species of dolphins and green sea turtles could be affected, and that there is no evidence that the frequency or amplitude of the sound from the

60
four buoys would cause harm to these species (Sound & Sea Technology 2002).
Makah Bay: The Environmental Assessment claimed that there would be no adverse effect on whales due to the relative strengths of the device versus ambient (ocean) noise and the fact that the devices would be well below 145 dB; this finding was also applicable to fish (FERC 2006).
Programmatic Draft EIS: This review indicates that although underwater noise would be produced by the hydraulic machinery associated with wave energy generation devices, it is currently unclear what the sound levels would be. Noise and vibrations associated with the operation of the generation units would be transmitted into the water column and, depending on the anchoring system used, the sediment. Depending on the intensity, such noises could potentially disturb or displace some marine mammals and fish within surrounding areas or could mask sounds used by these animals for communicating and/or detecting prey (MMS 2007).
Worldwide Assessment: This assessment cited Hagerman and Bedard (2004) in finding that expected wave energy generation device noises would be “light” as compared to transportation noises (Michel et al. 2007). (The two prior reports [FERC 2006, MMS 2007] considered amplitude but not frequency in their evaluations.)
Reedsport Project: This document acknowledges the potential use of acoustic guidance devices to mitigate the potential for collision and entanglement of cetaceans; the overall effect of either passive (the buoys’ own sounds) or active (use of sound generating devices) sound to cause whales to avoid the buoy array is not yet known (FERC 2007).
Scottish Executive: The strategic assessment was supported by a detailed study that concluded major overpressures (loudness) leading to temporary or permanent hearing loss were not a major risk during operations, even within square arrays, but rather that arrays could act as physical barriers due to the responses to fields of
sound. This report recommended appropriate studies of acoustic signatures of devices and of site-specific ambient sound in a wide array of conditions (Richards et al. 2007).
Mitigation: Known mitigation for operational noises is limited to design factors and appropriate siting.
Lighting effects
Issue: The lighting required by the U.S. Coast Guard to address safety considerations may attract biota, especially seabirds, to the generation devices.
Findings:
Reedsport Project: This document reports that a 14-buoy array will have “at least four to eight lights”, and concludes that lighting may affect the potential for nighttime seabird collisions (FERC 2007).
Mitigation: Mitigation may be limited to the minimum use of nighttime lighting to achieve safety goals.
Cumulative Effects
The National Environmental Policy Act (NEPA) defines cumulative impact as: “the impact on the environment which results from the incremental impact of the action when added to other past, present, and reasonably foreseeable future actions regardless of what agency (Federal or non-Federal) or person undertakes such other actions. Cumulative impacts can result from individually minor but collectively significant actions taking place over a period of time.”
For purposes of this workshop, the consideration of cumulative operational wave energy effects included the summary effects of all of the stressors and receptors in the system. Cumulative effects also go beyond the effects of a single wave energy array to assess the effects of multiple arrays. Ultimately, three key questions may be appropriate for consideration of cumulative effects in a given oceanographic region like the Pacific Northwest:

61
1. How large can a single array of devices get before effects begin to accumulate?
2. How many arrays can be deployed in a region before effects begin to accumulate?
3. Over what time-frame is/are the effect(s) going to occur?
One breakout session at the workshop was tasked with a systems view of cumulative impacts.
Maintenance Effects
Wave energy devices will require routine maintenance. Low-level maintenance will likely involve the use of service boats to perform maintenance activities in situ. Higher level maintenance or overhaul will likely require transport of devices by service boat to port where the work will take place. Effects would include those associated with operation of the vessel class of the service boats.
Accident Effects
System survivability is an issue with this new technology and the effects analysis should include some consideration of the effects of wave energy devices coming loose from their moorings. Maintenance may also be required in
inclement conditions, thereby increasing the probability of accidents. A potential accidental effect is the loss of electrical insulating oil (mineral oil) which is housed with the transformers located in the subsea pods.
Decommissioning Effects
Decommissioning of wave energy facilities will include the use of service boats and/or barges to remove all deployed equipment, devices, anchoring systems, and transmission systems from the site. Removal of very large anchors may require jetting and could possibly cause more bottom disturbance than deployment. Balancing of decommissioning cost and benefits will also involve consideration of any artificial reef benefits from structures such as anchors.
Policy Linkages for Effects Analysis
One area in which natural resource management policy impacts the scientific discussion is the existence of federal and state lists of Threatened and Endangered species under the Endangered Species Act (ESA). A preliminary list of ESA species possibly affected by wave energy development on the Oregon shelf is shown in Table 12 below. The workshop participants were asked to give some sense of priority to these resources that are already at risk.

62
Table 12. Federal and state listed species found in the Oregon nearshore ocean.
Common Name Scientific Name Lister Status Fish
Snake River Chinook Salmon (spring/summer)
Onchorhynchus tshawaytscha F T
Snake River Chinook Salmon (fall)
Onchorhynchus tshawaytscha F T
Upper Willamette River Chinook Salmon
Onchorhynchus tshawaytscha F E
Oregon Coast Coho Salmon Onchorhynchus kisutch F T*
Lower Columbia River Coho Salmon Onchorhynchus kisutch F E
Columbia River Chum Salmon Onchorhynchus keta F T Upper Willamette River Steelhead Onchorhynchus mykiss irideus F T Lower Columbia River Steelhead Onchorhynchus mykiss irideus F T Upper Columbia River Steelhead Onchorhynchus mykiss gairdneri F T Snake River Steelhead Onchorhynchus mykiss gairdneri F T Snake River Sockeye Salmon Onchorhynchus nerka F E
Reptiles
Green Sea Turtle Chelonia mydas F E Leatherback Turtle Dermochelys coriacea F E Loggerhead Sea Turtle Caretta caretta F T
Pacific Ridley Sea Turtle Lepidochelys olivacea F T
Birds Short-tailed Albatross Diomedea albatrus F E Brown Pelican Pelecanus occidentalis F E Western Snowy Plover Charadrius alexandrinus nivosus F T California Least Tern Sterna antillarum browni F E Marbled Murrelet Brachyramphus marmoratus F T
Mammals Sei Whale Balaenoptera borealis F E Blue Whale Balaenoptera musculus F E Fin Whale Balaenoptera physalus F E Gray Whale Eschrichtius robustus S E North Pacific Right Whale Eubalaena japonica F E Humpback Whale Megaptera novaeangliae F E Sperm Whale Physeter macrocephalus F E Northern (Steller) Sea Lion Eumetopias jubatus F T
Key: Lister – S = State; F = Federal. Status – T = Threatened; E = Endangered; * = In litigation.

63
Bibliography and Literature Cited
AquaEnergy Group, Ltd. 2005. AquaBuOY Wave Energy Converter. Formerly online at http://www.aquaenergygroup.com. Currently: Finavera Renewables. c2007. Online at http://finavera.com [accessed 5 March 2008].
Archimedes Wave Swing. 2006. Archimedes wave swing website. c2004–2008, AWS Ocean Energy Ltd. Online at http://www.waveswing .com [accessed 5 March 2008].
Bedard, R. 2005. Oregon offshore wave energy demonstration project: Bridging the gap between the completed phase 1 project definition study and the next phase – phase 2 detailed design and permitting. Electrical Power Research Institute Report E2I EPRI WP-010 OR. Palo Alto, CA. Online at http://oceanenergy.epri.com/ attachments/wave/reports/Ph_15_Oregon _Wave_Final_RB_121305.pdf [accessed 1 March 2008].
Bedard, R., G. Hagerman, M. Previsic, O. Siddiqui, R. Thresher, and B. Ram. 2005. Offshore wave power feasibility demonstration project: Final summary report, project definition study, EPRI Global WP 009–US Rev 1, Jan. 14, 2005. Electrical Power Research Institute. Palo Alto, CA.
Bottom, D., J. A. Lichatowich, and C. A. Frissell. 1998. Variability of Pacific Northwest marine ecosystem and relation to salmon production. In McMurray, G. R. and R. J. Bailey (eds.), Change in Pacific Northwest coastal ecosystems. NOAA Coastal Ocean Program Decision Analysis Series No. 11, NOAA National Centers for Coastal Ocean Science, Silver Spring, MD.
Braun, G. M. 2005. Benthic infauna at the mouth of the Columbia River. Draft White Paper. Institute for Natural Resources, Oregon State Univ., Corvallis.
Cada, G., J. Ahlgrimm, M. Bahleda, S. D. Stavrakas, D. Hall, R. Moursund and M. Sale. 2007. Potential impacts of hydrokinetic and wave energy conversion technologies on aquatic environments. Fisheries 32:174–181.
Christensen, L. 2006. Electronic mail from Christensen (Wave Dragon ApS, Copenhagen, Denmark) to L. Habegger (Argonne National Laboratory, Argonne, IL, U.S.A.), 22 June 2006.
Cox, D. 2005. Sediment transport and nearshore hydrodynamics at the mouth of the Columbia River. Draft White Paper. Institute for Natural Resources, Oregon State Univ., Corvallis.
Department of the Navy. 2003. Environmental Assessment, Proposed Wave Energy Technology Project, Marine Corps Base Hawaii, Kaneohe Bay, Hawaii, Jan. 2003.
EMEC. 2005. Environmental impact assessment (EIA) guidance for developers at the European Marine Energy Centre. European Marine Energy Centre, Ltd., Orkney, Scotland. Online at http://www.emec.org.uk/emec_documents.asp [accessed 23 August 2008].
Energetech. 2006. Media release: Port Kembla trial deployment results, Nov. 2005. Current citation: Oceanlinx. 2007. Online at http://www .oceanlinx.com/uploads/MediaUpdateNov2005 .pdf [accessed 5 March 2008].
European Thematic Network on Wave Energy (ETNWE). 2003. Results from the work of the European Thematic Network on wave energy, ERK5-CT-1999-2001, 2000–2003. Online at http://www.wave-energy.net [accessed 5 March 2008].
Faber Maunsell and METOC PLC. 2007. Scottish marine renewables strategic environmental assessment report. Prepared for the Scottish Executive by Faber Maunsell and METOC PLC. Online at http://www.seaenergyscotland.co.uk/ [accessed 7 May 2008].
FERC (Federal Energy Regulatory Commission). 2006. Preliminary draft environmental assessment: Makah Bay offshore wave energy pilot project. FERC Docket No. DI02-3-002. FERC, Washington, DC.
FERC (Federal Energy Regulatory Commission). 2007. Pre-application document: Reedsport OPT wave park. Reedsport Wave Energy Project, LLC, FERC Project No. 12713. FERC, Washington, DC.
Gallagher, E. D., P. A. Jumars, and D. D. Trueblood. 1983. Facilitation of soft-bottom benthic succession by tube builders. Ecology 64:1200–1216.

64
GLOBEC (U.S. Global Ocean Ecosystem Dynamics). 1996. North Pacific Climate Change and Carrying Capacity (CCCC) Science Plan. Report Number 16. Online at http:// www.usglobec.org/reports/pdf/rep16.pdf [accessed 5 March 2008].
GLOBEC (U.S. Global Ocean Ecosystem Dynamics). 2001. Ocean surface drifters released off the Oregon coast; wind driven circulation off Oregon. GLOBEC Northeast Pacific Program. Online at http://diana.oce .orst.edu/drift/wind-driven.shtml [accessed 5 March 2008].
Greenland, D. 1998. Variability and stability of climatic/oceanic regimes in the Pacific Northwest. In McMurray, G.R. and R.J.Bailey (eds.), Change in Pacific Northwest coastal ecosystems. NOAA Coastal Ocean Program Decision Analysis Series No. 11, NOAA National Centers for Coastal Ocean Science, Silver Spring, MD.
Hagerman, G, and R. Bedard. 2004. Offshore wave power in the US: Environmental issues. Global Energy Partners, LLC Report E2I Global EPRI-007-US. Online at http://oceanenergy.epri .com/attachments/wave/reports/007_Wave _Envr_Issues_Rpt.pdf [accessed 1 March 2008].
Hagerman, G., R. Bedard, and M. Previsic. 2004. E2I EPRI survey and characterization of potential offshore wave energy sites in Oregon. Electrical Power Research Institute Report E2I EPRI WP-OR-003. Palo Alto, CA. Online at http://oceanenergy.epri.com/attachments/wave/ reports/003_Oregon_Site_Report.pdf [accessed 1 March 2008].
Herzing, D. L., and B. R. Mate. 1984. Gray whale migrations along the Oregon coast, 1978–1981. In M. L. Jones, S. Swartz and S. Leatherwood (eds.), The gray whale, p. 289–307. Academic Press, New York.
Hodder, J. 2005. Marine mammal use of the nearshore waters along Clatsop Spit: An assessment of distribution, abundance, and potential effects from dredge spoil deposition adjacent to the south jetty of the Columbia River. Review Draft. Institute for Natural Resources, Oregon State Univ., Corvallis.
Keister J., and W. Peterson. 2003. Zonal and seasonal variations in zooplankton community
structure off the central Oregon coast, 1998–2000. Prog. Oceanogr. 57:341–361.
Kosro, P. M. 2007. Ocean currents mapping lab. Online at http://bragg.coas.oregonstate.edu/ [accessed 6 March 2008].
Kröncke, I. 1990. Macrofauna standing stock of the Dogger Bank. A comparison: II. 1951–1952 versus 1985–1987. Are changes in the community of the northeastern part of the Dogger Bank due to environmental changes? Neth. J. Sea Res. 25:189-198.
JAMSTEC (Japan Marine Science and Technology Center). 2006. Wave Energy Research and Development at JAMSTEC, Offshore Floating Wave Energy Device, Mighty Whale. Online at http://www.jamstec.go.jp/jamstec/MTD/Whale/ index.html [accessed 6 March 2008].
Lamb, J., and W. Peterson. 2005. Ecological zonation of zooplankton in the COAST study region off central Oregon in June and August 2001 with consideration of retention mechanisms. J. Geophys. Res.110, C10S15, doi:10.1029/2004JC002520.
Lance, M. M., S. A. Richardson and H. A. Allen. 2004. Sea Otter Recovery Plan. Washington Department of Fish and Wildlife, Wildlife Program, Olympia, WA. Online at http:// wdfw.wa.gov/wlm/diversity/soc/recovery/ seaotter/final_seaotter_recovery_plan_dec2004 .pdf [accessed 6 March 2008].
Landry, M. R., J. R. Postel, W. K. Peterson and J. Newman. 1989. Broad-scale patterns in the distribution of hydrographic variables. p. 1–41. In M.R. Landry and B.M. Hickey. Coastal oceanography of Washington and Oregon. Elsevier Press, Amsterdam.
Lane, N. 2007. Issues affecting tidal, wave, and in-stream generation projects. Congressional Research Service Report RL33883. Online at National Council for Science and the Environment, CRS reports, http://www .ncseonline.org/NLE/CRSreports/07Sep/ RL33883.pdf [accessed 6 March 2008].
LASAR. 2007. Preliminary laboratory results for EPA-funded Coastal Environmental Monitoring and Assessment Program (EMAP). Lab Analytical Storage and Retrieval (LASAR) System, Oregon Department of Environmental Quality, Laboratory Division, Portland.

65
Mate, B. R., and J. Harvey. 1984. Ocean movements of radio-tagged gray whales. In M. L. Jones, S. Swartz, and S. Leatherwood (eds.), The gray whale, p. 577–589. Academic Press, New York.
Mate, B. R., B. A. Lagerquist, and J. Urban-Ramirez. 2003. A note on using satellite telemetry to document the use of San Ignacio Lagoon by gray whales (Eschrichtius robustus) during their reproductive season. J. Cetacean Res. Manage. 5:149–154.
Mate, B. R., and J. Urban-Ramirez. 2003. A note on the route and speed of a gray whale on its northern migration from Mexico to central California, tracked by satellite-monitored radio tag. J. Cetacean Res. Manage. 5:155–157.
Michel, J., H. Dunagan, C. Boring, E. Healy, W. Evans, J. M. Dean, A. McGillis, and J. Hain. 2007. Worldwide synthesis and analysis of existing information regarding environmental effects of alternative energy uses on the outer continental shelf. MMS OCS Report 2007-038. U.S. Dept. of the Interior, Minerals Management Service, Herndon, VA.
MMS (Minerals Management Service). 2006. Technology white paper on wave energy potential on the U.S. outer continental shelf. Renewable Energy and Alternate Use Program, MMS, Reston, VA.
MMS (Minerals Management Service). 2007. Programmatic draft environmental impact statement for alternative energy development and alternate uses on the OCS. MMS, Reston, VA.
Niermann, U., E. Bauerfeind, W. Hickel, and H. V. Westernhagen. 1990. The recovery of benthos following the impact of low oxygen content in the German Bight. Neth. J. Sea Res. 25:215–226.
NMFS (National Marine Fisheries Service). 2003. Large whale entanglement report 2001 (updated 2003). NOAA National Marine Fisheries Service, Protected Resources Division, Gloucester, MA.
NMFS (National Marine Fisheries Service). 2005. Pacific coast groundfish fishery management plan: Essential fish habitat designation and minimization of adverse impacts. Final Environmental Impact Statement. NOAA National Marine Fisheries Service, Seattle, WA.
Ocean Power Delivery Ltd. 2006. World’s first wave farm–shipping of first machine to Portugal, Press Release, March 14. Formerly online at http://www.oceanpd.com. Currently Greenjobs. c2004, 2006. Renewable Energy Industry News. Online at http://www.greenjobs.com/Public/ IndustryNews/i_news_00411.htm [accessed 6 March 2008].
Ocean Power Technologies. 2006. Making Waves in Power. Online at http://www.oceanpower technologies.com [accessed 6 March 2008].
ODFW Nearshore Team. 2006. The Oregon nearshore strategy. Oregon Department of Fish & Wildlife, Marine Resources Program, Newport.
Pearcy, W. G. 2005. Marine fishes. Draft White Paper. Institute for Natural Resources, Oregon State Univ., Corvallis.
Pearson, W. H. 2005. Issues concerning Dungeness crabs and the demonstration project for the Columbia River Nearshore Beneficial Use Project. Review Draft. Institute for Natural Resources, Oregon State Univ., Corvallis.
Pearson, T. H. and R. Rosenberg. 1978. Macrobenthic succession in relation to organic enrichment and pollution of the marine environment. Oceanogr. Mar. Biol. Annu. Rev. 16:229–311.
PFMC. 2006. Measures to prohibit fishing for krill in the Exclusive Economic Zone off the West Coast. Pacific Fishery Management Council, Portland, OR.
Polaski, K. 2003. Waiting for the Waves. The IEA Ocean Energy Systems Newsletter, Issue 2, September. Online at http://www .iea-oceans.org/newsletters/ [accessed 7 March 2008].
Rhinefrank, K. 2005. Wave energy research, development, and demonstration at Oregon State University. Presented at Energy Ocean 2005, April 26–28, Washington, DC.
Richards, S. D., E. J. Harland, and S. A. S. Jones. 2007. Underwater noise study supporting Scottish Executive strategic environmental assessment for marine renewables. QinetiQ Ltd., Farnborough, Hampshire.
Sound & Sea Technology Ocean Engineering. 2002. Wave energy (WET) environmental impacts of

66
selected components. Report 02-06. Prepared for Belt Collins Hawaii.
Strong, C. 2005. Marine bird use of the nearshore waters along Clatsop Spit: an assessment of composition, abundance, and potential effects from dredge spoil deposition adjacent to the south jetty of the Columbia River. Review Draft. Institute for Natural Resources, Oregon State Univ., Corvallis.
Sutor, M., T. Cowles, W. Peterson, and S. Pierce. 2005. Acoustic observations of finescale zooplankton distributions in the Oregon upwelling region. Deep-Sea Res. Part II Top. Stud. Oceanogr. 52:109–121.
Thorpe, T. W. 1999. A Brief Review of Wave Energy. ETSU Report R-122, prepared for the United Kingdom Department of Trade and Industry (as of 2007, the Department for Business, Enterprise and Regulatory Reform).
USDOE (U.S. Department of Energy). 2006. Proceedings of the hydrokinetic and wave energy technologies technical and environmental issues workshop. Prepared by RESOLVE, Inc. for U.S. Department of Energy, Office of Energy Efficiency and Renewable Energy, Wind and Hydropower Technologies Program, Washington, DC.
USEPA (U.S. Environmental Protection Agency). 1998. Guidelines for ecological risk assessment. U.S. Environmental Protection Agency, Risk Assessment Forum, Washington, DC. EPA/630/R-95/002F.
Valberg, P. A. 2005. Memorandum addressing electric and magnetic field (EMF) questions. Cape Wind Energy Project, Nantucket Sound. Online at http://www.mms.gov/offshore/ PDFs/CWFiles/141.pdf [accessed 7 March 2008].
Wave Dragon. 2005. Technology. Online at http://www.wavedragon.net [accessed 7 March 2008].
WavePlane Production A/S (WPP A/S). 2006. Home page. Currently: WavePlane A/S. c2007. Home page. Online at http://www.waveplane .com [accessed 7 March 2008].
Wilson, B., R. S. Batty, F. Daunt, and C. Carter. 2007. Collision risk between marine renewable energy devices and mammals, fish and diving birds. Report of the Scottish Executive for Marine Science, Oban, Scotland. PA37 1QA.

67
Breakout Groups
Introduction to the Breakout Groups
John Meyer, Oregon State University, and Robin Hartmann, Oregon Shores Conservation Coalition
In order to vet the important interactions between wave energy projects and the natural environment, breakout sessions convened on both days of the workshop. Specifically, the breakouts were designed to accomplish the following:
1. Initial assessment of the potential impacting agents and ecological effects of wave energy development in Oregon’s coastal ocean
2. Development of a general conceptual framework of physical and biological relationships that can be applied to specific wave energy projects
The goal of answering the breakout group questions was to document
1. What we know
2. What we don’t know, including key information gaps
3. Level of uncertainty, level of agreement
4. A sense of priority about environmental issues
5. Any recommended studies or monitoring programs
Breakouts on the first day consisted of workshop participants addressing the potential impacts of wave energy projects on specific sectors of the environment (i.e., receptors, such as benthic habitat and sea birds). On the second day, participants focused on specific aspects of a wave energy project (i.e., stressors, such as acoustics and energy-absorbing structures) and their potential effects on the environment as a whole. A final breakout group considered cumulative effects.
The Steering Committee determined breakout group membership based on a person’s expertise on the subject, as well as the need to include participants with a diversity of knowledge. Each participant was assigned membership to one breakout group on the first day and to another on the second day.
RECEPTOR breakout groups (Day 1):
• Physical Environment
• Pelagic Habitat
• Benthic Habitat
• Fish and Fisheries
• Marine Birds
• Marine Mammals
STRESSOR breakout groups (Day 2):
• Energy Absorbing Structures
• Chemical Effects
• Hard Structures and Lighting
• Acoustics
• Electromagnetic Effects
• System View and Cumulative Effects

68
Questions for the stressor groups included the following:
• What is the status of knowledge of stressor X and the propagation/transmission of its direct and indirect effects?
• What are the key information gaps and uncertainties about stressor X or its effects?
• What are the key/vulnerable receptors for stressor X?
• What are the appropriate baseline and monitoring parameters and possible management triggers for stressor X?
• What are the known mitigation strategies for stressor X and their possible effectiveness?
• Given our knowledge of stressor X and the system variability in time and space, can recommendations about the utility and applicability of control areas be made?
Questions for the receptor groups included the following:
• What are the key stressors of interest for receptor X?
• What are the key information gaps for exposure and response for receptor X?
• Given our knowledge of receptor X and the system variability over space and time, can key baseline and monitoring parameters be recommended?
• Given our knowledge of receptor X and the system variability over space and time, can recommendations about the utility and applicability of control areas be made?
• Can stressors for receptor X be estimated or ranked?
• Can a response factor for receptor X be estimated or ranked?
In the final breakout group, System View and Cumulative Effects, the above questions were integrated across the stressors, stressor processes, and receptors, culminating in the specific question: Are there any system vulnerabilities not apparent in the stressor- or receptor-specific analyses?
Workshop participants were given several hours each day to work through the questions, facilitated by a single member from the Steering Committee. Discussions were captured on flipcharts and by one participant assigned to take notes in each group. All workshop participants reconvened at the end of each session to report the key points from their deliberations to the rest of the group.

69
Receptor Breakout Group Report: The Physical Environment
Participants:
Jonathan C. Allan, DOGAMI Jack Barth, OSU Tuba Özkan-Haller, OSU Keith Kirkendall, NOAA-NMFS (Facilitator) Paul D. Komar, OSU (Chair) Curt Peterson, PSU Mirko Previsic, EPRI Ocean Energy Program Maria Stefanovich, OSU (Rapporteur)
Key Findings
The potential impacts of wave energy extraction facilities on the physical environment could be extensive depending upon the fraction of wave energy extracted. Concerns include consequences of the reduction in wave energy levels along the shore, potentially affecting the processes and stabilities of the beaches, and the effects of the structures on ocean currents, which in turn could alter the magnitudes and patterns of sediment transport and accumulation. Details, along with discussion of the literature and a proposed monitoring program, can be found in Appendix 5. Specific points of concern include the following:
• Wave energy extraction units vary in design, in how they extract energy, in their efficiency, and in the amount of energy they reflect back seaward. These variations, as well as their site of installation, affect their impact on wave reduction and on ocean currents.
• The magnitudes of the reduced wave heights become significantly greater, wave patterns more complex, and potential alterations of currents greater, when multiple extraction units are present.
• Numerical models of wave reduction by wave energy complexes on other coasts suggest that lowered wave heights will be experienced on the beaches of the Pacific Northwest, affecting (both negatively and positively) a range of
natural processes and the recreational activities of beach visitors.
• There is a need for field investigations of the environmental changes that result from the construction of wave energy facilities. This is critical for those constructed on the Pacific Northwest coast, due to its extreme waves and currents and the fairly unique processes and responses of its beaches.
• Our committee believes it is imperative that monitoring and experiments be undertaken at the first few sites developed along the Pacific Northwest coast.
• A dialog needs to be established between the developers of the proposed wave facilities, specifically their engineers and scientists responsible for the technical analyses, experts in those areas available at the state universities and government agencies, nongovernmental organizations, and other stakeholder groups. It is important that we work together to address the complex issues raised.
Top Environmental Issues
Energy extraction technologies
Wave energy extraction devices vary in their designs and fundamental mechanisms for deriving energy from the waves. The degree of wave reduction in the lee of the extraction unit

70
depends on the amount of energy removed to generate electricity (about 5% to 20%), the amount of energy reflected seaward (about 10% to almost 100%), and the site of installation. Similarly, the different unit designs will have unique effects on ocean currents and water-column stratification, depending on their size, shape, and location.
Most of our discussions focused on the use of multiple buoys placed in an array, as buoy systems are most feasible for application in the Pacific Northwest, and a buoy system will be used for the first Oregon facility at Reedsport.
Collective impact of multiple units
Having extracted and reflected energy from the waves arriving from offshore, a single unit will create a “shadow zone” of lowered wave heights in its lee. The magnitudes of the reduced wave heights become significantly greater and wave patterns more complex when multiple extraction units are present. Wave energy complexes will almost always consist of multiple lines of units, designed to maximize the wave energy extraction; there would be a greater reduction in wave heights in a multi-unit shadow zone compared with that for a single line of units (see the models of Venugopal and Smith 2007). It can therefore be expected that with the development of a full-scale wave energy complex consisting of a large number of extracting units in a two-dimensional array, there could be significant reductions in wave heights and energies along the coast, potentially extending for kilometers in the shoreward direction and affecting the beaches. Furthermore, the development of numerical models for such an array will be considerably more complex than that for a single line, increasing the uncertainties in the model’s capacity to predict the environmental impacts.
In addition to affecting wave energies and patterns of diffraction and refraction, the presence of a wave farm will become an obstacle to the flow of wind-driven currents in the shallow-water continental shelf, and could alter the structure of the water column (variations in temperature and salinity with
depth). While there will be some effect by individual extraction units, the collective impacts of a large number of units in an array could produce a measurable effect on the currents and the water column.
Potential environmental impacts
Sediment transport patterns—With wave energies on average being reduced, there will be a tendency for sediments to accumulate in the lee of the array, producing some shoaling and possibly a change in bottom sediment grain size (likely a shift to finer sediment, and possibly a change from a rocky seafloor to sand). Those changes will have a feedback effect on the processes, for example altering the patterns of wave refraction if shoaling significantly changes the water depths. Such a modification of the wave refraction will be carried to the shore, the altered angles of waves breaking on the beaches affecting the longshore currents and sand transport.
Changes in beach processes—The range of beach processes can be expected to be directly affected by the installation of a wave energy facility, as most of those processes in shallow water are driven by the heights and energies of the waves (Komar 1998). With a reduction in wave heights on the beaches, surf-zone widths could be significantly reduced from their natural widths, and because the magnitudes of the longshore currents and sand-transport rates depend on the heights of the breaking waves, they could also experience reductions. Changes in nearshore currents and sand-transport could produce significant shifts in the shorelines, with erosion focused along some stretches of beach, and accumulation of the eroded and transported sand widening other stretches of beach.
Reduction in surf energy—The existence of a high-energy surf is important to the mixing and dilution of pollutants that reach the nearshore, with the seaward-directed rip currents flushing them offshore; with coastal pollution increasingly becoming a problem along the Oregon and Washington shores, it could be exacerbated by the reduction in wave-energy levels. Significant negative impacts could also

71
occur along the rocky shores to the tidepool life that is adapted to the presence of high waves and depends on their oscillations and wave-driven currents for the delivery of food and dispersal of larvae (discussed in other sections of this report).
Scientific Uncertainty and Agreement
The wave energy facility designs for the Pacific Northwest, as elsewhere, will be based in large part on numerical models. The models applied thus far have focused on analyses of the wave diffraction and refraction, beginning with the reduced wave heights after a significant portion of their energy has been extracted and following the waves as they move toward the shore. For the most part those wave models should yield reasonable results when applied to the Pacific Northwest; however, areas of uncertainty remain.
Unit design
As discussed by Venugopal and Smith (2007), problems remain if the analyses need to include the dynamics of the energy-extraction units, as will be the case when the units consist of buoys whose motions have a feedback effect on the waves. This may be important on the Pacific Northwest coast in that energy-extracting buoys are likely the most viable technology.
Process investigations
Modeling and investigations, such as described by Venugopal and Smith (2007) and Miller et al. (2007), provide guidance as to what the impacts on the physical environment might be and where they would be greatest. However, at this stage in the development of wave energy facilities, there has been only limited reported use of numerical models extended to assessments of the processes that would be responsible, such as the transport of sediment on the continental shelf and beaches. Of particular importance, there have yet to be reported field experiments to document on a prototype scale the impacts of individual unit designs, and no experience from the construction of a complete
wave energy complex consisting of multiple units.
Sediment transport
It is unfortunate that there have been only limited investigations of sediment-transport processes on the continental shelves of the Pacific Northwest. The one region of concentrated research has been that in proximity to the mouth of the Columbia River (the Columbia River Littoral Cell), but the extrapolation of its results to the Oregon continental shelf is uncertain. Although numerical models may eventually include assessments of sediment transport affected by the construction of a wave energy facility, their predictions for the Oregon coast would be uncertain. For example, while it can be expected that there would be sediment accumulation in the shadow zone of a facility, it is doubtful whether one could predict with confidence whether that sediment was transported there by shelf currents modified by the array, or was carried offshore from the ocean beach.
Particularly problematic in the design process will be the use of numerical models applied to analyze the transport of sediment by the modified waves and currents, to predict areas of seafloor erosion or sediment accumulation. In general the application of such models is a challenge with uncertain results. This is even more so in applications to the Pacific Northwest, because the physics of the processes on these high-energy, low-sloping (dissipative) beaches differ significantly from laboratory wave tanks and low-energy beaches (e.g., U.S. East Coast and European) where those models have been tested.
Key Information Gaps
• Applications of wave diffraction/refraction numerical models require accurate data on water depths, the bathymetry of the seafloor. This is seldom available from recent surveys along the Pacific Northwest coast, particularly for the intermediate water

72
depths from 50 meters to the shore, including profiles of the beaches at the site of interest.
• Design information on the wave energy units is needed for independently modeled assessments of wave energy facility impacts on the physical environment.
• Experimental field data documenting environmental impacts, from both prototype-scale and multiple-unit wave extraction facilities, is lacking.
Recommendations for Baseline and
Monitoring Studies
There has been little experience in the design, construction and operation of wave energy systems along the world’s coastlines. Therefore, the development of wave energy complexes along the Pacific Northwest coast should proceed with caution, requiring that during the design process analyses include projections of the potential environmental consequences, and that prior to and following construction the installation be monitored through the implementation of a data-collection program. The program of data collection in any proposed development site needs to be initiated during the design stage to supply the required depth surveys and preconstruction data on natural conditions that is needed for comparisons with the environmental changes that occur following construction.
The extreme Pacific Northwest environment will place special demands on the wave energy device designs. It is important that the ensuing environmental responses be carefully documented, at least for the first few developments that will serve as tests of the designs and impacts. Our committee proposed a monitoring and sampling program designed specifically for the wave energy facility being proposed for development at Reedsport, because it is expected to be the first (Appendix 5). Although such a monitoring program would be complex and demanding, requiring a team of experienced investigators, it would be a good investment leading to the improved design of wave energy facilities that minimize the impacts on the physical environment and ecology.
Literature Cited
Allan, J. C., and P. D. Komar. 2006. Climate controls on U.S. West Coast erosion processes. J. Coastal Res. 22:511–529.
Komar, P. D. 1998. Beach processes and sedimentation. 2nd edition. Prentice Hall, New Jersey.
Miller, D. L., H. C. M. Smith, and D. E. Reeve. 2007. Modelling analysis of the sensitivity of shoreline change to a wave farm. Ocean Eng. 34:884–901.
Venugopal, V., and G. H. Smith. 2007. Wave investigation for an array of wave power devices. In Proc. 7th European Wave and Tidal Energy Conference, Porto, Portugal, 11–13 September 2007.

73
Receptor-specific effects table for the physical environment. KEY: L=low impact, M=medium impact, H=high impact, NA=not applicable.
Activity (agent or stressor) Receptors
Wav
e En
ergy
Wav
e H
eigh
t
Turb
ulen
ce
Nea
rsho
re C
urre
nt
Spee
d
Cur
rent
Dire
ctio
n
Net
Sed
imen
t Tr
ansp
ort
Dire
ctio
na
Net
Sed
imen
t Tr
ansp
ort
Am
ount
a
Litto
ral C
ell N
et
Effe
cta
Loca
l Sed
imen
tatio
n at
th
e A
rray
Loca
l Sco
urin
g
Turb
idity
Foul
ing
Com
mun
ity
(e.g
., m
usse
ls)
Shel
f Cur
rent
and
D
irect
ion
Emplacement/Installation Mooring System L L L L L L L L L L L L L Electrical Transmission Infrastructure L L L L L L L L L L L L L Directional Drilling L L L L L L L L L L L/M L L
Operation Mooring System L L L/M L L L L L L M L NA L Buoy or Other Generation Device L/M L/M M M M L/M L/M L/M L/M L L L L Electrical Transmission Infrastructure L L L L L L L L L L L L L Chemical Coatings NA NA NA NA NA NA NA NA NA NA NA NA NA
Decommissioning Buoy or Device Removal L L L L L L L L L L L/M L L Transmission Infrastructure Removal L L L L L L L L L L L/M L L Anchor Removal or Decommissioning L L L L L L L L L L L/M L L
a Focus of the conversations and ratings were on shoreline effects.

74
Receptor Breakout Group Report: Pelagic Habitat
Participants:
Richard Brodeur, NOAA-NMFS, NWFSC Selina Heppell, OSU Susan Holmes, OSU (Rapporteur) Justin Klure, Oregon Wave Energy Trust (Facilitator) Bill Peterson, NOAA-NMFS, NWFSC Alan Shanks, Univ. of Oregon (Chair)
Key Findings
• The wave energy structures will likely have little or no effect on phytoplankton.
• Antifouling coatings may have adverse affects on plankton if the coatings leach toxins. Nonleaching antifouling coatings should be used if at all possible.
• The electromagnetic signals generated by the facilities may confuse fishes that use an electrical sense to orient toward prey or use a sense of earth magnetism for navigation. We know these organisms are very sensitive, so the shielding of the electromagnetic signals must be very good.
• Wave energy extractors that are dependent on water movement through the apparatus will likely kill or damage large zooplankton such as jellyfish and ctenophores.
• Benthic organisms will colonize the wave energy structures extensively. For most populations, the loss of larvae to settlement on the structures will be unimportant. For some populations (e.g., rockfish populations recovering from overfishing), this loss may be important. If juvenile rockfish associated with the wave energy structures are unable to successfully transition to a permanent adult habitat, then settlement of larval rockfish on the structures may represent a sink for these larvae.
• The structures will act as Fish Attraction Devices (FADs). They will attract fish that feed on benthic organisms, a variety of water column fishes, and fish predators.
Top Ecological Issues, Uncertainty, and
Recommendations
Antifouling coatings
Antifouling coatings that work by releasing toxins into the water may harm any organism (phyto-, mero- or holoplankton) in the plankton community. Most of the effect will be localized to near the power-generating structures and will extend downstream for an unknown distance. The effect of one structure leaching toxins from antifouling coatings will probably be minimal, but the effect of leaching toxins from many structures in a wave energy facility and many facilities along the coast may not be minimal, particularly if there are bioaccumulative compounds. Utilization of antifouling coatings that rely on leaching toxins should be avoided in preference to nonleaching coating, but it is possible that grazing organisms may facilitate the release of these compounds.
Water inflow entrainment
Some of the devices designed to extract energy from waves pass water through the mechanism. During the passage of water through the device, large delicate organisms will be killed or damaged. Large zooplankton such as jellyfish, salps, and ctenophores are particularly susceptible to this type of damage. This stressor can be avoided by utilizing energy

75
extraction devices that do not require the water to pass through a mechanism.
Electromagnetic effects
The wave energy extractors themselves and the generation of electricity by the devices will produce weak electric and magnetic fields. Elasmobranchs (sharks and rays) and some bony fishes are capable of detecting even very weak electric and magnetic fields. In general, in marine organisms, the electric sense is used to orient toward prey. Even the weak electric signal generated by dissimilar metals in contact with each other in seawater can disorient some shark species. In experimental settings, sharks can sense the electric signal from a clam buried in sediment. Several marine organisms can sense the earth’s magnetic field and may use it to aid in navigation. Few organisms have been investigated so we have no idea how widespread this capacity is. These organisms are quite likely very sensitive to magnetic signals if the best-studied organism (the pigeon) is any indication of the general sensory ability of organisms that navigate with earth magnetism. We know some marine organisms are very sensitive to both of these electromagnetic outputs and we are assured that the infrastructure utilized in wave energy extraction will be shielded to minimize the effect, but we currently do not have a clear idea as to how much shielding is adequate. Given the extreme sensitivity we suspect, shielding will have to be very very good if it is to minimize the effect on marine life.
Entanglement on mooring lines
Mooring lines are used in most of the proposed wave energy extractors and in some designs there are a number of mooring lines. These will entangle some organisms. Large jellyfish with long tentacles (e.g., Pelagia sp.and Chrysaora sp.) will tangle on the mooring lines. This will kill or at least damage these organisms. Sea turtles and marine mammals can become entangled by lines, particularly slack mooring lines, leading to drowning. We could think of no way to mitigate against entanglement of jellyfish, but the major problem for sea turtles
and marine mammals is slack lines. Hence, mitigation would be the avoidance of all loose lines.
Effect of wave energy structures
This report is based upon the assumption that the combined structures in wave energy facilities would have little or no effect on inner shelf currents or water structure. If this proves not to be the case, some of our conclusions will have to be modified.
Most of the potential effects of the wave energy structures are related to the attraction of organisms to energy generating structures, mooring lines, anchors, etc.
The wave energy facilities will be placed in nearshore areas of sandy bottom, areas with no or very little hard substrate. Larvae settling out of the plankton will quickly colonize this new hard substrate. The situation is very much like what has happened around offshore oil platforms in southern California, and many of the same organisms that have colonized those oil platforms will likely colonize the hard surface associated with wave energy extractors placed off Oregon. Organisms that settle on the wave energy structures, obviously, will not have the opportunity to settle on other hard substrates; the wave energy structures could, by removing larvae, be viewed as a sink. Most benthic organisms produce vast numbers of larvae and even at the end of the pelagic larval development phase, when larvae are ready to settle out of the plankton, there are generally far more competent larvae than needed to sustain populations.
There are perhaps some exceptions to this generalization. Structures in the water, like floating rafts of seaweed and the wave energy structures, attract larval and juvenile fish from the plankton. Many of the rockfish species display this behavior. In the case of the wave energy structures, larval fish that “settle” in association with the structures may adopt an adult benthic existence associated with the structure. The oil platforms in southern California do support populations of associated

76
fishes including rockfish. It is not clear, however, that the wave energy structures will actually represent adequate habitat for adult benthic fishes. If the structures associated with the wave energy extractors prove to be inadequate substrates for supporting adult fishes then the structures may be a drain on the larval pool. Current adult populations of some rockfish species are low due to overfishing and are in the process of recovery. Due to the low population sizes, larval production may also be low and the loss of larvae to the wave energy facilities may represent an important loss of larvae, which may slow the recovery of the populations. If like the oil platforms, the hard substrate associated with the wave energy extractors is adequate adult habitat, then the situation may be beneficial, providing new habitat into which populations of fishes can expand. The situation is ambiguous and only study of initial deployments of wave energy extractors will provide the information needed to address this question.
Many of the jellyfish have complex life cycles with a planktonic sexual reproductive stage and a benthic asexual stage. The wave energy structures will definitely be colonized by hydrozoans and likely by the asexual stage of true jellyfish (Scyphozoans). By providing more habitat for the benthic asexual stage, wave energy structures may increase jellyfish population sizes.
Many types of adult fishes are attracted to objects in the water. This behavior is so common that fishers in many parts of the world
exploit it. Almost any structure placed in the water column can be used as an FAD. The wave energy extractors will act as FADs. Some of the fish attracted to FADs feed on the organisms clinging to the FAD. This will certainly be the case in the wave energy facilities as the structures not protected by antifouling coatings will rapidly become colonized. There are a number of species of fish that associate with FADs, but it is not clear what benefit they derive from this association. These are often smaller forage fish. Lastly, the accumulation of fish around FADs attracts fish predators (e.g., sharks, larger fish, sea lions, dolphins, etc.). After some period, a whole community of fish can become associated with a FAD.
Species of fish that feed on the benthic organisms associated with the structures may benefit from the new hard-substrate habitats. The attraction of predators to the structures may enhance predation rates and on some types of fish (e.g., juvenile fall Chinook salmon [Oncorhynchus tshawytscha]) this may have adverse affects. The plan for sighting of the wave energy facilities places them right in the habitat of juvenile fall Chinook salmon. The habitat for fall Chinook during their first year at sea is the nearshore zone, from the surf zone out to only a few kilometers from shore. Although we do not know how or if the wave energy structures will impact these fishes, it is clear that the nearshore zone is where these endangered and threatened species do live. Thus, it is imperative that we work to determine if there is any negative conflict between the devices and the fishes.

77
Receptor-specific effects table for pelagic habitat. KEY: L=low impact, M=medium impact, H=high impact, U=unknown, ?=some uncertainty associated with the estimate, + positive effect, - negative effect
Activity (agent or stressor) Receptors
Phyt
opla
nkto
n
Neu
ston
ic P
lank
ton
Mer
opla
nkto
n
Hol
ozoo
plan
kton
a
Mys
ids b
Jelly
fish
and
Cte
noph
ores
Mar
ket S
quid
c
Shar
ks
Mig
rato
ry F
ishe
s d
Fora
ge F
ishe
s
Leat
herb
ack
Sea
Tu
rtles
e
Juve
nile
Sal
mon
Mol
a m
ola,
Oce
an
Sunf
ish
Alteration of Currents f,g L? Antifouling Coatings h Lb La L Hydraulic Fuel Spill i Lb Water Flow Entrainment j Ua Ua, n U Ha Structure:
Habitat k H?+/- b,n Ub,o Accumulation near k M+? M-H U H Growth on k H H+b,n Attraction to k M-H L+a,p H+?a,b,p H+?a,b,p Prey attraction to or growth on k
M+?a L+a,p M+a,b,p M+?a,b,p
Predator attraction to k M-H U Avoidance of k L+a,p
Mooring Lines (Entanglement) Ha,k M?m M?m EMF Effects on Navigation l L?b M-H?a,b M-H?a,b M-H?a,b M-H?a,b M-H?a,b M-H?a,b
a effect on individual b effect at local population level c Doryteuthis opalescens (formerly Loligo opalescens) d most migratory fish live further offshore than the proposed facility area e Dermochelys coriacea f can mitigate effect by appropriate facility design g effect at community level h effects will be low if coatings do not leach toxins into the water; can mitigate by using appropriate coatings i low if double-walled containment is used
j physical damage, device-specific; mitigate by avoiding devices dependent on water inflow k mitigation probably not possible l may be able to mitigate by using enough shielding m effect on individual, or population in case of rare species; mitigate by avoiding loose mooring lines n species-dependent o may affect spawning habitat, which is location-specific; can mitigate by not placing wave-energy facilities at known spawning sites p effect on schools

78
Receptor Breakout Group Report: Benthic Habitat
Participants:
Ray Buckley, WDFW John Chapman, HMSC Bob Emmett, NOAA-NMFS, NWFSC Jack Engle, UCSB Hugh Link, Oregon Dungeness Crab Commission Bruce Menge, OSU John Meyer, OSU (Facilitator) Fred Piltz, MMS Erin Richmond, OSU (Rapporteur) Gil Rilov, OSU (Chair)
Key Findings
Benthos is the community of organisms that either live on the seabed substrate (epifauna), in the substrate (infauna), or have strong affinity to the substrate (for example, reef fish). Any structure added to the coastal environment and connected to the seabed will impact benthic communities and can be regarded as a stressor (Gill 2005). Stress is any type of change, whether “negative,” e.g., reduction/deletion of species, or “positive,” e.g., addition of species to the community.
The vision of wave energy technology is to establish multiple facilities, each with multiple units, along the shore. The effect of a single unit does not necessarily scale up linearly with multiple units. Communities developing on multiple units and at multiple complexes can interact through connectivity and thus these projects could have net effects greater than the sum of their parts. We therefore used a “worst-case scenario” approach when dealing with the potential ecological effects of this technology. There are many potential technological designs that may be implemented in the future along the Oregon shore, but because all designs involve massive anchoring systems that will rest on the bottom, and objects with large volumes at or near the surface, we addressed this problem generically. As far as we know, all structures are planned to be situated on soft bottoms, therefore our discussion reflected this
assumption. Specific key findings included the following:
1. Assuming that wave energy facilities will include high numbers of large units at multiple locations along the coast, their ecological impact on the benthos could be considerable. Their physical presence will increase habitat complexity by adding structure to the soft bottom directly by the anchoring system and by altering local hydrodynamics; and indirectly by debris shedding off the mid- and surface-water structures during maintenance, or naturally as fouling grows and becomes heavy. The effects can scale up beyond a simple linear increase with size.
2. Highest effects are expected during technology operation, less during deployment and decommissioning (unless those processes involve dragging structures across the bottom or abandoning structures).
3. The structures could affect both nearshore hydrodynamics and sediment transport, indirectly affecting bottom communities, water velocities, and larval transport.
4. If toxic antifouling paints are used on wave energy structures, considerable pollution effects are expected on the marine community within and beyond the location of the facilities.

79
5. More basic information is needed before wave energy projects can be implemented sustainably. Areas with large information gaps include seafloor mapping, and modeling of changes in ocean circulation and wave energy patterns. Modeling can reveal potential effects of these changes on nearshore currents, and on sediment and larval transport. Models should examine changes resulting from multiple structures, and incorporate a broad range of seawater densities and offshore distances. Models should be validated as pilot scale facilities develop.
6. A proper scientific approach should be used to test for possible ecological effects on the benthos while pilot wave energy studies are underway, and close monitoring should continue as full build-out occurs. This includes a Before-After-Control-Impact (BACI) study design.
7. Useful information can be readily obtained concerning existing communities on and below nearshore buoys or other upper water column structures already placed along the Oregon coast.
Top Ecological Issues
Anchoring system
Community composition and species interactions—Based on the suggested designs, each unit will have a large anchoring system made of concrete and/or metal that will create a large footprint on the sea floor. This structure, plus bottom structures such as the subsea pod unit in the Reedsport OPT project and pipes containing electrical cables, will add structural complexity to the seabed. This will create de facto artificial reefs that will recruit hard-benthos organisms and change the local soft-bottom community structure. Apart from increasing local biological diversity, some organisms that will recruit or be attracted to those structures could affect organisms in
adjacent habitats. For example, hard-bottom predators such as fish and crabs will probably prey on the surrounding natural soft-bottom epi- or infauna, thus expanding the impact beyond the footprint of the structures themselves (Langlois et al. 2005).
Hydrodynamics and sediment composition—Large bottom structures alter bottom water flow and shear, which alter sediment deposition and composition. Benthic communities are highly sensitive to sediment composition and thus threatened by these changes.
Mid- and surface-water structures
Community composition and species interactions—Large mid- and surface-water structures proposed in the different technologies will be home for massive fouling communities unless coated by highly effective antifouling paints. These fouling communities will increase deposition to the bottom, as organisms fall off, or when they are cleaned off during maintenance to increase efficiency or reduce corrosion of the units. In Oregon, the fouling community includes many “ecosystem engineers” such as large mussels and barnacles. Therefore, it is expected that the shells of fouling organisms will pile on the bottom and over the years will increase the bottom structural complexity surrounding these units (see an example from oil rigs, Love et al. 1999). Furthermore, ocean waves and strong currents have the potential to spread the debris beyond the units’ area. Shedding is expected to be facilitated during winter storms. Large amounts of decaying organic matter on the bottom can also reduce dissolved oxygen levels, potentially contributing to the “dead-zone” phenomenon that has developed along Oregon shores in recent years.
Hydrodynamics and sediment composition—The large piles of fouling debris could alter bottom water flow and sediment deposition and composition, potentially impacting benthic communities. Vertical movement of floating mid-water structures can also create vertical currents and suspend

80
sediments, affecting sediment dynamics and community structure.
Trapping algal drift mats—Surface structures and mooring lines can entangle large kelp mats floating on the ocean surface. Trapped mats will affect local communities by providing extra shelter and food for invertebrates and fish. Pelagic juvenile rockfishes recruited to the drift mat habitats will have normal migration patterns (i.e., drift trajectories) disrupted, and may suffer increased mortality. Drift mats could also facilitate kelp growth on the hard structures by shedding kelp propagules, as well as add organic matter to the benthos as they decay.
Circulation—Many large, stationary, floating devices influence wave and current regimes. These changes can affect nearshore sediment flow and beach erosion. The floating units can affect larval fronts (for example in upwelling fronts) and thus dispersal and recruitment to the benthic habitat at the site or upstream or downstream of it.
Dislodged structures—Storms, collisions with ships, or equipment failure can dislodge units or their components. These structures can tangle with other structures, drag along the bottom, find their way to the bottom and add structure there (see above for potential effects), or wash up on a sandy beach or a rocky shore. The huge structures proposed in most designs will not be easily removed from the shore and thus could have considerable effects on longshore sediment transport on sandy beaches, and on intertidal benthic communities.
Antifouling
If toxic antifouling paints are used on the floating devices, pollution of the water column and bioaccumulation through the food web is certain. The magnitude of the pollution depends on the compound, the matrix in which it is embedded, erosion rate (dependent on degree of water movements including swells and currents), and the number and size of units.
Scale
One or several sparingly spaced units will probably serve mostly as population sinks within a network of metapopulations. However, many large units spread over large areas could create extensive connected communities that could interact by movement of adults and/or larvae and will become population sources for other artificial and natural hard substrata in the region. Pollution from antifouling paints from hundreds of large units could affect marine organisms on a coastal scale.
Stepping-stones for invasive species
The Oregon coast has large expanses of sandy beaches and seabed with no hard substrate. This natural seascape can potentially reduce the spread of hard-substrate-dwelling invasive species with short dispersal ranges. Dotting soft-bottom areas with many large hard structures increases the potential for such species located north or south of the Oregon coast to spread along the shore by supplying habitat necessary for recruitment and growth, creating populations that can then serve as sources of dispersal further along the shore.
Effective closure of wave energy project areas—the protected areas effect
The effective closure of portions of the ocean floor from extractive activities can result in an increase in the abundance and size of soft-bottom-dwelling organisms such as crabs and fish. This may result in a spillover effect, i.e., the export of adults or young outside of the protected area to the potential benefit of fisheries around it (Gell and Roberts 2003). The community that forms on the hard structures will also be protected and as stated above could export adults and young to other areas.
Scientific Uncertainty and Agreement
There are many levels of uncertainty with regard to the potential direct and indirect effects of the proposed wave energy technologies on Oregon’s nearshore benthic habitat. Nothing of the magnitude of the proposed projects has ever

81
been placed in the Oregon ocean, or perhaps anywhere else. The only equivalents may be oil and gas rigs, and recently, nearshore wind farms. Publications on the assessed ecological implications of offshore renewable energy development projects (Gill 2005) are not yet available, except for the effects on birds by wind turbines. Our assessments here are therefore based on general knowledge of benthic ecology, and on the long-known effects of artificial reefs (e.g., Davis et al. 1982, Rilov and Benayahu 2002).
Key Information Gaps
Lacking first and foremost are detailed maps of the seafloor along the Oregon coast. Maps will reveal where placements will be most likely to avoid rocky reefs. We encourage the implementation of a detailed inner-shelf seafloor mapping program before any large-scale deployment of the technology takes place. This mapping should include both physical (type of substrate and its features) and biological (communities) information. There is already benthos data out there (most in gray literature) that needs to be compiled, synthesized, and analyzed. The Dungeness crab (Cancer magister) fishers could also provide information on areas that are “biological hot spots” that need some degree of protection. These types of data would help identify areas where wave energy project activity should preferably be avoided.
Another large knowledge gap is the effects of large stationary objects in the nearshore on ocean currents and larval transport. Such effects can vary greatly among designs of individual technologies, and the number and distance between units and complexes. Models of nearshore oceanography will assist efforts to estimate larval transport effects and effects on sediment transport.
Information on the fouling communities that develop on large stationary floating structures along the Oregon shore, and their rates of development in different ocean conditions, is lacking. Monitoring of fouling of existing nearshore buoys (and of the debris that piles on the bottom underneath them) might be a first
step in that direction, and monitoring of wave energy structures placed for any pilot study will be highly valuable.
Feasibility and Effectiveness of Mitigation
There is no way to effectively reduce the impact of the bottom structures except for scraping organisms off the surface, packing them, and bringing them back to shore, or alternately using antifouling paints that could cause pollution if toxic. Burying the anchors entirely under the sediments when in use and removing them at the end of their use will reduce their effects. Nontoxic antifouling paints (see for example Perez et al. 2007, and Univ.of California 1998–2007 for epoxy alternatives) on mid- and surface-water structures will reduce impacts, but we are not sure that epoxy paints are effective on stationary structures.
Placing structures farther offshore is recommended to reduce potential effects on nearshore currents and onshore communities, as is keeping the units as small as possible.
Recommendations for Baseline and Monitoring Studies
Testing and monitoring the potential ecological effects of the developing technology on the benthos requires Before-After-Control-Impact approaches with sufficient replication for statistical analyses.
Potential sites for deployment should be monitored before deployment for at least a year (to capture seasonal variability). Multiple adjacent sites to the north and south (distance to be determined by the size of units and of the entire complex) should be monitored as controls. The size of the monitoring plots and their distance should be based on ecological considerations, including dispersal and movement ranges of dominant organisms. Samples of water, sediment, and organisms should be taken at increasing distances from point sources to test the potential effects of toxic antifouling paints. If bioindicators for the specific pollutants exist, they should also be used.

82
Literature Cited
Davis, N., G. R. VanBlaricom, and P. K. Dayton. 1982. Man-made structures on marine sediments: effects on adjacent benthic communities. Mar. Biol. 70:295–303.
Gell, F. R., and C. M. Roberts. 2003. Benefits beyond boundaries: the fishery effects of marine reserves. Trends Ecol. Evol. 18:448–455.
Gill, A. B. 2005. Offshore renewable energy: ecological implications of generating electricity in the coastal zone. J. Appl. Ecol. 42:605–615.
Langlois, T. J., M. J. Anderson, and R. C. Babcock. 2005. Reef-associated predators influence adjacent soft-sediment communities. Ecology 86:1508–1519.
Love, M. S., J. Caselle, and L. Snook. 1999. Fish assemblages on mussel mounds surrounding seven oil platforms in the Santa Barbara Channel and Santa Maria Basin. Bull. Mar. Sci. 65:497–513.
Perez, M., M. Garcia, G. Blustein, and M. Stupak. 2007. Tannin and tannate from the quebracho tree: an eco-friendly alternative for controlling marine biofouling. Biofouling 23:151–159.
Rilov, G., and Y. Benayahu. 2002. Rehabilitation of coral reef-fish communities: the importance of artificial-reef relief to recruitment rates. Bull. Mar. Sci. 70:185–197.
University of California, Sea Grant Extension Program. c1998–2007. Nontoxic antifouling strategies project. Online at http://seagrant .ucdavis.edu/nontoxicdemo.htm [accessed 28 August 2008]

83
Receptor-specific effects table for benthic habitat. KEY: L=low impact, M=medium impact, H=high impact
Activity (agent or stressor) Receptors
Sedi
men
t Gra
in S
ize
Perc
ent O
rgan
ics
Cur
rent
Spe
eds
Turb
ulen
ce
Foul
ing
Com
mun
ity
Poly
chae
te W
orm
s
Mol
lusc
s
Cru
stac
ean
Infa
una
Cru
stac
ean
Epifa
una
Echi
node
rm In
faun
a
Echi
node
rm E
pifa
una
Paci
fic S
andl
ance
d
Emplacement Mooring System L L L L L L L L L L L L Electrical Transmission Infrastructure L L L L L L L L L L L L
Operation Mooring System H H H H H H H H H H H H Buoy or Other Generation Device H H H H H H H H H H H H Electrical Transmission Infrastructure a Chemical Coatings b L L L L L L L L L L L L Equipment Loss L L L L H H H H H H H M
Decommissioning Buoy or Device Removal L L L L L L L L L L L L Transmission Infrastructure Removal L L L L L L L L L L L L Anchor Removal or Decommissioning L L L L L L L L L L L L
Routine Maintenance Vessel Traffic, Maintenance Activities L L L L L L L L L L L L Biofouling Removal c M H L L H H H H H H H H
a If buried, impacts will be all low; if above the sediment surface, impacts will all be medium to high. b Impacts will be low if U.S. Coast Guard recommendations are followed. c Cleaning the buoys, lines, etc., will require care to prevent deposition of raining organic matter on the seafloor. d Ammodytes hexapterus

84
Receptor Breakout Group Report: Fish and Fisheries
Participants:
David Baldwin, NOAA-NMFS, NWFSC George Boehlert, OSU (Facilitator) Ann Scarborough Bull, MMS Matt Cutlip, FERC John Ferguson, NOAA-NMFS, NWFSC (Chair) Mike Fitzpatrick, FINE David Fox, ODFW Kaety Hildenbrand, OSU Steve Kajiura, Florida Atlantic University Laurel Kellner, OSU (Rapporteur) Bob Thresher, National Wind Technology Center Waldo Wakefield, NOAA-NMFS, NWFSC
Key Findings
Discussions focused on the positive and negative effects on fish and fisheries that may result from installing, operating, and maintaining wave energy generating structures in nearshore ecosystems along the Oregon coast. A high degree of diversity exists in the habitats and in the biological communities that are present in the areas proposed for wave energy facilities, and in the various fisheries that target this diversity. There is a lack of adequate information and a high level of scientific uncertainty regarding the effects these structures may have on the diverse fish communities and their associated commercial and recreational fisheries communities. We reached the following overall conclusions from the breakout session:
1. The installation, operation, and maintenance of wave energy generating devices in the nearshore ecosystems will change the physical structure of the benthic and pelagic habitat available to fishes and limit its accessibility to fishers. Physical structures will be placed in the water column and on the bottom where none currently exist. The structures may function to attract fishes and affect the species composition of fish populations that occupy these habitats on daily, seasonal, annual, and
decadal scales. They may affect the relationships between predators and their prey, and thus the food web and trophic structure of the nearshore ecosystems at wave energy installation sites.
2. The wave energy devices are being placed in the corridors some species use to migrate along the coast or up onto the continental shelf. This may have direct effects on certain species such as juvenile and adult salmonids, Dungeness crab (Cancer magister), green sturgeon (Acipenser medirostris), and elasmobranchs, whose behavior may change in the vicinity of the developed area during migrations. The energy devices may also indirectly affect fish using such migration corridors by emitting electromagnetic, acoustic, and chemical fields at levels that interfere with fish navigation and orientation systems; by altering their preferences for certain habitat types; and by deterring fish from entering the area.
3. The amount of data on the impacts wave energy devices may have on the biology of fishes and their physical environment, and how those impacts scale with the size of a given installation, is very limited. This lack of information results in a high degree of uncertainty

85
associated with our ability to quantify and forecast potential effects on fish, coastal ecosystems and communities, and the associated fisheries. To address this uncertainty, we recommend that biological and ecological study sites be established or incorporated into proposed wave facility demonstration sites. In study sites, baseline and postinstallation information should be gathered to quantify any shifts in species composition, community structure, and predator-prey relationships. Studies should also assess offsite effects such as 1) changes in fishing effort; 2) physical changes in nearshore habitat structure and function (due to altered wave energy patterns and current attenuation) and their effects on the type and amount of habitat available to fishes; and 3) effects from irregular but potentially significant events such as oil or chemical spills and structures dislodged during storm events.
Top Ecological Issues
New structures
The addition of cables, floats, mooring systems, and energy-generating devices themselves will add physical structure to benthic and pelagic habitats where none exists currently. This may change the access fishes have to these habitats, the food-web structure, and the fish communities that use the habitat. Depending on the species, this could be a positive change (e.g., the structure attracts forage fish species that are prey), or a negative change (e.g., the physical nature of the wave energy attenuation changes the structure of sand waves on the bottom and alters crab migration corridors).
Protected areas
The wave energy facility sites may function as surrogate marine protected areas (MPAs) because fishing activities may be excluded by changes to either regulations or physical access to the sites. Studies of fish responses and changes in community structure within existing
MPAs could be a source of information for evaluating the potential effects of wave energy development along the coast.
Fish populations in nondeveloped areas may be depleted due to a shift in fishing pressure from the wave energy complex area to other fishing sites.
Noise, EMF, and chemicals
The wave energy structures, mooring cables, and devices may emit noise; electromagnetic fields (EMF); and chemicals from antifouling coatings, zinc anodes, and hydraulic or vegetable oil reservoirs. If the noise, EMF, and chemicals are above sensory threshold levels, they may affect fish sensory systems and the ability of individual fish to orient to their environment, find prey, and avoid predators.
Dislodged structures
The impact on coastal ecosystems from wave energy structures breaking away during high storm events is unknown. The group felt that these events are certain to occur, but their frequency, and any impacts that equipment loss or associated maintenance activities may have on benthic habitat, shoreline structure, and local biological communities are unknown.
Wave attenuation
Wave energy structures will convert the physical energy contained in waves into mechanical energy, which will change the magnitude and patterns of waves approaching the shoreline. The physical effects of wave attenuation on bottom habitat structure are unknown, as is the response of biological communities to any such changes.
Cumulative effects
The cumulative impacts of several wave energy facilities may be greater than impacts that can be anticipated from a single site. Consideration of cumulative impacts needs to be incorporated into any program examining the effects of wave energy development.

86
Scientific Uncertainty and Agreement
Although the level of uncertainty associated with any of our comments is high, courses of action are available to reduce this uncertainty.
First, specific experiments that examine the effects of wave energy devices on the various species of fish and invertebrates in the wave energy facility area should be conducted. For example, these could include studies of effects of acoustic, electromagnetic, and chemical levels that are produced by wave energy generators on fish olfactory, hearing, and navigation sensory systems. The “dose” could be measured and related to the “response” by individual fish in the laboratory, and ultimately scaled to population-level effects through quantitative modeling.
Second, impact studies that measure ecological characteristics over time should be conducted to look for evidence of differences (impacts) between developed and control sites. Presumably, any differences will be attributed to the impact, but close attention will have to be paid to the experimental design, the randomization of study sites, and replication. The timing of the installation must be known in advance so that baseline information can be collected, and data should be collected over a period of several years to incorporate interannual environmental variability. The ecosystems along the Oregon coast are characterized by a high degree of variability over daily, seasonal, annual and decadal scales, and this variability will have to be factored into any study designs, such as those using a BACI (Before-After-Control-Impact) design.
Key Information Gaps
The following are unknown:
1. Effects of electromagnetic emissions on fish behavior, especially feeding and migration.
2. Effects of noise emissions on fish behavior.
3. Effects of wave energy facilities and energy generating devices on the structure of the demersal and pelagic communities within the wave energy facility and surrounding areas.
4. The leaching rates of chemicals used in wave energy facilities (e.g., antifouling chemicals, epoxy resins, and oils and lubricants necessary for fabrication and maintenance); the effects of ambient levels of these chemicals on fish and crab behavior and toxicology; and the degree that chemicals enter the food chain and bioaccumulate.
5. Effects wave energy facilities will have on crab migrations from deep to shallow habitats. The Dungeness crab fishery is the largest fishery (based on dollars) along the Oregon coast.
6. Effects on green sturgeon. Wave energy facilities may be placed in the depth zone of green sturgeon migration corridors. This species migrates north and south seasonally each year at depths around 28 fathoms (about 51 m). Green sturgeon populations are depleted and at risk.
7. Effects on salmon. Wave energy facilities may also affect the migrations of juvenile salmon along the shore, onshore, and offshore; and adult salmon during homing migrations to natal rivers and while waiting near river mouths for river hydraulic conditions to improve.
8. Effects on the ontogenetic migrations of demersal fishes.
9. Effects of maintenance activities on the local demersal and pelagic communities. These would include the use of high-velocity water jets to remove organisms that have attached to buoys and cables, and their subsequent accumulation on the bottom.

87
Feasibility and Effectiveness of Mitigation
Generating electrical energy from wave energy is a relatively new and untested technology. Thus, the feasibility and effectiveness of mitigation measures for key ecological impacts are unknown. The potential effects of wave energy structures and how to mitigate for their effects in coastal Oregon ecosystems could be examined through several concurrent approaches. First, the results of studies that have been conducted on prototype wave energy structures and facilities in Europe over the past 10 years should be reviewed for applicability in the Pacific Northwest. Second, baseline biological information should be collected at proposed development sites. Third, small-scale experiments with prototype structures should be conducted at locations dedicated for such research. One such site has been proposed by Pacific Gas & Electric for the northern California coast, and a second demonstration site is planned for the coast off Newport, Oregon. Studies of the physical impacts to both sandy and rocky substrates should be evaluated, along with the concomitant responses by the biological communities associated with each type of habitat.
Recommendations for Baseline and Monitoring Studies
1. Wave energy demonstration facilities should also be biological and ecological monitoring sites, whereby baseline biological information is gathered alongside the engineering, deployment, and operational tests of prototype systems.
2. Close attention will have to be given to the experimental designs associated with
efforts to measure biological impacts (see Scientific Uncertainty and Agreement above).
3. Uniform monitoring protocols need to be developed so that sampling results from before and after installation are comparable.
4. Fish and benthic community population sizes should be monitored throughout the sampling period (year) to evaluate seasonality effects and monitor aggregation behavior and periods.
5. Information on how fish communities respond to existing MPAs could be used to inform wave energy facility siting considerations, and develop baseline/control study areas.
6. Changes in the behavior of migratory fish in and near wave energy facilities should be monitored using tagging technologies and telemetry procedures.
7. The tissues of fish and benthic organisms should be sampled if chemical leaching is suspected or has been documented. Ideally, tissue samples should be taken and archived prior to the installation of facilities to allow for the establishment of baseline levels of contaminants.
8. Unique, site-specific monitoring requirements should be identified and incorporated into sample design and evaluation protocols. For example, a specific wave energy facility location may include a unique feature such as strong upwelling or a physical feature that warrants special consideration.

88
Receptor-specific effects table for fish and fisheries. KEY: L=low impact, M=medium impact, H=high impact, U=unknown, ?=some uncertainty associated with the estimate, + positive effect
Activity (agent or stressor) Receptors
Mar
ket S
quid
a
Dun
gene
ss C
rab
Pink
Shr
impb
Shar
ks
Salm
on a
nd
Stee
lhea
dc
Alb
acor
e Tu
nab,
d
Smel
ts, h
errin
g,
sard
ines
, anc
hovi
es
Roc
kfis
h, L
ingc
ode
Oth
er D
emer
sal
Rou
ndfis
hes
Flat
fish
Skat
es a
nd R
ays
Gre
en S
turg
eon
Paci
fic S
andl
ance
f
Emplacement Mooring System L L L L L L L L L L L L L Electrical Transmission Infrastructure L L L L L L L L L L L L L
Operation Mooring System & benthic habitat (shell mounts) H+ H M+ M+ Mg M+ L H+ H+ Mh L H L Buoy or Other Generation Device L L L M+ Mg M+ L H+ H+ L L L L Electrical Transmission Infrastructure(EMF) L M? L H H? L L M? M? L H H L Chemical Coatings L H L L H L L M M M L L L Wave and Current Attenuation U U U U U U U U U U U U U Acoustics L L L L H? L M M? M? L L L L
Decommissioning Buoy or Device Removal L L L L L L L L L L L L L Transmission Infrastructure Removal M M M L M L L M M M M M M Anchor Removal or Decommissioning M M M L M L L M M M M M M
Routine Maintenance Vessel Traffic, Maintenance Activities L? L? L? L? L? L? L? L? L? L? L? L? L?
a Doryteuthis opalescens (formerly Loligo opalescens) b Low vulnerability given our understanding of the current wave energy
structures and technology c Sea-run rainbow trout, Oncorhynchus mykiss d Thunnus alalunga e Ophiodon elongates
f Ammodytes hexapterus g positive effect for adults, negative for juveniles h positive or negative effect, varies with species

89
Receptor Breakout Group Report: Marine Birds
Participants:
Holly Campbell, OSU (Rapporteur) Robin Hartmann, Oregon Shores Conservation Coalition (Facilitator) Jan Hodder, OIMB (Chair) Roy Lowe, USFWS Rob Suryan, OSU Jen Zamon NOAA-NMFS, NWFSC
Key Findings
For purposes of this document, our definition of “marine birds” included not only seabirds that spend their entire lives in marine waters, but also waterbirds, waterfowl, and shorebirds that are seasonal visitors to marine waters or use marine flyways during migration.
We divided the stressors introduced by facilities harvesting wave energy into two broad categories: 1) direct effects from wave energy structures, which include impacts such as mortality, injury, and attraction/avoidance of an area, and 2) indirect effects such as changes in bird habitat or food webs. Stressors may be new stressors that are introduced to the environment as a result of wave energy infrastructure; or enhanced existing stressors that are already present in the environment but whose impact will be increased due to the addition of wave energy infrastructure. Following are specific conclusions from our discussion:
• Given currently existing information, collisions with structures above the sea surface have the largest potential direct impacts on marine birds. Lighting and structures may result in unusual attraction and collisions.
• The most important indirect effects are likely to be the alteration of coastal ocean food webs and the physical effects of wave energy alteration on the beach, which have the potential to affect shorebirds that forage and nest there.
• We have significant data gaps in the spatial and temporal abundance of birds.
In particular, we do not know if there are important areas of bird activity in the ocean to avoid, or what birds do at night, particularly during migration.
Top Ecological Issues
Direct effects of wave energy structures
New stressors for marine birds—New key stressors for marine birds include any wave facility structures above the sea surface. Specific issues identified with new stressors are as follows:
1. Presence of any continuous lighting associated with wave energy facilities will attract birds to the structure at night, thus causing distribution or behavior changes that may lead to collisions.
2. Flying birds may collide with hard structures above the surface during times of high winds or poor visibility (storm conditions, fog, and darkness).
3. Oil leakage from any part of the structures, even nontoxic oils, will foul feathers and disrupt their waterproofing and thermoregulatory functions.
Collision hazards for flying birds are documented by studies that monitor wind energy harvesting devices. The greatest direct mortality occurs when improper site selection places wind energy structures within a migration corridor. We are therefore very concerned about proper site selection for wave energy structures.

90
It is possible to collect information on marine bird migrations and commuter flyways, and thus increase the probability of low-impact site selection (see below). However, unlike the land-based collision hazard studies, we currently lack an effective methodology to detect and measure collision injury or collision mortality of birds at sea. This critical uncertainty about one of the most significant direct stressor impacts will remain unless a method for measuring bird collisions with wave energy structures can be developed.
Enhancement of existing stressors for marine birds—Stressor types (e.g., vessels, mooring lines) already present within the environment due to existing human uses, but which will be added to or enhanced by wave energy structures, include vessel activity and subsurface lines associated with wave energy facilities. Specific key issues identified with enhancement of existing stressors include the following:
1. Deck lights from installation or maintenance vessel activity at night will attract birds.
2. Vessel accidents or vessel collisions with wave energy structures could result in oil spills.
3. Subsurface structures may alter food-web dynamics, food distribution, habitat, or habitat accessibility for birds.
Indirect effects of wave energy structures on habitat and food webs
We anticipate that arrays of wave energy structures will have effects on physical habitat as well as on other marine organisms such as benthic invertebrates and fish. Specific effects are contained in reports from other receptor groups. Those impacts likely to affect marine birds include the following:
1. Food-web changes (e.g., distribution, abundance, or behavior of fishes and invertebrates) may have positive or negative impacts on foraging by marine birds.
2. “Shadow” effects caused by energy absorption in the structures may affect the physical environment of the sandy shore, thus affecting shorebird habitat. Effects on sanderlings (Calidris alba) and snowy plovers (Charadrius alexandrinus) are the principal concerns.
Scientific Uncertainty and Agreement
Available data
There are limited contemporary data on Oregon marine birds. These data were collected under a variety of mandates and methods, and information has not been synthesized. Below is a summary of contacts and information sources of which we are aware:
1. Scientific literature and presentations address historical species presence or absence and community composition on the Oregon coast, and approximate depth ranges within which species are most abundant.
2. Roy Lowe (USFWS) has a catalog with locations of Oregon coast seabird breeding sites, and information on snowy plovers. The Habitat Conservation Plan for the snowy plover (OPRD 2005) and Designation of Snowy Plover Critical Habitat (USFWS 2005) are available online.
3. Jen Zamon (NOAA-NMFS, NWFSC) has at-sea bird distribution data from Newport, Oregon, north to the Washington state border, collected primarily in May and June from 1 to 25 nautical miles (1.85–46.3 km) offshore during 2003 to 2007.
4. Rob Suryan (OSU) has at-sea bird distribution data from the Newport Hydrographic line from 1 to 25 nmi offshore during 2007, and satellite telemetry on endangered albatross (Suryan et al. 2007).
5. Craig Strong (Crescent Coastal Research) has at-sea bird distribution

91
data from the surf zone to about 3 nmi (about 5.5 km) offshore, as part of the marbled murrelet (Brachyramphus marmoratus) surveys during 1992–1996 and 2000–2004; and a dredged-material assessment report for Clatsop Spit, Oregon (Strong 2005).
6. Dave Ainley (HT Harvey & Associates) has at-sea bird distribution data from Newport, Oregon, south to the California border in 2000 and 2002 (Ainley et al. 2005, Ainley and Tynan 2005).
7. Lisa Ballance (NOAA-NMFS, SWFSC) has at-sea bird distribution data from three biannual offshore CSCAPE (Collaborative Survey of Cetacean Abundance and the Pelagic Ecosystem) survey lines in Oregon.
8. Glenn Ford (R. G. Ford Consulting) has compiled some of these disparate data sets, including MMS aerial surveys (Ford et al. 2004).
9. Greg Gillson (The Bird Guide, Inc.) has qualitative information on distribution and seasonal occurrence in central Oregon and elsewhere from pelagic bird-watching trips (Gillson 1994).
10. Range Bayer (Bayer Research, [email protected]; http://www .orednet.org/~rbayer/), Phil Pickering (private citizens) and Mike Patterson (Celeta Research Associates) have qualitative, land-based bird observation data from headlands, especially concerning seasonal occurrence and migrations.
Items of common knowledge, but lacking quantitative data
Two items of common knowledge about marine birds and habitat use were highlighted:
1. Large numbers of marine (and nonmarine) birds migrate within state waters of the territorial sea (0 to 3 nmi
from shore), particularly during the spring and fall.
2. Large numbers of birds make daily feeding commutes from river mouths and breeding colonies to feeding areas in nearshore or open ocean areas. These flyways occur within or cross through state waters of the territorial sea.
Key Information Gaps
Distribution and habitat use data
Comprehensive spatial and temporal data on the distribution and habitat use for marine birds along the Oregon coast are lacking. Methods for obtaining these data include ship-, aircraft-, or land-based surveys for daytime distribution; and satellite or radio tagging for habitat use and residence time.
Maps are needed of important bird feeding or staging areas (“hot spots”) along the Oregon coast. Data for these maps could be obtained by aircraft or ship surveys for daytime distributions, and satellite or radio tagging for habitat use both day and night.
We do not know which species fly at night or how far above the sea surface flight paths are. Information on migration patterns and behavior, including flight patterns at night and in storms, could be obtained through radar studies at night, and satellite or radio tagging.
Existing stressor analogs may provide useful insight
We have no information on wave energy structure impacts for Oregon coast marine birds or marine ecosystems because, at this time, only single devices have been deployed in Oregon for engineering tests or proof-of-concept. However, there is information available from other ecosystems that may provide useful insight, such as the following:
• Offshore wind-energy farms
• Offshore oil platforms

92
• Wave energy development in other parts of the world
Feasibility and Effectiveness of Mitigation
It is possible that direct and indirect effects of stressors can be decreased with appropriate design and deployment strategies. Several ideas that should be investigated were mentioned during the workshop discussion:
1. Avoid installing wave energy structures near breeding colonies, primary foraging areas, and migration corridors.
2. Constant bright light at night will attract birds or interfere with night-vision birds. Intermittent light should reduce light impacts. Intermittent lights should be off more than on during each lighting cycle.
3. Birds are probably attracted more to certain colors of light than others, so color of lighting could be a mitigation measure. This would require specific data or experiments.
4. Night work by vessels is more detrimental than daytime work.
5. Design of surface structures should minimize potential for roosting by birds. Simple and proven devices already exist to discourage roosting.
6. Underwater lines should be rigid and large to minimize underwater collision potential.
7. Structures should use multiple layers of containment for oils.
8. Above-surface structures should minimize height above the sea surface to reduce collision potential.
Recommendations for Baseline and
Monitoring Studies
It will be impossible to provide responsible measures of stressor impacts or minimize such impacts through wise site-selection or design
improvements without data on existing coastwide bird use and distribution. Furthermore, site-specific data must be collected to make Before-After-Control-Impact comparisons of positive, negative, and negligible impacts on marine birds. Below are some recommendations for the types of data needed to examine stressor impacts.
Baseline studies
Coastwide baseline studies prior to site selection should be used to recommend where stressor impacts are likely to be lowest and should consider
• Spatial and temporal distributions, habitat use by marine birds
• Migration and flight patterns
• Ecologically sensitive habitats (e.g., breeding, feeding areas)
Preinstallation studies
Once a site is selected, but prior to installation of wave energy structures, site-specific studies need to document preinstallation conditions, such as
• Bird distribution, abundance, behavior, and habitat use
• Comparisons within, near, and outside the spatial footprint of the installation
Postinstallation studies
Site-specific monitoring while structures are in place should document both positive and negative impacts, such as
• Bird distribution, abundance, behavior, and habitat use
• Comparisons within, near, and outside the site of the installation
• Comparisons with nearby control sites
• Direct mortality caused by collision or oiling

93
Literature Cited
Ainley, D. G., L. B. Spear, C. T. Tynan, J. A. Barth, S. D. Pierce, R. G. Ford, and T. J. Cowles. 2005. Physical and biological variables affecting seabird distributions during the upwelling season of the northern California Current. Deep-Sea Res. Part II Top. Stud. Oceanogr. 52:123–143.
Ainley, D. G., and C. T. Tynan. 2005. GLOBEC NEP Northern California current bird data, and current bird metadata, R/V New Horizon cruises NH0005 and 0007. Online at http://globec .whoi.edu/jg/dir/globec/nep/ccs/ [accessed 3 February 2008].
Ford, R. G., D. G. Ainley, J. L. Casey, C. A. Keiper, L. B. Spear, and L. T. Ballance. 2004. The biogeographic patterns of seabirds in the central portion of the California Current. Mar.Ornithol. 32:77–96.
Gillson, G. 1994. The Bird Guide, Inc. Online at http://thebirdguide.com [accessed 2 February 2008].
OPRD (Oregon Parks and Recreation Department). 2005. Habitat conservation plan for the western snowy plover. Draft. Online at http://www .oregon.gov/OPRD/PLANS/docs/masterplans/ osmp_hcp/HCP11-17-04.pdf [accessed 3 February 2008].
Strong, C. S. 2005. Marine birds of the near shore waters of Clatsop Spit: An assessment of composition, abundance, and potential effects from dredge spoil deposition adjacent to the south jetty of the Columbia River. Crescent Coastal Research, Crescent City. Online at http://inr.oregonstate.edu/download/marine _birds_final_strong.pdf [accessed 3 February 2008].
Suryan, R. M., K. S. Dietrich, E. F. Melvin, G. R. Balogh, F. Sato, and K. Ozaki. 2007. Migratory routes of short-tailed albatrosses: use of exclusive economic zones of North Pacific Rim countries and spatial overlap with commercial fisheries in Alaska. Biol. Conserv. 137:450–460.
USFWS (U.S. Fish and Wildlife Service). 2005. Endangered and threatened wildlife and plants; Designation of critical habitat for the Pacific Coast population of the western snowy plover; Final rule. Federal Register [Regulation Identifier Number 1018-AT89, 26 September 2005] 70(188):56970–57119. Online at http://frwebgate.access.gpo.gov/cgi-bin/ getdoc.cgi?dbname=2005_register&docid= fr29se05-14 or at http://www.gpoaccess.gov/ fr/retrieve.html [accessed 3 February 2008].

94
Receptor-specific effects table for marine birds. KEY: L=low impact, M=medium impact, H=high impact
Activity (agent or stressor) Receptors
Loon
s and
Gre
bes
Alb
atro
sses
Petre
ls
Shea
rwat
ers a
nd
Fulm
ars
Pelic
ans
Cor
mor
ants
Gul
ls
Tern
s
Com
mon
Mur
res
Mar
bled
Mur
rele
ts
Pige
on G
uille
mot
s
Auk
lets
Oth
er A
lcid
s
Shor
ebird
s
Wat
erfo
wl
Emplacement Mooring System M L L M L M L L M M L M M L M Electrical Transmission M L L M L M L L M M L M M L M Lighting on vessels and equipment
L L H H L L M L L L L H L L L
Operation Mooring System M L L M L M L L M M L M M L M Buoy or Other Generation H L L H L H L L H H L H H H H Electrical Transmission M L L M L M L L M M L M M L M Chemical Coatings L L L L L L L L L L L L L L L Lighting on Buoys L L H H L L L L L L L H L L L
Decommissioning Buoy or Device Removal L L L L L L L L L L L L L L L Transmission Infrastructure M L L M L M L L M M L M M L M Anchor Removal or Decommissioning
L L L L L L L L L L L L L L L
Lighting L L H H L L L L L L L H L L L Routine Maintenance
Vessel Traffic, Maintenance L L L L L L L L L M L L L L L Lighting L L H H L L M L L L L H L L L
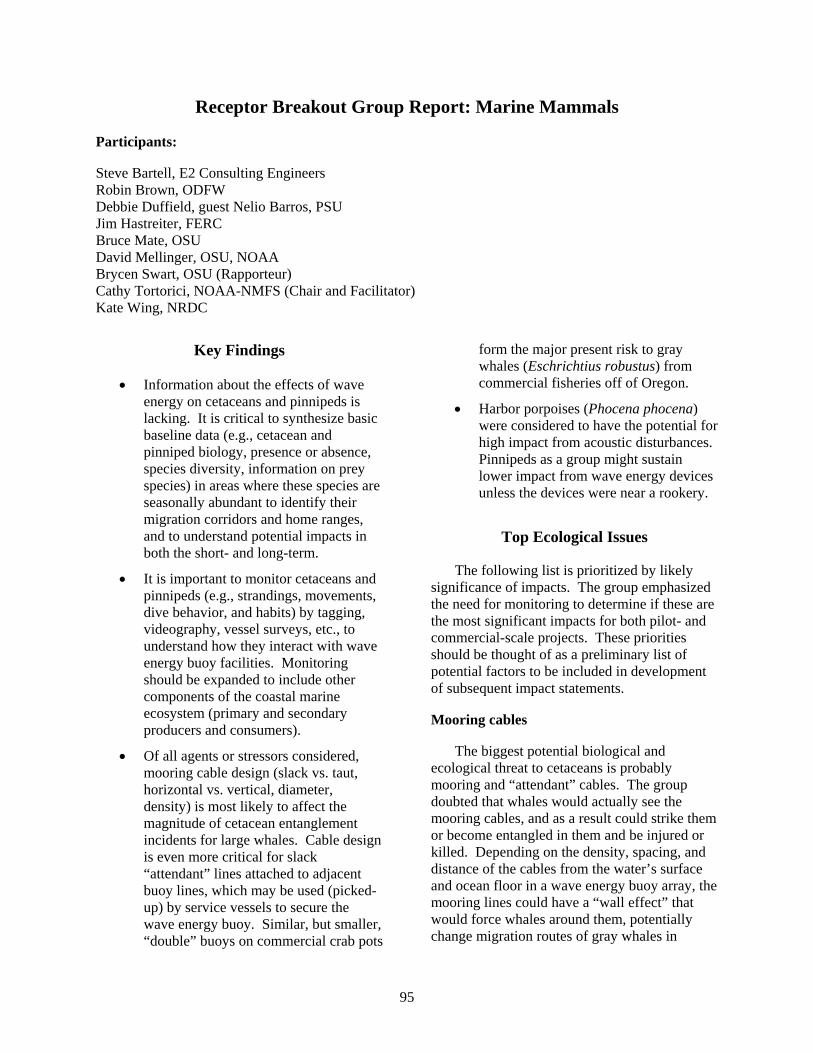
95
Receptor Breakout Group Report: Marine Mammals
Participants:
Steve Bartell, E2 Consulting Engineers Robin Brown, ODFW Debbie Duffield, guest Nelio Barros, PSU Jim Hastreiter, FERC Bruce Mate, OSU David Mellinger, OSU, NOAA Brycen Swart, OSU (Rapporteur) Cathy Tortorici, NOAA-NMFS (Chair and Facilitator) Kate Wing, NRDC
Key Findings
• Information about the effects of wave energy on cetaceans and pinnipeds is lacking. It is critical to synthesize basic baseline data (e.g., cetacean and pinniped biology, presence or absence, species diversity, information on prey species) in areas where these species are seasonally abundant to identify their migration corridors and home ranges, and to understand potential impacts in both the short- and long-term.
• It is important to monitor cetaceans and pinnipeds (e.g., strandings, movements, dive behavior, and habits) by tagging, videography, vessel surveys, etc., to understand how they interact with wave energy buoy facilities. Monitoring should be expanded to include other components of the coastal marine ecosystem (primary and secondary producers and consumers).
• Of all agents or stressors considered, mooring cable design (slack vs. taut, horizontal vs. vertical, diameter, density) is most likely to affect the magnitude of cetacean entanglement incidents for large whales. Cable design is even more critical for slack “attendant” lines attached to adjacent buoy lines, which may be used (picked-up) by service vessels to secure the wave energy buoy. Similar, but smaller, “double” buoys on commercial crab pots
form the major present risk to gray whales (Eschrichtius robustus) from commercial fisheries off of Oregon.
• Harbor porpoises (Phocena phocena) were considered to have the potential for high impact from acoustic disturbances. Pinnipeds as a group might sustain lower impact from wave energy devices unless the devices were near a rookery.
Top Ecological Issues
The following list is prioritized by likely significance of impacts. The group emphasized the need for monitoring to determine if these are the most significant impacts for both pilot- and commercial-scale projects. These priorities should be thought of as a preliminary list of potential factors to be included in development of subsequent impact statements.
Mooring cables
The biggest potential biological and ecological threat to cetaceans is probably mooring and “attendant” cables. The group doubted that whales would actually see the mooring cables, and as a result could strike them or become entangled in them and be injured or killed. Depending on the density, spacing, and distance of the cables from the water’s surface and ocean floor in a wave energy buoy array, the mooring lines could have a “wall effect” that would force whales around them, potentially change migration routes of gray whales in

96
particular, and block feeding habitat underneath the array. Presently, designers are suggesting 50- to 100-meter spacing.
Thin mooring cables are more dangerous than thick ones because they may cause lacerations and entanglements, although thick cables may cause blunt-force trauma. Slack cables are more dangerous than taut ones for entanglement risk, and depending on where they are in the water column, horizontal cables are more dangerous than vertical lines. In this respect, even short tag lines attached to a buoy with a slack horizontal line pose a significant risk for entanglement.
In addition, if the transmission cables and/or anchor lines associated with a wave energy array are buried less than 1 m, gray whales could dig them up while feeding, so this point needs to be factored in as arrays are designed.
Buoys
Effects on gray whales could be high if project construction and decommissioning occur when whales are migrating through the area or in areas of significant feeding. Decommissioning or demolition (with explosives) should not be done while gray whales are in the area. Collision and injury could occur if a whale swam into a buoy. The greater the surface area of the buoy occurring below the ocean surface, the greater the chance there is for a whale strike. Loud acoustic output from buoys could disrupt feeding or migration behavior for whales and dolphins. Modest acoustic noise from buoys may be an asset for whales to detect the buoys themselves, but any desirable effect may vary with sea state as the signal-to-noise ratio changes.
It will be important to install pinniped exclusion devices on the wave energy buoys that are oriented vertically or diagonally in the water column to ensure that seals and sea lions do not haul out on the devices and thus be targets for possible illegal shootings and endanger the buoy itself. Although California sea lions (Zalophus californianus) are the most likely to attempt using buoys as haulouts, Steller sea lions
(Eumetopias jubatus) are the species of most concern (due to their ESA status) during open ocean implementation and decommissioning as a result of vessel traffic in the ocean. Harbor seals (Phoca vitulina) are most likely to be affected by the same vessel traffic, but in estuaries before the ships move out to sea. Elephant seals (Mirounga angustirostris) are probably the least likely to be affected by wave energy buoy arrays because they are deep water feeders at sea and absolute numbers are relatively low in Oregon, the northern extent of their range.
The group strongly agreed that horizontal “Pelamis” type devices present the highest risk of whale strikes. It may also be difficult to keep seals and sea lions off their large surfaces. For both buoy configurations and larger “Pelamis” type devices, if the devices attract fish, this could compound interactions with marine mammals, as harbor seals, California sea lions, and Steller sea lions would be drawn to feed on those fish.
Acoustics
Depending on the sound emitted from a buoy array, the sound could warn cetaceans to stay away from the array or attract them to it. Either situation could have an impact. Avoidance behavior associated with sound could result in changes to cetacean migration routes, especially the nearshore gray whale. If the mooring cables form any type of essential barrier, then cetaceans pushed together into a smaller migration corridor could be more vulnerable to predators, like killer whales (Orcinus orca), and have reduced foraging ability. Killer whales could also then interpret sounds from an array as a signal for aggregation, which could result in increased exposure to predation for other species.
Chemicals
Chemical spills are not a high threat to cetaceans and pinnipeds. However, the group emphasized that prompt cleanup of chemical spills from wave energy buoys (especially those washed up on the shore) is critical to minimizing exposure to cetaceans and pinnipeds, and to

97
shallow water benthic habitats where gray whales feed.
Electromagnetic fields
Not much is known about the effects of electromagnetic fields on cetaceans and pinnipeds. If predatory fish like sharks are attracted to wave energy arrays, this could create a dangerous situation for marine mammals, particularly dolphins and porpoises, which are naturally occurring nearshore (especially harbor porpoises) and may also be attracted to the vicinity of a wave energy array.
Scientific Uncertainty and Agreement
The level of uncertainty and scientific agreement concerning the impacts of wave energy generating devices on cetaceans and pinnipeds depends on the species, device, number of devices, and the mooring cable arrangement for the array. The Receptor-Specific Effects Table below details impacts and levels of uncertainty.
Feasibility and Effectiveness of Mitigation
Impact minimization measures for mooring cables must consider the cable diameter, length, and density; and whether the cables are slack or taut. It might be possible to develop a model and crude approximation of cable density to probability of strike or entanglement, to identify configurations that pose sufficient risk to require appropriate minimization and mitigation actions.
It might also be possible to place acoustic warning systems on buoys. There is some evidence from NMFS’ Southwest Fisheries Science Center that acoustic warning systems have worked on fishing nets to minimize entanglement. The strongest evidence on the use of acoustic warning systems has been demonstrated in studies on aquaculture facilities. These warning devices were designed to keep pinnipeds away, but have been shown to drive away harbor porpoises as well. However, there is still a high level of uncertainty concerning whether such a system would deter whales at a wave energy buoy array. In designing such a
system, it is important to consider sound emission levels that are loud enough to deter the animal, but not loud enough to damage hearing. Such devices should not exclude whales from identified foraging areas. The devices also need to adapt to varying levels of background noise associated with different sea states to avoid excessive noise (and affected areas) when low sea states do not require loud sources.
The group also considered if there is an “ocean corridor” outside of known migratory routes that could be identified and considered by the industry for placement of wave energy buoy arrays, to minimize impacts to pinnipeds and cetaceans. For pinnipeds, the group recommended specifically that these projects not be sited near rookeries (i.e., Cape Arago), and that seasonal buffer zones be placed around the rookeries so as not to disturb them.
Recommendations for Baseline and Monitoring Studies,
Key Information Gaps
The most important information needed is baseline information prior to the development of wave energy facilities. The general habits of most of the cetaceans and pinnipeds that could be affected by the development of wave energy off the Oregon coast are not well understood. The following data collection needs were identified as top priorities:
• General biological information on cetaceans and pinnipeds, starting with a literature review of available information. Initial information could be obtained from the petroleum industry and regulatory authorities, and/or the various NMFS’ Fisheries Science Centers.
• Seasonal distribution, migration patterns, and residency information on a species-by-species basis.
• Dietary information on a species-by-species basis.
• Abundance and distribution information on a species-by-species basis.

98
• Information on bottom habitats where wave energy arrays are proposed to be placed.
• Assessment of behavioral interactions of marine mammals with wave energy conversion devices and cables.
The group emphasized that baseline and survey work should include an average weather year, an El Niño year, and a La Niña year. This information should be collected over a 3–5 year period to account for variability in ocean conditions, and cetacean and pinniped species abundance and behavior. An important component of baseline data collection could be the development of a migration corridor model for cetaceans and pinnipeds based on tagging. The baseline information should form the building block of any monitoring work conducted on any single wave energy project, or group of projects, along the Oregon coast. The group specifically discussed different
monitoring techniques that could be used for cetaceans and pinnipeds:
• Animal spotting from the beach or from moored vessels in areas of proposed development
• Forensic diagnostics (necropsy) on all beach-cast (dead or injured) marine mammals to identify if a strike or injury has occurred and the nature of that injury
• Tagging whales to track them using satellite data, including pop-off tags on migrating whales
• Aerial surveys
Due to low water visibility conditions off the Oregon coast, videotaping would not be effective to monitor cetacean and pinniped behavior in and around the array.

99
Receptor-specific effects table for marine mammals. KEY: L=low impact, M=medium impact, H=high impact, NA=not applicable, ?=some uncertainty associated with the estimate.
a Sea otters (Enhydra lutris) are not an issue on the Oregon coast because they do not occur there. b Steller sea lions would be impacted by implementation and decommissioning due to vessel traffic movement and noise. c Harbor seals would be affected primarily as vessels are deployed from estuaries to construct and maintain the wave energy facility. d Phocoenoides dalli
Activity (agent or stressor) Receptors
Sea
Otte
ra
Stel
ler S
ea L
ionb
Cal
iforn
ia S
ea L
ion
Har
bor S
ealc
Bea
ked
Wha
les
Kill
er W
hale
Har
bor P
orpo
ise
Dal
l’s P
orpo
ised
Gra
y W
hale
e
Elep
hant
Sea
lf
Hum
pbac
k an
d M
inke
wha
lesg
Sper
m W
hale
h
Dol
phin
s
Emplacement Mooring System NA M L L M? L M? L? M-H? L M? L L Electrical Transmission Infrastructure NA M L L M? L M? L? M? L M? L L Vessel Traffic NA M L L M? L M? L? M? L M? L L
Operation Mooring System NA L L L M? L M? L? M-H? L M? L L Buoy or Other Generation Device NA L L L M? L M? L? M? L M? L L Electrical Transmission Infrastructure NA L L L M? L M? L? M? L M? L L Chemical Coatings NA L L L L L L L? L L L L L Acoustics NA L L L L-M? L? L-M L? L-M? L L-M? L L EMF NA L L L L? L L? L? L? L L? L L Vessel Traffic, Maintenance Activities NA L L L M? L L L? M? L M? L L
Decommissioning Buoy or Device Removal NA M L L M? L M? L? M? L M? L L Transmission Infrastructure Removal NA M L L M? L M? L? M? L M? L L Anchor Removal or Decommissioning NA M L L M? L M? L? M? L M? L L

100
e Effects to the gray whale population for a pilot project rate as medium. For a commercial project, the effects could be high. This is a density-dependent issue. If installation is done when whales are there, then the effect could be high. If the population has seasonally migrated to Baja, then the construction effect could be low, but overall effect would remain a medium. f Elephant seals are deep-water feeders and because of this behavior are not predicted to be greatly affected by construction or operation. g Uncertainty for humpback (Megaptera novaeangliae) and minke (Balaenoptera acutorostrata) whales relates to whether the animals are present during facility construction and operation. h Physeter catodon

101
Stressor Breakout Group Report: Energy Absorbing Structures
Participants:
Keith Kirkendall, NOAA-NMFS (Chair and Facilitator) Hugh Link, Oregon Dungeness Crab Commission Bill Peterson, NOAA-NMFS, NWFSC Maria Stefanovich, OSU (Rapporteur) Jen Zamon, NOAA-NMFS, NWFSC
Key Findings
The discussion centered on the potential impacts of energy absorbing structures (of all types) on the ecology of the nearshore environment. All issues were intimately related to the topics discussed by other working groups. The reader should consult those working group reports for more detail, especially for receptors.
Three main ideas arose as themes:
• The inshore area (depths < 100 m, but especially < 40 m) off the coast of Oregon is a particularly sensitive ecological zone. Any energy absorbing structure placed here will have impacts on not just one or two receptors, but on a suite of related ecological receptors. Wise site-selection before installation is one of the least expensive and most effective ways to avoid undesirable impacts on both the ecology.
• Energy absorbing structures that trap water (overtopping devices) are likely to be the most problematic designs, especially in nearshore environments, because they will also trap or focus marine organisms or debris. This will affect the functioning of the device as well as ecological functions.
• Effective cleaning and maintenance schedules for energy absorbing structures need to take into account what is known about naturally occurring physical and biological cycles.
This list should be viewed only as a starting point for continued discussion of stressor
impacts, not a comprehensive list of all possible issues of concern.
Top Ecological Issues
The biologically productive nearshore zone
Because of the combination of tidally driven mixing, wind mixing, and upwelling, shelf habitat inshore of 100 m depth, and particularly inshore of 40 m depth, is the most biologically productive marine zone (see overview by Peterson in this volume, as well as reports from receptor working groups).
The productivity in this zone includes important pelagic and benthic food webs. In addition to supporting communities of marine birds, mammals, fishes, invertebrates, and even a reptile (the leatherback turtle, Dermochelys coriacea); each of these food webs supports important commercial and recreational harvests of finfish and shellfish (e.g., salmon, sardines, bottom fish, rockfish, and Dungeness crab [Cancer magister]). Several protected species also include this zone in their critical habitat; impacts on those species are significant for legal purposes.
Many potential impacts were discussed based on what is known about energy absorbing structure design and how organisms, human and nonhuman, might react to those structures. The severity of actual impacts will remain unknown, however, unless well-designed monitoring programs are in place to measure those impacts by documenting the response of the biota.
Exclusion zone—Any device or array of devices will necessarily have an exclusion zone surrounding it to prevent collisions or

102
entanglements between the device and ships or fishing gear. Exclusion zones will have immediate impacts on existing uses by maritime vessel traffic and fishing.
Microscopic organisms—While microscopic organisms at the base of the food web (phytoplankton, zooplankton) might not be adversely affected by any one individual energy harvesting structure, arrays of many structures are expected to have impacts on distribution and abundance of such organisms by changing currents, mixing, and wave energy within and near the array (see results from the physical environment receptor working group).
Migration paths—Devices and arrays in the nearshore zone will be in the path of migrating birds, mammals, and fishes. Of particular concern are
• Birds colliding with above-surface structures, especially during low visibility and adverse weather (see additional discussion in the marine bird receptor working group report).
• California gray whales (Eschrichtius robustus), especially cows and calves, becoming either herded further offshore where calves may be more vulnerable to predation, or becoming trapped or entangled in mooring lines of dense arrays (see additional discussion in the marine mammal receptor working group report). Calves in distress are of special concern because mothers will remain with them.
• Salmon migrations becoming disrupted in some fashion (physically, chemically, or electrically) when juveniles migrate alongshore during their first summer at sea, or when adults make their return migration to spawning grounds.
Biofouling—Any structure or device below the waterline will be subject to biofouling. Fouling communities are known to affect benthic habitats below and adjacent to them because organisms in those communities generate excreta and detritus. Decreased
buoyancy and increased drag caused by fouling may also make the device itself more vulnerable to being torn away during extreme weather events.
Electromagnetic fields and acoustics—Many organisms are known to be sensitive to changes in electromagnetic fields and underwater sounds. There are concerns, particularly in the fishing community, that large metal structures generating electromagnetic fields and underwater sound, or the use of certain metals such as those used in sacrificial anodes, will cause certain species to avoid areas occupied by energy absorbing structures.
Overtopping structures
Overtopping devices (which trap and contain surface water) will serve as collectors for near-surface organisms and debris. Not only the items being collected, but also the performance and function of the devices will be affected.
Impacts of biology on devices: clogging—Natural physical and biological cycles in the nearshore can generate dense aggregations of certain organisms or debris. If these organisms are trapped or focused into certain parts of the energy harvesting device, then that device could become clogged or its operation could be less than optimal. For example, it is known from research surveys that very dense aggregations of a coastal jellyfish, Chrysaora fucescens, occur in the nearshore waters of Oregon during summer and early autumn. This jellyfish bloom is likely to clog water intakes. In some years, large rafts of “by-the-wind-sailors” (Velella velella), a type of jellyfish, are found off the coast and these will certainly become trapped by overtopping devices. Perhaps more importantly, endangered steelhead trout (Oncorhynchus mykiss), which live at the sea surface, will almost certainly be captured (and likely killed) by overtopping devices. Finally, the onset of winter rains can wash large amounts of debris, such as logs, into the coastal ocean from rivers. This debris may also impair the function of devices that focus or trap near-surface water.

103
Impacts of devices on biology: entrapment—Near-surface organisms will likely become trapped or concentrated within any water-trapping device. This trapping or concentration could result in the following negative impacts:
• Injury or death of organisms passing through the energy harvesting mechanism
• Injury or death of organisms trying to escape
• Increased vulnerability of trapped organisms to predation
• Trapping of attracted predators, with possible consequent damage to the device
Cleaning and maintenance
Any device deployed in the marine environment—regardless of the mechanism it uses to convert wave energy to electrical energy—will be subject to biofouling by marine organisms. These organisms could change the following properties of the device:
• Buoyancy
• Drag
• Turbulence
Changes in those properties could affect the efficiency of the device, if fouling affects moving parts essential to buoy function, as well as device vulnerability to damage or dislocation during heavy weather.
Regular cleaning and checks of the devices will be necessary and to be most effective, cleaning and maintenance should account for natural cycles of organism settlement and growth. Fouling organisms will settle on mooring lines and hard structures primarily in spring with greatest growth in summer. It would be wise to clean the structures during late summer and early autumn so that the drag on mooring lines is decreased before storms arrive. We also recommend that cleaning be carried
over an extended period of time so that there is not a single massive deposition of material to the seafloor over the course of a few days.
Key Information Gaps
At this time, the State of Oregon lacks a comprehensive, integrated inventory of coastwide marine resources. If the State of Oregon is going to proceed with wise development of wave energy as a renewable resource, then it is imperative that the State generate such information. Lacking this information, it is much more difficult to evaluate good locations vs. bad locations during the site-selection process.
Feasibility and Effectiveness of Mitigation
Suggestions for how to mitigate the undesirable impacts of wave energy structures included the following:
1. Locate devices/arrays at depths that do not compromise highly productive waters; certainly greater than 40 m, and possibly greater than 100 m. This avoids use conflicts with nearshore vessel traffic and fishers, known nearshore migratory pathways for protected species, and placement of stressors in sensitive environments where effects on suites of interdependent receptors is likely.
2. Avoid using devices that physically trap water, as they will also trap organisms, such as endangered steelhead trout, and debris. Trapped organisms or debris could also compromise functioning of the device.
3. Use what is known about seasonal cycles in physics and biology to design effective cleaning and maintenance routines. Work with biologists to optimize cleaning intervals.

104
Recommendations for Baseline and Monitoring Studies
The development of wave energy facilities within the Oregon coastal ecosystem is a new event. The type and magnitude of impacts—either positive or negative—that such facilities will have on the ecology of Oregon will remain only educated speculation unless well-planned studies are in place to monitor and measure those impacts.
Studies of potential impacts need to consider the following:
• Effect of a single device vs. an array of devices
• Effect of array design on impacts
• Water depths in which the devices are placed

105
Stressor-specific effects table for energy absorbing structures. KEY: L=low impact, M=medium impact, H=high impact
Activity (agent or stressor) Receptors
Oce
an W
aves
Oce
an C
urre
nts
Ben
thic
Hab
itats
Plan
kton
Foul
ing
Com
mun
ity
(e.g
., ep
ipel
agic
sp
ecie
s)a
Pela
gic
Fish
Fora
ge F
ish
and
Inve
rtebr
ates
Dem
ersa
l Fis
h
Epib
enth
ic
Mac
roin
verte
brat
es
Ben
thic
Infa
una
(e.g
., cl
ams,
wor
ms)
Seab
irds
Pinn
iped
sb
Cet
acea
nsc
Point Absorber Deviced Wave Energy Absorption (buoy) M M H M H H H L H H H L/M L/M Drag and Turbulence M M L L H
Attenuator Device (e.g., sea snake) Wave Energy Absorption L L L L L L L L L L L L L Drag and Turbulence L L L L L L L L L L L L L
Oscillating Water Column Device Wave Energy Absorption L L L L L L L L L L L L L Drag and Turbulence L L L L L L L L L L L L L
Overtopping Devicee Wave Energy Absorption H H H H H H H H H H H H H Drag and Turbulence H H H H H H H H H H H H H
a Addressing issues with the fouling community means that regular cleaning of the devices and mooring structures needs to occur; everything that is metal needs to be “zinced” or have zinc anodes included in the device design. b Structure design should focus on keeping pinnipeds off the devices. c The group was most concerned about the impact these structures would have to young cetaceans. d To minimize overall effects of point absorbing structures, the industry should focus on placement of devices in water depths beyond 100 m in depth. The industry should avoid device placement in 40 m of water or less, and be aware that environmentally sensitive areas and physical actions like upwelling can still occur out to 100 m in depth. e Overtopping devices can trap and focus water and increase potential impacts, and are therefore an undesirable design.

106
Stressor Breakout Group Report: Chemical Effects
Participants:
David Baldwin, NOAA-NMFS, NWFSC (Chair) Matt Cutlip, FERC Debbie Duffield, PSU Susan Holmes, OSU (Rapporteur) Justin Klure, Oregon Wave Energy Trust (Facilitator) Bruce Menge, OSU Gil Rilov, OSU
Key Findings
In assessing the impacts of chemicals, the group found it useful to distinguish the unintentional release from leaks or spills from the expected release from antifouling paints or sacrificial anodes. Examples of the former would include the release of hydraulic fluid from a device, or fuel from a vessel due to a collision. This could be considered to have a low probability of occurrence, but to have a high impact. Examples of the latter would include the release of dissolved metals such as copper or zinc. This could be considered to be continually occurring, but to perhaps have a lower impact. However, as mentioned elsewhere, the magnitude of these impacts is uncertain and likely variable.
Chemical effects are of low concern for ocean waves and ocean currents, but of concern for all biological receptors.
Top Ecological Issues
Extent of chemical exposure
Released chemicals are likely to spread over a large area and, in high concentrations or with prolonged exposure, affect entire communities of organisms. For example, since dissolved metals do not degrade, they can be transported some distance by currents. Additionally, because they will persist in the environment, they can accumulate in tissue and be transferred between trophic levels (i.e., in the diet). Finally, if a device breaks free and washes ashore, the
location of any impacts of chemicals would shift from offshore habitat to shoreline habitat.
Lethal and sublethal effects
Chemical effects do not have to be lethal for important biological responses to occur. Many chemicals, dissolved metals such as copper and zinc being good examples, are known to have sublethal effects on many aspects of a species’ biology such as sensory systems, growth, and behavior. These effects can occur at lower concentrations of exposure than those producing mortality. Reductions in the sensory function or growth of an individual can reduce the likelihood of survival or reproduction. Behavioral responses to chemicals that are detectable can include avoidance. By causing animals to avoid the area of a device, chemicals could alter migration routes used by resident species to travel to and from feeding areas or by transient species to pass through the area. If these changes lead to increases in predation or decreases in feeding, they could also reduce the likelihood of survival or reproduction for an animal. The potential for chemicals to produce sublethal effects such as these needs to be assessed.
Indirect effects
In addition to the direct effects of chemical exposures on a species discussed above (whether lethal or sublethal), the potential indirect effects of chemicals on a species should also be considered. For example, even if a species is not itself affected by a chemical, if a prey species is affected, e.g., through mortality, the indirect effect of the chemical on the predator species

107
could be a reduction in growth due to a reduction in available food.
Key Information Gaps
In order to assess the potential effects of chemicals on receptor species it is necessary to define the chemical exposure. This represents a critical information gap and requires answers to several questions:
1. What are the specific chemical compounds present in the devices that might be released to the environment? For example, while copper from antifouling paint was discussed, it was also mentioned that epoxy-based paints would likely be used instead. Similarly, whether the devices would have sacrificial zinc anodes or not was unclear.
2. For each of the chemicals, how much is being released into the environment? For example, for copper-based antifouling paints, estimates should be available of the leaching rate of copper from the device based on the application of the paint. This would allow an estimate of the concentration of dissolved copper likely to be observed in the water near the devices.
3. What is the fate of each chemical once in the environment? For example, dissolved metals will not degrade and could travel with prevailing currents or attach to particulate material and settle to the bottom with the potential of resuspension.
The better the definitions of the chemical exposures, the better the impacts on receptor species can be addressed.
Feasibility and Effectiveness of Mitigation
The best form of mitigation would be avoiding the use of toxic chemicals in the first place. This would include the appropriate choice of hydraulic fluids and antifouling paints. The use of epoxy-based antifouling paint would, for example, reduce concerns over the continual
leaching of dissolved copper into the environment. There was recognition by the group that mitigation efforts such as this will likely have other consequences, such as more frequent cleaning of devices, hence more servicing trips, and a greater buildup of fouling detritus below the devices. However, not using toxic compounds was considered a feasible and important mitigation strategy.
For chemical releases from spills or leaks, mitigation involves accident prevention and cleanup preparedness. Minimizing servicing trips by vessels, for example, would reduce the risk of spills or collisions. Having the ability to contain and clean spills always on standby would mitigate the impacts should a spill occur.
Recommendations for Baseline and Monitoring Studies
Monitoring studies will be critical in assessing the impacts of chemicals. Such studies, however, need to be carefully designed and implemented. Several issues in the design of monitoring studies were identified:
• To help define the chemical exposures, samples of water, tissue, and sediment need to be analyzed for the specific chemicals that may be released to the environment (e.g., zinc and copper).
• Monitoring for the effects of chemicals on organisms needs to include not just the presence of mortality, but also changes in abundance and movement. Changes in movement may, however, be due to behavioral responses to the physical structure of the devices as well as any chemicals released. This is one instance where controlled studies may be useful, in this case perhaps monitoring the same structure but with and without antifouling paint. Numerous other controlled studies may also be warranted.
• Multiple locations and times should be monitored, since the chemical exposures and effects are likely to be variable. For example, identifying how far and in
108
which direction a specific chemical will move requires sampling multiple locations in and around the area of a device. Similarly, even reference or control sites may vary in time depending on what is being monitored (e.g., species abundance). Ideally baseline monitoring should occur before the installation of a device, for comparison with monitoring at the same location after installation. Other locations to be used as reference sites need to be chosen carefully to match as many of the important features of the device location as possible.
• Finally, any monitoring study needs to consider that while the impact of a single device may be subtle and hard to detect, the cumulative impact of dozens to hundreds of devices may be appreciable. The effects of chemical exposure are likely to increase with increased numbers of devices. Monitoring studies involving only a few devices need to be able to detect exposures and effects that are as small as possible.

109
Stressor-specific effects table for chemical effects. KEY: L=low impact, M=medium impact, H=high impact, ?=some uncertainty associated with the estimate.
Activity (agent or stressor) Receptors
Oce
an W
aves
Oce
an C
urre
nts
Ben
thic
Hab
itats
Plan
kton
Foul
ing
Com
mun
ity
Pela
gic
Fish
Fora
ge F
ish
and
Inve
rtebr
ates
Dem
ersa
l Fis
h
Epib
enth
ic
Mac
roin
verte
brat
es
Ben
thic
Infa
una
Seab
irds
Pinn
iped
s
Cet
acea
ns
Organicsa Hydraulic Fluids L L L/M L? M? H? H M L/M L/M H L L Spills (Fuel, Oil) L L L/M L? M? H? H M L/M L/M H L? L?
Metalsb Sacrificial Anodes (Zn++) L L M M? M? H? H? M? M? M M? L L
Toxicsb Tributyltin (Sn+++) L L M M? M?/Hc H? H? M? M? M M? L L Antifouling Coatings (Cu++) L L M M? M?/Hc H? H? M? M? M M? L L
a Mitigation for organics is to prevent spills, reduce likelihood, and prepare for cleanup. b Mitigation for metals and toxics is to not use or minimize use of chemicals. c Impact high on buoy community, but not on community in general.
110
Stressor Breakout Group Report: Hard Structures and Lighting
Participants:
Robin Brown, ODFW Ray Buckley, WDFW Ann Bull, MMS Jan Hodder, OIMB Roy Lowe, USFWS John Meyer, OSU (Facilitator) Fred Piltz, MMS (Chair) Erin Richmond, OSU (Rapporteur) Rob Suryan, OSU
Key Findings
High interactions between receptors and hard structures and lighting associated with wave energy facilities were those interactions that the group concluded had a higher probability of occurrence and/or potentially significant impacts: These included the following:
• Exposed surfaces provide perches for seabirds or haul-outs for pinnipeds.
• Lighting on surface structures may attract seabirds. Birds could be injured after flying into small structures on the exposed parts of wave energy devices; these include radio telemetry towers and lines, and meteorological instruments.
• Hard structures may act as Fish Attraction Devices (FADs); this may be both a positive and negative interaction.
• Mooring lines from the wave energy structures to anchors on the sea bottom may entangle algal drift mats and fishing gear (causing ghost fishing). Anchor lines, depending upon their size and distribution, may be a hazard to cetaceans.
• Mooring lines and anchors may bring changes to the benthic habitat and associated benthic communities surrounding wave energy devices. Fouling communities naturally develop on any hard structure in the ocean.
Changes will occur because of the natural sloughing-off of these fouling communities or because of their removal during periodic maintenance cleaning of the wave energy device.
Top Ecological Issues
Dislodged structures
Top ecological issues included the potential ecological impacts that would occur if and when a large wave energy device broke loose of its moorings during a severe Pacific storm event. Such an event could create ecological effects from bottom scouring as a large device moved along the bottom and similar physical damage to shoreline habitats such as rocky intertidal areas. Should a large array of wave energy devices break free, blockage of estuarine habitats might occur for some time until the devices could be removed.
Litter fall from fouling communities
Changes in the benthic habitat will occur due to the litter fall from marine fouling communities that will form on the wave energy devices, mooring lines, and anchors. Discussions focused on wave energy facilities in soft-bottom or unconsolidated sediment environments, but we did not conclude that the ecological changes caused by the litter fall on such benthic habitats would be either good or bad. They would, however, present significant changes in the benthic communities from those

111
characteristic of soft sediments to communities associated with coarser sediments or cobble-type environments.
Seabird encounters
There is a potential for negative effects on seabirds and seabird populations from encounters with the exposed wave energy devices. Of most concern is that lighting that may be required on the wave energy devices could attract birds that may collide with the hard surfaces that are above the water. These include radio antennae, small-diameter wires, or small meteorological instruments that might be part of the device.
Legal protection issues
A significant issue was raised that is ecologically-based but more significantly related to federal legal protection for marine mammals and seabirds. The Marine Mammal Protection Act, Endangered Species Act, Migratory Bird Treaty Act, and Essential Fish Habitat laws will greatly influence the development of wave energy facilities on the Oregon coast. Further analysis should indicate whether interactions of animals protected by these laws cross thresholds that require mitigation, selective placement, or other limits or special conditions for the wave energy device or facility.
Scientific Uncertainty and Agreement
There was good general agreement among the participants in this breakout group as to the significant findings and key ecological issues described above. Additionally, there was good agreement as to the scientific bases for our conclusions related to benthic effects and the interaction between hard structures and fish. The conclusions with regard to potential significant effects on the benthic communities and habitats were based upon similar effects demonstrated under offshore oil and gas platforms in southern California and described in the literature. The scientific bases for concerns related to the interactions between hard structures, mooring lines, anchors, and the marine mammal and seabird fauna were not
fully explored in the breakout group. Much of the uncertainty associated with these animals and wave energy devices and facilities is better defined in the reports from the breakout sessions concerning marine mammals and seabirds.
It should be noted that participants in this breakout group identified the uncertainty of the eventual extent of wave energy development off the Oregon coast as a major unknown that will limit more exact analysis of potential environmental impacts. This was coupled to some extent with uncertainty about the type or types of wave energy devices that might actually be deployed offshore Oregon. The devices described to participants in the plenary sessions differ widely and therefore significantly in the potential for ecological effects, and in some cases differ in the types of ecological effects that they might create. The uncertainty about the extent of wave energy development and the actual devices to be used in commercially scaled energy projects will remain as a source of uncertainty in environmental analysis for some time.
Key Information Gaps
• Coastal habitat mapping (at a minimum) needs to be done early in site selection to understand the area being considered for wave energy development. Such maps, when ground truthed via Remotely Operated Vehicle (ROV) observations to characterize the benthic habitat, can be used to determine areas that need to be avoided. A coastwide map and analysis is needed.
• Sampling in the proposed wave energy project area and in a buffer zone around it should begin as soon as possible to establish a preinstallation and therefore preimpact baseline against which to measure any changes. The sampling may need to be expanded, and scaled up as wave energy facilities grow in size. The data collected will form the basis of a long-term data set.

112
• Existing data need to be synthesized to identify areas of greatest potential biological effects (“hotspots”).
• The rate of change in bottom characteristics that affect benthic communities needs to be understood.
• The first wave energy project needs to be tied to a long-term study to help shape future projects; state and federal governments need to fund this effort if they are genuinely interested.
Feasibility and Effectiveness of Mitigation
• Mitigation for surface structure impacts could include lowering structures into the water as much as possible, reducing bird interactions by lowering antennae and other projections, and making steep haul-out structures to minimize pinniped haul-out opportunities.
• Entanglement of fishing gear and ghost fishing could be a major problem; monitoring of entanglement and regular cleanup should be required.
• Mooring and cable lines need to be large and tight; tag lines should be minimized.
• Service and maintenance should be limited as much as possible to the daytime because of lighting issues for birds. This depends on the extent of lighting for maintenance boats at night—one boat might not create a big problem, but many boats could.
Recommendations for Baseline and
Monitoring Studies
As discussed above, the first wave energy project needs to be tied to a long-term study to help shape future projects. Ecosystem monitoring should start with the Reedsport Project.

113
Stressor-specific effects table for new hard structures and lighting. KEY: L=low impact, M=medium impact, H=high impact.
Activity (agent or stressor) Receptors
Oce
an W
aves
Oce
an C
urre
nts
Ben
thic
Hab
itats
Plan
kton
Foul
ing
Com
mun
ity
Pela
gic
Fish
Fora
ge F
ish
and
Inve
rtebr
ates
Dem
ersa
l Fis
h
Epib
enth
ic
Mac
roin
verte
brat
es
Ben
thic
Infa
una
Seab
irds
Pinn
iped
s
Cet
acea
ns
Exposed Surface (Landing or Haul-out) L L L L L L L L L L H H L Hard Surface Area (i.e., Cross-section) L L H L H H H L L L L L H Mooring Lines L L H L H H L L L L L L L Anchors L L H L H L H H H H L L L Lighting L L L L L L L L L L H L L

114
Stressor Breakout Group Report: Acoustics
Participants:
John Ferguson, NOAA-NMFS, NWFSC David Fox, ODFW Bruce Mate, OSU David Mellinger, OSU Brycen Swart, OSU (Rapporteur) Bob Thresher, National Wind Technology Center Cathy Tortorici, NOAA-NMFS (Chair and Facilitator) Waldo Wakefield, NOAA-NMFS, NWFSC
Key Findings
• The level of noise that will be generated by wave energy structures off the Oregon coast is unknown, but may have a significant impact on the behavior and feeding ecology of both resident and migratory cetaceans and fish.
• It is possible to measure or model the magnitude, frequencies, and duration of noises generated by wave energy structures. Field observations or laboratory studies should be conducted, and both these physical changes and any effects they have on the coastal environment, such as effects on fish and marine mammals, should be measured. Quantifying impacts to resident and migratory organisms would aid in the identification of possible mitigation strategies.
• Wave energy facilities (buoy arrays) could create a sound barrier that certain cetaceans and fish species may avoid.
Top Ecological Issues
Our discussion was based on wave energy facilities being located 2.5 to 3 miles (4 to 4.8 km) off the Oregon coast. That may not always be the case. As the industry evolves, these recommendations must be revisited to accommodate new siting conditions.
Noise generation
Noise associated with wave energy facility development can be generated from a variety of different sources, both natural and anthropogenic. All these sources of noise need to be considered when generating conclusions about the environmental impact of noise from the development of wave energy buoy arrays:
• Wind (background sound as well as noise associated with a buoy).
• Waves (background sound as well as noise associated with a buoy).
• Rain (background sound as well as noise associated with a buoy).
• Internal waves (under the water).
• Internal machinery of buoys.
• Waves slapping on buoys.
• Transmission cables, substations, and power convertors used to connect individual buoy cables back to shore.
• Synchronous movement of array components—depending on how buoys and mooring cables are arranged and the direction and spacing of swell, the parts of the array could move synchronously, creating a much louder noise than if they were moving separately from one another.
• Installation and maintenance equipment used to construct and service the buoy array. This includes the vessels needed

115
to install, service, monitor, and respond to emergencies at the wave energy facility.
• Strum and other flow noise of mooring cables (varying with thickness, number, tension, and orientation).
• Breaking of cables during storm events.
• Organisms (e.g., snapping shrimp) that could be attracted to the wave energy facility.
General effects
Noise generated from wave energy buoys is likely to be low frequency. That being the case, one would expect animals with sensitivity to low frequencies, such as baleen whales and fish, to be most affected. The more variable the generated noise is, the more likely it is to affect marine mammals such as cetaceans. Effects on animals probably would be mostly behavioral rather than physical, but that determination needs to be confirmed during actual testing of noise being produced by a buoy or array of buoys.
Depending on the sound emitted from a buoy array, the noise could warn cetaceans and/or fish to stay away from the array or conversely, attract them to the site. Either situation would have an impact. Avoidance behavior associated with a noise could alter a cetacean’s migration route. Fish and marine mammals may assume that a wave energy buoy array could be a rock or shore because it creates an acoustic barrier to be avoided. This could result in pushing them or “choking” them together into a smaller migration corridor that could then reduce their ability to forage and make them more vulnerable to predators like killer whales (Orcinus orca). Construction noises like pile driving, vessel traffic from routine maintenance of the arrays, or repetitive noises from old or malfunctioning machinery could all cause an avoidance response in cetaceans.
Noise could also be interpreted as a signal for aggregation, which could also result in
whales and/or fish having additional exposure to increased predation.
The group discussed key receptors (i.e., cetaceans, pinnipeds, and fish) and how each marine mammal or fish species discussed might respond to noise generated by wave energy buoys and the associated equipment in the wave energy facility.
Gray whales
Gray whales (Eschrichtius robustus) respond to anthropogenic sounds: 50% of observed whales were affected at a received level of 120 dB re 1 µPa continuous (Moore and Clarke 2002). Since ambient noise in the ocean is roughly 90 dB re 1 µPa, depending on weather and wave conditions, noise generated from a wave energy facility could be masked by background noise. Anthropogenic noise can have more impact when there is relatively little ambient noise (during calm weather conditions) than when there is a great deal of ambient noise (during rough weather conditions). In addition, these whales react more strongly to mobile sounds than static sounds. So if the noise generated by the wave energy facility is not masked by background noises, whales could veer away from it, especially when migrating, resulting in them getting “choked” into a narrower migration route along the beach. For non-migrating whales, the noise disturbance may be such that they will simply leave the area and not come back. For both migrating and non-migrating whales, this behavioral avoidance reaction could result in their having less food, a reduced feeding area, and increased vulnerability to predation by killer whales.
Humpback whales
While humpback whales (Megaptera novaeangliae) periodically can be found close to shore, they transit primarily farther offshore than the current location of all of the proposed wave energy facilities off the Oregon coast. They are seasonally resident, most likely for feeding, in some areas. These include Heceta Bank and south of Cape Blanco (Tynan et al. 2005), areas that should be avoided for wave energy

116
installations. Potential impacts to them from noise generation from wave energy facilities would be similar to that of gray whales, but at lower impact levels because they transit farther offshore. Impacts would also vary from year to year as the humpback population size changes.
Killer whales
Killer whales are found off the Oregon coast all year long, with most being sighted in the late spring and early summer. It is possible that background noise could mask the noise generated from wave energy facilities for killer whales. It is likely that killer whales could be initially startled by encountering an array, but would soon desensitize to them and even be attracted to an array. Killer whales could react to wave energy arrays in the same manner that they do to large ships when searching for prey. Killer whales will chase prey up against the ship’s side and in effect “corner” it to catch it. Thus wave energy arrays could act similarly, as a bottleneck, forcing prey such as fish and other whales into a bottleneck or choke point, making them more vulnerable to predation.
Dolphins and porpoises
Dolphins and porpoises are less likely to be affected by wave energy facilities than whales because they are more likely to swim around any wave energy buoys encountered. Dolphins and porpoises are also sensitive to high-frequency sound rather than the low-frequency sound the group assumed would come from wave energy devices. However, that assumption needs to be confirmed during actual testing of noise produced by a buoy or array of buoys.
Sea lions and seals
While Steller sea lions (Eumetopias jubatus) are more sensitive to noise than California sea lions (Zalophus californianus), pinnipeds in general are not likely to be greatly affected by the noise generated from wave energy facilities. They are most likely to avoid the facility, or be desensitized to the noise and be attracted in if prey fish are also attracted to the area.
Fish
Virtually all fish have some form of auditory sensory mechanisms that allow them to sense their sound-filled, hydrodynamic environment. Fishes use their inner ear for sound detection and balance, and their lateral line system to sense movement of water (Moyle and Cech 2000). In addition to being able to detect sounds, many species of fish are known to be sound-producing or soniferous. Recently, it has been estimated that over 800 species of fish from 109 families are soniferous; however, many more species are likely to have this capability (Rountree et al. 2006). Sound production as a form of communication is associated with feeding, schooling, reproduction, etc. Salmon, sardines, herring, rockfish, midshipman (Porichthys sp.), and a number of other groundfish species are all thought to be particularly noise-sensitive. For example, midshipman are more acoustically oriented than other fish species and courting midshipman males hum to attract egg-laying females. Herring hearing may be sensitive enough to detect predator ultrasound in a manner that may parallel the evolution of a mechanism by moths to detect their bat predators.
There are two potential effects on fish ear and/or lateral line function from noise generated by wave energy structures: the immediate (and possibly temporary) effects on hearing or lateral line detection of hydrodynamic stimuli (Popper et al. 2003), and longer term effects that lead to permanent loss of sensory capabilities. The most likely cause of temporary or permanent loss of sensitivity is alteration of the capabilities or health of the mechanosensory hair cells found in the ear and lateral line. However, it is not yet clear whether damage to sensory hair cells in fishes is permanent or temporary because in fishes, unlike in humans, there is a constant proliferation of sensory hair cells for most of a fish’s life. There is also some evidence of repair to these cells after damage (Lombarte et al. 1993). The fundamental question becomes how long the impairment lasts and whether it becomes permanent.

117
Because fish are food sources for other fish and marine mammals, any effects wave energy development might have on their abundance, feeding ecology, or behavior could result in disruption to the food chain for other fish species, including commercially important species, and cetaceans. Species like crab, tuna, and sharks would be the least impacted from noises generated from wave energy facilities.
Scientific Uncertainty and Agreement
The level of uncertainty and scientific agreement concerning wave energy facility noise impacts on cetaceans, pinnipeds, and fish depends on an analysis of the species that could be found near these arrays in relationship to the noise generated (see Receptor-Specific Effects table below).
Key Information Gaps
There is a substantial lack of information concerning the hearing sensitivity and capability of cetaceans, pinnipeds, and fish that could encounter a wave energy buoy array. The following information gaps need to be filled as baseline information is developed prior to project construction:
• What ambient sounds are being produced in the location of a potential wave energy facility?
• What is the hearing sensitivity of cetaceans, pinnipeds, and fish (all species), and how do they respond to noise of frequencies that could be generated by a wave energy buoy or buoy array?
• What is generally known about the schooling behavior of fish in relationship to pressure waves and acoustics?
While one buoy would provide an initial start on monitoring sound, a small array of buoys (at least three) would be necessary to generate data to assess effects statistically. It is also important to model the sound field (output from buoy and buoy array) and do so on a
seasonal basis to encompass the full array of noises that could be generated.
Feasibility and Effectiveness of Mitigation
A variety of potential mitigation measures could reduce noise generation from wave energy buoy arrays:
• Varying the array design (buoy and mooring cable arrangements in the water) could reduce the production of synchronous sound.
• Looser cables strum at lower levels than tighter cables and would not produce as much noise, but this must be balanced against the need to reduce the potential for cetacean entanglement.
• Thicker cables produce a lower frequency sound than thinner cables. Therefore, to reduce noise generation, limit the total number of cables to fewer, larger, vertical cables.
• Use antistrum (sheath/fairing) devices on cables where possible.
• Companies developing wave energy technology should include noise reduction of internal parts of their buoys and underwater substations as a design criterion.
• Sounds that sweep in frequency are more likely to disturb marine mammals than constant-frequency sounds. Devices that emit a constant frequency are preferred to ones that vary. The same is true, though perhaps to a lesser extent, for sounds that change in amplitude.
• Because cable fouling might change the noise spectrum of cables, decisions about when and how often to clean cables should include noise as a factor in decision-making.

118
Recommendations for Baseline and Monitoring Studies
The group discussed a variety of potential monitoring actions necessary to understand the effects of wave energy buoy arrays.
Monitoring of sound levels
It is critical to monitor the sound level of a single wave energy buoy and multiple buoys in an array:
• To measure the acoustic signature for each device and group of devices, both inside and outside of the array. This is especially important to address the generation of synchronous or asynchronous noise generated by an array.
• To study noise under different ocean conditions to differentiate background noise from the buoy/array noise, and to understand how noise generation changes under different environmental conditions.
• To monitor buoy and mooring cable noise over time, to see how it changes as the devices age and mooring cables become fouled.
Modeling
The noise generated by a buoy/array can and should be modeled to predict noise generation for differently sized and shaped arrays over a variety of environmental conditions. An array of four rows of three or four buoys each would be a starting point for such an experiment. Such modeling is possible since analogous models exist for wind power devices.
Studies of marine mammal and fish behavior
Surveys—Marine mammal and fish behavior around buoys and arrays should be surveyed to determine changes in behavior as a result of noise.
Morphological studies—Some morphological studies have shown loss of sensory hair cells for a few species following exposure to intense sounds (Hastings et al. 1996; McCauley et al. 2003), but other studies have not found an effect (Popper et al. 2005). The problem with morphological studies is that they only show the most severe damage, and do not show if there is transient damage to the sensory system.
Physiological methods—A better approach has been to use some physiological method to assess hearing response immediately following exposure to a signal. This approach has demonstrated temporary, and recoverable, hearing loss in response to exposure to pure tones, seismic air-guns, boats, and sonar, and to long-term exposure to lower intensity sounds. The method known as auditory brainstem response (ABR) measures evoked signals in the brain of fish to sounds of different levels. This method is noninvasive, can be done immediately after or even during exposure to sounds, and is highly automated. ABR basically measures the response of the ear (and possibly first levels of the auditory portion of the brain) to sound stimuli, and measures of auditory sensitivity (thresholds) can be made. The same method could also be easily adapted to the lateral line. However, ABR measures the response of the ear (and possibly brain) but does not indicate how a fish would respond to the sound, and the measure of sensitivity provided is not the best sensitivity of the animal since the technique does not examine the processing that may occur in the brain which could improve sensitivity (e.g., by improving the signal-to-noise ratio by averaging). Thus, use of ABR requires the extensive use of controls that exposed animals are compared to, and any changes in sensitivity are relative to these controls. Finally, the acoustic setup for the tests must be very carefully defined; animals that are pressure sensitive must be tested with a pressure stimulus, and animals sensitive to particle motion (most fish) need to be tested with respect to that stimulus.
Tagging—Fish monitoring also could be accomplished using sonic or passive integrated

119
transponder tags. Marine mammal tags incorporating acceleration sensors (e.g., Johnson and Tyack 2003) can be used to observe fine-scale behavior and responses to noise. Fish finders can be placed into the array to monitor movement. It is also critical to have a control area with which to compare animal movement and behavior in the array area.
Wave energy research facility
The group agreed that since many of the questions being asked about the generation of noise from a buoy/array are so basic in nature, they would be best addressed in a “wave energy research facility” before full-scale development of wave energy begins. The cost of developing the wave energy research facility should be funded in a cooperative fashion by private, state, and federal funds. A facility like this could also serve as a control area for comparison against actual wave energy facilities.
Literature Cited
Hastings, M. C., A. N. Popper, J. J. Finneran, and P. J. Lanford. 1996. Effect of low frequency underwater sound on hair cells of the inner ear and lateral line of the teleost fish Astronotus ocellatus. J. Acoust. Soc. Am. 99:1759–1766.
Johnson, M., and P. L. Tyack. 2003. A digital acoustic recording tag for measuring the response of wild marine mammals to sound. IEEE J. Oceanic Engr. 28:3–12.
McCauley, R. D., J. Fewtrell, and A. N. Popper. 2003. High intensity anthropogenic sound damages fish ears. J. Acoust. Soc. Am. 113:638–642.
Moyle, P. B. and J. J. Cech, Jr. 2000. Fishes: an introduction to ichthyology. 4th edition, Prentice Hall.
Lombarte, A., H. Y. Yan, A. N. Popper, J. C. Chang, and C. Platt. 1993. Damage and regeneration of hair cell ciliary bundles in a fish ear following treatment with gentamicin. Hear. Res. 66:166–174.
Moore, S. E., and J. T. Clarke. 2002. Potential impact of offshore human activities on gray whales (Eschrichtius robustus). J. Cetacean Res. Manage. 4:19–25.
Popper, A. N., R. R. Fay, C. Platt, and O. Sand. 2003. Sound detection mechanisms and capabilities of teleost fishes. In S. P. Collin and N. J. Marshall (eds.), Sensory processing in aquatic environments, p.3–38. Springer-Verlag, New York.
Popper, A. N., M. E. Smith, P. A. Cott, B. W. Hanna, A. O. MacGillivray, M. E. Austin, and D. A. Mann. 2005. Effects of exposure to seismic airgun use on hearing of three fish species. J. Acoust. Soc. Am. 117:3958–3971.
Rountree, R .A., R. G. Gilmore, C. A. Goudey, A. D. Hawkins, J. J. Luczkovich, and D. A. Mann. 2006. Listening to fish: applications of passive acoustics to fisheries science. Fisheries 31:433–445.
Tynan, C. T., D. G. Ainley, J. A. Barth, T. J. Cowles, S. D. Pierce, and L. B. Spear. 2005. Cetacean distributions relative to ocean processes in the northern California Current System. Deep Sea Res. Part II Top. Stud. Oceanogr. 52:145–167.

120
Stressor-specific effects table for acoustics. KEY: L=low impact, M=medium impact, H=high impact, NA=not applicable, ?=some uncertainty associated with the estimate
Activity (agent or stressor) Receptors
Oce
an W
aves
and
C
urre
nts
Ben
thic
Hab
itats
, Pl
ankt
on, F
oulin
g C
omm
unity
Fish
a
Fora
ge F
ish
and
Inve
rtebr
ates
Dem
ersa
l Fis
h
Epib
enth
ic
Mac
roin
verte
brat
es
Ben
thic
Infa
una
Seab
irds
Pinn
iped
s
Har
bor P
ropo
iseb
Gra
y W
hale
c
Dol
phin
s
Oth
er B
alee
n W
hale
s
Acoustic Frequency Signatures NA NA H? H? H? L L L? L H M? L? M? Point Absorber NA NA H? H? H? L L L? L H M? L? M? Attenuator NA NA H? H? H? L L L? L H M? L? M? Oscillating Water Column NA NA H? H? H? L L L? L H M? L? M? Overtopping NA NA H? H? H? L L L? L H M? L? M?
Mild Weather Acoustics (Quiet Days)d NA NA H? H? H? L L L? L H M? L? M? Heavy Weather Acoustics (Loud Days)d NA NA H? H? H? L L L? L H H? L? H? Important Frequencies for Key Biota NA NA H? H? H? L L L? L H M? L? M? Amplitude Effects (Overpressure) NA NA NA NA NA L L L? L H H? L? H? Service Boats and Equipment NA NA M? M? M? L L L? L H M? L? M? Calm Weather Daye NA NA H? H? H? L L L? L H H? L? H?
a Most concern is for acoustically sensitive fish like herring and midshipman. b Harbor porpoises (Phocoena phocoena) are very affected by acoustic pingers and the use of pingers at wave energy facilities is being considered. c The effect of a lack of acoustic signature of the wave energy facility is of special concern for gray whales. d Based on Bruce Mate’s statement that about 90% of ocean sound on a stormy day is nonanthropogenic (natural), whereas about 90% of sound on a quiet day is anthropogenic; ergo, a possible rationale for considering differential effects. e Calm is different from mild weather, as the threat in calm weather is the complete lack of sound and consequent risk of the animals being unaware of the buoys or cables and blundering into them.

121
Stressor Breakout Group Report: Electromagnetic Effects
Participants:
George Boehlert, OSU (Facilitator) Ric Brodeur, NOAA-NMFS, NWFSC Bob Emmett, NOAA-NMFS, NWFSC Mike Fitzpatrick, Fishermen Interested in Natural Energy Stephen Kajiura, Florida Atlantic Univ. Laurel Kellner, OSU (Rapporteur) Greg McMurray, Oregon DLCD (Chair)
Key Findings
The electromagnetic field (EMF) is comprised of an electric field (E field) and a magnetic field (B field). The E field is contained by the insulation within the generation devices, subsea pods, and cables. The B field is generally detectable outside of this componentry and can induce a second electric field (the iE field) which is produced when conductive animals move through it. Galvanic fields are caused by electrochemical interactions of metals in contact with seawater (an electrolyte).
Following are our key findings on potential electromagnetic effects of wave energy facilities:
• EMF is most likely to affect animals that use magnetic fields for orientation or electrical fields for feeding.
• The key receptors for EMF are salmon, crab, sturgeon, sharks and rays, and albacore tuna (Thunnus alalunga, for offshore waters).
• Both induced and galvanic electrical fields are of concern and may have impacts.
• There are major areas of uncertainty on receptors for both electrical (E) and magnetic (B) fields.
• Baseline measurements before and after development are needed to establish extent and magnitude of local magnetic fields.
• Armoring and trenching are likely effective mitigation for cabling, but we need demonstration of Faraday cage effectiveness in the field for all generation devices and also for the subsea (rectifying) pods, when and if used.
• The participants recommended that the 2007 COWRIE mesocosm experiments be used as a guide to the value of stressor-response experiments prior to trying to test local species.
Top Ecological Issues
• Galvanic or induced electrical fields may modify behavior of animals that use electrical fields for feeding. Species affected probably include sharks and rays (elasmobranchs), crab, sturgeon, albacore tuna (if present), and possibly marine birds.
• Attraction or repulsion of prey species by EMF may affect foraging ability of other prey species, such as seabirds.
• Magnetic fields may affect movement and behavior patterns of animals that use magnetic fields for orientation. Affected animals include salmon, elasmobranchs, sturgeon, albacore tuna (if present), and likely some cetaceans.
• System breakages resulting in ground faults (i.e., short circuits to the ocean) would likely have lethal but very local effects.

122
• Both galvanic electrical fields and induced electrical fields may have ecological effects.
• Due to physical proximity, EMF from generation devices would likely affect only the pelagic biota, whereas EMF from subsea pods would likely affect only the demersal biota. However, some species utilize the entire water column over a diurnal cycle (for example, Chinook salmon [Oncorhynchus tshawytscha]).
Scientific Uncertainty and Agreement
• There was a high level of uncertainty about the response of pinnipeds, cetaceans, plankton, turtles, squid and baitfish, and benthic infauna to EMF as expressed by magnetic and induced electrical fields.
• There was a significant level of uncertainty about the response of salmon to electrical fields. These fields can affect catch rates for salmon trollers.
• There was a high level of scientific agreement among the participants in the breakout group about the major ecological issues, levels of uncertainty, key information gaps, and likely feasibility of mitigation.
Key Information Gaps
There is a general lack of information about the sensitivity of many animal groups to EMF, including that for pinnipeds and cetaceans, seabirds, sturgeon, squid and baitfish, flatfish, rockfish and lingcod (Ophiodon elongatus), and plankton.
Feasibility and Effectiveness of Mitigation
• Conversion of electricity to 60 Hertz synchronous AC and armoring and trenching of the cabling from the rectifying pods to the shore are very
likely effective mitigation measures for the undersea cables.
• Ground-fault interruption (similar to home GFI circuits) is likely effective mitigation for short circuiting of all components of the system, but should be backed up with real-time data telemetered to a control station.
• Mitigation for magnetic fields (and therefore, induced electrical fields) is dependent on both the effectiveness of the application of Faraday caging in the generation devices and subsea pods, and the conversion of asynchronous AC at less than 1 Hertz to 60 Hertz AC.
• Adequate armoring should protect vertical transmission cables from generating devices to subsea pods from biting by sharks and rays, as has occurred with communication cables.
• Areas of outcrop (i.e., reefs) along the paths of transmission cables should be avoided, as they will make burial unfeasible.
Recommendations for Baseline and
Monitoring Studies
• Baseline studies should include magnetic surveys of sites before and after deployment of energy-generating and transmission equipment in order to establish local magnetic background and possible relevance of superimposed magnetic fields from the electrical currents produced and transmitted.
• Monitoring for wave energy generated electric and magnetic fields should accompany facility buildouts.
• Studies of animal responses to EMF conducted in situ will be difficult and likely expensive. Dedicated control areas may not be very helpful in assessing EMF effects. The possibility of studying the equipment with and without electrical current production would likely be a better approach, and
123
would help address the difficulty of separating the effects of multiple stressors. This approach would probably require the ability to switch from transmission to dummy loads.
Other Information
At the time of this writing, COWRIE mesocosm studies are intended to be conducted in the British Isles during the 2007 field season and should be completed by February 2008 and reported on by June 2008. The results of these studies, when published, should be valuable in scoping studies of the response of local species to EMF. Further information is available at two web sites:
COWRIE (Collaborative Offshore Wind Research Into the Environment). No date. Offshore windfarms: putting energy into the UK. Online at http://www.offshorewindfarms.co.uk/ Research/ResearchAreas/ElectromagneticFields/EMFPhase1.aspx [accessed 8 February 2008].
Gill, A.B., I. Gloyne-Phillips, K.J. Neal, and J.A. Kimber. 2005. Cowrie 1.5 Electromagnetic fields review. The potential effects of electromagnetic fields generated by sub-sea power cables associated with offshore wind farm developments on electrically and magnetically sensitive marine organisms—a review. Online at http://www.offshorewindfarms.co.uk/ Downloads/1351_emf_phase_one_half_report .pdf [accessed 8 February 2008].

124
Stressor-specific effects table for electromagnetic effects. KEY: L=low impact, M=medium impact, H=high impact, U=unknown, ?= some uncertainty associated with the estimate
Activity (agent or stressor) Receptors
Salm
on
Dun
gene
ss c
rab
Stur
geon
Pinn
iped
s
Shar
ks (p
elag
ic)
Shar
ks &
skat
es
(dem
ersa
l)
Roc
kfis
h &
ling
cod
Flat
fish
Plan
kton
– m
ysid
s an
d cu
mac
eans
Cet
acea
ns
Turtl
es
Bai
tfish
/Squ
id
Ben
thic
infa
una
Seab
irds
Generating Devices Galvanic E field U L L U H L L L U U U U L L-M? Induced E field U L L U H L L L U U U U L L-M? Magnetic field H L L U H L L L U U U U L L-M?
Collecting/Rectifying Devices Galvanic E field U H H U L H U U U U U U U L-M? Induced E field U H H U L H U U U U U U U L-M? Magnetic field H U H U L H U U U U U U U L-M?
Transmission System Galvanic E field U H H U L H U U U U U U U L-M? Induced E field U H H U L H U U U U U U U L-M? Magnetic field H U H U L H U U U U U U U L-M?
Catastrophic Ground Fault H H H H H H H H H H H H H L-M?

125
Breakout Group Report: System View and Cumulative Effects
Participants:
S.M. Bartell, E2 Consulting Engineers, Inc. (Chair) Holly Campbell, OSU (Rapporteur) John Chapman, HMSC Jack Engle, UCSB Robin Hartmann, Oregon Shores Conservation Coalition (Facilitator) Selina Heppell, OSU Kaety Hildenbrand, OSU Curt Peterson, PSU Alan Shanks, OIMB Kate Wing, NRDC
Introduction
The breakout session participants were challenged to address the cumulative environmental effects of wave energy technologies within the coastal ecosystem. The purpose was not to perform the actual assessment, but to discuss important environmental aspects and issues of such a comprehensive analysis. The socioeconomic and policy considerations attendant to cumulative effects assessment were recognized as important. However, the participants agreed to focus on the environmental effects—consistent with the overall technical theme of the workshop.
There was no substantive discussion of the requirements of a cumulative effects assessment (e.g., under the National Environmental Policy Act [NEPA] and the Council on Environmental Quality [CEQ]) and it was not clear that a framework for assessing cumulative effects of wave energy technologies produced by the sessions need conform to such requirements. Nevertheless, brief attention to these programmatic approaches helped to organize the results of the session discussion and might suggest a useful path forward towards a cumulative assessment of the environmental effects of wave energy technologies.
Cumulative impact is defined under NEPA as follows:
“Cumulative impact” is the impact on the environment which results from the incremental impact of the action when added to other past, present, and reasonably foreseeable future actions regardless of what agency (Federal or non-Federal) or person undertakes such other actions. Cumulative impacts can result from individually minor but collectively significant actions taking place over a period of time. [40 CFR 1508.7, CEQ 1987]
The CEQ (1997) recommends 11 steps for assessing cumulative effects. These steps can be conveniently categorized as scoping, organizing, screening, evaluating, and mitigating (including monitoring and adaptive management). Senner et al. (2002) attempt to simplify the process, yet provide a systematic and consistent framework for assessment. Halpern et al. (2008) developed a qualitative, subjective framework for assessing the cumulative effects of various environmental stressors on marine ecosystems, including coastal systems.
Characterizing the incremental effects in relation to past and current actions underscores the technical and analytical perspectives in assessing cumulative effects (e.g., Bedford and Preston 1988). Characterizing impacts in relation to the reasonably foreseeable future suggests an intractable assessment from an analytical perspective. However, an emphasis

126
on future actions emphasizes cumulative effects assessment as an exercise in environmental planning (e.g., Stakhiv 1988). In practice, both analysis and planning contribute valuably to a cumulative assessment (Smit and Spaling 1995). Although the implications of future actions garnered less attention, both perspectives were evident in the breakout session discussions.
Key Findings
The session participants identified the following as key aspects in assessing the cumulative environmental effects of wave energy technologies:
1. The cumulative effects of wave energy technologies will depend importantly on the number, size, location, and configuration of wave energy projects that become operational within the nearshore coastal environment. Assessment of cumulative impacts will require periodic, systematic, multistep evaluations as the energy facilities increase in scale and extent.
2. As the number and extent of wave energy facilities increase, new effects or risk assessment endpoints might emerge that were not evident at smaller scales. As the wave energy landscape increases throughout the coastal zone, thresholds might be surpassed whereby wholesale modifications of the physical circulation and sediment dynamics of the nearshore environment become evident.
3. Adaptive management, long-term monitoring, and public involvement are necessary components of a cumulative assessment that continues as the wave energy industry increases in its scale of deployment.
4. A significant deployment of wave energy technologies might redirect and potentially focus other ongoing coastal zone activities (e.g., shipping, commercial fishing, whale migration), with associated environmental impacts that should be included in the cumulative assessment.
High Uncertainty: Incomplete Understanding and Sparse Data
Session participants repeated concerns that the lack of information and data describing the nature of the wave energy technologies, and the incomplete understanding of marine resources and coastal zone dynamics, introduce substantial uncertainty into the assessment of cumulative effects. The nature of the technologies actually implemented will influence the number and spacing of cables used to anchor these devices. Injury and death due to entanglement or collision were considered the major impacts on marine mammals resulting from these technologies. Spatial-temporal distributions and population sizes of potentially impacted marine organisms are poorly quantified. The coastal zone physical environment, including wave energies, patterns of circulation, sediment transport, and deposition remain incompletely described for the areas potentially occupied by wave energy complexes. Such basic information is needed to undertake a meaningful cumulative effects assessment. The participants questioned if other states or countries might provide examples of effective programs for assessing cumulative effects.
One interesting and important unknown is whether the physical conditions favorable for selecting locations for wave energy projects are also favorable conditions for attracting marine resources or increasing biological productivity. If so, the potential for continuing and cumulative environmental impacts will be increased. If not, the impacts of wave energy technologies might be substantially reduced.
Site-selection and location could be used in mitigating effects. For example, avoiding known areas of whale migration in locating wave energy devices could reduce the likelihood of entanglement or collision.
Spatial and Temporal Scale
Session participants considered the importance of spatial and temporal scales implied by a cumulative effects assessment of wave energy technologies. As indicated, a small

127
number of widely spaced facilities might prove to be of minimal risk to marine resources or the local coastal physical environment. However, as the number, size, and proximity of wave energy facilities increase, thresholds might be exceeded where impacts become sudden and dramatic. A small array of buoys might simply dampen wave energy, while a large array could modify sand/sediment transport and deposition, with a major cumulative impact in the nearshore environment. Similarly, smaller arrays might result in minor rates of associated injury or mortality to marine mammals. However, compounding of these mortalities by multiple and larger arrays could produce significant population-level impacts, especially for populations characterized by low numbers and low rates of reproduction. One animal killed might be one too many.
Concerns were also expressed that deleterious effects might require considerable time to manifest. For example, significant longer term consequences of an accumulation of minor short-term impacts could require years of monitoring before the significance was realized. Therefore, it appears imperative to implement some level of assessment from the very beginning of technology deployment.
Wave Energy Technologies
The session participants recognized that the different technologies for capturing wave energy might pose different risks to the coastal environment and associated biota. Given the different performance characteristics of these technologies and attendant risk, a risk:benefit analysis might contribute meaningfully to an assessment of cumulative effects. Technologies that were efficient transformers of wave energy into electricity and posed minimal environmental risks would logically be favored. Clearly, the cost of the technologies would factor into such an assessment.
Regardless of the specific technology, cables would be necessary to maintain the position of the device. The number, size, and geometry of the anchoring cables represent important aspects of each technology in determining the likelihood
of collision or entanglement with marine organisms, particularly marine mammals. Loose thin cables likely pose greater risks for entanglement than taut thick cables. However, taut thick cables might pose greater risks for collision and injury or death. The geometrical complexity of the anchoring cables increases in importance, perhaps nonlinearly, as the number of deployed devices increases.
Modeling and Monitoring
The group expressed considerable optimism that the effects of wave energy technologies and wave facilities could be mathematically modeled. This was particularly emphasized for physical aspects of the coastal marine environment between the wave project and the shore. Changes in wave energies, current velocities, and water depths might be modeled with sufficient accuracy to inform the cumulative assessment process. The importance of using models to characterize the dynamics of sand scour, transport, deposition, underwater dune formation, and dune migration was also discussed. Simple models that estimate the probability of encounter with a cable might be constructed from knowledge of the physical dimensions of marine mammals, swimming behavior, and the geometry of the cable system defined by a technology and the dimensions of the wave energy facility.
Given information on the physical attributes of the anchoring system, it might also prove possible to model the accumulation and associated productivity of marine fouling communities that inhabit the cables. The spatial-temporal accumulation of hard-bottom habitat (e.g., mussel shell mounds) could also be modeled. It is conceivable that the distribution and magnitude of this habitat type would increase substantially during the operational life cycle of the wave energy facilities. An underwater landscape dominated by physically connected mussel mounds might interfere with the cross-shelf movements or migrations of critically important benthic resources (e.g., Dungeness crab [Cancer magister]). At the same time, soft-bottom habitat of value to other

128
marine resources might correspondingly decrease.
In addition to modeling, the group underscored the importance of using deployed wave energy facilities (or individual devices or buoys) as opportunities for long-term monitoring. The results of the monitoring could be used to evaluate model predictions. These data could also directly inform an adaptive management process for assessing and mitigating the cumulative effects of wave energy technologies.
Decommissioning
Session participants recognized the potential risks posed by the removal of wave energy technologies at the end of their usefulness. Particular attention was paid to the removal of the large concrete blocks used as anchors. If these structures demonstrate ecological value in terms of their attached communities and associated fisheries, political pressures might be brought to leave the structures in place. However, some states (e.g., Oregon) already have taken positions that these structures shall be removed regardless. If underwater demolition is required, additional risks must be included in the cumulative effects assessment. Increases in navigation by vessels involved in the decommissioning process might pose additional risks to be considered.
Stressor-Response Functions, Risk, and Effects Assessment
Cumulative effects can to some degree be assessed by simply adding up risks posed by each stressor to each receptor. This requires the derivation of separate stressor-response functions for the relevant combinations of stressors and receptors. Initial functions might be more qualitative and subjective in form until the necessary data are developed. Where data permit, the functions can be quantitatively described and used in a manner consistent with probabilistic risk estimation. Previous experience suggests that the cumulative assessment might well distill to a small number of key risks involving subsets of stressors and
receptors (e.g., cables and marine mammals). Session participants emphasized the need for detailed quantitative assessments of risks posed to Dungeness crabs and endangered salmonids.
A matrix wherein columns define the stressors associated with wave energy technologies (i.e., construction, operation and maintenance, decommissioning) and rows identify the responses (i.e., effects) of interest should be developed as a framework for assessing cumulative effects. Risks should be estimated for each (applicable) combination of stressor and response. Risks can be integrated over stressors (column “sums”) or effects (row “sums”) to characterize cumulative effects and overall risk. Inspection of the matrix would quickly identify key stressors and effects. Developing this matrix based on existing information and data might be fraught with uncertainty. Key combinations of stressors and responses that appear significant, but uncertain, could be used to guide research and monitoring efforts. Subsequent revisions to the matrix could be performed until the remaining uncertainties were acceptable and the results summarized in the matrix usefully informed an adaptive risk management and mitigation process.
The matrix can be expanded to include additional columns that identify other past and continuing human and natural stressors that might generate additional effects. These should be included in the cumulative effects assessment (CEQ 1997). For example, current recreational or commercial fishing will be dislocated from wave energy facilities and relocated in other areas. The net effect might be an increase in fishing pressures in these areas outside of the wave energy facilities. Risks to the fishing industry would be a component of the cumulative effects assessment. The location of wave energy projects might alter the migration habits of whales and force them into deeper waters and shipping lanes, where opportunities for collision might increase.
Finally, columns should be added that speculate concerning additional stressors (human or natural) that might be relevant for the

129
reasonably foreseeable future (CEQ 1997). Continuing changes in climate and associated upwelling characteristics of the coastal marine environment might exacerbate some risks posed by the operation of the wave energy facilities; alternatively, other risks might be reduced. Clearly, speculation of future risk remains highly uncertain.
The cumulative effects assessment would then require integration across all the stressors (past, present, and future) that are associated directly with the wave energy technologies, as well as other actions in the affected environment that could conceivably bear upon the responses of concern.
Cumulative Effects Matrix
Much of the session discussion focused on individual stressors and receptors. It was inevitable that important issues raised during day one of the workshop were revisited. The discussion of individual stressors and receptors has been summarized in the cumulative effects matrix below. The matrix uses a ranking system of low, medium and high, but within each ranking the magnitude and potential of the effect, if any, would be a function of the scale and extent of deployment. This matrix has been expanded to include stressors and receptors not specifically discussed during the cumulative effects session.
Related Issues
Related topics addressed during the session that pertain to cumulative effects, but not specifically identified in the cumulative effects matrix, included the following:
• Magnetic fields should be carefully examined because small changes might result in impacts to fish. Additional consideration of noise as a disturbance is similarly suggested.
• Fishers know ways to reduce the seabird perching and nesting problem. These methods are well understood and might be used to reduce potential problems associated with wave energy devices.
• Assessing cumulative effects might require the consideration of any increased dredging in rivers and harbors necessary to support the vessels that service the wave energy industry. Dredging has the potential to negatively impact nursery areas and other critical marine habitats.
• “Bounding” the cumulative effects assessment was further discussed. For example, if the deployment of wave energy technologies permits reductions of other energy technologies (e.g., dam removals), should the corresponding reductions in environmental effects associated with these other technologies be included in the cumulative assessment of wave energy technologies?
• One approach to mitigation of cumulative effects might be to concentrate deployment of wave energy complexes, rather than distribute them widely throughout the coastal ocean.
• There needs to be some kind of an organization responsible for monitoring and assessing the effects of wave energy technologies coastwide.
Literature Cited
Bedford, B. L. and E. M. Preston. 1988. Developing the scientific basis for assessing cumulative effects of wetland loss and degradation on landscape functions: status, perspectives, and prospects. Environ. Manage. 12:751–771.
Council on Environmental Quality (CEQ). 1997. Considering cumulative effects under the National Environmental Policy Act. Prepared by the CEQ, Executive Office of the President, Washington, D.C.
Halpern, B., S. Walbridge, K. A. Selkoe, C. V. Kappel, F. Micheli, C. D’Agrosa, J. Bruno, K. S. Casey, C. Ebert, H. E. Fox, R. Fujita, D. Heinemann, H. S. Lenihan, E. M. P. Madden, M. Perry, E. R. Selig, M. Spalding, R. Stenek, and R. Watson. 2008. A global map of human impact on marine ecosystems. Science 319:948–952.

130
Senner, R. G. B., J. M. Colonell, J. D. Isaacs, S. K. Davis, S. M. Ban, J. P. Bowers, and D. E. Erikson. 2002. A systematic but not-too-complicated approach to cumulative effects assessment. 22nd Annual Conference of the International Association for Impact Assessment, The Hague, June 15–21, 2002.
Smit, B., and H. Spaling. 1995. Methods for cumulative effects assessment. Environ. Impact Assess. Rev. 15:81–106.
Stakhiv, E. Z. 1988. An evaluation paradigm for cumulative impact analysis. Environ. Manag. 12:725–748.

131
Stressor-receptor matrix for cumulative effects. KEY: L=low impact, M=medium impact, H=high impact.
Stressors Emplacement Operation Decommissioning Other stressors (past,
present, future)
Receptors/ responses
Con
stru
ctio
n na
viga
tion
Moo
ring
syst
em
Tran
smis
sion
in
fras
truct
ure
Moo
ring
syst
em
Gen
erat
ion
devi
ce
Tran
smis
sion
in
fras
truct
ure
Che
mic
al
coat
ings
Dec
omm
issi
on
navi
gatio
n
Dev
ice
rem
oval
Moo
ring
cabl
e re
mov
al
Anc
hor r
emov
al
Fish
ing
pres
sure
Clim
ate
chan
ge
Extre
me
stor
ms
Inva
sive
spec
ies
Cum
ulat
ive
effe
cts
Ocean waves M L M H M Ocean currents L M L L L M H M Sediments L L L M L L L L H M Plankton L L L L L L Fouling community H H H L H H H L Migratory fish L L L M L L L L L M L L M L Forage fish L L L M L L L L L M L L M L Demersal fish L L M M L L L L M L L M M Invertebrates L L L M L L L L L L L L M L Epibenthic macroinvertebrates
L L M M L L L L L L L M L
Benthic infauna L L M M L L L L L L M L Seabirds M L M L M L L M M Pinnipeds L L L L L L L M L M M L Cetaceans L L L H M M L L L L H M L M M


133
Workshop Integration and Synthesis
Cathy Tortorici, NOAA-NMFS
The goals of the workshop were to develop 1) an initial assessment of the potential impacting agents and ecological effects of wave energy development in the coastal ocean and 2) a general framework that can be applied to specific wave energy projects. To accomplish these goals, we explored key questions in a series of breakout sessions:
1. What is known about wave energy facilities, their associated components (such as cables, anchors, and buoys), and their effect on the physical and biological components of the ecosystem?
2. What is unknown about these relationships, and what are key information gaps?
3. What is the level of uncertainty or agreement among scientists about these interactions?
4. Can we prioritize important ecological issues (e.g., key interactions)?
5. What studies, monitoring, or mitigation measures should be employed to help minimize effects?
As stated in the workshop prospectus,
This workshop [did] not attempt to discuss and vet policy issues pertaining to wave [facilities]; rather, it [focused] on building capacity to more adequately address the potential ecosystem impacts of wave energy development along the Oregon coast. In addition, the broader U.S. marine science community may not be aware of the ocean energy momentum building in Oregon and will benefit from understanding the proposed projects and a framework for the ecological context in which they will operate.
The workshop shared current understanding and initiated a broad discussion of the potential
ecological effects of ocean energy. The morning plenary session presentations provided a common understanding of wave energy technology and scientific issues involved. The afternoon and following morning provided a forum of structured breakout groups and interaction among the groups. These discipline-based groups generated written summaries for this proceedings volume to disseminate the workshop results. Below is a summation of key cross-cutting messages from all breakout groups.
Importance of the Ocean Environment is Vital to Keep in Mind
Both in the plenary session and in the breakout groups, the importance of the nearshore ocean environment was emphasized as an underlying principle. All agreed that workshop participants should keep this in mind as they considered the ecological effects of wave energy development off the Oregon coast.
The Energy Absorbing Structures breakout group summarized this sentiment best when they wrote,
Because of the combination of tidally driven mixing, wind mixing, and upwelling, shelf habitat inshore of 100 m depth, and particularly inshore of 40 m depth, is the most biologically productive marine zone ….
The productivity in this zone includes important pelagic and benthic food webs. In addition to supporting communities of marine birds, mammals, fishes, invertebrates, and even a reptile (the leatherback turtle, Dermochelys coriacea); each of these food webs supports important commercial and recreational harvests of finfish and shellfish (e.g., salmon, sardines, bottom fish, rockfish, and Dungeness crab [Cancer magister]). Several protected species also include this zone in their critical
134
habitat; impacts on those species are significant for legal purposes.
Lack of Information around Potential
Effects Needs to be Recognized as Wave Energy Projects are Considered
A major concern was the lack of information by which to judge ecological and physical effects from the development of wave energy projects. For example, the Cumulative Effects breakout group said, “Session participants repeated concerns that the lack of information and data describing the nature of the wave energy technologies, and the incomplete understanding of marine resources and coastal zone dynamics, introduce substantial uncertainty into the assessment of cumulative effects.” The Electromagnetic Effects (EMF) group said, “There is a general lack of information about the sensitivity of many animal groups to EMF, including that for pinnipeds and cetaceans, seabirds, sturgeon, squid and baitfish, flatfish, rockfish and lingcod,…and plankton.” The Fish and Fisheries breakout group stated, “There is a lack of adequate information and a high level of scientific uncertainty regarding the effects these structures may have on the diverse fish communities and their associated commercial and recreational fisheries communities.”
All emphasized the need to collect data and general baseline information at each wave energy buoy array and specific information through monitoring to assess impacts on individual species and the overall nearshore and ocean ecosystems. For example, the following pieces of information were judged necessary to begin to understand the impacts of wave energy buoy arrays on seabird populations:
• Comprehensive spatial and temporal data on the distribution and habitat use for marine birds along the Oregon coast
• Maps of important bird feeding or staging areas along the Oregon coast
• Information on migration patterns and behavior, including flight patterns at night and in storms
Modeling is an Important Tool that can Help Answer Questions
Modeling was highlighted as a method to obtain information about the effects of wave energy on the physical and biological environment. For example, the Physical Environment breakout group emphasized that modeling can be used to assess the impact of the physical location of wave energy buoy arrays and their effects on changes in wave heights and sedimentation processes along the Oregon coast. Their detailed report (Appendix 5) stated, “There are numerical models that have been developed to quantitatively evaluate sediment transport rates under combined waves and currents, so there is the potential that model analyses can be expanded to assess the changes in sediment-transport patterns in the shadow zone of a proposed wave farm.”
Those participants evaluating acoustic effects noted that it is possible to measure or model the magnitude, frequencies, and duration of noises generated by wave energy structures:
The noise generated by a buoy/array can and should be modeled to predict noise generation for differently sized and shaped arrays over a variety of environmental conditions. An array of four rows of three or four buoys each would be a starting point for such an experiment. Such modeling is possible since analogous models exist for wind power devices.
We note here that model validation studies should be conducted on demonstration, pilot, and commercial facilities as they are developed.
Monitoring is a Must to Understand Effects
All groups pointed out that given the lack of baseline information and information concerning effects of the construction and operation of wave energy structures, monitoring is a key component to the development of wave energy projects. Monitoring specific fauna (e.g., sea birds, marine mammals) is needed to understand the changes that could occur for project construction and implementation.

135
For example, the Acoustics breakout group said,
It is critical to monitor the sound level of a single wave energy buoy and multiple buoys in an array:
• To measure the acoustic signature for each device and group of devices, both inside and outside of the array. This is especially important to address the generation of synchronous or asynchronous noise generated by an array.
• To study noise under different ocean conditions to differentiate background noise from the buoy/array noise, and to understand how noise generation changes under different environmental conditions.
• To monitor buoy and mooring cable noise over time, to see how it changes as the devices age and mooring cables become fouled.
The Chemical Effects breakout group suggested that “Monitoring for the effects of chemicals on organisms needs to include not just the presence of mortality, but also changes in abundance and movement. … Multiple locations and times should be monitored, since the chemical exposures and effects are likely to be variable.”
The Benthic Habitat breakout group suggested,
Potential sites for deployment should be monitored before deployment for at least a year (to capture seasonal variability). Multiple adjacent sites to the north and south (distance to be determined by the size of units and of the entire complex) should be monitored as controls. The size of the monitoring plots and their distance should be based on ecological considerations, including dispersal and movement ranges of dominant organisms. Samples of water, sediment, and organisms should be taken at increasing distances from point sources to test the potential effects of toxic antifouling paints. If bioindicators for the specific pollutants exist, they should also be used.
The Marine Mammal breakout group agreed that the most important information needed to collect is baseline information prior to the development of wave energy:
The general habits of most of the cetaceans and pinnipeds that could be affected by the development of wave energy off the Oregon coast are not well understood. The following data collection needs were identified as top priorities:
• General biological information on cetaceans and pinnipeds, starting with a literature review of available information. Initial information could be obtained from the petroleum industry and regulatory authorities, and/or the various NMFS’ Fisheries Science Centers.
• Seasonal distribution, migration patterns, and residency information on a species-by-species basis.
• Dietary information on a species-by-species basis.
• Abundance and distribution information on a species-by-species basis.
• Information on bottom habitats where wave energy arrays are proposed to be placed.
• Assessment of behavioral interactions of marine mammals with wave energy conversion devices and cables.
The EMF breakout group suggested that monitoring for wave energy generated electric and magnetic fields should accompany facility build outs.
The Physical Environment breakout group emphasized that it is “imperative” that monitoring/experiments, e.g,, as outlined in their detailed report (Appendix 5), be undertaken at the first few wave energy sites developed along the Pacific Northwest coast.
Risk and Uncertainty are Important to Characterize
A number of the breakout groups emphasized that understanding the risk and uncertainty surrounding wave energy
136
development is critical to the ultimate development of this industry. For example, the EMF breakout group noted that “There was a high level of uncertainty about the response of pinnipeds, cetaceans, plankton, turtles, squid and baitfish, and benthic infauna to EMF as expressed by magnetic and induced electrical fields. There was a significant level of uncertainty about the response of salmon to electrical fields.” The Hard Structure and Lighting breakout group noted that “the uncertainty about the extent of wave energy development and the actual devices to be used in commercially scaled energy projects will remain as a source of uncertainty in environmental analysis for some time.”
The Physical Environment breakout group noted, “As things stand, there will be significant levels of uncertainty in the design of wave farms to be constructed in the Pacific Northwest. It is therefore important that the ensuing responses of the environments be carefully documented, at least for the first few developments that will serve as tests of the designs and impacts” (Appendix 5).
The Fish and Fisheries breakout group noted that uncertainty could be reduced through specific experiments that examine the effects of wave energy devices on the various species of fish and invertebrates, and through studies that look for evidence of differences (impacts) between treatment and control sites by measuring ecological characteristics over time.
The Acoustics breakout group acknowledged that there is uncertainty around the impacts of noise generated from wave energy facilities on cetaceans, pinnipeds, and fish. The level of uncertainty depends on an analysis of the species that could be found near these arrays in relationship to the noise generated from a single buoy and/or a buoy array.
Cumulative Effects Must be Understood
Cumulative effects were a key point of conversation in the closing session at the workshop. Workshop participants described the
need to address cumulative effects in the context of necessary modeling, monitoring, adaptive management, and balancing the scientific and social aspects of project impacts. Cautious development by the wave energy industry was a primary message of the entire workshop.
The Cumulative Effects breakout group summarized this need in the following manner: “The cumulative effects of wave energy technologies will depend importantly on the number, size, location, and configuration of wave energy projects that become operational within the nearshore coastal environment. Assessment of cumulative impacts will require periodic, systematic, multistep evaluations as the energy facilities increase in scale and extent.”
This group also emphasized that, “The cumulative effects assessment [requires] integration across all the stressors (past, present, and future) that are associated directly with the wave energy technologies, as well as other actions in the affected environment that could conceivably bear upon the responses of concern.”
Mitigation may be Possible
A number of groups identified potential mitigation measures that could be tested and employed to ameliorate the physical and biological effects as wave energy buoy arrays are constructed and implemented.
The Acoustics breakout group discussed a variety of potential mitigation measures to reduce noise generation from wave energy buoy arrays:
• Varying the array design (buoy and mooring cable arrangements in the water) could reduce the production of synchronous sound.
• Looser cables strum at lower levels than tighter cables and would not produce as much noise, but this must be balanced against the need to reduce the potential for cetacean entanglement.
• Thicker cables produce a lower frequency sound than thinner cables.

137
Therefore, to reduce noise generation, limit the total number of cables to fewer, larger, vertical cables.
• Use antistrum (sheath/fairing) devices on cables where possible.
• Companies developing wave energy technology should include noise reduction of internal parts of their buoys and underwater substations as a design criterion.
• Sounds that sweep in frequency are more likely to disturb marine mammals than constant-frequency sounds. Devices that emit a constant frequency are preferred to ones that vary. The same is true, though perhaps to a lesser extent, for sounds that change in amplitude.
• Because cable fouling might change the noise spectrum of cables, decisions about when and how often to clean cables should include noise as a factor in decision-making.
The Chemical Effects breakout group noted that the best form of mitigation would be avoiding the use of toxic chemicals in the construction of the wave energy buoys. They stated that
The use of epoxy-based antifouling paint, would, for example, reduce concerns over the continual leaching of dissolved copper into the environment… For chemical releases from spills or leaks, mitigation involves accident prevention and cleanup preparedness. Minimizing servicing trips by vessels, for example, would reduce the risk of spills or collisions. Having the ability to contain and clean spills always on standby would mitigate the impacts should a spill occur.
The Marine Birds breakout group noted eight mitigation techniques that should be considered during the siting and development of a wave energy facility:
• Avoid installing wave energy structures near breeding colonies, primary foraging areas, and migration corridors.
• Constant bright light at night will attract birds or interfere with night-vision birds. Intermittent light should reduce light impacts. Intermittent lights should be off more than on during each lighting cycle.
• Birds are probably attracted more to certain colors of light than others, so color of lighting could be a mitigation measure. This would require specific data or experiments.
• Night work by vessels is more detrimental than daytime work.
• Design of surface structures should minimize potential for roosting by birds. Simple and proven devices already exist to discourage roosting.
• Underwater lines should be rigid and large to minimize underwater collision potential.
• Structures should use multiple layers of containment for oils.
• Above-surface structures should minimize height above the sea surface to reduce collision potential.
The Fish and Fisheries breakout group suggested that looking to other similar examples of wave energy development off the coast of Europe may be helpful as one method to gather ideas about mitigation.
The Marine Mammal breakout group stated that
Impact minimization measures for mooring cables must consider the cable diameter, length and density, and whether the cables are slack or taut. It might be possible to develop a model and crude approximation of cable density to probability of strike or entanglement, to identify configurations that pose sufficient risk to require appropriate minimization and mitigation actions.
It might also be possible to place acoustic warning systems on buoys. There is some evidence from NMFS’ Southwest Fisheries Science Center that acoustic warning systems have worked on fishing nets to minimize entanglement. The

138
strongest evidence on the use of acoustic warning systems has been demonstrated in studies on aquaculture facilities. These warning devices were designed to keep pinnipeds away, but have been shown to drive away harbor porpoises as well. However, there is still a high level of uncertainty concerning whether such a system would deter whales at a wave energy buoy array. In designing such a system, it is important to consider sound emission levels that are loud enough to deter the animal, but not loud enough to damage hearing. Such devices should not exclude whales from identified foraging areas. The devices also need to adapt to varying levels of background noise associated with different sea states to avoid excessive noise (and affected areas) when low sea states do not require loud sources.
The group also considered if there is an “ocean corridor” outside of known migratory routes that could be identified and considered by the industry for placement of wave energy buoy arrays, to minimize impacts to pinnipeds and cetaceans. For pinnipeds, the group recommended specifically that these projects not be sited near rookeries (i.e., Cape Arago), and that seasonal buffer zones be placed around the rookeries so as not to disturb them.
The EMF breakout group noted that
• Conversion of electricity to 60 Hertz synchronous AC and armoring and trenching of the cabling from the
rectifying pods to the shore are very likely effective mitigation measures for the undersea cables.
• Ground fault interruption…is likely effective mitigation for short circuiting of all components of the system, but should be backed up with real-time data telemetered to a control station.
• Adequate armoring should protect vertical transmission cables from generating devices to subsea pods from biting sharks and rays...
The Benthic Habitat group suggested that mitigation include burying wave buoy anchors entirely under the surface of the seafloor, placing structures farther offshore to reduce the effects on nearshore currents and onshore communities, and keeping the units as small as possible.
Conclusions
There is an urgency to the need for environmental studies of wave energy conversion. Throughout the workshop, the importance of evaluating ecological effects at any wave energy demonstration study sites or pilot scale facilities was stressed. These evaluations will help reduce uncertainty of effects for all stressors and all receptor groups, leading to improvements in the best practices for design of devices and arrays and to performance standards and monitoring requirements that can be applied to commercial-scale development.

139
Glossary, Abbreviations, and Acronyms
ABR auditory brainstem response
AC alternating current
Adaptive management an approach to natural resource management that involves evaluating the results of management actions and modifying subsequent actions
Advective referring to the effect of large-scale ocean currents (as opposed to very small-scale processes)
Ambient signals or stressors of nonhuman origin; background
Amphipods a group of small benthic or planktonic crustaceans
Amplitude the height of a wave from trough to crest
Anthropogenic signals or stressors of human origin
Antifouling paint a toxic paint that is used to inhibit growth of the fouling community on manmade surfaces
Array a gridwork; in this context, comprised by columns and rows of wave energy generation devices
ASP amnesiac shellfish poisoning
Asynchronous not occurring at predefined intervals; as alternating current, not as 60-Hertz
B Field the magnetic portion of an electromagnetic field
BACI before-after-control-impact (study design)
Baseline preproject conditions; the studies that establish preproject conditions
Benthos living on or in the substrate at the bottom of the water column
Bioaccumulate the tendency for some chemicals, especially toxicants, to increase in the food web
Biofouling the buildup of fouling community organisms on manmade structures
Bioindicator a species that is sensitive to specific pollutants or stressors and used to indicate their presence
Bivalves molluscs having two opposing shells
Bristleworms a group within the polychaete worms

140
Brittle stars a group of invertebrates closely related to seastars, but having long, thin, whip-like arms
Bus bar the electrical infrastructure at which all the energy of a wave energy development will be amassed
Capacity the maximum amount of electricity that can be generated by a given device under optimal conditions
Catenary line the line connecting the subsurface float to the generating buoy
CEQ Council on Environmental Quality (federal)
Cetaceans the group of marine mammals that includes both the baleen and toothed whales
Closure depth the depth at which littoral transport processes cease to act, effectively the seaward boundary of a littoral cell
COMPASS Communication Partnership for Science and the Sea
Copepods a group of small planktonic crustaceans that is a key important component of marine pelagic food webs
COWRIE Collaborative Offshore Wind Research Into the Environment
Ctenophores a planktonic group of animals that are similar to jellyfish
Cumaceans a group of small benthic crustaceans resembling tiny shrimps
dB decibels; a measure of sound pressure
Demersal large organisms, like fishes or crabs, that live near or on the sea floor
Dissipative tending to reduce the amount of energy
DLCD Oregon Department of Land Conservation and Development
DOGAMI Oregon Department of Geology and Mineral Industries
Downwelling a process whereby surface waters are forced downwards
E Field the electrical portion of an electromagnetic field
EFH Essential Fish Habitat
Elasmobranchs soft-boned fishes that include the sharks, bats and rays; many are able to sense weak electrical fields
EMAP U.S. EPA’s Environmental Monitoring and Assessment Program
EMEC European Marine Energy Centre
141
EMF electromagnetic field
Epifauna bottom-dwelling animals that live at the surface of the bottom substrate
EPRI Electrical Power Research Institute
ESA Endangered Species Act (federal)
Euphausiids a group of crustacean invertebrates that migrates up into the plankton at night; important forage for fish, birds, and cetaceans
Exposure the contact or co-occurrence of a stressor with a receptor
FAD fish attraction device
Faraday cage a metal shield that blocks electromagnetic radiation
FERC Federal Energy Regulatory Commission
Fetch the distance over which both wind and waves move unimpeded
FINE Fishermen Interested in Natural Energy
Flux a flow of matter or energy
Forage fishes smaller fishes that are important sources of food for larger fish, birds and mammals
Fouling community a group of plants and animals that settles on hard substrates
Front an ocean region of high rates of change in temperature and salinity
Galvanic electrical field an electrical field produced by the chemical process of electrolysis
Gastropods snails
GFI Ground fault interruptor
Ghost fishing the loss of fish or other species to derelict fishing nets or traps
GLOBEC GLOBal ocean ECosystems dynamics
Hertz cycles per second
HMSC Hatfield Marine Science Center
Holoplankton planktonic organisms that spend their entire life history as plankton
Hs significant wave height
Hydrography measures of temperature, salinity, and density in seawater; they define ocean water masses

142
Hydrozoans attached animals that are related to jellyfish; a component of the fouling community
IE field the electrical field induced by motion of a conductor through a magnetic field
Infauna bottom-dwelling animals that live within the bottom sediments
Invasive species undesirable species that tend to dominate habitats at the expense of more desirable species; almost all are non-indigenous
Isobath a line on a chart that indicates a contour of equal bottom depth
kHz kiloHertz
Krill a group of epibenthic and planktonic crustaceans that is important forage for fish, birds, and cetaceans; generally refers to the euphausiids and the mysids
kW kiloWatts
LASAR Lab Analytical Storage and Retrieval System
Lateral line a pressure-sensitive structure in fishes
Leaching rate the rate at which a chemical is dissolved into seawater
Littoral cell the area within which nearshore sediments tend to circulate
MBTA Migratory Bird Treat Act
MCBH Marine Corps Base Hawaii
Mechanosensory sensitive to mechanical stimulation
Meroplankton planktonic animals that spend only an early part of their life history as plankton; most benthic invertebrates and many fishes have planktonic larvae
Mesocosm an experimental enclosure or container used for experiments requiring very large volumes of water
Mitigation an action taken to prevent or avoid an ecological effect
MMPA Marine Mammal Protection Act
MMS U.S. Minerals Management Service
Morphological referring to physical structure or appearance
MPA marine protected area
MSA Magnusen-Stevens Fishery Conservation Act (federal)

143
MW megawatt
MWh megawatt hour
Mysids a group of crustacean invertebrates that forms swarms near the sea floor and is important forage for fish, birds, and cetaceans
Nearshore the ocean area closest to the shoreline, generally within 1–2 km, within which key oceanographic processes take place
Necropsy forensic analysis of a carcass to find cause(s) of death or injury
NEPA National Environmental Policy Act (federal)
Neuston plankton living in the upper 10 cm or so of the water column
NMFS National Marine Fisheries Service
NOAA National Oceanic and Atmospheric Administration
NRDC Natural Resources Defense Council
NWFSC Northwest Fisheries Science Center
O&M Operations and maintenance
ODFW Oregon Department of Fish and Wildlife
OIMB Oregon Institute of Marine Biology
Olfactory referring to the sense of smell
Oligochaete worms segmented worms not having parapodia and with few bristles; closely related to earthworms
Oligotrophic referring to ocean regions having low overall productivity
OPT Ocean Power Technologies
OSU Oregon State University
OWET Oregon Wave Energy Trust
Pelagic an organism living in the water column; the water column habitat
Pelamis a wave energy generation device; so named after the genus of the sea snake
Period the length of time taken for the full wave to pass a given point
Physiography physical geography; in this context, of the shoreline
Phytoplankton planktonic plants; the basis of most marine food webs

144
Pinnipeds a group of marine mammals comprising the seals and sea lions
Piscine related to fish
PISCO Partnership for Interdisciplinary Studies of Coastal Oceans
Plankton plants or animals that drift in water without sufficient swimming capability to counter currents
PMFC Pacific Marine Fisheries Council
Polychaete worms segmented worms having parapodia (protrusions) with bristles; they are a major component of the marine infauna
Power the amount of energy in a wave; measured in kW/m as wave power density
Progress ratio a measure of learning in industry; in this context, the annual percentage rate at which the cost of the power generated decreases
Propagules biological units capable of propagating new individuals or colonies; may be vegetative or reproductive
PSP Paralytic shellfish poisoning
PSU Portland State University
Receptor a characteristic of the environment, generally an ecological entity, in which change from stressors can result
Recruitment the process by which young are added to a population
Residual effect the remaining ecological effect of a stressor or stressors after any possible mitigation has been taken into account
Ribbon worms a widely distributed group of nonsegmented (i.e., smooth) worms also called the proboscis worms
Risk assessment an evaluation of the potential adverse effects of an action; in this paper, the evaluation of ecological risk gained from rigorous assessment of the exposure and effects of stressors on receptors
Risk assessment endpoint another term for ecological effects
Risk benefit analysis an analysis of the comparative risks and benefits of a proposal or situation
Rookery a place where pinnipeds haul out to reproduce and rear their young
ROV Remotely operated vehicle
RPS Renewable Portfolio Standard
145
Sacrificial anode an expendable piece of metal, generally zinc, that protects iron and steel from electrolysis in seawater
Salps planktonic animals with gelatinous bodies; they resemble jellyfish but are more closely related to vertebrates
Scaphopods tusk or tooth shells; a molluscan component of the benthos
Scoping process a process that defines the bona fide environmental issues relating to a human action; drawn from the National Environmental Policy Act
Shoaling becoming shallower
Signature the specific characteristics of a signal; in this context, includes chemical, acoustic, and electromagnetic signals
Significant wave height the average height, trough to crest, of the one-third highest waves valid for a time period
Soniferous producing sound
Spatial temporal in space and time
Stressor an agent of change in the environment
Sublittoral past the seaward boundary of a littoral cell; deeper than closure depth
Subsea pod a vault on the seafloor that contains equipment to refine electrical signals from ocean generators before cabling to shore
Synchronous occurring at regular intervals
Taxis a specific behavioral response by an animal to a specific stimulus
Te energy period
Tendon line the line connecting the subsurface float to the anchor
Territorial sea the portion of the ocean owned by the state; in Oregon it is measured as three nautical miles seaward from the shoreline or any rocks or islands
Transmission grid firming the concept of providing reliable sources of power as a backup for less reliable sources such as wind
Transponder an acoustic or radio frequency device that responds to a query; used to establish location
TWh terawatt hours
UCSB University of California at Santa Barbara
USGS U.S. Geological Survey

146
Wave refraction the tendency of ocean waves to curve around obstructions
WDFW Washington Department of Fish and Wildlife
WEC wave energy conversion
Zooplankton planktonic animals
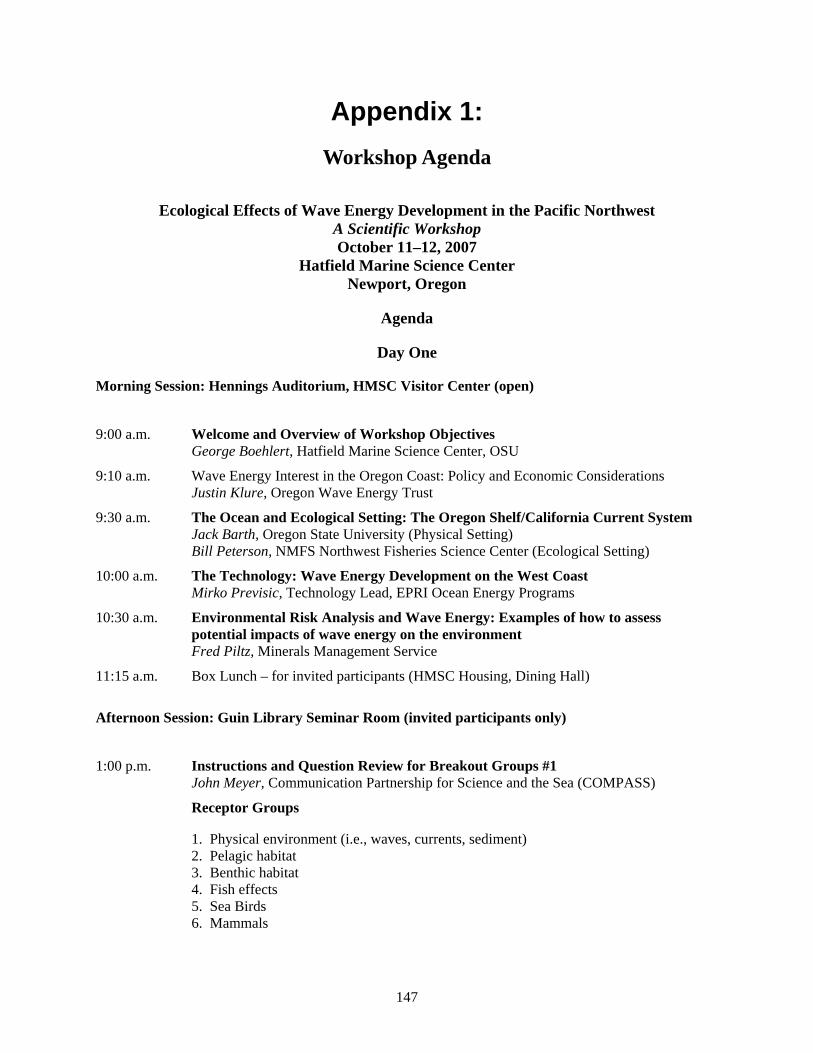
147
Appendix 1:
Workshop Agenda
Ecological Effects of Wave Energy Development in the Pacific Northwest A Scientific Workshop October 11–12, 2007
Hatfield Marine Science Center Newport, Oregon
Agenda
Day One
Morning Session: Hennings Auditorium, HMSC Visitor Center (open)
9:00 a.m. Welcome and Overview of Workshop Objectives George Boehlert, Hatfield Marine Science Center, OSU
9:10 a.m. Wave Energy Interest in the Oregon Coast: Policy and Economic Considerations Justin Klure, Oregon Wave Energy Trust
9:30 a.m. The Ocean and Ecological Setting: The Oregon Shelf/California Current System Jack Barth, Oregon State University (Physical Setting) Bill Peterson, NMFS Northwest Fisheries Science Center (Ecological Setting)
10:00 a.m. The Technology: Wave Energy Development on the West Coast Mirko Previsic, Technology Lead, EPRI Ocean Energy Programs
10:30 a.m. Environmental Risk Analysis and Wave Energy: Examples of how to assess potential impacts of wave energy on the environment Fred Piltz, Minerals Management Service
11:15 a.m. Box Lunch – for invited participants (HMSC Housing, Dining Hall)
Afternoon Session: Guin Library Seminar Room (invited participants only)
1:00 p.m. Instructions and Question Review for Breakout Groups #1 John Meyer, Communication Partnership for Science and the Sea (COMPASS)
Receptor Groups
1. Physical environment (i.e., waves, currents, sediment) 2. Pelagic habitat 3. Benthic habitat 4. Fish effects 5. Sea Birds 6. Mammals

148
3:00 p.m. Break
3:30 p.m. Breakout Groups #1: Receptors (continued)
5:00 p.m. Adjourn
6:00 pm – 8:00 pm
Social Hour, Dinner and Keynote Address, Oregon Coast Aquarium Keynote Speaker: Professor Richard Hildreth, Director, University of Oregon Ocean and Coastal Law Center. “Ocean Zoning: Implications for Wave Energy Development”
Day Two
8:00 a.m. Recap from Day One Cathy Tortorici, National Marine Fisheries Service
8:30 a.m. Instructions and Questions for Breakout Groups #2 Robin Hartmann, Oregon Shores Conservation Coalition
Stressor Groups
1. Energy absorbing structures 2. Chemical effects (e.g., anti-fouling coatings, other toxic effects) 3. New hard structures/Lighting 4. Acoustics 5. Electromagnetic effects 6. System view/cumulative effects
10:30 a.m. Break
11:00 a.m. Report Out from Stressor Breakout Groupings John Meyer, Communication Partnership for Science and the Sea (COMPASS)
11:30 p.m. Integration/Synthesis Session Cathy Tortorici, National Marine Fisheries Service
12:15 p.m. Wrap-up and Next Steps George Boehlert, Hatfield Marine Science Center, OSU
12:30 p.m. Adjourn

149
Appendix 2:
Ecological Effects of Wave Energy Development in the Pacific Northwest:
Prospectus for a Science Workshop
October 11–12, 2007 Hatfield Marine Science Center
Newport, Oregon Contact: Greg McMurray ([email protected])
What: The Ecological Effects of Wave Energy Development Workshop will be a one and one-half day meeting with goals of 1) developing an initial assessment of the potential impacting agents and ecological effects of wave energy development in the coastal ocean and 2) developing a general framework that can be used to apply to specific wave energy projects. The workshop will share current understanding and initiate a broad discussion of the potential ecological effects of ocean energy. The morning will be a plenary session with presentations that provide a common understanding of wave energy technology and scientific issues involved. The afternoon and following morning will offer a forum of structured breakout groups and interaction among the groups. These discipline-based groups will generate written summaries that will be put in a proceedings volume to disseminate the workshop results.
This workshop will not attempt to discuss and vet policy issues pertaining to wave parks; rather, it will focus on building capacity to more adequately address the potential ecosystem impacts of wave energy development along the Oregon coast. In addition, the broader U.S. marine science community may not be aware of the ocean energy momentum building in Oregon and will benefit from understanding the proposed projects and a framework for the ecological context in which they will operate.
Why: Wave energy is renewable power. The Governor’s Office is encouraging the development of this technology. Several different projects are likely to develop along the Pacific Northwest coast. There are currently 12 proposed wave energy projects along the Pacific coast, of which seven reside off the coast of Oregon. One project gaining momentum is being developed by a company called Ocean Power Technologies (OPT). OPT is planning to build a 50-megawatt wave park off the town of Gardiner, on the central Oregon coast over the next 5–10 years and has filed a preliminary permit application with the Federal Energy Regulatory Commission (FERC). The application describes an experimental 150 kW buoy to be launched in spring 2008 and an additional 13 buoys in the fall of 2008. The Reedsport wave park at peak capacity could power 60,000 households. As this and other proposed projects move forward, a variety of unknowns could stand in the way of the timely assessment and development of this technology. Stakeholder dialogue is underway, but significant issues around the environmental impacts to coastal ecosystems have yet to be identified. There is a pressing need to begin examining how ocean wave energy development might impact the marine environment, biological communities, and individual species. This workshop will take the first step by developing a framework for evaluating these environmental impacts. It will also highlight the science from undersea cable projects and other existing ocean technologies that have a larger body of literature on the ecological impacts and may be applicable for wave energy.
Oregon’s governor is committed to helping the wave energy companies move to this state and develop wave energy off the Oregon Coast. Mechanisms to “fast track” wave energy are being developed

150
through the “Oregon Solutions” process. All known stakeholders and all levels of government are involved with this effort. The Department of State Lands is requesting permission from the State Land Board to start a rule-making process for wave energy in the Territorial Sea. The Governor’s citizen advisory council on ocean issues, the Ocean Policy Advisory Council (OPAC), has created a working group to address ocean wave energy issues. Meanwhile, Lincoln and Douglas Counties have also filed preliminary permit applications with FERC and may be a direct part of the future equation of wave energy facility permitting.
It is time for Oregon’s scientific community to begin to respond to some of the most commonly asked questions about the impact of wave generation on the local ocean. The Reedsport Wave Park will be the first utility-scale facility in the United States and is likely to be a model for future projects.
Who: Wave energy is new: Europe is leading the world in its development. In the United States there are just three projects, and they are all experimental sites with a single device deployed: Makah Bay, Washington; Kaneohe Bay, Hawaii; and off the coast of New Jersey. Expertise in understanding ocean impacts is still in the formative stages and developing the scientific capacity to better understand wave energy’s potential ecological impacts is the primary objective of this meeting.
Invitees to this meeting will include scientists with a present expertise in ecological impacts, scientists who do not have a present expertise but would be helpful in expanding Oregon’s science capacity in wave energy, and scientists whose expertise is transferable to understanding wave energy ocean impacts. This meeting will not focus on policy, details of wave energy engineering, or the socioeconomic impacts of wave energy. Separate meetings to address these topics might be a recommended next step.
The scientists invited to the workshop will guide and provide the basic input to the proceedings of the meeting. The focus of the workshop will include topic areas such as
• Physical Effects
Currents and waves Littoral transport
• Effects on Fish
Electromagnetic field effects (sensory systems, orientation) Changes in migration
• Habitat Effects
Fouling community effects and interactions Aggregation effects in pelagic environment (FADs) Planktonic community
• Effects of Benthic Disturbance
Benthic-pelagic coupling
• Marine Mammals and Seabirds
Electromagnetic field effects (sensory systems, orientation) Changes in migration; use of acoustic harassment devices (AHD) Entanglement
When: The Reedsport Wave Park has entered a multi-year permitting process with FERC that will involve stakeholders and a series of resource studies. Oregon’s 2007 legislative session will deliberate on potential incentive packages for wave energy, leading the Coastal Caucus looking into the positive and

151
negative impacts of wave energy on coastal communities. In order to provide useful and timely information to both coastal communities as well as the questions likely to be generated by OPAC and the Coastal Caucus, the science meeting is planned to occur on October 11–12, 2007.
Where: The workshop will be located at Oregon State University’s Hatfield Marine Science Center in Newport, Oregon.
Workshop Steering Committee:
George Boehlert, Director, Hatfield Marine Science Center, Oregon State University Robin Hartmann, Ocean Program Director, Oregon Shores Conservation Coalition Maurice Hill, U.S. Mineral Management Service, OCS Alternative Energy Coordinator Justin Klure, Executive Director, Oregon Wave Energy Trust Greg McMurray, Marine Affairs Coordinator, Oregon DLCD John Meyer, COMPASS, Oregon State University Cathy Tortorici, Chief, Oregon Coast/Lower Columbia River Branch, NOAA-NMFS


153
Appendix 3:
Workshop Participants
Jonathan Allan, Ph.D. Marine Geologist Oregon Department of Geology and Mineral Industries Newport, OR 97365 (541) 574-6642 [email protected]
David H. Baldwin, Ph.D. Ecotoxicology and Environmental Fish Health Program Environmental Conservation Division NOAA-NMFS, NWFSC 2725 Montlake Blvd. E. Seattle, WA 98112 (206) 860-3306 [email protected]
Nelio Barros Portland State University Department of Biology P.O. Box 751 Portland, OR 97207-0751 (503)725-4078 [email protected]
Steven M. Bartell, Ph.D. Principal Scientist and Manager E2 Consulting Engineers, Inc. 339 Whitecrest Drive Maryville, TN 37801 (865) 980-0560 [email protected]
Jack Barth, Ph.D. Professor College of Oceanic and Atmospheric Sciences Oregon State University Corvallis, OR 97331 (541) 737-1607 [email protected]
George Boehlert, Ph.D. Professor and Director Oregon State University Hatfield Marine Science Center 2030 SE Marine Science Dr. Newport, OR 97365 (541) 867-0212 [email protected]
Richard D. Brodeur, Ph.D. NOAA-NMFS, NWFSC Hatfield Marine Science Center 2030 SE Marine Science Dr. Newport, OR 93965 (541) 867-0336 [email protected]
Robin F. Brown Marine Mammals Research Program Oregon Department of Fish and Wildlife 7118 NE Vandenberg Ave. Corvallis, OR 97330 (541) 757-4186 [email protected]
Ray Buckley, Ph.D. Senior Research Scientist Washington Dept. of Fish and Wildlife 600 Capitol Way North Olympia, WA 98501-1091 (360) 902-2828 [email protected]
Ann Scarborough Bull, Ph.D. Marine Biologist Chief, Environmental Analysis Section U.S. Minerals Management Service Pacific Region 770 Paseo Camarillo Camarillo, CA 93010 (805) 389-7820 [email protected]

154
Holly Campbell Marine Resource Management College of Oceanic and Atmospheric Sciences Oregon State University Corvallis, OR 97331 [email protected]
John Chapman, Ph.D. Hatfield Marine Science Center 2030 SE Marine Science Drive Newport OR 97365 (541) 867-0235 [email protected]
Matt Cutlip Fish Biologist Federal Energy Regulatory Commission Office of Energy Projects Portland Regional Office 101 S.W. Main Street, #905 Portland, OR 97204 (503) 552-2762 [email protected]
Debbie Duffield, Ph.D. Portland State University Department of Biology P.O. Box 751 Portland, OR 97207-0751 (503)725-4078 [email protected]
Robert Emmett, Ph.D. NOAA-NMFS, NWFSC Hatfield Marine Science Center 2030 SE Marine Science Dr. Newport, OR 97365-5296 (541) 867-0109 [email protected]
Jack Engle, Ph.D. Associate Research Biologist Marine Science Institute University of California Santa Barbara, CA 93106-6150 (805) 893-8547 [email protected]
John Ferguson, Ph.D. NOAA Fisheries, NWFSC 2725 Montlake Boulevard East Seattle, WA 98112 (206) 860-3287 [email protected]
Mike Fitzpatrick Fishermen Interested in Natural Energy (FINE) P.O. Box 983 Lincoln City, OR 97367 (541) 994-3440 [email protected]
David Fox Marine Program Assistant Manager Oregon Department of Fish and Wildlife 2040 S.E. Marine Science Dr. Newport, OR 97365 (541) 867-0300 ext. 228 [email protected]
Robin Hartmann Oregon Shores Conservation Coalition 1721 SE Main St Roseburg, OR 97470 (541) 672-3694 office [email protected]
Jim Hastreiter Federal Energy Regulatory Commission 101 SW Main Street, Suite 905 Portland, OR 97204 (503) 552-2760 [email protected]
Selina S. Heppell, Ph.D. Associate Professor Dept. Fisheries and Wildlife Oregon State University Corvallis, OR 97331 (541) 737-9039 [email protected]
Kaety Hildenbrand Marine Fisheries Extension Faculty OSU Extension Service Lincoln County 29 SE 2nd St. Newport, OR 97365-4496 (541) 574-6537 ext. 27 [email protected]

155
Richard Hildreth, Professor Director University of Oregon Ocean & Coastal Law Center Knight Law Center 1515 Agate St. Eugene, OR 97403 (541) 346-3866 [email protected]
Maurice L. Hill Office of Alternative Energy Programs U.S. Minerals Management Service 770 Paseo Camarillo, Suite 228 Camarillo, CA 93010 (805) 389-7815 [email protected]
Jan Hodder, Ph.D. Associate Professor Oregon Institute of Marine Biology P.O. Box 5389 Charleston, OR 97420 (541) 888-2581 ext.215 [email protected]
Susan Holmes Marine Resource Management College of Oceanic and Atmospheric Sciences Oregon State University Corvallis, OR 97331 [email protected]
Stephen Kajiura, Ph.D. Department of Biological Sciences Florida Atlantic University Boca Raton, FL 33431 (561) 297-2677 [email protected]
Laurel Kellner Marine Resource Management College of Oceanic and Atmospheric Sciences Oregon State University Corvallis, OR 97331 [email protected]
Keith Kirkendall NOAA-NMFS1201 NE Lloyd Blvd. Portland, OR 97232 (503) 230-5431 [email protected]
Justin Klure Oregon Wave Energy Trust PO Box 8626 Portland, OR 97207-8626 (503) 475-2999 [email protected]
Paul Komar, Ph.D. Professor (Emeritus) College of Oceanic and Atmospheric Sciences Oregon State University Corvallis, OR 97331 (541)737-5210 [email protected]
Hugh Link Oregon Dungeness Crab Commission 964 Central Avenue Coos Bay, OR 97420 (541) 267-5810 [email protected]
Roy W. Lowe Oregon Coast National Wildlife Refuge Complex U.S. Fish and Wildlife Service 2127 SE Marine Science Drive Newport, OR 97365-5258 (541) 867-4550 [email protected]
Bruce Mate, Ph.D. Professor and Director, Marine Mammal Institute Hatfield Marine Science Center 2030 SE Marine Science Drive Newport OR 97365 (541) 867-0202 [email protected]

156
Greg McMurray, Ph.D. Marine Affairs Coordinator Oregon Department of Land Conservation and Development Ocean and Coastal Services Division 635 Capitol Street NE, Suite 150 Salem, OR 97301-2540 (503) 373-0050 ext.248 [email protected]
David Mellinger, Ph.D. Cooperative Institute for Marine Resources Studies HMSC/Oregon State University Newport, OR 97365 (541) 867-0372 [email protected]
Bruce Menge, Ph.D. Professor, Department of Zoology Cordley 3029 Oregon State University Corvallis, OR 97331-2914 (541) 737-5358 [email protected]
John Meyer COMPASS Program Associate Department of Zoology Oregon State University Corvallis, OR 97331 (541) 737-9840 [email protected]
Bill Peterson, Ph.D. NOAA-NMFS, NWFSC Hatfield Marine Science Center Newport, OR 97365 (541) 867-0201 [email protected]
Curt Peterson, Ph.D. Professor, Portland State University Geology Department P.O. Box 751 Portland, OR 97207-0751 (503) 725-3375 [email protected]
Fred Piltz, Ph.D. U.S. Minerals Management Service 770 Paseo Camarillo, Suite 228 Camarillo, CA 93010 (805)389-7850 [email protected]
Mirko Previsic re vision consulting LLC 5115 11th Ave Sacramento, CA 95820 (916) 977-3970 [email protected]
Erin Richmond PISCO Program Oregon State University Corvallis, OR 97331 [email protected]
Gil Rilov, Ph.D. Partnership for Interdisciplinary Studies of Coastal Oceans (PISCO) Department of Zoology Oregon State University Corvallis, OR 97331-2914 (541) 737-3699 [email protected]
Alan Shanks, Ph.D. Professor Oregon Institute of Marine Biology University Of Oregon 618 Boat Basin Dr., PO Box 5389 Charleston, OR 97420 (541) 888-2581 ext.277 [email protected]
Rob Suryan, Ph.D. Oregon State University Hatfield Marine Science Center 2030 SE Marine Science Dr. Newport, OR 97365 (541) 867-0223 [email protected]
Maria Stefanovich Environmental Sciences Oregon State University Corvallis, OR 97331 [email protected]

157
Brycen Swart Marine Resource Management College of Oceanic and Atmospheric Sciences Oregon State University Corvallis, OR 97331 [email protected]
Robert Thresher, Ph.D. National Wind Technology Center National Renewable Energy Laboratory 1617 Cole Blvd. Golden, CO 80401-3393 (303) 384-6999 [email protected]
Cathy Tortorici NOAA-NMFS 1201 NE Lloyd Blvd. Portland, OR 97232 (503) 231-6268 [email protected]
Waldo Wakefield, Ph.D. NOAA-NMFS, NWFSC Hatfield Marine Science Center 2030 SE Marine Science Dr. Newport, OR 97365-5296 (541) 867-0542 [email protected]
Kate Wing Senior Ocean Policy Analyst Natural Resources Defense Council 111 Sutter St., 20th Floor San Francisco, CA 94104 (415) 875-6100 [email protected]
Jen Zamon, Ph.D. NOAA-NMFS, NWFSC P.O.Box 155 Hammond, OR 97121-0155 (503)861-1818 ext.19 [email protected]


159
Appendix 4:
Keynote Address— Ocean Zoning:
Implications for Wave Energy Development (WED) Richard G. Hildreth
Professor of Law Director, Ocean and Coastal Law Center* [email protected]
KEYNOTE ADDRESS
Presented October 11, 2007
at the Oregon Coast Aquarium, Newport, Oregon
as part of
Ecological Effects of Wave Energy Development in the Pacific Northwest: A Scientific Workshop
Wave energy development (WED) is being proposed off the coast of Oregon in areas where activities such as fishing occur. Ocean zoning is a recognized technique for managing multiple ocean uses. It is a means for specifying human uses for particular ocean areas to reduce conflicts between ocean users and to support marine conservation. It is also known as area-based management, place-based management, and marine spatial planning.
The United States Exclusive Economic Zone (EEZ) is the world’s largest and extends 200 miles off the coast of Oregon and other U.S. states and territories. Pursuant to federal law, resource management within the first three miles is primarily by the states. The need for zoning in particularly busy areas of the U.S. EEZ such as off the New England and southern California coasts was recognized in the recent reports of the Pew and United States commissions on ocean policy. President Bush’s Action Plan and Executive Order and the Joint Ocean Commission Initiative following up on those reports also support the use of ocean zoning.
Two leading examples of ocean zoning are Australia’s Great Barrier Reef Marine Park and the Northwest Hawaiian Islands Marine National Monument proclaimed by President Bush last year. Each is slightly larger than the state of California in area. The monument is slightly larger than the park, is the world’s largest marine or terrestrial conservation area, and includes about 3% of the U.S. EEZ. Commercial fishing is prohibited in most of the monument and in 34% of the park.
* Professor Hildreth gratefully acknowledges the assistance of Ocean and Coastal Law Center staff members Andrea Coffman and Christy Callaghan.

160
Other U.S. federal ocean zoning schemes include 13 National Marine Sanctuaries whose total area includes about 1% of U.S. state and federal EEZ waters. Four of those sanctuaries are located off California and 1 off Washington. In 2005 Oregon Governor Kulongoski proposed that the entire continental shelf off Oregon be designated a sanctuary—it would be 4 times as large as the next largest sanctuary, the Monterey Bay National Marine Sanctuary off the central California coast. Within most sanctuaries, bottom trawling is banned and some other fishing activities are also regulated. Most significantly for my topic, wave and other renewable energy facilities are prohibited in federal sanctuary waters and stringently regulated in state sanctuary waters.
The Florida Keys and California Channel Islands sanctuaries contain networks of “no take” marine reserves. In state waters off the central California coast, the state recently established a network of 12 marine reserves. Almost all federal and state definitions of marine reserves exclude “extractive” activities. Under California’s Marine Life Protection Act, activities which would “change the dynamics of the ecosystem” also are prohibited. WED probably will not be viewed as an “extractive” activity like offshore oil and gas development or commercial fishing, but it does have impacts on local ecosystem dynamics of varying levels of significance which are being assessed as part of this state-of-the-art international workshop.
Currently off Oregon there are no marine reserves in state or federal waters and ocean zoning is limited to essential fish habitat areas designated by the federal regional Pacific Fishery Management Council and protected from damaging activities under the federal Fisheries Conservation and Management Act. Should more zoning be implemented before WED proceeds? My answer for the short term is no, WED may proceed without additional zoning. I base that conclusion in part on regulations recently adopted by the Oregon Department of State Lands which among other things require that WED in state waters not “substantially impair lawful uses or developments already occurring within the area” such as fishing. Furthermore, Oregon Ocean Resources Management Goal 19 which has the force of law requires that a precautionary approach be used with regard to the scientific uncertainties involved in determining whether there are significant use conflicts or adverse ecosystem impacts. Under the federal Coastal Zone Management Act, both requirements are potentially applicable to federal approval of WED in federal waters off Oregon as well.
Under the framework of Goal 19, when trans-Pacific fiber optic cables laid off Oregon displaced some fishing activity, appropriate compensation for that displacement was negotiated and paid to the affected fishermen as a means of resolving the use conflict. A similar process could be used for fishing activity displaced by the installation and operation of WED facilities offshore and their associated transmission cables to shore.
Over the longer term, expanded ocean zoning off Oregon could offer WED developers security of tenure at preferred seabed, water column, and surface locations through a lessened likelihood that expiring state and federal permits and leases up for renewal would not be renewed and the location allocated to some other use. That additional security of tenure would be supported by the use of zoning to harmonize WED to the maximum extend possible with existing and future uses in the area. In this regard, it is increasingly clear that WED facilities offshore will have to be protected by some form of “no entry” zone.
And if WED does expand up and down the west coast, the 2006 West Coast Governors’ Agreement on Ocean Health specifically supports a coordinated three-state approach to ocean renewable energy development. And on the research side, the three states are developing a Regional Marine Research Plan for the California Current Ecosystem adjacent to all three states. Much of the research funded and carried out pursuant to that plan could be relevant to assessing the potential for and ecological impacts of WED on the west coast and the need for expanded ocean zoning.

161
Are there any downside risks for WED through expanded ocean zoning? Yes, at least in theory. One only has to recall the initial hostile response to the proposed Cape Wind wind farm in federal waters off Massachusetts and the west coast federal and state “zoning out” of any more offshore oil and gas development to the see the possibility of WED being zoned out. And of course further research following up on this workshop might reveal WED impacts which would require mitigation or compensation to affected users, or in a worst-case scenario, lead to WED’s exclusion from certain areas.
But personally, as one concerned like many of you about the environmental implications of our continued heavy reliance on fossil fuels, I am hopeful that room can be made for WED off Oregon and elsewhere.


163
Appendix 5:
Environmental Consequences of Wave Energy Extraction along the Shores of the U.S. Pacific Northwest: The Physical Environment
Paul D. Komara, Jonathan C. Allanb, Jack Bartha, Tuba Özkan-Hallera, Curt Petersonc, Mirko Previsicd, and Keith Kirkendalle aCollege of Oceanic & Atmospheric Sciences, Oregon State University bOregon Department of Geology & Mineral Industries cDepartment of Geology, Portland State University dre vision consulting LLC, Sacramento, CA eNOAA, Portland, OR
Introduction
The wave climate of the Pacific Northwest, the shores of Oregon and Washington, is recognized for its severity, the waves being the product of energy derived from winds blowing across the expanse of the North Pacific. Winter storms reaching this coast commonly generate deep-water significant wave heights1 greater than 10 meters, with the most extreme storms in recent decades having achieved significant wave heights of 15 meters. It is noteworthy that there has been a marked and progressive increase in the wave heights measured by NOAA buoys since they became operational in the mid-1970s, an increase that likely is a response to global warming and can be expected to continue in future decades (Allan and Komar 2006). Within that net decadal increase in wave energies have been marked variations from year to year in storm intensities and their generated waves, which in some cases can be attributed to climate events such as a major El Niño, whereas the causes of other extreme years remain uncertain.
The high waves along this coast have attracted interest as a potential source of renewable energy. Plans are advancing at a 1 The significant wave height is the average of the highest one-third of the measured wave heights, this average having neglected the lowest “insignificant” waves. Measurements show that the highest waves are on the order of 1.5 to 2.0 times as large as the significant wave height.
rapid pace toward the installation of energy-extraction units (“wave farms”) to collect the arriving wave energy and convert it into electrical power that is transmitted to shore by cables. If these initial plans are successful, it is anticipated that they will be followed by a rapid expansion of such systems along the shores of the Pacific Northwest.
Concerns about the impacts of such developments to the physical environment include the consequences of the reduction in wave-energy levels along this shore, potentially affecting the processes and stabilities of the beaches and recreational activities such as surfing. Also of concern are the effects of the structures on ocean currents, which in turn could alter the magnitudes and patterns of sediment transport and accumulation.
Our objective is to summarize our review of the potential consequences of reduced wave-energy levels and modified ocean currents that could result from commercial energy extraction. Our considerations range from the likely changes in sedimentation processes offshore, in proximity to the extraction units, to significant impacts to our beaches and rocky shores with ecological consequences (discussed in other sections of this report).
Energy-extraction technologies
Complicating a review of the issues pertaining to the impacts on the physical

164
environment is the range of designs of wave-energy extraction units. These variously involve buoys floating on the water’s surface, tethered to the seafloor to hold them in position; and massive concrete structures that rest reef-like on the bottom, extracting energy from the waves that pass over them. A variation on the latter that is meant to operate in relatively shallow water is an extraction unit that consists of rigid flaps extending upward from the seafloor. The unit oscillates under the reversing orbital motions of the waves, thereby extracting some of their energy.
As well as differing in their fundamental mechanisms to derive energy from the waves, each unit design is unique in the portion of wave energy that can be extracted, this being the unit’s basic efficiency (as defined for any machine); these efficiencies range from approximately 5% to 20%. Moreover, these units will reflect a portion of the arriving wave energy so it returns seaward rather than reaching the shore; analyses completed for various designs indicate that this could be on the order of 10% to 30%, but ridged structures projecting through the water’s surface could have a reflection approaching 100%. The degree of wave reduction in the lee of the extraction unit depends on both the amount of energy removed to generate electricity and that being reflected. Similarly, the different unit designs will have unique effects on ocean currents and water-column stratification, depending on their size and shape.
The dynamic characteristics of each energy-extracting unit therefore depend on its design, but also on the site of installation including the ranges of wave heights and periods that occur. It is our understanding that these dynamic properties of the units are generally documented by their developers, based on numerical-model analyses of wave interactions with the designed structure, and possibly from scaled-down laboratory wave-basin tests of their responses. While these fundamental characteristics are known by the commercial developers, it generally is the case that this information is proprietary, not being available to other interested parties. It is important that this documentation be made available to the State of
Oregon and interested engineers and scientists; without that availability, assessments of the potential impacts of wave-energy extraction on the physical environment cannot be independently made by others.
Our consideration was directed primarily toward buoy systems and their potential impacts on the physical environment, as they are most feasible for application in the Pacific Northwest, and a buoy system is under development for installation at Reedsport2 on the southern Oregon coast, expected to be “first in the water.” Most of the following discussions therefore focus on those systems that feature the use of multiple buoys placed in an array.
The collective impact of multiple units
Having extracted and reflected energy from the waves arriving from offshore, a single unit will create a “shadow zone” of lowered wave heights in its lee. This reduction is greatest immediately shoreward of the unit, with the waves thereafter progressively recovering some energy as they continue to travel toward the shore, by a process that is termed wave diffraction3. However, the energy gained by the waves in the shadow zone is derived from the adjacent portions of the wave crests, so their heights outside that directly sheltered area are reduced by this diffraction process. The effect of having locally extracted energy from the waves therefore spreads, having started out as the effective width of the extracting unit but progressively widening as the waves move toward the shore. By the time the waves reach
2 The Reedsport Wave Energy Park is being developed by Ocean Power Technology on the southern Oregon coast, about 4 kilometers (2.5 miles) offshore in about 50-meters water depth. The plan is to initially deploy 10 energy-extraction buoys (PowerBuoy) in the summer or fall of 2009, later to be expanded to 200 units. 3 Diffraction is the movement of energy along the crest of a wave due to variations in the height and energy level of the wave (Komar 1998). It is often accompanied by wave refraction where the speed of the advancing wave crest depends on the water depth (fastest where the depth is greatest), resulting in a bending of the crests and changes in their directions of approach to the shore.

165
the beach, the potentially impacted area could have widened considerably, affecting a long stretch of shore, although the degree of wave-height and energy reduction in the line extending from the unit to the shore would not be as great as that which had occurred in the immediate lee of the unit.
The magnitudes of the reduced wave heights become significantly greater and the diffraction patterns more complex when multiple extraction units are present (forming a “wave farm”), as they will always be in commercial systems designed to maximize the derived electrical energy. Each individual unit will tend to produce a wave-diffraction pattern as described above, but their respective modified waves interact and combine as they move toward the shore. This is illustrated in Figure 1, derived from the numerical diffraction/refraction models developed by Venugopal and Smith (2007) to analyze the wave reduction created by a hypothetical series of five extracting units. While the extraction system is hypothetical and its dynamics assumed, the site modeled is the European Marine Energy Centre (EMEC) on the western shore of the Orkney Islands, Scotland, established to become a prototype-testing site for unit designs. The water depths (65 to 2.5 meters) in the analyzed area represent the actual bathymetry of the EMEC, as does the wave climate; the models in Figure 1 are for a deep-water significant wave height of 4 meters and a 10-second wave period.
The examples in Figure 1 for the series of models by Venugopal and Smith (2007) are for an array of five extraction units in a line approximately parallel to the coast (which is rocky and irregular), positioned 3.5 to 4 kilometers offshore in 50-meter water depth. The individual units are bottom mounted and ridged, this “design” having been determined by the numerical models employed, which cannot account for wave-induced motions of the units and therefore cannot be satisfactorily applied to analyses of floating buoys. Each extraction unit in the model is 10 meters wide by 160 meters long, with 160-meter spaces (gaps) where the arriving wave energy can pass through the array.
The series of models involved a range of assumed “porosities”, representing the loss in energy due to wave reflection and the energy extracted by the individual units.
The first model in the series, Figure 1(a), represents the natural condition in the absence of a wave farm. In addition to serving as a comparison where an array is included, this analysis demonstrates that there are natural variations in the significant wave heights in the shoreward direction. The wave heights are affected by the normal shoaling transformations of waves, but in this example there is a marked reduction in wave heights caused by bottom friction. Thus, according to the model results, at this site there is a natural trend of decreasing wave heights in the onshore direction, which locally will be enhanced by the presence of an array of extraction units. The most extreme example is seen in Figure 1(b) where the porosity is close to zero, in effect representing a series of solid structures with short gaps between. It is seen that according to the model, the significant wave heights in the shadow zone are smaller than 1 meter, a substantial reduction from their original 4-meter heights in the offshore.
The third model run, Figure 1(c), is a more realistic assessment of the effects of a series of extracting units, with a porosity = 0.7 having been assumed for the individual units. As expected there are reduced wave heights in the shadow zones of the individual units, but again energy diffracts into those zones from the waves that pass through the gaps. That initial recovery is followed by a general reduction in wave heights in the shoreward direction as the expanding sheltered zones behind the series of 5 units merge, also affected by bottom friction as depicted in Figure 1(a). Overall the reduction in wave heights is noticeably greater than seen for the natural condition in Figure 1(a), but having a complex pattern of variations due to the inclusion of multiple extraction units. It should be recognized that this pattern changes as the heights, periods, and directions of waves arriving from deep water vary from day to day.

166
Figure 1. Model analyses by Venugopal and Smith (2007) of the reduced wave heights shoreward of a
hypothetical wave farm off the Orkney Islands. (a) natural condition in absence of wave farm (b) wave array with porosity close to zero (c) wave array with porosity=0.7.
While these model results were for
hypothetical fixed extraction units placed on the seafloor and for conditions specific to the EMEC in Scotland, the results provide guidance as to
the expected patterns of wave-height and energy reductions in the shadow zone of a wave farm constructed on the U.S. Pacific Northwest coast. However, wave farms will almost always consist

167
of multiple lines of units, with the second line extracting energy that had passed through the first. Typically the second line of buoys would be set shoreward of the first with positions to occupy the gaps in the first line of buoys, extracting energy from the waves that had passed through the gaps. There might be a third line, again offset to occupy the gaps in the second line. Such an array is designed to maximize the wave energy extraction, but it is apparent that there would be a greater reduction in wave heights in its shadow zone compared with that seen in Figure 1 from the models of Venugopal and Smith (2007) for a single line of units. It can therefore be expected that with the development of a full-scale wave farm consisting of a large number of extracting units in a two-dimensional array, there could be significant reductions in wave heights and energies along the coast, potentially extending for kilometers in the shoreward direction and affecting the beaches. Furthermore, the development of numerical models for such an array will be considerably more complex than that for a single line, increasing the uncertainties in the model’s capacity to predict the environmental impacts.
In addition to affecting wave energies and patterns of diffraction and refraction, the presence of a wave farm will become an obstacle to the flow of wind-driven currents in the shallow-water continental shelf, and could alter the structure of the water column (variations in temperatures and salinity with depth). While there will be some effect by individual extraction units, the collective impacts of a large number of units in an array will be important. It is expected that when fully developed, a wave farm would consist of hundreds of units extending along an appreciable length of coast, so there could be a measurable effect on the currents and a modification of the water column. In addition, the water currents in the nearshore—on the ocean beaches—are driven by the waves, so any reduction in wave heights or altered angles of arrival at the shore could change the magnitudes and directions of those currents, in turn affecting the longshore transport of sand on the beaches.
Potential environmental impacts
From the magnitudes of the potential reductions in wave energies and the effects on ocean currents, there is a distinct possibility of there being significant changes in the physical environment resulting from the construction of a wave farm. Analyses like those in Figure 1 provide guidance as to what those impacts might be, and where they would be greatest. However, at this stage in the development of wave farms, this unfortunately remains somewhat speculative. There has been only limited reported use of numerical models extended to assessments of the processes that would be responsible, such as the transport of sediment on the continental shelf and beaches. And of particular importance, no field experiments have documented the impacts of individual unit designs on a prototype scale, and no experience has been derived from the construction of a complete wave farm consisting of multiple units. The objective here is to consider what those impacts might be, framed in the context of the Pacific Northwest.
Environmental changes in the offshore can certainly be expected, particularly in the immediate lee of the wave farm where the wave-height reductions are greatest. From the complicated patterns of the affected waves, evident in Figure 1(c) for even a single line of buoys, it can be expected that there would be a parallel complexity in the responses of the seafloor sediments. That would be further complicated by the presence of superimposed shelf currents (also affected by the wave farm) with the transport of sediment and resulting patterns of erosion versus sediment deposition being the product of the combined waves and currents. There are numerical models that have been developed to quantitatively evaluate sediment transport rates under combined waves and currents, so there is the potential that model analyses can be expanded to assess the changes in sediment-transport patterns in the shadow zone of a proposed wave farm. With the wave energies on average being reduced, there would be a tendency for sediments to accumulate in the lee of the array, producing some shoaling and possibly a change in grain sizes of the bottom

168
sediments (likely a shift to finer sediment, and possibly a change from a rocky seafloor to sand). Those changes would have a feedback effect on the processes, for example altering the patterns of wave refraction if shoaling had significantly changed the water depths. Such a modification of the wave refraction would be carried to the shore, the altered angles of waves breaking on the beaches affecting the longshore currents and sand transport.
It is unfortunate that there have been only limited investigations of sediment-transport processes on the continental shelves of the Pacific Northwest, and research elucidating the causes of long-term sediment erosion areas versus accumulation areas. The one region of concentrated research has been that in proximity to the mouth of the Columbia River (the Columbia River Littoral Cell), but the extrapolation of its results to the Oregon continental shelf is uncertain, there being no counterpart to the Columbia River and therefore only limited sources of sediment. Although numerical models may eventually include assessments of sediment transport affected by the construction of a wave farm, their predictions for the Oregon coast would be uncertain. For example, while it can be expected that there would be sediment accumulation in the shadow zone of a wave farm, it is doubtful whether one could predict with confidence whether that sediment was transported there by shelf currents modified by the array, or was carried offshore from the ocean beach.
The range of beach processes can be expected to be directly affected by the installation of a wave farm, as most of those processes in shallow water are driven by the heights and energies of the waves (Komar 1998). With a reduction in wave heights on the beaches, surf-zone widths could be significantly reduced from their natural widths. The magnitudes of the longshore currents and sand-transport rates could also experience reductions because they depend on the heights of the breaking waves. As indicated above, changes in wave refraction and shoaling would affect the angles at which the waves break on the beaches,
also altering the nearshore currents and sand-transport rates, and in some instances even their directions along the shore. This potentially could produce significant shifts in the shorelines, with erosion focused along some stretches of beach and accumulation of eroded transported sand widening other stretches of beach.
Only recently have researchers begun to analyze the consequences of the energy reductions by a wave farm, having extended the analyses to the shore to assess the wave-height reductions. Miller et al. (2007) have undertaken such investigations, though still limited in scope: analyses of the potential impacts of the future development of the Wave Hub system off the coast of southwest England. The proposed site would be at a depth of 50 to 60 meters, but well offshore, some 20 kilometers seaward of St. Ives Bay, Cornwall. The objective of their study was to estimate how much the shoreline wave climate would be changed; specifically, the analyses were for the 10-meter water depth contour, but did not actually address the effects on the beaches (even though “the sensitivity of shoreline change” is part of the title of their paper). In many respects their investigation was comparable to that of Venugopal and Smith (2007) discussed above, having focused on the magnitudes and patterns of the combined wave diffraction and refraction of the reduced waves in the shadow zone as the waves move toward the coast. The analyses by Miller et al. (2007) were again for a hypothetical wave farm, because it has not been determined which extraction-unit technology will be used. The primary advance of their study was that their analyses included the full range of wave heights, periods, and directions for the coast of Cornwall, with results provided for the wave-height reductions at the 10-meter depth for nearly a 100-kilometer length of that coast. Their overall conclusion was that the wave-height reductions would be small, and “There is little cause for concern that effects introduced by the Wave Hub will be felt by shoreline users of the sea.” (Miller et al. 2007, p. 900). However, this conclusion cannot be extended to all wave farms, it largely being the result of the 20-kilometer offshore distance of the proposed Wave Hub site. Their investigation does serve

169
as an example of the types of analyses that are needed to assess the potential impacts of a wave farm on a coast, but it is also necessary to consider the changes in the range of beach processes and the potentially induced shoreline erosion.
It can be expected that there will be consequences from the construction and operation of wave farms to people who live along the coast and those who visit for recreation. There likely will be positive reactions by some individuals to the prospects of the reduction in wave energies at the shore, particularly those who own shore-front properties and believe that this will reduce their threat of erosion by winter storms. That broadly will be the case, but as noted above, in detail the changes in wave energies and beach widths will be more complex than that simple view. Furthermore, there can be expected to be impacts that are more definitely negative. In particular, the reduction in wave heights will not be welcomed by most surfers. The existence of high-energy surf is also important to the mixing and dilution of pollutants that reach the nearshore, with the seaward-directed rip currents flushing them offshore. With coastal pollution increasingly becoming a problem along the Oregon and Washington shores, it could be exacerbated by the reduction in wave-energy levels. Significant negative impacts could also occur along the rocky shores, to the tidepool life that is adapted to the presence of high waves and depends on their oscillations and wave-driven currents for the delivery of food and dispersal of their larvae (discussed in other sections of this report).
It is our conclusion that the potential impacts of wave-energy extraction to the physical environment could be extensive. It is important that research be directed toward these possible consequences, drawing on the studies being undertaken on other coasts, as well as along the shores of Oregon and Washington.
Monitoring the environmental responses
Extreme waves and currents will be experienced by wave farms developed along the
coast of the Pacific Northwest, with the environmental responses likely exceeding those produced by installations on other coasts. This will place special demands on their designs, and as discussed here, require the implementation of a program to document the resulting environmental responses. Such a program would be more than simple “monitoring”— instead it should be viewed as being an “experiment,” conducted so that future designs can benefit from the experiences at the developed wave-farm sites and reduce impacts to the physical environments and ecosystems.
The wave farm designs for the Pacific Northwest, as elsewhere, will be based in large part on numerical models. It was seen in the above review that the models applied thus far have focused on analyses of the wave diffraction and refraction, beginning with the reduced wave heights after a significant portion of their energy has been extracted, and following the waves as they move toward the shore. For the most part those wave models should yield reasonable results when applied to the Pacific Northwest. However, as discussed by Venugopal and Smith (2007), problems remain if the analyses need to include the dynamics of the energy-extraction units, as would be the case when the units consist of buoys whose motions have a feedback effect on the waves. This may be important on the Pacific Northwest coast in that energy-extracting buoys are likely the most viable technology.
Applications of wave diffraction/refraction numerical models require accurate data on water depths, the bathymetry of the seafloor. This is seldom available from surveys along the Pacific Northwest coast with the desired accuracy and of recent vintage, particularly for the intermediate water depths from 50 meters to the shore and including profiles of the beaches at the site of interest. Hence, the program of data collection in any proposed development site needs to be initiated during the design stage to supply the required depth surveys and preconstruction data that is also needed for comparisons with the environmental changes that occur following construction.

170
Particularly problematic in the design process will be the use of numerical models applied to analyze the transport of sediment by the modified waves and currents, to predict areas of seafloor erosion or sediment accumulation. As discussed above, in general the application of such models is a challenge with the results uncertain, being even more so in applications to the Pacific Northwest due to the extreme energy levels of the processes, well above those included in the testing and calibration of the models. This includes the models applied to the processes and morphologic responses of the Pacific Northwest beaches. Our experience is that their results may be particularly unreliable, since the physics of the processes on these high-energy, low-sloping (dissipative) beaches differ significantly from laboratory wave tanks and low-energy beaches (e.g., U.S. East Coast and European) where those models have been tested.
As things stand there will be significant levels of uncertainty in the design of wave farms to be constructed in the Pacific Northwest. It is therefore important that the ensuing responses of the environments be carefully documented, at least for the first few developments that will serve as tests of the designs and impacts. In view of this importance we considered what would be needed to document the changes in the processes and environmental responses, the scope of a monitoring program. This consideration was directed specifically toward the wave farm being proposed for development at Reedsport, because it is expected to be the first, though our recommended “experiment” could have been directed toward any proposed wave farm in the Pacific Northwest.
The components of the experiment are depicted schematically in Figure 2. The depth contours represent 10-meter increments, with the rectangular box being the aerial extent of the proposed energy-extraction array. The critical component of the recommended measurement program is directed toward a documentation of the waves and currents in the sheltered lee of the wave farm, guided at this stage by the model results in Figure 1 and to be refined once similar analyses have been completed specifically for this development site. From the complex
patterns of the reduced waves seen in Figure 1, it is apparent that the wave-measurement sites in Figure 2 need to span what is expected to be the approximate width of the expanding wave-diffraction zone shoreward of the wave farm. An additional two sites up- and down-coast from the diffraction zone are included to measure the natural changes in waves and currents beyond the impacts of the proposed wave farm. Each data-collection system would be equipped to measure wave heights, periods, and directions at hourly intervals, the times corresponding to measurements being collected in deep water offshore by the National Data Buoy Center of NOAA.
In addition to measuring the waves at each of these sites, the mean currents also need to be measured to determine the extent to which they are modified by the drag of the array of multiple buoys. Two of the data-collection systems in Figure 2 are designated for measuring water temperatures and salinities, relevant to interpretations of the origins of the measured mean currents and potential changes in the upper-ocean structure. The data derived from this core set of measurements would be fundamental to documenting the effects of the wave farm on ocean processes, and would serve as the basis for analyses of the resulting environmental (and biological) alterations experienced at this site.
Accompanying this documentation of the changes in waves and currents would be surveys of the altered seafloor bathymetry and bottom sediments. Surveys of the water depths can realistically be undertaken only with personal watercraft (jet-skis), because the depths range from 50 meters offshore to the shallow-water surf of the beaches. The use of jet-skis in such surveys has been shown to yield good bathymetric data, including that in studies along the Oregon and Washington coasts (Ruggiero et al. 2005). Surveys of the dry portions of the beaches are also needed, and thanks to the recent development of Global Positioning System (GPS) survey technologies this can be accomplished at relatively little expense. The beach surveys can extend to wading depths, overlapping with the jet-ski surveys, but

171
Figure 2: Sketch of the recommended monitoring program directed toward the proposed wave farm at
Reedsport, Oregon.
undertaken at least on a monthly basis to account for the seasonal cycles in beach profiles experienced along the Pacific Northwest coast (Komar 1997). As noted above, surveys offshore and on the beaches need to be initiated prior to the construction of the wave farm, in order to document the natural conditions before development.
Figure 2 includes a sampling program for the periodic collection of seafloor sediments, to document their changes in response to the construction of the wave farm. Data would be related to the altered seafloor bathymetry and provide evidence for whether the sediment source was offshore or from the landward beaches. Such a sampling program is also expected to be important to investigations of potential changes in the bottom fauna, so any sampling program needs input from marine biologists; that shown in Figure 2 is only a tentative suggestion. If in the design stage the analyses indicate that significant degrees of seafloor erosion or sediment accumulation can be anticipated from the construction of the wave farm, it is recommended that several cores be collected across the study area, to be analyzed to
determine the site’s long-term history of sedimentation (hundreds of years to a thousand years).
There are additional components in Figure 2 that if included in the monitoring would considerably improve documentation of the effects of the wave farm on the physical environment. First, radar measurements of water currents, based on analyses of the effect of currents on wave advance, have demonstrated that this technology can provide detailed documentation of the water currents across the entire area, beyond the few sites where direct measurements from in situ data-collection systems are obtained (McGregor et al. 1998, Bell et al. 2004, Kosro 2005). Also depicted is the inclusion of a video tower, the analyses of video records having become common for measuring beach processes (e.g., longshore-current velocities and runup levels of waves at the shore). This technique can also provide documentation of the changing bathymetry of the beaches, especially needed during storms when wave energies are too extreme for jet-ski surveys (Holland et al. 1997, Holman and Stanley 2007).

172
We believe it is imperative that monitoring and experiments as outlined here be undertaken at the first few sites developed along the Pacific Northwest coast. The estimated costs of such an undertaking would be relatively minor in comparison with the costs of design and construction. At the same time the demands and complexity of such an undertaking should not be underestimated; a team of experienced investigators will be required.
Summary and discussion
At this stage in the development of wave farms along the shores of the Pacific Northwest we are close to “flying blind.” There has been little experience in the design, construction, and operation of such systems along the world’s coastlines, so we have little to guide us on the Pacific Northwest coast. To date detailed consideration and analyses of the potential environmental impacts of wave energy extraction have been minimal during the design stage, but what few analyses have been completed imply that they could be significant. Most lacking is documentation of the impacts of constructed prototypes on the physical (and biological) environments, although it is understood that monitoring of European sites is underway. Therefore, the development of wave farms along the Pacific Northwest coast should proceed with caution. During the design process, analyses should include projections of the potential environmental consequences, and prior to and following construction the installation should be monitored through the implementation of a data-collection program along the lines of that depicted in Figure 2.
Specific findings of this review of the potential changes in the physical environment include the following:
• Numerical models of the wave reduction by wave farms indicate that wave heights in the sheltered lee of the structure could be significantly lowered, and the patterns of diffraction and refraction of the waves as they move toward the shore would be complex, extending for at least 10 kilometers with
consequences to the beaches (both negative and positive).
• There is a need for field investigations of the environmental changes that result from the construction of wave farms. This is critical for wave farms constructed on the coast of the Pacific Northwest, due to its extreme waves and currents and the fairly unique processes and responses of its beaches.
• Based on evidence from numerical models that have analyzed wave reductions shoreward of typical wave farms (Venugopal and Smith 2007, Miller et al. 2007), it is probable that lowered waves will be experienced on the beaches of the Pacific Northwest, affecting a range of natural processes and the recreational activities of beach visitors.
The high wave energy along the shores of the Pacific Northwest has considerable potential as a renewable resource. On the other hand, there are potential environmental consequences, especially when those developments achieve their fully planned-for extents, with each wave farm potentially consisting of hundreds of energy-extracting units extending for kilometers along the shore. It is important that we have a better understanding of these potential consequences before the implementation of whole-scale deployment along the Pacific Northwest coast. To accomplish this, a dialog needs be established between the developers of the proposed wave farms, specifically their engineers and scientists responsible for the technical analyses, and experts in those areas available at the state universities and government agencies. There is considerable experience available from those local experts, including applications of the most advanced numerical models available for analyses of the effects of a wave farm on the waves and currents, the collection and analysis of field data for the waves and currents, and investigations of the sediment and morphology responses on the continental shelf and beaches. As reviewed here, the development of a wave farm is a complex technological undertaking with

173
uncertain environmental consequences. It is important that we work together to address these issues.
Literature Cited
Allan, J. C., and P. D. Komar. 2006. Climate controls on US West Coast erosion processes. J. Coastal Res. 22:511–529.
Bell, P. S., J. J. Williams, S. Clark, B. D. Morris, and A. Vila-Concejo. 2004. Nested radar systems for remote observations. J. Coastal Res. Special Issue 39.
Holland, K. T., R. A. Holman, T. C. Lippmann, J. Stanley, and N. Plant. 1997. Practical use of video imagery in nearshore oceanographic field studies. J. Ocean Eng. 22:81–92.
Holman, R. A., and J. Stanley. 2007. A history and technical capabilities of Argus. Coast. Eng. 54:477–491.
Komar, P. D. 1997. The Pacific Northwest Coast: Living with the shores of Oregon and Washington. Duke University Press, Durham, North Carolina.
Komar, P. D. 1998. Beach processes and sedimentation. 2nd edition. Prentice Hall, New Jersey.
Kosro, P. M. 2005. On the spatial structure of coastal circulation off Newport, Oregon, during spring and summer 2001 in a region of varying shelf width. J. Geophys. Res. 110:C10S06, Online at http://dx.doie.ort [DOI number 10.1029/2004JC002769, accessed 1 March 2008].
McGregor, J. A., E. M. Poulter, and M. J. Smith. 1998. S band Doppler radar measurements of bathymetry, wave energy fluxes, and dissipation across an offshore bar. J. Coastal Res. 103:28779–18789.
Miller, D. L., H. C. M. Smith, and D. E. Reeve. 2007. Modelling analysis of the sensitivity of shoreline change to a wave farm. Ocean Eng. 34:884–901.
Ruggiero, P., G. M. Kaminsky, G. Gelfenbaum, and B. Voight. 2005. Seasonal to interannual morphodynamics along a high-energy dissipative littoral cell. J. Coastal Res. 21:553–578.
Venugopal, V., and G. H. Smith. 2007. Wave investigation for an array of wave power devices. In Proc. 7th European Wave and Tidal Energy Conference, Porto, Portugal, 11–13 September 2007.
