ecological and social impacts of photovoltaic solar …„skylÄ studies in biological and...
TRANSCRIPT

JYVÄSKYLÄ STUDIES IN BIOLOGICAL AND ENVIRONMENTAL SCIENCE
338
Ecological and Social Impacts of Photovoltaic Solar Power Plants
and Optimization of their Locations in Northern Chile
Anna Suuronen

JYVÄSKYLÄ STUDIES IN BIOLOGICAL AND ENVIRONMENTAL SCIENCE 338
Anna Suuronen
Ecological and Social Impacts of Photovoltaic Solar Power Plants
and Optimization of their Locations in Northern Chile
Esitetään Jyväskylän yliopiston matemaattis-luonnontieteellisen tiedekunnan suostumuksellajulkisesti tarkastettavaksi yliopiston Ambiotica-rakennuksen salissa YAA303,
marraskuun 24. päivänä 2017 kello 12.
Academic dissertation to be publicly discussed, by permission ofthe Faculty of Mathematics and Science of the University of Jyväskylä,
in building Ambiotica, hall YAA303, on November 24, 2017 at 12 o’clock noon.
UNIVERSITY OF JYVÄSKYLÄ
JYVÄSKYLÄ 2017

Ecological and Social Impacts of Photovoltaic Solar Power Plants
and Optimization of their Locations in Northern Chile

JYVÄSKYLÄ STUDIES IN BIOLOGICAL AND ENVIRONMENTAL SCIENCE 338
Anna Suuronen
Ecological and Social Impacts of Photovoltaic Solar Power Plants
and Optimization of their Locations in Northern Chile
UNIVERSITY OF JYVÄSKYLÄ
JYVÄSKYLÄ 2017

EditorsAnssi LensuDepartment of Biological and Environmental Science, University of JyväskyläPekka Olsbo, Ville KorkiakangasPublishing Unit, University Library of Jyväskylä
Jyväskylä Studies in Biological and Environmental ScienceEditorial Board
Jari Haimi, Anssi Lensu, Timo Marjomäki, Varpu MarjomäkiDepartment of Biological and Environmental Science, University of Jyväskylä
Permanent link to this publication: http://urn.fi/URN:ISBN:978-951-39-7248-6
URN:ISBN:978-951-39-7248-6ISBN 978-951-39-7248-6 (PDF)
ISBN 978-951-39-7247-9 (nid.)ISSN 1456-9701
Copyright © 2017, by University of Jyväskylä
Jyväskylä University Printing House, Jyväskylä 2017

ABSTRACT
Suuronen, Anna Ecological and social impacts of photovoltaic solar power plants and optimization of their locations in Northern Chile Jyväskylä: University of Jyväskylä, 2017, 31 p. (Jyväskylä Studies in Biological and Environmental Science ISSN 1456-9701; 338) ISBN 978-951-39-7247-9 (nid.) ISBN 978-951-39-7248-6 (PDF) Yhteenveto: Aurinkovoimaloiden ekologiset vaikutukset ja kestävän kehityksen huomioiva sijoittelu Pohjois-Chilessä Diss.
Large scale photovoltaic (PV) solar power plants are gaining popularity in Chile. Solar energy potential in northern Chile is one of the best worldwide and true deserts are considered ideal environments for solar power plant projects. Atacama Desert is one of the driest places on earth. Nevertheless, northern Chile is home for many endemic species with 40 different vegetation types. The thesis presents studies of ecological effects (I-II) and location optimization of PV solar power plants in northern Chile (III). For ecological impacts two types of PV solar power plant technologies were studied: fixed mount solar plant and solar-tracking mounts. Study units were placed below the mounts or between the panels. Reference area was outside the panel area. Arthropod species composition was altered between shade and sun conditions at fixed mount power plant and, for example, dipterans were more common in shade conditions. Fixed mount solar power plants’ shade conditions can act as refuge to some arthropod groups, but for vegetation, shade conditions can disturb their florescence. Abiotic conditions limited local spider species habitat selection, but invasive spider species Lactrodectus geometricus could colonize mount legs of entire plant. Precaution should be taken when planning PV projects in areas with sensitive nature. Northern Chile is an ideal place for solar power plant projects because of its high solar energy potential but environmental and social aspects of site selection should be considered. Ideal places with low environmental and landscape value are in the absolute desert situated in the central valley starting from Arica and reaching until the northern part of Atacama region. Nevertheless, cities and historical sites should be avoided. The results of this thesis provide new information about ecological environment of PV plants and gives alternatives to multidisciplinary site selection.
Keywords: Arthropods; Atacama Desert; ecological impacts; environmental-social effect; photovoltaic solar power plant; site selection; sustainable energy.
Anna Suuronen, University of Jyväskylä, Department of Biological and Environmental Science, P.O. Box 35, FI-40014 University of Jyväskylä, Finland

Author’s address Anna Suuronen Department of Biological and Environmental Science P.O. Box 35 FI-40014 University of Jyväskylä Finland [email protected]
Supervisors Professor Jussi Vilho Kalevi Kukkonen Department of Biological and Environmental Science P.O. Box 35 FI-40014 University of Jyväskylä Finland
Professor Markku Kuitunen Department of Biological and Environmental Science P.O. Box 35 FI-40014 University of Jyväskylä Finland
University Lecturer Anssi Lensu Department of Biological and Environmental Science P.O. Box 35 FI-40014 University of Jyväskylä Finland
Reviewers University Lecturer Timo Vuorisalo Department of Biology FI-20014 University of Turku Finland
Docent Pedro Cardoso Finnish Museum of Natural History P.O. Box 17 FI-00014 University of Helsinki Finland
Opponent Professor Jukka Käyhkö Department of Geography and Geology FI-20014 University of Turku Finland

CONTENTS
ABSTRACT
LIST OF ORIGINAL PUBLICATIONS
1 INTRODUCTION ..................................................................................................... 7 1.1 Sustainable development ................................................................................ 7
1.1.1 Renewable energy.................................................................................. 7 1.1.2 Solar energy ............................................................................................ 8
1.2 Solar energy impacts ........................................................................................ 9 1.2.1 Environmental impacts ......................................................................... 9 1.2.2 Social impacts ....................................................................................... 10
1.3 Location optimization of PV plants ............................................................. 10
2 OBJECTIVES ............................................................................................................ 12
3 MATERIAL AND METHODS .............................................................................. 13 3.1 Study Sites ....................................................................................................... 13 3.2 Studied PV plants ........................................................................................... 14 3.3 Study methods ................................................................................................ 15
4 RESULTS AND DISCUSSION .............................................................................. 17 4.1 Microclimate of PV plants ............................................................................. 17 4.2 Ecological environment of PV solar power plants .................................... 18 4.3 Location optimization of PV plants in northern Chile .............................. 20
5 CONCLUSIONS ...................................................................................................... 21
Acknowledgements ............................................................................................................ 23
YHTEENVETO (RÉSUMÉ IN FINNISH) .................................................................... 25
REFERENCES .................................................................................................................. 28

LIST OF ORIGINAL PUBLICATIONS
The thesis is based on the following original papers, which will be referred to in the text by their Roman numerals I-III.
Anna Suuronen had the original ideas of the studies and Anssi Lensu, Markku Kuitunen and Jussi V.K. Kukkonen helped to plan the field work. Suuronen was the main writer of the manuscripts and did the statistical analyses with the help of Anssi Lensu and Christian Muñoz-Escobar. Muñoz-Escobar participated in writing the manuscripts I and II, and he did part of the statistical analyses of the same manuscripts. Anssi Lensu gave several notes and comments to manuscripts I, II, and III and corrected the language. In addition, Markku Kuitunen gave notes to manuscripts I and II, and gave the idea of survey study in the III manuscript. Marcelo Miranda helped to plan the manuscripts I and III. Anna Suuronen realized the field work and identified the arthropod groups together with Marcos Ferrú, Andrés Taucare-Ríos, Pablo Espinoza Astudillo and Natalia Guajardo Celis. Natalia Guajardo Celis and Rodrigo Andrade-Alvear assisted in the field work. In addition, Andrade-Alvear realized survey questionnaires together with Suuronen. Marcelo Perez gave several notes and comments on manuscript III.
I Suuronen A., Muñoz-Escobar C., Lensu A., Kuitunen M., Guajardo Celis N., Espinoza Astudillo P., Ferrú M., Taucare-Ríos A., Miranda M. & Kukkonen J.V.K. 2017. The influence of solar power plants on microclimatic conditions and the biotic community in Chilean desert environments. Environmental management 60(4): 630–642.
II Suuronen A., Muñoz-Escobar C., Lensu A., Andrade-Alvear R., Taucare-Ríos A., Kuitunen M. & Kukkonen J.V.K. Biota responses to solar Power Plant Environment in the Valley of Copiapó, Chile. Submitted manuscript.
III Suuronen A., Lensu A., Andrade-Alvear R., Kuitunen M., Miranda M., Perez M., Ferrú M. & Kukkonen J.V.K. Optimization of photovoltaic solar power plant locations in northern Chile. Submitted manuscript.

1 INTRODUCTION
1.1 Sustainable development
1.1.1 Renewable energy
Sustainable development (Brundtland 1989) is described as development that meets the needs of current demands, but does not compromise the future demand so that also future generation can meet their needs (Brundtland 1989, Omer 2008a). International agreements such as the World Summit on Sustainable Development in Johannesburg (2002) and Paris Agreement (United nations 2015) were ratified to promote the goals of sustainable development (Omer 2008a). There are many factors when considering sustainable development, but energy demand is one of the essential factors. Traditional energy sources have many problems including global warming, air pollution, acid precipitation, forest destruction, and emission of radioactive substances (Dincer 2000).
Climate change is a consequence of human activities where fossil fuels are used and carbon dioxide (CO2), among many other greenhouse gases, is emitted (Omer 2008a). To mitigate the harmful effects of energy production, requirement is that the energy resources must be fully sustainable (Dincer and Rosen 1998, 2011). Therefore, renewable energy is the most effective and efficient solution to sustainable development because it´s almost emissions free (Dincer 2000, Omer 2008a).
Sustainable development not only considers emission free energy supply, but also energy efficiency (Dincer 2000) and energy saving (Omer 2008b). In fact, all energy production has environmental impacts, but if negative impacts are thought to be small compared to the amount of produced energy, it is sustainable energy. Sustainable energy is described as energy that has minimal negative impact on human health and the healthy functioning of vital ecological systems during the production or consumption phase (Omer 2008b). Sustainable development requires that sustainable energy can be used to all

8
tasks without negative social impacts. Nevertheless, sustainable energy should meet the needs of cost effectiveness (Dincer 2000).
Constant environmental degradation is not sustainable over time and can lead to various health, ecological, and other problems. Utilization of renewable energy sources has much less environmental impacts because the energy resources are not depleted unlike fossil fuel or uranium resources. In addition, renewable energy decentralizes the energy supply and gives more flexibility to energy consumption. Because many renewable energy technologies are based on solar radiation, such as winds or waves, energy sources are available without extraction and consumption (Dincer 2000). Renewable energy forms are constantly supplemented and, therefore, they do not run out (Elliot 2000). Energy supply derives ultimately from the Sun, or in case of geothermal energy, Earth’s internal heat supply (Kelly 1993).
1.1.2 Solar energy
Solar energy is considered environmentally most advantageous among renewable energy resources, considering that it is noiseless, CO2 free during operation, scale flexible, and operation and maintenance are considered straightforward (Wang and Qiu 2009). There are three solar energy forms: Solar-thermal panels, solar photovoltaic (PV) panels, and solar power plants (Afgan et al. 1998), which can be either solar-thermal or photovoltaic. Solar-thermal techniques concentrate sun light to heat fluids that drive turbines (De Laquil et al. 1993). In contrast, PV converts sun light directly into electricity (Kelly 1993). Since solar energy potential varies between locations, lack of solar radiation data is a critical problem. Equipment that measures solar radiation are expensive and evaluating solar energy potential at remote places is difficult (Omer 2008b). Fortunately, the price of solar energy per kWh has decreased because of improved solar cell efficiency and because prices have gone down due to improvements in manufacturing-technology. Consequently, lower prices have enabled solar electric energy share of markets to grow (Carrasco et al. 2006).
The basic unit device in a PV system is a PV cell. Cells can be grouped to form panels, and arrays can be formed from one panel or several panels, which are connected in series or parallel to form large PV systems (Villalva et al. 2009). Earth movement changes solar radiation diurnally and seasonally. Fixed mounts are facing the Sun with a locally chosen optimal angle; however, in sun tracker systems the solar panels turn optimizing the orientation to the Sun (Mousazadeh 2009). For example, a “One axis three position sun tracking PV module” has three positions: morning, noon, and afternoon (Huang and Sun 2006). Nevertheless, the tracking system consumes 2–3 % of produced energy and, therefore, is not suitable for small solar power plants (Mousazadeh 2009).
9
1.2 Solar energy impacts
1.2.1 Environmental impacts
Solar energy technologies (SET) have positive environmental impacts when compared to conventional energy, for instance, reduction of the greenhouse gas emissions (CO2, N2O, CH4, etc.), and prevention of toxic gas emissions (SO2, particulates). In addition, SETs can reduce transmission lines of electricity grids (Tsoutsos et al. 2005). Unfavourable effects are considered usually minor and they can be minimized. These effects are site specific and are depending on SET project type (Tsoutsos et al. 2005, Turney and Fthenakis 2011). In addition, an environmental impact of solar power plants depends on distance from sensitive ecosystems (Tsoutsos et al. 2005).
PV panel production is energy intensive and causes depletion of some natural resources, because bulk semiconductor material is needed in high quantities (Tsoutsos et al. 2005). Some PV cell types contain hazardous materials (such as CdTe modules), although their release to the environment is not common since that would require a fire, for example.
Impacts on wildlife are largest during the construction phase of solar power plants. Despite the fact that PVs themselves are noiseless, the construction phase causes some intensive noise (Tsoutsos et al. 2005, Wu et al. 2014). In addition, construction increases dust formation (Lovich and Ennen 2011) and vibration (Wu et al. 2014). During the construction, soil is removed alongside its flora and fauna. Inherent biological soil crusts are turned over and the soil becomes vulnerable to soil erosion (Wu et al. 2014), and water infiltration rate changes (Lovich and Ennen 2011). Recovery of the ecosystem may require many years (Turney and Fthenakis 2011), especially in deserts where recovery is slow (Tsoutsos et al. 2005). For the above reasons, it takes time for flora and fauna to return during the operational phase (Wu et al. 2014). In addition, solar plants are enclosed by a fence, which limits the movements of some animals. Therefore, solar power plant can also change habitat quality, migration routes, and cause habitat fragmentation (Turney and Fthenakis 2011).
Positive effects for wildlife are also possible (Turney and Fthenakis 2011). Shade of the panels can offer a beneficial microclimate to vegetation (Tsoutsos et al. 2005, Wu et al. 2014). SETs can increase the albedo of a desert environment, which could change the local temperature and precipitation patterns through wind speed changes and evapotranspiration (Lovich and Ennen 2011). If panels are cleaned with water, impact can be extensive in desert environments where lack of water is normally a problem (Charabi and Gastli 2011). On the other hand, solar power plant environments can be fragile to exotic species invasion (Lovich and Ennen 2011). Despite the fact, that construction phase causes notable disruptions to wildlife and habitat, wildlife and ecosystem impacts are poorly understood (Turney and Fthenakis 2011).

10
Typical characteristic of invasive species invasions is that they can be better fit to their environment than local endemic species (Lozon and Maclsaac 1997, Vellend et al. 2007). Invasive species can compete directly for the same space with the endemic species or they can indirectly affect the resources available to species (Tilman 1982). These changes can affect the whole ecosystems. When anthropogenic effect, for example the construction of solar power plant facility, is introduced to some habitat, it creates a new kind of anthropogenic environment (Vellend et al. 2007).
1.2.2 Social impacts
Social impacts are not easy to define and they are often left with less attention than environmental impacts because measurement methods are slow and complicated (Daniel 2001, Sevenant and Antrop 2009). Most important social impacts of solar power plants are public acceptance, job creation, and social benefits (i.e. progress of the region, income, health benefits of improved air quality, etc.) (Wang et al. 2009). Other positive socio-economic benefits are that solar energy projects increase regional or national energy independence, increase work opportunities, diversify and secure energy supply, deregulate energy markets, and can promote rural electrification in developing countries (Tsoutsos et al. 2005).
Among social impacts, public acceptance of RES is often related to landscape (Olson-Hazboun et al. 2016). However, landscape has both cultural and environmental aspects: Diverse landscape can maintain more biodiversity along with aesthetic and cultural value. Therefore, landscape should be integrated as one of the socio-ecological impacts (Azar et al. 1996) or be divided into ecological landscape and visual landscape (Daniel 2001).
With the help of the visual landscape planning, cultural heritance and aesthetics can be protected. Visual impacts are dependent on the type of surroundings and landscape where the PV system is installed. As with the environmental impacts, the amount of social impact depends on the location. Near natural beauty and cultural heritage areas, PV installations usually have a strong negative impact (Tsoutsos et al. 2005). Naturally, this may lead to public resistance and negative attitudes towards solar energy. Even though renewable energy has become a part of visual landscape in many countries (Antrop 2005), renewable energy can divide public opinions so that some people experience them positively, while others may reject the installations (Yonca Aydin et al. 2010).
1.3 Location optimization of PV plants
Physical characteristics of a site and its economic factors define the best locations to the PV plants (Arán Carrion et al. 2008, Charabi and Gastli 2011). True deserts are considered as optimal sites for SETs because they have little

11
cloud cover, scarce amount of biomass and low human population. However, desert scrublands have the same kind of biodiversity as grasslands or farmlands (Turney and Fthenakis 2011). Nevertheless, in site selection or location optimization it is essential to mitigate the negative impacts of RES facilities (Tsoutsos et al. 2005). Beside solar radiation, physical aspects include: temperature, orientation of the ground, slope, and distances to the roads and substations of grid (Arán Carrion et al. 2008). Costs can be diminished if PV plant is built into close proximity to roads and already existing electric grid. In addition, former land use affects the magnitude of PV project’s impacts (Arán Carrion et al. 2008, Charabi and Gastli 2011).
Diminishing the negative environmental effects, high biodiversity areas should be avoided (Tsoutsos et al. 2005). High biodiversity does not mean only the number of species, also rare and endemic species should be included (Ayyad 2003, Rey Benayas and de la Montaña 2003, Mittermeier et al. 2003, Kier et al. 2009). Number of guilds, variety of life cycles and diversity of biological recourses are other dimensions of biodiversity, which are unique to arid environments (Ayyad 2003). Many desert species are dormant and become active after rainfall (Chesson et al. 2004). Nevertheless, in some desert environments rain does not fall every year (Tracol et al. 2011). Biodiversity assessments of those environments may be neglected, yet they can possess even endangered species (Ayyad 2003, McNeely 2003). In addition, ecosystems rarity should not be overlooked because conservation of whole ecosystems also protects the species in them (Saunders et al. 2002, Roberts et al. 2003). Nevertheless, biomass is used to characterise ecosystems, although only few species form the bulk of biomass (Walker et al. 1999). Most important ecosystems are usually converted to world heritage sites, Ramsar sites, national parks, private protected areas, etc. (Dubley 2008). Natural places, such as rivers and their biota possess also natural beauty value (Meitner 2004).
Analysing the scenic and environmental landscape, observation points define visibility (O´Sullivan and Turner 2001). Visibility of a target depends on its size and location, and analysis of visibility is often over or under estimated (Ogburn 2006). Therefore, visibility of a PV plant depends of its size and the topography of the surroundings. Visual impact varies also according to the hours of visibility to an observer. Therefore, PV plants close to big cities have more observers and the impact becomes bigger (Fernandez Jimenez 2015).
Despite of positive public acceptance of renewable energy, seeing the installations on the field can cause resistance (Wüsterhagen et al. 2007, Yonca Aydin et al. 2010). Gaining the public support and stakeholders’ acceptance of PV projects is crucial to sustainable development, and with careful site selection future conflicts can be avoided (Wüsterhagen et al. 2007).

2 OBJECTIVES
The present thesis aims to promote construction of PV solar power plants in a sustainable manner and understand their effect on Atacama Desert environment. Very little is known about solar power plants’ microclimate and it’s’ effect on the local biota. Especially ecological and social aspects of solar power plants are not yet studied comprehensively (Turney and Fthenakis 2011). Therefore, the present thesis aims to understand ecological events in two different power plants (I, II). Effects were observed through changes in biodiversity, arthropod species composition, and plant allocation, and how much microclimate conditions were responsible for the observed ecological changes (I, II). In addition, habitat selection of web building spiders was observed (II). The objectives of the thesis were to 1) describe the microclimate of two different PV solar power plants, 2) study changes in biodiversity of arthropods, species composition, and interactions in the PV solar power plant environment. It is expected that microclimate is more cool and humid under the panels especially when the panels are fixed. Most likely, microclimatic conditions create favourable conditions to arthropod species in desert environment. Finally, 3) favorable locations for PV solar power plant projects in northern Chile is suggested. To get a comprehensive understanding of various impacts of PV solar energy in Chile, Geographic Information Systems were used (III). Multiple criteria of social (i.e. distance from cities, vegetation and landscape values), environmental (i.e. land use, biomass, vegetation), and physical (i.e. temperature, global irradiation, orography, distance to roads and powerlines) factors were used to select the optimal sites for PV solar power plants. Social impacts of solar energy were analysed with the help of a survey and conflicts of environmental, social, and solar energy potential of RES installations were analysed in geospatial space (III). Finally, the aim was to give recommendations how to promote sustainable construction of PV solar power plants in Chile (I, II, III).

3 MATERIAL AND METHODS
3.1 Study Sites
The studies of this thesis were conducted in four regions of Northern Chile: Arica and Parinacota (region XIV), Tarapacá (region I), Antofagasta (region II), and Atacama (III). In addition, answers to survey questions were collected from whole country. Intertropical Convergence zone (ITCZ) and its circulation systems are responsible for Chilean weather. Tropic of Capricorn is situated in the same latitude as northern Chile (Fig. 1). The tropic of Capricorn and the tropic of Cancer are latitudes where dry winds flow in the upper atmosphere, which makes these areas dry on the ground level, too. Chile is situated along the South American continent beside the Pacific Ocean (Fig. 1). Chile is isolated from its neighbours, Argentina and Bolivia, by the Andes. Beside the long but narrow country flows the Humboldt Current. The current is cold, which reduces evaporation. Therefore, cloud and mist formation are minimal, and steep Chilean coastal range limits the humidity from the sea to the coast. The Atacama Desert is situated in the highlands, which makes it the driest desert in the world (Moreira-Muñoz 2011). Vegetation of the Northern Chile varies from non-vegetated deserts, via shrubs and / or herbaceous lands to ice and snow (Luebert and Pliscoff 2006, Moreira-Muñoz 2011). There are some broadleaf and evergreen forests, but with regional distributions (Luebert and Pliscoff 2006).
Precipitation in the Northern Chile is not regular every year (Luebert and Pliscoff 2006). Variation in the amount of precipitations is related to El Niño Southern Oscillation (ENSO) phenomenon. In addition, there are studies that have found that the amount of coastal mist is related to ENSO unlike the precipitation in the inland (Aceituno and Montecinos 1993, Muñoz-Schick et al. 2001, Houston 2006). ENSO is oscillation in the Pacific Ocean. It occurs irregularly and changes weather conditions. During the years called “El Niño” warm waters arrive to the coast of Chile increasing the amount of water vapour in the air (Aceituno and Montecinos 1993, Vargas et al. 2000, Houston 2006).

14
Northern Chile has few big cities, which are mainly on the coast. Inland infrastructure has been built around the mines and agriculture (in the valleys). The inland area contains many little villages, of which some have a high cultural value. Historical and natural monuments are frequent along with archaeological sites. Landscape includes snow-covered Andes, salt lakes with flamingos, hieroglyphs, herbaceous highlands, mineral rich coloured mountains, etc.
FIGURE 1 Chile is situated on the west coast of South America (on the right). Study area includes the northern Chile (on the left). Study area had four regions. Studied solar power plants are presented with black dots: upper dot denotes PAS3 in Tarapacá region and lower dot PSPS in Atacama region.
3.2 Studied PV plants
Two different technologies of PV solar power plants were included in the study: Fixed mount PV plant “Photovoltaic Solar Plant Subsole” (PSPS, hereafter) and PV plant with solar tracking “Pozo Almonte Solar 3” (PAS3, hereafter). PSPS

15
was situated in the Atacama region, and PAS3 in the Tarapacá region (Fig. 1). These two plants were chosen among existing solar power plants, because we could get permission to study them. In addition, these solar power plants where one of the first installed in Chile. More detailed descriptions of the two solar power plants are given and their differences are described in article I.
PSPS was studied every year during September and November from 2013–2015 and PAS3 during January and February 2014. Studies were timed according to possible water availability to get a higher arthropod activity. Raining season is most likely to occur during June to August in the Atacama region (Houston 2006). Central valley of Tarapacá, were PAS3 is located, can have floods from the raining season at the Andes during January to March (Houston 2006).
3.3 Study methods
To be able to suggest sustainable construction of PV plants, many different approaches were needed, including studies related to microclimatic conditions under the panels and analyses of arthropods distribution in the PV plants. In addition, georeferenced data together with survey results were used to cover the four regions in northern Chile.
The PV panels cause some areas of power plants to be shaded, and there are almost windless sunny areas between the arrays. Abiotic (I) and biotic (I, II) aspects of these two areas (i.e. Sun and Shade) were studied and compared to the reference area situated in the northern side of the plants. Microclimate was measured with 16 data loggers (I, II). GLS models and Kendall´s Tau correlation coefficient were used to analyse changes in temperature, relative humidity and dew point (I) between environmental conditions (i.e. Sun, Shade, and Reference), day and night, and study months.
Arthropod species of the solar power plants were studied on the ground level by pitfalls (I) and web building spider species from the mount structure were collected by hand, and their webs were calculated (II). Plant coverage and the number of pods (Hoffmannseggia prostrata) were calculated (II). Identification of the plants and arthropods were done according to Snelling and Hunt (1975), Aguilera and Casanueva (2005), Ferrú and Elgueta (2011), Taucare-Ríos and Sielfeld (2013), among others.
Multivariate methods were used to analyse biotic changes in solar power plant conditions. Changes in plant coverage, number of pods (II), arthropod biodiversity, and arthropod species composition changes (I) were studied in different environmental conditions and study periods using permutational multivariate analysis of variance (PERMANOVA). Also, distribution of web building spiders was analysed among the panel arrays and study years with PERMANOVA. Multivariate analyses were made using PRIMER v6.1.12 (Clarke and Gorley 2006) with PERMANOVA+ v1.0.2 add-on software (Anderson et al. 2008) (I) and with PRIMER v7.0.13 (Clarke and Gorley 2015)

16
(II). Finally, the effects of abiotic conditions were compared to biotic patterns with BIO-ENV routine (Clarke et al. 2008) (I, II).
Location optimization of PV plants included physical, environmental and social aspects (III). Social data was partly related to a survey performed in connection to this thesis in Chile in 2014 (III). The aspects were divided into factors. Physical factors included spatial data of global irradiation data, temperature, slope, orientation, distance to the roads and power lines. Environmental factors consisted of land use, biomass, and rarity of vegetation type and social factors of distance from cities, landscape and vegetation values. In addition, biomass was considered again with social factors because ecosystems have health benefits (Tzoulas et al. 2007) (III). Constraints included social and environmental considerations, such as historical sites, conservation areas, natural parks, etc.
Spatial multi criteria decision making with analytic hierarchy processes (AHP) and ordered weighted averaging (OWA) were applied to optimal site selection (Saaty 1997, Malczewski 2006). Fuzzy sets were used to standardize the factors (III). Standardized factors were first given pair-wise weights inside every aspect (AHP). Afterwards suitability levels were given with OWA-weights allowing all aspects to have some trade-off between the factors with minor risk. Finally, equal weights with weighted linear combination (WLC) were used to calculate the final map that combined all three aspects (III). Pre-treatment, spatial analyses and raster calculations were done using TerrSet® v18.20 (Clark Labs, Worcester, MA) and ArcGIS ® v10.3.1 (ESRI, Redlands, CA) (III).

4 RESULTS AND DISCUSSION
4.1 Microclimate of PV plants
It is known that shading of panels in concentrated solar power (CSP) plants change the energy balance of the soil (Wu et al. 2014). Because the sun light is converted to energy, temperature changes significantly and, therefore, effects on the biota are expected (Wu et al. 2014). The same way as the CSP power plants, also PV plants change the microclimate underneath the panels (I). Depending on PV technology, shade conditions are different (I). Ground level has lower temperature under the panels than between the panels during the midday time at both fixed and solar tracking technologies. Nevertheless, the difference between shading conditions of fixed and moving mount occurs during the morning and afternoon: The Sun is shining under the panel mounts longer in the studied solar-tracking system than in the studied fixed mount plant (I). In both PV plants, relative humidity rises in Shade conditions although in Sun conditions humidity is lower than outside the solar power plants (I). Like Wu et al. (2014) suggested, microclimate described above can have beneficial effects to biota (I).
Ground temperature of the small PV solar power plant raised fast with the increasing number of panel arrays (I). Nevertheless, in large scale solar tracking technology there was no significant correlation between temperature and number of array groups (I). Wu et al. (2014) detected that wind speed slows down in CSP plants. Most likely slowdown of wind speed at the first arrays is the reason why temperature rises in the back part of the solar power plant at the studied small-scale PV plant with fixed mounts (I). Studied large-scale PV plant had more space between the panels and solar power plant was divided by corridors. That can be the reason why the temperature did not rise at the large scale solar plant like it did in the small-scale PV plant (I). Therefore, we recommend, leaving space or corridors between the panel mounts. Space lets the air to flow into the solar power plant and decreases the temperature of the panels. The wind can also bring arthropods to inner parts of the facilities. Wind

18
could also balance temperature differences between arrays. Nevertheless, using more space per array causes also the total area of the facility to grow and the plant to have an effect to a larger area. Space between panel mounts can work as an ecological corridor resembling the desert conditions outside the panel area. On the other hand, those corridors are used by maintenance cars, which make the corridors to be more disturbed than the sunny between-panel areas.
4.2 Ecological environment of PV solar power plants
Detected arthropod biodiversity (abundance and species richness) changes were caused by temporal factors and not by the different conditions in the solar power plants (I). In contrary, species composition was affected by the environmental conditions (i.e. Sun, Shade, and Reference) (I). The Shade of fixed mount solar power plant had different species composition than Sun and Reference area, but at the solar tracking facility, species were not different between Sun and Shade, although some changes were detected between Reference and the panel area (I).
In PSPS spider species Lactrodectus geometricus and their webs were detected from panel mount legs. Other web building spider Dictyna sp. was detected from back surface of the panels, pitfalls, and from the panel mounts legs. Only two species of vegetation were identified from the study plots: Hoffmannseggia prostrata and Malva nicaeensis.
Of all studied arthropods, only the distribution of spiders was significantly affected by the microclimate conditions (I, II). Dictyna sp. reacted to the increased temperature by placing her webs on the ground (II). Because arthropod species distribution was not affected by the microclimate, we suspect that species interactions play a significant role in solar power plant ecosystems. In the future studies, more attention should be paid to species interactions and invasive species ecology.
Distinct solar power plant conditions are suitable for different arthropod groups depending on their habitat requirements. Some groups were found only from sunny conditions like Solifugae, whereas coleopterans and dipterans were found to be more frequent in Shade (I). In addition, we detected a higher amount of flying insects at the solar power plant facilities than within the reference area and wind speed changes can accumulate flying insects into the solar power plant (I). Though, on the ground level arthropods could find refuge from the Sun conditions under the fixed mounts (I).
Distributions of different arthropod species were found to have interactions (I). Species interactions were detected among arthropod species (I) and distribution of web building spiders (II) at the fixed mount facility (I). Abundant amount of both spider species was detected on the mount legs and on the back surface of panels of first two arrays. We believe that this might be because of more abundant prey availability, and surely this attracts spiders to build their webs to the mounts of solar power plants. In addition, coleopterans

19
were more abundant in Shade than Sun conditions (I) which makes it a good preying surroundings to L. geometricus, which can prey on bigger arthropods than Dictyna sp.
Web building spiders build their webs using vegetation as a base of the structure, but in solar power plant environment mounts and panels structure can substitute that function and spiders’ distribution can be independent of the vegetation (II). That might mean that pray species used by spiders are also distributed independent of the vegetation, but there most likely are other arthropod groups that are dependent on vegetation. Notable impact of vegetation changes happened on fixed mount solar plant where H. prostrata pod production was inclined in Shade, which can lead to severe ecosystem changes (I). Change in resource allocation in plants can be one of the reasons why arthropod species were divided among Shade and Sun at fixed mount solar plant.
Quickly constructed solar-tracking technology seems to have less effect on the environment than fixed mounts (I), but more studies should be conducted to be able to know if exotic species will inhabit the moving table mounts. Moving of the panels would break some of the webs, but would not stop web-building spiders from colonizing solar-tracking mounts, if the environment is favourable. In fact, species migrate mainly from the surrounding desert and if exotic species are not present in the surrounding nature, they may not find their way to the solar power plant. On the other hand, construction and maintenance of the facility can bring species from further off that travel with the personnel. Therefore, wildlife management has been recommended (Lovich and Ennen 2011).
Since soil and local biota is moved during the construction phase of a solar power plant (Wu et al. 2014), panel environment can be completely different from the original environments and therefore be unfit to the biota that was moved. Nevertheless, ecological impacts of solar power plant technologies are minor and radical changes between species distribution was not detected. On the other hand, if solar power plants would be constructed into areas with vulnerable species of flora or fauna, construction of solar power plant would cause serious harm. Shading causes plants to change their resource allocation and invasive species can take over, leaving fewer resources to endemic species (II). When performing evaluation of desert environments, seasonality should be taken into account with extra care. For the reasons mentioned before, careful site selection for each solar power plant projects is advised. Biota of the deserts typically is of dormant nature (Ward 2009), which should be considered when planning solar plant facilities.
According to my studies, solar tracking technology changes the original environment less than panels with fixed mounts. Therefore, I recommend solar tracking technology over fixed mounts. On the other hand, studied solar power plants were not comparable, because of the difference in size and location, and the temporal differences of the studies. In fact, these results should be confirmed with the two technologies in the same study sites and times.

20
4.3 Location optimization of PV plants in northern Chile
Ecological impacts of solar power plant facilities were included in the location optimization process by using constraints (III). Therefore, high biodiversity areas, natural parks, and protected areas were ruled out from the site selection before any other criteria were considered. In addition, high biomass areas were given less value as a suitable site (III).
Highest suitability score was found nearby roads and electrical grids, and the score slowly increased towards the mountainous areas. Elevated temperatures decrease the energy efficiency of the panels (Dubey et al. 2013), but the enormous amount of radiation available compensates the productivity decrease in northern Chile (III). Finding was partly in conflict with environmental aspects because high biomass areas, outside the constraint areas, were also found at the Andes. The Andes also possess scenic landscapes that were found to be of high importance to conserve (III). Mountainous areas are less attractive for solar power plant projects because of their distances from cities and extreme conditions (deep slopes, low air pressure, snow storms). On the other hand, several mines are situated in those areas as well. Therefore, solar energy projects can be an attractive option even at the Andes. Nevertheless, site selection is of foremost importance in those areas (III).
I recommend that physical, environmental, and social factors of PV plant location optimization should be considered to guarantee sustainable development (III). AHP and OWA methods have been tested in multiple spatial multi criteria decision making processes (Siddiqui et al. 1996, Arán Carrión et al. 2008, Boroushaki and Malczewski 2008, Jamali et al. 2014). I recommend AHP-OWA method as a good preplanning method of site selection to PV solar power plant projects. The method used in this thesis can be repeated to other regions where similar data as in this study is available. Maintaining environmental and social impacts small, only little trade-off in these factors should be allowed to make sure that we reach a satisfying solution (III).

5 CONCLUSIONS
According to my studies, photovoltaic solar power plants change microclimate of desert environment (I), and the microclimatic conditions do change some biota distribution and behaviour especially at fixed mount solar plant (II). There are species that can benefit from solar power plant conditions, and some biota clearly avoid the shadow conditions. Fixed mount solar power plants can act as refuge to some arthropod groups during the day time heat (I), but for vegetation, that is adapted to direct sun light, Shade conditions can disturb florescence (II).
Arthropod species composition was divided between Shade and Sun conditions at fixed mount power plant (I). Solar power plants create patchy habitats where species composition is different below the panels and between them. Sunny conditions lack web-building spiders and that can be part of the detected interactions. Temperature and dew point seemed to affect habitat selection of local spider species while invasive species could habit the solar power plant mount legs entirely (II). PV solar power plants can act as a good habitat to invasive species if they are not sensitive to extreme temperatures. Nevertheless, regular wildlife observations are advised also in Chile. Considering the facts presented above, I conclude that ecological impacts of photovoltaic solar power plants are minor compared to some other forms of energy production, but precaution should be taken when planning projects in areas with sensitive nature (I). Solar tracking technology will most likely have less effect on the desert arthropods and would let the Sun shine more equally to the ground beneath the mount. Nevertheless, more studies should be conducted in multiple solar power plants to confirm the magnitude of the effects of different technologies (I).
Generalisation of the ecological impacts of the two studies (I and II) cannot be done to cover large areas in northern Chile, but habitats of naturally endemic species with restricted distribution should be avoided. Therefore, it is not possible to rule out the environmental assessment with this study. In contrast, more studies should be conducted to understand the Atacama Desert’s local conditions. We should also have information about desertification of the

22
adjacent areas of true deserts. For example, there are only few studies about the biological crust of the Atacama Desert (Drees at al. 2006, Warren-Rhodes et al. 2006 Azua-Bustos et al. 2012). Therefore, it is not known what biodiversity potential lies in the extreme conditions of northern Chile.
Here I must admit that Northern Chile is an ideal place for solar power plant projects because of its high solar energy potential. Nevertheless, I suggest that the environmental and social aspects of site selection should be considered in more detail using multi criteria decision-making tools and their locations should be optimized. Nevertheless, local site selection planning should be done with more detailed large-scale information than presented here. My thesis provides only initial location optimization over a large area. On the other hand, the accuracy of these maps is more than enough to describe the four regions in northern Chile. Ideal places with low environmental and landscape value are in the absolute desert situated in the central valley starting from Arica and reaching until the northern part of Atacama region (III). Nevertheless, cities and historical sites should be avoided.
23
Acknowledgements
All started in 2011 when I was a trainee at Fundación Chile. A fellow worker, Eduardo Soto Sepulveda, came to me saying that he wants to do environmental impact assessment of solar power plants in Chile. He found a possibility to apply funding from a Sustainable Energy program organized by the Academy of Finland and Chilean CONICYT. So, we started to plan the application together with Vicente Olavarría Baeza and Heikki Sorasahi. I sent the application to Timo Vuorisalo, who was my teacher when studying masters at the University of Turku, asking for co-operation. Vuorisalo sent the co-operation request forward to all environmental departments of Finland. Jussi Kukkonen answered to the call together with Markku Kuitunen, and Anssi Lensu. From Chilean side Eduardo contacted Marcelo Perez and Samir Kouro asking them to join the project. I want to thank the Academy of Finland and CONICYT for funding our project.
I am grateful to my dear supervisors Jussi Kukkonen, Markku Kuitunen, and Anssi Lensu, and to my follow-up group members Matti Salo, Risto Kalliola, and Elisa Vallius. I want to thank Jussi Kukkonen for all his support and for allowing me to work independently, as well as his good ideas. I am also grateful to Markku Kuitunen for his support and guidance. Special thanks to Anssi Lensu and Christian Muñoz-Escobar who took all this time to teach, correct my texts and write the articles with me. You have made this time really educating but also very entertaining. I have had many great moments reading your comments.
I want to thank my coauthors, Christian Muñoz-Escobar, Marcelo Perez, Marcelo Miranda, Marcos Ferrú, Andrés Taucare-Ríos, Pablo Espinoza Astudillo, and Natalia Guajardo Celis, for all your support, ideas, species identifications, and help with the everyday work. Special thanks to my coauthor, field assistant and friend, Rodrigo Andrade-Alvear, who helped me with the articles, field work, cleaning of the samples, especially with the survey and with pisco sour.
I have been privileged to participate in one co-operation article together with Marcelo Perez, Samir Kouro, Anssi Lensu, and Jaime Zapata Amores and to draw taxonomic images to two publications together with Jukka Salmela. Thank you for these opportunities.
Thank you to all those people, who allowed me to enter their solar power plants. Thank you for all the help, support, and beautiful moments that I had with you! At Subsole these people include Alfonso Momberg, Paulina Valenzuela Escobar, Gilian Mora Sarmiento, Jorge Jimenez Yañez, and Juan Luis Olguín Marschhausen, and at Solar Pack´s solar power plant especially Angel Martín, Santiago Maldonado, and the two Pacos.
Thank you to all that participated to cleaning and identification of the samples, José Infante Varela, Nelson Jara (also thanks for your help with the survey!), Patricio Valenzuela, Leynar Leyton Naranjo, and Vicente Zamora
24
Pavel. I also want to thank those who participated to the field work, Samuel Perez Espinoza, and Lorena Rivera.
I would also like to thank Christián Hernández for receiving me at the University of Consepción, and SAG of Tarapacá, especially Leonardo Turra for receiving me and providing your help and information. In the University of Jyväskylä, I also want to thank Ambiotica office personnel for handling all the paper work that my travelling took, and the IT services for the reinstalling of my notebook over and over again, and of course laboratory technicians Mervi, and Leena. I never worked with you two, but it’s clear, that you keep everything running.
I want to thank my colleagues in Chile and in Finland especially Heidy Villalobas Barrantes, Garen Guzman Rendon, Carlos Zamora, Oscar Inostroza, Alejandra Panzera, Margarita Ruiz De Gamboa Astroza, Hanna Arola, Anu Mikkonen, Elijah Ngumba, Yufei Gu, Juho Rajala, Cyril Rigaud, Andreas Eriksson, and Jaana Wallin. You have all been a great help, support and most of all an excellent company. When I have moved between the two countries, it has always been great to see you again, which has unfortunately meant always missing the people on the other side of the Atlantic.
Thank you also to my friends whom I love so much: Linda Willman, José Yepez, Jenny Uusitalo, Lorena Troncosa, Jessica Salas, Nicole Mermoud, Francesca Renzi, Miguel Del Castillo Negrete, Suvi Valkonen, Hanna Urtti, and Sarah Perrine. You have been my strength, and no matter when and where I see you, I always feel like coming back to home again.
Finally, thank you so much Mum and Timo. I can´t even count how many times you have picked me up from the airport. Mum, thank you for all your support through all my life and that you have been so proud of me even though I would not have done anything special. Thank you, Grandma, for being always there for me and having the most practical ideas about life. Thank you, dad, for your support and for sharing your enthusiasm towards nature and your endless desire to implement projects. I think I inherited them from you, which eventually took me here. Thank you to my brother Antti and to his family Eeva-Maria, Aleksi, and Henri for all the good moments that we have spent together and thanks Antti for shaping my movie taste and drawing skills. You have been my inspiration in many things even though I have not admitted that before. Thank you to my godmother Eeva-Liisa and to her family Markku, Jonna, Minna, and Veli-Sakari. I have always felt loved and privileged to be at your company.

25
YHTEENVETO (RÉSUMÉ IN FINNISH)
Aurinkosähkövoimaloiden ekologiset vaikutukset ja kestävän kehityksen huomioiva sijoittelu Pohjois-Chilessä. Aurinkoenergian suosio on kasvanut nopeasti Kioton sopimuksen (1998) jäl-keen. Sopimus edisti merkittävästi hiilineutraalin energian käyttöönottoa. Au-rinkoenergia on jo suosittua monissa maissa, kuten USA:ssa, Kiinassa ja Saksas-sa. Myös Chilessä kestävää energiaa tuetaan säädöksellä, jossa on tavoitteena täyttää 20 % koko maan energian tuotosta uusiutuvalla energialla vuoteen 2025 mennessä. Isoja aurinkovoimaloita on jo rakennettu Chileen, mutta monet pro-jektit odottavat vielä hyväksymistä. Aurinkoenergian suosio on kasvamassa etenkin Pohjois-Chilessä, jossa aurinkoenergiapotentiaali on yksi suurimmista koko maailmassa.
Atacaman aavikko sijaitsee Chilen pohjoisosassa. Se on maailman kuivim-pia aavikoita ja siellä taivas on lähes aina pilvetön. Äärimmäisten olosuhteiden vuoksi elämä aavikolla on niukkaa. Koska aurinkovoimaloiden ympäristövai-kutusten arvioidaan olevan erittäin pienet Chilessä, ajatellaan usein yksioikoi-sesti, että Atacaman aavikko on ideaalinen paikka isoille aurinkovoimaloille. Pohjois-Chilen alueella on kuitenkin 40 erilaista kasvillisuusvyöhykettä, jotka sisältävät myös monia endeemisiä lajeja. Näiden lajien levinneisyys on hyvin paikallista. Lisäksi monet lajit ovat kehittyneet monofyleettisesti eli yhdestä lajista on eriytynyt monta paikallista lajia.
Vaikka aurinkovoimaloiden ympäristövaikutusten on todettu olevan erit-täin pieniä verrattaessa perinteisiin energiantuotantomuotoihin, haitallisia ym-päristövaikutuksia aurinkoenergialla on kuitenkin etenkin aurinkovoimaloiden rakennusvaiheessa, jolloin suuria määriä maata joudutaan muokkaamaan pa-neeli- tai peiliasennuksien tieltä. Alkuperäinen maaperä eliöstöineen poistetaan ja lisäksi rakentamisesta aiheutuu pölyä, melua ja maan tärinää. Paneelialueet suljetaan aidalla, jolloin pienehköjenkin maaeläinten pääsy paneelialueelle es-tyy. Rakennusvaiheen jälkeen aurinkovoimala-alueella liikutaan säännöllisesti puhdistamassa ja huoltamassa paneeleita ja niiden rakenteita. Tästä aiheutuu kasvien tallaantumista ja isoilla voimaloilla myös autoja käytetään liikkumi-seen. Mikäli paneeleita puhdistetaan tislatulla vedellä, tämä ylimääräinen vesi voi myös muuttaa aurinkovoimalan ympäristöolosuhteita. Vaikka aurinkovoi-maloiden rakentamisenaikaiset ympäristövaikutukset tiedetään verraten hyvin, ekologisia vaikutuksia on tutkittu varsin vähän.
Atacaman alueella on laajoja alueita ilman kasvillisuutta, ja siksi paneelien tuoma varjo voi muuttaa aavikon mikroilmastoa. Varjo voi tarjota suojaa aavi-kon kuumuudelta. Lisäksi suhteellinen kosteus on varjossa suurempaa ja on mahdollista, että kasvit voisivat hyötyä aurinkovoimalan olosuhteista. Nämä olosuhteet ovat kuitenkin hyvin erilaisia aavikon alkuperäisiin olosuhteisiin verrattuna, joten myös vieraslajien levittäytyminen voimala-alueille on mahdol-lista.

26 Kun aurinkovoimalaprojekteja suunnitellaan, sosiaalisiin vaikutuksiin tu-
lisi myös kiinnittää huomiota. Sosiaalisten vaikutusten arviointi on jäänyt vä-hemmälle huomiolle, koska tutkimusmenetelmät ovat hitaita ja työläitä. Jotta sosiaaliset vaikutukset eivät kasvaisi liian suuriksi, aurinkovoimalat tulisi sijoit-taa riittävän suuren etäisyyden päähän kaupungeista. Mikäli aurinkovoimala on liian lähellä kaupunkia, jo liikkuminen ulos kaupungista tai sisään hankaloi-tuu. Osa kaupungin asukkaista voi kokea aurinkovoimalan positiivisena osana maisemaa, mutta osa ihmisistä vastustaa niitä. Toistuva näkeminen voi kuiten-kin aiheuttaa negatiivisen asenteen kehittymisen etenkin, jos aurinkovoimala on sijoitettu esteettistä tai historiallista arvoa omaavalle alueelle. Kun etsitään optimaalista paikkaa aurinkovoimalalle, tulisi optimoinnissa huomioida aurin-koenergiapotentiaalin lisäksi myös ympäristöön ja sosiaalisiin aiheisiin liittyvät seikat. Tätä varten monikriteerisiä päätöstentekotyökaluja on kehitelty tutkijoi-den käyttöön. Paikkatietosovellukset ovat tyypillisiä menetelmiä, joiden avulla on mahdollista toteuttaa monikriteeristä päätöksentekoa.
Tietoa siitä, miten aurinkovoimalat vaikuttavat Pohjois-Chilen luontoon, ei ole aikaisemmin julkaistu. On kuitenkin tärkeä tietää, mitä ekologisia vaiku-tuksia aurinkovoimaloilla on, jotta voidaan ennustaa, miten aurinkovoima-laympäristö muuttaa luontoa. Siksi väitöskirjassani olen tutkinut, minkälaisen ympäristön aurinkovoimalat luovat Pohjois-Chilessä ja miten muuttunut ympä-ristö vaikuttaa eliöstöön. Lisäksi arvioin väitöskirjassani aineistojen perusteella, mitkä fysikaaliset, ympäristölliset ja sosiaaliset seikat on otettava huomioon, kun valitaan parhaita alueita aurinkovoimaloita sijoitettaessa. Tietoisuutta sosi-aalisista vaikutuksista lisättiin kyselyn avulla, jonka tuloksia sovellettiin sen jälkeen lisätietoina muodostettaessa taustamuuttujia monikriteeriseen paikka-tietoanalyysiin.
Työtä varten kahta erityyppistä aurinkosähkövoimalaa tutkittiin Pohjois-Chilessä vuosien 2013–2015 aikana. Voimalat erosivat toisistaan paneelien asennustekniikoissa. Kolmen vuoden seuranta suoritettiin Copiapó:n laaksossa sijaitsevassa voimalassa, jossa paneelit ovat kiinteillä, pohjoiseen päin kalliste-tuilla, pöydillä. Yhden vuoden tutkimus suoritettiin Tarapacá-alueen aurinko-voimalassa, lähellä Pozo Almonten kaupunkia. Siellä paneelit seurasivat aurin-koa kääntyen idästä länteen päivän aikana. Työ toteutettiin tutkimusruutujen avulla, jotka olivat sijoitettu kolmeen erilaiseen ympäristöön: paneelien alle, paneelien väliin ja paneelialueen ulkopuolelle. Ruuduista laskettiin kasvillisuu-den peittävyys ja kasveissa olevien hedelmien lukumäärä. Kuoppaloukut asen-nettiin kasvillisuusruutujen ympärille ja dataloggerit asennettiin mittaamaan lämpötilaa, suhteellista kosteutta ja kastepistettä ruuduilta. Verkkoa kutovat hämähäkit ja/tai niiden verkot laskettiin paneelipöytäkohtaisesti.
Aiemmassa kirjallisuudessa esitetään, että aurinkovoimaloiden ympäris-tövaikutukset ovat pieniä, mutta osa ekologisista vaikutuksista on kuitenkin syytä ottaa huomioon. Yleinen paikallinen kasvilaji, Hoffmannseggia prostrata, kasvoi kiinteäpaneelisen aurinkovoimalan alueella. Kun kasvi kasvoi referens-sialueella, se tuotti runsaasti palkoja. Paneelien alla varjossa se ei kuitenkaan pystynyt tuottamaan palkoja. Ilmeisesti suoran auringonvalon puute sai H. pro-

27
strata:n allokoimaan kasvuun kukkimisen sijaan, koska kasvillisuuden muutok-set eivät riippuneet abioottisista olosuhteista. Sen sijaan verkkoja kutovien hä-mähäkkien elinympäristövalintaan abioottiset olosuhteet vaikuttivat. Kun läm-pötilat kohosivat, paikallinen hämähäkkilaji, Dictyna sp., ei kiivennyt ylös pa-neeleihin rakentamaan seittejään, vaan pysytteli maan tasalla. Chilelle vierasla-jina tunnettu hämähäkkilaji, ruskea leski (Lacrodectus geometricus), ei ollut herk-kä abioottisille muutoksille, ja sen verkkoja löytyi kaikkialta aurinkopaneelien jalkarakenteista kiinteäpaneelisessa aurinkovoimalassa. Niveljalkaisten lajisto oli jakautunut eri tavoin kiinteäpöytäisessä voimalassa aurinkoisten alueiden ja varjon välillä. Jotkut niveljalkaisryhmät, kuten arolukit (Solifugae), löytyivät enimmäkseen aurinkoisista olosuhteista, kun taas suurempi osa kovakuoriaisis-ta (Coleoptera) ja kaksisiipisistä (Diptera) oli paneelien alla enemmin kuin niiden välissä auringossa. Voimalassa, jossa paneelit seurasivat aurinkoa, niveljalkais-ten lajisto ei ollut jakautunut. Lajistossa kuitenkin havaittiin eroja, kun aurinko-voimala-alueen tuloksia verrattiin referenssialueen tulosten kanssa.
Optimaalisin aurinkovoimaloiden sijoittelualue Pohjois-Chilessä oli Ata-caman aavikon keskiosa alkaen Arican alueesta jatkuen Atacaman alueen poh-joisosaan. Tällä alueella kasvillisuus on erittäin niukkaa ja aurinkoenergia on voimakasta, vaikka korkeat lämpötilat heikentävätkin paneelien hyötysuhdetta. Alue oli optimaalinen lukuun ottamatta kaupunkien lähistöjä, historiallisia mo-numentteja tai luonnonsuojelualueita. Ristiriitaiset alueet löytyivät Andien vuo-ristosta teiden ja sähköverkon lähettyvillä, jossa alueen sopivuus fysikaalisilta ominaisuuksiltaan (aurinkoenergian potentiaali, lämpötila, maaperän kalte-vuus, ym.) oli suurimmillaan, mutta myös biomassan määrä oli suurempaa kuin keskialueella. Vuoristoisuus rajoitti aurinkoenergian tuotantoon kelpaavat alueet lähelle tieverkostoja. Andeilla sijaitsee myös suuri määrä esteettisesti tär-keitä maisemia, joiden suojeluarvon tärkeys tuli esille kyselyssä. Atacaman alu-een eteläosa on myös biomassaltaan runsas verrattuna tutkimusalueen ylem-piin keskiosiin. Koska tyypillisten maisemien ja vuoristomaisemien osuus An-deilla on suuri, katsottiin alueen olevan heikompi sijoittelun kannalta.
Väitöskirjani lisää tietoisuutta aurinkovoimaloiden ekologisista vaikutuk-sista ja ottaa kantaa niiden kestävän kehityksen mukaiseen sijoitteluun Pohjois-Chilessä. Tuloksia voi soveltaa Pohjois-Chilen alueellisessa päätöksenteossa, sekä aurinkovoimaloiden sijoittelun optimointia voi soveltaa myös muille alu-eille, joilta vastaavia aineistoja ja lähtötietoja on saatavilla.

28
REFERENCES
Aceituno P. & Montecinos A. 1993. Análisis de la estabilidad de la relación entre la oscilación del sur y la precipitación en América del sur. Bull Inst Fr Étud andin 22(1): 53–63.
Afgan N.H., Gobaisi D.A., Carvalho M.G. & Cumo M. 1998. Sustainable energy development. Renew Sust Energ Rev 2: 235–286.
Aguilera M. & Casanueva M. 2005. Araneomorphae chilenas: estado actual del conocimiento y clave para las familias más comunes (Aracnida: Araneae). Gayana 69(2): 201–224.
Anderson M.J., Gorley R.N. & Clarke K.R. 2008. PERMANOVA+ for PRIMER: Guide to Software and Statistical Methods. PRIMER_E: Plymouth, UK.
Antrop M. 2005. Why landscapes of the past are important for the future. Landscape Urban Plan 70: 21–34.
Arán Carrión J., Espín Estrella A., Aznar Dols F., Zamorano Toro M., Rodríguez M. & Ramos Ridao A. 2008. Environmental decision-support systems for evaluating the carrying capacity of land areas: Optimal site selection for grid-connected photovoltaic power plants. Renew Sust Energ Rev 12: 2358–2380.
Azar C., Holmberg J. & Lindgren K. 1996. Methodological and Ideological Options, Socio-ecological indicators for sustainability. Ecol Econ 18: 89–112.
Boroushaki S. & Malczewski J. 2008. Implementing an extension of the analytical hierarchy process using ordered weighted averaging operators with fuzzy quantifiers in ArcGIS. Comput Geosci 34: 399–410.
Brundtland G.H. 1989. How to secure our common future. Sci American 261(3): 190.
Carrasco J.M., Bialasiewicz J.T., Portillo Guisado R.C. & León J.I. 2006. Power-Electronic Systems for the Grid Integration of Renewable Energy Sources: A Survey. IEEE T Ind Electron 53: 1002–1016.
Charabi Y. & Gastli A. 2011. PV site suitability analysis using GIS-based spatial fuzzy multi-criteria evaluation. Renew Energ 36: 2554–2561.
Chesson P., Gebauer R.L.E, Schwinning S., Huntly N., Wiegand K., Ernest M.S.K., Sher A., Novoplansky A. & Weltzin J.F. 2004. Resource pulses, species interactions, and diversity maintenance in arid and semi-arid environments. Oecologia 141: 236–253.
Clarke K.R. & Gorley R.N. 2006. PRIMER v6: User Manual/Tutorial. PRIMER-E, Plymouth, pp. 192.
Clarke K.R. & Gorley R.N. 2015. PRIMER v7: User Manual/Tutorial. PRIMER-E, Plymouth, pp. 296.
Clarke K.R., Somerfield, P.J. & Gorley R.N. 2008. Testing of null hypotheses in exploratory community analyses: similarity profiles and biota-environment linkage. J Exp Mar Biol Ecol 366: 56–69.
Daniel T.C., 2001. Whither scenic beauty? Visual landscape quality assessment in the 21st century. Landscape Urban Plan 54: 267–281.

29
De Laquil III P., Kearney D., Greyer M. & Diver R. 1993. Solar-thermal electric technology. In: Johansson T.B., Kelley H., Reddy A.K.N, Williams R.H. (eds.), Renewable Energy: Source for Fuels and Electricity. Island press Washington, D.C. Covelo, California, pp. 213.
Dincer I. 2000. Renewable energy and sustainable development: a crucial review. Renew Sust Energ Rev 4: 157–175.
Dincer I. & Rosen M.A. 1998. A worldwide perspective on energy, environment and sustainable development. Int J Energ Res 22(15): 1305–21.
Dincer I. & Rosen M.A. 2011. Thermal Energy Storage: Systems and applications. Wiley, Chichester, UK.
Drees K.P., Neilson J.W., Betancourt J.L., Quade J., Henderson D.A., Pryor B.M. & Maier R.M. 2006. Bacterial Community Structure in the Hyperarid Coreof the Atacama Desert, Chile. Appl environ microb 72(12): 7902–7908
Dubey S., Sarvaiya J.N. & Seshadri B. 2013. Temperature Dependent Photovoltaic (PV) Efficiency and Its Effect on PV Production in the World a Review. Energy Procedia 33: 311-321.
Dubley N. 2008. Guidelines for Applying Protected Area Management Categories. IUCN Gland, Switzerland.
Elliott D. 2000. Renewable energy and sustainable futures. Futures 32: 261–274. Ferrú M. & Elgueta M. 2011. Lista de Coleópteros (Insecta: Coleoptera) de Las
Regiones de Arica y de Tarapacá, Chile. Bol Mus Nac Hist Nat Chil 60: 9–61. Houston J. 2006. Variability of precipitation in the Atacama Desert: Its causes
and hydrological impact. Int J Climatol 26: 2181–2198. Huang B.J. & Sun F.S. 2007. Feasibility study of one axis three positions tracking
solar PV with low concentration ratio reflector. Energ Convers Manage 48: 1273–1280.
Jamali I., Mörtberg U., Olofsson B. & Shafique M. 2014. A spatial multi-criteria analysis approach for locating suitable sites for construction of subsurface dams in northern Pakistan. Water Resour Manag 28: 5157–5174.
Kelly H. 1993. Constructing a renewables-intensive global energy scenario. In: Johansson T.B., Kelley H., Reddy A.K.N. & Williams R.H. (eds.), Renewable Energy: Source for Fuels and Electricity. Island press Washington, D.C. Covelo, California, pp. 21–22.
Kiera G., Krefta H., Leeb T.M., Jetzb W., Ibischc P.L., Nowickic C., Mutkea J. & Barthlotta W. 2009. A global assessment of endemism and species richness across island and mainland regions. P Natl Acad Sci USA 106: 9322–9327.
Lovich J. & Ennen J.R. 2011. Wildlife Conservation and Solar Energy Development in the Desert Southwest, United States. BioScience 61: 982–992.
Lozon J.D. & MacIsaac H.J. 1997. Biological invasions: are they dependent on disturbance? Environ Rev 5(2): 131–144.
Luebert F. & Pliscoff P. 2006. Sinopsis bioclimática y vegetacional de Chile. Editorial Universitaria.

30
Malczewski J. 2006. Ordered weighted averaging with fuzzy quantifiers: GIS-based multicriteria evaluation for land-use suitability analysis. Int J Appl Earth Obs Geoinf 8: 270–277.
Meitner M.J. 2004. Scenic beauty of river views in the Grand Canyon: relating perceptual judgments to locations. Landscape Urban Plan 68: 3–13.
Mittermeier R. A., Mittermeier C. G., Brooks T. M., Pilgrim J. D., Konstant W. R., da Fonseca G.A.B. & Kormos C. 2003. Wilderness and biodiversity conservation. P Natl Acad Sci USA 100: 10309-10313.
Moreira-Muñoz A. 2011. 13 Current Climate and Vegetation. In: Werger M.J.A. (ed.), Plant geography of Chile. Springer, Dordrecht, Heidelberg, London, New York, pp. 33–34.
Mousazadeh H., Keyhani A., Javadi A., Mobli H., Abrinia K. & Sharifi A. 2009. A review of principle and sun-tracking methods for maximizing solar systems output. Renew Sust Energ Rev 13: 1800–1818.
Muñoz-Schick M., Pinto R., Mesa A. & Moreira-Muñoz A. 2001. “Oasis de neblina” en los cerros costeros del sur de Iquique, region de Tarapacá, Chile, durante el evento El Niño 1997–1998. Rev Chil Hist Nat 74: 389–405.
O’Sullivan D. & Turner A. 2001. Visibility graphs and landscape visibility analysis. Int J geogr inf sci 15: 221– 237.
Olson-Hazboun S.K., Krannich R.S. & Robertson P.G. 2016. Public views on renewable energy in the Rocky Mountain region of the United States: Distinct attitudes, exposure, and other key predictors of wind energy. Energy Res Soc Sci 21: 1–179.
Omer A.M. 2008a. Energy, environment and sustainable development. Renew Sust Energ Rev 12: 2265–2300.
Omer A.M. 2008b. Green energies and the environment. Renew Sust Energ Rev 12: 1789–1821.
Rey Benayas J.M. & de la Montaña E. 2003. Identifying areas of high-value vertebrate diversity for strengthening conservation. Biol Conserv 114: 357–370.
Roberts C.M., Branch G, Bustamante R.H., Castilla J.C., Dugan J., Halpern B.S., Lafferty K.D., Leslie H., Lubchenco J., Mcardle D., Ruckelshaus M. & Warner R.R. 2003. Application of Ecological Criteria in Selecting Marine Reserves and Developing Reserve Networks. Ecol Appl 13(1): 215–228.
Saaty T. 1997. A Scaling method for priorities in hierarchical structures. J Math Psychol 15: 234–81.
Saunders D.L., Meeuwig J.J. & Vincent A.C.J. 2002. Freshwater Protected Areas: Strategies for Conservation. Conserv Biol 16: 30–41.
Sevenant M. & Antrop M. 2009. Cognitive attributes and aesthetic preferences in assessment and differentiation of landscapes. J Environ Manage 90: 2889–2899.
Snelling R.R. & Hunt J.H. 1975. The ants of Chile (Hymenoptera: Formicidae). Rev Chil Entomol 9: 63–129.
Taucare-Ríos A. & Sielfeld W. 2013. Arañas (Arachnida: Araneae) del extremo norte de Chile. Bol Museo Na Hist Nat 62: 7–27.

31
Tilman D. 1982. Resource Competition and Community Structure. Princeton University Press.
Tracol Y., Gutiérrez, J.R. & Squeo F.A. 2011. Plant Area Index and microclimate underneath shrub species from a Chilean semiarid community. J Arid Environ 75: 1–6.
Tsoutsos T., Frantzeskakib N. & Gekasb, V. 2005 Environmental impacts from the solar energy technologies. Energ Policy 33: 289–296.
Turney D. & Fthenakis V. 2011. Environmental impacts from the installation and operation of large-scale solar power plants. Renew Sust Energ Rev 15: 3261–3270.
Tzoulas K., Korpela K., Venn S., Yli-Pelkonen V., Ka mierczak A., Niemela J. & James P. 2007. Promoting ecosystem and human health in urban areas using Green Infrastructure: A literature review. Landscape Urban Plan 81(3):167–178.
United Nations (2015) 21st Conference of the Parties of the UNFCCC in Paris. Retrieved in 2017 from https://treaties.un.org/doc/Publication/UNTS/No%20Volume/54113/Part/I-54113-0800000280458f37.pdf
Walker B., Kinzig A. & Langridge J. 1999. Plant Attribute Diversity, Resilience, and Ecosystem Function: The Nature and Significance of Dominant and Minor Species. Ecosystems 2: 95–113.
Wang J.-J., Jing Y.-Y., Zhang C.-F. & Zhao J.-H. 2009. Review on multi-criteria decision analysis aid in sustainable energy decision making. Renew Sust Energ Rev 13: 2263–2278.
Wang Q. & Qiu H.-N. 2009. Situation and outlook of solar energy utilization in Tibet, China. Renew Sust Energ Rev 13: 2181–2186.
Ward D. 2009. The Biology of Deserts. Oxford University Press, New York. Vargas G., Ortlieb L. & Rutlant J. 2000. Aluviones históricos en Antofagasta y su
relación con eventos El Niño/Oscilación del Sur. Rev geol Chile 27(2): 157–176.
Vellend M., Harmon L.J., Lockwood J.L., Mayfield M.M., Hughes A.R., Wares J.P. & Sax D.F. 2007. Effects of exotic species on evolutionary diversification. Trends Ecol Evol 22 (9): 481–488.
Villalva M.G., Gazoli J.R. & Filho E.R. 2009. Comprehensive Approach to Modeling and Simulation of Photovoltaic Arrays. IEEE T Power Electr 24: 1198–1208.
Wu Z., Anping H., Chun C., Xiang H., Duoqi S. & Zhifeng W. 2014. Environmental impacts of large-scale CSP plants in North-western China. Environ Sci Processes Impacts 16: 2432.
Wüsterhagen R., Wolsinkb M. & Jean Bürer M. 2007. Social acceptance of renewable energy innovation: An introduction to the concept. Energ Policy 35: 2683–2691.
Yonca Aydin N., Kentel E. & Duzgun S. 2010. GIS-based environmental assessment of wind energy systems for spatial planning: A case study from Western Turkey. Renew Sust Energ Rev 14: 364–373.

ORIGINAL PAPERS
I
THE INFLUENCE OF SOLAR POWER PLANTS ON MICROCLIMATIC CONDITIONS AND THE BIOTIC COMMUNITY IN CHILEAN DESERT
ENVIRONMENTS
by
Suuronen Anna, Muñoz-Escobar Christian, Lensu Anssi, Kuitunen Markku, Guajardo Celis Natalia, Espinoza Astudillo Pablo, Ferrú Marcos, Taucare-Ríos Andrés, Miranda
Marcelo & Kukkonen Jussi Vilho Kalevi 2017
Environmental Management 60(4): 630-642.
Reprinted with kind permission of Springer©

Environmental ManagementDOI 10.1007/s00267-017-0906-4
The Influence of Solar Power Plants on MicroclimaticConditions and the Biotic Community in ChileanDesert Environments
Anna Suuronen1 ● Christian Muñoz-Escobar2 ● Anssi Lensu1 ● Markku Kuitunen1 ●
Natalia Guajardo Celis3 ● Pablo Espinoza Astudillo4 ● Marcos Ferrú4 ●
Andrés Taucare-Ríos5 ● Marcelo Miranda3 ● Jussi V. K. Kukkonen1
Received: 19 September 2016 / Accepted: 10 June 2017© Springer Science+Business Media, LLC 2017
Abstract The renewable energy sector is growing at a rapidpace in northern Chile and the solar energy potential is oneof the best worldwide. Therefore, many types of solarpower plant facilities are being built to take advantage ofthis renewable energy resource. Solar energy is considered aclean source of energy, but there are potential environ-mental effects of solar technology, such as landscape frag-mentation, extinction of local biota, microclimate changes,among others. To be able to minimize environmentalimpacts of solar power plants, it is important to know whatkind of environmental conditions solar power plants create.This study provides information about abiotic and bioticconditions in the vicinity of photovoltaic solar power plants.Herein, the influence of these power plants as drivers of newmicroclimate conditions and arthropods diversity composi-tion in the Atacama Desert was evaluated. Microclimatic
conditions between panel mounts was found to be moreextreme than in the surrounding desert yet beneath thepanels temperature is lower and relative humidity higherthan outside the panel area. Arthropod species compositionwas altered in fixed-mount panel installations. In contrast,solar tracking technology showed less influence on micro-climate and species composition between Sun and Shade inthe power plant. Shady conditions provided a refuge forarthropod species in both installation types. For example,Dipterans were more abundant in the shade whereas Soli-fugaes were seldom present in the shade. The presentedfindings have relevance for the sustainable planning andconstruction of solar power plants.
Keywords Arthropod species composition ● The AtacamaDesert ● Environmental effect ● Microclimate ● Photovoltaicpower plant
Introduction
Chile depends on fossil fuels to satisfy its energy needs(Ortega et al. 2010; Jiménez-Estévez et al. 2015), but lackssignificant reserves of its own (Corral et al. 2012). Chileanenergy consumption is projected to grow 5.4% annuallyuntil 2030. Especially current inland production will need tobe increased (Tokman 2008). In addition, Chile has set amandatory quota that 20% of produced electricity has tocome from renewable energy sources by 2025 (Ortega et al.2010). Therefore, to reach this level of supply, renewableenergy sources are being promoted nationally (Fthenakis2009; Hernandez et al. 2014).
Solar radiation intensity in the North of Chile is one ofthe best worldwide, with an annual average Direct Normal
* Anna [email protected]
1 Department of Biological and Environmental Science, Universityof Jyvaskyla, P.O. Box 35, Jyvaskyla FI-40014, Finland
2 Doctoral Program of Systematics and Biodiversity, Department ofZoology, Faculty of Natural Sciences and Oceanographics,University of Concepción, Concepción, Chile
3 Department of Ecosystems and Environment, PontificiaUniversidad Católica de Chile, Santiago, Chile
4 Centro de Estudio y Muestreo Biológico, CEMABIO, Iquique,Chile
5 Department of Ecology Sciences, Faculty of Sciences, Universityof Chile, Santiago, Chile
Electronic supplementary material The online version of this article(doi:10.1007/s00267-017-0906-4) contains supplementary material,which is available to authorized users.

Irradiation of 9–10 kWh/(m2/day) (del Sol and Sauma2013). Such potential makes the Atacama Desert anattractive location for large-scale solar power plant projects(Corral et al. 2012; Jiménez-Estévez et al. 2015; Salazaret al. 2015). Nevertheless, the use of solar energy is in itsinitial phase in Chile (Ortega et al. 2010). In 2015, only 3%of total electricity was produced by solar energy in thecountry (Ministry of Energy, Chile 2015). However, theamount is growing because several solar power projects arein the works. These include photovoltaics (PV), con-centrated solar power, and thermal solar plants (Escobaret al. 2014).
Solar energy is a clean and safe energy source comparedto fossil fuels (Tsoutsos et al. 2005) although solar energyinstallation requires a large-scale landscape transformation(Chiabrando et al. 2009). Landscape fragmentation, theelimination of existing flora and fauna, changes in micro-climate and changes in surface albedo are some of the mainenvironmental impacts (Turney and Fthenakis 2011; Wuet al. 2014). Furthermore, rapid growth in renewables inrecent years has meant that management planning for solarinstallations is lagging behind (Lovich and Ennen 2011).Consequently, there is a lack of studies on this subject inChile, and existing studies usually focus on the technicalfactors, resource measurement, and economic impacts ofinstalling solar power plants (del Sol and Sauma 2013;Escobar et al. 2014; Ferrada et al. 2015).
Areas with high solar energy potential are often easilydisturbed fragile ecosystems, which exhibit difficulties inrecovery (Stoms et al. 2013). For example, biological soilcrusts take several years to recover from disturbance (Cal-lison et al. 1985; Johansen and Clair 1986). Solar powerplant construction can alter the soil conditions because thearea might be scraped to bare ground, and herbicides arecommonly used (Tsoutsos et al. 2005; Turney and Fthena-kis 2011). Consequently, these modifications might alter thelocal flora and fauna (Wu et al. 2014). However, impacts onbiodiversity can also be positive as the panels can createbeneficial microclimate for new species (Tsoutsos et al.2005). For instance, in the Chilean semiarid desert, themicroclimate beneath the shrub canopy can be favorable;contributing to species dispersion (Tracol et al. 2011), aneffect that might be mimicked by solar panels. According toWu et al. (2014), solar panels can increase soil humidity,which generates favorable conditions for biota.
The Atacama Desert is characterized by highly endemiclineages, monotypic taxa, and species with restricted dis-tribution (Agusto et al. 2006; Ferrú and Elgueta 2011;Hughes and Eastwood 2006; Pennington et al. 2010;Pizarro-Araya et al. 2008; Pizarro-Araya and Jerez 2004;Roig-Juñet and Flores 2001; Taucare-Ríos and Sielfeld2013; Toro-Núñez et al. 2015). This particular biota is theresult of a complex history of geomorphological and
climatic events, which promoted diverse environmentalconditions and a gradient of abiotic conditions (e.g., tem-perature and aridity) as a function of latitude and altitude(Luebert and Pliscoff 2006; Rundel et al. 1991).
In the Atacama Desert, arthropods are one of the mostabundant and diverse group of animals (Pizarro-Araya et al.2008). They are capable of maintaining vertebrate popula-tions (Gantz et al. 2009; Guzmán-Sandoval et al. 2007;Vidal et al. 2011) and are the keystones of many food webs(Samways 2005). Moreover, in desert systems, arthropodstake over functional roles that are occupied by annelids andother invertebrates in mesic environments (Whitford 2000).The latter stems from fewer restrictions due to low wateravailability and extreme temperature conditions in com-parison to other animal groups (Whitford 1991).
Some of the other studies have focused on microclimatechanges of solar facilities (Chiabrando et al. 2009; Kaygu-suz 2009; Lovich and Ennen 2011; Turney and Fthenakis2011). Nevertheless, only a few hypothetical schemesassume that changed microclimate conditions could have abeneficial effect on biota (Tsoutsos et al. 2005; Wu et al.2014). Despite of a few studies (Turney and Fthenakis2011; Wu et al. 2014) the impacts between solar powerplants and their surrounding environments have not yetbeen addressed comprehensively in literature. Therefore, itis crucial to understand what potential ecological impactsand environmental issues solar power plants have, related tothe growing installation of solar power plants in Chile.Moreover, it would be beneficial to know the most sus-tainable way to construct solar power plants into the Ata-cama Desert.
In the present study, a preliminary spatio-temporal eva-luation of the biodiversity (e.g., arthropods) and abioticparameters, temperature, relative humidity (hereinafterhumidity), and dew point, associated with micro-environments (beneath and between panels) was per-formed. Two solar power plants were included in the study:“Photovoltaic Solar Plant Subsole” (PSPS) was built in 2012and “Pozo Almonte Solar III” (PAS3) in 2013. Consideringthe large daily thermal oscillations and humidity con-densation beneath the solar panels, it is expected that theseareas might create favorable environmental conditions forarthropod assemblages and therefore act as refuges. Thismay lead to significant changes in arthropod assemblagesand abiotic conditions among the study sites. Differences inenvironmental conditions between the solar plants and theouter zone, and among sampling times may be significant.
The objectives of the study were to: (1) describe thevariation in temperature, humidity, and dew point within thetwo different solar power plants; (2) evaluate the spatio-temporal effects of solar plants on diversity and taxonomiccomposition of arthropods; (3) evaluate and link thearthropod distribution patterns with abiotic variables and
Environmental Management

biotic interactions; and (4) propose guidelines for sustain-able construction of solar power plants for decision makers,engineers, and environmental specialist.
Material and Methods
Study Sites
The two PV plants, PSPS and PAS3 situated in northernChile, differ in their mount technologies. PSPS consists ofsix arrays of fixed mounts. Panel mounts are north-facingand they cover an area of 1.0 ha with 0.5 ha of arrays with atotal of 42 panels (Fig. 1). PSPS has a power output of 0.3MW and it is located at the interior of Copiapó Valley in theAtacama region (27° 44.11′ S, 70° 11.45′ W). The vegeta-tion is semi-desert scrub (Moreira-Muñoz 2011). Annualrainfall is 10–50 mm and coastal fog brings humidity to thearea (Moreira-Muñoz 2011). Raining season is from June toAugust. The plant was built on former agricultural landbeside the river Copiapó and has an elevation of approx.773 m.
The PAS3 consists of 58,560 panel mounts with102 solar trackers, allowing the array to follow the Sun.This plant covers an area of 126 ha with 33 ha of arraysinstalled facing East in the morning and turning towardsWest during the day. PAS3 output power is 16MW andproduced electricity is used for mining processes (SolarPack 2013). The plant is located near Pozo Almonte city inTarapacá region (20° 15.37′ S, 69° 44.82′ W). The area issituated in the central desert with an elevation of 1030 m.Annual rainfall at Pozo Almonte is below 10 mm andvegetation is very scarce (Moreira-Muñoz 2011). Rainingseason in the Andes is from January to March, which mightcause floods to the study area.
During the study period, PSPS was 1 year old and PAS3was built only 5 months before this study. Geographicdistance of the two power plants is almost 800 km. The twostudied PV technologies vary in their shading conditions fortwo reasons. First, mounts have different orientation to thesun (Fig. 1), and second, solar tracking makes the shadechange its position at PAS3. Fixed panels have longerperiods of shade beneath the mounts than solar trackingpanels. Fixed panels allow the sunshine to enter under themounts very short moments during the sunrise and sunset.By contrast, moving panels shift from East to West duringthe day allowing direct sunlight to shine longer periodsunder the mounts. Therefore, the moving panels create moretemporary shading conditions than the fixed panels.
Study periods were chosen according to water avail-ability to obtain richer arthropod activity. Therefore, PSPSwas studied during September and November 2013, andPAS3 during January and February 2014. At PAS3, abioticdata were supplemented with data from 2015. Samplingunits of the experimental design considered three differentenvironmental conditions. They were called Sun, Shade,and Reference. Units were named according to mid-day sunconditions. Sun units were between the panels having sunnyconditions during the hottest hours of the day. Shade sam-pling units were below the solar panels and were shaded atleast during the mid-day. Finally, Reference units wereoutside the panel area.
Measurements of Abiotic Variables
Abiotic variables, temperature, humidity, and dew pointwere recorded with 16 data loggers (Lascar, EL-USB-1-LCD) during a 6-day period at PSPS and during 1 month atPAS3. Loggers were placed 10 cm above ground and pro-tected from solar radiation with white mesh (as suggestedin, e.g., Tracol et al. 2011). Loggers were divided into Sunand Shade sampling unit locations at the sites as explainedabove. The Reference area had two loggers for 2 days atPSPS and for 30 days at PAS3. Temperature, humidity, anddew point were measured with 1-min intervals at PSPS, and
PAS3
PSPS
12345678
9101112
100 m
100 m
N
{1 Mount
First Panel Group
123456
Fig. 1 Location and structure of solar power plants PAS3 (above) andPSPS (below). PAS3 is divided into three array groups and the firstgroup is numbered according to the arrays, each including 30 mounts.Numbers 1–6 in PSPS indicate arrays. Dashed lines around the panelareas indicate perimeter fences
Environmental Management

every 5 min at PAS3. To detect correlations between abioticvariables and distinct parts of the solar plants, arrays werenumbered starting from the northern edge of the solar plants(Fig. 1). Six arrays of the PSPS plant were observed forsmall-scale abiotic variables correlations, whereas at PAS3it was possible to study large-scale correlations betweenpanel groups. The first panel grouping of PAS3 (upper leftcorner of the plant, see Fig. 1) was divided into 12 rowsaccording to the sun tracking array groups.
Arthropod Collection and Identification
Arthropods were sampled with same method using30 sampling units at both study sites. However, since thesolar panels can drastically modify abiotic conditions atsmall scale, 10 sampling units were installed between thepanel mounts (Sun) and 10 beneath the panels themselves(Shade). On the north side of the perimeter fence, 10 sam-pling units were placed and used as a reference. Samplingprotocol proposed by Cepeda-Pizarro et al. (2005b) wasused in which each unit consisted of six interception traps ina grid of 1× 2 m. Traps were plastic recipients with dia-meter of 8.5 cm and height 10 cm and were buried at groundlevel and were filled 1/3 with propylene glycol as the pre-serving liquid. Locations of the sampling units were ran-domized. Reference sites were the same type of terrain asthe solar power plant areas themselves. Traps were oper-ating for four full days at both power plants; the contents ofeach trap were labeled and preserved in an 80% ethanolsolution for taxonomic determination and counting.Arthropods were identified afterwards. For taxonomicnomenclature, Snelling and Hunt (1975), Aguilera andCasanueva (2005), Ferrú and Elgueta (2011), Taucare-Ríosand Sielfeld (2013), among others were followed.
Statistical Analyses
Because of different locations and technologies, paneldesign, and sampling times, the studied solar power plantswere not directly comparable. Therefore, all the statisticalanalyses were performed separately.
Abiotic variables
For the characterization of abiotic variables, Sun conditionswere divided into Sun-front (arrays 1–2, Fig. 1) and Sun-back at PSPS (arrays 3–6, Fig. 1). Division was donebecause of high temperature differences among the Sunsampling units. To study spatial and temporal differences inabiotic variables, Linear Mixed-Effects models (LME) wereused in the R package “nlme” (Pinheiro et al. 2015) usingthe protocol of Zuur et al. (2009). Further interactions wereanalyzed using the pairwise argument of “testInteractions”
function in “phia” package (De Rosario-Martinez 2015)(Online Resources 1–3). To understand correlationsbetween abiotic variables and the arrays/array groups,Kendall’s tau correlation analyses (Kendall 1938) were used(Online Resource 4). Visual interpretations of abiotic vari-ables with significant spatial correlation were created withspatial interpolation method inverse distance weightingprogrammed with Python (Ascher et al. 2001) (OnlineResources 5–6).
Biotic data and abiotic variables
Obtaining the overall understanding how the biotic data wasdistributed at the two sites univariate and multivariateanalyzes were performed to the arthropod data. To sum-marize the arthropod assemblages, for each sampling unitwithin each sampling time, richness (S), abundance (N), andspecies composition were estimated. A Euclidean distancematrix of differences between every pair of observationswas calculated to assess richness and abundance. To ana-lyze the arthropods composition, the species abundancesdata were transformed with square root and a Bray-Curtis(Clarke et al. 2006) similarity matrix was generated. Tovisualize and detect the main sources of variation inassemblage structure, a non-metric multi-dimensional scal-ing was performed as an ordination method (Kruskal 1964).The effects of environmental conditions and sampling timeon arthropods biodiversity and species composition wereanalyzed with permutational multivariate analysis of var-iance (PERMANOVA, Anderson 2001a). Analyses wereperformed with PRIMER v6.1.12 (Clarke and Gorley 2006)and PERMANOVA+ v1.0.2 add-on software (Andersonet al. 2008). In cases of significant differences, pair-wisetests for all combinations of factors were conducted usingthe t-statistic (pseudo t-test) (Anderson and Robinson2003). The statistical significances of variance componentswere tested using 10,000 permutations of residuals under areduced model and type III sums of squares (Anderson2001b). To test the effect of the taxonomic resolution, theRELATE routine (Clarke and Ainsworth 1993) wasperformed.
After finding out that there were significant differencesamong the environmental conditions with PERMANOVA,similarity percentages routine (SIMPER, Clarke 1993) wasperformed to identify which arthropod orders were causingthe differences. Further, to determine the best combinationof abiotic variables that explained the overall multivariatearthropods pattern, the BIO-ENV (Clarke et al. 2008) rou-tine was used. Subsequently, to understand how speciescomposition was structured among abiotic variables, link-age tree analysis (LINKTREE, Clarke et al. 2008) in con-junction with similarity profile test was performed
Environmental Management

(SIMPROF, Clarke et al. 2008) to settle the terminal nodesstatistically.
Finally, to evaluate our prediction of solar panels actingas refuge in each study site, for each arthropod species thedegree of nestedness was estimated with the NODF index(Almeida-Neto et al. 2008). Furthermore, due to possiblebiotic interactions, the co-occurrence pattern was evaluatedto test the species aggregation/segregation among environ-mental conditions using modified C-score index (Ulrich andGotelli 2013) as proxy. These analyses (i.e., nestedness andaggregation/segregation) were performed using the pro-grams NODF v2.0 (Almeida-Neto et al. 2008) andTURNOVER v1.1 (Ulrich and Gotelli 2013), respectively.
Results
Abiotic Conditions
Characterization of abiotic variables
Temperature, humidity, and dew point were affected bysampling month, environmental conditions, and day/nightinteraction according to all LME models (Table 1). In pairwise analyses, temperature did not differ between Shadeand Sun-front arrays during the day time at PSPS (Fig. 2a).In contrast, Sun-back were warmer than other
environmental conditions (Fig. 2a). At PAS3, Sun, Shadeand Reference had unique microclimates during the daytime. Shade had higher temperature than Sun during themorning and late afternoon hours (Fig. 2b). Shade humidityconditions were higher than Sun or Reference during theday time from 8:00 to 18:15 (Fig. 2c) at PSPS. This wasalso true at PAS3, however, only between 10:11 and 16:30(Fig. 2d).
PSPS Reference dew point was significantly differentfrom Shade or Sun conditions during the day time (Fig. 2e).Reference had a high peak in the morning meaning thattemperature increased faster at the Reference than in thepanel area. At PSPS, night time microclimate conditions didnot differ (Figs. 2a, c) except References’ dew point wassignificantly lower (Fig. 2e). The same was true at PAS3(Fig. 2f). Nevertheless, diurnal dew point at PAS3 did notshow statistical differences between environmental condi-tions (Fig. 2f). Reference was significantly cooler and morehumid during the night compared to panel area while Sunand Shade did not differ (Figs. 2b, d). Abiotic conditionschanged with delay in the solar power plant areas. Forexample, temperature values stayed at high levels longerduring the morning hours and heat lingered longer in theafternoon compared to Reference (Figs. 2a–f).
Correlations of abiotic variables
Statistically significant Kendall’s correlation was observedbetween the mean temperatures and the array numbers inSun (z= 2.07, p= 0.039, τ= 0.41) and Shade (z= 2.04, p= 0.042, τ= 0.42) (Fig. 3a) sampling units at PSPS in2013. The mean humidity (Fig. 3b) had a significantnegative correlation (z=−2.27, p= 0.023, τ=−0.46) withthe array numbers. Thus, the maximum temperaturesstrongly correlated with the array numbers (z= 4.40, p<0.001, τ= 0.84) (Fig. 3c), showing the same pattern asmean temperature. Temperature rose extremely high in theback arrays of PSPS plant, reaching 52 °C, which maycause reduction of efficiency of the PV panels (Krauter2004). At PAS3, there were no significant correlationamong abiotic variables among array groups (Fig. 3d).
Biotic Conditions
Diversity and taxonomic composition
1364 individuals belonging to 18 orders of terrestrialarthropods with 87 morphospecific taxa were collected. Ofthese, 53 morphospecies (n= 952) were found at PSPS and45 morphospecies (n= 412) at PAS3. The most abundanttaxa can be seen in Table 2.
The main difference in species richness was amongenvironmental conditions at PSPS, but at PAS3 depended
Table 1 Results of LME models for abiotic response variables(temperature, humidity, dew point) in both study sites
Temperature Humidity Dew Point
F-value F-value F-value
PSPS
Intercept 40.34*** 23.30*** 219.22***
Month 0.02 0.13 107.41***
Env. 6.86*** 0.29 4.53*
Day / Night 1055.21*** 465.90*** 281.12***
Month× Env. 0.19 0.03 10.21***
Env.×Day / Night 8.45*** 2.33 1.50
Month× Env.×Day / Night 24.65*** 19.23*** 37.25***
PAS3
Intercept 2723.60*** 3313.60*** 6637.15***
Month 13.14*** 6.96* 75.86***
Env. 9.26*** 11.55*** 3.75*
Day / Night 6021.20*** 4592.93*** 102.86***
Month× Env. 0.45 2.55 0.17
Env.×Day / Night 18.39*** 11.83*** 4.30*
Month× Env.×Day / Night 9.03*** 3.34** 4.94**
Env. stands for environmental condition (Sun, Shade, Reference)
* P< 0.05; ** P< 0.01; *** P< 0.001
Environmental Management

on both environmental conditions and the sampling month(Table 3). In addition, abundances only showed temporaldifferences at PAS3 (Table 3). However, the spatial diver-sity patterns depend on intrinsic local conditions, bothenvironmental (Figs. 4a and b) and temporal (Fig. 5). Forinstance, the number of morphospecies (S) at PSPS was
higher in Shade compared to Sun (Fig. 4a, Table 4).Opposite pattern was observed in the richness (S) at PAS3(Fig. 4b), Shade did not differ significantly from Sun(Table 4). Both sites show no abundance differences amongenvironmental conditions (Table 4). In temporal terms,abundances (N) and richnesses (S) were the same at PSPS
PSPS PAS3
AB
B
C
B
A
C
A
B
B
Sun-backSun-frontShadeReference
Mean D
ew
Poin
t (°
C)
Mean
Hum
idity
(%)
Mean T
em
pera
ture
(°C
)a)
0
5
10
15
20
25
30
35
40
45
em
pera
ture
(°C
)
c)
Mean H
um
idity
(%
)
d)
0
2
4
6
8
10
12
14
16e)
Mean D
ew
Poin
t (°
C)
f)
b)
0 2 4 6 8 10 12 14 16 18 20 22Time (hour)
SunShadeReference
SunShadeReference
0
10
20
30
40
50
60
70
80
Time (hour)
0 2 4 6 8 10 12 14 16 18 20 22Time (hour)
Time (hour)0 2 4 6 8 10 12 14 16 18 20 22
Time (hour)
Time (hour)
Me
an
T
Fig. 2 Plots of a and b mean temperature, c and d mean humidity, ande and f mean dew point at PSPS on the left and PAS3 on the right.Nights are denoted with a grey background. Letters A–C in the figures
indicate significant contrast between environmental conditions duringthe night or day time
Environmental Management

(Table 3). The opposite was observed at PAS3, where thefirst sampling time was higher on richness and abundance(Fig. 5).
Arthropod assemblages were statistically dissimilaramong environmental conditions and the sampling times atboth sites (Table 3). However, the taxonomic compositionof PAS3 did not indicate variation in the communityassembly between Sun and Shade. PSPS presents differ-ences between areas beneath solar panel and Reference/Sunareas (Table 4). Figure 6 shows the nMDS ordering of thespatial and temporal components of both places. A strongcorrelation between full species dataset and the order-taxonmatrix for multivariate community patterns was observed(RELATE: PSPS: ρ= 0.68, p< 0.001 and PAS3: ρ= 0.63,p< 0.001). The spatial and temporal variations, observed in
PERMANOVA pairwise tests, were associated with dif-ferent orders of arthropods (Table 5). For example, thespatial structuring was based on eight orders that con-tributed over 91%; the most important were Solifugae,Coleoptera, and Orthoptera to PSPS, and Diptera, Hemi-ptera, and Trichoptera to PAS3. Solifugae and Dipteraexplained the main dissimilarities at PSPS between Shadeand the sunny (Sun/Reference) environments. In terms oftemporal structuring, six orders contributed over 90% to theobserved structure at PSPS; even though taxa contributionsare similar, Hymenoptera presents higher abundances inOctober. Trichoptera was the most dominant order at PAS3Reference, whereas Diptera in the panel area (Sun/Shade).Finally, four orders, including Hymenoptera, contributedover 93% to temporal structuration at PAS3. All taxaincreased their abundances in the second sampling time,except for Trichoptera, which decreased (Table 5).
Linkages among arthropod assemblages and abioticvariables
The BIO-ENV test showed a significant link between globalarthropod assemblages and statistical descriptor valuescalculated from a suite of environmental variables at bothsites. For instance, five of the studied variables, temperature(minimum and standard deviation), and humidity (standarddeviation, range, and mode) best explained the overallspecies arrangement at PSPS (BEST: Spearman’s ρ=0.238, p< 0.004). However, variables related to
a) b)
Max
Tem
pera
ture
(°C
)
Max
Tem
pera
ture
(°C
)
1 2 3 4 5 6
47
43
41
39
22
20
18
16
50
45
40
35
30
Mea
n H
umid
ity (%
)
Mea
n Te
mpe
ratu
re (°
C)
Array
Array group2 4 6 8 10 12
c) d)
1 2 3 4 5 6Array
1 2 3 4 5 6
Array
50
45
40
35
30
ShadeSun
45
ShadeSun
Fig. 3 Scatterplots of a averagetemperature b average RH, and cmaximum temperature amongarray numbers at PSPS, and dmaximum temperature amongarray groups at PAS3
Table 2 Percentages and counts of most abundant taxa
PSPS PAS3
% n % n
Araneae 6.9 66
Diptera 6.5 62 45.4 187
Coleptera 22.5 214 6.3 26
Orthoptera 22.3 212
Hymenoptera 16.5 157 6.3 26
Hemiptera 23.3 96
Trichoptera 12.6 52
Total 952 412
Environmental Management

Table 3 Results ofPERMANOVA main testamong environmental conditionsand sampling times
Community parameters Taxonomic composition
Richness (S) Abundance (N) Bray-Curtis
Source df Pseudo-F P (perm) Pseudo-F P (perm) Pseudo-F P (perm)
PSPS
Env. 2 6.14 0.003 1.81 0.176 5.81 <0.001
S. time 1 3.42 0.069 0.03 0.882 3.69 <0.001
Env.× S. time 2 0.71 0.493 0.35 0.713 0.63 0.884
Residuals 54
Total 59
PAS3
Env. 2 4.33 0.008 0.49 0.620 2.33 0.002
S. time 3 21.74 <0.001 8.97 <0.001 7.54 <0.001
Env.× S. time 6 2.40 0.031 1.79 0.104 1.31 0.523
Residuals 99
Total 110
Env. stands for environmental condition (Sun, Shade, Reference), and S. time for sampling time
Fig. 4 Species richness (S), andabundance (N) amongenvironmental conditions a inPSPS and b in PAS3. Verticallines show standard error
SepOct SepOct JanFeb JanFeb
PSPS PAS3
0
5
10
15
20
25
Num
ber
of In
divi
dual
s (N
)
0
1
2
3
4
5
6
7
8
9
10
Num
ber
of M
orph
ospe
cies
(S
)
S N
Fig. 5 Temporal averages of richness (S), and abundance (N). Verticallines show standard error
Table 4 Summary of paired t-tests among environmental conditions
Community parameters Taxonomic composition
Richness (S) Bray-Curtis
Shade Sun Ref. Shade Sun Ref.
Shade 0.19 2.95** 1.15 1.55*
Sun 2.67* 2.72** 2.33*** 1.87***
Ref. 2.94** 0.10 2.92*** 1.77
Results of pairwise comparisons between environmental conditions atPAS3 and at PSPS are above and below the main diagonal,respectively
* P< 0.05; ** P< 0.01; *** P< 0.001
Environmental Management

temperature (minimum, maximum and mode) explained theglobal biotic pattern at PAS3 (BEST: Spearman’s ρ=0.325, p= 0.020). The divisive cluster algorithm did notfind an effective way to describe the species-environmentrelationships at PSPS. In contrast, the resulting linkage atPAS3 had one division based on inequalities in minimumtemperatures (Fig. 7). In this case, the abiotic variablesexplained the biotic structure mostly according to samplingtimes (i.e., January and February). In a broad sense, it was
noticed that the variation in abiotic variables was not evi-dent from the spatial clustering of morphospecies (i.e.,according to PERMANOVA tests).
The role of shade as refuges and co-occurrence patterns
At both sites, there was evidence of nestedness in co-occurrence patterns in the arthropods distribution and sig-nificant nestedness among sampling units and
Stress: 0.28ReferenceSunShade
PSPSa) PAS3ReferenceSunShade
b) Stress: 0.22
SepOct
PSPSStress: 0.28c) PAS3JanFeb
Stress: 0.22d)
Fig. 6 Ordination of observedarthropod species compositionby non-metric multidimensionalscaling based on square roottransformed Bray-Curtissimilarities betweenenvironmental conditions a atPSPS and b at PAS3, andsampling times c at PSPS and dat PAS3 with 50 restarts
Table 5 Results of the analysis of similarity percentage with all taxa grouped by order (SIMPER), according to the groups noted significant in thePERMANOVA pairwise tests
Environmental condition Sampling time
PSPS PAS3 PSPS PAS3
Average similarity(%)
Ref./Sun (53.25) Shade(52.60)
Ref.(35.53)
Sun/Shade(38.33)
September(50.14)
October(49.58)
January(46.65)
February(25.68)
Contribution (%)
Araneae 7.33 13.24 15.09 5.66
Coleoptera 27.11 39.82 34.78 30.32
Diptera 15.57 29.55 60.32 7.08 8.2 50.14 54.27
Hemiptera 31.88 17.29 19.31 24.55
Hymenoptera 6.95 10.94 10.9 8.53
Orthoptera 17.69 11.59 15.94 17.22
Solifugae 32.77 17.86 17.96
Trichoptera 37.50 23.71 6.67
Total contribution 91.84 91.16 98.93 77.61 90.76 90.27 93.16 94.03
Total orders 5 5 3 2 5 6 3 4
Environmental Management

morphospecies independently (NODF-values in Table 6).On the other hand, a higher C-score value than expected bychance was evidence for a segregated pattern of speciesamong environmental conditions at PSPS. There was nosignificant pattern of morphospecies aggregation nor seg-regation at PAS3, indicating that morphospecies are dis-tributed independently of each other (Table 6).
Discussion and Conclusions
Abiotic Environment of Solar Power Plants
The studied PV technologies created different microclimaticconditions. Shading and energy intake by the panels chan-ges the energy balance of soil and affects the temperature(Wu et al. 2014). This was seen in both studied solar power
plants. Fixed mounts create a shade where the temperatureis cooler and humidity is higher than in the sun conditionsthroughout the day. In contrast, solar tracking creates tem-porally varying shading conditions.
The conditions at sun areas between arrays were moreextreme than on the desert around it. Wind environment isaffected by the solar power plants (Wu et al. 2014) and thisis most likely the case also on the studied PV installations.Altered wind speed would explain why microclimaticchanges in fixed mount structure occur already in a small-scale solar plant and maximum temperature rises by theincreasing array number in Shade and in Sun conditions. Inthe night time, big scale power plant creates a warmer anddryer microclimate than on the surrounding desert, whereasthe effect of a small scale solar plant is not clearly seen.
Biotic Environment of Solar Power Plants
The type of PV power plant seems to be an important factorwhen considering the plants’ effects on biodiversity. Theresults presented showed a clear spatio-temporal effect onrichness and taxonomic composition. However, Sun andShade have a differing effect on the number of morphos-pecies. There were no taxonomic composition differences inenvironmental conditions (i.e., Sun and Shade) within thestudied solar tracking technology plant (PAS3), and onlyShade conditions differed in the fixed-mount technologyplant (PSPS).
In general, most of the studies have focused on micro-climate impacts of solar facilities’ design (e.g., Chiabrandoet al. 2009; Lovich and Ennen 2011; Turney and Fthenakis2011), and only a few hypothetical schemes assume bene-ficial effect on microclimate and biota by the shade condi-tions under the solar panels (Tsoutsos et al. 2005; Wu et al.2014). In fact, this study should reach the same conclusions,since greater humidity conditions beneath panels could bebeneficial to biota showing as increased number of species.However, analyses in this study showed no explicit linkage
B%
R=0.25; B%=75
T (min) < 7.5 T (min) > 9.0
[6 Sun,6 Shade, 2 Ref.]
January 14
[4 Sun,7 Shade, 2 Ref.]
[2 Sun,2 Shade]
January 4
February 14
Fig. 7 Linkage tree analysis (LINKTREE) at PAS3 showing cluster-ing of sampling units based on morphospecies composition con-strained by abiotic variables. For each split, R is the optimal ANOSIMR value (relative subgroup separation). The B% statistic shows theabsolute measure of group differentiation, and considers the ranksfrom the original resemblance data. The significant environmentalvariable(s) (SIMPROF, p< 0.05) that define each division are listed atthe branching point (A). T stands for temperature
Table 6 Co-occurrenceanalysis of morphospecies bysampling unit data set of PSPSand PAS3 arthropods
PSPS PAS3
Observed Simulated Observed Simulated
NODF 28.48*** 23.22 29.17*** 16.61
(20.93–25.72) (13.56–20.12)
NODFc 34.31** 28.91 35.42*** 19.72
(sites) (25.49–32.66) (14.89–25.39)
NODFr 21.00*** 15.91 21.13*** 12.6
(species) (13.60–18.36) (9.73–16.11)
C-score 0.01672*** 0.01562 0.0066 0.0065
(0.0148–0.0162) (0.0058–0.0071)
Term “sites” refers to sampling units in this table
Environmental Management

between abiotic conditions and spatial biota arrangement.According to this study, there were no benefits on biotabecause of microclimatic conditions. This is a paradoxicalresult, since microclimate conditions beneath fixed-tableswere more stable, and a significant nested co-occurrencepattern was observed at PSPS.
Fixed mounts could act as refuges for biodiversity (e.g.,Araneae, Coleoptera, Diptera, and Hymenoptera), becausebiotic segregate pattern was observed with differences ofarthropod species distributions. Accordingly, Solifugaeinhabited only Sun/Reference and Diptera Shade condi-tions. Moreover, there is a possibility of microhabitatselection regardless of the microclimatic conditions. Forexample, some spider species might consider solar panels asdiscrete habitat patches, and web spiders at habitat edges areexpected to increase because of the facilitation to buildwebs in anthropic environments and to improve their fitness(Wise 2006). As a result from the increase in edge habita-tion, there were changes in species interactions which maybe beneficial or detrimental to edge organisms depending ontheir intrinsic ecological traits (Cobbold and Supp 2012).The latter supports the idea that the structure of fixed-mounts determined the spatial assemblage pattern ratherthan abiotic conditions.
Although a nestedness pattern was observed at PAS3 aswell, it cannot be asserted that solar tracking panels act as arefuge to biodiversity. Contrary to the findings in fixed-mount technology (PSPS), the pattern observed at PAS3was due to a temporal factor, which modulated the abioticparameters. Seasonal changes in arthropod compositionwere seen especially at PAS3 where the abundance of thesecond sampling time was lower. In this case, the mainstructuration source was dew point, which acted as anenvironmental filter. Thereby, during the first sampling time(January) dew point was significantly higher than on thesecond sampling time (February). In other words, whencomparing the first and the second sampling times, increasein dew point made less condensed water available at highertemperatures that explained why both community para-meters and taxonomic composition varied between thesampling times.
Solar tracking panels had no spatial assemblage differ-ences among environmental conditions inside the panelarea. Considering that PAS3 facilities are bigger than theones at PSPS, the impact of disturbance is thought to begreater. However, the effect of disturbance relies on theirfrequency and intensity (Connell 1978). It should be notedthat PAS3 was built quickly because terrain conditions wereeasy to modify. Unstable communities are often known tobe the most resilient, so unstable communities are morelikely to return to their previous composition and structurefollowing some kind of disturbance (Holling 1973). See-mingly, the solar tracking panels at PAS3 generate an
unstable environment beneath them because shadows areconstantly moving during the day, and they prevent thedirect sunlight only partially. This explains how assem-blages within the solar plant had no differences in theirtaxonomic composition. Solar panel area’s species compo-sition was different from the Reference which was under-standable because the solar power plant was recentlyinstalled. In addition, soil at PSPS is heavily used anddevelopment of biological crust has not been possible. Onthe contrary, PAS3 Reference was untouched ground.Therefore, the existence of biological crust could explaindifferences between the solar panel area and Reference.
Guidelines for Enhancing Sustainability of Solar PowerPlants
This preliminary study showed that PV power plant tech-nology modifies microclimatic and biota conditions, but theway and magnitude of the effects depend on local condi-tions and power plant’s scale. In this sense, it is important toconsider the high level of endemism and heterogeneousecosystems within the Atacama Desert in Chile as othershave suggested (Jerez 2000). Given the geographic distancebetween the sites in this study and the terrain differences,these results are not comparable. The effects of solar powerplants described earlier suggest that the evaluation of solarpanels’ impacts on biota cannot be extrapolated to largerscales (i.e., regional, global). Because of scarcity of infor-mation and the limited focus of the present study, werecommend that both spatial short-term and long-term scaleenvironmental studies are conducted at solar power plants.
The design and arrangement of solar panels is especiallyimportant in the case of fixed mounts; for instance, at PSPS,during the construction of the solar plant, distances betweenmounts were not considered. Having more space betweenthe mounts, like there is at PAS3, could allow the cool air toget inside the solar power plant and the extreme abioticconditions could be prevented. The terrain type should alsobe considered during the construction of solar power plants.Construction of solar power plants necessarily demands soilmodifications (Chiabrando et al. 2009) and might alter localbiota (Wu et al. 2014), but if construction is done quickly,desert arthropod species might have better resilience.
The studied reference areas represent a small fraction ofthe Atacama Desert and the impact of different technologieson distinct type of desert ecosystems can be very different.This is important if the landscape heterogeneity of northernChile is considered (Luebert and Pliscoff 2006), especiallyin the Flowering Desert area (Moreira-Muñoz 2011). Thetechnology and design used at PAS3 seems to have asmaller impact on biota, because this plant did not have asignificant impact on arthropod composition inside thepanel area. Nevertheless, new studies are required to rule
Environmental Management

out an effect of the different types of desert ecosystems.Finally, this study highlighted the importance of evaluatingthe impact of solar plants considering the interaction ofbiotic and abiotic components as the first step. Thus, deci-sion makers, engineers and environmental specialist shouldalso focus on the proposed ecological aspects and changesin physical environment observed in this study. Althoughthe solar power plants are considered to have a small impactcompared to conventional energy production methods(Lovich and Ennen 2011; Tsoutsos et al. 2005) it is stillbetter to decrease the impacts of solar power plant con-struction if it is possible.
Acknowledgements The authors would like to thank Solar Pack andSubsole for their collaboration and support in this study. FundaciónChile and Eduardo Soto Sepúlveda (Phineal), who helped with ideasand logistic support, are also gratefully acknowledged. Funding for A.Suuronen was supplied by the Academy of Finland [grant no 269468].
Compliance with Ethical Standards
Conflict of Interest The authors declare that they have no compet-ing interests.
References
Aguilera M, Casanueva M (2005) Araneomorphae chilenas: estadoactual del conocimiento y clave para las familias más comunes(Aracnida: Araneae). Gayana 69(2):201–224
Agusto P, Mattoni CI, Pizarro-Araya J, Cepeda-Pizarro J, López-Cortés F (2006) Communities of scorpions (Arachnida: Scor-piones) of the transitional coastal desert of Chile. Rev Chil HistNat 79:407–421
Almeida-Neto M, Guimarães P, Guimarães Jr PR, Loyola RD, UlrichW (2008) A consistent metric for nestedness analysis in ecolo-gical systems: reconciling concept and quanti-fication. Oikos117:1227–1239
Anderson MJ (2001a) A new method for non-parametric multivariateanalysis of variance. Austral Ecol 26:32–46
Anderson MJ (2001b) Permutation tests for univariate or multivariateanalysis of variance and regression. Can J Fish Aquat Sci58:626–639
Anderson MJ, Gorley RN, Clarke KR (2008) PERMANOVA+ forPRIMER: guide to software and statistical methods. PRIMER_E,Plymouth
Anderson MJ, Robinson J (2003) Generalized discriminant analysisbased on distances. Aust NZ J Stat 45:301–318
Ascher D, Dubois PF, Hinsen K, Hugunin J, Oliphant T (2001)Numerical Python. Lawrence Livermore National Laboratory,Livermore, California, USA. http://www.pfduboiscom/numpy/
Callison J, Brotherson JD, Bowns JE (1985) The effects of fire on theblackbrush [Coleogyne ramosissima] community of South-western Utah. J Range Manage 38:535–538
Cepeda-Pizarro J, Pizarro-Araya J, Vásquez H (2005b) Variación en laabundancia de Artropoda en un transecto latitudinal del desiertocostero transicional de Chile, con énfasis en los tenebriónidosepígeos. Rev Chil Hist Nat 78:651–663
Chiabrando R, Fabrizio E, Garnero G (2009) The territorial andlandscape impacts of photovoltaic systems: definition of impacts
and assessment of the glare risk. Renew Sust Energ Rev13:2441–2451
Clarke KR (1993) Non-parametric multivariate analyses of change incommunity structure. Aust J Ecol 18:117–143
Clarke KR, Ainsworth M (1993) A method of linking multivariatecommunity structure to environmental variables. Mar Ecol-ProgSer 92:205–219
Clarke KR, Gorley RN (2006) PRIMER v6: user manual. TutorialPRIMER-E. Ltd, Plymouth
Clarke KR, Somerfield PJ, Gorley RN (2008) Testing of nullhypotheses in exploratory community analyses: similarity profilesand biota-environment linkage. J Exp Mar Biol Ecol 366:56–69
Clarke KR, Somerfield PJ, Chapman MG (2006) On resemblancemeasures for ecological studies, including taxonomic dissim-ilarities and a zero-adjusted Bray-Curtis coefficient for denudedassemblages. J Exp Mar Biol Ecol 330:55–80
Cobbold SM, Supp SR (2012) Patch shape alters spider communitystructure: links between microhabitat choice and sensitivity toincreased edge habitat. J Insect Conserv 16:581–589
Connell JH (1978) Diversity in tropical rain forest and coral reefs.Science 199:1302–1310
Corral N, Anrique N, Fernandes D, Parrado C, Cáceres G (2012)Power placement and LEC evaluation to install CSP plants innorthern Chile. Renew Sust Energ Rev 16:6678–6685
De Rosario-Martinez H (2015) phia: Post-Hoc Interaction Analysis Rpackage, version 02-1 https://CRANR-projectorg/package=phia
del Sol F, Sauma E (2013) Economic impacts of installing solar powerplants in northern Chile. Renew Sust Energ Rev 19:489–498
Escobar R, Cortés C, Pino A, Bueno Pereira E, Ramos Martins F,Cardemil JM (2014) Solar energy resource assessment in Chile:Satellite estimation and ground station measurements. RenewEnerg 71:324–332
Ferrada P, Araya F, Marzo A, Fuentealba E (2015) Performanceanalysis of photovoltaic systems of two different technologies ina coastal desert climate zone of Chile. Sol Energy 114:356–363
Ferrú M, Elgueta M (2011) Lista de Coleópteros (Insecta: Coleoptera)de Las Regiones de Arica y de Tarapacá, Chile. Bol. Mus NacHist Nat 60:9–61
Fthenakis V (2009) Sustainability of photovoltaics: the case for thin-film solar cells. Renew Sust Energ Rev 13:2746–2750
Gantz A, Rau J, Couve E (2009) Ensambles de Aves en El DesiertoAtacama, Norte Grande de Chile. Gayana 73(2):172–179
Guzmán-Sandoval J, Sielfeld W, Ferrú M (2007) Dieta de Lycalopexculpaeus (Mammalia: Canidae) El Extramo Norte de Chile(Región de Tarapacá). Gayana 71(1):1–7
Hernandez RR, Easter SB, Murphy-Mariscal ML, Maestre FT,Tavassoli M, Allen EB, Barrows CW, Belnap J, Ochoa-Hueso R,Ravi S, Allen MF (2014) Environmental impacts of utility-scalesolar energy. Renew Sust Energ Rev 29:766–779
Holling CS (1973) Resilience and stability of ecological systems.Annu Rev Ecol Syst 4:1–23
Hughes CE, Eastwood RJ (2006) Island radiation on a continentalscale: exceptional rates of plant diversification after uplift of theAndes. Proc Nat Acad Sci 103:10334–10339
Jerez V (2000) Diversidad y patrones de distribución geográfica deinsectos coleópteros en ecosistemas desérticos de la región deAntofagasta, Chile. Rev Chil Hist Nat 73:79–92
Jiménez-Estévez G, Palma-Behnke R, Latorre R, Morán L (2015) Heatand dust - The solar energy challenge in Chile. IEEE PowerEnergy M 13:71–77
Johansen JRSt, Clair LL (1986) Cryptogamic soil crusts: recoveryfrom grazing near camp Floyd State Park, Utah, USA. GreatBasin Nat 46:632–640
Kaygusuz K (2009) Environmental impacts of the solar energy sys-tems. Energ Source Part A 31:1376–1386
Environmental Management

Kendall M (1938) A new measure of rank correlation. Biometrika 30(1–2):81–89. doi:10.1093/biomet/30.1-2.81
Krauter S (2004) Increased electrical yield via water flow over thefront of photovoltaic panels. Sol. Energ. Mat Sol Cells82:131–137
Kruskal JB (1964) Nonmetric multidimensional scaling. Psychome-trika 29:1–27
Lovich J, Ennen JR (2011) Wildlife conservation and solar energydevelopment in the desert Southwest, United States. BioScience61:982–992
Luebert F, Pliscoff P (2006) Sinopsis bioclimática y vegetacional deChile. 1st edn, Editorial Universitaria, Santiago de Chile
Ministry of Energy, Chile (2015) 2015 Energy statistical year bookChile. https://www.cne.cl/wp-content/uploads/2016/07/AnuarioCNE2015_vFinal-Ingles.pdf. Accessed April 2017
Moreira-Muñoz A (2011) Plant geography of Chile, 13 current climateand vegetation. Springer, Dordrecht, Heidelberg, London, NewYork, p 33–34
Ortega A, Escobar R, Colle S, Lunade AS (2010) The state of solarenergy resource assessment in Chile. Renew Energ35:2514–2524
Pennington RT, Lavin M, Särkinen T, Lewis GP, Klitgaard BB,Hughes CE (2010) Contrasting plant diversification historieswithin the Andean biodiversity hotspot. Proc Natl Acad Sci USA107:13783–13787
Pinheiro J, Bates D, DebRoy S, Sarkar D, and R Core Team (2015)nlme: Linear and Nonlinear Mixed Effects Models R package.version 31-122. URL: http://CRANR-projectorg/package=nlme
Pizarro-Araya J, Ceppeda-Pizarro J, Flores GF (2008) DiversidadTaxonómica de los Artrópodos Epígeos de la Región de Atacama(Chile). In: Squeo FA, Arancio G, Gutiérrez JR (Eds.) Estado delConocimiento Libro Rojo de la Nativa y de los sitios Prioritariospara su Conservación: Región de Atacama. Ediciones Uni-versidad de La Serena, La Serena, p 267–284. 14
Pizarro-Araya J, Jerez V (2004) Distribución geográfica del géneroGyriosomus Guérin-Méneville, 1834 (Coleoptera: Tenebrioni-dae): una aproximación biogeográfica. Rev Chil Hist Nat77:491–500
Roig-Juñet S, Flores GE (2001) Geográfica de las áreas áridas deAmérica del Sur Austral. Teorías, conceptos, métodos y aplica-ciones. In: Llorente-Busquets J, Morrone JJ (eds) Introducción ala biogeografía en Latinoamérica Historia. Las prensas de Cien-cias, Facultad de Ciencias. UNAM, México, p 257–266
Rundel PW, Dillon MO, Palma B, Mooney H, Gulmon SL, EhleringerJR (1991) The Phytogeography and ecology of the costal Ata-cama and Peruvian deserts. Aliso 13:1–50
Salazar G, Checura Diaz MS, Denegri MJ, Tiba C (2015) Identifica-tion of potential areas to achieve stable energy production usingthe SWERA database: A case study of northern Chile. RenewEnerg 77:208–216
Samways MJ (2005) Insect diversity conservation. In: Del Claro K,Olivera PS, Rico-Gray V (eds) Tropical biology and conservationmanagement. Cambridge University Press, New York, NY, p342. Vol. VII
Snelling RR, Hunt JH (1975) The ants of Chile (Hymenoptera: For-micidae). Rev Chil Entomol 9:63–129
Solar Pack (2013) Descripción General, in: Memoria Técnica V05,Plantas solares fotovoltaicas conectadas a red, Pozo AlmonteSolar 3-16MW Annex 5.05, Technical Specifications, p 3
Stoms D, Dashiell SL, Davis FW (2013) Siting solar energydevelopment to minimize biological impacts. Renew Energ57:289–298
Taucare-Ríos A, Sielfeld W (2013) Arañas (Arachnida: Araneae) delextremo norte de Chile. Bol Mus Nac Hist Nat 62:7–27
Tokman M (2008) Política energética, nuevos lineamientos transfor-mando la crisis energética en una oportunidad. National EnergyCommission, Government of Chile, Santiago de Chile
Toro-Núñez O, Al-Shehbaz IA, Mort ME (2015) Phylogenetic studywith nuclear and chloroplast data and ecological niche revealsAtacama (Brassicaceae), a new monotypic genus endemic fromthe Andes of the Atacama Desert, Chile. Plant Syst Evol301:1377–1396
Tracol Y, Gutiérrez JR, Squeo FA (2011) Plant Area Index andmicroclimate underneath shrub species from a Chilean semiaridcommunity. J Arid Environ 75:1–6
Tsoutsos T, Frantzeskakib N, Gekasb V (2005) Environmental impactsfrom the solar energy technologies. Energy Policy 33:289–296
Turney D, Fthenakis V (2011) Environmental impacts from theinstallation and operation of large-scale solar power plants.Renew Sust Energ Rev 15:3261–3270
Ulrich W, Gotelli NJ (2013) Pattern detection in null model analysis.Oikos 122:2–18
Vidal MA, Pizarro-Araya J, Jerez V, Ortiz JC (2011) Daily activityand thermoregulation in predator-prey interaction during theFlowering Desert in Chile. J Arid Environ 75:802–808
Whitford WG (1991) Subterranean termites and long-term productiv-ity of desert rangelands. Sociobiology 19:235–243
Whitford WG (2000) Keystone arthropods as webmasters in desertecosystem. In: Coleman DC, Hendrix PF (eds) Invertebrates aswebmaster in ecosystems. CAB International, London, p 5–41
Wise DH (2006) Cannibalism, food limitation, intraspecific competi-tion, and the regulation of spider populations. Annu Rev Entomol51:441–465
Wu Z, Anping H, Chun C, Xiang H, Duoqi S, Zhifeng W (2014)Environmental impacts of large-scale CSP plants in North-Western China. Environ Sci Processes Impacts 16:2432
Zuur AF, Ieno EN, Walker NJ, Saveliev AA, Smith GM (2009) Mixedeffects models and extensions in ecology with R. Springer Sci-ence+Business Media, New York
Environmental Management

1
Online Resource 1
Con
trast
-bas
ed p
air-
wis
e LM
E te
st re
sult
amon
g en
viro
nmen
tal c
ondi
tions
of t
empe
ratu
re, h
umid
ity a
nd d
ew p
oint
usin
g ho
urly
dat
a of
day
tim
e 8
a.m
. - 8
p.m
. in
Sept
embe
r and
Oct
ober
at P
SPS
2013
and
in Ja
nuar
y an
d Fe
brua
ry a
t PA
S3 2
015.
* P
< 0.
05; *
* P
< 0.
01; *
** P
< 0
.001
Onl
ine
Res
ourc
e 1

2
Con
trast
-bas
ed p
air-
wis
e LM
E te
st re
sult
amon
g en
viro
nmen
tal c
ondi
tions
of t
empe
ratu
re, h
umid
ity a
nd d
ew p
oint
usin
g ho
urly
dat
a of
nig
ht
time
9 p.
m. -
7 a
.m. i
n Se
ptem
ber a
nd O
ctob
er a
t PSP
S 20
13 a
nd in
Janu
ary
and
Febr
uary
at P
AS3
201
5.
* P
< 0.
05; *
* P
< 0.
01; *
** P
< 0
.001
Onl
ine
Res
ourc
e 2

3
C
ontra
st-b
ased
pai
r-w
ise
LME
test
resu
lts a
mon
g da
y an
d ni
ght d
ata
of te
mpe
ratu
re, h
umid
ity a
nd d
ew p
oint
usin
g ho
urly
dat
a fr
om S
epte
mbe
r and
Oct
ober
in P
SPS
2013
and
Janu
ary
and
Febr
uary
in P
AS3
201
5.
Onl
ine
Res
ourc
e 3
Onl
ine
Res
ourc
e 4
Ken
dall´
s tau
cor
rela
tion
test
of t
empe
ratu
re, h
umid
ity, a
nd d
ew p
oint
am
ong
row
s in
PSPS
dur
ing
Sept
embe
r and
Oct
ober
201
3 an
d am
ong
mou
nt g
roup
s in
PAS3
du
ring
Janu
ary
and
Febr
uary
201
5.
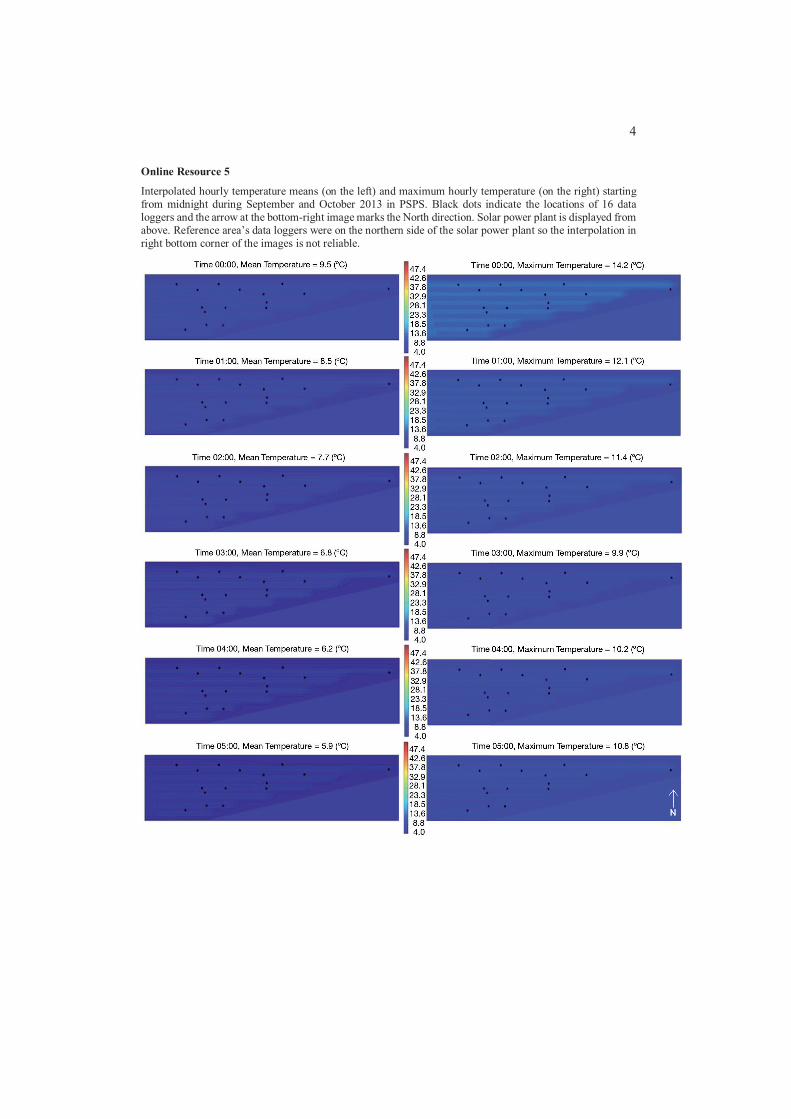
4
Online Resource 5
Interpolated hourly temperature means (on the left) and maximum hourly temperature (on the right) starting from midnight during September and October 2013 in PSPS. Black dots indicate the locations of 16 data loggers and the arrow at the bottom-right image marks the North direction. Solar power plant is displayed from above. Reference area s data loggers were on the northern side of the solar power plant so the interpolation in right bottom corner of the images is not reliable.

5

6

7

8
Online Resource 6
Interpolated hourly means of humidity starting from midnight. during September and October 2013 in PSPS black dots are 16 data loggers and the arrow at the bottom-right image marks the North direction. Solar power plant is displayed from above. Reference areas data loggers were on the northern side of the solar power plant so the interpolation in right bottom corner of the images is not reliable.

9

II
BIOTA RESPONSES TO SOLAR POWER PLANT ENVIRONMENT IN THE VALLEY OF COPIAPÓ, CHILE
by
Suuronen Anna, Muñoz-Escobar Christian, Lensu Anssi, Andrade-Alvear Rodrigo,
Taucare-Ríos Andrés, Kuitunen Markku & Kukkonen Jussi Vilho Kalevi 2017
Submitted manuscript

III
OPTIMIZATION OF PHOTOVOLTAIC SOLAR POWER PLANT LOCATIONS IN NORTHERN CHILE
by
Suuronen Anna, Lensu Anssi, Kuitunen Markku, Andrade-Alvear Rodrigo, Guajardo Celis Natalia, Miranda Marcelo, Perez Marcelo & Kukkonen Jussi Vilho
Kalevi 2017
Submitted manuscript