ecole polytechnique fédérale de lausanne · ecole polytechnique fédérale de lausanne laboratory...
TRANSCRIPT

NSLS-II Workshop
March 15, 2004
László Forró
School of Basic Sciences
Ecole Polytechnique Fédérale de Lausanne
Laboratory of Nanostructures and Novel Electronic Materials

Metals Semiconductors
Novelconductors,
bad metals
Our interest in solid state physics

In Nanostructures

Protein
…and in Biomaterials
DNA
Keratocyte Neuron
Protein Protein polymer

Solid State Physics

High Tc sample: Bi2Sr2CaCu2O8
Tc = 91 K
Studied at U4IR
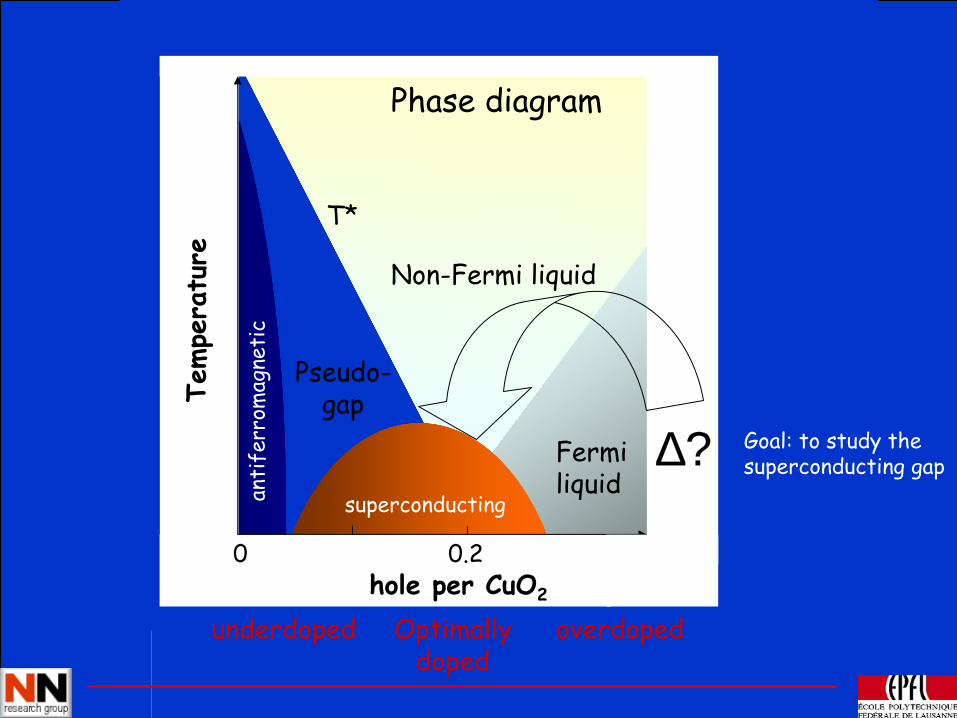
00 0.2
hole per CuO2
Tempe
ratu
re
anti
ferr
omag
neti
c
superconducting
T*
Non-Fermi liquid
Fermi liquid
Phase diagram
Pseudo-gap
Optimallydoped
underdoped overdoped
∆? Goal: to study the superconducting gap

How can we study ∆ (at NSLS)?• Electron in - electron out
– EELS : SC → vacuum keV– Tunnelling : SC → metal meV
• Photon in - electron out– Photoemission eV
• Electron in - photon out– Inverse Photoemission
• Photon in - photon out– Optical reflectivity– Optical transmission meV– Raman scattering
• 300K = 25 meV = 200cm-1 = 6 THz• Low Tc : 3.5x3K = 100 GHz µwave• High Tc : 3.5x100K = 230cm-1 FIR
Our choice
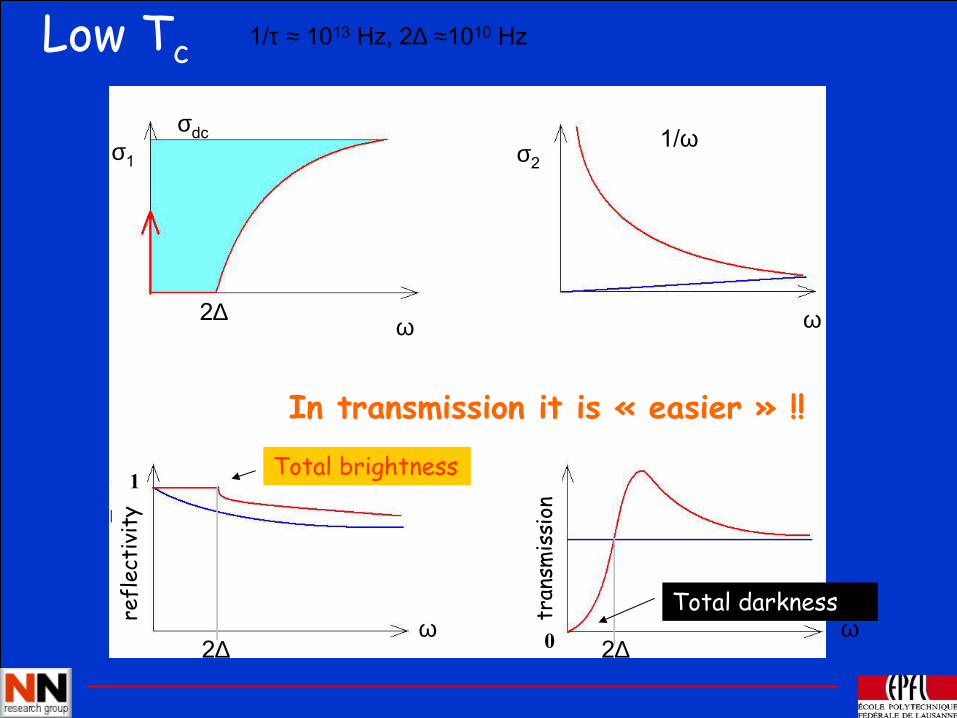
Low Tc 1/τ ≈ 1013 Hz, 2∆ ≈1010 Hz
ω
σ1 σ21/ω
2∆ ω
2∆2∆ω ω
1.r
t
σdc
Total brightness
Total darkness
In transmission it is « easier » !!
refl
ecti
vity
tran
smis
sion
1
0

Reference paper!

2212 100 nm thick single crystal, self-supported over 0.9 mm hole, platinum substrate
Our method:transparent single crystals of Bi2Sr2CaCu2O8
2212 150 nm thick single cystal, self-supported over 0.6 mm hole, contacted for resistivity, sapphire substrate

The first « good » results (from U4IR)
No peak in transmission ratios -> gaplesssuperconductivity!
Forró et al., PRL, 65, 1941 (1990)

Counter-argument for the absence ofthe gap feature: Clean limit
2∆
T>Tc
1/τ
σ1
ω (cm-1)Very small oscillatory strength → Difficult to observe

0.0
0.5
1.0
1.5
2.0
2.5
3.0
0 200 400 600 800
ρ ab (m
Ωcm
)
T (K)
Bi2Sr
2Ca
1-xY
xCu
2O
8
p=0.16
0.12
0.096
0.08
0.058
T*
0 100
1 102
2 102
3 102
4 102
5 102
6 102
0 50 100 150 200 250 300
R (Ω
)
T (K)
p = 1bar
0.1
0.01
0.001
Bi2Sr
2CaCu
2O
8+δ
Leaving the « clean limit » by introducingdefects: by electron irradiation, off-stoichiometry, substitution
e.g.: by Oxygen depletion

Infrared transmission of 2212 up to high temperatures (500 °C) (U4IR)
Thermocouple
Gold coated sapphire holder
heater
electrodes
Reference hole φ =0.6 mm2212 sample

Leaving « clean limit »:e-beam induced defects, heattreatment, substitution – still no gap feature!
Mandrus et ak, 70, 2629 (1993)
Cuprates are unconventional, d-wave superconductors!

2zd
)( 2 gte
Recent work: BaVS3correlated d-electron system (on U10A)

Pressure dependence
L. Forró, R. Gaál, H. Berger, P. Fazekas, K. Penc, I. Kézsmárki and G. MihályPhys. Rev. Lett. 85, 1938 (2000).
Phase diagram

Optical conductivity in the infrared rangeambient pressure under pressure
C. Homes, et al. – NSLS U10A beamline (2001-2002)
∆ = 700 K
100 10000
100
200
300
400
500
600
700 p TMI ∆
18 kbar 17 K 260 K 16 kbar 26 K 320 K 15.7 kbar 27 K 390 K 14.6 kbar 31 K 410 K 1 bar 70 K 750 K
σ 1 (Ω
-1cm
-1)
ω (cm-1)
10 K
HP optical cell

Blue bronzePeierls transition at 180 K
Quasi-1D organic CDW conductors2H-NbSe2: a conventionallayered superconductor
Other correlated systems studied (U4IR)

Nanostructures – carbon nanotubes

Hernadi et al., Catalysis Lett. 59, 229 (1997)
Supporter (Alumina, Zeolite)
Catalyticparticles(Fe, Co, Ni…)
Single walled CNTs Multi walled CNTs

Structured Nanotube Filmsby Soft Lithography
1 mM 10 mM
40 mM 50 mM
Kind et al., Langmuir (2000)
Patterned CNT structures

Logic circuit – IBM (Derycke et al, Nanoletters, New York Times (2001)

Flat panel screen
ZnO phosphor(anode)
Mo gate (for pixel control)Nanotube emitters
Back contact
to emitters
(cathode)
Substarte
Glass
Samsung:
4.5" color screen
Choi et al., APL 75, 3129 (1999)

IR microspectroscopy of nanotubes (on U10B)
– Gives local, chemically sensitive information

Example: optical conductivity of aligned ropes of carbon nanotubes
• Pure SWNTs Rope

•Good metallic behavior for E||
Drude fit for E||:ε0 4.71
ωp 7300
γ 1200
•Large anisotropy
R. Gaál et al., in preparation
Parallel olarization
Perpendicular polarization
300 K
Experiment on SWNT ropes

Biomatter

• Insulates like diamond (Broun et al., Nature’98)
• Semiconducts (Porath et al., Nature’2000); Tran et al., Phys.Rev.Lett.’2000).
• Conducts like a metal (Fink et al., Nature’99).
• Superconducts (proximity effect) (Kasumov et al. Science’2001).
Charge Transport in DNA

Aligned bundle of λ-DNA
Self-supportedoriented DNA bundle,
~10µm width
Light polarized ||and ⊥ to the bundle
Coppergrid

0100 200 3000
Wavenumber (cm-1)
100
Tra
nsm
ittan
ce (%
)
400
A broad, localised
mode
No conduction in d.c. limit
the low energy part… (on U12IR)
L. Forró et al., in preparation

Results… (on U10B)
2000 4000 6000500Wavenumber (cm-1)
0
100
Tra
nsm
ittan
ce (%
)
Parallel polarization
Perpendicular polarization

Phonon structure of a protein: their variationcan be used for diagnostic purposes
0
0.2
0.4
Wavenumber (cm-1)4000 2000
Inte
nsit
y
N-H stretch in proteins C-H
stretch in lipids
C=O stretch
in α-helix
PO2stretch

Alzheimer’s plaques are misfol -ded β-amyloid protein.
Alzheimer’s tangles are hyper-phosphorylated tau protein the forms paired helical filaments.
Plaques and tangles are thought to damage surrounding neurons.
Plaques-like structures, by staining, have recently been identified in other organs: liver, pancreas, ovary, testis, thyroid.
Amyloid plaques
Neurofibrillary tangles
20 µm
20 µm
Normal Alzheimer’sAlzheimer’s disease

1800 1500 1300
Wavenumber (cm-1)
Inte
nsit
y(u
.a.)
AD brain byopsis
α-helix
β-sheet Humain cortexhealthy
Alzheimer’s disease
Conformation change of a protein

Cortex AD plaques
140
120
100
80
60
40
20
0
y p
ositi
on [µ
m]
150100500 x position [µm]
0.80
0.75
0.70
0.65
intensity a.u.

Pancreas β-sheets plaques

“You can observe a lot,
just by watching…”
Conclusion

Acknowledgments…G. Williams H. BergerLarry Carr R. Gaal
Lisa Miller A. Radenovic
Laszlo Mihaly A. Kis
C. Homes
D. Mandrus J. Miklossy
M. Martin S. Kasas
I. Kezsmarki
G. Mihaly
N. Barisic

Thank you for your attention