ecml/pkdd 2003 discovery challenge 1 21 1 1 attribute-value and first order data mining within the...
TRANSCRIPT

ECML/PKDD 2003 Discovery Challenge1 1211
Attribute-Value and First Order Data Mining within the STULONG
projectAnneleen Van Assche, Sofie Verbaeten, Darek Krzywania,
Jan Struyf, Hendrik Blockeel
Department of Computer Science
Katholieke Universiteit Leuven

ECML/PKDD 2003 Discovery Challenge1 221
Data Mining Effort
•Data
•Data preprocessing
•Data mining
•Evaluation criteria
Discovered Knowledge
•Initial exploration
•Entry data
•Control data
Conclusions
Outline
ECML/PKDD 2003 Discovery Challenge1 321
Data
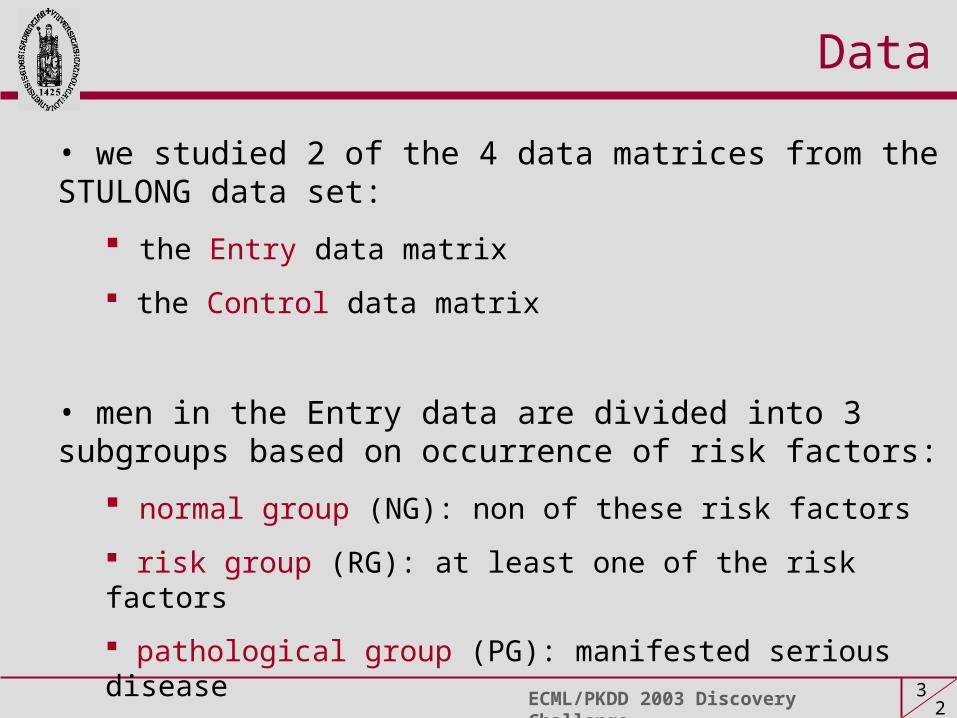
• we studied 2 of the 4 data matrices from the STULONG data set:
the Entry data matrix
the Control data matrix
• men in the Entry data are divided into 3 subgroups based on occurrence of risk factors:
normal group (NG): non of these risk factors
risk group (RG): at least one of the risk factors
pathological group (PG): manifested serious disease

ECML/PKDD 2003 Discovery Challenge1 421
Data preprocessing
• missing values / empty entries / “not stated” / “no”
• data = propositionalisation of relational database
many empty entries + redundancies (eg. personal anamnesis)
1-n relation from Entry to Control data set
solution: relational representation (ILP)
background knowledge can be used
• new features for trend analysis in control examinations
ECML/PKDD 2003 Discovery Challenge1 521
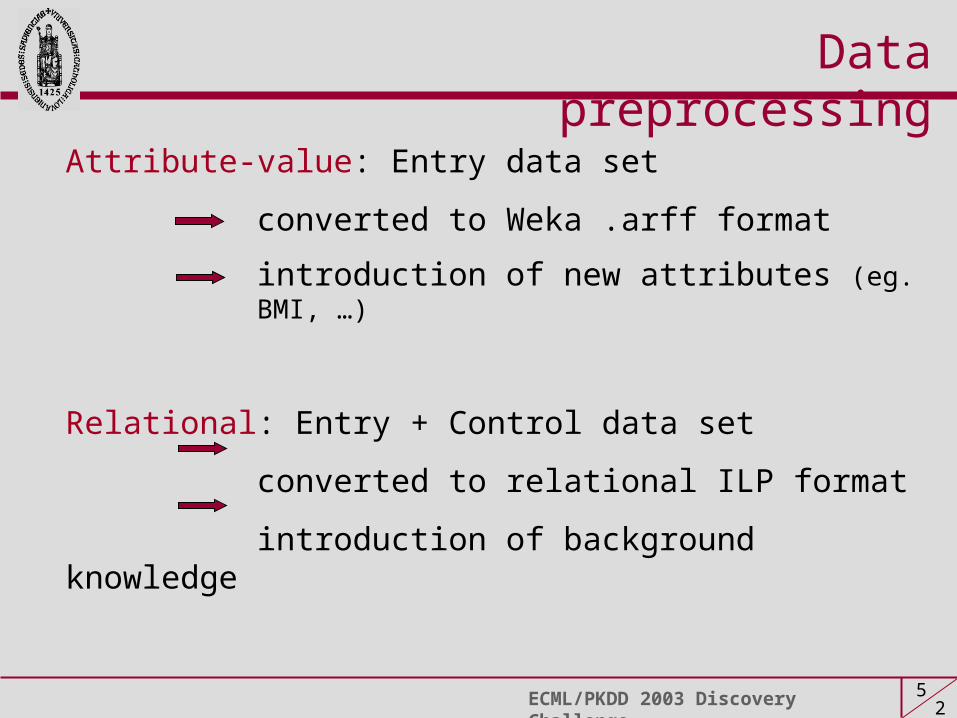
Attribute-value: Entry data set
converted to Weka .arff format
introduction of new attributes (eg. BMI, …)
Relational: Entry + Control data set
converted to relational ILP format
introduction of background knowledge
Data preprocessing

ECML/PKDD 2003 Discovery Challenge1 621
Data mining
• Entry data in .arff format Weka
classification (ZeroR, OneR, NB, Decision Stump, Decision Table, J48, …)
regression (Linear Regression, M5’)
association rules (Apriori)
• Entry + Control data in ILP format ACE
classification (Tilde)
regression (Tilde)
since data distributions are skewed, better use regression to predict chance of being positive/negative instead of using classification

ECML/PKDD 2003 Discovery Challenge1 721
Evaluation criteria
• 10-fold cross-validation
• classifiers
ROC – analysis (Area Under Curve)
accuracy
• regression models
Relative error (RE)
Pearson’s correlation coefficient (r)

ECML/PKDD 2003 Discovery Challenge1 821
Data Mining Effort
•Data
•Data preprocessing
•Data mining
•Evaluation criteria
Discovered Knowledge
•Initial exploration
•Entry data
•Control data
Conclusions
Outline

ECML/PKDD 2003 Discovery Challenge1 921
Initial exploration of Entry
Comparison of mean values of attributes for the three subgroups
reached education
responsibility in job
physical activity in job
physical activity after job
Skinfold above musculus triceps
Skinfold above musculus subscpularis

ECML/PKDD 2003 Discovery Challenge1 1021
Initial exploration of Entry
Correlation between BMI and skin fold for the three subgroups

ECML/PKDD 2003 Discovery Challenge1 1121
Results from the Entry data set
Relations between social factors and other characteristics
• education level physical activity in job
• education level smoking
• pensioner drinking
• age blood pressure
Relations between physical activities and other characteristics
• activity after job smoking
• duration of way to work drinking
...
...

ECML/PKDD 2003 Discovery Challenge1 1221
Results from the Entry data set
Correlation between skinfolds and BMI in particular risk groups
• regression task: predict BMI using SUBSC and TRIC
• classification task: predict OVERWEIGHT(OW) (1 if BMI >25 else 0)
Experiment Size ACC RAE r AUC
OW_T 6.0 71% 0.83 0.417 0.71
OW_NG 0.6 53% 1.01 -0.009 0.50
OW_RG 3.9 74% 0.78 0.467 0.73
OW_PG 1.0 75% 0.97 0.205 0.55
BMI_T 6.9 0.77 0.486
BMI_NG 1.0 0.90 0.309
BMI_RG 3.9 0.72 0.529
BMI_PG 1.7 0.86 0.304

ECML/PKDD 2003 Discovery Challenge1 1321
Results from the Entry data set
Correlation between skinfolds and BMI in particular subgroups
• correlation is strongest in risk group
• for all different groups SUBSC > ±15 is most important split to distinguish between overweight en non-overweight
• SUBSC BMI
• influence of TRIC on BMI less than influence of SUBSC

ECML/PKDD 2003 Discovery Challenge1 1421
Correlation between skinfolds and BMI in particular subgroups
Results from the Entry data set
26 24.4
21.926.726.7
29.6 27.5
TRIC < 15
SUBSC < 10
SUBSC < 15
SUBSC < 20
SUBSC < 70
SUBSC < 35
ex. risk group:26.1
23.9
22.2
27.1
27.7
27.8
yesno
no yes
yesno
no yes
yesno
no yes

ECML/PKDD 2003 Discovery Challenge1 1521
Results from the Entry data set
Staying healthy in the risk group (RG)
• task: predict if person of RG came down with cardio disease
• new attribute ILL introduced based on HODN0 attr from Control
• no good performance (most correlation coefficients < 0.05)
• best correlation (0.15) for cholesterol level
• if cholesterol < 250 then chance to stay healthy

ECML/PKDD 2003 Discovery Challenge1 1621
Results from the Control data set
• relational Control data set Tilde
• task: predict whether person from risk group comes down with cardio disease (1) or not (0)
• use only controlexaminations (ce) before patient’s cardio disease:
ce.year ≤ ROKi
• numeric attributes: extra features
compute trend over different ce’s
slope of least squares model of attr. over time interval T – N
T: start of patient’s first disease
N: parameter chosen by Tilde
ECML/PKDD 2003 Discovery Challenge1 1721
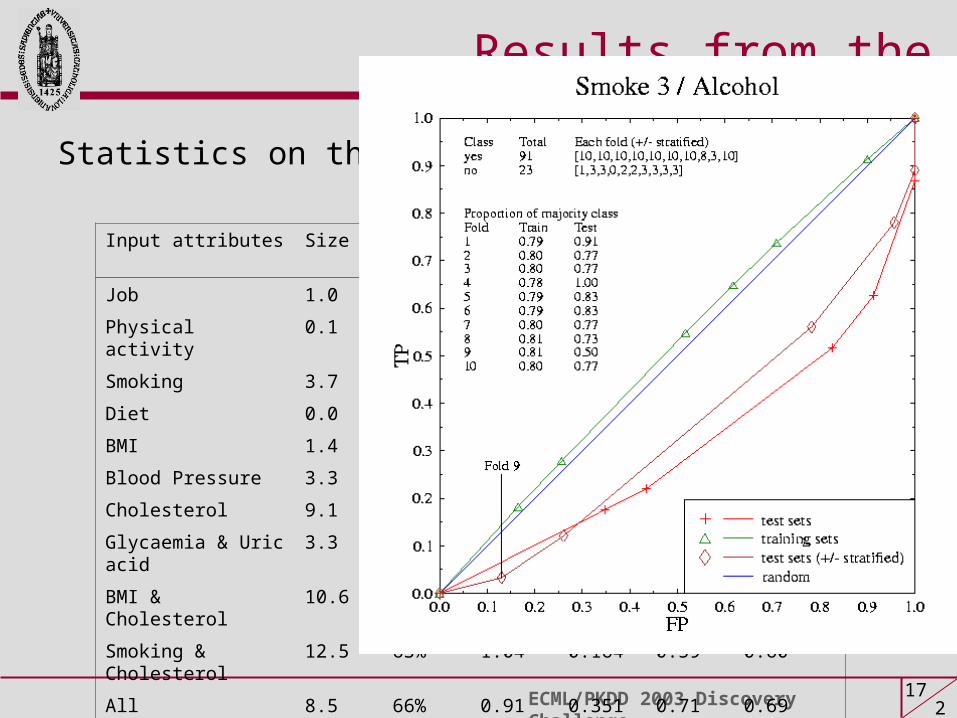
Results from the Control data set
Input attributes Size ACC RAE r AUC AUC (33%)
Job 1.0 68% 0.79 0.162 0.54 0.55
Physical activity 0.1 68% 1.01 -0.09 0.43 0.51
Smoking 3.7 67% 0.98 0.153 0.57 0.61
Diet 0.0 68% 1.00 -0.11 0.43 0.50
BMI 1.4 67% 1.03 -0.04 0.46 0.50
Blood Pressure 3.3 63% 1.03 0.106 0.55 0.58
Cholesterol 9.1 64% 1.03 0.147 0.59 0.57
Glycaemia & Uric acid 3.3 66% 0.81 0.435 0.71 0.71
BMI & Cholesterol 10.6 63% 1.05 0.147 0.59 0.57
Smoking & Cholesterol 12.5 63% 1.04 0.164 0.59 0.60
All 8.5 66% 0.91 0.351 0.71 0.69
Statistics on the Control data experiments

ECML/PKDD 2003 Discovery Challenge1 1821
Results from the Control data set
• Some interesting subgroups from the decision trees:
proportion of class 1 in whole group = 32%
total population = 1417
IF glycaemia > 7.2 and BMI > 23.5 in each examination and diastolic blood pressure slope during last 10 years < -77 THEN 64% (103)
IF systolic blood pressure slope during last 20 years < -0.97 THEN 53% (122)
IF glycaemia > 7.2 in each examination THEN 48% (434)
If patient leaves to full retirement in some examination THEN 20% (233)
IF reduced smoking in some examination and slope in number of cigarettes during last 20 years < 0.48 but during last 10 years > -0.11 THEN 16% (116)
IF glycaemia < 7.2 in some examination THEN 7% (285)

ECML/PKDD 2003 Discovery Challenge1 1921
Results from the Control data set
• Glycaemia most important attribute
• also blood pressure, cholesterol and smoking …
• slope of numeric attributes very useful
• statistics may be negatively biased due to cross-validation

ECML/PKDD 2003 Discovery Challenge1 2021
Conclusions
• used variety of data mining algorithms
propositional techniques
multi-relational techniques
• results consistent over different algorithms
• much discovered knowledge difficult to handle
• interpretation of results by domain experts is necessary
• carefull handling of results
• if accuracy of classifier not larger than predicting the average
classifier can still be informative!!

ECML/PKDD 2003 Discovery Challenge1 2121
The End
Thanks for your attention!!