eclipse resources corporation investor presentation - january 2016
TRANSCRIPT

NYSE|ECRNYSE|ECR
Investor PresentationJanuary 2016
2
January2016 Corporate
2
Cautionary StatementsForward-Looking Statements
This presentation contains forward-looking statements within the meaning of the federal securities laws. All statements, other than statements of historical facts, included in this presentation that addressactivities, events or developments that Eclipse Resources Corporation and its subsidiaries (collectively, the “Company” or “Eclipse”) expects, believes or anticipates will or may occur in the future areforward-looking statements. The words “believe,” “may,” “expect,” “anticipate,” “plan,” “intend,” “estimate,” “project,” “foresee,” “should,” “would,” “could,” or other similar expressions are intended toidentify forward-looking statements. However, the absence of these words does not mean that the statements are not forward-looking. Without limiting the generality of the foregoing, forward-lookingstatements contained in this presentation specifically include estimates of the Company’s reserves, expectations of plans, strategies and objectives and anticipated financial and operating results of theCompany, including as to the Company’s drilling program, production, hedging activities, capital expenditure levels and other guidance included in this presentation. These statements are based on certainassumptions made by the Company based on management’s experience and perception of historical trends, current conditions, anticipated future developments and other factors believed to beappropriate. Such statements are subject to a number of assumptions, risks and uncertainties, many of which are beyond the control of the Company, which may cause actual results to differ materiallyfrom those implied or expressed by the forward-looking statements. These include the factors discussed in the Company’s Annual Report on Form 10-K, filed on March 9, 2015 with the U.S. Securities andExchange Commission (the “SEC”).
The Company cautions you that these forward-looking statements are subject to all of the risks and uncertainties, most of which are difficult to predict and many of which are beyond our control, incidentto the exploration for and development, production, gathering and sale of natural gas and oil. These risks include, but are not limited to, commodity price volatility, inflation, lack of availability of drilling,production and processing equipment and services, legal and environmental risks, drilling and other operating risks, regulatory changes, counterparty credit risk, the uncertainty inherent in estimatingnatural gas, natural gas liquids (“NGLs”) and oil reserves and in projecting future rates of production, cash flow and access to capital, risks associated with our level of indebtedness, the timing ofdevelopment expenditures, and the other risks described under the heading “Risk Factors” in the Company’s Annual Report on Form 10-K.
Any forward-looking statement speaks only as of the date on which such statement is made and the Company undertakes no obligation to correct or update any forward-looking statement, whether as aresult of new information, future events or otherwise, except as required by applicable law.
This presentation has been prepared by Eclipse and includes market data and other statistical information from sources believed by Eclipse to be reliable, including independent industry publications,government publications, filings, press releases and presentations by other oil and gas companies, and other published independent sources. Some data is also based on the Company’s good faithestimates, which are derived from its review of internal sources as well as the independent sources described above. Although the Company believes these sources are reliable, it has not independentlyverified the information and cannot guarantee its accuracy and completeness.
Cautionary Note Regarding Hydrocarbon Quantities
The SEC permits oil and gas companies to disclose in their filings with the SEC only proved, probable and possible reserve estimates. Eclipse has provided proved reserve estimates that wereindependently engineered by Netherland Sewell & Associates, Inc. Unless otherwise noted, proved reserves are as of December 31, 2014. Actual quantities that may be ultimately recovered from Eclipse’sinterests may differ substantially from the estimates in this presentation. The Company may use the terms “resource potential,” “EUR” and “upside potential” to describe estimates of potentiallyrecoverable hydrocarbons that the SEC rules prohibit from being included in filings with the SEC. These are based on analogy to the Company’s existing models applied to additional acres, additional zonesand tighter spacing and are the Company’s internal estimates of hydrocarbon quantities that may be potentially discovered through exploratory drilling or recovered with additional drilling or recoverytechniques. These quantities may not constitute “reserves” within the meaning of the Society of Petroleum Engineer’s Petroleum Resource Management System or SEC rules. EUR estimates, resourcepotential and identified drilling locations have not been fully risked by Company management and are inherently more speculative than proved reserves estimates. Actual locations drilled and quantitiesthat may be ultimately recovered from the Company’s interests could differ substantially. There is no commitment by the Company to drill all of the drilling locations, which have been attributed to thesequantities.
Factors affecting ultimate recovery include the scope of the Company’s ongoing drilling program, which will be directly affected by the availability of capital, drilling and production costs, availability ofdrilling services and equipment, drilling results, lease expirations, transportation constraints, regulatory approvals, actual drilling results, including geological and mechanical factors affecting recoveryrates, and other factors. Resource potential and EUR may change significantly as development of the Company’s oil and natural gas assets provide additional data. The Company’s production forecasts andexpectations for future periods are dependent upon many assumptions, including estimates of production decline rates from existing wells and the undertaking and outcome of future drilling activity,which may be affected by significant commodity price declines or drilling cost increases.
The type curve areas included in this presentation are based upon our analysis of available Utica Shale well data, including information regarding initial production rates, Btu content, natural gas yields andcondensate yields, all of which may change over time. As a result, the well data with respect to the type curve areas presented herein may not be indicative of the actual hydrocarbon composition for thetype curve areas, and the performance, Btu content and natural gas and/or condensate yields of our wells may be substantially less than we anticipate or substantially less than performance and yields ofother operators in our area of operation.

3
January2016 Corporate
3
Company Overview
Key StatisticsMarket Capitalization(1) $405 MillionEnterprise Value(1) $771 MillionLiquidity(2) $281 MillionAverage Daily Production (MMcfe/d) and % Liquids
2014 73 (26%)1Q-15 160 (31%)2Q-15 199 (43%)3Q-15 225 (35%)4Q-15 Guidance ~225-235 (29%)2015 Guidance ~202-205 (~35%)1Q-16 Guidance* ~200 (~25%)
Proved Reserves(3) 355.8 BcfeTotal Resource Potential(4) 6.5 TcfeEst. 2015 Capital Expenditures $330 MillionNet Core Acreage(5) 129,000
Utica Liquids Rich (% HBP’d) 53,000 (47%)Utica Dry (% HBP’d) 49,000 (37%)Marcellus Liquids Rich(5) (% HBP’d) 27,000 (24%)
1. As of December 31, 20152. Cash and cash equivalents estimate for December 31, 2015 of $184MM and an effective borrowing base of $97MM ($125MM borrowing base less $28MM for letters of credit
outstanding)3. As of December 31, 2014; proved reserves based on estimates provided by Eclipse's independent engineering firm. PV-10 is based on SEC pricing4. Resource potential is based on internal estimates and includes, but does not represent, total proved reserves 5. As of December 31, 2015; acreage in Marcellus also included in Utica Dry
Eclipse Utica Shale Core Asset Area
Eclipse Resources is an independent exploration and production company engaged in the acquisition and development of oil and natural gas properties in the Appalachian Basin with over 100,000 acres in the “Core” of the Utica Shale Play in Southeast Ohio
*1Q 2016 production is planned to be voluntarily curtailed until commodity prices recover
OH

4
January2016 Corporate
4
Leading edge drilling performance averages less than 20 days per well spud to rig release
Continuing to push the boundaries on lateral length in the Utica Shale
Drilled the Company’s longest lateral to date with total measured depth of ~21,000’ in 17 days
Peer leading total cost per foot of lateral of $1,165(2) on last 7 wells
Unparalleled Operational Performance
Key Investment Highlights
Premier Assets
Prudent Business Plan with sufficient
Liquidity
~101,000 “Core” Utica Shale Acres ~27,000 Liquids Rich Marcellus Shale Acres 4Q15 estimated net production of ~236
MMcfe/d 2015 exit rate production of ~270
MMcfe/d(1) from 179 gross (67.2 net) producing wells
Long term Firm Interstate Gas transportation portfolio of ~355 MMcfe/d
~$184 MM cash on hand at YE 2015 Until commodity prices recover, Eclipse
plans to size 2016 capital expenditures to avoid additional debt and end 2016 with cash on hand and no incremental debt
Approximately 90% of guided 1Q 2016 gas hedged at $3.11/Mcf
1Q 2016E production voluntarily curtailed until commodity prices recover
$125 MM revolving credit facility borrowing base with $0 drawn(3)
1. As of December 31, 20152. Normalized to a 10,000 foot lateral3. Effective borrowing base of $97Million ($125 MM borrowing base less $28MM for letters of credit outstanding)
ECR 10 WellsIP Rate 4.6 MMcfe/d
60% LiquidsAvg. 6,044’
Lateral
*
*
**
*
***
ECR 1 WellIP Rate 13.8
MMcfe/d23% LiquidsAvg. 8,853’
Lateral
ECR 2 WellsIP Rate 23.5
MMcfe/d0% LiquidsAvg. 7,422’
Lateral
ECR 1 WellIP Rate 18.6
MMcfe/d0% LiquidsAvg. 5,850’
Lateral
ECR 3 WellsIP Rate 12.9
MMcfe/d0% LiquidsAvg. 6,124’
Lateral
ECR 3 WellsIP Rate 4.5 MMcfe/d
63% LiquidsAvg. 7,397’
Lateral
ECR 4 Wells*IP Rate 3.7 MMcfe/d
61% LiquidsAvg. 6,298’
Lateral
ECR 4 WellsIP Rate 4.2 MMcfe/d
59% LiquidsAvg. 7,797’
Lateral
*
*
*ECR 6 WellsIP Rate 7.1 MMcfe/d
61% LiquidsAvg. 6,637’
Lateral
ECR 3 WellsIP Rate 5.2 MMcfe/d
62% LiquidsAvg. 6,724’
Lateral
ECR 2 WellsIP Rate 7.6 MMcfe/d
64% LiquidsAvg. 7,901’
Lateral
*
ECR 3 Wells*IP Rate 13.0
MMcfe/d0% LiquidsAvg. 6,460’
Lateral
*
ECR 4 WellsIP Rate 5.4 MMcfe/d
54% LiquidsAvg. 6,947’
Lateral
*
ECR 7 Wells*IP Rate 14.8
MMcfe/d0% LiquidsAvg. 8,808’
Lateral
*Aggressively Pressure Managed

5
January2016 Corporate
5
$1,718
$1,165
$-
$250
$500
$750
$1,000
$1,250
$1,500
$1,750
$2,000
1Q 2015 3Q/4Q 2015
6,239 6,836
8,693
13,492
-
2,000
4,000
6,000
8,000
10,000
12,000
14,000
16,000
2013 2014 2015 4Q15
861
1,011
-
200
400
600
800
1,000
1,200
1Q 2015 3Q/4Q 20151. Normalized to 15,600’ TMD; as of July 31, 20152. Normalized to a 10,000 foot lateral
Total Cost per Lateral Foot Lateral Feet Drilled per Day
Operated Lateral Length (Ft) Operated vs. Non-Op Drilling Days(1)
Strong Operational Performance
30
25
25
17
- 5 10 15 20 25 30 35 40
Non Op
Eclipse
Non Op
Eclipse
All W
ells
Sinc
e In
cept
ion
Last
20
Wel
lsDr
illed
19%Faster
34%Faster
861
980
-
200
400
600
800
1,000
1,200
1Q 2015 3Q/4Q 2015
(2)

6
January2016 Corporate
6
Reserve Growth
Average Daily Production (MMcfe/d)
Production Outlook
1. As of December 31, 2015
Net Turn-to-Sales (Wells)
• Eclipse exited 2015 with an approximately 270 MMcfe/d net production rate(1)
• 1Q16 forward Henry Hub gas price is $1.99/Mcfwith 4Q16 forward Henry Hub gas price of $2.48/Mcf
• In 1Q16 Eclipse plans to voluntarily curtail its production to 200 MMcfe/d until commodity prices recover to more sustainable levels
12.3
6.3 6.4 8.0
1.3 -
2.0
4.0
6.0
8.0
10.0
12.0
14.0
1Q15 2Q15 3Q15 4Q15 1Q16E
236
200
38.3 41.9
85.8
123.8
159.6
198.6 225.2
-
45
90
135
180
225
270
1Q14 2Q14 3Q14 4Q14 1Q15 2Q15 3Q15 4Q15E 1Q16E
Operated Non-Operated Current Estimates 2015 Full Year Guidance
2015 Full Year Guidance Midpoint: 203 MMcfe/d

7
January2016 Corporate
7
Eclipse 2015 & 1Q16 Guidance
1. Excludes impact of hedges2. Excludes firm transportation, DD&A, exploration, and general and administrative expenses3. Excludes costs associated with rig terminations, which will be booked as expenses in general and administrative4. Includes routine lease acquisition, land related expenses, and net of projected midstream reimbursements; excludes land and producing asset acquisitions
Q3 2015Actual Low High Low High Low High
Forecasted ProductionAverage Daily (MMcfe/d) 225.2 225 235 202 205
% Natural Gas 65% 68% 74% 64% 66% 73% 80%% NGL 19% 16% 18% 18% 20% 15% 17%% Oil 16% 10% 14% 15% 17% 6% 10%
Forecasted Realizations(1)
Natural Gas ($/Mcf)Differential to NYMEX 0.10$ (0.12)$ (0.22)$ (0.12)$ (0.15)$ (0.10)$ (0.20)$ Firm Transportation Expense (0.30)$ (0.38)$ (0.49)$ (0.30)$ (0.34)$ (0.40)$ (0.50)$
Total Differential (0.20)$ (0.50)$ (0.71)$ (0.42)$ (0.49)$ (0.50)$ (0.70)$
NGLPrice as % of WTI 9% 15% 25% 20% 24% 20% 30%
Oil ($/Bbl)Differential to NYMEX (9.29)$ (11.00)$ (13.00)$ (11.25)$ (12.25)$ (11.25)$ (12.25)$
Projected Operating CostsOperating Cost per Unit(2) ($/Mcfe) 1.22$ 1.32$ 1.37$ 1.28$ 1.33$ 1.35$ 1.45$
Cash G&A(3) ($ MM) 12$ 10$ 12$ 45$ 47$ 11$ 12$
Capital Expenditures(4) ($ MM) 51.7$ Drilling and CompletionLand & Other
Q4 2015E Full Year 2015E
330$ 290$
40$
Q1 2016E
~200
$33
8
January2016 Corporate
8
0%
10%
20%
30%
40%
50%
60%
70%
80%
90%
100%
Natural Gas Oil Propane
% o
f Q1
2016
Gui
danc
e @
mid
-poi
nt
$3.11 $58.50
$0.46
Per Mcf Per Bbl
Per Gal
Average Floor(2)
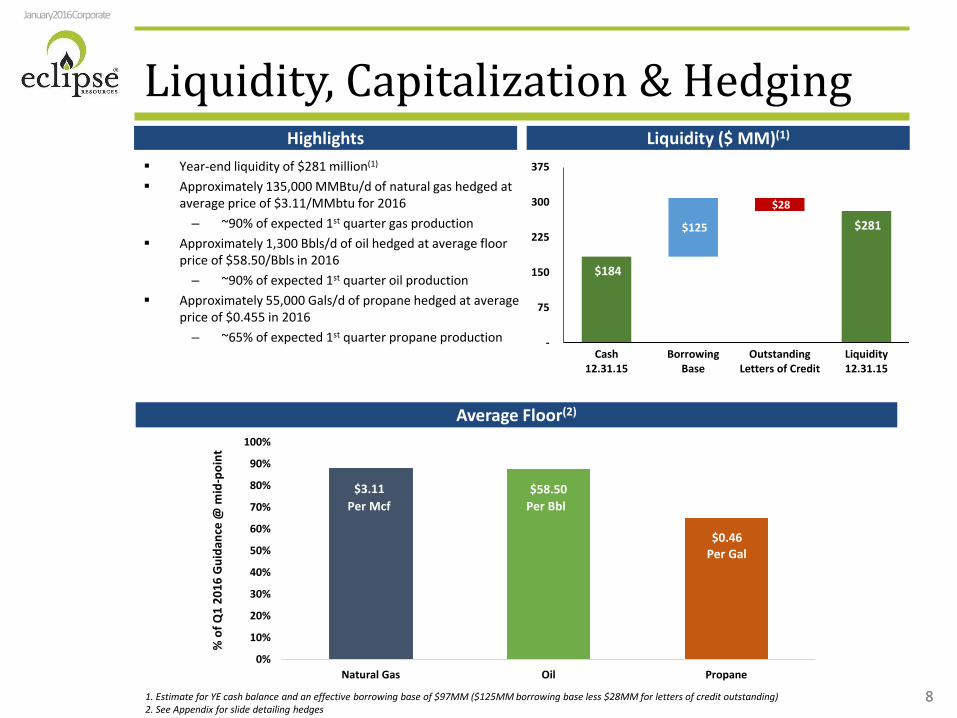
Liquidity, Capitalization & Hedging Year-end liquidity of $281 million(1)
Approximately 135,000 MMBtu/d of natural gas hedged at average price of $3.11/MMbtu for 2016
– ~90% of expected 1st quarter gas production Approximately 1,300 Bbls/d of oil hedged at average floor
price of $58.50/Bbls in 2016– ~90% of expected 1st quarter oil production
Approximately 55,000 Gals/d of propane hedged at average price of $0.455 in 2016
– ~65% of expected 1st quarter propane production
Liquidity ($ MM)(1)Highlights
1. Estimate for YE cash balance and an effective borrowing base of $97MM ($125MM borrowing base less $28MM for letters of credit outstanding)2. See Appendix for slide detailing hedges
$184
$281 $125
$28
-
75
150
225
300
375
Cash12.31.15
BorrowingBase
OutstandingLetters of Credit
Liquidity12.31.15

9
January2016 Corporate
9
Dom SouthApp Basin
6%
Gulf Coast 65%
M3 App Basin8%
Mid West 21%
Diversified Midstream Strategy
Firm gathering, processing and fractionation with Blue Racer Midstream for its operated Utica Shale Liquids Area acreage in place
Firm gathering with Eureka Hunter for its operated Utica Shale Dry Gas acreage in place
Firm condensate gathering and stabilization with EnLink Midstream in place
~355,000 MMbtu/d in non-recallable long term firm interstate gas transportation contracts to price advantaged markets
Firm NGL (propane and butane) contract in Mariner East II pipeline for transport and sale at East Asia Index Prices (4Q16)
Eclipse’s acreage is centered across a confluence of major pipelines in the country providing significant in- and out-of-basin optionality
Highlights
Q4-15 Sales Markets
Blue Racer Processing and Fractionation (Berne and Natrium)
ET Rover100,000 Dth/d – Gulf50,000 Dth/d - Dawn
Rockies Express/ANR South
50,000 Dth/d ANR SE
Columbia 205,000 Dth/d
TCO Pool
ET RoverExpected In-service in 4Q16
Term: 15 years100,000 Dth/d – Gulf50,000 Dth/d – Dawn
ColumbiaExpected In-service in
4Q16Term: 15 years205,000 Dth/d
TCO Pool
Texas EasternIn-service
Term: 9.5 years75,000 Dth/d
Gulf, M3, Lebanon
Rockies Express / ANR SouthIn-service
Term: 17 months50,000 Dth/d
ANR SE
Mariner East IIExpected In-service in 4Q16
Significant portion of expected propane and
butane production

10
January2016 Corporate
10
Operated Wells in ProgressEclipse has elected to defer completions on 21 Utica wells (17.6 net) and 2 Utica wells (2.0 net) in the company’s Condensate and Dry Gas Type Curve windows, respectively
Operated Wells as of December 31, 2015Operated Net Well Summary
32.136.7
41.648.2
2.9
6.419.7
16.8
20.6 19.6
3.0
3.0
5.7
3.2
-
10
20
30
40
50
60
70
80
March 31, 2015 June 30, 2015 October 31, 2015 December 31, 2015
Producing Wait-on-Pipe Deferred Compl Awaiting Compl Drilling

11
January2016 Corporate
11
Fuchs/Dietrich Pads Dry Gas East The Fuchs A unit and Dietrich A and C units consist of
seven wells drilled off of two pads in the Dry Gas East Type Curve Area
Eclipse drilled the wells at horizontal lateral lengths ranging from 7,459’ to 10,529’ in an average of 18 days per well
The wells were completed at an average of 226’ stage spacing using nearly 100% Slickwater and 1400 lbs/ftsand
Total well cost at an average of $1,165(1)/per foot of lateral
The wells were brought on production in late November and early December 2015 to Type Curve rates using an aggressive pressure management production strategy
1. Normalized to a 10,000 foot lateral

12
January2016 Corporate
12
Fuchs/Dietrich “Optimized” Well Pad vs. Shroyer Wells – Dry Gas East
Started bringing Fuchs and Dietrich wells on line at Type Curve IP rates in late November 2015. Target IP rates were normalized to the Dry Gas East Type Curve IP of 16.8 MMcfd for a 10,000’ lateral, using an aggressive pressure management strategy.
By 12/7/2015, all seven Fuchs A, Dietrich A and Dietrich C unit wells were producing into sales at Target IP Rates
Shroyer #2H and #4H wells (first wells drilled in Dry Gas East) were put into sales in August 2014 at initial rates of 21 to 24 MMcfd (~30 MMcfd normalized), and saw significant pressure drawdowns
Initial casing pressures at Fuchs/Dietrich pads between 7,500 and 8,000 psi, similar to those seen at the Shroyer pad. Pressure drawdown significantly shallower on Fuchs/Dietrich wells due to aggressive pressure management.
CompletedLateral Length (ft)
Target IP rate (MMcf/d)
Stage Length (ft)
% Slickwater #/ft Sand
Fuchs A 2H 8,955 15.0 225 98% 1425
Fuchs A 4H 10,529 17.7 223 99% 1415
Dietrich A 2H 7,459 12.5 226 99% 1422
Dietrich A 4H 8,386 14.1 227 98% 1414
Dietrich A 6H 8,732 14.7 225 98% 1364
Dietrich C 4H 9,160 15.4 230 99% 1448
Dietrich C 6H 8,439 14.2 230 99% 1472
Shroyer 2H 8,277 21.5 286 59% 1788
Shroyer 4H 6,649 22.0 202 45% 1828
Fuchs-Dietrich Normalized
Rates
ShroyerNormalized
Rates
Fuchs-Dietrich Casing Pressure
Shroyer Casing Pressure
Fuchs/Dietrich initial pressure and production data exceeds performance seen from ECR’s Shroyer wells

13
January2016 Corporate
13
Utica Type Well Economics Update Eclipse has updated Type Well Economics in each Type Curve Area to
reflect current expectations for an “optimized” well design: – The previous Dry Gas West Type Curve Area was broken out into separate Dry Gas Central
and Dry Gas West Type Curve Areas due to large areal extent and wide range of OGIP values
– Utilized available microseismic data and well spacing test data to recommend decreased inter-lateral spacing in Dry Gas East, Dry Gas Central, Dry Gas West and Rich Gas Type Curve Areas from 1000’ to 850’
Current “Optimized” Well Design includes: – Lateral lengths of at least 10,000’– 200’ to 225’ frac stage spacing– Greater than 90% Slickwater frac fluid– Aggressively Pressure Managed production rates – target 150 psi/week pressure
drawdown in Dry Gas Areas and 100 psi/week pressure drawdown in Liquids Rich Areas
Capital expenditures for 2016 Type Well Economics based on current operations and services costs

14
January2016 Corporate
14
Aggressive Pressure Management
𝐾𝐾𝐾𝐾𝑖𝑖𝑖𝑖𝑖𝑖𝑖𝑖𝑖𝑖𝑖𝑖𝑖𝑖
= 𝑒𝑒−𝛾𝛾(𝑃𝑃𝑖𝑖𝑖𝑖𝑖𝑖𝑖𝑖𝑖𝑖𝑖𝑖𝑖𝑖−𝑃𝑃)In Liquids Rich Areas, once reservoir pressure in
the near-wellbore region falls below the dew point, condensate will drop out of the gas
phase. This decreases gas relative permeability and can cause a near wellbore blockage effect.
It is advantageous to delay the time to reach dew point for as long as possible through
aggressive pressure management.
In over-pressured Shale reservoirs, as a result of pore volume reduction caused by fluid withdrawal,
the available flow area is reduced, and thus the permeability decreases with pressure decline. This
phenomenon is known as “pressure dependent permeability”.
In Shale reservoirs, as reservoir pressure decreases, the closure stress across the propped fractures
increases, resulting in reduced fracture conductivity.
Aggressive pressure management enhances fracture conductivity, reservoir permeability in both Dry Gas and Liquids Rich Areas

15
January2016 Corporate
15
2.52.7
3.7 3.8 3.8
4.3
3.2
3.63.4
3.8
3.2
3.7
4.4
3.9 3.9
4.3
4.8
5.2
0.0
5.0
10.0
15.0
20.0
25.0
30.0
35.0
0.0
1.0
2.0
3.0
4.0
5.0
6.0
Well 1 Well 2 Well 3 Well 4 Well 5 Well 6 Well 7 Well 8 Well 9 Well10
Well11
Well12
Well13
Well14
Well15
Well16
Well17
Well18
Nor
mal
ized
Gas
Rat
e Pr
ior t
o De
clin
e (M
Mcf
d)
Nor
mal
ized
Cum
ulat
ive
Prod
uctio
n @
dec
line
(Bcf
)
Cumulative Production and Rates Prior to Decline
Average Moderate Cum at Decline Normalized Rate @ Decline
Aggressive Pressure Management - Dry Gas Areas
Wells 17 & 18 (red) were aggressively
pressure managed. Their average cum production prior to
decline was 5 Bcf, with an average production
rate of 11 MMcfd. Well 18 has not
started to decline yet.
Dry Gas area wells can be divided in three
pressure management categories: None,
Moderate and Aggressive pressure
management
In Moderate pressure managed category
(blue), average wells’ cum production prior to decline was 3.6 Bcfwith an 18.4 MMcfd
normalized production rate.
Wells 1 & 2 (green) which were not
pressure managed, produced 2.6 Bcf with average normalized IP
rate of 30 MMcfd.
1. Production rates normalized to 10,000’ lateral
1
Eclipse believes that aggressively pressure managed wells in the Dry Gas Areas produce 35% more gas prior to initial decline as compared with moderately pressure managed wells

16
January2016 Corporate
16
Aggressive Pressure Management - Lean Condensate Area
The average of moderately
pressure managed wells’ (blue) cum
production prior to starting their
decline was 1.1 Bcfe at a 4.5
MMcfd normalized production rate.
In Lean Condensate area, Eclipse wells can
be divided in two pressure management
categories as: Moderate or
Aggressive pressure managed
Aggressively pressure managed wells’ (red) average
cum production was 1.72 Bcfe with a production rate of 2.8 MMcfd for
wells 4, 5 & 6.
Wells 17, 18 & 19 changed to aggressively
pressure managed in August 2015
1. Production rates normalized to 10,000’ lateral
1.00.9 0.9
1.9
1.7
1.8
1.0 1.0
1.1
1.6
1.2
0.91.0
1.3
0.7
0.6
1.8
1.4
1.7
0
1
2
3
4
5
6
0.00
0.20
0.40
0.60
0.80
1.00
1.20
1.40
1.60
1.80
2.00
Well 1 Well 2 Well 3 Well 4 Well 5 Well 6 Well 7 Well 8 Well 9 Well10
Well11
Well12
Well13
Well14
Well15
Well16
Well17
Well18
Well19
Nor
mal
ized
Gas R
ate
Prio
r to
decl
ine
(MM
cfd)
Nor
mal
ized
Cum
ulat
ive
Prod
uctio
n @
dec
line
(Bcf
e)
Cumulative Production and Rates Prior to Decline
Normalized Cum Prod @ Decline Average Cum Prod @ Decline Normalized Rate @ Decline1
Eclipse believes that aggressively pressure managed wells in the Lean Condensate Area produce 50% more gas equivalent prior to initial decline as compared with moderately pressure managed wells

17
January2016 Corporate
17
Enhanced Returns of Extended Reach Laterals Eclipse’s operated wells have trended from 6,000’ laterals in
2013 and 2014 to 8,000’ laterals in 2015 and 10,000’ laterals currently
Significant economic enhancement is achieved through longer laterals
– Lowest cost per foot– Fewer pads constructed– Less midstream infrastructure
Eclipse is designing all future wells with the goal of maximizing extended reach laterals
Shallower depth and decreased drilling complexity in Liquids Rich and Condensate Areas allow for longer laterals than in deeper, more challenging Dry Gas Areas
NYMEX Strip and Consensus Pricing shown are as of 12/21/2015
Type Well Cost per Foot -Dry Gas East/Condensate(M$)
BT IRR by Lateral Length (Dry Gas East) BT IRR by Lateral Length (Condensate)
0%
20%
40%
60%
80%
100%
120%
140%
Gas: $2.50Oil: $42.50
NYMEXStrip
Gas: $3.00Oil: $60.00
Consensus Gas: $3.50Oil: $70.00
Gas: $4.00Oil: $80.00
Condensate - 6K Condensate - 8KCondensate - 10K Condensate - 13KCondensate - 15K
0%
20%
40%
60%
80%
100%
120%
140%
Gas: $2.50Oil: $42.50
NYMEXStrip
Gas: $3.00Oil: $60.00
Consensus Gas: $3.50Oil: $70.00
Gas: $4.00Oil: $80.00
Dry Gas East - 6K Dry Gas East - 8K
Dry Gas East - 10K Dry Gas East - 13K
$0
$500
$1,000
$1,500
$2,000
6,000'Lateral
8,000'Lateral
10,000'Lateral
13,000'Lateral
15,000'Lateral
Dry Gas East Condensate

18
January2016 Corporate
18
Utica Type Curve Areas w/Pt. Pleasant OGIPs
Marcellus Type Curve Areas
Eclipse has continued to refine its Gas In Place estimates in the Utica Shale core area (map depicts OGIP of Point Pleasant corridor only)

19
January2016 Corporate
19
10,000’ Lateral Type Well Economics Summary
1. Assumes ethane rejection with contractual 30% recovery2. Breakeven is defined as PV(10) > $0.00
Dry Gas Dry Gas Dry Gas Marcellus Marcellus
West Central East West East
Gas IP Rate (Mcf/d) 1,500 2,400 3,300 7,000 11,000 14,000 15,000 16,800 2000 5,500
Ini tia l Decl ine 0% 0% 0% 0% 0% 0% 0% 0% 0% 0%
Ini tia l Decl ine Period (Months) 24 8 12 9 9 9 9 8 4 4
2nd Decl ine Segment 55% 50% 60% 60% 63% 63% 63% 63% 54% 54%
2nd Decl ine B-factor 1.25 1.25 1.25 1.25 1.2 1.2 1.2 1.2 1.4 1.4
Fina l Decl ine 6% 6% 6% 6% 6% 6% 6% 6% 6% 6%
Ini tia l Cond. Yield (Bbl/Mmcf) 300 200 150 60 15 N/A N/A N/A 200 100
Secondry Cond. Yield (Bbl/MMcf) 200 160 N/A N/A N/A N/A N/A N/A N/A N/A
Cond. Yield Trans i tion Time (Mth) 15 15 N/A N/A N/A N/A N/A N/A N/A N/A
Fina l Cond. Yield (Bbl/Mmcf) 120 80 65 12 2 N/A N/A N/A 80 25
Cond. Yield Trans i tion Time (Mth) 20 20 20 12 15 N/A N/A N/A 8 24
NGL Yield (Bbl/Mmcf) 93 92 88 80 60 N/A N/A N/A 125 125
Gas Shrink 84.4% 85.1% 85.2% 86.2% 90.0% N/A N/A N/A 81.0% 81.0%
EUR (w/ process ing) (Bcfe)(1) 7.04 8.61 9.06 14.06 17.73 17.67 18.99 20.89 6.49 15.66
BT IRR ($3.00 Gas , $60.00 Oi l , NGL 35% of WTI) 31% 29% 27% 19% 17% 31% 35% 42% 9% 51%
Wel l Cost ($MM) $9.17 $9.17 $9.17 $9.17 $9.17 $10.48 $10.48 $10.48 $7.89 $7.89
Breakeven Gas Price at $60.00 Oi l ($/Dth)(2) $0.10 $0.85 $1.55 $2.60 $2.77 $2.44 $2.40 $2.30 $3.35 $1.07
Breakeven Oi l Price at $3.00 Gas ($/Bbl ) $47.00 $47.20 $48.25 $51.55 $51.00 N/A N/A N/A $62.25 $39.80
Assumed Inter Latera l Wel l Spacing (ft) 750 750 750 750 850 850 850 850 750 750
Estimated Remaining Net Locations 31 20 83 60 44 82 80 54 78 63
EUR, Bcfe/1000' 0.7 0.9 0.9 1.4 1.8 1.8 1.9 2.1 0.6 1.6
Rich GasVery Rich Condensate
Rich Condensate
Lean Condensate
Condensate/Rich Gas

20
January2016 Corporate
20
-
5,000
10,000
15,000
20,000
25,000
0 100 200 300 400 500 600 700 800 900 1000
Ga
s (
Mcf/
da
y)
Days
New Type Curve Old Type Curve
-
5,000
10,000
15,000
20,000
0 100 200 300 400 500 600 700 800 900 1000
Ga
s (
Mcf/
da
y)
Days
New Type Curve_DGW New Type Curve_DGC Old Type Curve
Dry Gas Area Comparison PlotsDry Gas East
Dry Gas West and Central
Dry Gas Area Type Curve initial production rates were decreased to achieve an aggressively managed pressure drawdown and to maintain pressure dependent permeability
Reducing inter-lateral spacing from 1000’ to 850’ reduced average well drainage area by approximately 16%
Long term decline rates and ultimate recoveries with aggressive pressure management and “optimized” frack designs are still being determined

21
January2016 Corporate
21
-
5,000
10,000
0 100 200 300 400 500 600 700 800 900 1000
Ga
s (
Mcf/
da
y)
Days
New Type Curve Old Type Curve
-
5,000
10,000
15,000
0 100 200 300 400 500 600 700 800 900 1000
Ga
s (
Mcf/
da
y)
Days
New Type Curve Old Type Curve
Rich Gas Area Comparison PlotsRich Gas
Condensate/Rich Gas
1
10
100
0 200 400 600 800 1000
Cond
ensa
te Y
ield
(Bbl
/Mm
cf)
Days
New Type Curve
Old Type Curve
1
10
100
0 200 400 600 800 1000
Cond
ensa
te Y
ield
(Bbl
/Mm
cf)
Days
New Type Curve
Old Type Curve
Rich Gas Area Type Curve initial production rates were decreased to achieve an aggressively managed pressure drawdown and to maintain pressure dependent permeability
Condensate yield decline increased to better match historical production, has negligible EUR effect due to low condensate yields in Rich Gas Areas
Long term decline rates and ultimate recoveries with aggressive pressure management and “optimized” frack designs are still being determined

22
January2016 Corporate
22
-
2,000
4,000
6,000
8,000
0 200 400 600 800 1000 1200 1400
Ga
s (
Mcf/
da
y)
Days
New Type Curve Old Type Curve
-
1,000
2,000
3,000
4,000
0 200 400 600 800 1000 1200 1400
Ga
s (
Mcf/
da
y)
Days
New Type Curve Old Type Curve
-
1,000
2,000
3,000
4,000
0 200 400 600 800 1000 1200 1400
Ga
s (
Mcf/
da
y)
Days
New Type Curve Old Type Curve
10
100
1,000
0 200 400 600 800 1000
Cond
ensa
te Yi
eld
(Bbl/
Mm
cf)
Days
New Type CurveOld Type Curve
Condensate Area Comparison Plots
5
100
0 200 400 600 800 1000
Cond
ensa
te Y
ield
(B
bl/M
mcf
)
Days
New Type CurveOld Type Curve
Lean Condensate
Rich Condensate
10
100
1,000
0 200 400 600 800 1000
Cond
ensa
te Yi
eld
(Bbl/
Mmc
f)
Days
New Type CurveOld Type Curve
Very Rich Condensate
Condensate Area Type Curve initial production rates were decreased to achieve an aggressively managed pressure drawdown and to maintain pressure dependent permeability
Condensate yields increased and declines flattened to reflect effects of aggressive pressure management
Long term decline rates and ultimate recoveries with aggressive pressure management and “optimized” frack designs are still being determined
23
January2016 Corporate
23
-
1,000
2,000
3,000
4,000
0 100 200 300 400 500 600 700 800 900 1000
Ga
s (
Mcf/
da
y)
Days
New Type Curve Old Type Curve
-
2,000
4,000
6,000
8,000
0 100 200 300 400 500 600 700 800 900 1000
Ga
s (
Mcf/
da
y)
Days
New Type Curve Old Type Curve
Marcellus Area Comparison Plots
10
100
0 200 400 600 800 1000
Cond
ensa
te Y
ield
(Bbl
/Mm
cf)
Days
New Type Curve
Old Type Curve
Marcellus East
10
100
1,000
0 200 400 600 800 1000
Cond
ensa
te Y
ield
(Bbl
/Mm
cf)
Days
New Type Curve
Old Type Curve
Marcellus West
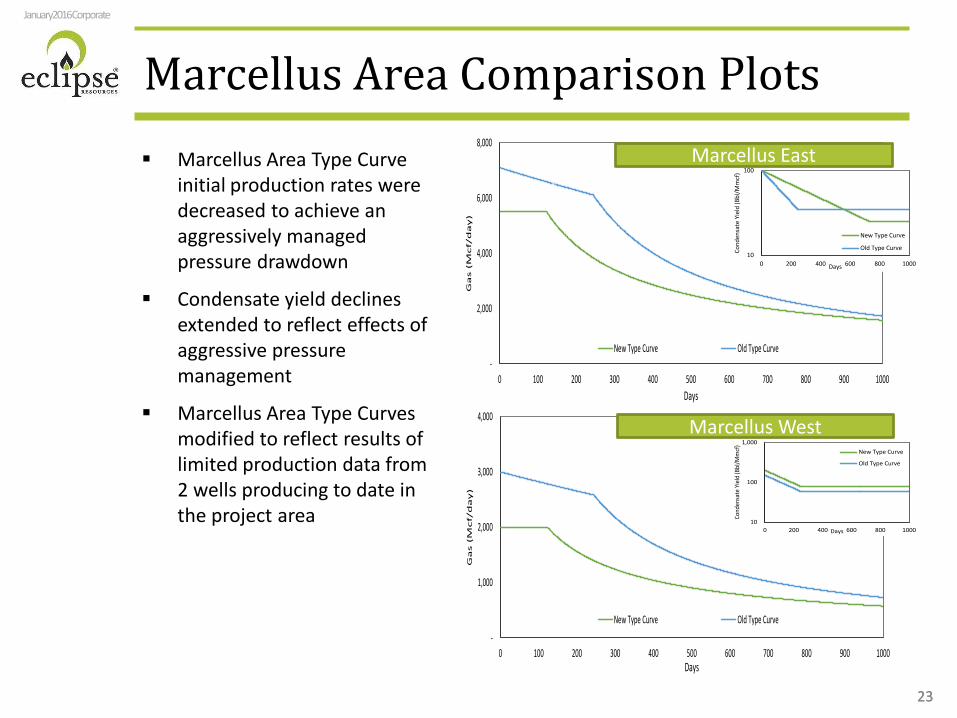
Marcellus Area Type Curve initial production rates were decreased to achieve an aggressively managed pressure drawdown
Condensate yield declines extended to reflect effects of aggressive pressure management
Marcellus Area Type Curves modified to reflect results of limited production data from 2 wells producing to date in the project area

Appendix

25
January2016 Corporate
25
Name Position Prior Experience Years in Industry
Benjamin Hulburt President & CEO 14
Thomas Liberatore Chief Operating Officer 34
Matthew DeNezza Chief Financial Officer 13
Christopher Hulburt General Counsel 14
Roy Steward SVP, Chief Accounting Officer 15
Oleg Tolmachev VP, Drilling & Completions 16
Marty Byrd VP, Land 35
Dr. Brian Panetta VP, Geology 18
Bruce King VP, Operations 26
Melissa Hamsher VP, Health, Safety, Environmental & Regulatory 14
Lawrence Gorski VP, Administration 17
Todd Bart VP, Controller 18
Dana Bryant VP, Marketing and Midstream 16
Daniel Sweeney VP, Assistant General Counsel 7
Timothy Loos VP, Financial Planning & Analysis 10
Douglas Kris VP, Investor Relations 22
Mark Spears VP, Reservoir Engineering 34
Highly Experienced Management Team

26
January2016 Corporate
26
78.5 109.6
186.4
245.5
355.8
$155.3
$253.8
$337.9
$401.2 $509.4
$-
$100
$200
$300
$400
$500
$600
-
100
200
300
400
500
600
Q4-13 Q1-14 Q2-14 Q3-14 Q4-14
PV-1
0 ($
MM
)
Rese
rves
(Bcf
e)
PDP PNP/PBP PUD Net PV-10 ($ MM)
Net Oil (Mbbls)
Net NGL (Mbbls)
Net Gas (MMcf)
Net Total(MMcfe)
Net PV-10 ($M)
PDP 2,967 4,269 93,561 136,978 321,184PNP/PBP 914 2,489 39,398 59,818 113,180PUD 1,816 4,120 123,350 158,972 75,025
Total Proved 5,697 10,879 256,310 355,768 509,389
Growing Proved Reserves(1)
1. Q4-13, Q1-14, Q3-14 and Q4-14 reserves prepared by Eclipse’s independent engineering firm. Q2-14 reserve estimates prepared internally. Based on SEC pricing from Q4 2013 to Q4 2014 for WTI: $96.91, $98.43, $100.27, $99.08, $94.99 and for Henry Hub: $3.67, $3.99, $4.10, $4.24, $4.35. These prices are above NYMEX strip pricing
Total Proved Reserves(1)
Eclipse has been able to achieve significant growth in proved reserves and proved developed reserves since the commencement of its active drilling program in late 2013
85% of Proved Value

27
January2016 Corporate
27
Texas Eastern - M3Texas Eastern - Lebanon Hub
Columbia - TCO Pool
Texas Eastern - ELA/WLA
Rex - ANR - SE
Rover - Trunkline Z1A
Rover - Dawn
Firm Sales
0
100,000
200,000
300,000
400,000
500,000
2015 2016 2017 2018 2019
MM
Btu/
d
0.54 0.50 0.55
0.05 0.05
0.06
$-
$0.10
$0.20
$0.30
$0.40
$0.50
$0.60
$0.70
2015 2016 2017Demand Variable
*TETCO capacity is recallable on specified terms
Firm Transportation and Sales OutletsFirm Transportation Costs ($ / MMBtu) Annual Average Firm Transportation
Firm Commitments per MMBtu per day
MMBtu/d 2015 2016 2017 2018+North East
Texas Eastern - M3 35,417 37,500 37,500 37,500Columbia - TCO Pool 34,167 205,000 205,000
CanadaRover - Dawn 29,167 50,000
Mid-WestTexas Eastern - Lebanon Hub 11,807 12,501 12,501 12,501
GulfRover - Trunkline Z1A 100,000 100,000Rex - ANR-SE 25,000 41,667Texas Eastern - ELA/WLA 23,417 24,999 24,999 24,999
Total 95,641 150,833 409,167 430,000

28
January2016 Corporate
28
NGL Infrastructure
Edmonton Markets
Midwest Markets
Ontario Markets
Northeast Markets
South MarketsGulf
Markets
Natrium Plant
MarcusHookStephen
City, VA
Rail Transport
2015 Marketing by Region
4Q15 average realized price of $13.50 per barrel and represents 15% of total production for the quarter Mariner East II contract to begin in fourth quarter 2016
– Contract to market propane and butane using East Asia Index benchmark
– Global propane prices have not weakened with the same magnitude as US prices
NGL prices should firm with growing number of outlets for NGL demand, export capacity increasing through the second half of 2015, and with the migration through the shoulder season
EclipseMount Belvieu
33%
38%
9%
12%
8%
37%
38%
6%7%
12%
Mariner East I
Mariner East II (4Q16)

29
January2016 Corporate
29
Non-GAAP Reconciliations
Adjusted Revenue
1. As of December 31, 2014; proved reserves based on estimates provided by Eclipse's independent engineering firm. PV-10 based on SEC pricing
PV-10(1)
Adjusted EBITDAX
Year ended December 31,($ in millions) 2014 2013
Future net cash flows 792,091$ 286,855$
Present value of future net cash flows
Before income tax (pre-tax PV-10) 509,389$ 155,295$
Income taxes (178,732) -
After income tax (Standardized measure) 330,657$ 155,295$
Sept 30, June 30, December 31, September 30,($ in thousands) 2015 2015 2014 2014Net Loss (81,468)$ (41,970)$ (33,023)$ (19,054)$ Depreciation, depletion & amortization 67,172 60,641 37,251 29,983 Exploration expense 3,244 6,243 4,289 3,057
Rig Termination Expense - 366 3,283 Impairment of oil and gas properties - - 30,250 4,605 Incentive unit compensation 1,237 1,410 61 31 Accretion of asset retirement obligations - 399 216 198 Gain on reduction of pension l iabil ity - - - - Gain/Loss on derivative instruments (23,679) 3,523 (19,693) (5,572) Net cash receipts (payment) on derivative instruments 9,332 8,457 2,211 584 Net cash paid for option premium - - - (244) Interest expense - 14,401 13,027 10,066
(Gain) Loss of sale of assets 290 (5,553) 272 - Other Income - 2
Income tax expense (18,309) (16,412) (12,198) (10,544)
Adjusted EBITDAX 29,571$ 31,507$ 25,946$ 13,110$
Three Months Ended
Sept 30, Sept 30,($ in thousands) 2015 2014Total Revenues 71,172$ 35,702$ Net cash receipts (payments) on derivative instruments 9,332 340 Brokered natural gas and marketing (9,244) -
Adjusted revenue 71,260$ 36,042$
Three Months Ended

30
January2016 Corporate
30
Financial and Operational Summary
1. Represents the midpoint of company guidance2. Operating Expense per unit excludes firm transportation, DD&A, exploration, brokered natural gas expenses, and general and administrative
(in thousands, except per share data)
1Q14 2Q14 3Q14 4Q14 FY 2014 1Q15 2Q15 3Q15 2015 GuidanceProduction
Natural Gas (Mcf) 30,656 27,020 67,286 90,784 54,137 109,614 114,131 145,787 NGL (MBbls) 100 1,243 1,265 3,234 1,468 4,383 7,502 7,209 Oil (MBbls) 1,200 1,244 1,814 2,248 1,630 3,939 6,584 6,028
Total Daily Equivalent (MMcfe/d) 38.5 41.9 85.8 123.7 72.7 159.6 198.6 225.2 203.0 Total Equivalent (MMcfe) 3,461 3,817 7,890 11,378 26,546 14,360 18,077 20,719
% Gas 65%
Natural Gas Realized Price ($/Mcf)Average NYMEX Henry Hub ($/MMBtu) 5.17$ 4.58$ 3.95$ 3.34$ 4.26$ 2.90$ 2.74$ 2.76$
Differential to Henry Hub (0.11) (0.49) (1.17) 0.04 (0.75) (0.51) (0.03) 0.10 (0.135)$ Realized Price before Firm Transportation 5.06$ 4.09$ 2.78$ 3.38$ 3.51$ 2.39$ 2.71$ 2.86$
Firm Transportation (0.07) (0.41) (0.30) (0.320)$ Realized Price after Firm Transportation 5.06$ 4.09$ 2.78$ 3.38$ 3.51$ 2.32$ 2.30$ 2.56$
Impact of Cash Settled Derivatives (0.52) (0.38) 0.05 0.26 0.01 0.61 0.75 0.64 Realized Price after Cash Settled Derivatives 4.54$ 3.71$ 2.83$ 3.64$ 3.52$ 3.00$ 3.46$ 3.50$ Realized Price after Hedging and Firm Transportation 4.54$ 3.71$ 2.83$ 3.64$ 3.52$ 2.92$ 3.05$ 3.20$
NGL Realized Price ($/Bbl)Average NYMEX WTI ($/Bbl) 98.68$ 102.99$ 97.25$ 72.72$ 92.91$ 48.49$ 57.67$ 46.81$
% of WTI 65% 54% 45% 42% 42% 40% 24% 9% 22.0%Realized Price 63.88$ 55.95$ 44.09$ 30.30$ 39.27$ 19.17$ 14.01$ 4.16$
Oil Realized Price ($/Bbl)Average NYMEX WTI ($/Bbl) 98.68$ 102.99$ 97.25$ 72.72$ 92.91$ 48.49$ 57.67$ 46.81$
Differential to WTI (3.73) (9.69) (17.19) (9.18) (13.37) (12.83) (12.19) (9.29) (11.75)$ Realized Price before Hedging 94.95$ 93.30$ 80.06$ 63.54$ 79.54$ 35.66$ 45.48$ 37.52$
Impact of Cash Settled Derivatives - - - - - 0.00 1.16 1.46 Realized Price after Cash Settled Derivatives 94.95$ 93.30$ 80.06$ 63.54$ 79.54$ 35.66$ 46.64$ 38.98$
Operating expenses per Mcfe ($/Mcfe)Lease operating 0.52 0.69 0.26 0.18 0.32 0.23 0.20 0.16 Transportation, gathering and compression 0.26 0.77 0.87 0.65 0.68 0.87 1.25 1.10 Production and ad valorem taxes 0.10 0.18 0.27 0.34 0.27 0.15 0.17 0.15 Unit Operating Costs 0.88 1.64 1.40 1.17 1.27 1.25 1.62 1.41 OpEx excluding Firm Transportation 0.88 1.65 1.40 1.17 1.27 1.20 1.38 1.22 1.305$ Depreciation, depletion and amortization 3.48 2.61 3.80 3.27 3.36 2.95 3.35 3.24 General and administrative 2.43 2.21 1.51 1.47 1.71 0.83 0.70 0.66
Revenues ($ thousands)Natural gas sales 13,959 10,066 17,208 28,217 69,450 23,609 28,715 38,360 NGL sales 574 6,329 5,132 9,013 21,048 7,564 9,563 2,757 Oil sales 10,255 10,560 13,362 13,141 47,318 12,641 27,246 20,811
Oil and natural gas sales 24,788 26,955 35,702 50,371 137,816 43,814 64,984 61,928 Brokered natural gas and marketing revenue 9,469 9,244
Total revenues excluding Hedging 24,788 26,955 35,702 50,371 137,816 43,814 74,453 71,172 0Net of Cash Settled Derivatives (1,441) (931) 340 2,211 179 5,965 8,457 9,332
Total revenues after Hedging 23,347 26,024 36,042 52,582 137,995 49,779 82,910 80,504
Expenses ($ thousands)Lease operating 1,791 2,643 2,077 2,007 8,518 3,346 3,589 3,212 Transportation, gathering and compression 904 2,949 6,857 7,404 18,114 12,451 22,634 22,810 Production and ad valorem taxes 353 702 2,132 3,897 7,084 2,100 3,078 3,175
Total Lifting Costs 3,048 6,294 11,066 13,308 33,716 17,897 29,301 29,197 0Cash general and administrative 8,365 8,402 11,866 16,503 45,136 11,197 11,307 12,498 Brokered natural gas and marketing expense 10,795 9,262
Adjusted EBITDAX 11,934 11,328 13,110 26,054 62,426 20,686 31,507 29,571
Rig termination - - - 3,283 3,283 7,056 366 174 Depreciation, depletion and amortization 12,027 9,957 29,983 37,251 89,218 42,432 60,641 67,172 Exploration 4,545 9,295 3,057 4,289 21,186 13,453 6,243 3,244 Impairment of oil and gas properties - - 4,605 30,250 34,855 - - -
Net Income (Loss) (18,451) (112,648) (19,054) (33,023) (183,176) (34,103) (41,970) (81,468)
Capital Expenditures ($ thousands)Drilling and Completion 82,158 160,335 193,311 208,682 644,486 88,830 106,352 48,283 Midstream 1,109 6,625 20,087 5,439 33,260 12,393 (28,317) 197 Land 52,563 32,457 24,372 18,121 127,513 16,725 7,034 3,149 Other 1,628 1,239 550 678 4,095 2,119 435 36
Total 137,458 200,657 238,321 232,920 809,356 120,067 85,505 51,665 330,000

31
January2016 Corporate
31
Favorable Lease Expiration Schedule
Utica Core Area Leasehold Expiration(1)
1. As of December 31, 2015
5.0%
28.6%
11.0%13.1%
42.3%
0%
5%
10%
15%
20%
25%
30%
35%
40%
45%
2016 2017 2018 2019+ Fee/HBP
~57% of leases have a 5-year extension option Eclipse is aggressively amending leases whose primary term is set to expire in 2017 and 2018 to replace the
five year lump sum extension option to optional annual payments of 5-8 years. To date, Eclipse has executed amendments representing approximately 6,000 net acres

32
January2016 Corporate
32
Hedging SummaryNatural Gas Hedges Volume
(MMBtu/d)Production Period Weighted Average
Price ($/MMBtu)
Natural Gas Swaps65,000 January 2016 – December 2016 $3.28
Natural Gas CollarFloor purchased (put) 30,000 January 2016 – December 2017 $3.00
Ceiling sold (call) 30,000 January 2016 – December 2017 $3.50Natural Gas – Three-Way Collars
Floor Purchased (Put) 40,000 January 2016 – December 2016 $2.90Ceiling Sold (Call) 20,000 January 2016 – December 2016 $3.25Ceiling Sold (Call) 20,000 January 2016 – December 2016 $3.22
Floor Sold (Put) 40,000 January 2016 – December 2016 $2.35Natural Gas Call/Put Options
Put Sold 16,800 January 2016 – December 2016 $2.75Call Sold 40,000 January 2018 – December 2018 ($3.75)
Natural Gas Basis SwapsDom South 10,000 Current to March 2016 ($0.90)
TETCO M3 25,000 November 2015 – March 2016 0.83
NGL Hedges Volume(Gal/d)
Production Period Weighted AveragePrice ($/gal)
Propane Swaps42,000 January 2016 – December 2016 $0.46021,000 January 2016 – June 2016 $0.43310,500 July 2016 – September 2016 $0.455
Oil Hedges Volume(Bbl/d)
Production Period Weighted AveragePrice ($/Bbl)
Oil – CollarFloor Purchased (Put) 3,000 Current – February 2016 $55.00
Ceiling Sold (Call) 3,000 Current – February 2016 $61.40Oil – Three-Way Collar
Floor purchased (put) 1,000 March 2016 - December 2016 $60.00Ceiling sold (call) 1,000 March 2016 - December 2016 $70.10
Floor sold (put) 1,000 March 2016 - December 2016 $45.00

33
January2016 Corporate
33
0%
10%
20%
30%
40%
50%
60%
70%
80%
-25% -20% -15% -10% -5% 0% 5% 10% 15% 20% 25%
BT IR
R
Capex Change
0%
10%
20%
30%
40%
50%
60%
70%
6,000 8,000 10,000 12,000 14,000 16,000
BT IR
R
Lateral Length (ft.)
Dry Gas East(1)
Type Curve Assumptions Map
Commodity Price BT IRR SensitivityCapEx BT IRR Sensitivity
Eclipse Acreage Area
Lateral Length IRR Sensitivity
1. Assumes 10,000’ lateral. Base Case for CapEx and Lateral Length IRR Sensitivities assume $3.00 Gas, $60.00 Oil, 35% WTI NGL pricing
Base Case
Base Case
$2.00
$2.50
$3.00
$3.50
$4.00
$4.50
0% 10% 20% 30% 40% 50% 60% 70% 80% 90% 100%
Gas P
rice
($/D
th)
BT IRR
Well CharacteristicsBcfe / 1000' 2.1Lateral Length 10,000 Gross EUR (Mmcfe, Post-Processing) 20,893 PPT Rf 69%PPT + Utica Rf 47%Type CurveExponential Phase
Gas IP Rate (MMcf/d) 16.8Initial Decline (%) 0%Months 8
Hyperbolic PhaseInitial Decline (%) 63%B Factor 1.20Terminal Decline (%) 6%
LiquidsInitial Cond. Yield (Bbl/Mmcf) N/ANGL Yield (Bbl/Mmcf) N/A
Drilling And CompletionD&C Cost ($'000/well) 10,476 Net Acres 12,005 Estimated Remaining Net Locations 54
34
January2016 Corporate
34
0%
10%
20%
30%
40%
50%
60%
70%
-25% -20% -15% -10% -5% 0% 5% 10% 15% 20% 25%
BT IR
R
Capex Change
0%
10%
20%
30%
40%
50%
60%
6,000 8,000 10,000 12,000 14,000 16,000
IRR
Lateral Length (ft.)
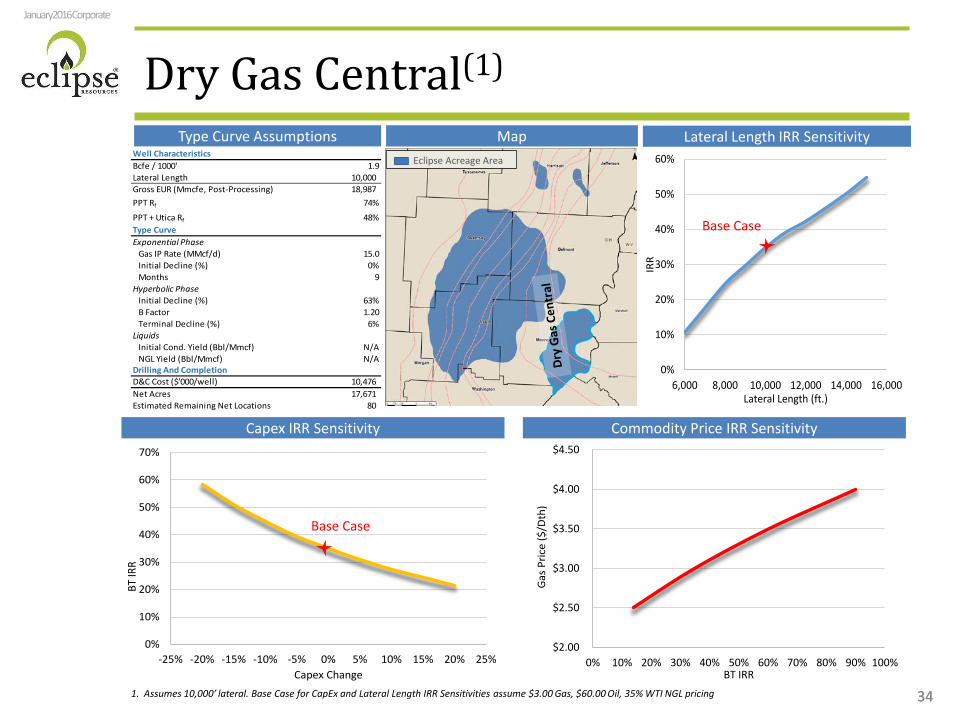
Dry Gas Central(1)
Type Curve Assumptions Map
Commodity Price IRR SensitivityCapex IRR Sensitivity
Eclipse Acreage Area
Lateral Length IRR Sensitivity
Base Case
Base Case
$2.00
$2.50
$3.00
$3.50
$4.00
$4.50
0% 10% 20% 30% 40% 50% 60% 70% 80% 90% 100%
Gas
Pric
e ($
/Dth
)
BT IRR
Well CharacteristicsBcfe / 1000' 1.9Lateral Length 10,000 Gross EUR (Mmcfe, Post-Processing) 18,987 PPT Rf 74%
PPT + Utica Rf 48%Type CurveExponential Phase
Gas IP Rate (MMcf/d) 15.0Initial Decline (%) 0%Months 9
Hyperbolic PhaseInitial Decline (%) 63%B Factor 1.20Terminal Decline (%) 6%
LiquidsInitial Cond. Yield (Bbl/Mmcf) N/ANGL Yield (Bbl/Mmcf) N/A
Drilling And CompletionD&C Cost ($'000/well) 10,476 Net Acres 17,671 Estimated Remaining Net Locations 80
1. Assumes 10,000’ lateral. Base Case for CapEx and Lateral Length IRR Sensitivities assume $3.00 Gas, $60.00 Oil, 35% WTI NGL pricing

35
January2016 Corporate
35
0%
10%
20%
30%
40%
50%
60%
-25% -20% -15% -10% -5% 0% 5% 10% 15% 20% 25%
BT IR
R
Capex Change
0%
5%
10%
15%
20%
25%
30%
35%
40%
45%
50%
55%
6,000 8,000 10,000 12,000 14,000 16,000
BT IR
R
Laterla Length (ft.)
Dry Gas West(1)
Type Curve Assumptions Map
Commodity Price IRR SensitivityCapex IRR Sensitivity
Eclipse Acreage Area
Lateral Length IRR Sensitivity
Base Case
Base Case
$2.00
$2.50
$3.00
$3.50
$4.00
$4.50
0% 10% 20% 30% 40% 50% 60% 70% 80% 90% 100%
Gas P
rice
($/D
th)
BT IRR
Well CharacteristicsBcfe / 1000' 1.8Lateral Length 10,000 Gross EUR (Mmcfe, Post-Processing) 17,672 PPT Rf 80%PPT + Utica Rf 49%Type CurveExponential Phase
Gas IP Rate (MMcf/d) 14.0Initial Decline (%) 0%Months 9
Hyperbolic PhaseInitial Decline (%) 63%B Factor 1.20Terminal Decline (%) 6%
LiquidsInitial Cond. Yield (Bbl/Mmcf) N/ANGL Yield (Bbl/Mmcf) N/A
Drilling And CompletionD&C Cost ($'000/well) 10,476 Net Acres 17,153 Estimated Remaining Net Locations 82
1. Assumes 10,000’ lateral. Base Case for CapEx and Lateral Length IRR Sensitivities assume $3.00 Gas, $60.00 Oil, 35% WTI NGL pricing

36
January2016 Corporate
36
0%
5%
10%
15%
20%
25%
30%
35%
-25% -20% -15% -10% -5% 0% 5% 10% 15% 20% 25%
BT IR
R
Capex Change
0%
5%
10%
15%
20%
25%
30%
35%
6,000 8,000 10,000 12,000 14,000 16,000
BT IR
R
Lateral Length (ft.)
Rich Gas(1)
Type Curve Assumptions Map
Commodity Price IRR SensitivityCapex IRR Sensitivity
Lateral Length IRR SensitivityEclipse Acreage Area
1. Assumes 10,000’ lateral. Base Case for CapEx and Lateral Length IRR Sensitivities assume $3.00 Gas, $60.00 Oil, 35% WTI NGL pricing
Base Case
Base Case
$35
$45
$55
$65
$75
$85
$2.00
$2.50
$3.00
$3.50
$4.00
$4.50
0% 10% 20% 30% 40% 50% 60%
Oil
Price
($/B
bl)
Gas P
rice
($/D
th)
BT IRR
Gas Sensitivity at Strip Oil Oil Sensitivity at Strip Gas
Well CharacteristicsBcfe / 1000' 1.8Lateral Length 10,000 Gross EUR (Mmcfe, Post-Processing) 17,730 PPT Rf 85%
PPT + Utica Rf 51%Type CurveExponential Phase
Gas IP Rate (MMcf/d) 11.0Initial Decline (%) 0%Months 9
Hyperbolic PhaseInitial Decline (%) 63%B Factor 1.20Terminal Decline (%) 6%
LiquidsInitial Cond. Yield (Bbl/Mmcf) 15NGL Yield (Bbl/Mmcf) 60.0
Drilling And CompletionD&C Cost ($'000/well) 9,166 Net Acres 7,911 Estimated Remaining Net Locations 44

37
January2016 Corporate
37
0%
5%
10%
15%
20%
25%
30%
35%
40%
-25% -20% -15% -10% -5% 0% 5% 10% 15% 20% 25%
BT IR
R
Capex Change
0%
5%
10%
15%
20%
25%
30%
35%
6,000 8,000 10,000 12,000 14,000 16,000
BT IR
R
Lateral Length (ft.)
Condensate/Rich Gas(1)
Commodity Price IRR SensitivityCapex IRR Sensitivity
Eclipse Acreage Area
Type Curve Assumptions Map Lateral Length IRR Sensitivity
1. Assumes 10,000’ lateral. Base Case for CapEx and Lateral Length IRR Sensitivities assume $3.00 Gas, $60.00 Oil, 35% WTI NGL pricing
Base Case
Base Case
$35
$45
$55
$65
$75
$85
2.00
2.50
3.00
3.50
4.00
4.50
0% 10% 20% 30% 40% 50%
Gas P
rice
($/D
th)
BT IRRGas Sensitivity at Strip Oil Oil Sensitivity at Strip Gas
Well CharacteristicsBcfe / 1000' 1.4Lateral Length 10,000 Gross EUR (Mmcfe, Post-Processing) 14,063 PPT Rf 85%PPT + Utica Rf 49%Type CurveExponential Phase
Gas IP Rate (MMcf/d) 7.0Initial Decline (%) 0%Months 9
Hyperbolic PhaseInitial Decline (%) 60%B Factor 1.25Terminal Decline (%) 6%
LiquidsInitial Cond. Yield (Bbl/Mmcf) 60NGL Yield (Bbl/Mmcf) 80.4
Drilling And CompletionD&C Cost ($'000/well) 9,166 Net Acres 10,065 Estimated Remaining Net Locations 60

38
January2016 Corporate
38
0%
10%
20%
30%
40%
50%
60%
-25% -20% -15% -10% -5% 0% 5% 10% 15% 20% 25%
BT IR
R
Capex Change
0%
5%
10%
15%
20%
25%
30%
35%
40%
45%
50%
6,000 8,000 10,000 12,000 14,000 16,000
BT IR
R
Lateral Length (ft.)
Lean Condensate(1)
Commodity Price IRR SensitivityCapex IRR Sensitivity
Eclipse Acreage Area
Type Curve Assumptions Map Lateral Length IRR Sensitivity
1. Assumes 10,000’ lateral. Base Case for CapEx and Lateral Length IRR Sensitivities assume $3.00 Gas, $60.00 Oil, 35% WTI NGL pricing
Base Case
Base Case
$35
$45
$55
$65
$75
$85
$2.00
$2.50
$3.00
$3.50
$4.00
$4.50
0% 10% 20% 30% 40% 50% 60% 70%
Oil
Pric
e ($
/Bbl
)
Gas P
rice
($/D
th)
BT IRR
Gas Sensitivity at Strip Oil Oil Sensitivity at Strip Gas
Well CharacteristicsBcfe / 1000' 0.9Lateral Length 10,000 Gross EUR (Mmcfe, Post-Processing) 9,060 PPT Rf 64%
PPT + Utica Rf 34%Type CurveExponential Phase
Gas IP Rate (MMcf/d) 3.3Initial Decline (%) 0%Months 12
Hyperbolic PhaseInitial Decline (%) 60%B Factor 1.25Terminal Decline (%) 6%
LiquidsInitial Cond. Yield (Bbl/Mmcf) 150NGL Yield (Bbl/Mmcf) 87.7
Drilling And CompletionD&C Cost ($'000/well) 9,166 Net Acres 16,099 Estimated Remaining Net Locations 83

39
January2016 Corporate
39
0%
10%
20%
30%
40%
50%
60%
-25% -20% -15% -10% -5% 0% 5% 10% 15% 20% 25%
BT IR
R
Capex Change
0%
5%
10%
15%
20%
25%
30%
35%
40%
45%
50%
6,000 8,000 10,000 12,000 14,000 16,000
BT IR
R
Lateral Length (ft.)
Rich Condensate(1)
Commodity Price IRR SensitivityCapex IRR Sensitivity
Eclipse Acreage Area
Type Curve Assumptions Map Lateral Length IRR Sensitivity
1. Assumes 10,000’ lateral. Base Case for CapEx and Lateral Length IRR Sensitivities assume $3.00 Gas, $60.00 Oil, 35% WTI NGL pricing
Base Case
Base Case
$35
$45
$55
$65
$75
$85
$2.00
$2.50
$3.00
$3.50
$4.00
$4.50
0% 10% 20% 30% 40% 50% 60% 70% 80%
Oil
Pric
e ($
/Bbl
)
Gas P
rice
($/D
th)
BT IRRGas Sensitivity at Strip Oil Oil Sensitivity ar Strip Gas
Well CharacteristicsBcfe / 1000' 0.9Lateral Length 10,000 Gross EUR (Mmcfe, Post-Processing) 8,607 PPT Rf 76%PPT + Utica Rf 36%Type CurveExponential Phase
Gas IP Rate (MMcf/d) 2.4Initial Decline (%) 0%Months 8
Hyperbolic PhaseInitial Decline (%) 50%B Factor 1.25Terminal Decline (%) 6%
LiquidsInitial Cond. Yield (Bbl/Mmcf) 200NGL Yield (Bbl/Mmcf) 91.5
Drilling And CompletionD&C Cost ($'000/well) 9,166 Net Acres 3,910 Estimated Remaining Net Locations 20

40
January2016 Corporate
40
0%
10%
20%
30%
40%
50%
60%
-25% -20% -15% -10% -5% 0% 5% 10% 15% 20% 25%
BT IR
R
Capex Change
0%
5%
10%
15%
20%
25%
30%
35%
40%
45%
50%
55%
6,000 8,000 10,000 12,000 14,000 16,000
BT IR
R
Lateral Length (ft.)
Very Rich Condensate(1)
Commodity Price IRR SensitivityCapex IRR Sensitivity
Eclipse Acreage Area
Type Curve Assumptions Map Lateral Length IRR Sensitivity
1. Assumes 10,000’ lateral. Base Case for CapEx and Lateral Length IRR Sensitivities assume $3.00 Gas, $60.00 Oil, 35% WTI NGL pricing
Base Case
Base Case
$35
$45
$55
$65
$75
$85
$2.00
$2.50
$3.00
$3.50
$4.00
$4.50
0% 10% 20% 30% 40% 50% 60% 70% 80%
Oil
Pric
e ($
/Bbl
)
Gas P
rice
($/D
th)
BT IRRGas Sensitivity at Strip Oil Oil Sensitivity at Strip Gas
Well CharacteristicsBcfe / 1000' 0.7Lateral Length 10,000 Gross EUR (Mmcfe, Post-Processing) 7,043 PPt Rf 62%
PPt + Utica Rf 30%Type CurveExponential Phase
Gas IP Rate (MMcf/d) 1.5Initial Decline (%) 0%Months 24
Hyperbolic PhaseInitial Decline (%) 55%B Factor 1.25Terminal Decline (%) 6%
LiquidsInitial Cond. Yield (Bbl/Mmcf) 300NGL Yield (Bbl/Mmcf) 93.0
Drilling And CompletionD&C Cost ($'000/well) 9,166 Net Acres 5,576 Estimated Remaining Net Locations 31

41
January2016 Corporate
41
0%
10%
20%
30%
40%
50%
60%
70%
80%
90%
100%
-25% -20% -15% -10% -5% 0% 5% 10% 15% 20% 25%
BT IR
R
Capex Change
0%
10%
20%
30%
40%
50%
60%
70%
80%
90%
6,000 8,000 10,000 12,000 14,000 16,000
BT IR
R
Lateral Length (ft.)
Marcellus East(1)
Commodity Price IRR SensitivityCapex IRR Sensitivity
Eclipse Acreage Area
1. Assumes 10,000’ lateral, to be drilled off of an existing Utica well pad.2. Base Case for CapEx and Lateral Length IRR Sensitivities assume $3.00 Gas, $60.00 Oil, 35% WTI NGL pricing
Type Curve Assumptions Map Lateral Length IRR Sensitivity
Base Case
Base Case
$35
$45
$55
$65
$75
$85
$2.00
$2.50
$3.00
$3.50
$4.00
$4.50
0% 20% 40% 60% 80% 100% 120% 140%
Oil
Price
($/B
bl)
Gas P
rice
($/D
th)
BT IRR
Gas Sensitivity at Strip Oil Oil Sensitivity at Strip Gas
Well CharacteristicsBcfe / 1000' 1.6Lateral Length 10,000 Gross EUR (Mmcfe, Post-Processing) 15,658 Marcellus and Geneseo Rf 62%
Type CurveExponential Phase
Gas IP Rate (MMcf/d) 5.5Initial Decline (%) 0%Months 4
Hyperbolic PhaseInitial Decline (%) 54%B Factor 1.40Terminal Decline (%) 6%
LiquidsInitial Cond. Yield (Bbl/Mmcf) 100NGL Yield (Bbl/Mmcf) 125.0
Drilling And CompletionD&C Cost ($'000/well) 7,892 Net Acres 12,821 Estimated Remaining Net Locations 63

42
January2016 Corporate
42
0%
2%
4%
6%
8%
10%
12%
14%
16%
18%
-25% -20% -15% -10% -5% 0% 5% 10% 15% 20% 25%
BT IR
R
Capex Change
0%
5%
10%
15%
20%
6,000 8,000 10,000 12,000 14,000 16,000
BT IR
R
Lateral Length (ft.)
Marcellus West(1)
Commodity Price IRR SensitivityCapex IRR Sensitivity
Eclipse Acreage Area
Type Curve Assumptions Map Lateral Length IRR Sensitivity
Base Case
Base Case
1. Assumes 10,000’ lateral, to be drilled off of an existing Utica well pad.2. Base Case for CapEx and Lateral Length IRR Sensitivities assume $3.00 Gas, $60.00 Oil, 35% WTI NGL pricing
$35
$45
$55
$65
$75
$85
$2.00
$2.50
$3.00
$3.50
$4.00
$4.50
0% 5% 10% 15% 20% 25% 30% 35% 40%
Oil
Pric
e ($
/Bbl
)
Gas P
rice
($/D
th)
BT IRRGas Sensitivity at Strip Oil Oil Sensitivity at Strip Gas
Well CharacteristicsBcfe / 1000' 0.6Lateral Length 10,000 Gross EUR (Mmcfe, Post-Processing) 6,486 Marcellus and Geneseo Rf 62%
Type CurveExponential Phase
Gas IP Rate (MMcf/d) 2.0Initial Decline (%) 0%Months 4
Hyperbolic PhaseInitial Decline (%) 54%B Factor 1.40Terminal Decline (%) 6%
LiquidsInitial Cond. Yield (Bbl/Mmcf) 200NGL Yield (Bbl/Mmcf) 125.0
Drilling And CompletionD&C Cost ($'000/well) 7,892 Net Acres 16,101 Estimated Remaining Net Locations 78