ecg lecture
TRANSCRIPT

ELECTROCARDIOGRAM
avm


The Leads
• Leads I, II, III – are the bipolar limb leads– Measures the ECG along the frontal planes
• Leads AVR, AVL and AVF – are the augmented limb leads
• V1-V6 – are the chest or precordial leads– Measures the ECG along the transverse plane

How to attach the leads
• Limb leads– Black-right ankle– Red-right arm– Yellow-left arm– Green-left ankle
• Chest leads– V1-4th ICS, RPSB– V2-4th ICS, LPSB– V3-between V2 and V4– V4-5th ICS, LMCL– V5-5th ICS, LAAL– V6-5th ICS, LMAL

Chest leadsV1: 4th ICS, RPSB
V2: 4th ICS, LPSB
V3: between V2 and V4
V4: 5th ICS, LMCL
V5: 5th ICS, LAAL
V6: 5th ICS, LMAL

• Standardization– 1mV = 10 mm
• Paper speed 25 mm/sec:– 1 small box = 0.04 sec– 1 big box = 0.2 sec


Atrial Activation(depolarization)
Ventricular Activation(depolarization)
Ventricular deactivation(repolarization)

S4 S1 S2 S3
Mitral and Tricuspid Valve Close
Aortic and Pulmonary Valve Close
Rapid Filling Phase of Ventricular Diastole
Atrial Filling Phase of Ventricular Diastole
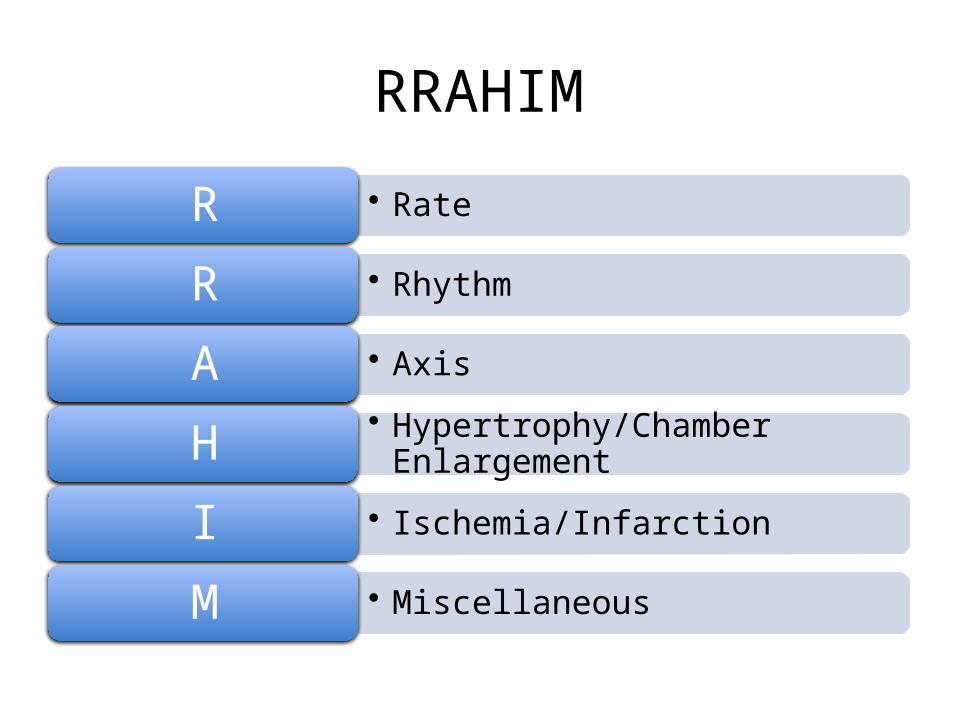
RRAHIM
• RateR• RhythmR• AxisA• Hypertrophy/Chamber EnlargementH• Ischemia/InfarctionI• MiscellaneousM

Measurement of Rate
• Formula 1: 300 # big squares between R-R
• Formula 2: 1500 # small squares between R-R
• For irregular heart rates, get the number of QRS complexes in a 6-second strip; then multiply by 10

Check the Rhythm
1. Is there a P wave? Same P wave?2. Regular or Irregular?3. Check relation of P wave to QRS.4. Check PR interval (0.12- 0.20 sec)


Determination of Axis
Normal axis is from -30° to 110°

Determination of AxisLead I Lead AVF
Normal Axis + +Left axis deviation + -Right axis deviation - +Indeterminate Axis - -
• Axis
• If negative in I and positive in aVF (RAD)= 180 –

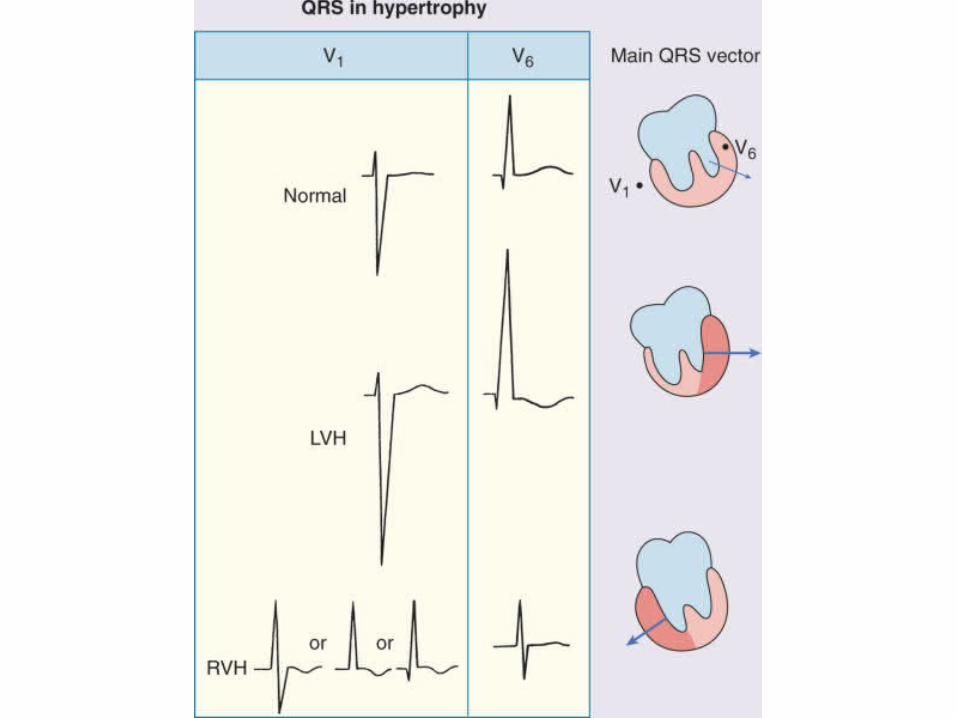
Hypertrophy/Chamber Enlargement

Hypertrophy/Chamber Enlargement
Parameter for LVH Criteria
Sokolow-Lyon index • SV1 + (RV5 or RV6) > 3.5 mV

Criteria for Ischemia/Infarction
ISCHEMIAST-segment depression• At least 1 mmT wave inversion• >5mm
INFARCTIONST Elevation: • ≥2mm in ≥ 2 contiguous
chest leads• ≥1mm in ≥ 2 contiguous
limb leadsSignificant Q waves:• ¼ of QRS complex or • ≥ 0.04 sec (1 sm )

Wall InvolvementLeads Wall
II, III, avF: Inferior wallI and avL: High lateral wall
V1, V2: Septal wallV3, V4: Anterior wallV5, V6: Lateral wall
Mirror image of V1, V2: Posterior wallV3R and V4R: RV wall

Significant Q Wave

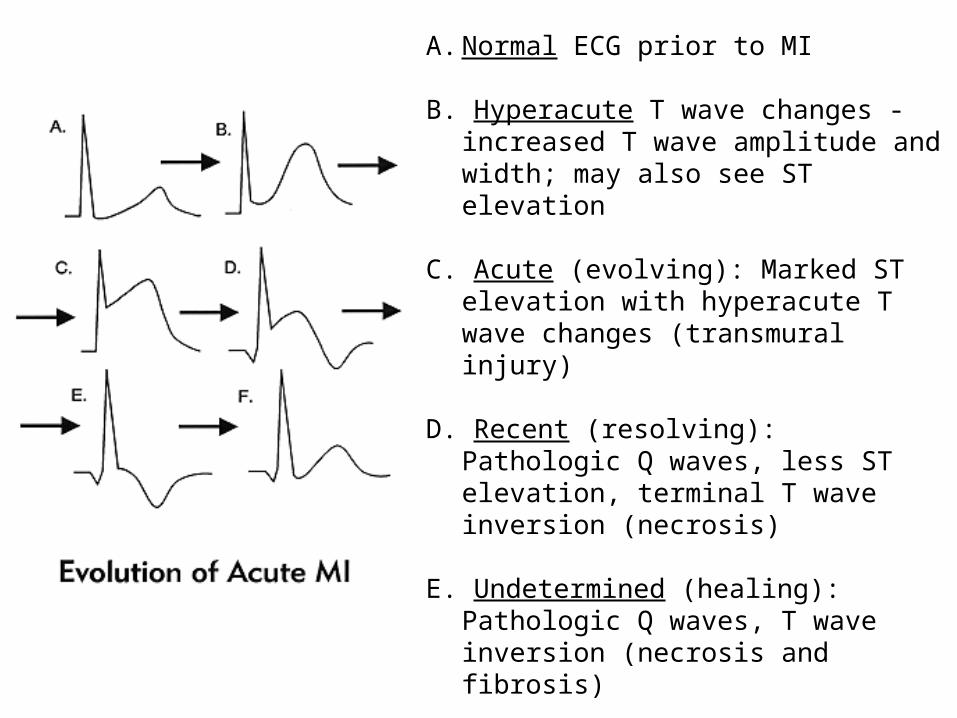
A. Normal ECG prior to MI
B. Hyperacute T wave changes - increased T wave amplitude and width; may also see ST elevation
C. Acute (evolving): Marked ST elevation with hyperacute T wave changes (transmural injury)
D. Recent (resolving): Pathologic Q waves, less ST elevation, terminal T wave inversion (necrosis)
E. Undetermined (healing): Pathologic Q
waves, T wave inversion (necrosis and fibrosis)
F. Old: Pathologic Q waves, upright T waves (fibrosis)

• ST depression in v4-V6
• Note: upsloping ST depression is not an ischemic abnormality

RRAHIM
• 1500/# small squares between R-RRate
• P wave (0.12-0.20s); P wave to QRS• Regular/IrregularRhythm
Axis
• SV1 + (RV5 or RV6) > 3.5 mVHypertrophy
• Ischemia: At least 1 mm ST depression; T wave inversion (>5mm)• Infarction: ST Elevation: ≥2mm (chest leads); ≥1mm (limb leads);
Significant Q wavesIschemia/Infarction

RATE

Heart rate assessment by “rule of 300”
Determination of Heart Rate

Measurement of Rate
• Formula 1: 300 # big squares between R-R
• Formula 2: 1500 # small squares between R-R
• For irregular heart rates, get the number of QRS complexes in a 6-second strip; then multiply by 10

Pacemakers of the HeartSA NODE Dominant 60-100 bpmAV Junction SA NODE Bundle of His
Escape 40-60 bpm
Ventricular Bundle Branch Purkinje Fiber
Escape 20-40 bpm

Labeling the ECG
Sinus Tachycardia
Junctional Accelerated
Tachycardia
Ventricular Accelerated Tachycardia
0 20 40 60 80 100

RHYTHM
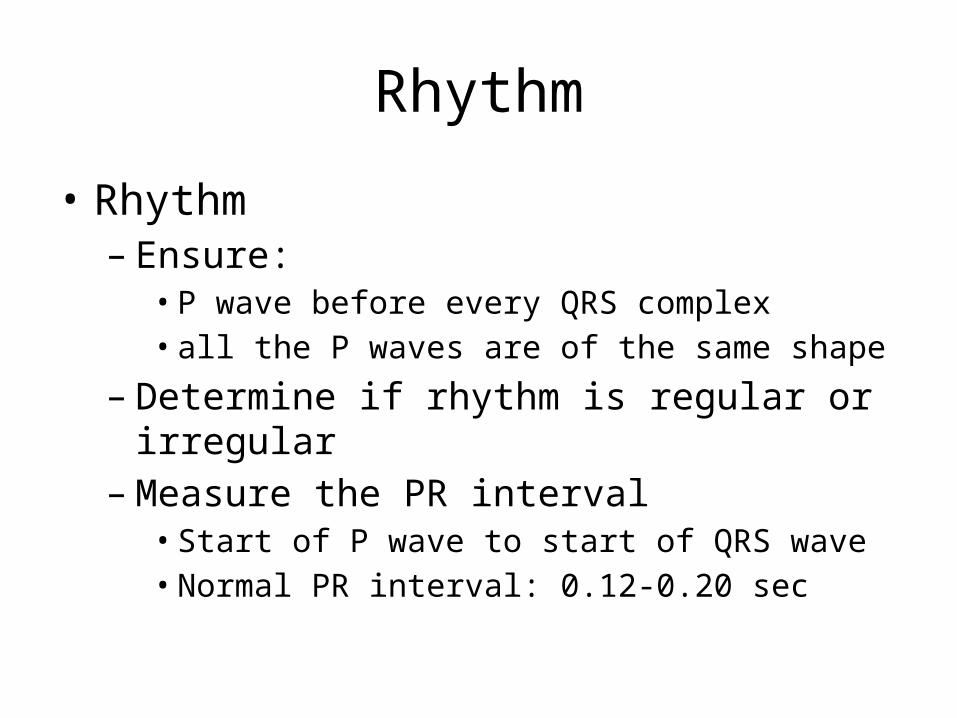
Rhythm
• Rhythm– Ensure:
• P wave before every QRS complex • all the P waves are of the same shape
– Determine if rhythm is regular or irregular– Measure the PR interval
• Start of P wave to start of QRS wave• Normal PR interval: 0.12-0.20 sec

Rhythm
1. Identify the P wave..Sinus?2. Check relation of P to QRS3. Check PR interval (0.12- 0.20 sec)
AV block?4. Check QRS (<0.12s)
BBB?5. Relation of R-R and P-P
P-P < R-R: complete heart block P-P > R-R: AV dissociation

Rhythm
• Is there a sinus P? upright in most leads inverted in AVR, biphasic in V1 3 different Ps in MAT or WP absent in AF, junctional /vent rhythm
buried or after QRS in SVT, 3AVB

Rhythm: PR Interval (0.12 - 0.20 s)
• Shortened PR – Pre-excitation syndrome
• WPW• LGL (Lown-Ganong-
Levine)
– AV Junctional Rhythms with retrograde atrial activation
– Ectopic atrial rhythms originating near the AV node
– Normal variant
• prolonged PR interval– First degree AV block
• Intra-atrial conduction delay (uncommon)
• Slowed conduction in AV node (most common site)
• Slowed conduction in His bundle (rare)
• Slowed conduction in bundle branch
– Second degree AV block • Type I (Wenckebach)• Type II (Mobitz)
– AV dissociation

Rhythm
• Check QRS interval– wide QRS in
• IVCD• LBBB• Complete RBBB• VTach• aberrantly conducted PAC

Rhythm
• Compare PP and RR interval normally equal PP < RR in complete heart block PP > RR in AV dissociation

Rhythm
1. Sinus Rhythm2. Heart Blocks
• 1°, 2° Mobitz type I, 2° Mobitz type II, 3°, LBBB, RBBB
3. Common Supraventricular Arrhythmias• AFib, A Flutter, SVT
4. Ventricular Arrhythmias• PVCs, VT, VFib

1st Degree AV block• PR intervals > 0.20s• One-to-one AV conduction
• Tx: none• This may be caused by:
– drugs, such as digoxin– excessive vagal tone– Ischemia– intrinsic disease in the AV junction or bundle branch
system.
Partial block at AV node

1st Degree AV Block

AV Conduction Defects
• The conduction of the normal wave front can be delayed or blocked at any point after atrial depolarization
• Block may occur within the AV node below the Bundle of His

Second Degree AV BlockType I Type II
Lesion above the Bundle of His Lesion in the Bundle Branch
PR may prolong prior to dropped beat Fixed PR interval; dropped beat
Responds to pharmacologic tx Does NOT respond well to drugs
Rarely requires pacing REQUIRES pacing
Ventricular rhythm reg/irreg

Classic Wenckebach• The 3 rules of "classic AV Wenckebach" are:
– decreasing RR intervals until pause– the pause is less than preceding 2 RR intervals– the RR interval after the pause is greater than the RR interval just prior to pause
• there are many examples of atypical forms of Wenckebach where these rules don't hold
• Presence of sinus rhythm
• Mobitz Type I: P-R intervals of conducted beats vary accdg to Wenckebach periodicity;

2nd Degree AV Block, Type 2
• 2nd degree AV block, Type 2– Note the two consecutive nonconducted P waves
• Presence of sinus rhythm• Mobitz Type II: P-R intervals of conducted beats are normal or
prolonged but constant• Tx: pacemaker insertion

3rd Degree AV Block or Complete Heart Block
1. AV dissociation (p waves seen marching through the QRS complexes)
2. P-P interval is less than R-R interval
3. Idioventricular rhythm
Tx: pacemaker insertion

3rd Degree AV Block

Measurements
• QRS duration (width of most representative QRS)– normally: <0.12s– Differentials:
• QRS duration <0.12s– Incomplete right or left bundle branch block– Nonspecific intraventricular conduction delay (IVCD)– Some cases of left anterior or posterior fascicular block
• QRS duration > 0.12s– Complete RBBB or LBBB– Nonspecific IVCD– Ectopic rhythms originating in the ventricles

Bundle Branch Block

Bundle Branch BlockComplete Left Bundle Branch Block Complete Right Bundle Branch Block
• QRS duration ≥ 120 msec • QRS duration ≥ 120 msec
• Broad, notched R waves in lateral precordial leads (V5 and V6) and usually leads I and aVL
• Broad, notched R waves (rsr , rsR , or ′ ′rSR patterns) in right precordial leads ′(V1 and V2)
• Small or absent initial r waves in right precordial leads (V1 and V2) followed by deep S waves
• Absent septal q waves in left-sided leads
• Prolonged intrinsicoid deflection (>60 msec) in V5 and V6[*}
• Wide and deep S waves in left precordial leads (V5 and V6)

• LBBB – QRS duration >0.12s– monophasic R waves in I and V6– terminal QRS forces oriented leftwards and posterior– The ST-T waves oriented opposite to the terminal QRS forces

• RBBB – QRS duration >0.12s– rSR' in V1– terminal QRS forces oriented rightwards and anterior– ST-T waves oriented opposite to the terminal QRS forces

Fascicular BlocksLeft Anterior Fascicular Block Left Posterior Fascicular Block
• Frontal plane mean QRS axis of -45 to - 90 degrees with rS patterns in leads II, III, and aVF and a qR pattern in lead aVL
• QRS duration <120 msec
• Frontal plane mean QRS axis >120 degrees
• RS pattern in leads I and aVL with qR patterns in inferior leads
• QRS duration < 120 msec• Exclusion of other factors causing right
axis deviation (e.g., right ventricular overload patterns, lateral infarction)

Fascicular Blocks

Hemiblocks
• RBBB + LAHB: RBBB + LAD + negative QRS in II• RBBB + LPHB: RBBB + very deep straight S
wave in I w/ mirror image in II• Trifascicular: PLUS 1° AV block• IVCD: wide QRS not typical of RBBB/LBBB• Brugada Syndrome: RBBB + ST segment
elevation in V1-V3

RBBB + LAHB
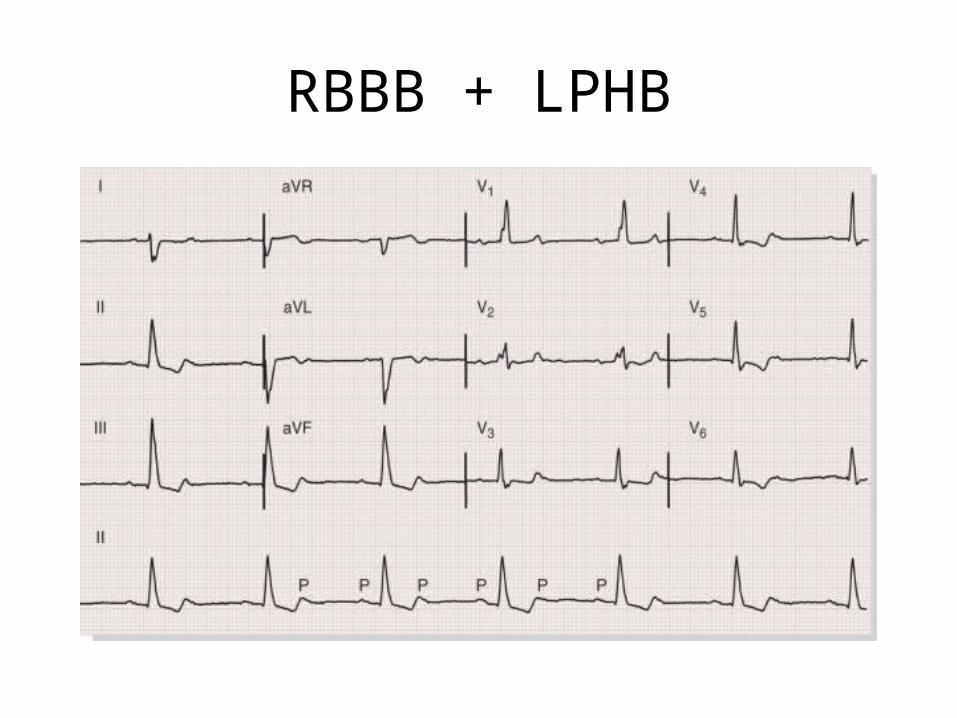
RBBB + LPHB

Measurements
• QT interval– normally QT < 0.42 @ 60 bpm;
QTc < 0.40 sec) – Basett's Formula:
– Poor Man's Guide to upper limits of QT: • For HR = 70 bpm, QT<0.40 sec • for every 10 bpm increase above 70 subtract 0.02 sec• for every 10 bpm decrease below 70 add 0.02 sec

Measurements
• Long QT Syndrome (LQTS) – Torsade-de-pointes
• Drugs• Electrolyte abnormalities• CNS disease• Hereditary LQTS (e.g., Romano-Ward Syndrome)• Coronary Heart Disease

Wolff-Parkinson-White Syndrome

• Wide QRS • Delta wave in V1
• type A if positive (L-sided)
• type B if negative (R-sided)
• Short PR interval
WPW Syndrome

• Note the short PR and the subtle 'delta' wave at the beginning of the QRS complexes

Atrial Mechanism

Premature Atrial Complex
P’ waves: premature, flattened, or notchedP’RI: varies from 0.12-0.20sQRS: <0.12 sec but may be prolongedQRS rate: usually normal, but may depend on underlying rhythmQRS rhythm: irregular due to PACs
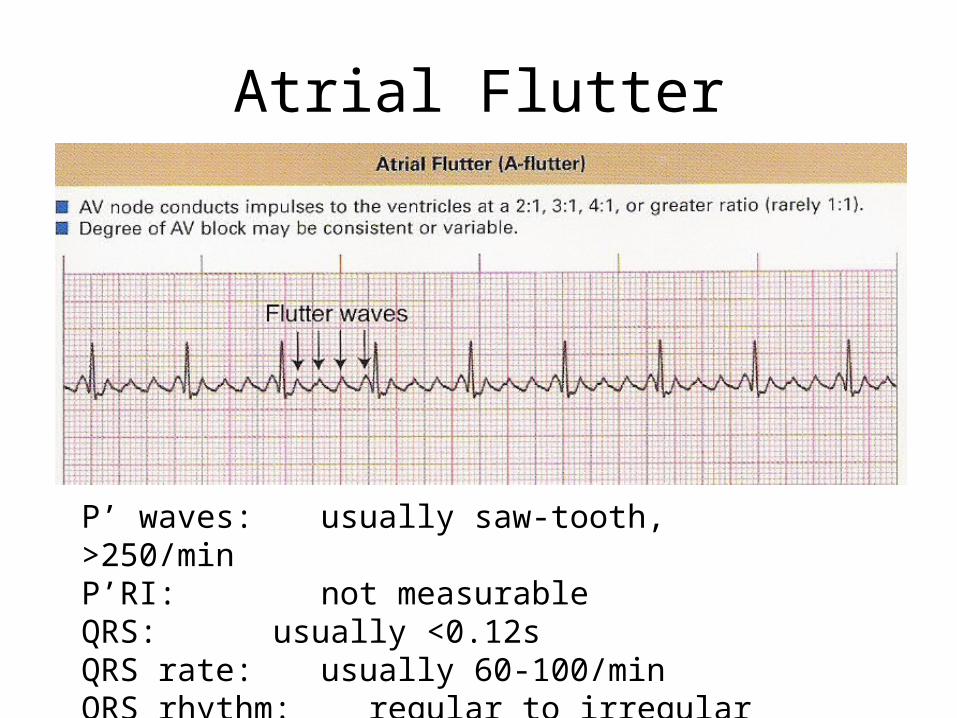
Atrial Flutter
P’ waves: usually saw-tooth, >250/minP’RI: not measurableQRS: usually <0.12sQRS rate: usually 60-100/minQRS rhythm: regular to irregular

Atrial Fibrillation
P’ waves: unable to identifyP’RI: not measurableQRS: ≤0.12sQRS rate: 60-100/min when controlled QRS rhythm: irregularly irregular

Wandering Atrial Pacemaker
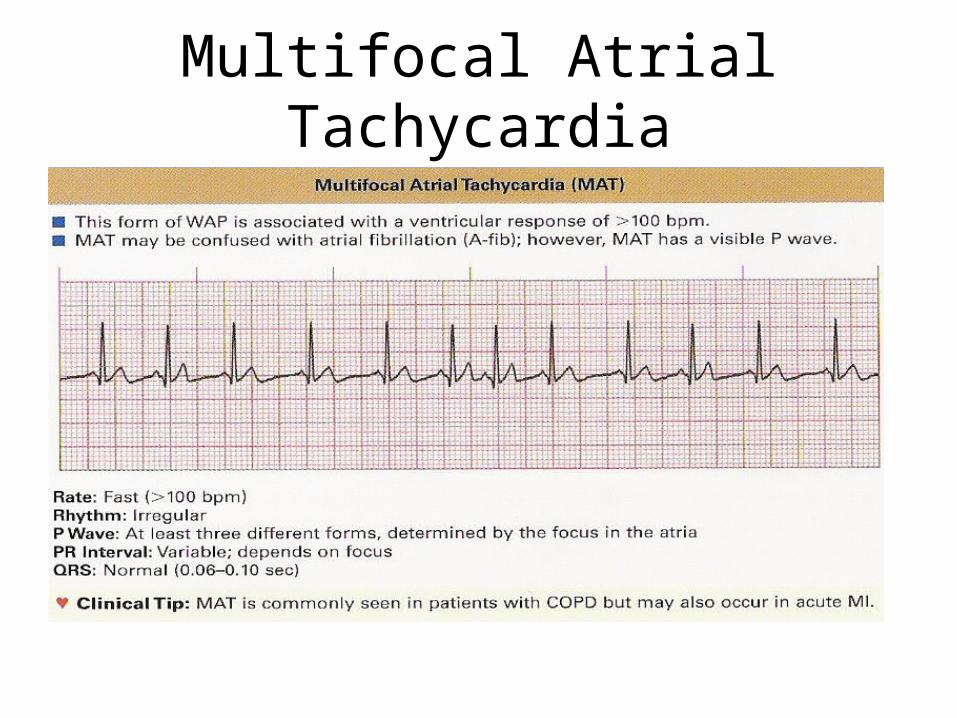
Multifocal Atrial Tachycardia

Supraventricular Tachycardia
P’ waves: atrial P waves are different from the sinus P waves; maybe buried in the QRS (AVNRT); P waves follows the QRS (CMT by an accessory pathway)
P’RI: usually not measurableQRS: < 0.12sQRS rate: 150-250 bpmQRS rhythm: regular

Paroxysmal Supraventricular Tachycardia

Junctional Mechanism

Junctional Mechanism• Sinus node failure AV junction takes over• P prime (P’) – any P wave that originates from other
than the SA node
– P’ wave: none– P’RI: < 0.12 sec– QRS: < 0.12 sec– QRS rate: at least 40-60bpm – QRS rhythm: regular

Junctional Escape Beat
P’ waves: noneP’RI: < 0.12sQRS: usually <0.10sQRS rate:QRS rhythm:

Junctional Rhythm
P’ waves: (-) or noneP’RI: <0.12 secQRS: <0.12 secQRS rate: 40-60 bpmQRS rhythm: regular to slightly irregular

Accelerated Junctional Rhythm
P’ waves: (-) or noneP’RI: <0.12 secQRS: <0.12 secQRS rate: 60-100 bpmQRS rhythm: regular

Premature Junctional Complex
P’ waves: (-) or noneP’RI: <0.12 secQRS: <0.12 secQRS rate:QRS rhythm:

Ventricular Mechanisms

Premature Ventricular Complex
Left ventricular impulse
Right ventricular impulse

Variations in PVCs

Variations in PVCs

Variations in PVCs
• Bigeminy: every other beat is a PVC

Variations in PVCs
• Trigeminy: every 3rd beat is a PVC

Variations in PVCs


Ventricular Tachycardia
P’ waves: may be present or absent, if present they have no set relationship to the QRS complex
P’RI: noneQRS: <0.12 secQRS Rate: 100-250 bpmQRS Rhythm: regular

Ventricular Tachycardia

Intermittent V-Tach

Polymorphic V-tach: Torsade de Pointes
P’ waves: may be present or absent, if present they have no set relationship to the QRS complex
P’RI: noneQRS: > 0.12 sec; gradual alteration in the
amplitude and direction of the QRSQRS Rate: 150-250 bpmQRS Rhythm: irregular or regular

Ventricular Fibrillation
P’ waves: not discernibleP’RI: not discernibleQRS: not discernibleQRS Rate: cannot be determinedQRS Rhythm: rapid and chaotic with no pattern of regularity

Ventricular Escape: Idioventricular Rhythm
P’ waves: absentP’RI: noneQRS: >0.12sQRS Rate: 20-40 bpmQRS Rhythm: regular

Idioventricular Rhythm: Agonal rhythm

Accelerated Idioventricular Rhythm
P’ waves: absentP’RI: noneQRS: >0.12sQRS Rate: 40-100 bpmQRS Rhythm: regular

Asystole
P’ waves: not discernibleP’RI: not discernibleQRS: not discernibleQRS Rate: cannot be determinedQRS Rhythm: not discernible

Pulseless Electrical Activity
• Absence of detectable pulse and the presence of some type of electrical activity

AXIS

Hexaxial System
Determination of Axis

Determination of Axis
Normal axis is from -30° to 110°

Determination of AxisLead I Lead AVF
Normal Axis + +Left axis deviation + -Right axis deviation - +Indeterminate Axis - -
• Axis
• If negative in I and positive in aVF (RAD)= 180 –

Differential Diagnoses…
• Left Axis Deviation:– Left ventricular
hypertrophy– Short, fat individuals– Inferior wall infarction– LBBB– Left anterior fascicular
block– Wolff Parkinson White
syndrome
• Right Axis Deviation:– Right ventricular
hypertrophy– Lateral wall infarction– Pulmonary embolism– Thin, tall individuals– Left posterior fascicular
block– Wolff Parkinson White
syndrome

Vector Analysis

Vector Analysis
• First find the isoelectric lead if there is one;– the lead with equal forces in the positive and negative
direction– often this is the lead with the smallest QRS.
• The QRS axis is perpendicular to that lead's
orientation.
• Since there are two perpendiculars to each isoelectric lead, chose the perpendicular that best fits the direction of the other ECG leads.

Vector Analysis
• If there is no isoelectric lead– Look for two leads that are nearly isoelectric, and these
are always 30o apart. – Find the perpendiculars for each lead – Choose an approximate QRS axis within the 30o range.
• Occasionally if each of the 6 frontal plane leads is small and/or isoelectric– The axis cannot be determined and is called
indeterminate. – This is a normal variant.

CHAMBER ENLARGEMENT


Right Atrial Enlargement (p pulmonale)
• Any of the following:– In lead V1: tall initial component of p wave which
is >/= 2 mm wide (0.08 sec) and >/= 2 mm tall– In any lead: P wave >/= 2.5 mm tall

• tall P waves in Lead II

Left Atrial Enlargement (p mitrale)
• Any of the following:– In lead V1: wide terminal component of p wave
which is >/= 1 mm wide (0.04 sec) and >/= 1 mm deep
– In any lead: P wave wider than 0.12 sec (>3 small squares) or
– with a >/= 1mm notched in the middle


Biatrial Enlargement
Features of both RAE and LAE in same ECG – P wave in lead II >2.5 mm tall and >0.12s in
duration– In V1, P wave diphasic with initial positive
component ≥ 2mm tall and terminal negative component ≥ 1mm depp and ≥0.04 sec duration

Criteria for LVHParameter Criteria
Sokolow-Lyon index • SV1 + (RV5 or RV6) > 3.5 mV• RaVL > 1.1 mV
Romhilt-Estes point score system (points)
• Any limb lead R wave or S wave ≥2.0 mV (3)• or SV1 or SV2 ≥ 3.0 mV (3)• or RV5 to RV6 ≥ 3.0 mV (3)• ST-T wave abnormality (no digitalis therapy) (3)• ST-T wave abnormality (digitalis therapy) (1)• Left atrial abnormality (3)• Left axis deviation ≤ -30 degrees (2)• QRS duration >90 msec (1)• Intrinsicoid deflection in V5 or V6 > 50 msec (1)
Cornell voltage criteria • SV3 + SaVL ≥ 2.8 mV (for men)• SV3 + SaVL ≥ 2.0 mV (for women)
Cornell voltage-duration measurement
• QRS duration × Cornell voltage >2436• QRS duration × sum of voltages in all leads >17,472

Left Ventricular Hypertrophy• Romhilt and Estes criteria
– Amplitude (any) – 3 points• Largest R/S in limb leads > 20mm• S wave in V1/V2 ≥ 30 mm• R wave in V5/V6 ≥ 30 mm
– ST-T segment changes typical of LV strain• Without digitalis – 3 points• With digitalis – 1 point
– LAE (terminal negativity of P in V1, depth ≥ 1 mm, duration ≥ 0.04 sec) – 3 points– LAD – 2 points– QRS duration ≥ 0.09 sec, < 0.12 sec – 2 points– Intrinsicoid deflection in V5 and V6 ≥ 0.05 sec – 1 point
• Interpretation:– Possible = 3 points– Probable = 4 points– Definite ≥ 5 points

Differentials for LVH
• Hypertension• Aortic stenosis• Aortic insufficiency• Cardiomyopathy• Initial compensating mechanism in obesity,
smoking, dyslipidemia, obstructive sleep apnea, DM

Criteria for RVHCriterion Sensitivity (%) Specificity (%)
R in V1 ≥ 0.7 mV <10 —
QR in V1 <10 —
R/S in V1 > 1 with R > 0.5 mV <25 89
R/S in V5 or V6 < 1 <10 —
S in V5 or V6 > 0.7 mV <17 93
R in V5 or V6 ≥ 0.4 mV with S in V1 ≥ 0.2 mV <10 —
Right axis deviation ≥ + 90 degrees <14 99
S1Q3 pattern <11 93
S1S2S3 pattern <10 —
P pulmonale <11 97

Right Ventricular Hypertrophy
• Right axis deviation (>/= 110 deg), with any of the following:– Lead V1: R wave > S wave– Deep S wave in leads V5 and V6: R/S ratio less
than 1 in leads V5 and V6– ST depression and T wave inversion in V1-V3

Right Ventricular Hypertrophy
• If QRS duration <0.12 sec, any of the ff:– Right axis deviation (>90 degrees) in presence of
disease capable of causing RVH– R in aVR > 5 mm, or– R in aVR > Q in aVR
• Any one of the following in lead V1: – R/S ratio > 1 and negative T wave– R > 6 mm, or S < 2mm, or rSR' with R' >10 mm

Differentials for RVH
• Normal in young adults and children• COPD• RBBB• True posterior infarction• WPW syndrome
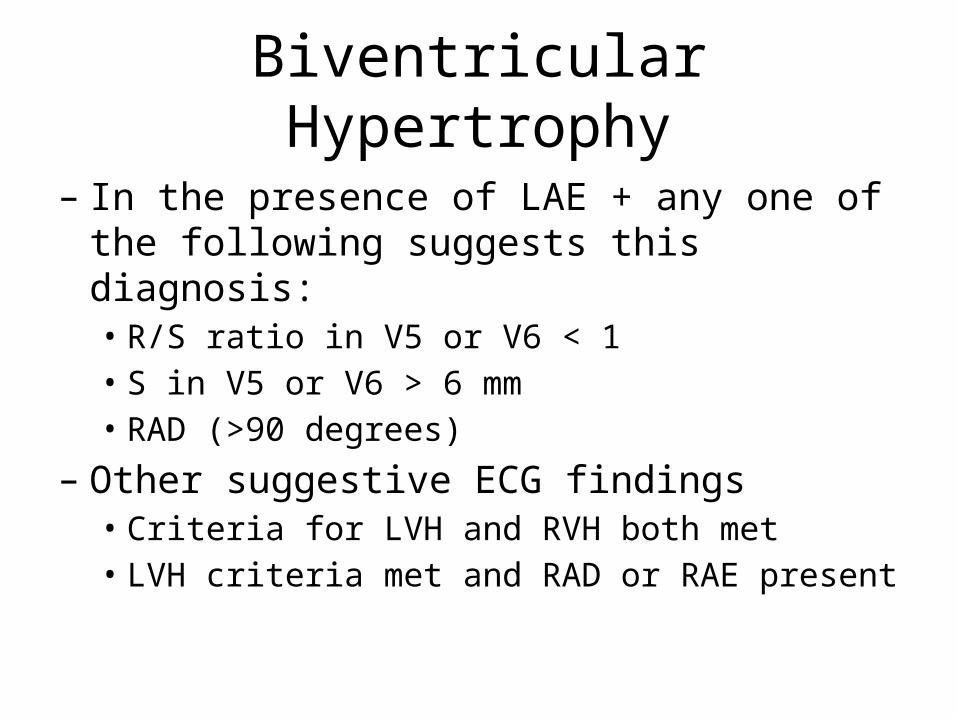
Biventricular Hypertrophy
– In the presence of LAE + any one of the following suggests this diagnosis: • R/S ratio in V5 or V6 < 1• S in V5 or V6 > 6 mm• RAD (>90 degrees)
– Other suggestive ECG findings• Criteria for LVH and RVH both met• LVH criteria met and RAD or RAE present

ISCHEMIA AND INFARCTION


Wall Involvement1. Transmural
– extends through the myocardial wall from endocardial to epicardial surfaces
2. Nontransmural– clinical evidence of myocardial damage without
consistent ECG changes
3. Endocardial/Epicardial – refers to the innermost and outermost surfaces of the
myocardium

Wall InvolvementLeads Wall
II, III, avF: Inferior wallI and avL: High lateral wall
V1, V2: Septal wallV3, V4: Anterior wallV5, V6: Lateral wall
Mirror image of V1, V2: Posterior wallV3R and V4R: RV wall

Wall Involvement

Criteria for Ischemia
1. At least 1 mm ST-segment depression2. Symmetrically or deeply inverted T waves3. Abnormally tall T waves4. Normalization of abnormal T waves5. Prolongation of the QT interval6. Others: Arrhythmias, BBB, AV blocks, or
electrical alternans

• ST depression in v4-V6
• Note: upsloping ST depression is not an ischemic abnormality

Differential Diagnosis ST Depression
• Digitalis effect• Hypokalemia• LVH with strain (V5-V6)• RVH with strain (V1-V2)• NSTEMI• Mitral valve prolapse (some cases) • CNS disease • Secondary ST segment changes with IV conduction
abnormalities (e.g., RBBB, LBBB, WPW, etc)
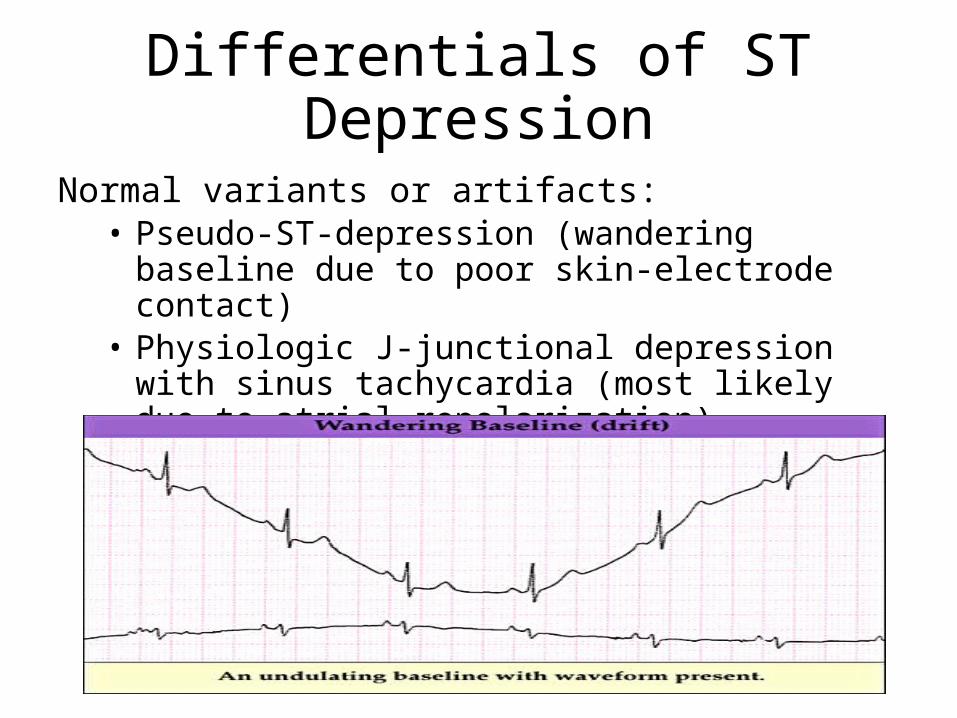
Differentials of ST Depression
Normal variants or artifacts: • Pseudo-ST-depression (wandering baseline due to poor
skin-electrode contact) • Physiologic J-junctional depression with sinus
tachycardia (most likely due to atrial repolarization)• Hyperventilation-induced ST segment depression

Criteria for Infarction
ST elevation: – ≥2mm in ≥ 2 contiguous chest leads– ≥1mm in ≥ 2 contiguous limb leads
Significant Q waves: ¼ of QRS complex or ≥ 0.04 sec (1 sm )– Not significant if…
in AVR in lead III or V1 alone in V1-V3 if associated with LBBB
– Pathologic if… > 0.04 seconds duration > 25% of the R wave amplitude

Significant Q Wave

Ischemia and InfarctionIn presence of bundle branch blocks
• RBBB: – usual MI criteria
• LBBB: – diminishing R wave forces in chest leads (reverse R wave
progression), or– Q waves at V5, V6, I, aVL (any 2)– Notching of the downstroke/upstroke of the S wave in precordial
leads before QRS changes from a predominate S wave complex to a predominate R wave complex
– rSR' complex in leads I, V5 or V6 – RS complex in V5-6 rather than the usual monophasic R waves
seen in uncomplicated LBBB– "Primary" ST-T wave changes (i.e., ST-T changes in the same
direction as the QRS complex rather than the usual "secondary" ST-T changes seen in uncomplicated LBBB

Timing of Myocardial InfarctionQ
WaveST
ElevationT wave Approx.
Timing of MI
Hyperacute (-) (-/+) Peaked 0 – 6 hrs
Acute (-/+) (++) (-/+) 6 – 24 hrs
Recent (++) (++) Inverted 24 – 72 hrs
Undetermined age
(++) (-) Inverted 72 hrs – 6 wks
Old (++) (-) Upright > 6 wks
A. Normal ECG prior to MI
B. Hyperacute T wave changes - increased T wave amplitude and width; may also see ST elevation
C. Acute (evolving): Marked ST elevation with hyperacute T wave changes (transmural injury)
D. Recent (resolving): Pathologic Q waves, less ST elevation, terminal T wave inversion (necrosis)
E. Undetermined (healing): Pathologic Q
waves, T wave inversion (necrosis and fibrosis)
F. Old: Pathologic Q waves, upright T waves (fibrosis)

Differential of ST Elevation
• Acute myocardial infarction• Acute pericarditis• Early repolarization changes• Ventricular aneurysm• Severe LV wall hypokinesia • Variant (Prinzmetal) angina

Differentials for ST Elevation
Ischemic Heart Disease– usually convex upwards, or straightened– Acute transmural injury – Persistent ST elevation after acute MI suggests
ventricular aneurysm– ST elevation may also be seen as a manifestation
of Prinzmetal's angina– ST elevation during exercise testing suggests
extremely tight coronary artery stenosis or spasm (transmural ischemia)

Differentials for ST Elevation
Acute Pericarditis– Concave upwards ST elevation in most leads
except aVR– No reciprocal ST segment depression (except in
aVR)– Unlike "early repolarization", T waves are usually
low amplitude, and heart rate is usually increased.– May see PR segment depression, a manifestation
of atrial injury

Differentials for ST Elevation
Normal Variant "Early Repolarization" – usually concave upwards, ending with
symmetrical, large, upright T waves– high take off of the ST segment in leads V4-6; – ST elevation in V2-3 is generally seen in most
normal ECG’s– ST elevation in V2-6 is concave upwards

Differentials for ST Elevation
Other Causes – LVH (in right precordial leads with large S-waves)– LBBB (in right precordial leads with large S-waves) – Advanced hyperkalemia – Hypothermia (prominent J-waves or Osborne
waves)

Pseudoinfarcts
– WPW preexcitation (negative delta wave may mimic pathologic Q waves)
– IHSS (septal hypertrophy may make normal septal Q waves "fatter" thereby mimicking pathologic Q waves)
– LVH (may have QS pattern or poor R wave progression in leads V1-3)
– RVH (tall R waves in V1 or V2 may mimic true posterior MI)
– Complete or incomplete LBBB (QS waves or poor R wave progression in leads V1-3)

Pseudoinfarcts
– Pneumothorax (loss of right precordial R waves)– Pulmonary emphysema and cor pulmonale (loss of
R waves V1-3 and/or inferior Q waves with right axis deviation)
– Left anterior fascicular block (may see small q-waves in anterior chest leads)
– Acute pericarditis (the ST segment elevation may mimic acute transmural injury)
– CNS disease (may mimic non-Q wave MI by causing diffuse ST-T wave changes)

Waveform Analysis
• The specificity of ST-T and U wave abnormalities is provided more by the clinical circumstances in which the ECG changes are found than by the particular changes themselves.
• Thus the term, nonspecific ST-T wave abnormalities, is frequently used when the clinical data are not available to correlate with the ECG findings.
• This does not mean that the ECG changes are unimportant!

Waveform Analysis
• Factors affecting the ST-T and U wave configuration – "Primary" ST-T Wave Abnormalities
• independent of changes in ventricular activation and that may be the result of global or segmental pathologic processes that affect ventricular repolarization
• Drug effects (e.g., digoxin, quinidine, etc)• Electrolyte abnormalities (e.g., hypokalemia)• Ischemia, infarction, inflammation, etc• Neurogenic effects (e.g., subarrachnoid hemorrhage
causing long QT)

Waveform Analysis
– "Secondary" ST-T Wave changes • are normal ST-T wave changes solely due to
alterations in the sequence of ventricular activation• ST-T changes seen in bundle branch blocks
– (ST-T polarity is opposite to the major or terminal deflection of the QRS)
• ST-T changes seen in fascicular block• ST-T changes seen in nonspecific IVCD• ST-T changes seen in WPW preexcitation• ST-T changes in PVCs, ventricular arrhythmias, and
ventricular paced beats

Inferior MI
• Pathologic Q waves and evolving ST-T changes in leads II, III, aVF
• Q waves usually largest in lead III, next largest in lead aVF, and smallest in lead II
Example #1: frontal plane leads with fully evolved inferior MI (note Q-waves, residual ST elevation, and T inversion in II, III, aVF)


• Example #2: Old inferior MI (note largest Q in lead III, next largest in aVF, and smallest in lead II)

True Posterior MIECG changes:• anterior precordial leads V1-3, but are the mirror image of an
anteroseptal MI: • Increased R wave amplitude and duration (i.e., a "pathologic R
wave" is a mirror image of a pathologic Q) • R/S ratio in V1 or V2 >1 (i.e., prominent anterior forces)• Hyperacute ST-T wave changes: i.e., ST depression and large,
inverted T waves in V1-3• Late normalization of ST-T with symmetrical upright T waves in
V1-3 • Often seen with inferior MI (i.e., "inferoposterior MI")

Example #1: Acute inferoposterior MI (note tall R waves V1-3, marked ST depression V1-3, ST elevation in II, III, aVF)

Example #2: Old inferoposterior MI (note tall R in V1-3,
upright T waves and inferior Q waves)

Example #3: Old posterolateral MI (precordial leads): note tall R
waves and upright T's in V1-3, and loss of R in V6

Right Ventricular MI
• Right Ventricular MI (only seen with proximal right coronary occlusion; i.e., with inferior family MI's)
• ECG findings usually require additional leads on right chest (V1R to V6R, analogous to the left chest leads)
• ST elevation, >1mm, in right chest leads, especially V4R


Anteroseptal MI
• Q, QS, or qrS complexes in leads V1-V3 (V4)
• Evolving ST-T changes
Example: Fully evolved anteroseptal MI (note QS waves in V1-2, qrS complex in V3, plus ST-T wave changes)


Anterior MI
• (similar changes, but usually V1 is spared; if V4-6 involved call it anterolateral")
• Example: Acute anterior or anterolateral MI (note Q's V2-6 plus hyperacute ST-T changes)


High Lateral MI
• typical MI features seen in leads I and/or aVL

• (Note also the slight U-wave inversion in leads II, III, aVF, V4-6, a strong marker for coronary disease)
• Example: note Q-wave, slight ST elevation, and T inversion in lead aVL

MI with Bundle Branch Block
• MI + Right Bundle Branch Block • Usually easy to recognize because Q waves
and ST-T changes are not altered by the RBBB

• Example #1: Inferior MI + RBBB (note Q's in II, III, aVF and rSR' in lead V1)

• Example #2: Anteroseptal MI with RBBB (note Q's in leads V1-V3, terminal R wave in V1, fat S wave in V6)

MI + Left Bundle Branch Block
• Often a difficult ECG diagnosis because in LBBB the right ventricle is activated first and left ventricular infarct Q waves may not appear at the beginning of the QRS complex (unless the septum is involved).

• Suggested ECG features, not all of which are specific for MI include: Q waves of any size in two or more of leads I, aVL, V5, or V6 (probably indicates septal infarction, because the septum is activated early from the right ventricular side in LBBB)


• Reversal of the usual R wave progression in precordial leads
• Notching of the downstroke of the S wave in precordial leads to the right of the transition zone (i.e., before QRS changes from a predominate S wave complex to a predominate R wave complex); this may be a Q-wave equivalent.

• Notching of the upstroke of the S wave in precordial leads to the right of the transition zone (another Q-wave equivalent).
• rSR' complex in leads I, V5 or V6 (the S is a Q-wave equivalent occurring in the middle of the QRS complex)

• RS complex in V5-6 rather than the usual monophasic R waves seen in uncomplicated LBBB; (the S is a Q-wave equivalent).
• "Primary" ST-T wave changes (i.e., ST-T changes in the same direction as the QRS complex rather than the usual "secondary" ST-T changes seen in uncomplicated LBBB); these changes may reflect an acute, evolving MI.

MISCELLANEOUS

T Wave
• most labile wave in the ECG• changes may be the result of many cardiac
and non-cardiac conditions• normal T wave is usually in the same direction
as the QRS except in the right precordial leads• normal T wave is asymmetric with the first half
moving more slowly than the second half

T Wave
• normal T wave is always upright in leads I, II, V3-6, and always inverted in lead aVR.
• other leads are variable depending on the direction of the QRS and the age of the patient.

Differentials for T Wave Inversion
– Q wave and non-Q wave MI– Myocardial ischemia– Subacute or old pericarditis – Myocarditis – Myocardial contusion (from trauma) – CNS disease causing long QT interval (especially SAH)– Idiopathic apical hypertrophy (a rare form of hypertrophic
cardiomyopathy)– Mitral valve prolapse– Digoxin effect– RVH and LVH with "strain" pattern

U Wave• origin is still in question• most authorities correlate the U wave with
electrophysiologic events called "afterdepolarizations" in the ventricles. – afterdepolarizations can be the source of arrhythmias caused by
"triggered automaticity" including torsade de pointes. • has the same polarity as the T wave • is usually less than one-third the amplitude of the T wave• usually best seen in the right precordial leads especially
V2 and V3• normal U wave is asymmetric with the ascending limb
moving more rapidly than the descending limb (just the opposite of the normal T wave).

Differentials for Upright U Waves
– Sinus bradycardia accentuates the U wave– Hypokalemia (remember the triad of ST segment
depression, low amplitude T waves, and prominent U waves)
– Quinidine and other type 1A antiarrhythmics– CNS disease with long QT intervals (often the T and
U fuse to form a giant "T-U fusion wave")– LVH– Mitral valve prolapse– Hyperthyroidism

Differentials for Negative U Waves
• Ischemic heart disease (often indicating left main or LAD disease)
• Myocardial infarction (in leads with pathologic Q waves)• During episode of acute ischemia (angina or exercise-
induced ischemia)• Post extrasystolic in patients with coronary heart disease• During coronary artery spasm (Prinzmetal's angina)• Nonischemic causes Some cases of LVH or RVH (usually
in leads with prominent R waves)• Some patients with LQTS

Hypokalemia
• ECG may be normal • Prominent U waves
– (as tall or taller than the T wave at leads II and V3)• Flattened or inverted T waves• ST depression• Fusion of T and U waves• Prolonged QRS

Hyperkalemia
• Hyperkalemia:– In chest leads, T waves > 10 mm in most leads– In limb leads, T waves > 5 mm in most leads

Differentials for Peaked T Waves
• Myocardial ischemia• Hyperacute myocardial infarction• Hyperkalemia• Normal variant in young athletes

Hypocalcemia
• Prolonged QT interval (longer than half of the RR interval by eyeballing)
• If tachycardic or bradycardic, get the QTc using Basset’s formula

Hypercalcemia
• Shortened QT interval

Digitalis Effect
• Prolonged PR interval• Scooping of the ST segment• Short QT interval

QRS Electrical Alternans
• Height of QRS varies from beat to beat• Differentials:
– Cardiac tamponade– Large pericardial effusion– Low cardiac output– COPD– Tension pneumothorax

Poor R Wave Progression
• Height of the R wave in V1-V3 is <3 mm• Exceptions:
– LVH– LBBB– WPW– Anteroseptal wall MI– Low Voltage Complexes
• Differentials: – Normal variant– Old anteroseptal wall MI; LVH; LBBB

Low Voltage QRS Complexes
• The amplitude of the entire QRS complex in – < 5 mm in Limb leads– <10mm in Chest leads
• Differentials: – Normal elderly patients– Obese or edematous patient– Cardiac tamponade– Large pericardial effusion– Pneumothorax– Hypothyroidism– Dilated cardiomyopathy

Artifacts
• ARTIFACTS– EKG deflections caused by influences other than the heart’s
electrical activity
• CAUSES:– electrical interference – muscle tremors– metal objects – loose electrodes– ground hum – varies with respiration

Artifacts