ece 194c target classification in sensor networks ... w x x x x x minimize y b g x y k b y b i t i...
TRANSCRIPT
1
ECE 194C Target Classification in Sensor
Networks
www.ece.ucsb.edu/Faculty/Iltis/ece194c
• Problem
– Given signature of a target, e.g. seismic, acoustic,
video.
– Determine which category the signature belongs to
• Fundamental problem in pattern recognition.
– Design classifiers to use temporal, FFT,
autoregressive model parameters to minimize error
rate.

2
Seismic Target SignaturesRef: Li, Wong, Hu and Sayeed “Detection, Classification and Tracking of Targets,” IEEE
Signal Proc. Mag. 2002.
Seismometer
)(nx
FFT
∑−
=
−1
0
/2)(N
n
Nnkienx
π
2||Power spectral
density (PSD)

3
Video Sensing – Pedestrian Avoidance
Ref. D. Gavrila, “Sensor-based pedestrian protection, IEEE Intelligent Syst. 2001
Daimler-Chrysler
Chamfer System
Problem is to detect
pedestrians in
cluttered imagery.
Classify pedestrian vs.
tree vs. building vs.
car.
4
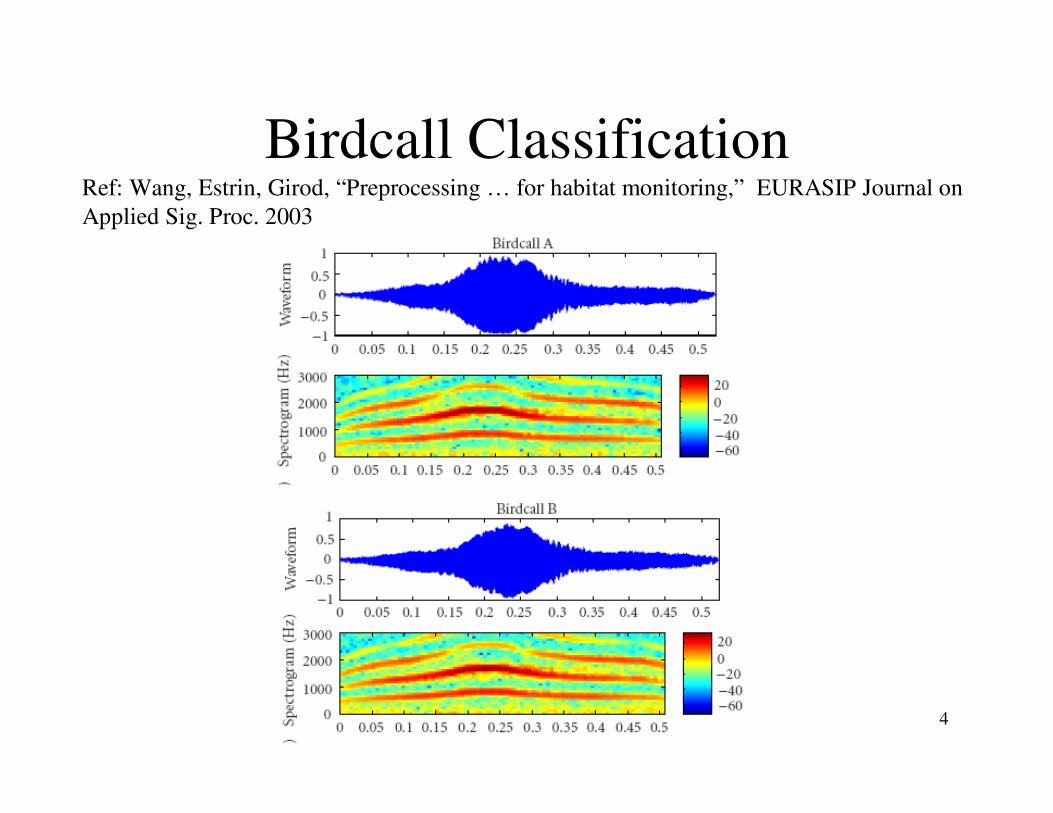
Birdcall ClassificationRef: Wang, Estrin, Girod, “Preprocessing … for habitat monitoring,” EURASIP Journal on
Applied Sig. Proc. 2003

5
Bayes Classifier
Optimal classifier to minimize probability of classification error.
)|(max
argˆ xi
i
i P ωω
ω =
∑−
=
−=
−
=1
0
/2
2
2
2
)()(,
|)1(|
|)1(|
|)0(|
N
n
NknienxkX
NX
X
X
πx
Feature vector example -- PSD
x Classifier iω̂
6
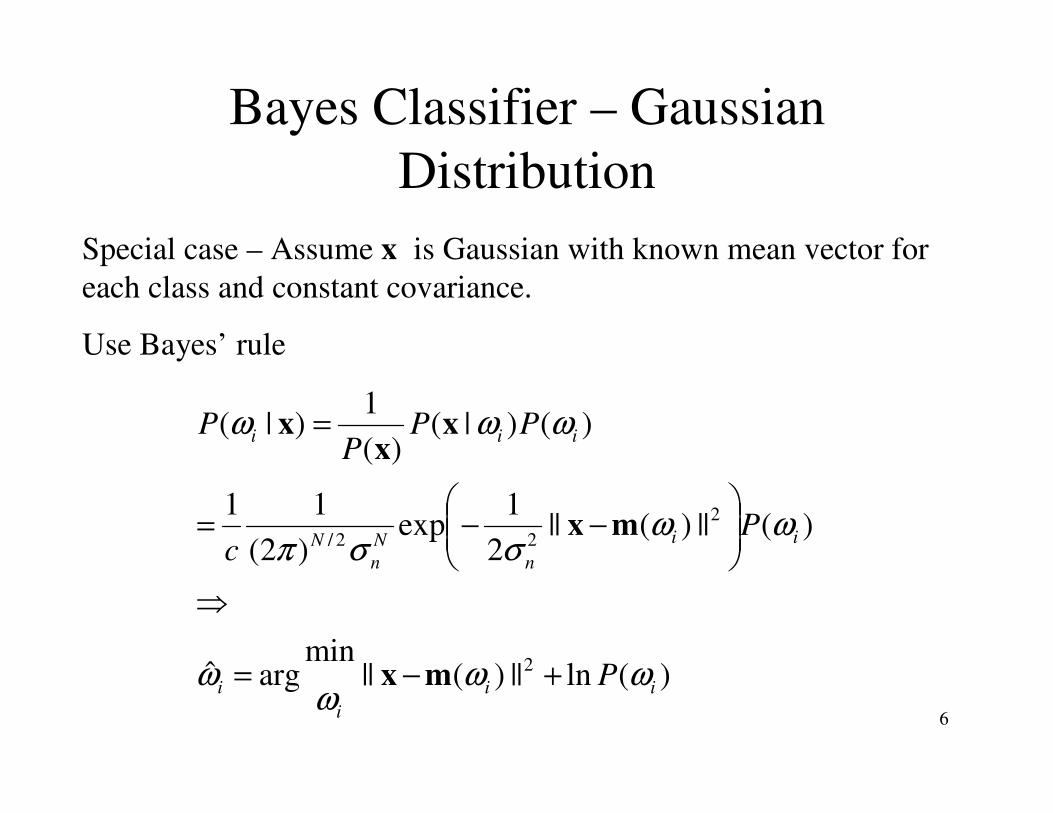
Bayes Classifier – Gaussian
Distribution
Special case – Assume x is Gaussian with known mean vector for
each class and constant covariance.
Use Bayes’ rule
)(ln||)(||min
argˆ
)(||)(||2
1exp
)2(
11
)()|()(
1)|(
2
2
22/
ii
i
i
ii
n
N
n
N
iii
P
Pc
PPP
P
ωωω
ω
ωωσσπ
ωωω
+−=
⇒
−−=
=
mx
mx
xx
x

7
Bayes Classifier – Known Gaussian
Distribution – Equal Priors
Matlab voronoi(x,y) plots Voronoi regions. Region i is the set of points closer to
(xi,yi) then any other point. Points (xi,yi) are means of x in each category for the
Gaussian case.
1m
2m
NmClassify as
ω1 for all x in
this region.
1ω
2ω
Nω

8
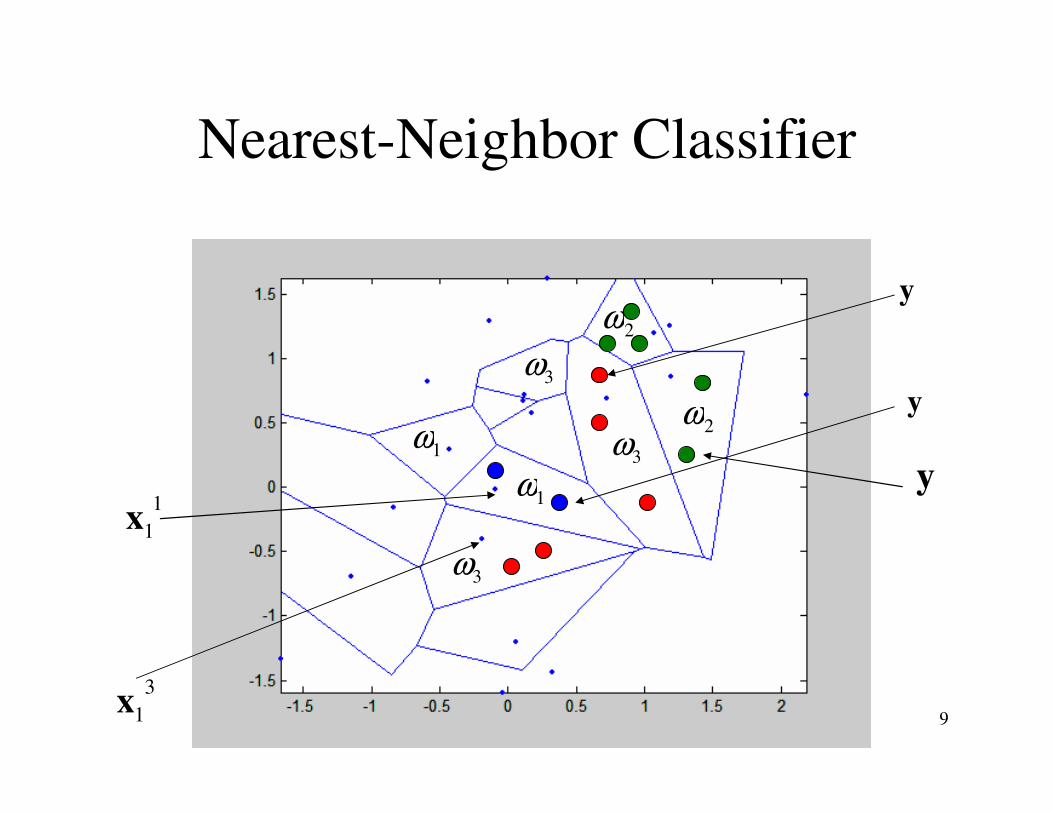
Nearest-Neighbor Classifier
Assume Ni prototype vectors x are available with known classification (e.g.
seismic FFTs of known vehicles.)
1ω 2ω 3ω
1
2
1
1
1
1Nx
x
x
1
2
2
1
1
2Nx
x
x
3
3
2
3
1
3Nx
x
x
For each test vector y, find prototype x that is closest and classify as
associated iω
||||,
minargˆ
i
n
i
in
xy −=ω
ω
9
Nearest-Neighbor Classifier
1ω
1ω
2ω
2ω
3ω
3ω
3ω
y
y
y
1
1x
3
1x

10
Gaussian Classifier/K-Means
Algorithm
Assume prototypes and test vectors come from the same mixture Gaussian
density.
)(||||2
1exp
)2(
11
)()|()|(
1
2
,22/ i
M
k
ik
nn
N
iii
pc
ppp
i
ωσσπ
ωωω
∑=
−−
=
mx
xx
)...(#
)(#)(ˆ
21 N
i
ipxxx
x
∪∪=ω
Simplest estimate of prior probability of class i is relative frequency of prototypes
in class i.
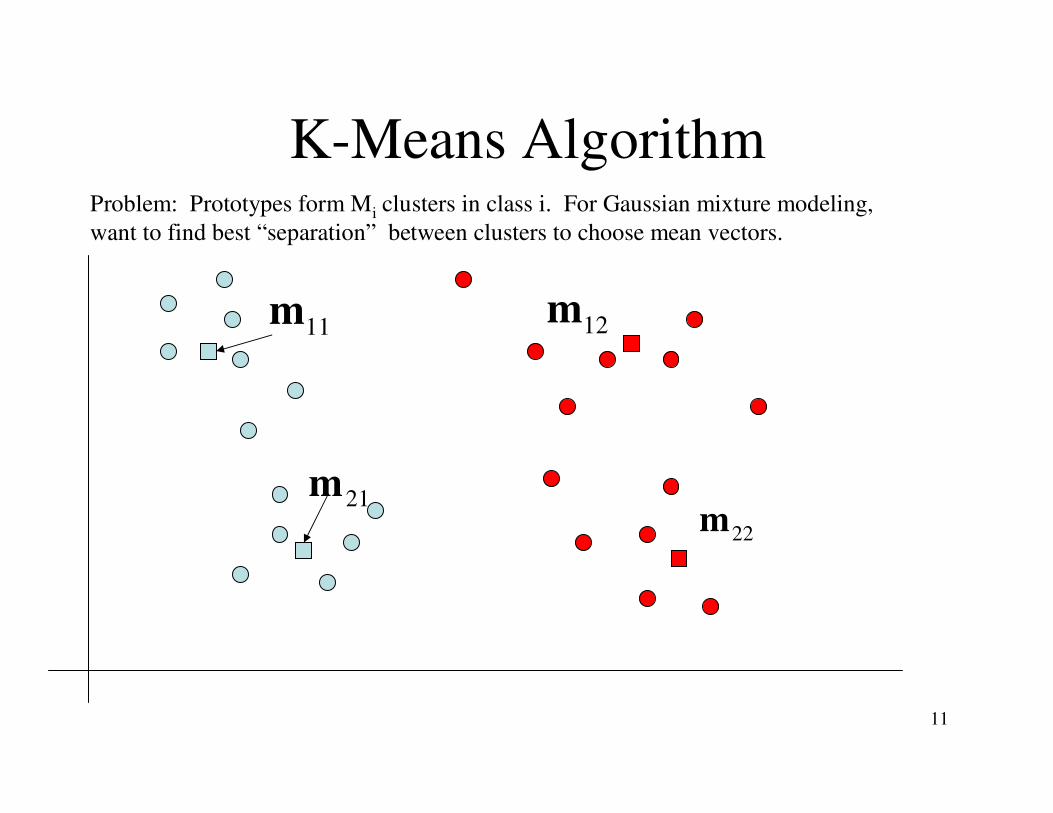
11
K-Means AlgorithmProblem: Prototypes form Mi clusters in class i. For Gaussian mixture modeling,
want to find best “separation” between clusters to choose mean vectors.
11m
21m
12m
22m

12
K-Means Algorithm within a Class
Step 1: Place k points randomly into space represented by class i. These are
the initial centroids
11m
21m
Step 2: Assign each xi to group whose centroid is
closest.
11m
21m
Step 3: Recompute centroids
11m
21m
13
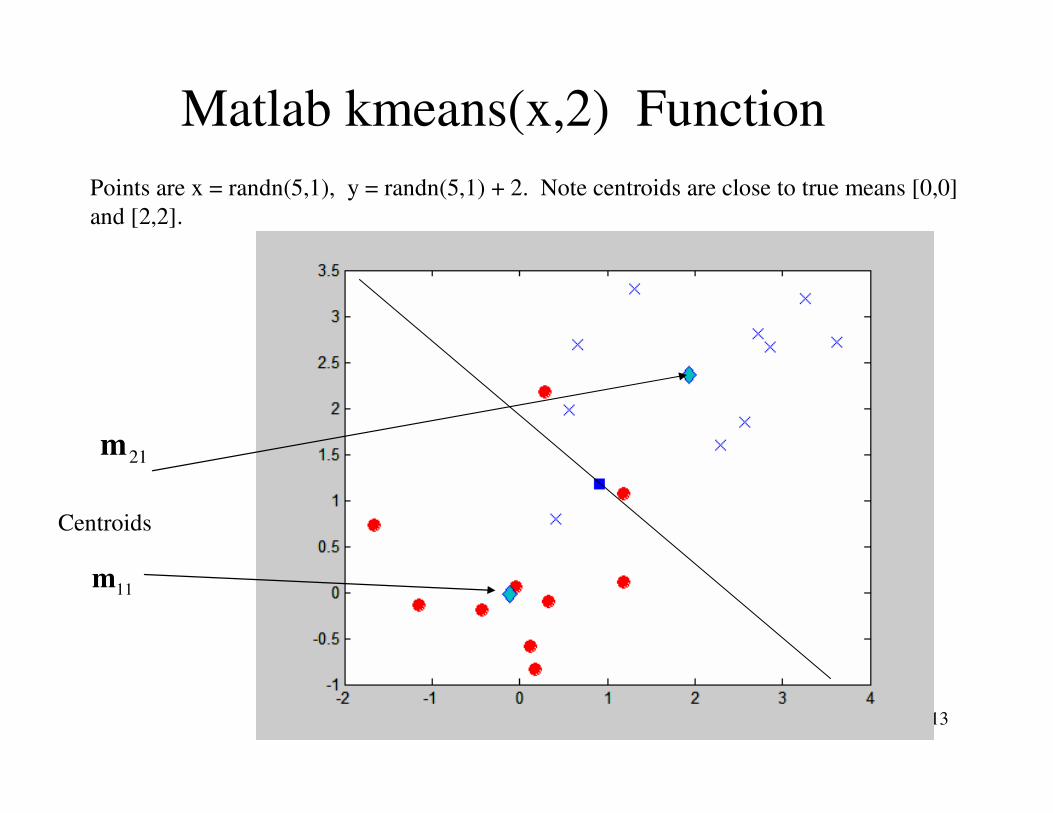
Matlab kmeans(x,2) Function
Centroids
Points are x = randn(5,1), y = randn(5,1) + 2. Note centroids are close to true means [0,0]
and [2,2].
11m
21m

14
Gaussian Mixture ClassifierStep 1: Run k-means algorithm on prototypes x.
Step 2: Set Gaussian mean vectors to centroids.
Step 3: (Compute covariance matrix of prototypes corresponding to each centroid.)
ijallforp
p
if
j
M
k
jk
nn
N
i
M
k
ik
nn
N
i
i
i
≠
−−
>
−−
→
∑
∑
=
=
)(||||2
1exp
)2(
1
)(||||2
1exp
)2(
1
1
2
,22/
1
2
,22/
ωσσπ
ωσσπ
ω
mx
mx
y

15
Neural Network Interpretation of Gaussian
Mixture Classifier
x
2
1||||
imx −
exp()
Σ
2
2||||
imx −
exp()
2
1||||
jmx −
exp()
2
2||||
jmx −
exp()
Σ<
>iω̂

16
Examples of Gaussian Mixture Classification – 2
Dimensional Feature Vector
0 5 10 15 20 25 30 35 40 45 500
5
10
15
20
25
30
35
40
45
50
0 5 10 15 20 25 30 35 40 45 500
5
10
15
20
25
30
35
40
45
50
i1m i2m

17
Seismic Classification Results
Ref: Li, Wong, Hu and Sayeed “Detection, Classification and Tracking of Targets,” IEEE
Signal Proc. Mag. 2002.
18
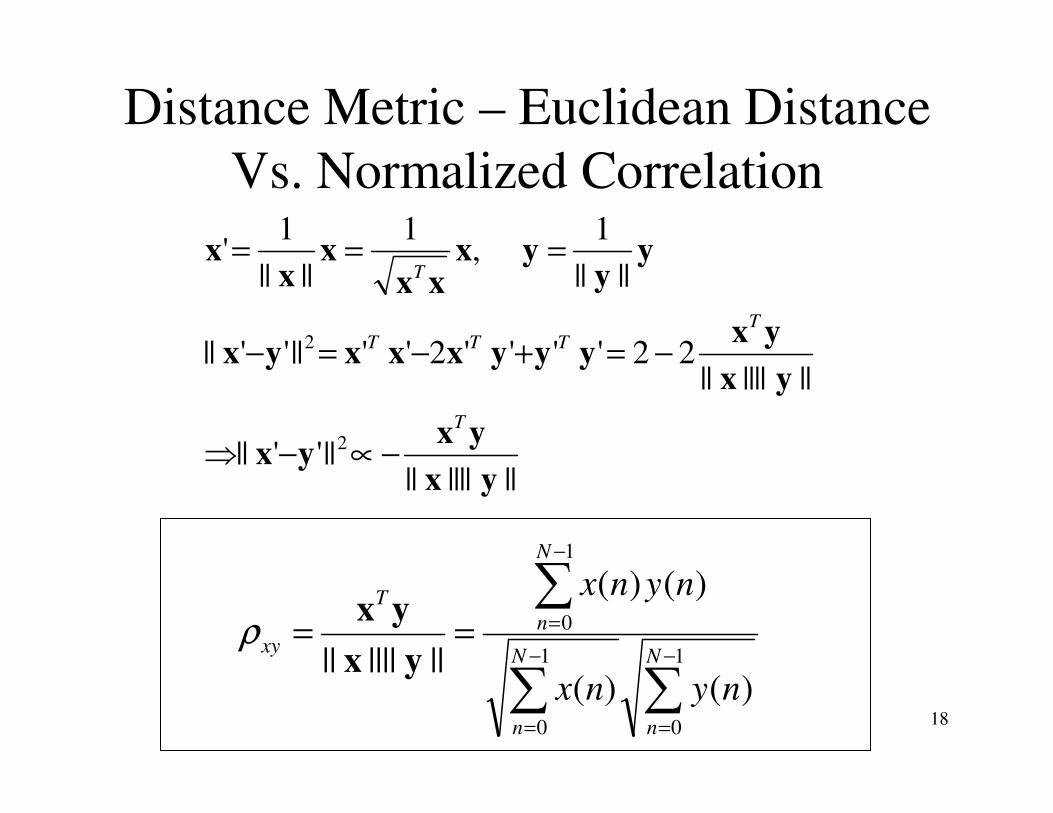
Distance Metric – Euclidean Distance
Vs. Normalized Correlation
||||||||||''||
||||||||22''''2''||''||
||||
1,
1
||||
1'
2
2
yx
yxyx
yx
yxyyyxxxyx
yy
yxxx
xx
x
T
TTTT
T
−∝−⇒
−=+−=−
===
∑∑
∑−
=
−
=
−
===1
0
1
0
1
0
)()(
)()(
|||||||| N
n
N
n
N
n
T
xy
nynx
nynx
yx
yxρ

19
Cross-Correlation Classification
Bird call examples Loon 2 Loon 4
Loon 2 using specgram(loon2a,256,fs2) Loon 4

20
Autocorrelation Loon 2
),(),(
),(
1),(
1
0
1
01
0
1
0
2
jminxmnx
mnx
jiN
n
N
mN
n
N
m
xx −−= ∑∑∑∑
−
=
−
=−
=
−
=
ρ
1max =ρ

21
Cross-Correlation – Loons 2 and 4Use Matlab xcorr2 function on spectrogram image. Normalized cross-correlation
coefficient.
),(),(
),(),(
1),(
1
0
1
01
0
1
0
21
0
1
0
2
jminymnx
mnymnx
jiN
n
N
mN
n
N
m
N
n
N
m
xy −−= ∑∑∑∑∑∑
−
=
−
=−
=
−
=
−
=
−
=
ρ
5671.max =ρB1 = specgram(loon,256,fs)
B1 = abs(B1)
xcorr2(B1,B2)/(norm(B1,’fro’)*…
norm(B2,’fro’))
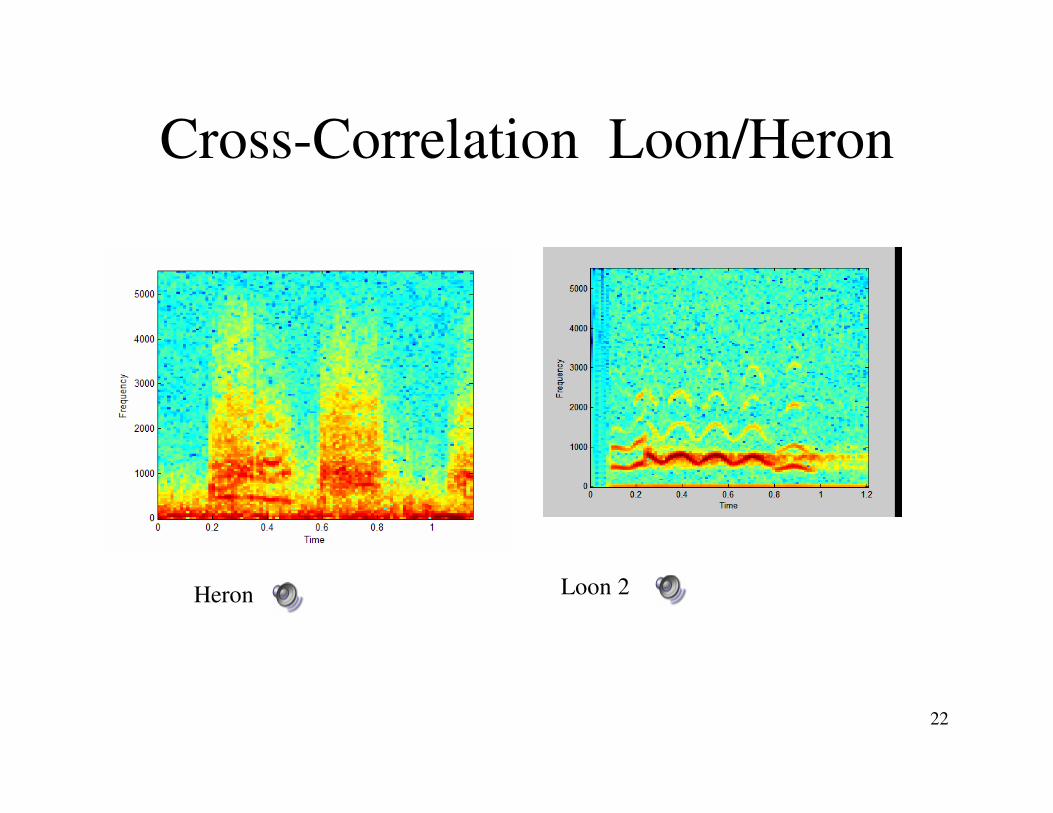
22
Cross-Correlation Loon/Heron
Heron Loon 2

23
Cross-Correlation Loon/Heron
4191.max =ρ

24
Support Vector Machine for SAR
ClassificationRef: Q. Zhao and J. Principe “Support vector machines for SAR automatic
target recognition,” IEEE Trans. AES 2001
SAR imaging
(www.sandia.gov/radar)

25
SAR Imaging/Pose Ref: Q. Zhao and J. Principe “Support vector machines for SAR automatic target
recognition,” IEEE Trans. AES 2001
Problem: Classify type of
object (T72 Tank) with
orientation uncertainty.
T72
BTR70
BMP2
26
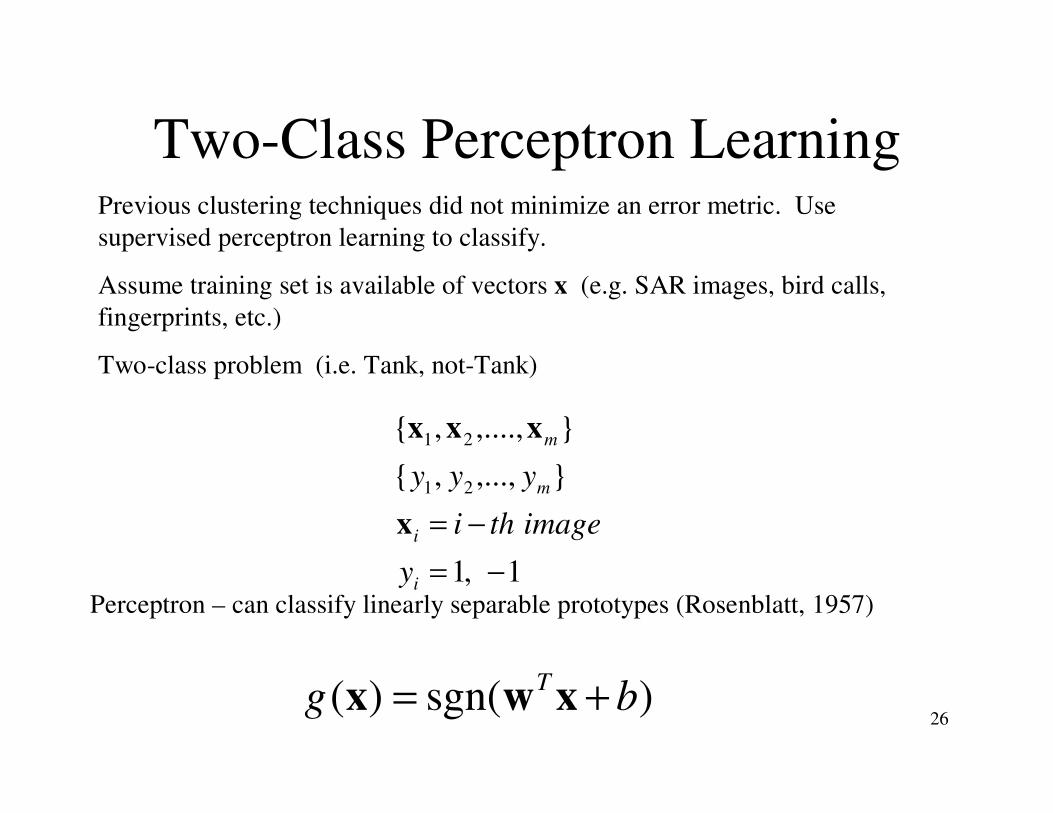
Two-Class Perceptron LearningPrevious clustering techniques did not minimize an error metric. Use
supervised perceptron learning to classify.
Assume training set is available of vectors x (e.g. SAR images, bird calls,
fingerprints, etc.)
Two-class problem (i.e. Tank, not-Tank)
1,1
},...,,{
},....,,{
21
21
−=
−=
i
i
m
m
y
imagethi
yyy
x
xxx
Perceptron – can classify linearly separable prototypes (Rosenblatt, 1957)
)sgn()( bgT += xwx
27
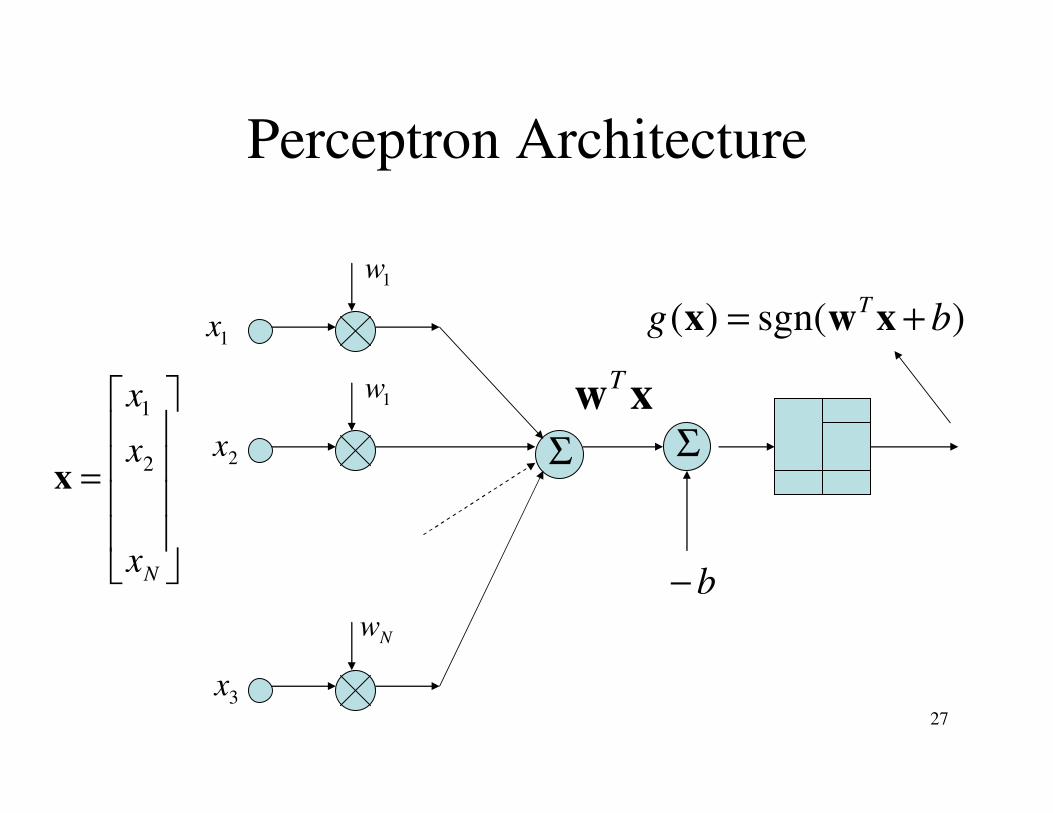
Perceptron Architecture
=
Nx
x
x
2
1
xΣ
b−
1w
1w
Nw
1x
2x
3x
Σ
xwT
)sgn()( bgT += xwx

28
Perceptron Criteria
w
bxw −=T
1)sgn( =+ bxwT
0)sgn( =+ bxwT
∑∈
+=xi E
i
TJ
Minimize
x
bxww ||)(

29
Perceptron Learning Rule
Define error due to new input. (Note b is like a weight with unity input.)
∈>+−
∈<+
+
=
+−=
0
1
,1,1
,1,1
,0
)sgn()(
Rb
Rb
classifiedcorrectlyb
btne
T
T
T
T
x
xxw
xxw
xw
xw
)))()1(sgn(()()1(
)1()))()1(sgn(()()1(
nbntnbnb
nnbntnn
T
x
T
x
++−+=+
+++−+=+
xw
xxwww

30
Perceptron Learning
)(nw
)()( nbnT −=xw
x is in R0, but tx = 1. e(n) = +1
1)()1( +=+ nbnb
)1()1( +−=+ nbnT xw
1R
1R
0R

31
Matlab Perceptron Demo (NN Toolbox)
Neural Network DESIGN Decision Boundaries
Move the perceptron
decision boundary by
dragging its handles.
Try to divide the
circles so that none
of their edges are red.
The weights and bias
will take on values
associated with the
chosen boundary.
Drag the white and
black dots to define
different problems.
Chapter 4W= 1.55 1.27 b= -2.22
-3 -2 -1 0 1 2 3
-3
-2
-1
0
1
2
3
W
32
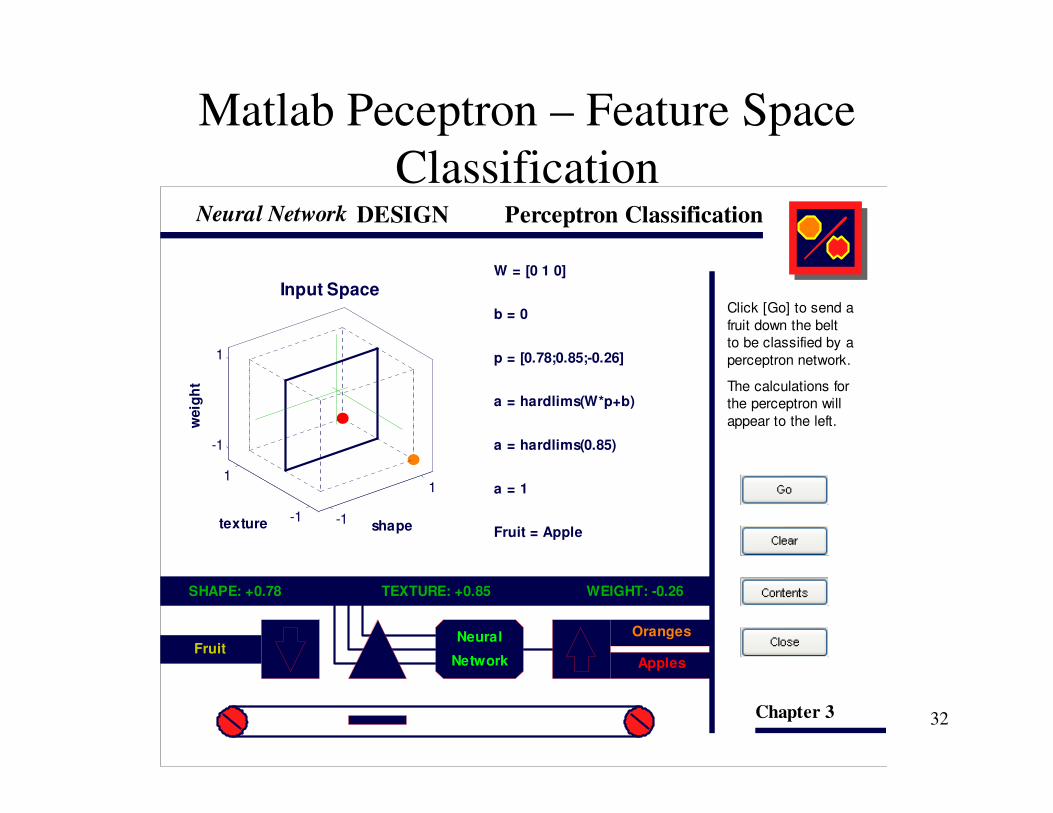
Matlab Peceptron – Feature Space
Classification
-1
1
-1
1
-1
1
shape
Input Space
texture
weig
ht
Neural Network DESIGN Perceptron Classification
Click [Go] to send a
fruit down the belt
to be classified by a
perceptron network.
The calculations for
the perceptron will
appear to the left.
Chapter 3
Fruit
SHAPE: +0.78 TEXTURE: +0.85 WEIGHT: -0.26
Neural
Network
Oranges
Apples
W = [0 1 0]
b = 0
p = [0.78;0.85;-0.26]
a = hardlims(W*p+b)
a = hardlims(0.85)
a = 1
Fruit = Apple

33
Neural Network – Mean-Square Error
Minimization
))(exp(1
1),(
)),(()(1
2
bg
gyJ
T
m
i
ii
−−+=
−=∑=
xwxw
xww
-5 -4 -3 -2 -1 0 1 2 3 4 50
0.1
0.2
0.3
0.4
0.5
0.6
0.7
0.8
0.9
1
x
y
y=1/(1+exp(-x))
Class 1
Class -1
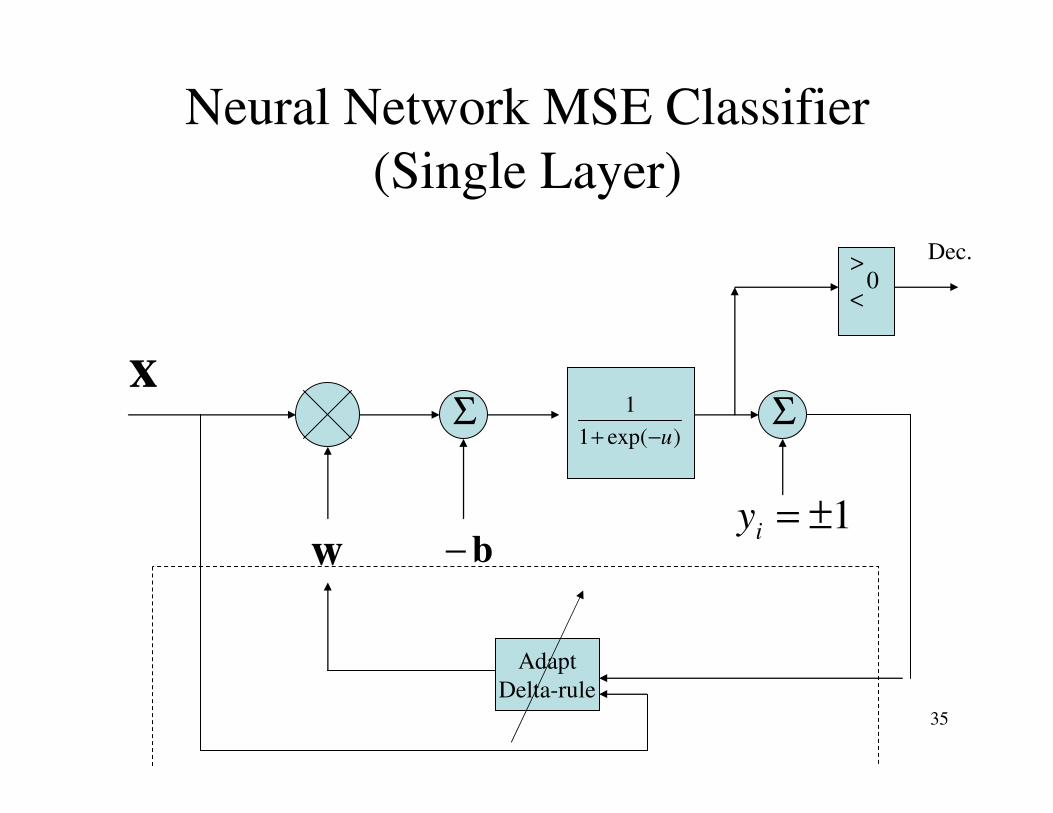
Problem: The NN should learn based on prototypes xi. Learning
means selecting the w and b vectors to minimize J(w) based on
adaptation to prototypes and desired responses.
34
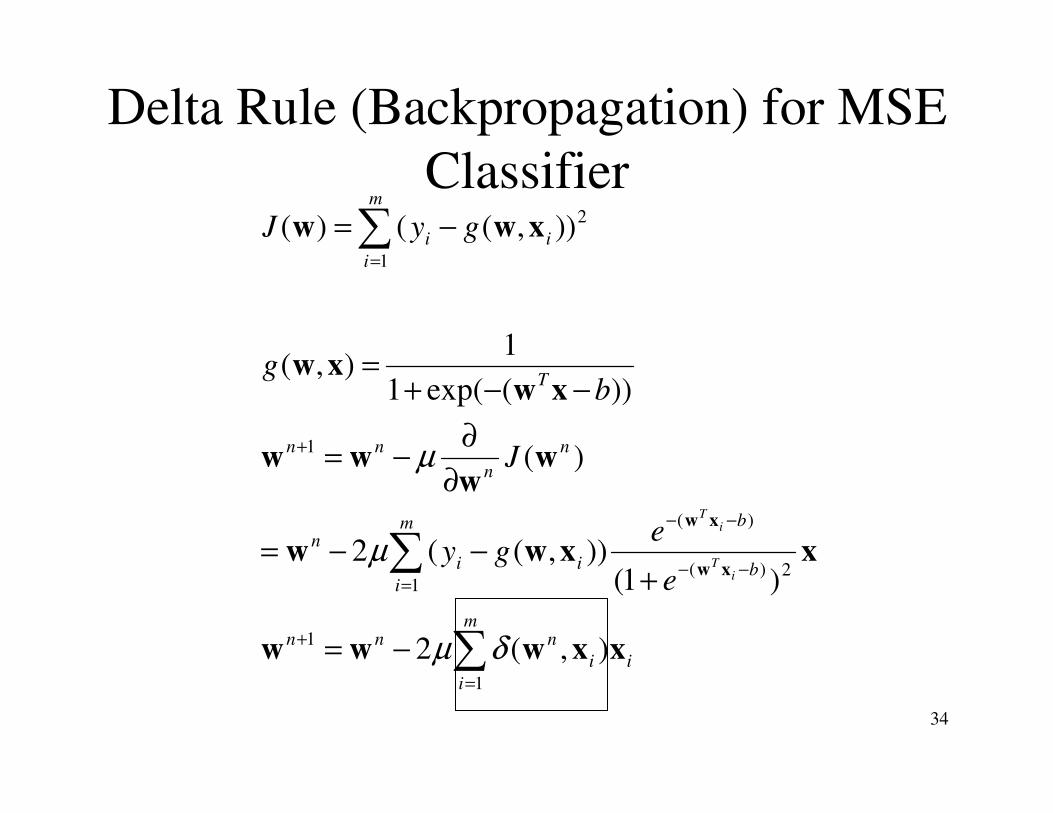
Delta Rule (Backpropagation) for MSE
Classifier
∑
∑
∑
=
+
−−
−−
=
+
=
−=
+−−=
∂
∂−=
−−+=
−=
m
i
ii
nnn
b
bm
i
ii
n
n
n
nn
T
m
i
ii
iT
iT
e
egy
J
bg
gyJ
1
1
2)(
)(
1
1
1
2
),(2
)1()),((2
)(
))(exp(1
1),(
)),(()(
xxwww
xxww
ww
ww
xwxw
xww
xw
xw
δµ
µ
µ
35
Neural Network MSE Classifier
(Single Layer)
x
w
Σ
b−
)exp(1
1
u−+Σ
1±=iy
0<
> Dec.
Adapt
Delta-rule
36
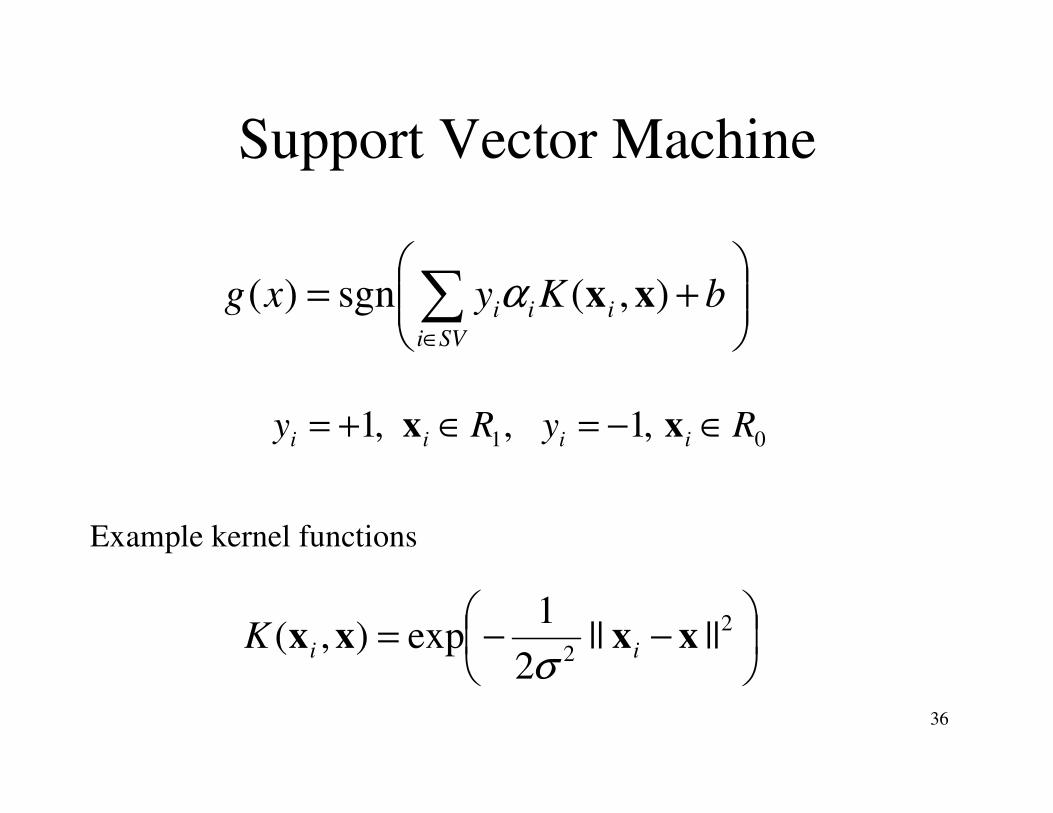
Support Vector Machine
+= ∑
∈
bKyxgSVi
iii ),(sgn)( xxα
Example kernel functions
−−= 2
2||||
2
1exp),( xxxx iiK
σ
01 ,1,,1 RyRy iiii ∈−=∈+= xx

37
Support Vector Machine
2
1|||| xx −−
exp()
Σ
2
2|||| xx −−
2
1||||
−−−
Nxx
exp()
2||||
Nxx −−
exp()
Σ<
>iω̂
x
exp()
11 yα22 yα
NN yα11 −− NN yα

38
Optimization for SVMProblem is to select alpha coefficients to maximize separation
between classes, while keeping fixed error rates.
Problem in convex optimization, Lagrangian primal and duals.
( )
2||||
1)(
Constraint
)()(sgn),(sgn)(
w
xw
xxxx
Minimize
by
bybKyxg
i
T
i
SVi
T
iii
SVi
iii
≥+
+=
+= ∑∑
∈∈
φ
φφαα
∑
∑
∈
∈
=
=
SVi
ii
SVi
iii
y
xy
Solution
0
)(
α
φαw

39
ADATRON Learning Rule for SVM
WhileEnd
ybbIf
xf
patternxChoose
tMWhile
tthresholdbInitialize
xfM
bxxkyyxf
iiiiiii
iADi
i
AD
j
iADAD
jij
m
j
jiiAD
)6
,,0)()5
))(1()4
)3
)2
,)1
)(min
),()(1
δδααδα
ηδ
ηα
α
+=+=>+
−=
<
=
+= ∑
=
Ideally should
be 1, or > 0.
Zero if fAD = 1 (like perceptron
rule)
Tries to drive fAD to 1.

40
SVM for SAR Imagery
SVM
T72
80 x 80 pixel
SAR image
(pose corrected)
SVM
BTR70
SVM
BMP2
Ref: Q. Zhao and J. Principe “Support vector machines for SAR automatic target
recognition,” IEEE Trans. AES 2001
Threshold
Test (Clutter
Rejection)
Threshold
Test (Clutter
Rejection)
Threshold
Test (Clutter
Rejection)
x1,1 −
1,1 −
1,1 −

41
SAR Imagery Confusion MatricesRef: Q. Zhao and J. Principe “Support vector machines for SAR automatic target
recognition,” IEEE Trans. AES 2001

42
Problems in Image Classification
• Color
• Correct for orientation (pose), translation, scale.
– Use invariant transforms, e.g. FFT magnitude is invariant to translation (phase shift.)
• Feature extraction (identify object in background)
• Choice of nearest-neighbor, k-means clustering/Bayes classifier, or neural-net methods.
– Long training times for images.
