ec339: lecture 4 chapter 3: pivot tables or… conditional expectations? (a.k.a. crosstabs)
TRANSCRIPT
EC339: Lecture 4Chapter 3: Pivot Tables or… Conditional Expectations? (a.k.a. Crosstabs)

First, get Excel up to speed Install Necessary Add-ins: Execute Tools: Add-ins (to get the
Add-Ins Manager dialog box, as shown to the right) and check the Analysis ToolPak and Analysis ToolPak VBA options.
Now is also a good time to install the Histogram add-in. Once again, execute Tools: Add-ins and click Browse. Navigate to the Histogram.xla file and click OK.
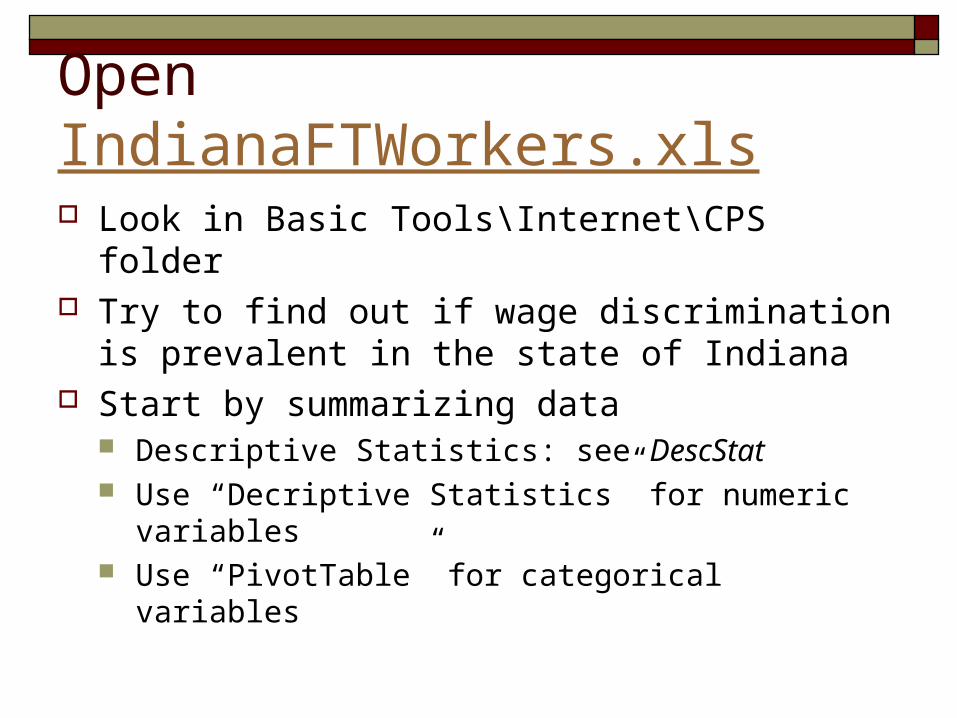
Open IndianaFTWorkers.xls Look in Basic Tools\Internet\CPS folder Try to find out if wage discrimination is
prevalent in the state of Indiana Start by summarizing data
Descriptive Statistics: see DescStat Use “Decriptive Statistics” for numeric variables Use “PivotTable” for categorical variables
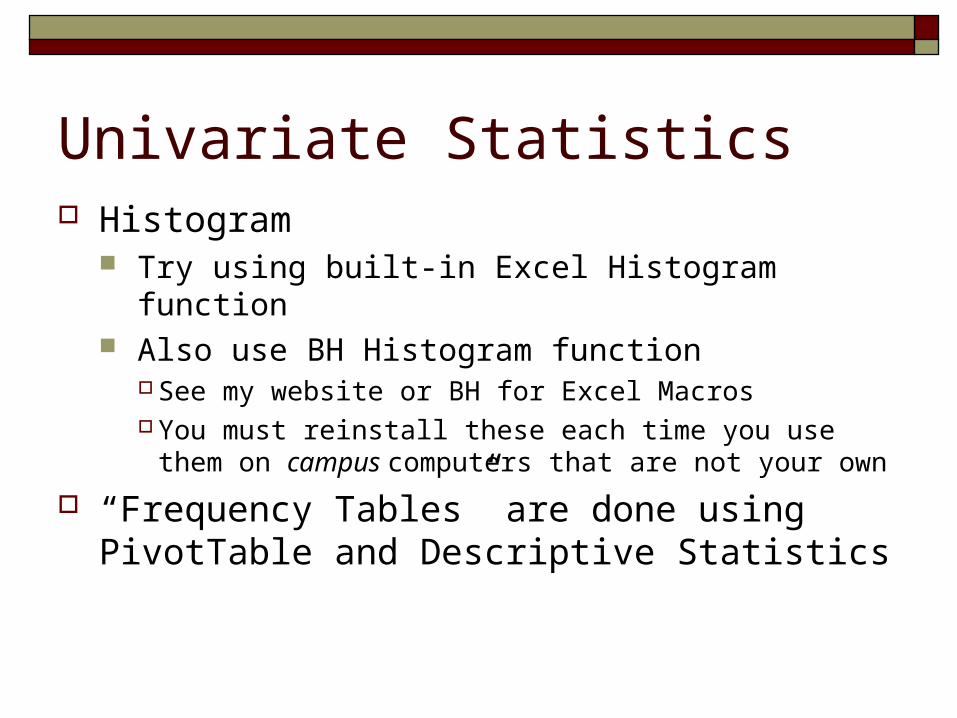
Univariate Statistics Histogram
Try using built-in Excel Histogram function Also use BH Histogram function
See my website or BH for Excel Macros You must reinstall these each time you use them on
campus computers that are not your own
“Frequency Tables” are done using PivotTable and Descriptive Statistics

Multivariate Statistics Crosstabs
Display relationships and patterns between multiple variables.
Display the value of one or more variables conditional on the value of one or more other variables
Excel allows for ‘grouping’
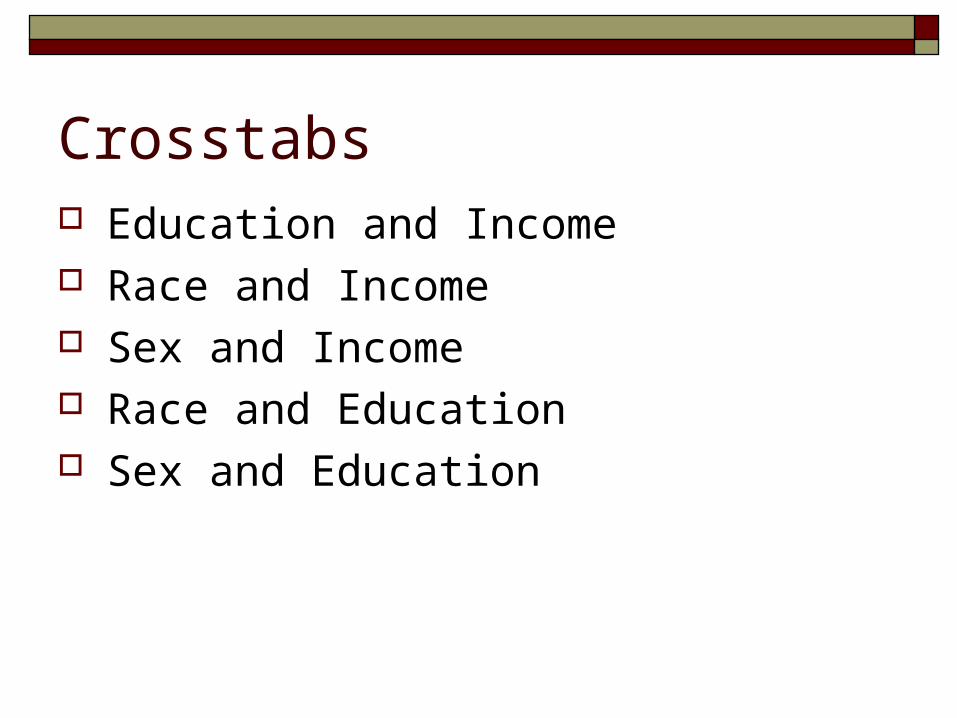
Crosstabs Education and Income Race and Income Sex and Income Race and Education Sex and Education

Examples of Conditional Averages From Indiana
Average of Total Personal IncomeEducation in Years Total
8 $21,0379 $29,620
10 $23,92411 $21,489
11.5 $36,82812 $28,62413 $34,59514 $34,49416 $60,29518 $64,72920 $47,211
Grand Total $37,174
Race Data TotalAsianPI Average of Total Personal Income $155,319
Count of Total Personal Income 1Black Average of Total Personal Income $30,228
Count of Total Personal Income 31IndEsk Average of Total Personal Income $40,753
Count of Total Personal Income 7White Average of Total Personal Income $37,303
Count of Total Personal Income 559Total Average of Total Personal Income $37,174Total Count of Total Personal Income 598
Note here there is an example of a weighted average. The overall average of $37,174 is the average of the individuals (or weighted by observations here), rather than the average of the averages, which would be $65,901.
See WeightAvg sheet

Crosstab of Income by Race and Education
Average of Total Personal Income Education General CategoriesRace FirsttoEighthGrade SomeHighSchool HighSchoolGrad SomeCollege CollegeGrad PostGraduateStudy Grand TotalAsianPI $155,319 $155,319Black $8,921 $27,770 $33,268 $27,097 $62,500 $30,228IndEsk $23,568 $58,500 $66,250 $40,753White $21,037 $26,947 $28,662 $34,502 $61,974 $61,254 $37,303Grand Total $21,037 $25,647 $28,624 $34,555 $60,295 $63,076 $37,174
Given you are black and have a high school diploma, the expected value or average income would be $27,700. If you are black, and have some college, the expected value of income rises to $33,268, a difference of $5,568. Note, the difference for a white HS grad and some college is $5,840
Conditional Mean Function Using EastNorthCentralFTWorkers.xls Conditional Mean: the average (mean) of y given
x. Often written in expectations form E(y|x). The vertical line signifies given or conditional.
Group Annual Earnings by Education What is average annual income of individuals with
12 years of education? What about if you know their income is between
$20,000 and $39,999?

Yearly EarningsEducation Data 0-19999 20000-39999 40000-59999 60000-79999 80000-100000 >100000 Grand Total
8 Count of Yearly Earnings 101 34 10 2 147Average of Yearly Earnings2 $10,605 $27,252 $47,860 $60,000 $17,662
9 Count of Yearly Earnings 34 9 5 1 1 50Average of Yearly Earnings2 $10,966 $26,222 $45,326 $60,000 $306,731 $24,044
10 Count of Yearly Earnings 70 46 7 2 1 126Average of Yearly Earnings2 $10,508 $27,968 $44,500 $70,503 $94,000 $20,386
11 Count of Yearly Earnings 84 58 12 2 156Average of Yearly Earnings2 $9,795 $27,427 $47,674 $65,300 $19,976
11.5 Count of Yearly Earnings 27 23 6 1 57Average of Yearly Earnings2 $6,980 $28,279 $48,269 $60,000 $20,851
12 Count of Yearly Earnings 769 994 358 92 20 14 2247Average of Yearly Earnings2 $10,629 $27,857 $46,957 $65,797 $89,654 $160,494 $27,934
13 Count of Yearly Earnings 415 603 326 103 34 22 1503Average of Yearly Earnings2 $10,857 $28,375 $46,917 $66,117 $88,765 $190,624 $33,888
14 Count of Yearly Earnings 45 94 61 16 2 3 221Average of Yearly Earnings2 $10,012 $28,760 $46,568 $65,937 $92,000 $217,745 $35,687
16 Count of Yearly Earnings 163 420 310 171 88 68 1220Average of Yearly Earnings2 $7,803 $29,496 $48,072 $66,878 $89,280 $173,702 $48,907
18 Count of Yearly Earnings 54 113 188 117 69 98 639Average of Yearly Earnings2 $6,974 $31,011 $49,097 $68,316 $89,997 $218,059 $76,187
Total Count of Yearly Earnings 1762 2394 1283 507 214 206 6366Total Average of Yearly Earnings2 $10,198 $28,441 $47,512 $66,783 $89,512 $197,001 $37,796

E x p e c ta tio n s O p e ra to r
Ex j1k xj fxj
f(x ) is th e p ro b a b ility d e n s ity fu n c tio n o f th e g iv e n v a lu e o f x . I t a c ts m u c h lik e a w e ig h t o n e a c h v a lu e o f x .
W h e n c a lc u la tin g th e e x p e c te d v a lu e o f a v a r ia b le , th in k o f th e fo llo w in g q u e s tio n : "W h a t is th e p ro b a b ility th a t y o u w o u ld s e le c t th is p a r tic u la r o b s e rv a tio n o u t o f a ll o b s e rv a tio n s ? " In a s im p le a v e ra g e , th is is th e p ro b a b ility 1
k w h e re k is th e to ta l n u m b e r
o f o b s e rv a tio n s . T h is w o u ld b e th e fa m ilia r Ex j1k xj 1
k . N o w , w ith
s u m m a tio n o p e ra to r s , if e v e ry n u m b e r is m u ltip lie d b y a c o n s ta n t, y o u c a n ta k e it o u ts id e o f th e o p e ra to r . Ex 1
k j1
k xj, w h ic h s h o u ld lo o k lik e th e fa m ilia r
e q u a tio n fo r a n a v e ra g e o f a s e r ie s .
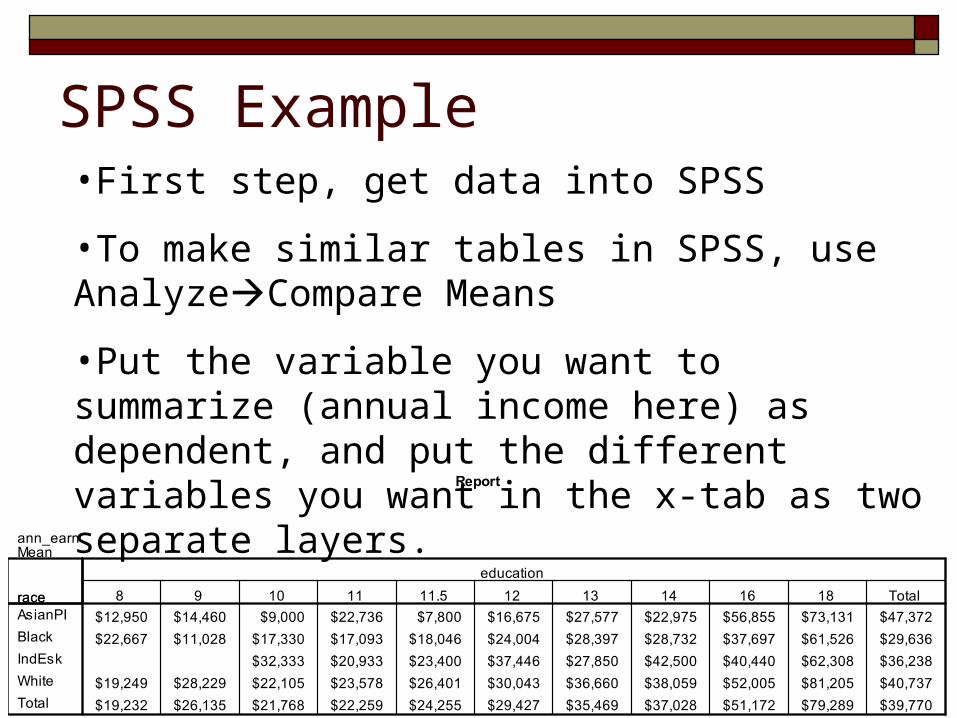
SPSS Example•First step, get data into SPSS
•To make similar tables in SPSS, use AnalyzeCompare Means
•Put the variable you want to summarize (annual income here) as dependent, and put the different variables you want in the x-tab as two separate layers.