ebos group limited notice of special meeting of … · 2018-08-28 · 1 important transaction for...
TRANSCRIPT
NOTICE OF SPECIAL MEETING OF SHAREHOLDERS AND EXPLANATORY MEMORANDUMRelating to the proposed acquisition of Symbion and the issue of shares in EBOS
29 May 2013Important Dates:• Meeting time/date: 10:00 a.m., Friday 14 June 2013• Venue: Great Hall, Chateau on the Park,
corner Deans Avenue & Kilmarnock Street, Christchurch• Last date for receipt of Voting/Proxy Forms: 10:00 a.m., Wednesday, 12 June 2013
EBOS GROUP LIMITED

1
IMPORTANT TRANSACTION FOR EBOS SHAREHOLDERS
On 29 May 2013, EBOS announced its intention to purchase all of the shares of Zuellig Healthcare Holdings Australia Pty Limited (Symbion).
This Notice of Meeting and Explanatory Memorandum includes important information requiring your immediate attention relating to the proposed acquisition by EBOS, or a wholly-owned subsidiary of EBOS, of Symbion (the Symbion Acquisition), the issue of EBOS Shares in part consideration for the purchase of Symbion, and related matters (such issue of Shares and other matters, together with the Symbion Acquisition, being the Proposed Transaction).
The EBOS Board strongly advises that you read this document carefully. For the Proposed Transaction to proceed, Shareholder support is required.
The Notice of Meeting set out in section 5 of this document specifies the Resolutions to be considered at the special meeting of Shareholders to be held at the Great Hall, Chateau on the Park, corner Deans Avenue & Kilmarnock Street, Christchurch on Friday, 14 June 2013 at 10:00 a.m. (the Special Meeting).
The remainder of this document sets out the details of, and rationale for, the Proposed Transaction, together with certain related administrative matters. An Independent Report from Northington Partners on the merits of the Symbion Acquisition, and the related Zuellig Share Issue, accompanies this Notice of Meeting and Explanatory Memorandum.
The EBOS Board fully supports the Proposed Transaction and unanimously recommends that Shareholders vote in favour of each of the Resolutions to be put to them at the Special Meeting.
Should you have questions please contact your investment adviser.
TABLE OF CONTENTS
1. Chairman’s and CEO's Letter 3
2. Overview of Symbion 6
3. The rationale for the Proposed Transaction, and overview of the Combined Group
8
4. The Proposed Transaction 19
5. Notice of Meeting 25
6. Explanation of the Resolutions and Additional Information 28
7. Glossary 34
Appendix One: Amendments to EBOS’ Constitution 37
Appendix Two: Constitutional Amendments Explanatory Notes 38
Appendix Three: Independent Report 39
Directory inside back cover

2
IMPORTANT DATES
Transaction announcement 29 May 2013
Institutional Share placement bookbuild 29-30 May 2013
Bonus Issue record date 6 June 2013
Institutional Share placement Shares issued 7 June 2013
Bonus Issue Shares issued 10 June 2013
Entitlement trading commences on the NZX Main Board 12 June 2013
Entitlement Offer record date 14 June 2013
EBOS Special Meeting of Shareholders 14 June 2013
Entitlement Offer period 17 June – 1 July 2013
Symbion Transaction settlement 5 July 2013
New EBOS Shares commence trading on the NZX Main Board 5 July 2013
These dates, and future dates in this document generally, are subject to change, are indicative only and, subject to the requirements of the Securities Act and NZSX Listing Rules, may be amended by EBOS at its absolute discretion. Further details of the Entitlement Offer will be advised to NZX closer to the time of the Entitlement Offer.
Forward Looking Statements This Notice of Meeting and Explanatory Memorandum contains certain statements that relate to the future. Such statements are not a guarantee of future performance and involve known and unknown risks, uncertainties, assumptions and other important factors, many of which are beyond the control of the Company and which may cause actual results, performance or achievements of the Company to differ materially from those expressed or implied by such statements.
Defined Terms Capitalised terms used in this Notice of Meeting and Explanatory Memorandum are defined in the Glossary, in section 7.
References to dollars and $ Unless otherwise indicated, all references in this Notice of Meeting and Explanatory Memorandum to dollars or “$” shall be to New Zealand dollars.
3
1. CHAIRMAN’S AND CEO’S LETTER
Dear Shareholder,
On behalf of the Board of EBOS, we are pleased to offer you the opportunity to support EBOS’
intended acquisition of Zuellig Healthcare Holdings Australia Pty Limited (Symbion) from its owner
Symbion Holdings Pte Limited (Zuellig) (the Symbion Acquisition), at an enterprise value of
approximately $1.1 billion.
EBOS Shareholders will be familiar with the merger and acquisition activities of the Company over
the last 12 years, successfully making 18 acquisitions, the most recent of which was Masterpet in
2011. Acquisitions have contributed to an increase in revenues from $80 million to $1.43 billion,
with a corresponding lift in earnings and market capitalisation, which is now in excess of $500
million. Most of these transactions have been funded from retained earnings and/or debt, the last
capital raising having been for the purchase of PRNZ in 2007.
At last year’s AGM we suggested that the next milestone for EBOS would be to become a $1 billion
company by market capitalisation, with leading positions in the markets in which it chooses to
operate. That milestone is now imminent. The Symbion Acquisition will transform EBOS into the
largest diversified Australasian marketer, wholesaler and distributor of healthcare, medical and
pharmaceutical products and a leading Australasian animal care products distributor. Combined
revenues across Australia, New Zealand and the Pacific Islands are expected to be in excess of $6
billion.
Symbion is the leading Australian pharmaceutical wholesaler and distributor, by revenue, and a
leading veterinary wholesale provider in Australia. It has a strong record of growth and
profitability. It has a diversified earnings base in pharmacy, hospital and animal care, and is a
great fit with EBOS’ core competencies in both countries. Symbion’s veterinarian wholesale
business, Lyppard, complements EBOS’ recent acquisition of Masterpet.
Symbion is privately owned by The Zuellig Group, with whom EBOS has had a long relationship,
including through our very successful purchase of PRNZ in 2007. The Proposed Transaction
continues that relationship, with Zuellig choosing to retain a 40% shareholding in the Combined
Group on terms that are mutually agreed. Zuellig’s decision to retain this significant investment
reflects the strong understanding between both parties, and a shared vision for the future of the
Combined Group in the Australasian market. Symbion’s success in Australia is a credit to their CEO
and key management, all of whom will remain with the Combined Group.
The period up to the announcement of the Symbion Acquisition has been the subject of the most
thorough and searching due diligence and risk assessment the Company has ever undertaken, and
this has been reciprocated by Symbion. The Proposed Transaction will be immediately earnings per
share (EPS) accretive and the Combined Group is expected to offer an attractive dividend yield.
The earnings per share accretion for the pro forma 2013 financial year is expected to be
approximately 29.8%1.
Northington Partners has been appointed by EBOS to provide an Independent Report on the merits
of the Symbion Acquisition and the issue of Shares to Zuellig as part consideration for the Symbion
1 See page 12 for further details regarding this calculation.

4
Acquisition (having regard to the interests of EBOS’ shareholders, other than Zuellig’s associate
Elite Investment Holdings Limited). Northington Partners has determined that, in their opinion, “the
purchase price of $865 million [for Symbion] sits approximately 15% below the mid-point of our
valuation range“. They conclude that the purchase price is attractive from EBOS’ point of view.
EBOS is seeking to acquire 100% of Symbion for consideration of $865 million, at an enterprise
value of $1.1 billion. The $367 million cash consideration payable to Zuellig in connection with the
Symbion Acquisition will be funded through a combination of:
new equity raised via an underwritten Share placement to institutional and habitual
investors scheduled to be completed on 7 June 2013 (the Placement);
a 7 for 20 pro-rata renounceable entitlement offer incorporating an oversubscription
facility (the Entitlement Offer); and
an extension of EBOS’ debt facilities.
The remaining portion of the consideration payable to Zuellig ($498 million) will be satisfied
through the issue of new EBOS Shares (the Consideration Shares). The additional debt and the
assumption of Symbion’s debt facilities, which will either be extended in their current form or rolled
into EBOS’ facilities (accounting for the remainder of Symbion’s enterprise value, above the
purchase price of $865 million) have been agreed in principle with EBOS’ and Symbion’s existing
bankers, on both sides of the Tasman, and formal documentation is in the process of being
negotiated.
It is of paramount importance to the Board that the Entitlement Offer be structured to allow
current Shareholders the opportunity to participate on an equitable basis and in priority to other
prospective investors. A pro-rata renounceable entitlement offer gives existing Shareholders that
right. Furthermore, existing New Zealand Shareholders will be given the opportunity to apply for
additional Shares not taken up by other Shareholders by way of an oversubscription facility forming
part of the Entitlement Offer.
The Board has also decided to undertake a bonus Share issue (the Bonus Issue) to all Shareholders
on the Bonus Issue Record Date (scheduled for 6 June 2013, prior to the issue of Shares under the
Placement) so as to allocate available imputation credits to existing EBOS Shareholders. The
Bonus Issue will result in Shareholders receiving 2 new Shares for every 53 Shares held at the
Bonus Issue Record Date.
The Symbion opportunity is large by any measure and will be transformational for EBOS. The
Board believes that the Proposed Transaction will add significant scale and diversification to EBOS’
current business and will allow for operational efficiency gains in premises, operations and back
office functions. Potential benefits have been identified through the detailed due diligence process.
However, they are not factored into any prospective financial information.
EBOS has agreed (except in certain limited circumstances where the Board unanimously decides
otherwise) to seek an ASX listing by 31 December 2013. This, together with an increased market
capitalisation and index weighting on the NZX, is expected to increase liquidity and investor
interest, which should be of benefit to all Shareholders. The EBOS Board will also benefit from the

5
addition of two experienced Directors, Peter Williams and Stuart McGregor, who will represent
Zuellig on the Board.
Following the Proposed Transaction EBOS’ ratio of net interest bearing debt to total tangible assets
is expected to be approximately 28% as at 31 December 2013. This debt position will be well
within EBOS’ debt facility covenants and, in the Board’s view, well within acceptable levels. EBOS
has a sound track record of utilising debt to assist in the funding of acquisitions and paying down
the debt associated with those acquisitions over time.
The Proposed Transaction is conditional on a number of conditions precedent, including
Shareholder approval. Resolutions to approve the Symbion Acquisition, the issue to Zuellig of the
Consideration Shares in part consideration for that acquisition, and to approve other aspects of the
Proposed Transaction, will be put to Shareholders at a special meeting to be held in Christchurch
on 14 June 2013 (the Special Meeting). If the Resolutions are not approved, the Proposed
Transaction will not proceed.
Subject to Shareholder approval of the Proposed Transaction at the Special Meeting, a prospectus
for the Entitlement Offer will be posted to you on 17 June 2013.
The Proposed Transaction is a rare opportunity to create a clear trans-Tasman market leader.
Further, we have a supportive vendor prepared to take a significant shareholding in EBOS,
providing even greater confidence for the future.
The Board of EBOS unanimously recommends that Shareholders support the Proposed Transaction.
Yours faithfully,
EBOS Group Limited
Rick Christie Mark Waller Chairman CEO & Managing Director

6
2. OVERVIEW OF SYMBION
Symbion is a market leading high quality business Symbion is a well-managed company with a track record of strong financial performance. Its acquisition will offer Shareholders access to a high-quality Australasian healthcare and animal care investment. EBOS believes the Combined Group will be particularly well placed to adapt to the current Australian healthcare reform process, given its experience and success in a similar regulatory framework in New Zealand.
Symbion is the leading Australian pharmaceutical wholesaler and distributor by revenue, and a leading veterinary wholesale provider in Australia, with operations across all states and 22 warehouses. In the year ending 30 June 2012, Symbion had revenue of nearly AUD$3.9 billion and EBITDA of AUD$108.5 million2.
Symbion primarily derives its revenues through the wholesale of pharmaceutical medicines and OTC products to retail pharmacies and through the wholesale and distribution of pharmaceutical medicines to hospitals. In the healthcare space, Symbion offers an additional suite of services, such as pharmacy management software, clinical trial management and logistics. In recent years Symbion has diversified its operations, including expanding into veterinary products through the purchase of Lyppard in 2011.
Overview of Symbion’s business activities Symbion is the leading Australian pharmaceutical wholesaler and distributor, by revenue, and a leading veterinary wholesale provider in Australia.
Manufacturer Services Wholesaling Retail
Services
Contract Logistics Clinect Clinical
TrialsAPHS
Packaging Pharmacy Hospitals Veterinary Services Dental Chemmart
Pharmacy Choice &
Intellipharm
Consumer Products Minfos
Symbion’s History 1845: FH Faulding is established as Francis Hardy Faulding opens his first pharmacy at 5
Rundle Street in Adelaide
1921: Faulding is restructured into a private company
1947: Faulding becomes a public company
1959: Sir Donald Bradman joins the board
1970: Faulding, Service Wholesaling and Specialist divisions are established to improve offerings to customers
2 Includes interest income of AUD$1.7 million.

7
1993: Faulding sales exceed AUD$1 billion
1996: Chemmart Pharmacy co-operative established in Australia as a national brand
2000: minfos acquired
2004: Sales reach AUD$2 billion
2007: Pharmacy Choice launched
2008: The Zuellig Group takes control of Symbion Pharmacy Services
2010: Faulding brand is relaunched
2011: Lyppard Australia is acquired. Clinect division formed and Symbion Pharmacy Services renamed Symbion
8
3. RATIONALE FOR THE PROPOSED TRANSACTION AND OVERVIEW OF THE COMBINED GROUP
Rationale for the Proposed Transaction The Proposed Transaction represents a rare and transformational opportunity for EBOS and its Shareholders. EBOS has a successful business in Australia and is looking to grow significantly in that market. EBOS considers that in order to achieve growth in the Australian healthcare and animal care sectors it needs to be a mainstream player of significant scale.
The Symbion Acquisition is expected to result in the Combined Group becoming the leading3 supply and distribution platform for pharmaceutical products in both New Zealand and Australia. The Combined Group will have a greater range of capabilities to take advantage of new and existing opportunities. In the animal care space, the Combined Group will have a diversified offering, with a range of quality brands and products across the pet speciality, grocery and mass merchant segments, vets and veterinary wholesale.
The Symbion Acquisition will transform EBOS and is expected to deliver significant value for EBOS Shareholders:
1. Creation of the leading supply and distribution platform for pharmaceutical products in both Australia and New Zealand.
2. The Combined Group will have a greater range of capabilities and resources to take advantage of new and existing opportunities in the growing healthcare and animal care markets.
3. The Combined Group will have a diversified animal care offering, with a range of quality brands and products across the pet specialty, grocery and mass merchant segments, vet and veterinary wholesale.
4. EBOS and Symbion both have a proven track record of profit growth under the guidance of the existing experienced management teams.
5. The increased scale of the Combined Group will enhance its ability to provide the critical infrastructure required by healthcare and animal care customers and suppliers.
6. Highly earnings accretive transaction offering an attractive forecast dividend yield.
7. Increased market capitalisation, index weighting and intended ASX listing expected to increase liquidity and investor interest.
1. Creation of the leading supply and distribution platform for pharmaceutical products in both Australia and New Zealand.
The Symbion Acquisition represents a rare opportunity to transform EBOS into the only comprehensive trans-Tasman marketer, distributor and wholesaler of healthcare and pharmaceutical products. While EBOS already possesses a footprint throughout Australia, the acquisition of Symbion will considerably deepen EBOS’ presence. The Combined Group will become (by market share)4:
#1 in combined pharmacy and hospital pharmaceutical wholesale and distribution in Australia and New Zealand
#1 pharmacy wholesaler in New Zealand
3 By financial year 2012 revenue, derived from each company’s annual accounts.
4 Market position information derived from IMS Statistics, EBOS management estimates based on publicly-available information.

9
#2 pharmacy wholesaler in Australia
#1 in hospital pharmaceutical distribution in New Zealand
#1 in hospital pharmaceutical distribution in Australia
#1 or #2 in pre-wholesale/3PL in New Zealand
2. The Combined Group will have a greater range of capabilities and resources to take advantage of new and existing opportunities in the growing healthcare and animal care markets.
The acquisition of Symbion will provide the Combined Group with a larger platform to achieve growth in the expanding Australian and New Zealand healthcare and animal care markets using its complementary capabilities in sales and marketing, wholesaling and distribution of pharmaceuticals, medical consumables, retail OTC, animal care products, veterinary wholesale and third party logistics. EBOS also expects there to be cross-selling opportunities, such as the direct distribution of EBOS’ and Symbion’s existing own-brand portfolios (e.g. Antiflamme, Faulding) in Australia and New Zealand.
The Combined Group will have a greater breadth and scale of service offering:
3rd party distribution & logistics solutions.Distribution systems and electronic ordering of supplies for healthcare providers
Product management solutions to pharmaceutical companies. Clinical trial logistics and depot services
Sales and marketing of a wide range of healthcare products across consumer, primary care, hospital, aged care and international markets
Logistics and Distribution
Pharm. & Hospital Wholesaling
HEALTHCARE ANIMAL CARE
Veterinary / pet products
Veterinary wholesaler, distributor and retailer of animal healthcare products, pet accessories and premium foods across Australasia
Retail brands & Services
Retail pharmacy brand ownership, sales of branded product and operation of pharmacy support and management systems
Manufacturer Services
Sales & Marketing
Specialist wholesaler and distributor of ethical, OTC and consumer products to pharmacies and public and private hospitals
The Symbion Acquisition will also provide the Combined Group with new capabilities (such as expertise in veterinary wholesale and retail brand group operations) that can potentially be utilised in EBOS’ existing markets. At the same time EBOS will be able to share with Symbion its knowledge and experience in the pre wholesale/third party logistics segment.
The breadth and depth of the Combined Group’s revenue streams will leave it well placed to adapt to changes in regulatory and competitive dynamics in the healthcare and animal care sectors. Additionally, the diversification of the Combined Group’s offerings is expected to assist in mitigating the impact of any downturn in demand in any one area of the business, while also introducing multiple avenues for growth in market segments to which EBOS did not previously have access. In the medium term, the increased scale and reach of the Combined Group’s distribution network allows for the possibility of expansion into new markets and channels.

10
3. The Combined Group will have a diversified animal care offering, with a range of quality brands and products across the pet specialty, grocery and mass merchant segments, vet and veterinary wholesale.
The Symbion Acquisition will provide the Combined Group with the opportunity to leverage the networks and brands available to both Lyppard and Masterpet across Australia and New Zealand. The Combined Group will be able to offer a suite of products and services to the animal care market, including the pet specialty, grocery, mass merchants, vet and veterinary distribution channels.
Suppliers to the Combined Group will gain access to a comprehensive wholesale and retail distribution network. In addition, the Combined Group will manufacture and distribute a range of its own pet care brands and operate 21 pet specialty retail outlets through its Animates joint venture in New Zealand.
4. EBOS and Symbion both have a proven track record of profit growth under the guidance of the existing experienced management teams.
Since the acquisition of PRNZ in 2007, EBOS has demonstrated its ability to grow earnings and has achieved an EBITDA compound annual growth rate (CAGR) of 8.7% and an earnings per Share CAGR of 9.3%.
Similarly, Symbion has achieved strong growth over the 2007-2012 period with a 7.7% CAGR in revenue and a 15.2% CAGR in EBITDA. This performance has been achieved through a period of significant regulatory change.
EBOS’ financial track record
Historical EBITDA
33.6
38.740.4 41.1
46.9
$0
$5
$10
$15
$20
$25
$30
$35
$40
$45
$50
FY08 FY09 FY10 FY11 FY12
EB
ITD
A (
NZ
$m)
EBITDA CAGR = 8.7%
Historical EPS1
37.641.1 39.5
45.4
53.6
0
10
20
30
40
50
60
FY08 FY09 FY10 FY11 FY12
Ear
nin
gs p
er s
har
e (N
Z c
ents
per
sh
are)
EPS CAGR = 9.3%
Source: EBOS Annual Reports. EBOS’ financial information is for a June year end.
1. Earnings per Share from continuing operations.

11
Symbion’s financial track record
Historical Revenue
2.7
3.1
3.53.7 3.8 3.9
$0.0
$0.5
$1.0
$1.5
$2.0
$2.5
$3.0
$3.5
$4.0
$4.5
FY07 FY08 FY09 FY10 FY11 FY12
Rev
enu
e (A
$bn
)
Revenue CAGR = 7.7%
Historical EBITDA1
53.5
70.4
85.4
98.2 97.6108.5
$0
$20
$40
$60
$80
$100
$120
$140
FY07 FY08 FY09 FY10 FY11 FY12
EB
ITD
A (
A$m
)
EBITDA CAGR = 15.2%
Source: Symbion management accounts. Symbion’s financial information is for a June year end.
1. Historical EBITDA has not been adjusted for APHS trading losses.
2. FY09 includes interest income of AUD$1.5m, FY10 includes interest income of AUD$4.7m, FY11 includes interest income of AUD$1.8m, FY12 includes interest income of AUD$1.7m.
Further information regarding EBOS, including historical financial statements, can be found at www.ebos.co.nz, while further background information on Symbion may be found at www.symbion.com.au.
5. The increased scale of the Combined Group will enhance its ability to provide the critical infrastructure required by healthcare and animal care customers and suppliers.
The Combined Group will operate a trans-Tasman integrated network of distribution, manufacturing and retail assets generating pro forma FY13 revenue in excess of $6 billion and EBITDA of $199 million5.
The Combined Group will distribute products and provide services through a network of 41 warehouses across Australia and New Zealand.
The increased scale will allow for operational efficiency gains in premises, operations and back office functions.
5 Assuming a NZD/AUD exchange rate of $0.7988. Excludes one-off transaction costs of $4.8 million and is adjusted for
APHS trading losses of $5.1 million.

12
EBOS and Symbion key operating locations
EBOS
Symbion
6. Highly earnings accretive transaction offering an attractive forecast dividend yield.
The Board expects the Symbion Acquisition to be highly earnings accretive. Based on the Board’s expectations of the financial performance of the existing EBOS business and the earnings of Symbion, the Symbion Acquisition would, on a June 2013 pro forma basis, result in EPS accretion of 29.8%1.
FY13 earnings per share1
48.2
62.6
0
10
20
30
40
50
60
70
EBOS standalone FY13 EPS (TERP
adjusted)
EBOS pro forma FY13 EPS
NZ
Cen
ts p
er S
hare
29.8%
Cash dividend yields2
3.6%
4.7%
0%
1%
2%
3%
4%
5%
Based on TERP Based on Entitlement Offer price
1. EBOS standalone FY13 EPS assumes that the Proposed Transaction does not occur and is adjusted for the impact of the Bonus Issue and the Entitlement Offer. EBOS pro forma FY13 EPS is based on EBOS’ pro forma fully diluted number of Shares and EBOS’ pro forma Net Profit After Tax assuming the Proposed Transaction occurred on 1 July 2012 and excludes any synergies and one-off transaction costs. See page 17 for further detail on the pro forma financial information.
2. EBOS FY13 DPS of 30.6 cents per Share includes EBOS’ 1H13 dividend of 17.5 cents per Share TERP adjusted by a factor of 0.922 (for the impact of the Bonus Issue and Entitlement Offer) to 15.6 cents per Share and an expected 15 cents per Share dividend for 2H13. Cash dividend yields calculated using the 30.6 cents per Share dividend and a TERP of $8.57 and Entitlement Offer price of $6.50. All calculations exclude imputation credits and resident withholding tax. See page 15 of the Independent Report for a reconciliation of how TERP and the TERP adjustment factor is determined.
In addition to the Bonus Issue (see below at page 23 for further details) scheduled to be allotted on 10 June 2013 to Shareholders who held Shares on the Bonus Issue Record Date (scheduled for 6 June 2013, prior to settlement of the Placement), the Board intends to pay a partially imputed cash dividend of 15.0 cents per Share (including on Shares issued in the

13
Bonus Issue, Placement and the Entitlement Offer, and on the Consideration Shares issued to Zuellig) in respect of the second half of its 2013 financial year, payable in October 2013.
7. Increased market capitalisation, index weighting and intended ASX listing expected to increase liquidity and investor interest.
The Symbion Acquisition and its associated transactions, including EBOS’ agreement to seek an ASX listing, will lead to an expanded EBOS Shareholder base, resulting in greater Share liquidity (i.e. an enlarged pool of buyers and sellers of EBOS Shares), an improved NZX 50 index position and a higher index weighting. This should result in increased research coverage of EBOS.
The Combined Group will be the largest listed healthcare and animal care wholesaler and distributor in Australasia with a pro forma market capitalisation of $1.3 billion6.
Overview of the Combined Group
Board of Directors EBOS’ existing Board will be supplemented by the addition of two Zuellig representatives Stuart McGregor and Peter Williams. The Board will comprise:
Rick Christie MSC (Hons), FNZIoD Independent Chairman of Directors Joined the EBOS Group Limited Board in June 2000, and was appointed Chairman in April 2003. He is a member of the Audit and Risk Committee, and chairman of the Remuneration Committee and the Nomination Committee. Rick Christie is a professional director with a breadth of governance and international management experience in a number of industries. A former Chief Executive of the diversified investment company Rangatira Limited, a former Managing Director of Cable Price Downer and former Chief Executive of Trade New Zealand. He is the Chairman of National e-Science Infrastructure – NeSI, director of South Port New Zealand Limited, NZ Pork Industry Board, Solnet Solutions Limited, Acurity Health Limited and Chairman of ServiceIQ. Previously Chairman of AgResearch Limited, Deputy Chairman of the Foundation for Research, Science & Technology and Chairman of the Victoria University Foundation Board of Trustees.
He is also a Companion of The Royal Society of New Zealand, a former director of Television New Zealand and the New Zealand Symphony Orchestra and a past president of Chamber Music New Zealand.
Mark Waller BCOM, ACA, FNZIM Chief Executive Officer & Managing Director Mark Waller has been Chief Executive Officer and Managing Director of EBOS Group Limited since 1987. He is a member of the Remuneration Committee. He is a director of all the EBOS Group Limited subsidiaries, as well as being a director of Scott Technology Limited, and HTS-110 Limited (alternate director). He was the recipient of the Executive of the Year award at the 2010 Deloitte/Management magazine Top 200 Awards.
Elizabeth Coutts BMS, CA Independent Director Appointed to the EBOS Group Limited Board July 2003. She is a member of the Audit and Risk Committee and the Nomination Committee. Elizabeth Coutts is a former Chairman of Meritec Group, Industrial Research, and Life Pharmacy Limited, director of Air New Zealand Limited and the Health Funding Authority, former Deputy Chairman of Public Trust, board member of Sport and Recreation NZ, member of the Pharmaceutical Management Agency (Pharmac), Commissioner for both the Commerce and Earthquake Commissions and former external monetary policy adviser to the Governor of the Reserve Bank of New Zealand and Chief Executive of the Caxton Group of Companies. Her current
6 Calculated by multiplying the number of Shares expected to be on issue following Completion by the Theoretical Ex-Rights
Price ($8.57 per Share).
14
directorships include Chair of Urwin & Co Limited, and director of NZ Directories Holdings Limited (and subsidiaries), Ports of Auckland Limited, Ravensdown Fertiliser Co-operative Limited, Sanford Limited, Skellerup Holdings Limited and Tennis Auckland Region Incorporated, and member, Marsh New Zealand Advisory Board. She is Chair of Inland Revenue, Risk and Assurance Committee.
Peter Kraus MA (HONS), DIP ENG Peter Kraus has been a Director of EBOS Group Limited since 1990. He is a member of the Nomination Committee. He is a director of Whyte Adder No 3 Limited, Strand Holdings Limited, Strand Management Limited, Herpa Properties Limited, Ecostore Company Limited, Huckleberry Farms Limited, Peton Limited and Peton Villas Limited, and Trustee of the The Perpanida Trust and The Annalise Trust.
Sarah Ottrey BCOM Independent Director Appointed to the EBOS Group Limited Board September 2006. Sarah Ottrey is a director of Blue Sky Meats (NZ) Limited, Smiths City Group Limited, Comvita Limited, Whitestone Cheese Limited and Sarah Ottrey Marketing Limited, and is a member of the Inland Revenue Risk and Assurance Committee. She is a past board member of the Public Trust. Sarah has held senior marketing management positions with Unilever and Heineken.
Barry Wallace MCOM (HONS), CA Appointed to the EBOS Group Limited Board October 2001. He is Chairman of the Audit and Risk Committee and member of the Remuneration Committee. Barry Wallace is a chartered accountant with a background in financial management. He is a former Chief Executive of Health Support Limited and is the Finance Director of a private group of companies and trusts. He is a director of Whyte Adder No 3 Limited, Strand Holdings Limited, Strand Management Limited, Herpa Properties Limited, Ecostore Company Limited, Eco Tech Solutions Limited, Huckleberry Farms Limited, Peton Limited and Peton Villas Limited and a Trustee of The Perpanida Trust and The Annalise Trust.
Peter Williams has been an executive of The Zuellig Group since 2000. In this capacity, in addition to being a director of Symbion Pty Limited, Peter Williams is a director of Interpharma Investments Limited, Asia’s leading distributor of healthcare products, and of Pharma Industries Limited. Peter Williams is also a director of Cambert, a company marketing health and personal care products in South East Asia.
Stuart McGregor BCOM, LLB, MBA was educated at Melbourne University and the London School of Business Administration, gaining degrees in Commerce and Law. He also completed a Masters of Business Administration. Over the last 30 years, Stuart McGregor has been Company Secretary of Carlton United Breweries, Managing Director of Cascade Brewery Company Limited in Tasmania and Managing Director of San Miguel Brewery Hong Kong Limited. In the public sector, he served as Chief of Staff to a Minister for Industry and Commerce in the Federal Government and as Chief Executive of the Tasmanian Government’s Economic Development Agency. He was formerly a director of Primelife Limited from 2001 to 2004. Currently Stuart is Chairman of Donaco International Ltd, an ASX listed company. He is also Chairman of Powerlift Australia Pty Ltd., C B Norwood Pty Ltd., and Symbion Pty Ltd.
Experienced management The Combined Group will be led by Mark Waller, Chief Executive Officer and Managing Director of EBOS since 1987.
Patrick Davies will continue to lead Symbion as its CEO. Patrick Davies holds a Bachelor of Economics (Adelaide University) and a Masters of Business Administration (Australian Graduate School of Management). He has been in executive management roles in the Australian healthcare industry for over twenty years having held senior roles across many industry sectors including pharmacy, primary care, pharmaceutical and consumer products. In January 2006, Patrick Davies was appointed to his current position of Chief Executive Officer of Symbion. He is a non-executive director of Pharmacybrands Limited a NZX listed public company, the current President of

15
Australia’s National Pharmaceutical Services Association and a member of the Board of Overseers for the International Partnership for Innovative Healthcare Delivery (an initiative of the World Economic Forum).
Dividend Policy The Board intends to maintain its current dividend policy of paying 60-70% of normalised Net Profit after Tax in dividends, after having regard to all relevant factors, including working capital and growth initiative requirements.
As a result of the increased Australian earnings contribution from Symbion, dividends are anticipated to be partially imputed in the future.
Future Strategy The Combined Group’s goal will be to leverage its scale and broad capability set to enhance revenue and margin improvement. In the healthcare and animal care sectors the Combined Group intends to:
Expand its 3PL (third party logistics) offering in Australia using Symbion’s scale and infrastructure and EBOS’ existing 3PL knowledge and expertise.
Expand the existing EBOS Australian medical consumables business utilising Symbion’s scale and infrastructure.
Increase contribution from business activities that are less reliant on government policy (e.g. OTC products, clinical trials).
Leverage group buying power and management expertise across both the healthcare and animal care businesses.
Expand into veterinary wholesale in New Zealand.
Utilise combined Australian resources to improve Lyppard’s and Masterpet’s operations and performance.
Key Risk Factors The Symbion Acquisition is not free from risk. As with any business, there is a risk that the Combined Group may not perform as expected. Similarly, any acquisition carries the risk that EBOS becomes directly or indirectly liable for previously unidentified historical liabilities for which the standard warranties and indemnities in the Share Purchase Agreement turn out to be inadequate. Key specific risk factors relating to the Symbion Acquisition transaction itself, but excluding risks of a general nature or which are currently faced by EBOS regardless of the Symbion Acquisition, include:
Change of control risk: The Proposed Transaction may trigger “change of control” clauses in material contracts of the Combined Group or otherwise result in counterparties seeking to terminate or renegotiate their arrangements with the Combined Group. A failure to retain key customers, suppliers, premises or intellectual property rights, or a material adverse change in the Combined Group’s contractual arrangements with them, could adversely affect the Combined Group’s performance.
Currency risk: As a trans-Tasman business the Combined Group will be exposed to movements in the relative value of the New Zealand and Australian currencies, and in particular the impact these currency movements may have on the presentation of the Combined Group’s financial results. The Combined Group also has exposures to other

16
currencies, such as the US dollar and Euro. The Combined Group will seek to mitigate the near term impact of these exchange rate movements through its hedging policy and strategies.
Regulatory risk: The Combined Group will operate in a highly regulated industry, in which government entities and programs (PHARMAC in New Zealand and the Pharmaceutical Benefits Scheme (PBS) and Community Service Obligation (CSO) funding pool in Australia) seek to contain the cost of pharmaceuticals, potentially impacting the Combined Group’s revenues and margins. Other regulatory decisions (such as the de-regulation of pharmacy ownership in Australia, permitting ownership by persons other than individual pharmacists) or changes to the structure of the pharmaceutical industry in New Zealand or Australia (such as manufacturers choosing to supply their products directly to pharmacy customers, rather than utilising wholesalers like the Combined Group) could adversely affect the Combined Group’s performance.
For further information on risk factors please see pages 30 and 44 of the Independent Report.
17
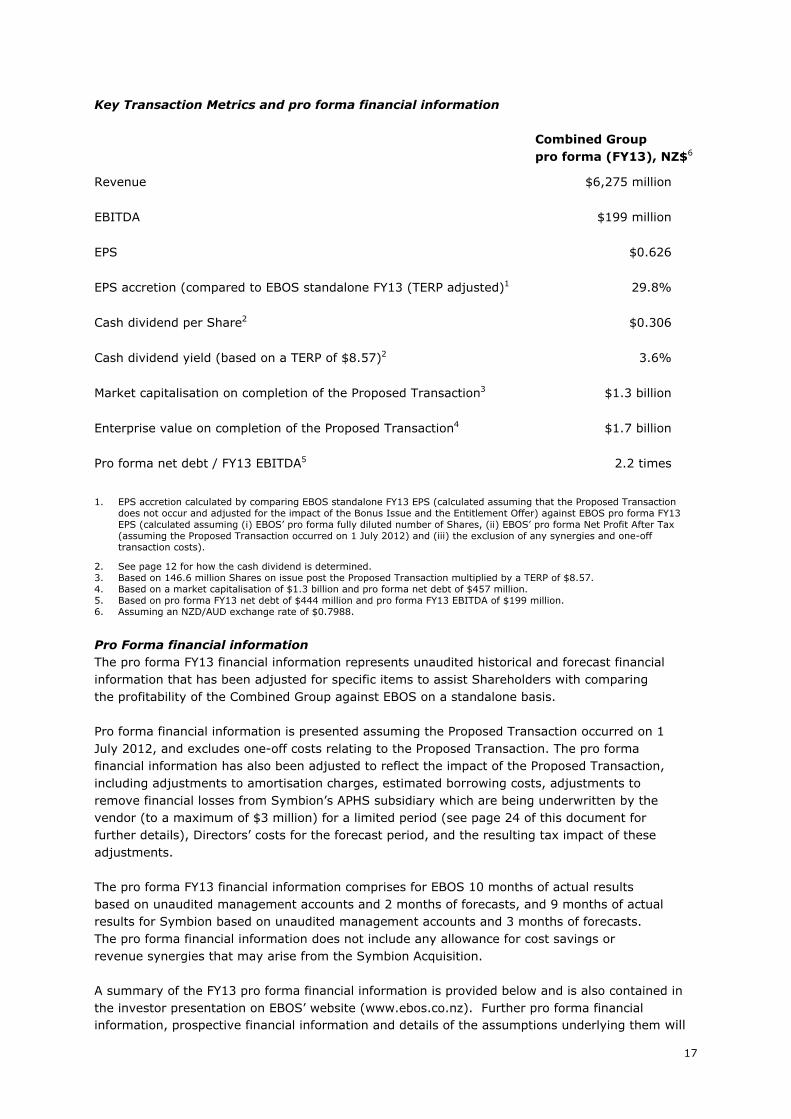
Key Transaction Metrics and pro forma financial information
Combined Group pro forma (FY13), NZ$6
Revenue $6,275 million
EBITDA $199 million
EPS $0.626
EPS accretion (compared to EBOS standalone FY13 (TERP adjusted)1 29.8%
Cash dividend per Share2 $0.306
Cash dividend yield (based on a TERP of $8.57)2 3.6%
Market capitalisation on completion of the Proposed Transaction3 $1.3 billion
Enterprise value on completion of the Proposed Transaction4 $1.7 billion
Pro forma net debt / FY13 EBITDA5 2.2 times
1. EPS accretion calculated by comparing EBOS standalone FY13 EPS (calculated assuming that the Proposed Transaction does not occur and adjusted for the impact of the Bonus Issue and the Entitlement Offer) against EBOS pro forma FY13 EPS (calculated assuming (i) EBOS’ pro forma fully diluted number of Shares, (ii) EBOS’ pro forma Net Profit After Tax (assuming the Proposed Transaction occurred on 1 July 2012) and (iii) the exclusion of any synergies and one-off transaction costs).
2. See page 12 for how the cash dividend is determined. 3. Based on 146.6 million Shares on issue post the Proposed Transaction multiplied by a TERP of $8.57. 4. Based on a market capitalisation of $1.3 billion and pro forma net debt of $457 million. 5. Based on pro forma FY13 net debt of $444 million and pro forma FY13 EBITDA of $199 million. 6. Assuming an NZD/AUD exchange rate of $0.7988.
Pro Forma financial information The pro forma FY13 financial information represents unaudited historical and forecast financial information that has been adjusted for specific items to assist Shareholders with comparing the profitability of the Combined Group against EBOS on a standalone basis.
Pro forma financial information is presented assuming the Proposed Transaction occurred on 1 July 2012, and excludes one-off costs relating to the Proposed Transaction. The pro forma financial information has also been adjusted to reflect the impact of the Proposed Transaction, including adjustments to amortisation charges, estimated borrowing costs, adjustments to remove financial losses from Symbion’s APHS subsidiary which are being underwritten by the vendor (to a maximum of $3 million) for a limited period (see page 24 of this document for further details), Directors’ costs for the forecast period, and the resulting tax impact of these adjustments.
The pro forma FY13 financial information comprises for EBOS 10 months of actual results based on unaudited management accounts and 2 months of forecasts, and 9 months of actual results for Symbion based on unaudited management accounts and 3 months of forecasts. The pro forma financial information does not include any allowance for cost savings or revenue synergies that may arise from the Symbion Acquisition.
A summary of the FY13 pro forma financial information is provided below and is also contained in the investor presentation on EBOS’ website (www.ebos.co.nz). Further pro forma financial information, prospective financial information and details of the assumptions underlying them will

18
be made available to Shareholders in the Offer Document for the Entitlement Offer which is anticipated to be posted on 17 June 2013. Further financial information is presented in the Independent Report.
Unaudited Pro forma FY13 Financial Information
SUMMARY PROFIT AND LOSS (NZ$M)
EBOS STANDALONE
SYMBION STANDALONE
PRO FORMA ADJUSTMENTS
PRO FORMA COMBINED GROUP
REVENUE 1,484 4,791 - 6,275
EBITDA 53 141 51 199
EBIT 49 125 (5)2 169
NPAT 29 71 (8)3 92
SHARES ON ISSUE (MILLION SHARES)
55.04 146.6
BASIC EPS (CENTS PER SHARE)
52.3 62.6
TERP ADJUSTMENT FACTOR
0.922 N/A
TERP ADJUSTED EPS (CENTS PER SHARE)
48.2 62.6
1. EBITDA adjustment includes a $5.1 million adjustment for APHS trading losses and a $0.5 million adjustment for Directors’ fees.
2. EBIT adjustment includes $9.5 million of amortisation, a $5.1 million adjustment for APHS trading losses and a $0.5 million adjustment for Directors’ fees.
3. NPAT adjustments includes $8.3 million of interest cost, $9.5 million of amortisation, a $5.1 million adjustment for APHS trading losses and a $0.5 million adjustment for Directors’ fees, and the tax effects of these adjustments.
4. Post the proposed 2-for-53 taxable Bonus Issue of approximately 2 million new Shares.
See page 15 of the Independent Report for further detail on how the TERP adjustment factor is calculated.

19
4. THE PROPOSED TRANSACTION
The Symbion Acquisition The Company has contracted to acquire, either itself or through a wholly-owned subsidiary, all of the shares in Symbion, at an enterprise value of approximately $1.1 billion. EBOS will acquire Symbion for consideration of $865 million, comprising:
the issue of 58,126,842 new EBOS Shares (of the same class as EBOS’ existing Shares) to Zuellig on Completion (the Consideration Shares)7, which Shares will, together with the 500,000 EBOS Shares already held by Zuellig’s related party Elite Investment Holding Limited (518,868 Shares post the Bonus Issue), result in Zuellig and its associates holding 40% of EBOS’ total Shares (taking into account the new Shares to be issued pursuant to the Bonus Issue, the Placement and the Entitlement Offer) immediately following Completion (the Zuellig Share Issue); and
payment to Zuellig of $367 million in cash.
In addition EBOS will assume $230 million of Symbion’s net debt. This assumption of debt, combined with the purchase consideration, results in the approximately $1.1 billion enterprise value ascribed to Symbion.
The purchase price to be paid for Symbion is, in the Board’s opinion, attractive. Symbion will be acquired on a projected June 2013 EV/EBITDA multiple, adjusted for APHS trading losses, of 7.5x. By comparison, EBOS’ Shares currently trade at a multiple of 12.6x FY12 EBITDA (as at 24 May 2013). The purchase price was agreed following extensive negotiations with Zuellig, and was based on EBOS’ view of Symbion’s future EBITDA potential and valuation multiples for similar businesses (including Sigma and API, two of Symbion’s Australian competitors, both of which are listed on the ASX). The Independent Adviser & Appraiser, Northington Partners, has concluded that “the purchase price of $865m sits approximately 15% below the mid-point of our valuation range“. They conclude that the purchase price is attractive from EBOS’ point of view.
Completion of the Symbion Acquisition is scheduled for 5 July 2013, with an effective date of 1 June 2013.
Conditions The Symbion Acquisition is subject to a number of conditions precedent, including:
Shareholder approval of the Symbion Acquisition and the Zuellig Share Issue (Resolutions 1 and 2);
Shareholder approval of the appointment of Peter Williams and Stuart McGregor as Directors (Resolutions 3 and 4);
Shareholder approval of amendments to EBOS’ Constitution to permit an ASX listing (Resolution 6);
EBOS securing prospectus liability insurance in respect of the simplified disclosure prospectus to be registered in connection with the Entitlement Offer;
the Company not having received minority buy-out notices under section 111(a) of the Companies Act 1993 in respect of 5% or more of the Company’s Shares; and
7 The Consideration Shares will be issued at an implied price of $8.57 per Share (the Theoretical Ex-Rights Price), but, for the
avoidance of doubt, will be issued to Zuellig in part consideration for the Symbion Acquisition; the Consideration Shares will not be issued for cash.
20
successful completion of the Placement and the Entitlement Offer.
If the conditions are not satisfied (or, if permitted, waived) or if a material adverse change occurs in relation to Symbion or the Company prior to Completion, the Proposed Transaction may not proceed on the terms outlined in this Notice of Meeting and Explanatory Memorandum (or at all).
Zuellig Share Issue Upon Completion, The Zuellig Group will be the Company’s largest Shareholder, with control of 40% of the Company’s Shares. The Zuellig Group’s shareholding will result in it having substantial indirect influence over the direction of the Company going forward, with substantial effective control. The Zuellig Group will have the ability to block the passage of special resolutions of Shareholders (which require 75% approval of the votes of those shareholders entitled to vote and voting on the resolution) and will have substantial influence over the election of Directors to the Board. For further information please see page 78 of the Independent Report.
All of the Consideration Shares to be issued to Zuellig in connection with the Proposed Transaction will be on the same terms, and will rank equally with, the Company’s existing Shares, except that Zuellig has agreed to certain restrictions on the sale of the Shares issued to it, which are explained below.
Escrow period for Consideration Shares The Company will enter into a lock-up deed with Zuellig on Completion, pursuant to which Zuellig will unconditionally and irrevocably agree that from Completion until the earlier of 30 September 2014; the release of the Company’s trading results (preliminary announcement) or annual report for the financial year to 30 June 2014 on the NZX Main Board; or the date the Shares cease to be quoted on the NZX Main Board, it will not:
sell, transfer or otherwise dispose of the legal or beneficial ownership of any of the Consideration Shares;
pass control of any voting rights attached to any Consideration Shares to any other person; or
agree to do any of the above,
subject to certain defined exceptions, including:
with the prior written consent of the Board;
to a wholly-owned subsidiary of The Zuellig Group Incorporated, provided that such subsidiary agrees to be bound by the same restrictions;
in connection with the acceptance of an offer for Shares made under the Code;
pursuant to a merger, amalgamation, scheme of arrangement, restructuring or similar transaction;
pursuant to a buyback offer made by, or return of capital effected by, the Company; or
where required by law, an authorisation or any competent authority or where Zuellig reasonably considers the disposition is required to ensure compliance with any law or authorisation applicable to the Consideration Shares.
21
Consideration Shares pledged as security for warranty claims The Company will enter into a Share Pledge Deed with Zuellig on Completion, pursuant to which Zuellig will grant the Company a security interest over 4,667,445 Shares, equating to a value of $40 million at the Theoretical Ex-Rights Price, in order to secure any amounts payable by Zuellig to the Company to satisfy a warranty claim made by the Company under the Share Purchase Agreement in the 18 month period following Completion.
Information on The Zuellig Group Zuellig is a wholly-owned subsidiary of The Zuellig Group Incorporated. Established in 1912, The Zuellig Group is active in the healthcare, agribusiness and agricultural equipment sectors throughout the Asia Pacific region.
The Zuellig Group’s healthcare businesses operate across Asia Pacific and include pharmaceutical distribution and manufacturing, and nutraceutical operations.
The Zuellig Group has an existing New Zealand presence through its investments in Pharmacybrands (New Zealand’s only listed retail pharmacy group) and Norwood (an importer, distributor and retailer of agricultural equipment).
The Proposed Transaction reflects a continuation of the Company’s strong relationship with The Zuellig Group. EBOS acquired PRNZ from The Zuellig Group in 2007 and The Zuellig Group member Elite Investment Holdings Limited currently owns 0.94% of EBOS’ Shares.
Symbion Acquisition Funding The $367 million cash payment to be made by EBOS to Zuellig in part consideration for the Symbion Acquisition will be funded through:
Placement The Company will raise $90 million of new capital by issuing new Shares to institutional and habitual investors (the Placement). The Placement is scheduled to be completed on 7 June 2013, prior to the date of the Special Meeting. The capital raised will be used to partly fund the cash consideration payable to Zuellig for the Symbion Acquisition. The issue price for the Shares to be issued pursuant to the Placement will be $8.50 per Share. The Placement will be fully underwritten by Forsyth Barr Group Limited and UBS New Zealand Limited.
Whyte Adder No 3 Limited and Herpa Properties Limited (both New Zealand companies of which two Directors of EBOS, Peter Kraus and Barry Wallace, are each directors, and therefore both “Related Parties” of EBOS for the purposes of the Listing Rules) will participate in the Placement, on the same terms as other participants.
The Placement is being made pursuant to Listing Rule 7.3.5(a) and does not require Shareholder approval.
If the Symbion Acquisition does not proceed the proceeds of the Placement will be used for general corporate purposes, including, potentially, the reduction of debt and/or the pursuit of other acquisition opportunities.
Entitlement Offer The Company will raise $149 million of new capital by conducting a 7 for 20 pro-rata renounceable entitlement offer, at an issue price of $6.50 per Share, incorporating an oversubscription facility in respect of unexercised entitlements (together, the Entitlement Offer). The capital raised will be used to partly fund the cash consideration payable to Zuellig for the Symbion Acquisition. The Entitlement Offer will be fully underwritten by Forsyth Barr Group Limited and UBS New Zealand Limited, with sub-underwriting being provided by, among others, Whyte Adder No 3 Limited and
22
Herpa Properties Limited, of which EBOS Directors Peter Kraus and Barry Wallace are each directors. The Entitlement Offer will not proceed if the Symbion Acquisition is not approved by Shareholders. The Entitlement Offer will be open to Eligible Shareholders (being New Zealand and Australian resident EBOS Shareholders as at 5:00 p.m. on the Entitlement Offer Record Date (scheduled for 14 June 2013)).
The entitlements will be renounceable and EBOS will be making application to NZX for the entitlements to be tradable.
NZ Eligible Shareholders who apply to take up their full entitlement will be permitted to apply for additional new EBOS Shares (at a price of $6.50 per Share), being those Shares not taken up under the Entitlement Offer by other EBOS Shareholders (the Oversubscription Facility).
In the event that demand for Shares under the Entitlement Offer exceeds supply (due to the Oversubscription Facility), applications for Shares under the Oversubscription Facility will be scaled on a pro rata basis in accordance with the size of the Eligible Shareholders’ respective shareholdings at the Entitlement Offer Record Date, with a scaling preference given to small Shareholders holding less than a “Minimum Holding” (as that term is defined in the Listing Rules) of EBOS Shares.
Any entitlements not taken up through the Oversubscription Facility will be taken up by the Underwriters, at the application price.
Allocations under the Entitlement Offer (including under the Oversubscription Facility) will in all cases be subject to EBOS’ right to limit the allotment of new Shares to any person when that allotment may result in that person materially increasing their ability to exercise, or direct the exercise of, effective control of EBOS (causing Listing Rule 7.5.1 to be triggered), when Listing Rule 9.2.1 (relating to related party transactions) could be triggered by such allotment, or where such allotment would breach the Code.
The Entitlement Offer is being made pursuant to Listing Rule 7.3.4(a) and does not require Shareholder approval. A simplified disclosure prospectus prepared in accordance with the Securities Act and the Securities Regulations and describing the Entitlement Offer in more detail (including the risks associated with the investment and instructions and an application form to enable Shareholders to accept their entitlement) will be sent to Shareholders on or about 17 June 2013, provided Shareholders vote to proceed with the Proposed Transaction.
Debt Financing To provide further funding for the cash consideration payable to Zuellig for the Symbion Acquisition, EBOS intends to extend its existing debt facilities by $140 million (the Debt Financing). Symbion’s existing debt facilities will be assumed by EBOS and either extended in their current form or rolled into EBOS’ facilities.
The Company has received from its banks a credit-approved term sheet in respect of the Debt Financing, with final binding documentation being negotiated as of the date of this Notice of Meeting and Explanatory Memorandum.

23
Summary of Acquisition Funding The funding for the Symbion Acquisition can be summarised as follows:
SOURCES NZ$ million
Equity issued to Zuellig* $498
New equity raised (Placement and Entitlement Offer) $239
Roll-over of Symbion debt facility $230
Extension of debt facility $140
Total sources $1,107
USES
Acquisition of Symbion equity $865
Roll-over of Symbion debt facility $230
Transaction costs $12
Total uses $1,107
* For the avoidance of doubt, Shares of this value (valued at the Theoretical Ex-Rights Price) will be issued to Zuellig in part consideration for the Symbion Acquisition; such Shares will not be issued for cash.
Bonus Issue The Company will issue 2 new Shares to Shareholders for every 53 Shares held by Shareholders (the Bonus Issue) as of the Bonus Issue Record Date (scheduled for 6 June 2013). The Company is undertaking the Bonus Issue to ensure that its existing Shareholders have the benefit of its accumulated imputation credits, which would otherwise be lost as a result of the implementation of the Proposed Transaction. The Placement will be timed such that the Shares issued pursuant to the Placement will not participate in the Bonus Issue.
The Bonus Issue is being made pursuant to Rule 7.3.4(b) and does not require Shareholder approval.
Other material terms of the Share Purchase Agreement In addition to the matters noted above, set out below is a summary of other material terms of the Share Purchase Agreement:
The Company is prohibited from issuing or agreeing to issue any new Shares, granting any options or other rights for the issue of new Shares and/or granting any securities which are convertible into new Shares for two years from Completion, unless the Company notifies Zuellig in advance and either:
Zuellig is provided with an opportunity to participate in the issue on the same terms as other participants and on a basis that would enable The Zuellig Group to maintain the same percentage shareholding in EBOS as it held immediately prior to the issue, in compliance with all applicable laws (including the Code); or
all of the Company’s Directors at the time unanimously approve the issue.

24
The above restrictions automatically cease to apply if The Zuellig Group holds less than 20% of the Company’s Shares. Similar prohibitions apply to the Company undertaking any buy-back or cancellation of Shares, provided that the prohibition shall apply indefinitely with respect to any buy-back or cancellation that would cause Zuellig to breach the Code’s fundamental rule, regardless of whether The Zuellig Group at any time holds less than 20% of the Company’s Shares.
The Company’s dividend reinvestment plan will be amended to enable Zuellig to take up Shares under that plan on a basis that would enable Zuellig to avoid dilution of The Zuellig Group shareholding.
For so long as The Zuellig Group holds at least 25% of the Company’s Shares, the Company must not effect an “overseas investment in sensitive land”, as that term is used in the Overseas Investment Act 2005, without Zuellig approval. However, the Company can make such an investment if the Board unanimously agrees.
Zuellig agrees to reimburse the Company (or the wholly-owned subsidiary which purchases the Shares in Symbion) for trading losses in APHS Packaging Pty Limited, a wholly-owned subsidiary of Symbion, during the period from Completion until 30 June 2015, on the basis that the trading losses will be calculated as EBITDA for each 12 month period ending 30 June 2014 and 30 June 2015, provided that such EBITDA for each year is less than zero (multiplied by 0.7), with a cap of $3m in aggregate.
The Share Purchase Agreement contains standard warranties and indemnities from Zuellig as seller in favour of the Company and from the Company as issuer of the Consideration Shares in favour of Zuellig. The warranties and indemnities are subject to certain time and monetary limitations.

25
5. NOTICE OF SPECIAL MEETING OF SHAREHOLDERS
Notice is given that a special meeting of the Shareholders of EBOS Group Limited (the Company or EBOS) will be held at the Great Hall, Chateau on the Park, corner Deans Avenue & Kilmarnock Street, Christchurch on 14 June 2013 at 10:00 a.m..
BUSINESS
The business of the meeting will be to consider and, if thought fit, pass the following Resolutions (passage of Resolutions 1, 2, 3, 4 and 6 are inter-conditional, such that all must be passed in order for any of them to be effective, reflecting the fact that passage of each of these Resolutions is a condition precedent to the Symbion Acquisition):
Approval of the acquisition of Symbion
Resolution 1: As a special resolution (being a major transaction in terms of section 129 of the Companies Act 1993 (the Act)):
“That the Shareholders ratify, confirm and approve, including for the purposes of section 129(1) of the
Act and NZSX Listing Rule 9.1.1, the acquisition, by the Company or a wholly-owned subsidiary of the
Company, of all the shares of Zuellig Healthcare Holdings Australia Pty Limited (the Symbion
Acquisition), as more particularly described in the Notice of Meeting and Explanatory Memorandum, and
that the Directors be authorised to take all actions, do all things and execute all necessary documents
and agreements necessary or considered by them to be expedient to give effect to the Symbion
Acquisition.”
Approval of the issue of EBOS Shares to Zuellig
Resolution 2: As an ordinary resolution:
“That the Shareholders approve, including for the purposes of Rule 7(d) of the Takeovers Code, NZSX
Listing Rule 7.3.1(a) and all relevant provisions of the Company’s Constitution, the issue to Symbion
Holdings Pte Limited, on completion of, and in part consideration for, the Symbion Acquisition described
in Resolution 1, of 58,126,842 fully paid, ordinary shares in the Company, as more particularly described
in the Notice of Meeting and Explanatory Memorandum, and that the Directors be authorised to take all
actions, do all things and execute all necessary documents and agreements necessary or considered by
them to be expedient to effect such issuance.”
Resolution 2 will only be considered if Resolution 1 is passed.
Approval of the appointment of additional Directors
Resolution 3: As an ordinary resolution:
“That the Shareholders approve the appointment of Peter Williams as a Director of the Company on and
from completion of the Symbion Acquisition.”
Resolution 4: As an ordinary resolution:
“That the Shareholders approve the appointment of Stuart McGregor as a Director of the Company on
and from completion of the Symbion Acquisition.”
Resolutions 3 and 4 will only be considered if Resolutions 1 and 2 are passed.

26
Approval of change to Director remuneration
Resolution 5: As an ordinary resolution:
“That the Shareholders approve, pursuant to NZSX Listing Rule 3.5.1, an increase of $450,000 in total
Non-Executive Director remuneration, from $525,000 per annum to $975,000 per annum, with effect
from the financial year commencing 1 July 2013.”
Resolution 5 will only be considered if Resolutions 1, 2, 3 and 4 are passed.
Approval of amendments to the Company’s constitution
Resolution 6: As a special resolution:
“That the Shareholders approve the amendments to the Company’s Constitution specified in Appendix
One to the Notice of Meeting and Explanatory Memorandum, with effect from the passage of this
resolution.”
Resolution 6 will only be considered if Resolutions 1, 2, 3 and 4 are passed.
Summary of Independent Report The Company has commissioned Northington Partners to prepare an Independent Report on the merits of the Zuellig Share Issue for the purposes of Listing Rule 6.2.2 and Rule 18 of the Code and to opine on the merits of the Proposed Transaction generally.
Northington Partners concluded in their Independent Report that “the purchase price of $865m [for Symbion] sits approximately 15% below the mid-point of our valuation range“. They conclude that the purchase price is attractive from EBOS’ point of view.
The conclusions of the Independent Adviser & Appraiser should be read in the context of the full Independent Report. A copy of the Independent Report accompanies this Notice of Meeting and Explanatory Memorandum.
Directors’ Recommendation to Approve the Resolutions The EBOS Board fully supports the Proposed Transaction and unanimously recommends that Shareholders vote in favour of the Resolutions.
Each Director has indicated that they will be voting the Shares they hold or control in favour of the Resolutions (to the extent permitted).
Voting and Proxies You may exercise your right to vote at the special meeting either by being present in person, by appointing a proxy to attend and vote in your place, or by post. A voting/proxy form is enclosed with this notice. If you wish to vote by proxy or by post you must complete the form and produce it to the Company so as to be received no later than 10:00 a.m. on Wednesday, 12 June 2013. Dennis Doherty has been authorised by the Board to receive and count postal votes.
A proxy need not be a Shareholder of the Company. You may direct your proxy how to vote, or give your proxy discretion to vote as he or she sees fit. If you wish to give your proxy such discretion you should mark the appropriate box on the proxy form accordingly. If you do not mark any box then your proxy may vote or abstain from voting as he or she sees fit.

27
The Chairman of the Company is willing to act as proxy. If you appoint the Chairman as proxy but do not direct him how to vote on any particular matter then the Chairman will vote your Shares in favour of each of the Resolutions.
NZX Waiver NZX has granted EBOS a waiver from Listing Rule 9.2.1 to the extent that it requires Shareholder approval of the Placement and the sub-underwriting of the Entitlement Offer. Such approval would otherwise have been required due to the participation of Whyte Adder No 3 Limited and Herpa Properties Limited (both New Zealand companies of which two Directors of EBOS, Peter Kraus and Barry Wallace, are each directors, and therefore both “Related Parties” of EBOS for the purposes of the Listing Rules) as sub-underwriters of the Entitlement Offer and participants in the Placement. In the absence of this waiver, both sub-underwriters, and certain associated persons, would have been precluded from voting on the Resolutions to approve the Symbion Acquisition, on the basis that the sub-underwriting forms one of a related series of transactions, of which the Symbion Acquisition is part. Accordingly, both sub-underwriters, and their associates, will be permitted to vote on all Resolutions, other than Resolution 5 (see note 3 below).
By order of the Board
Dennis Doherty Chief Financial Officer and Company Secretary Christchurch New Zealand
29 May 2013
Notes:
1 Resolutions 1 and 6 are special resolutions, each requiring for passage a 75% majority of the votes of the Shareholders entitled to vote and voting on that Resolution. The remainder of the Resolutions are ordinary resolutions, each requiring for passage a simple majority of the votes of the Shareholders entitled to vote and voting on that Resolution.
2 Associates (as that term is defined in the Takeovers Code) and Associated Persons (as that term is defined in the Listing Rules) of The Zuellig Group (including Elite Investment Holding Limited) may not vote on Resolution 2. However, each such person may be appointed as a proxy by another person who is not disqualified from voting, to vote in accordance with the express instructions of that other person.
3 Under Listing Rule 9.3.1, the Non-Executive Directors (being all of the Directors other than Mark Waller) and their Associated Persons (as that term is defined in the Listing Rules) are precluded from voting in respect of Resolution 5. This does not however prevent a Non-Executive Director who has been appointed as a proxy or voting representative by another person who is not disqualified from voting, or an Associated Person of such a Non-Executive Director, from voting in respect of the Shares held by that other person in accordance with the express instructions of that other person.

28
6. EXPLANATION OF THE RESOLUTIONS AND ADDITIONAL INFORMATION
Background The purpose of the Special Meeting is to consider and, if thought fit, to approve resolutions:
approving the Symbion Acquisition;
approving the Zuellig Share Issue;
approving the appointment of Zuellig nominees Peter Williams and Stuart McGregor as additional EBOS Directors;
approving an increase in total Non-Executive Director remuneration from $525,000 per annum to $975,000 per annum with effect from the financial year commencing 1 July 2013; and
approving certain amendments to the Company’s Constitution, which will permit the Company to apply to list its Shares on the ASX, as it has agreed to do.
Summaries of the Symbion Acquisition and the Zuellig Share Issue are set out in the earlier sections of this document.
Why are the Resolutions required? Resolution 1 – Approval of the Symbion Acquisition The Symbion Acquisition is a major transaction for the purposes of section 129 of the Companies Act 1993 (the Act), and accordingly requires Shareholder approval (by special resolution) under the Act and under Listing Rule 9.1.1. A special resolution is passed if 75% of the Shares of Shareholders entitled to vote and voting on the resolution are voted in favour of the resolution.
The Board’s views on the merits of the Symbion Acquisition, which are relevant to each of the Resolutions which Shareholders are being asked to vote on, are set out in the earlier sections of this document.
Companies Act For the purposes of the Act, a major transaction includes the acquisition of, or an agreement to acquire, assets the value of which is more than half the value of the company’s assets before the acquisition. A major transaction also includes a transaction that has, or is likely to have, the effect of the company incurring obligations or liabilities the value of which is more than half of the value of the company’s assets before the transaction.
In the Company’s view, the market value of the assets it is to acquire pursuant to the Symbion Acquisition (being the shares in Symbion), and the value of the obligation it is incurring to pay Zuellig the purchase price for the Symbion Acquisition (being $865 million, plus the assumption of $230 million of Symbion debt), are each clearly more than half the market value of the Company’s assets, meaning approval under section 129 of the Act is required.
Listing Rules Under Listing Rule 9.1.1 a listed issuer must obtain shareholder approval for an acquisition of assets in respect of which the gross value exceeds 50% of the issuer’s Average Market Capitalisation. As at the close of business on 24 May 2013, the last NZX Main Board trading day prior to the printing of this Explanatory Memorandum, EBOS’s Average Market Capitalisation was $518.2 million. As a result Shareholder approval for the acquisition of Symbion is also required under Listing Rule 9.1.1 because the gross value of the assets being acquired exceeds 50% of EBOS’ Average Market Capitalisation.
29
Resolution 2 – Approval of the Zuellig Share Issue Listing Rules Listing Rule 7.3.1 prohibits the Company from issuing equity securities (such as Shares) unless the precise terms and conditions of the specific proposal to issue those equity securities have been approved by separate resolutions (passed by a simple majority of votes) of holders of each class of quoted equity securities whose rights or entitlements could be affected by that issue, and that issue is completed within twelve months after the passing of those resolutions. In this case, the relevant class for the purposes of Listing Rule 7.3.1 is the Company’s Shares.
Under Listing Rule 6.2.2, an issue of equity securities pursuant to Rule 7.3.1 must be accompanied by an appraisal report if the issue is intended or is likely to result in more than 50% of the securities to be issued being acquired by directors or “Associated Persons” (as that term is defined in the Listing Rules) of directors of the issuer. Zuellig is an Associated Person (within the meaning of Listing Rule 1.8) of Peter Williams and Stuart McGregor who, if approved by Shareholders under Resolutions 3 and 4, will become Directors of the Company on Completion of the Symbion Acquisition, and Zuellig will be acquiring all of the securities being issued pursuant to Rule 7.3.1. An appraisal report has therefore been prepared in accordance with the Listing Rules by Northington Partners and accompanies this document. Shareholders should study carefully the Independent Report, which provides details regarding the Zuellig Share Issue.
The Takeovers Code Rule 6 of the Code contains the fundamental rule, part of which provides that a person (including its associates) who holds less than 20% of the voting rights in a code company may not become the holder of controller of an increased percentage of the voting rights resulting in that person and its associates holding or controlling more than 20% of the voting rights (the Fundamental Rule) unless that person does so under an exception contained in Rule 7 of the Code. EBOS is a code company (as defined in the Code).
Elite Investment Holding Limited, an associate of Zuellig, currently holds 0.94% of the voting rights in the Company. The Zuellig Share Issue will, if approved, result in Zuellig and its associates holding or controlling 40% of the voting rights in the Company.
Rule 7 of the Code sets out exceptions to the Fundamental Rule. One of the exceptions is contained in Rule 7(d), which permits the allotment of Shares that would otherwise breach the Fundamental Rule if the allotment is approved by an ordinary resolution of the Company. The Company is seeking Shareholders’ approval (by ordinary resolution) for the Zuellig Share Issue, in accordance with Rule 7(d) of the Code. Elite Investment Holding Limited, as an associate of Zuellig, may not vote on this Resolution.
In accordance with Rule 18 of the Code, the Company’s Directors have obtained an independent adviser’s report from Northington Partners on the merits of the proposed Zuellig Share Issue, having regard to the interests of the Company’s Shareholders (other than Elite Investment Holdings Limited). The Independent Report accompanies this Notice of Meeting and Explanatory Memorandum.
Resolutions 3 and 4 – Approval of the appointment of additional Directors Pursuant to the Share Purchase Agreement, the appointment of two Zuellig nominees, Peter Williams and Stuart McGregor, as Directors of EBOS is a condition precedent to the Symbion Acquisition. Accordingly, Shareholders are being asked to vote on Resolutions to appoint Messrs. Williams and McGregor as EBOS Directors, with effect from Completion.
Resolution 5 – Approval of change to Director remuneration This Resolution is put to Shareholders in accordance with Listing Rule 3.5.1, and expresses the Non-Executive Directors’ remuneration as a monetary sum payable to all such Directors taken

30
together in any financial year. At present the authorised aggregate Non-Executive Directors’ remuneration is $525,000 per annum, as approved by Shareholders at the Company’s October 2010 AGM, while the Directors were paid an aggregate $437,500 in the 2012 financial year. Directors’ fees are not paid to Mark Waller, the Company’s Chief Executive Officer and Managing Director. The proposed increase in aggregate remuneration to $975,000 per annum (an increase of $450,000) reflects the following:
(a) the increased size and scale of the Combined Group following Completion and the consequent increase in workload for the Directors, including in sub-committees;
(b) Non-Executive Directors’ remuneration has not been reviewed since the 2010 AGM;
(c) the proposed addition of two new Australian-based directors to the Board;
(d) the proposed increase is based on advice received from independent third party consultants and is consistent with the remuneration being paid to Non-Executive Directors in other similar sized NZX Main Board listed companies with substantial Australian operations; and
(e) EBOS wishes to offer competitive fees in order to attract and retain the highest quality directors.
For these reasons, the Board considers that the proposed increase in Non-Executive Director remuneration is justified and appropriate. The Board has not yet determined the actual level of the Directors’ aggregate remuneration, should the increase at issue be approved and the Proposed Transaction proceed. Similarly, the issue of Board committee fees remains to be determined.
Resolution 6 – Approval of amendments to the Company’s Constitution Section 32(2) of the Act requires any amendments to the Company’s Constitution to be approved by special resolution of the Company’s Shareholders.
It is a condition precedent to the Share Purchase Agreement (and therefore the Symbion Acquisition) that the Company’s Constitution be amended so as to enable the Board to apply for a listing on ASX, Australia’s principal stock exchange, by the end of this calendar year 2013, although the Board reserves the right to defer an ASX listing if, acting in good faith, all of the Directors of EBOS resolve that to undertake an ASX listing in calendar 2013 is not in the best interests of EBOS. Accordingly, Resolution 6 seeks Shareholder approval to certain amendments to the Constitution which will permit the Company to apply for an ASX listing. The amendments are set out in Appendix One to this document and an explanation of the amendments is set out in Appendix Two.
Takeovers Code disclosures Pursuant to rule 16 of the Code (with sub-paragraphs below corresponding to sub-paragraphs in rule 16), the Company advises as follows:
(a) Symbion Holdings Pte Limited (Zuellig) is the proposed allottee of Shares carrying voting rights, which will be issued to it pursuant to the Zuellig Share Issue.
(b) 58,126,842 new Shares will be allotted to Zuellig. This number represents 52.33% of the aggregate of all existing EBOS voting securities as of the date of this document and the voting securities being allotted. After completion of the allotment Zuellig will hold or control 39.6%, and Zuellig and its associates will hold or control 40%, of EBOS’ total voting securities. To ensure compliance with the Code and the Overseas Investment Act 2005, the Company had been advised that Elite Investment Holdings Limited does not intend to take up its entitlements under the Entitlement Offer.

31
(c) Not applicable (as the voting securities to be allotted are not securities of a body corporate other than the Code company, EBOS).
(d) The voting securities to be allotted (being the Consideration Shares issued pursuant to the Zuellig Share Issue) will be allotted on Completion (on or about 5 July 2013) in part consideration for the Symbion Acquisition and for that purpose are deemed to be issued at $8.57 per Share, being the Theoretical Ex-Rights Price.
(e) The Company’s reasons for the proposed Zuellig Share Issue are described above.
(f) The allotment of the Consideration Shares to Zuellig pursuant to the Zuellig Share Issue, if approved, will be permitted under rule 7(d) of the Code as an exception to rule 6 of the Code.
(g) The Company has been advised by Zuellig that there is no agreement or arrangement (whether legally enforceable or not) that has been, or is intended to be, entered into between Zuellig, on the one part, and any other person on the other part (other than the Share Purchase Agreement, Lock Up Deed, Share Pledge Deed and Deed relating to minority buy-out rights) relating to the acquisition, holding or control of the voting securities to be issued to Zuellig pursuant to the Zuellig Share Issue, or to the exercise of voting rights in the Company. Relevant details of the Share Purchase Agreement (pursuant to the terms of which the Zuellig Share Issue will be made), Lock Up Deed, Share Pledge Deed and Deed relating to minority buy-out rights are set out in this document.
(h) This document is accompanied by an Independent Report from Northington Partners on the merits of the proposed allotment of Shares to Zuellig pursuant to the Zuellig Share Issue. The Independent Report is required by Rule 18 of the Code and Rule 6.2.2(b) of the Listing Rules.
The Directors of EBOS recommend approval of the proposed allotment of the Consideration Shares to Zuellig pursuant to the Zuellig Share Issue, on the grounds that the Zuellig Share Issue, as part of the Symbion Acquisition and the Proposed Transaction, should significantly benefit the Company and its Shareholders, for the reasons outlined in this document (particularly in section 3).
Minority Buy-out Rights Section 110 of the Act may confer minority buy-out rights on Shareholders who vote against the special Resolution to approve the Symbion Acquisition (Resolution 1).
For a Shareholder to exercise those minority buy-out rights, the Shareholder must cast all the votes attached to Shares registered in the Shareholder’s name and having the same beneficial owner against the special Resolution. If the special Resolution is nevertheless passed, to exercise minority buy-out rights such a Shareholder must, within 10 working days of the passing of the special Resolution, give written notice to the Company that the Shareholder requires the Company to purchase the Shareholder’s Shares.
Within 20 working days of receipt of the notice the Board must:
(a) agree to purchase the Shares; or
(b) arrange for some other person to agree to purchase the Shares; or
(c) apply to the court for an order exempting the Company from the obligation to purchase the Shares on the grounds that the purchase would be disproportionately damaging to the

32
Company or that the Company cannot reasonably be required to finance the purchase or it would not be just and equitable to require the Company to purchase the Shares; or
(d) arrange for the special Resolution to be rescinded by special resolution of Shareholders, or decide in the appropriate manner not to take the action concerned, as the case may be.
Written notice of the Board’s decision must be given to the relevant Shareholder(s).
Where the Board agrees to the purchase of the Shares by the Company, it must give notice to the relevant Shareholder(s), within 5 working days after the notice referred to in the preceding paragraph, setting out the price the Board offers to pay for those Shares. That price must be a fair and reasonable price as at the close of business on the day before the Resolution was passed calculated using a default methodology designed to achieve a pro rata portion of the fair and reasonable value of all Shares in the Company adjusted to exclude any fluctuation in the value of all Shares that occurred and that was due to, or in expectation of the Proposed Transaction. Because the buy-out price would not include the value of the Proposed Transaction, the Board considers Shareholders will be disadvantaged if they exercise buy-out rights. The Board may use a different methodology to calculate the fair and reasonable price if using the default methodology would be clearly unfair to the Shareholder or the Company (and in that case the Board must also state in the notice why calculating the price under the default methodology would be clearly unfair).
A Shareholder may object to the price offered by the Board by giving written notice to the Company no later than 10 working days after the date the Board gave notice of the price offered by the Board. If, within that 10 working day period, no objection to the price offered by the Board has been received by the Company, it must, purchase the Shares at the nominated price. If within that 10 working days an objection to the price has been received by the Company, the fair and reasonable price must be submitted to arbitration. The Company must within 5 working days of receiving the objection pay on a provisional basis the price nominated by the Board. The arbitration is to be conducted in accordance with the Arbitration Act 1996. If the price determined by the arbitrator:
(a) exceeds the provisional price paid by the Company, then the arbitrator must order the Company to pay the balance owing to the Shareholder; or
(b) is less than the provisional price paid by the Company, then the arbitrator must order the Shareholder to pay the excess to the Company.
The arbitrator must award interest on any balance payable or excess to be repaid except in exceptional circumstances.
If a balance is owing to the Shareholders the arbitrator may award, in addition to or instead of interest, damages for loss attributable to the shortfall in the initial payment.
If the Board arranges for some other person to agree to purchase the Shares, the provisions set out in the preceding paragraphs will (with all appropriate modifications) apply to the purchase of Shares by such person and, in addition, the Company must indemnify the Shareholder in respect of any losses suffered by the Shareholder by reason of the failure by the person to purchase the Shares at the price nominated or fixed by arbitration, as the case may be.
The Company entered into a Deed relating to minority buy-out rights with Zuellig on or about 28 May 2013, pursuant to which the Company agreed that, if the Company is required to buy-out Shares under section 110 of the Act and proposes to purchase the relevant Shares itself, the Company must:

33
promptly advise Zuellig;
hold the relevant Shares as treasury stock; and
transfer those Shares out of treasury stock within 6 months of purchase.
34
7. GLOSSARY
Act Companies Act 1993
Board The board of Directors of the Company
Bonus Issue The 2 for 53 bonus issue of new Shares to Shareholders on the Bonus Issue Record Date
Bonus Issue Record Date 6 June 2013, unless amended by the Company
CAGR Compound annual growth rate
Code Takeovers Code Approval Order 2000
Combined Group EBOS and its subsidiaries (including Symbion and its subsidiaries)
Company or EBOS EBOS Group Limited
Completion Completion under the Share Purchase Agreement, being completion of the purchase of the shares in Symbion
Consideration Shares The 58,126,842 new Shares to be issued to Zuellig on Completion pursuant to the Share Purchase Agreement
Constitution The Company’s Constitution
Deed relating to minority buy-out rights
The deed relating to minority buy-out rights entered into on or about 28 May 2013 between Zuellig and the Company governing the manner in which the Company will deal with Shares it has agreed to purchase following the exercise of minority buy-out rights under section 110 of the Act
Director A director of EBOS
Directory The directory set out in this Offer Document
DPS Dividends per share
EBITDA Earnings before interest, tax, depreciation and amortisation
Eligible Shareholder Persons who are eligible to participate in the Entitlement Offer, being any person registered as a Shareholder at 5:00 p.m. on the Entitlement Offer Record Date and whose address shown in the Share Register is in New Zealand or Australia
Entitlement Offer The offer by EBOS to Eligible Shareholders of 7 new Shares for every 20 existing Shares held by that Eligible Shareholder on the Entitlement Offer Record Date, pursuant to the Offer Document, and the Oversubscription Facility
Entitlement Offer Record Date
14 June 2013, unless amended by the Company
35
EPS Earnings per share
FY Financial year
Glossary This glossary of terms
Independent Adviser & Appraiser
Northington Partners Limited
Independent Report The combined independent adviser’s report and independent appraisal report by the Independent Adviser & Appraiser, which accompanies this Notice of Meeting and Explanatory Memorandum in Appendix Three
Listing Rules Listing Rules of NZX in relation to the NZX Main Board (or any market in substitution for the market) in force from time to time, read subject to any applicable rulings or waivers
Lock Up Deed The lock up deed to be entered into on Completion between Zuellig and the Company governing Zuellig’s ability to deal with the Consideration Shares
Non-Executive Director A director of EBOS other than the Managing Director, Mark Waller
NZ Eligible Shareholder An Eligible Shareholder whose address shown in the Share Register is in New Zealand
NZX NZX Limited
Offer Document The simplified disclosure prospectus anticipated to be dated 6 June 2013, expected to be sent to Shareholders on or about 17 June 2013
Oversubscription Facility The facility for NZ Eligible Shareholders who take up their full entitlement to be permitted to apply for additional new Shares (at a price of $6.50 per Share), being those Shares not taken up under the Entitlement Offer by other Eligible Shareholders, as more fully described in the Offer Document
Placement The fully underwritten placement to institutional and habitual investors of 10,591,314 Shares at an issue price of $8.50 per Share which is scheduled to take place between 29 and 30 May 2013
Proposed Transaction The Symbion Acquisition, Zuellig Share Issue, Placement, Entitlement Offer and all ancillary and related transactions referred to in this document
Registrar Computershare Investor Services Limited
Resolution(s) The resolution(s) set out in the Notice of Meeting in section 5 of this document

36
Securities Act The Securities Act 1978, as amended from time to time
Securities Regulations The Securities Regulations 2009, as amended from time to time
Shareholder A registered holder of Shares from time to time
Share Pledge Deed The specific security agreement to be entered into on Completion between Zuellig and the Company in respect of some of the Consideration Shares by way of security for the payment by Zuellig of warranty claims under the Share Purchase Agreement
Share Purchase Agreement
The Share Sale and Purchase Agreement for Symbion, entered into between Zuellig and the Company on or about 28 May 2013
Share Register The register of securities of EBOS kept by the Registrar in accordance with section 51(1)(a) of the Securities Act
Shares Fully paid ordinary shares in EBOS of the class quoted on the NZX Main Board
Symbion Zuellig Healthcare Holdings Australia Pty Limited
Symbion Acquisition The purchase by EBOS or one of its wholly-owned subsidiaries of all of the issued share capital of Symbion
Theoretical Ex-Rights Price (TERP)
$8.57 per Share, being the theoretical price of a Share based on EBOS’ market capitalisation at a price of $9.80 (calculated based on the 15 day volume weighted average price to 24 May 2013) per Share adjusted for the cash proceeds of the Placement and Entitlement Offer and the increased number of Shares that will be on issue post the Bonus Issue, Placement and Entitlement Offer
The Zuellig Group The Zuellig Group Incorporated and its subsidiaries
Underwriters Each of Forsyth Barr Group Limited and UBS New Zealand Limited, severally
Voting/Proxy Form The form on which the EBOS Shareholders will vote at the special meeting of EBOS Shareholders, or by post
Zuellig Symbion Holdings Pte Limited
Zuellig Share Issue The issue of the Consideration Shares to Zuellig pursuant to the Share Purchase Agreement
37
APPENDIX ONE: AMENDMENTS TO EBOS’ CONSTITUTION
(a) Inserting the following definitions into clause 1.2 after the definition of Auditor:
ASX means ASX Limited and includes any successor body.
ASX Listing Rules means the listing rules of the ASX and any other rules of the ASX which are applicable while the Company is admitted to the Official List of the ASX, each as amended or replaced from time to time.
(b) Inserting a new clause 1.7 as follows:
1.7 Incorporation of ASX Listing Rules while listed on ASX For so long as the Company is admitted to the Official List of the ASX the following paragraphs apply.
(a) Notwithstanding anything contained in this Constitution, if the ASX Listing Rules
prohibit an act being done, the act must not be done.
(b) Nothing contained in this Constitution prevents an act being done that the ASX
Listing Rules require to be done.
(c) If the ASX Listing Rules require an act to be done or not to be done, authority is
given for that act to be done or not to be done (as the case may be).
(d) If the ASX Listing Rules require this Constitution to contain a provision and it
does not contain such a provision, this Constitution is deemed to contain that
provision.
(e) If the ASX Listing Rules require this Constitution not to contain a provision and it
contains such a provision, this Constitution is deemed not to contain that
provision.
(f) If any provision of this Constitution is or becomes inconsistent with the ASX
Listing Rules, this Constitution is deemed not to contain that provision to the
extent of the inconsistency.

38
APPENDIX TWO: CONSTITUTIONAL AMENDMENTS EXPLANATORY NOTES
Overview To be eligible for admission to the official list of the ASX, a company's constitution must be consistent with the ASX Listing Rules. They require that the constitution contain certain provisions. In order to comply with the ASX Listing Rules, the Company is proposing to amend its Constitution to incorporate (by reference) the ASX Listing Rules into the Constitution for so long as the Company is listed on the official list of the ASX.
Amendment: Incorporation of ASX Listing Rules while listed on ASX The effect of the amendment is to incorporate the ASX Listing Rules into the Constitution by reference, when and for so long as the Company is admitted to the official list of the ASX. The form of the new clauses proposed by this amendment are set out in Appendix One.
The proposed additional provisions are similar to the existing provisions in the Company’s Constitution with respect to the Listing Rules, which provide that, for so long as the Company remains listed on the NZX Main Board, the Constitution is deemed to incorporate all provisions of the Listing Rules required under those provisions.
Similarly, the effect of this proposed amendment is that when and for so long as the Company is admitted to the official list of the ASX, all necessary provisions of the ASX Listing Rules will be incorporated into the Constitution, and to the extent that there is any inconsistency between the ASX Listing Rules and the Constitution, the ASX Listing Rules will prevail.
The application of the Listing Rules to the Company is unaffected by these provisions. If the Company is admitted to the official lists of both the NZX and the ASX, the Company will also be required to comply with the requirements of the ASX Listing Rules. To the extent that the ASX Listing Rules impose additional requirements over the Listing Rules, then the Company is also required to comply with those additional requirements (and vice versa).
If the Company seeks admission to the official list of the ASX, then the practical benefits of adopting these amendments are that:
(a) it will avoid the need to update the Constitution every time the ASX Listing Rules are
changed;
(b) it will avoid the possibility of a conflict between the Constitution and the ASX Listing Rules;
(c) it will result in a shorter and simpler Constitution; and
(d) it should avoid the need to make additional amendments to the Constitution in order for the
Company to be admitted to the official list of the ASX.
Incorporation of these amendments will not impose any new obligations on the Company or Shareholders unless and until the Company is admitted to the official list of the ASX. However, if that does occur, then in order to fully understand the Company’s constitutional obligations and requirements, it will be necessary to refer to both the NZSX Listing Rules and the ASX Listing Rules, as well as the Constitution itself.
39
APPENDIX THREE: INDEPENDENT REPORT
EBOS Group Limited
May 2013May 2013May 2013May 2013
Independent Adviser’s Report
Prepared in Relation to the Proposed Acquisition of SymbiPrepared in Relation to the Proposed Acquisition of SymbiPrepared in Relation to the Proposed Acquisition of SymbiPrepared in Relation to the Proposed Acquisition of Symbionononon
Statement of IndependenceStatement of IndependenceStatement of IndependenceStatement of Independence
Northington Partners Limited confirms that it:
� Has no conflict of interest that could affect its ability to provide an unbiased report; and
� Has no direct or indirect pecuniary or other interest in the proposed transaction considered
in this report, including any success or contingency fee or remuneration, other than to
receive the cash fee for providing this report.
Northington Partners Limited has satisfied the Takeovers Panel, on the basis of the material
provided to the Panel, that it is independent under the Takeovers Code for the purposes of
preparing this report.

EBOS Group Limited – Independent Adviser’s Report Page 1
Table of Contents
Table of Contents
1.01.01.01.0 Executive SummaryExecutive SummaryExecutive SummaryExecutive Summary 5555
1.1 Outline of the Proposed Transaction 5
1.2 Regulatory Requirements 5
1.3 Summary of Our Assessment 6
1.4 Acceptance or Rejection of the Transaction 9
2.02.02.02.0 Transaction Structure and FundingTransaction Structure and FundingTransaction Structure and FundingTransaction Structure and Funding 10101010
2.1 Purchase Price 10
2.2 Summary of Transaction Funding and Proposed Capital Raising Process 10
2.3 Transaction Conditions 17
2.4 Timetable 17
3.03.03.03.0 Profile of SymbionProfile of SymbionProfile of SymbionProfile of Symbion 18181818
3.1 Background 18
3.2 Symbion Pharmacy Services 21
3.3 Symbion Hospital Services 23
3.4 Symbion Retail Services 24
3.5 Symbion Consumer Products 24
3.6 Contract Logistics and Manufacturer Services 25
3.7 Lyppard 25
3.8 Other Symbion Businesses 26
3.9 Group Financial Information 26
3.10 Prospects and Key Business Risks 27
4.04.04.04.0 Profile of EBOSProfile of EBOSProfile of EBOSProfile of EBOS 32323232
4.1 Background 32
4.2 ProPharma 35
4.3 Onelink 36
4.4 Healthcare Logistics 36
4.5 EBOS Healthcare New Zealand 37
4.6 EBOS Healthcare Australia 37
4.7 Masterpet 38
4.8 Capital Structure and Ownership 39
4.9 Share Price Performance and Liquidity 40
4.10 Financial Information 42
4.11 Prospects and Key Business Risks 44

EBOS Group Limited – Independent Adviser’s Report Page 2
Table of Contents
5.05.05.05.0 Profile of EBOS Following the TransactionProfile of EBOS Following the TransactionProfile of EBOS Following the TransactionProfile of EBOS Following the Transaction 46464646
5.1 Market Position 46
5.2 Service Offering and Capability 46
5.3 Pro-forma Financial Information 47
5.4 Market Capitalisation and NZSX Weighting 51
5.5 Board and Management Structure 49
5.6 Post Transaction Financial Metrics 49
6.06.06.06.0 Valuation of SymbionValuation of SymbionValuation of SymbionValuation of Symbion 53535353
6.1 Valuation Summary 53
6.2 Valuation Methodology 53
6.3 Valuation of Symbion 55
7.07.07.07.0 AssAssAssAssessment of the Merits of the Transactionessment of the Merits of the Transactionessment of the Merits of the Transactionessment of the Merits of the Transaction 67676767
7.1 Transaction Purchase Price 67
7.2 Strategic Fit 68
7.3 Financial Implications for EBOS 69
7.4 Funding Impacts 71
7.5 EBOS Control Position 76
7.6 EBOS Risk Profile 79
7.7 Alternative Options 80
7.8 Other Important Impacts of the Transaction 81
7.9 Fairness Assessment 81
Appendix 1: Regulatory Requirements and Scope of this ReportAppendix 1: Regulatory Requirements and Scope of this ReportAppendix 1: Regulatory Requirements and Scope of this ReportAppendix 1: Regulatory Requirements and Scope of this Report 83838383
Appendix 2: Profile of the Australian Pharmaceuticals IAppendix 2: Profile of the Australian Pharmaceuticals IAppendix 2: Profile of the Australian Pharmaceuticals IAppendix 2: Profile of the Australian Pharmaceuticals Industryndustryndustryndustry 86868686
Appendix 3: Comparable Transaction DataAppendix 3: Comparable Transaction DataAppendix 3: Comparable Transaction DataAppendix 3: Comparable Transaction Data 97979797
Appendix 4: Comparable Company DataAppendix 4: Comparable Company DataAppendix 4: Comparable Company DataAppendix 4: Comparable Company Data 98989898
Appendix 5: Financial Comparison of Symbion, Sigma and APIAppendix 5: Financial Comparison of Symbion, Sigma and APIAppendix 5: Financial Comparison of Symbion, Sigma and APIAppendix 5: Financial Comparison of Symbion, Sigma and API 99999999
Appendix 6: Market Evidence for Rights IssuesAppendix 6: Market Evidence for Rights IssuesAppendix 6: Market Evidence for Rights IssuesAppendix 6: Market Evidence for Rights Issues 100100100100
Appendix 7: Sources of Information Used in This ReportAppendix 7: Sources of Information Used in This ReportAppendix 7: Sources of Information Used in This ReportAppendix 7: Sources of Information Used in This Report 101101101101
Appendix 8: Declarations, Qualifications and ConsentsAppendix 8: Declarations, Qualifications and ConsentsAppendix 8: Declarations, Qualifications and ConsentsAppendix 8: Declarations, Qualifications and Consents 102102102102

EBOS Group Limited – Independent Adviser’s Report Page 3
Abbreviations and Definitions
Abbreviations and Definitions
A$A$A$A$ Australian dollars
APHSAPHSAPHSAPHS APHS Packaging Pty Limited
APIAPIAPIAPI Australian Pharmaceutical Industries Limited
ASXASXASXASX The Australian Securities Exchange equity securities market operated by ASX
Limited
Bonus IBonus IBonus IBonus Issuessuessuessue A taxable bonus issue of EBOS shares made to existing shareholders prior to
the Transaction
CodeCodeCodeCode The Takeovers Code
CAGRCAGRCAGRCAGR Compound Annual Growth Rate
ConditionsConditionsConditionsConditions Various conditions (listed in Section 2.3) that must be satisfied before the
Transaction can proceed
CSOCSOCSOCSO Community Service Obligation, being an obligation on certain wholesalers to
supply PBS medicines to pharmacies across Australia (regardless of their
location) in exchange for financial support from a CSO funding pool established
by the Government
EBITEBITEBITEBIT Earnings before Interest and Tax
EBITAEBITAEBITAEBITA Earnings before Interest, Tax, and Amortisation
EBITDAEBITDAEBITDAEBITDA Earnings before Interest, Tax, Depreciation and Amortisation
EBOS or CompanyEBOS or CompanyEBOS or CompanyEBOS or Company EBOS Group Limited
EPSEPSEPSEPS Earnings per share
Ethical ProductsEthical ProductsEthical ProductsEthical Products Pharmaceutical products that can only be sold with a prescription.
FYFYFYFY Financial Year
HospitalHospitalHospitalHospital Symbion Hospital Services, the second largest division of Symbion, being a
business unit involved in the wholesaling and distribution of pharmaceutical
products to Australian hospitals, day surgeries and other health agencies
LyppardLyppardLyppardLyppard Lyppard Australia Pty Ltd, a national veterinary wholesaler distributing a wide
range of products to veterinary clinics across Australia
MasterpetMasterpetMasterpetMasterpet Masterpet Corporation Limited, a business involved in sales, marketing and
distribution of pet care brands to customers in New Zealand and Australia
nmnmnmnm In respect of graphs and other diagrams in this report means “not meaningful”
Northington PartnersNorthington PartnersNorthington PartnersNorthington Partners Northington Partners Limited
Notice of MeetingNotice of MeetingNotice of MeetingNotice of Meeting The notice of special meeting required to be sent to EBOS shareholders in
relation to the Transaction
NPATNPATNPATNPAT Net Profit After Tax
NZ$NZ$NZ$NZ$ New Zealand dollars
NZSXNZSXNZSXNZSX The NZX Main Board equity securities market operated by NZX Limited
OTC ProductsOTC ProductsOTC ProductsOTC Products Non-ethical “over the counter” pharmaceutical products
PBSPBSPBSPBS Pharmaceutical Benefits Scheme, being a Commonwealth Government
scheme that subsidies the cost of PBS-listed prescription only medicines in
Australia

EBOS Group Limited – Independent Adviser’s Report Page 4
Abbreviations and Definitions
Abbreviations and Definitions (Continued)
PHARMACPHARMACPHARMACPHARMAC Pharmaceutical Management Agency, an entity tasked with securing universal
and affordable access to essential pharmaceuticals to the public of New
Zealand
PharmacyPharmacyPharmacyPharmacy Symbion Pharmacy Services, a full-line wholesale business involved in the
distribution of pharmaceutical products to pharmacies throughout Australia
(and the largest division of Symbion)
PrePrePrePre----Transaction PlacementTransaction PlacementTransaction PlacementTransaction Placement A placement of EBOS shares to new and existing institutional investors
(approximately NZ$90 million) prior to the Transaction being completed
Purchase PricePurchase PricePurchase PricePurchase Price NZ$865 million, for 100% of the shares on issue in ZHHA
Rights IssueRights IssueRights IssueRights Issue A pro-rata renounceable rights issue to all existing EBOS shareholders
(approximately NZ$149 million), subject to the Transaction first being approved
by EBOS shareholders at a special meeting
SigmaSigmaSigmaSigma Sigma Pharmaceuticals Limited
SymbionSymbionSymbionSymbion Symbion Pty Limited, the operating subsidiary of ZHHA
TERPTERPTERPTERP Theoretical Ex-Rights Price
TransactionTransactionTransactionTransaction The purchase by EBOS of all shares in ZHHA (and indirectly the Symbion
business)
VWAPVWAPVWAPVWAP Volume Weighted Average Share Price
ZHHAZHHAZHHAZHHA Zuellig Healthcare Holdings Australia Pty Limited, the ultimate Australian
domiciled legal owner of Symbion
ZuelligZuelligZuelligZuellig The Zuellig Group Incorporated (and where the context requires, its
subsidiaries), a family owned group which is active in the healthcare and
agribusiness sectors in the Asia Pacific region
Zuellig Share AllotmentZuellig Share AllotmentZuellig Share AllotmentZuellig Share Allotment The issue of fully paid ordinary shares in EBOS to Zuellig such that Zuellig will
hold 40% of the total shares on issue in EBOS when the Transaction is
completed

EBOS Group Limited – Independent Adviser’s Report Page 5
Executive Summary
1.0 Executive Summary
1.1 Outline of the Proposed Transaction
EBOS Group Limited (“EBOSEBOSEBOSEBOS” or “CompanyCompanyCompanyCompany”) is a public company listed on the NZX Main Board equity
securities market operated by NZX Limited (“NZNZNZNZSSSSXXXX”). EBOS distributes medical and surgical products,
pharmaceuticals and animal healthcare supplies throughout New Zealand, Australia and the Pacific
Islands. Further details on EBOS are set out in Section 4.0.
Symbion Pty Limited (“SymbionSymbionSymbionSymbion”) is a privately owned company based in Australia. It is currently owned
by the Zuellig Group (“ZuelligZuelligZuelligZuellig”), a family owned business active in the healthcare and agribusiness
sectors in the Asia Pacific region. Symbion’s principal business involves the supply of pharmaceuticals
and medical products to pharmacies and hospitals across Australia, as well as the distribution of
veterinary supplies. Further details on Symbion are set out in Section 3.0.
EBOS and Zuellig have reached a conditional agreement for EBOS to acquire Symbion (the
“TransactionTransactionTransactionTransaction”). The Transaction will be effected by EBOS purchasing 100% of the shares in Zuellig
Healthcare Holdings Australia Pty Limited (“ZHHAZHHAZHHAZHHA”), being the ultimate Australian domiciled Zuellig
subsidiary that wholly owns Symbion. A summary of the Transaction is presented in Table 1, with more
details on the proposed Transaction structure and funding set out in Section 2.0.
Table Table Table Table 1111: Summary of Transaction: Summary of Transaction: Summary of Transaction: Summary of Transaction
ComponentComponentComponentComponent Agreed TermAgreed TermAgreed TermAgreed Term
Purchase Price for
the Transaction
NZ$865 million, for 100% of the ZHHA shares on issue (“Purchase PricePurchase PricePurchase PricePurchase Price”)
Consideration Paid to
Zuellig
The Purchase Price will be paid to Zuellig via two components:
� The issue of fully paid ordinary shares in EBOS (“Zuellig Share AllotmentZuellig Share AllotmentZuellig Share AllotmentZuellig Share Allotment”), such that
Zuellig will hold 40% of the total shares on issue in EBOS when the Transaction is
completed (with value currently estimated at approximately NZ$498 million).
� A cash payment to make up the balance of the Purchase Price (approximately NZ$367
million).
Funding Sources EBOS will use the following sources to fund the cash component of the Purchase Price and pay
for transaction costs of approximately NZ$12 million:
� A placement of EBOS shares to new and existing institutional investors (approximately
NZ$90 million) (“PrePrePrePre----Transaction PlacementTransaction PlacementTransaction PlacementTransaction Placement”).
� A pro-rata renounceable rights issue to existing EBOS shareholders, including those
issued shares in the Pre-Transaction Placement (approximately NZ$149 million) (“Rights Rights Rights Rights
IssueIssueIssueIssue”).
� An increase in EBOS’ debt facility (approximately NZ$140 million).
Source: EBOS
1.2 Regulatory Requirements
The Transaction is a “major transaction” for the purposes of section 129 of the Companies Act 1993
(“Companies ActCompanies ActCompanies ActCompanies Act”) and accordingly requires shareholder approval (by special resolution) under the
Companies Act1.
1 We note that the Companies Act may confer minority buy-out rights on an EBOS shareholder who votes against the special resolution to approve the Transaction, whereby such a shareholder may give written notice to EBOS requiring it to purchase that shareholder’s shares. Further details on minority buy-out rights are set out in the Notice of Meeting that will be sent to EBOS shareholders in relation to the Transaction.
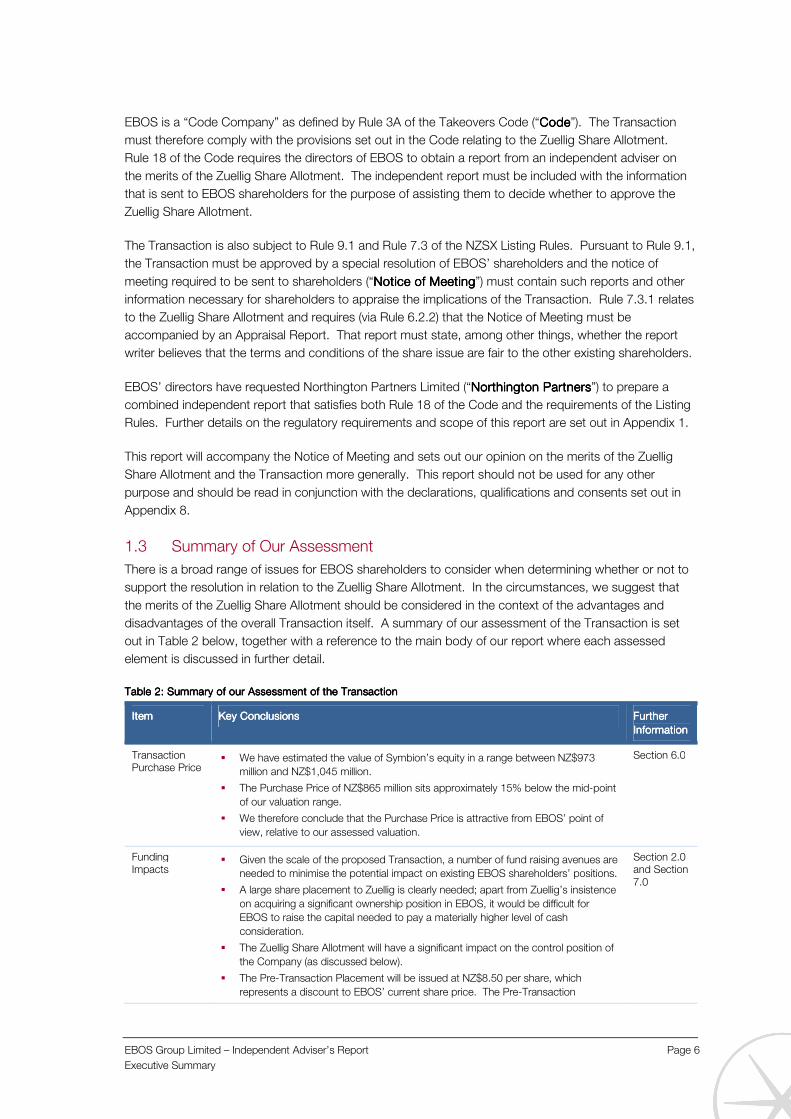
EBOS Group Limited – Independent Adviser’s Report Page 6
Executive Summary
EBOS is a “Code Company” as defined by Rule 3A of the Takeovers Code (“CodeCodeCodeCode”). The Transaction
must therefore comply with the provisions set out in the Code relating to the Zuellig Share Allotment.
Rule 18 of the Code requires the directors of EBOS to obtain a report from an independent adviser on
the merits of the Zuellig Share Allotment. The independent report must be included with the information
that is sent to EBOS shareholders for the purpose of assisting them to decide whether to approve the
Zuellig Share Allotment.
The Transaction is also subject to Rule 9.1 and Rule 7.3 of the NZSX Listing Rules. Pursuant to Rule 9.1,
the Transaction must be approved by a special resolution of EBOS’ shareholders and the notice of
meeting required to be sent to shareholders (“Notice of MeetinNotice of MeetinNotice of MeetinNotice of Meetingggg”) must contain such reports and other
information necessary for shareholders to appraise the implications of the Transaction. Rule 7.3.1 relates
to the Zuellig Share Allotment and requires (via Rule 6.2.2) that the Notice of Meeting must be
accompanied by an Appraisal Report. That report must state, among other things, whether the report
writer believes that the terms and conditions of the share issue are fair to the other existing shareholders.
EBOS’ directors have requested Northington Partners Limited (“Northington PartnersNorthington PartnersNorthington PartnersNorthington Partners”) to prepare a
combined independent report that satisfies both Rule 18 of the Code and the requirements of the Listing
Rules. Further details on the regulatory requirements and scope of this report are set out in Appendix 1.
This report will accompany the Notice of Meeting and sets out our opinion on the merits of the Zuellig
Share Allotment and the Transaction more generally. This report should not be used for any other
purpose and should be read in conjunction with the declarations, qualifications and consents set out in
Appendix 8.
1.3 Summary of Our Assessment
There is a broad range of issues for EBOS shareholders to consider when determining whether or not to
support the resolution in relation to the Zuellig Share Allotment. In the circumstances, we suggest that
the merits of the Zuellig Share Allotment should be considered in the context of the advantages and
disadvantages of the overall Transaction itself. A summary of our assessment of the Transaction is set
out in Table 2 below, together with a reference to the main body of our report where each assessed
element is discussed in further detail.
Table Table Table Table 2222: Summary of our Assessment of the Transaction: Summary of our Assessment of the Transaction: Summary of our Assessment of the Transaction: Summary of our Assessment of the Transaction
ItemItemItemItem Key ConclusionsKey ConclusionsKey ConclusionsKey Conclusions Further Further Further Further
InformationInformationInformationInformation
Transaction Purchase Price
� We have estimated the value of Symbion’s equity in a range between NZ$973
million and NZ$1,045 million.
� The Purchase Price of NZ$865 million sits approximately 15% below the mid-point
of our valuation range.
� We therefore conclude that the Purchase Price is attractive from EBOS’ point of
view, relative to our assessed valuation.
Section 6.0
Funding Impacts
� Given the scale of the proposed Transaction, a number of fund raising avenues are
needed to minimise the potential impact on existing EBOS shareholders’ positions.
� A large share placement to Zuellig is clearly needed; apart from Zuellig’s insistence
on acquiring a significant ownership position in EBOS, it would be difficult for
EBOS to raise the capital needed to pay a materially higher level of cash
consideration.
� The Zuellig Share Allotment will have a significant impact on the control position of
the Company (as discussed below).
� The Pre-Transaction Placement will be issued at NZ$8.50 per share, which
represents a discount to EBOS’ current share price. The Pre-Transaction
Section 2.0 and Section 7.0

EBOS Group Limited – Independent Adviser’s Report Page 7
Executive Summary
ItemItemItemItem Key ConclusionsKey ConclusionsKey ConclusionsKey Conclusions Further Further Further Further
InformationInformationInformationInformation
Placement will therefore have the effect of diluting (reducing) the share price from
its current (Pre-Transaction Placement) level. The discount of approximately 10%2
is towards the top end of recent evidence from other placements and block
trades, but the “cost” appears reasonable in the broader context of the transaction
benefits.
� The Rights Issue will in theory protect existing shareholders’ positions on the basis
that those who choose not to participate in the capital raising will be able to
capture value from selling their rights entitlements. There is however no guarantee
that the rights will trade at a level which fully reflects the anticipated discount
between the intrinsic value of EBOS’ shares and the issue price.
� Overall, we conclude that the Transaction’s proposed funding structure is
reasonable and that there are no obvious alternatives. Given the scale of the
capital requirement, there will be some negative consequences for existing
shareholders (e.g. potential dilution and the impact on the control position of the
Company) but these should not be viewed in isolation – the implicit costs need to
be balanced against the benefits of the Transaction.
Financial Implications for EBOS
� EBOS expects that the Transaction will increase earnings per share (“EPSEPSEPSEPS”) by
approximately 30% (on a pro-forma basis to June 2013).
� There is some potential for further moderate growth in the medium term, including
through expected revenue and cost synergies which are not factored into the
current earnings projections.
� The scope for incremental earnings and dividend growth should be greater
assuming the Transaction is completed (compared to the status quo).
Section 5.0 and Section 7.0
EBOS Control Position
� The Transaction will result in EBOS moving from having a relatively open share
register with no shareholder (together with its associates) holding more than 8.5%
of the shares on issue, to a position with a substantial cornerstone shareholder.
� Zuellig’s 40% shareholding position could provide it with effective control over the
Company and put it in a position to pass ordinary resolutions. Zuellig will also be
able to block special resolutions of the Company.
� However, there is no reason to believe that Zuellig’s interests will not be aligned
with those of the minority shareholders and its position as the cornerstone
shareholder in EBOS may actually provide some benefits.
� We believe that Zuellig is a stable cornerstone shareholder. Apart from the escrow
arrangement which prevents Zuellig from selling any of its EBOS shares until the
FY2014 results are announced, the current expectation is that Zuellig will remain as
a long term investor in the Company.
Section 7.0
Strategic Fit � The Symbion business is clearly well aligned with EBOS and there is a significant
cross-over in terms of sector exposure.
� This should help to ensure that post-Transaction integration issues are minimised,
that the existing executive team is well placed to manage the business, and that
there should be opportunities to extract some revenue and cost synergies in the
medium term.
� We also note that EBOS management has built a strong track record of sourcing
and implementing value-enhancing acquisitions. While the Symbion acquisition is
clearly far larger than previous transactions, the process is effectively the same.
Section 5.0 and Section 7.0
EBOS Risk Profile
� Symbion’s business is exposed to a moderate level of Australian regulatory risk,
and the on-going impact of previously enacted reforms is somewhat uncertain.
� Although EBOS is also exposed to a number of regulatory risks, EBOS has shown
the ability to adapt to key structural changes in the New Zealand context.
� The Transaction should effectively de-risk the current EBOS operations in Australia
by establishing EBOS as a market leader in its core sectors, with the scale needed
to compete effectively.
Section 3.10, Section 4.11 and Section 7.0
2 Compared to the theoretical share price after allowing for the impact of the pre-Transaction bonus issue (see Section 2.2.2 for further details).
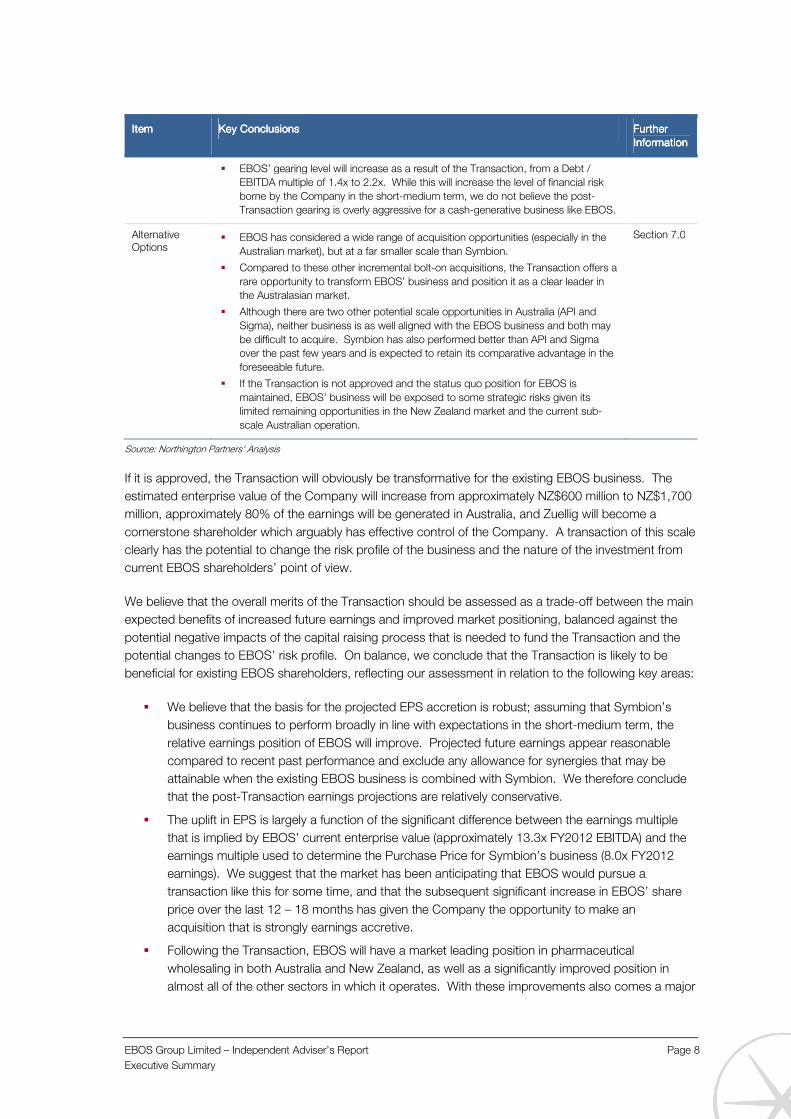
EBOS Group Limited – Independent Adviser’s Report Page 8
Executive Summary
ItemItemItemItem Key ConclusionsKey ConclusionsKey ConclusionsKey Conclusions Further Further Further Further
InformationInformationInformationInformation
� EBOS’ gearing level will increase as a result of the Transaction, from a Debt /
EBITDA multiple of 1.4x to 2.2x. While this will increase the level of financial risk
borne by the Company in the short-medium term, we do not believe the post-
Transaction gearing is overly aggressive for a cash-generative business like EBOS.
Alternative Options
� EBOS has considered a wide range of acquisition opportunities (especially in the
Australian market), but at a far smaller scale than Symbion.
� Compared to these other incremental bolt-on acquisitions, the Transaction offers a
rare opportunity to transform EBOS’ business and position it as a clear leader in
the Australasian market.
� Although there are two other potential scale opportunities in Australia (API and
Sigma), neither business is as well aligned with the EBOS business and both may
be difficult to acquire. Symbion has also performed better than API and Sigma
over the past few years and is expected to retain its comparative advantage in the
foreseeable future.
� If the Transaction is not approved and the status quo position for EBOS is
maintained, EBOS’ business will be exposed to some strategic risks given its
limited remaining opportunities in the New Zealand market and the current sub-
scale Australian operation.
Section 7.0
Source: Northington Partners' Analysis
If it is approved, the Transaction will obviously be transformative for the existing EBOS business. The
estimated enterprise value of the Company will increase from approximately NZ$600 million to NZ$1,700
million, approximately 80% of the earnings will be generated in Australia, and Zuellig will become a
cornerstone shareholder which arguably has effective control of the Company. A transaction of this scale
clearly has the potential to change the risk profile of the business and the nature of the investment from
current EBOS shareholders’ point of view.
We believe that the overall merits of the Transaction should be assessed as a trade-off between the main
expected benefits of increased future earnings and improved market positioning, balanced against the
potential negative impacts of the capital raising process that is needed to fund the Transaction and the
potential changes to EBOS’ risk profile. On balance, we conclude that the Transaction is likely to be
beneficial for existing EBOS shareholders, reflecting our assessment in relation to the following key areas:
� We believe that the basis for the projected EPS accretion is robust; assuming that Symbion’s
business continues to perform broadly in line with expectations in the short-medium term, the
relative earnings position of EBOS will improve. Projected future earnings appear reasonable
compared to recent past performance and exclude any allowance for synergies that may be
attainable when the existing EBOS business is combined with Symbion. We therefore conclude
that the post-Transaction earnings projections are relatively conservative.
� The uplift in EPS is largely a function of the significant difference between the earnings multiple
that is implied by EBOS’ current enterprise value (approximately 13.3x FY2012 EBITDA) and the
earnings multiple used to determine the Purchase Price for Symbion’s business (8.0x FY2012
earnings). We suggest that the market has been anticipating that EBOS would pursue a
transaction like this for some time, and that the subsequent significant increase in EBOS’ share
price over the last 12 – 18 months has given the Company the opportunity to make an
acquisition that is strongly earnings accretive.
� Following the Transaction, EBOS will have a market leading position in pharmaceutical
wholesaling in both Australia and New Zealand, as well as a significantly improved position in
almost all of the other sectors in which it operates. With these improvements also comes a major

EBOS Group Limited – Independent Adviser’s Report Page 9
Executive Summary
shift in emphasis toward the Australian market, with a consequent increase in the exposure to the
specific risk factors that affect that market.
� Many previous Australian acquisitions by other New Zealand companies have performed poorly.
However, we note that there are a range of factors in relation to this particular Transaction which
we believe will improve the likelihood of a more favourable outcome, including the fact that EBOS
anticipates the retention of the entire senior management team at Symbion. Zuellig will also
remain as a significant stakeholder in the Symbion business through its 40% shareholding in
EBOS, and we expect that this continuity will be important when dealing with some of the key
regulatory risk factors. Finally, we note that EBOS itself has built a strong track record of
identifying and implementing successful acquisitions, several of which were Australian-based.
� We believe that Zuellig is likely to have effective control of EBOS following the completion of the
Transaction via its 40% shareholding. While this can be perceived to be a negative outcome
from existing EBOS shareholders’ point of view, we suggest that there may be some benefits
from having a strong cornerstone shareholder like Zuellig which at least partially mitigates the
negative factors. Zuellig has a track record as a long-term investor in the pharmaceutical
industry, and is therefore likely to have industry knowledge and contacts which may be beneficial
for EBOS as the industry structure evolves through time. The fact that Zuellig is happy to retain a
40% interest in EBOS following the Transaction can also be interpreted as a strong vote of
confidence in EBOS’ future prospects.
1.4 Acceptance or Rejection of the Transaction
This report represents one source of information that EBOS shareholders may wish to consider when
forming their own view on whether to accept or reject the Transaction. It is not possible to contemplate
all shareholders’ personal circumstances or investment objectives and our assessment is therefore
general in nature. The appropriate course of action for each shareholder is dependent on their own
unique situation. If appropriate, shareholders should consult their own professional adviser(s).

EBOS Group Limited – Independent Adviser’s Report Page 10
Transaction Structure and Funding
2.0 Transaction Structure and Funding
2.1 Purchase Price
EBOS will acquire all of the shares on issue in ZHHA for total consideration of NZ$865 million. The
Purchase Price has been agreed between the parties based on a number of steps as broadly outlined in
Table 3 below.
Table Table Table Table 3333: Summary of Purchase Price Determination: Summary of Purchase Price Determination: Summary of Purchase Price Determination: Summary of Purchase Price Determination
Step 1: Agree Valuation Step 1: Agree Valuation Step 1: Agree Valuation Step 1: Agree Valuation
FramewoFramewoFramewoFrameworkrkrkrk
Shares valued in A$ terms as enterprise value less net debt.
Enterprise Value
less Net Debt
Equity Value (Purchase Price)
Step 2: Step 2: Step 2: Step 2: Confirm Input Confirm Input Confirm Input Confirm Input Values for Enterprise ValueValues for Enterprise ValueValues for Enterprise ValueValues for Enterprise Value
Based on agreed multiple of 8.0x FY2012 adjusted EBITDA. Adjustments to EBITDA to reflect components of ZHHA which are excluded from the Transaction.
EBITDA A$113.0m
Multiple 8.0x
EV A$904.0m
Step Step Step Step 3333: : : : Confirm Net Debt Confirm Net Debt Confirm Net Debt Confirm Net Debt Value and Assess Value and Assess Value and Assess Value and Assess Purchase PricePurchase PricePurchase PricePurchase Price
Net debt based on the projected balance as at 31 May 2013.
EV A$904.0m
Less Net Debt A$188.4m
Equity Value A$715.6m
Step 4: Confirm Gross Step 4: Confirm Gross Step 4: Confirm Gross Step 4: Confirm Gross Purchase Price in New Purchase Price in New Purchase Price in New Purchase Price in New Zealand Dollar TermsZealand Dollar TermsZealand Dollar TermsZealand Dollar Terms
Eliminate A$/NZ$ exchange rate uncertainty for EBOS by locking in the Purchase Price in NZ$ terms (example is based on approximate rate at the time of negotiations).
Purchase Price A$ A$715.6m
Exchange Rate (A$/NZ$) 0.815
Gross Purchase Price NZ$1 NZ$880.0m
Step 5: Agree PreStep 5: Agree PreStep 5: Agree PreStep 5: Agree Pre----Settlement Dividend to be Settlement Dividend to be Settlement Dividend to be Settlement Dividend to be paid by Symbionpaid by Symbionpaid by Symbionpaid by Symbion
In order to utilise Symbion’s franking credits, a pre-settlement dividend will be paid to Zuellig. The dividend will not exceed NZ$15.0 million.
Purchase Price NZ$ NZ$880.0m
Pre-Settlement Dividend NZ$15.0m
Net Purchase Price NZ$ NZ$865.0m
Source: EBOS and Northington Partners’ analysis 1 After rounding
We note that the Purchase Price has been determined by excluding the financial impact of APHS
Packaging Pty Limited (“APHSAPHSAPHSAPHS”), a 100% subsidiary of Symbion. APHS was acquired in 2012 and has
to date been unprofitable. As part of the Transaction negotiations, the parties have agreed that APHS
will be retained by Symbion following the Transaction on the condition that Zuellig will underwrite on-
going trading losses for the period to June 2015, to a maximum payment of $NZ3.0 million in aggregate3.
As a consequence of the sale and purchase agreement, the FY2012 EBITDA value used in the
determination of the Purchase Price has been adjusted to exclude the losses made by APHS in the
period to December 2012. On that basis, the adjusted EBITDA value of A$113 million is A$3.7 million
higher than actual EBITDA.
2.2 Summary of Transaction Funding and Proposed Capital Raising Process
2.2.1 Introduction and Overview
EBOS will pay the Purchase Price using a mixture of cash and EBOS shares. Table 4 summarises the
agreed breakdown of the consideration to be paid to Zuellig.
3 Any payments made in relation to this agreement will be determined as the EBITDA loss incurred during the relevant period, multiplied by 0.7 to account for the tax benefit that will accrue to EBOS as a result of the loss. The maximum payment of NZ$3.0 million therefore relates to an aggregate EBITDA loss of NZ$4.28 million.

EBOS Group Limited – Independent Adviser’s Report Page 11
Transaction Structure and Funding
Table Table Table Table 4444: Transaction Funding Summary: Transaction Funding Summary: Transaction Funding Summary: Transaction Funding Summary
Transaction ConsiderationTransaction ConsiderationTransaction ConsiderationTransaction Consideration ValueValueValueValue
(NZ$m)(NZ$m)(NZ$m)(NZ$m)
Allotment of EBOS Shares $498
Cash Payment $367
Total ConsiderationTotal ConsiderationTotal ConsiderationTotal Consideration $8$8$8$865656565
Source: EBOS
The cash component of the overall consideration paid to Zuellig will be funded using a variety of sources
including the Pre-Transaction Placement, the Rights Issue, and a new debt facility with EBOS’ banking
syndicate. The relative contribution of each funding source is set out in Table 5, showing that total funds
raised need to be sufficient to cover both the cash consideration paid to Zuellig and the anticipated
transaction costs4.
Table Table Table Table 5555: Sources: Sources: Sources: Sources and Uses of Cash Fundingand Uses of Cash Fundingand Uses of Cash Fundingand Uses of Cash Funding
ValueValueValueValue
(NZ$m)(NZ$m)(NZ$m)(NZ$m)
Cash Funding RequirementsCash Funding RequirementsCash Funding RequirementsCash Funding Requirements
Agreed Cash Payment to Zuellig $367.0
Estimated Transaction Costs $11.8
Total Cash RequirementsTotal Cash RequirementsTotal Cash RequirementsTotal Cash Requirements $378.$378.$378.$378.8888
Cash Funding SourcesCash Funding SourcesCash Funding SourcesCash Funding Sources
Pre-Transaction Placement $90.0
Rights Issue $149.1
New Debt Facility $140.0
Total Cash RaisedTotal Cash RaisedTotal Cash RaisedTotal Cash Raised $3$3$3$379797979....1111
Source: EBOS
4 Based on the assumed share values used in our analysis, together with the currently agreed structure of the Rights Issue, the total cash proceeds will marginally exceed the anticipated cash requirements (by around NZ$300,000).

EBOS Group Limited – Independent Adviser’s Report Page 12
Transaction Structure and Funding
Some of the important details for each component of the equity raising are summarised below in Table 6.
Table Table Table Table 6666: Summary o: Summary o: Summary o: Summary of Equity Raising Componentsf Equity Raising Componentsf Equity Raising Componentsf Equity Raising Components
ComponentComponentComponentComponent Intended TimingIntended TimingIntended TimingIntended Timing ProposedProposedProposedProposed Pricing TermsPricing TermsPricing TermsPricing Terms Other CommentOther CommentOther CommentOther Comment
Pre-Transaction Placement
EBOS advisers will engage with
selected institutions and high net
worth individuals immediately
after the announcement of the
Transaction, and make the
allotment approximately one
week after the announcement
date.
Shares will be allotted at a price of NZ$8.50 per share, which represents a: � 10% discount to the
Volume Weighted Average Price (“VWAPVWAPVWAPVWAP”) over the 20 trading days to 22 May (NZ$9.80)1; and
� 12% discount to the observed market closing price of EBOS shares on 22 May (NZ$9.99)1.
� Given the required timing, this allotment will be made before the Transaction is approved by shareholders.
� The Pre-Transaction Placement will be fully underwritten.
Rights Issue The record date for the Rights
Issue will be approximately two
weeks after the announcement
date of the Transaction, and the
issue of shares pursuant to the
Rights Issue will take place
immediately prior to the
settlement of the Transaction.
Shares will be issued at a price of NZ$6.50 per share, representing a discount of approximately 24% to the Theoretical Ex-Rights Price (“TERPTERPTERPTERP”) after the Pre-Transaction Placement.
� The Rights Issue is renounceable, meaning that shareholders who do not want to increase their investment in EBOS will be able to sell their rights on the NZSX.
� The Rights Issue will be fully underwritten.
Zuellig Share Allotment
The Zuellig Share Allotment will
be made at settlement.
The Zuellig shares will be issued at TERP, a price which will reflect the share price impacts of a bonus issue (see below), the Pre-Transaction Placement and the Rights Issue.
� Following the completion of the Zuellig Share Allotment, Zuellig will own 40% of the shares on issue in EBOS.
� Shares issued pursuant to the Zuellig Share Allotment will be subject to an escrow arrangement which prevents a sale of the shares until the results for FY2014 are announced (expected in September 2014).
Source: EBOS and Northington Partners’ analysis 1. After allowance for the impact of the Bonus Issue
In addition to the various sources of new equity capital, EBOS will partially fund the Purchase Price with a
new debt facility of NZ$140.0 million. The relative contribution from each source of funding is presented
in Figure 1.
Figure Figure Figure Figure 1111: Sources of Funding for the Transaction: Sources of Funding for the Transaction: Sources of Funding for the Transaction: Sources of Funding for the Transaction
Source: EBOS
10%
17%
57%
16%Pre-Transaction Placement
Rights Issue
Zuellig Equity in EBOS
New EBOS Debt

EBOS Group Limited – Independent Adviser’s Report Page 13
Transaction Structure and Funding
Further details for each of the capital raising components is provided below, and a discussion of the
implications of the potential outcomes from the capital raising process for existing EBOS shareholders is
set out in Section 7.4.
2.2.2 Taxable Bonus Share Issue
Prior to any of the share issues relating to the Transaction, EBOS will first declare a taxable bonus issue
to existing shareholders pursuant to which shareholders will be issued 2 new shares for every 53 shares
they hold (“Bonus IssueBonus IssueBonus IssueBonus Issue”). The purpose of the Bonus Issue is to utilise imputation credits that would
otherwise be lost if the Transaction proceeds. Without some form of taxable distribution, the available
imputation credits will be forfeited because the anticipated allotments of EBOS shares via the Pre-
Transaction Placement and the Zuellig Share Allotment will cause a breach of shareholder continuity
rules. The imputation credits could be utilised by either paying shareholders a cash dividend or by
making a taxable bonus issue of shares: EBOS has chosen the latter approach because it involves a
non-cash distribution and therefore does not add to the significant amount of cash that already needs to
be raised to fund the Transaction.
The benefit of a taxable bonus issue for existing shareholders is relatively subtle. The main impact is that
the net taxable bonus issue amount is converted into “available subscribed capital”. In the event of a
future share repurchase made by EBOS or a liquidation of EBOS, amounts distributed to shareholders
(up to the level of available subscribed capital) could be distributed tax free. While this potential benefit is
effectively shared with all of the Company’s shareholders at the time of the share repurchase or
liquidation, there could be other more immediate tax benefits for existing shareholders depending on their
individual circumstances:
� Shareholders on marginal tax rates lower than 33% may receive a partial refund of the Resident
Withholding Tax that will be withheld by EBOS as part of the Bonus Issue; and
� Corporate shareholders will also be able to credit their imputation credit accounts with the
imputation credits attached to the Bonus Issue.
The other impact of the Bonus Issue is that it will be slightly dilutive to the theoretical value of the EBOS
shares on issue, reflecting the fact that the total number of shares on issue will increase while the
aggregate value of EBOS’ equity remains the same. This impact is summarised in Table 7, on the basis
that all existing imputation credits (NZ$7.60 million) are utilised.

EBOS Group Limited – Independent Adviser’s Report Page 14
Transaction Structure and Funding
Table Table Table Table 7777:::: Impact of Taxable Bonus Issue on Theoretical Share ValueImpact of Taxable Bonus Issue on Theoretical Share ValueImpact of Taxable Bonus Issue on Theoretical Share ValueImpact of Taxable Bonus Issue on Theoretical Share Value
Amount / ValueAmount / ValueAmount / ValueAmount / Value Calculation Calculation Calculation Calculation
BasisBasisBasisBasis
Prior to Taxable Bonus IssuePrior to Taxable Bonus IssuePrior to Taxable Bonus IssuePrior to Taxable Bonus Issue
Assumed Share Value per Share A $9.80
Number of Shares on Issue B 52,956,571
Total Market Capitalisation C NZ$518,974,396 A x B
Net Bonus Issue AmountNet Bonus Issue AmountNet Bonus Issue AmountNet Bonus Issue Amount
Imputation Credits to be Utilised D NZ$7,600,000
Net Bonus Issue Value E NZ$19,542,857
Bonus Issue as Proportion of Market Cap F 3.77% E / C
Aggregate Number of Shares Issued under Bonus Issue G 1,998,361 F x B
After Bonus IssueAfter Bonus IssueAfter Bonus IssueAfter Bonus Issue
Number of Shares on Issue H 54,954,932 B + G
Theoretical Value per Share I NZ$9.44 C / H
Source: EBOS and Northington Partners’ Analysis
2.2.3 Pre-Transaction Placement
EBOS expects to issue approximately 10.6 million shares to a range of new and existing institutional
shareholders through the Pre-Transaction Placement. This represents 20% of the shares on issue in
EBOS before the Bonus Issue, and is the maximum number of shares that EBOS can issue without prior
shareholder approval. The other main features of the Pre-Transaction Placement are as follows:
� The shares will be issued at a price of NZ$8.50, representing a 10.0% discount to the 20 day
VWAP ending on 22 May 2013 and a 12% discount to the closing price on 22 May 2013
(adjusted for the impact of the Bonus Issue, as explained above);
� Because the shares will be issued at a discount to current market values, the Pre-Transaction
Placement will have a dilutionary impact on EBOS’ share price for existing shareholders. With all
else being equal, the immediate theoretical impact on EBOS’ price per share will be
approximately NZ$0.15, or 1.5% of the Pre-Transaction Placement value.
� Given the timing requirements of the Transaction process, the Pre-Transaction Placement will be
completed immediately after the announcement date but prior to the scheduled EBOS
shareholders meeting to vote on the Transaction. That means that the capital will be raised
irrespective of whether or not the Transaction is approved by EBOS shareholders. If the
Transaction does not proceed the proceeds will be used for general corporate purposes,
including, potentially, the reduction of debt and/or the pursuit of other acquisition opportunities.
2.2.4 Rights Issue
If the Transaction is approved by EBOS shareholders, the Company will raise approximately NZ$149
million through the Rights Issue that will be fully underwritten. Key terms of the Rights Issue are
summarised in Table 8.

EBOS Group Limited – Independent Adviser’s Report Page 15
Transaction Structure and Funding
Table Table Table Table 8888: Terms of the Rights: Terms of the Rights: Terms of the Rights: Terms of the Rights IssueIssueIssueIssue
Issue TermsIssue TermsIssue TermsIssue Terms Expected ValueExpected ValueExpected ValueExpected Value
Entitlement Ratio 7 new shares for every 20 shares held
Shares on Issue Prior to Rights Issue 65.55m
Total Number of Rights Entitlements 22.94m
Shares on Issue After Rights Issue 88.49m
Offer Price under Rights Issue $6.50
Total Capital Raised $149.1m
Source: EBOS and Northington Partners’ Analysis
New EBOS shares issued pursuant to the Rights Issue will be priced at a discount of approximately 24%
to the TERP. Table 9 sets out an indicative example of how TERP is determined, based on EBOS’ 20
Day VWAP ending on 22 May (NZ$9.80). The implied discount will change if the actual EBOS share
value is different to NZ$9.80 when the Rights Issue is implemented.
Table Table Table Table 9999: Calculation of Theoretical Ex: Calculation of Theoretical Ex: Calculation of Theoretical Ex: Calculation of Theoretical Ex----Rights Share PriceRights Share PriceRights Share PriceRights Share Price
Amount / ValueAmount / ValueAmount / ValueAmount / Value Calculation Calculation Calculation Calculation
BasisBasisBasisBasis
Market Capitalisation Before Rights IssueMarket Capitalisation Before Rights IssueMarket Capitalisation Before Rights IssueMarket Capitalisation Before Rights Issue
Shares on Issue (Following Bonus Issue and Placement) A 65,546,246
Market Value per Share1 B NZ$9.29
Total Market Capitalisation C NZ$609,000,567 A x B
New Shares Issued for Rights EntitlementsNew Shares Issued for Rights EntitlementsNew Shares Issued for Rights EntitlementsNew Shares Issued for Rights Entitlements
Number of Shares Issued Pursuant to Rights Issue D 22,941,186
Indicative Issue Price Per Share E NZ$6.50
Capital to be Raised F NZ$149,117,710 D x E
TETETETERP Following Rights IssueRP Following Rights IssueRP Following Rights IssueRP Following Rights Issue
Theoretical Market Capitalisation G NZ$758,118,277 C + F
Total Shares on Issue H 88,487,433 A + D
Theoretical Ex-Rights Price (TERP) I NZ$8.57 G / H
Rights Issue Price – Discount to TERP 24.13% 1 – (E / I)
1. Based on the 20 day VWAP ending on 22 May of $9.80, adjusted to account for impact of the Bonus Issue and Pre-Transaction Placement
Source: EBOS and Northington Partners’ Analysis
2.2.5 Zuellig Share Allotment
Following the Zuellig Share Allotment, Zuellig will own 40% of the total shares on issue in EBOS (including
the more than 500,000 shares already owned by Zuellig interests prior to the Transaction). The shares
will be issued at the current TERP of NZ$8.57, and therefore incorporates the dilutionary impacts of the
Bonus Issue, the Pre-Transaction Placement and the Rights Issue.

EBOS Group Limited – Independent Adviser’s Report Page 16
Transaction Structure and Funding
2.2.6 Summary
The overall impact of the capital raising process on value per EBOS share is summarised in Figure 2.
Figure Figure Figure Figure 2222: Th: Th: Th: The Capital Raising Components and TERPe Capital Raising Components and TERPe Capital Raising Components and TERPe Capital Raising Components and TERP1111
Source: EBOS and Northington Partners’ Analysis 1. Based on data available as at 22 May 2013
The funding structure used to support the Transaction will have a material impact on the ownership
position of EBOS. Irrespective of the outcomes of the Pre-Transaction Placement and the Rights Issue
(and after making adjustments to take account of the Bonus Issue), Zuellig will hold exactly 40% of the
shares on issue after the Transaction is completed, existing shareholders will hold an aggregate of
approximately 50%, and new shareholders will own the balance of around 10%5. These indicative post-
Transaction shareholdings are summarised in Figure 3.
Figure Figure Figure Figure 3333: Indicative Shareholding Percentages Post: Indicative Shareholding Percentages Post: Indicative Shareholding Percentages Post: Indicative Shareholding Percentages Post----TransactionTransactionTransactionTransaction
Source: EBOS and Northington Partners’ Analysis
5 Simplistically assuming both that the Pre-Transaction Placement shares are all issued to new shareholders and that existing shareholders who are entitled to participate in the Rights Issue exercise all of their rights entitlements. Neither of these outcomes is likely to occur and the final shareholding percentages held by new and existing shareholders will therefore differ slightly from the indicated levels.
$9.80
$9.44$9.29
$8.57
$6.0
$6.5
$7.0
$7.5
$8.0
$8.5
$9.0
$9.5
$10.0
NZ
$ p
er
EB
OS
sh
are
NZ
$ p
er
EB
OS
sh
are
NZ
$ p
er
EB
OS
sh
are
NZ
$ p
er
EB
OS
sh
are
($0.36) ($0.15)
($0.72)
Current Share Price TBI
Share Price ex TBI Placement
Theoretical Price ex TBI &
Placement Rights Offer TERP
TERP Adjustment = ($8.57/$9.29 = 0.922)
53.0m shares on issue at
$9.80 per share
2.0m bonus shares issued
55.0m shares on issue at
$9.44 per share
10.6m shares issued at $8.50
per share
65.5m shares on issue at
$9.29 per share
22.9m shares issued at $6.50
88.5m shares on issue at
$8.57 per share
50%
10%
40% Existing Shareholders
New Shareholders
Zuellig
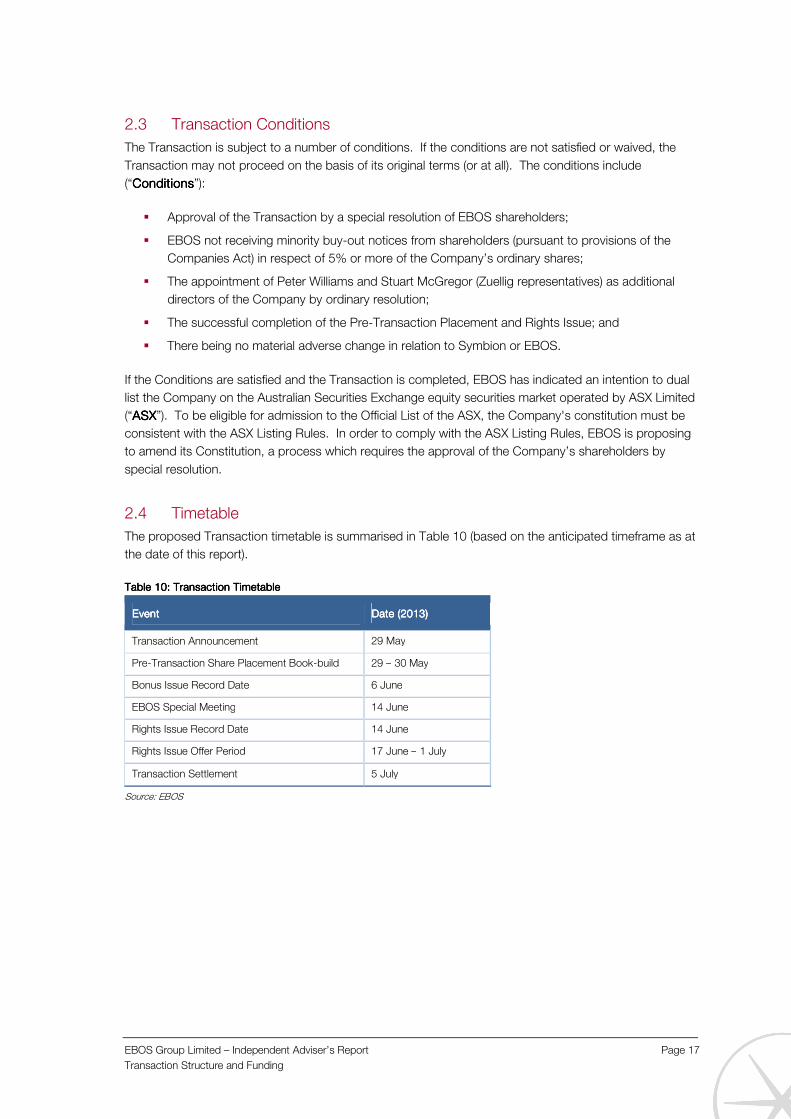
EBOS Group Limited – Independent Adviser’s Report Page 17
Transaction Structure and Funding
2.3 Transaction Conditions
The Transaction is subject to a number of conditions. If the conditions are not satisfied or waived, the
Transaction may not proceed on the basis of its original terms (or at all). The conditions include
(“ConditionsConditionsConditionsConditions”):
� Approval of the Transaction by a special resolution of EBOS shareholders;
� EBOS not receiving minority buy-out notices from shareholders (pursuant to provisions of the
Companies Act) in respect of 5% or more of the Company’s ordinary shares;
� The appointment of Peter Williams and Stuart McGregor (Zuellig representatives) as additional
directors of the Company by ordinary resolution;
� The successful completion of the Pre-Transaction Placement and Rights Issue; and
� There being no material adverse change in relation to Symbion or EBOS.
If the Conditions are satisfied and the Transaction is completed, EBOS has indicated an intention to dual
list the Company on the Australian Securities Exchange equity securities market operated by ASX Limited
(“ASXASXASXASX”). To be eligible for admission to the Official List of the ASX, the Company's constitution must be
consistent with the ASX Listing Rules. In order to comply with the ASX Listing Rules, EBOS is proposing
to amend its Constitution, a process which requires the approval of the Company’s shareholders by
special resolution.
2.4 Timetable
The proposed Transaction timetable is summarised in Table 10 (based on the anticipated timeframe as at
the date of this report).
Table Table Table Table 10101010: : : : Transaction TimetableTransaction TimetableTransaction TimetableTransaction Timetable
EventEventEventEvent DateDateDateDate (2013)(2013)(2013)(2013)
Transaction Announcement 29 May
Pre-Transaction Share Placement Book-build 29 – 30 May
Bonus Issue Record Date 6 June
EBOS Special Meeting 14 June
Rights Issue Record Date 14 June
Rights Issue Offer Period 17 June – 1 July
Transaction Settlement 5 July
Source: EBOS
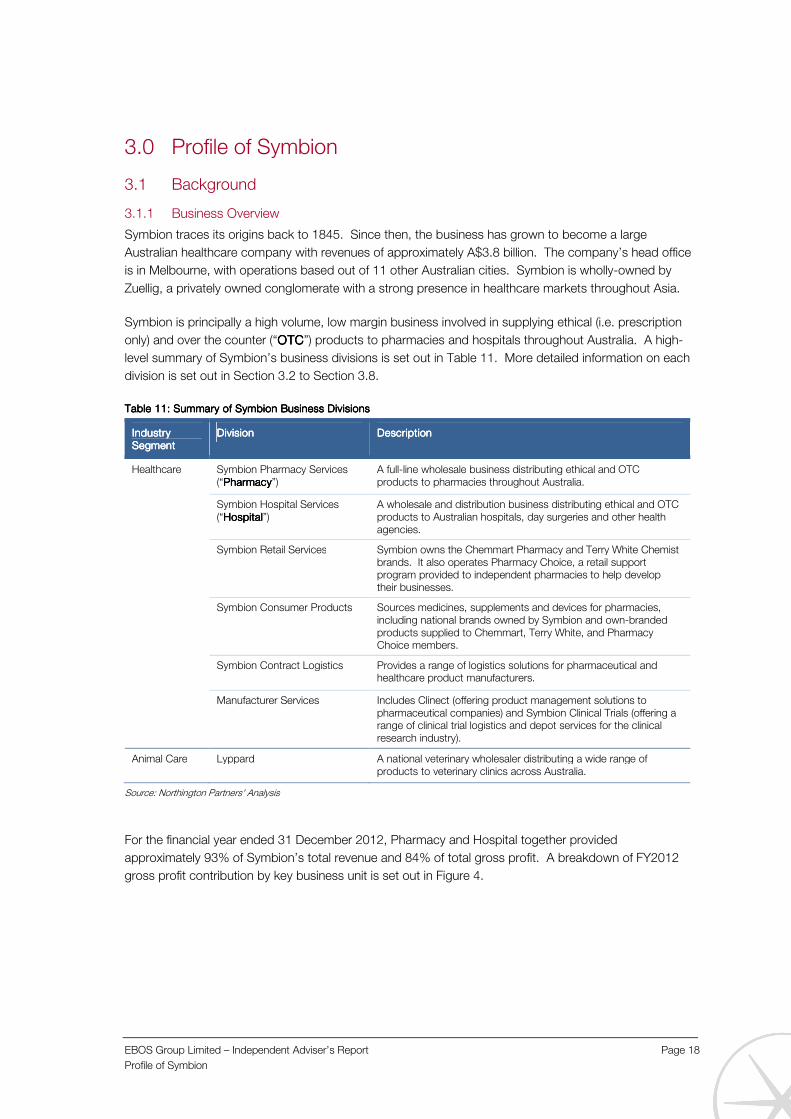
EBOS Group Limited – Independent Adviser’s Report Page 18
Profile of Symbion
3.0 Profile of Symbion
3.1 Background
3.1.1 Business Overview
Symbion traces its origins back to 1845. Since then, the business has grown to become a large
Australian healthcare company with revenues of approximately A$3.8 billion. The company’s head office
is in Melbourne, with operations based out of 11 other Australian cities. Symbion is wholly-owned by
Zuellig, a privately owned conglomerate with a strong presence in healthcare markets throughout Asia.
Symbion is principally a high volume, low margin business involved in supplying ethical (i.e. prescription
only) and over the counter (“OTCOTCOTCOTC”) products to pharmacies and hospitals throughout Australia. A high-
level summary of Symbion’s business divisions is set out in Table 11. More detailed information on each
division is set out in Section 3.2 to Section 3.8.
Table Table Table Table 11111111: Summary of Symbion Business Divisions: Summary of Symbion Business Divisions: Summary of Symbion Business Divisions: Summary of Symbion Business Divisions
Industry Industry Industry Industry SegmentSegmentSegmentSegment
DivisionDivisionDivisionDivision DescriptionDescriptionDescriptionDescription
Healthcare Symbion Pharmacy Services (“PharmacyPharmacyPharmacyPharmacy”)
A full-line wholesale business distributing ethical and OTC products to pharmacies throughout Australia.
Symbion Hospital Services (“HospitalHospitalHospitalHospital”)
A wholesale and distribution business distributing ethical and OTC products to Australian hospitals, day surgeries and other health agencies.
Symbion Retail Services Symbion owns the Chemmart Pharmacy and Terry White Chemist brands. It also operates Pharmacy Choice, a retail support program provided to independent pharmacies to help develop their businesses.
Symbion Consumer Products Sources medicines, supplements and devices for pharmacies, including national brands owned by Symbion and own-branded products supplied to Chemmart, Terry White, and Pharmacy Choice members.
Symbion Contract Logistics Provides a range of logistics solutions for pharmaceutical and healthcare product manufacturers.
Manufacturer Services Includes Clinect (offering product management solutions to pharmaceutical companies) and Symbion Clinical Trials (offering a range of clinical trial logistics and depot services for the clinical research industry).
Animal Care Lyppard A national veterinary wholesaler distributing a wide range of products to veterinary clinics across Australia.
Source: Northington Partners' Analysis
For the financial year ended 31 December 2012, Pharmacy and Hospital together provided
approximately 93% of Symbion’s total revenue and 84% of total gross profit. A breakdown of FY2012
gross profit contribution by key business unit is set out in Figure 4.

EBOS Group Limited – Independent Adviser’s Report Page 19
Profile of Symbion
Figure Figure Figure Figure 4444: : : : FY2012FY2012FY2012FY2012 Gross Profit Contributions by Key Business Units Gross Profit Contributions by Key Business Units Gross Profit Contributions by Key Business Units Gross Profit Contributions by Key Business Units
Source: Symbion
3.1.2 Regulatory Overview
Symbion operates within the highly regulated Australian pharmaceuticals industry, comprising firms
involved with the manufacture of medicines and medical products, service related segments including
wholesaling and distribution, and firms involved with bio-medical research and biotechnology.
A summary of the industry’s key regulatory components that impact on Symbion’s business is set out in
Table 12. A more detailed description of the regulatory environment is set out in Appendix 2, together
with details on industry structure, key industry participants, and industry trends.
Table Table Table Table 12121212: Summary of Key Industry Regulatory Components: Summary of Key Industry Regulatory Components: Summary of Key Industry Regulatory Components: Summary of Key Industry Regulatory Components
ItemItemItemItem DescriptionDescriptionDescriptionDescription
Pharmaceutical Benefits Scheme (“PBSPBSPBSPBS”)
� A Commonwealth Government scheme that subsidises the cost of PBS-listed
prescription only medicines.
� Consumers pay a proportion of the cost of all PBS medicines (capped at
A$36.10), with the Government paying the balance of the cost. Consumers on a
concession card pay a maximum of A$5.90.
� Manufacturers negotiate the price of PBS listed medicines with Government.
� The remuneration of wholesalers (like Symbion) and pharmacists is calculated
with reference to the manufacturer’s price.
� Extensive reforms have been made since 2007 to maintain the financial
sustainability of the PBS, particularly around encouraging physicians to prescribe
cheaper generic (non-branded) pharmaceuticals.
Community Pharmacy Agreements
� These agreements, entered into between the Australian Government and the
Pharmacy Guild of Australia, provide remuneration for community pharmacies
(including pharmacy and wholesaler mark-ups), the provision of pharmacy
programs and services, and detail the CSO arrangements with wholesalers.
� The current agreement, the 5th Community Pharmacy Agreement, took effect on
1 July 2010 and runs for a period of five years.
Community Service Obligation (“CSOCSOCSOCSO”) Funding Pool
� A funding pool established under the 4th Community Pharmacy Agreement that
aims to ensure all Australians receive access to PBS medicines via their
community pharmacy.
� The pool (approximately A$182 million in 2012/13) provides financial support to
wholesalers (including Symbion) supplying the full range of PBS medicines to
pharmacies across Australia, regardless of location and the relative cost of
supply.
70%
14%
10%
6%
Pharmacy Hospital Lyppard Other

EBOS Group Limited – Independent Adviser’s Report Page 20
Profile of Symbion
ItemItemItemItem DescriptionDescriptionDescriptionDescription
Pharmaceutical Pricing � The dispensed price of PBS medicines comprises the sum of the manufacturer’s
price, the wholesaler’s mark-up, the pharmacist’s mark-up, and dispensing and
other fees entitled to be charged by the pharmacist.
� For PBS listed medicines, the maximum regulated wholesaler mark-up is 7.52%
of the manufacturer’s price (capped at a maximum mark-up of A$69.94).
� The regulated pharmacy mark-up is determined by a sliding scale depending on
the price of PBS medicines, up to a maximum mark-up of A$70.00.
� For the bulk of PBS medicines that are “ready prepared” (i.e. require no further
preparation or compounding), the dispensing fee is A$6.52.
Pharmacy Ownership and Location Rules
� Ownership of pharmacies is restricted to pharmacists and (although differences
exist from state to state) is generally restricted to no more than 4-6 pharmacies
per pharmacist.
� Legislation specifically prevents corporate ownership, which has excluded
supermarkets and other large retailers from entering the pharmacy retailing
space.
� There are strict rules governing where new pharmacies can be located, or the re-
location of existing pharmacies. These rules are designed to prevent new
pharmacies from competing against existing practices.
Source: Northington Partners' Analysis
3.1.3 Corporate Structure
The corporate structure for the Symbion group is set out in Figure 5 below:
Figure Figure Figure Figure 5555: : : : Symbion Group Symbion Group Symbion Group Symbion Group Corporate StructureCorporate StructureCorporate StructureCorporate Structure
Source: Symbion
Most of Symbion’s business units, including Pharmacy and Hospital, are operated out of Symbion itself.
The Clinect division was established in 2011 and trades out of a separate legal entity. Symbion’s other
three wholly-owned subsidiaries reflect business acquisitions made in the last two years, with each new
business continuing to operate within its own legal entity. Symbion also owns a number of other non-
trading companies which are not relevant for the purposes of this report and have therefore been
excluded from the corporate structure diagram represented above.
Zuellig Healthcare Holdings Australia Pty Ltd
Symbion Pty Ltd
Clinect Pty LtdIntellipharm
Pty Ltd
Lyppard
Australia Pty
Ltd
APHS
Packaging Pty
Ltd
Zuellig Australia Pharmacy Services Pty Ltd
100%
100%
100% 100% 100% 100%

EBOS Group Limited – Independent Adviser’s Report Page 21
Profile of Symbion
3.1.4 Significant Historical Events
Key milestones in Symbion’s history are summarised below:
� 1845184518451845: F H Faulding (“FauldingFauldingFauldingFaulding”) was established upon the opening by Francis Faulding of a
pharmacy in Adelaide, Australia.
� 1890189018901890 ---- 1921921921924444: Faulding commenced operations in Western Australia, Sydney, Brisbane and
Melbourne.
� 1947194719471947: Faulding became a public company.
� 1964196419641964: Faulding purchased Milne Brown, a dental business with operations in New South Wales
and Queensland.
� 1980s1980s1980s1980s: Faulding established operations in Tasmania and the Northern Territory.
� 1996199619961996: Chemmart Pharmacy was launched as a national pharmacy brand in Australia.
� 1998199819981998: Faulding purchased the Terry White Chemists brand, developing it into a leading retail
brand.
� 2001200120012001: Faulding was bought by the Mayne Group Ltd and its name was changed to Mayne
Pharmacy Services.
� 2005200520052005: Mayne Pharmacy Services demerged to become Mayne Pharma and Symbion Pharmacy
Services (a division of Symbion Health Limited).
� 2007200720072007: Pharmacy Choice was launched, a comprehensive retail programme for independent
pharmacies.
� 2008200820082008: Zuellig purchased Symbion Pharmacy Services.
� 2010201020102010: Symbion Consumer Products, a division of Symbion supplying OTC products, re-launched
the Faulding brand.
� 2011201120112011: Symbion purchased Lyppard, a veterinary supplies distribution business, and the Clinect
division was formed.
� 2020202012121212: Symbion purchased APHS Packaging (a manufacturer of dose administration aids) and
Intellipharm (a provider of in-pharmacy data collection software).
3.2 Symbion Pharmacy Services
3.2.1 Business Overview
Pharmacy is the largest part of the Symbion business and operates as a full-line wholesaler distributing
approximately 16,000 ethical products and OTC products to retail pharmacies across Australia. The
division:
� Operates a nationwide network of 15 warehouses;
� Provides once a day delivery to pharmacies;
� Has a sales mix comprising approximately 76% ethical and 24% OTC products;
� Benefits from CSO pool funding received by Symbion; and
� Supports pharmacies with retail branded franchise systems and comprehensive store
management programs (see Section 3.4 below).

EBOS Group Limited – Independent Adviser’s Report Page 22
Profile of Symbion
3.2.2 Customers
As set out in Figure 6 below, the key customer groupings of Pharmacy comprise its own in-house retail
brands (Chemmart Pharmacy and Terry White Chemists), independent banner/buying groups, and
independent individual pharmacies (some of whom are also members of Symbion’s Pharmacy Choice
offering).
Figure Figure Figure Figure 6666: Pharmacy Customers: Pharmacy Customers: Pharmacy Customers: Pharmacy Customers
Source: Symbion
3.2.3 Market Size and Market Share
The total size of the pharmaceutical distribution market within the pharmacy segment is estimated at
approximately A$10 billion per annum, with around 88% of all distribution conducted by full-line
wholesalers 6.
Symbion management estimates Pharmacy’s overall market share by sales is approximately one-third of
the national wholesale distribution market. The division’s primary competition comes from the two other
national full-line wholesalers: Australian Pharmaceutical Industries Limited (“APIAPIAPIAPI”) and Sigma
Pharmaceuticals Limited (“SigmaSigmaSigmaSigma”). Competition also exists from regionally based wholesalers such as
Central Hospital Services Pty Ltd (based in Victoria) and Friendly Society Medical Association Limited, a
mutual organisation trading under the name “National Pharmacies” with operations in South Australia,
Victoria and New South Wales.
3.2.4 Financial Overview
The key drivers of Pharmacy’s business are the demand for pharmaceuticals, the regulatory environment
around funding and pricing of pharmaceuticals, and the desire of manufacturers to distribute products via
wholesale channels rather than directly to retailers.
The revenue of Pharmacy is particularly sensitive to the pricing of PBS-listed medicines given they
comprise the bulk of pharmaceuticals distributed by the division. Competition among wholesalers is
strong as they strive to win business from pharmacies, with many wholesalers selling pharmaceuticals
with a mark-up below the regulated maximum of 7.52%.
6 Source: IMS and Symbion management estimate
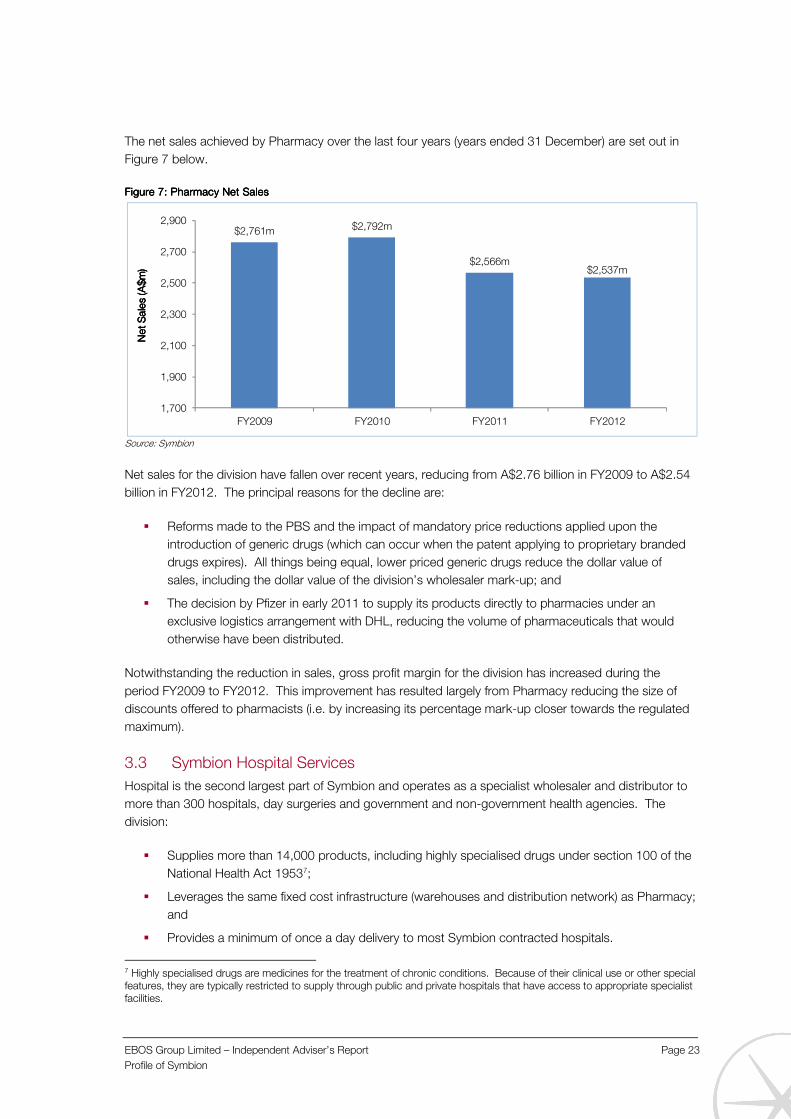
EBOS Group Limited – Independent Adviser’s Report Page 23
Profile of Symbion
The net sales achieved by Pharmacy over the last four years (years ended 31 December) are set out in
Figure 7 below.
Figure Figure Figure Figure 7777: Pharmacy Net Sales: Pharmacy Net Sales: Pharmacy Net Sales: Pharmacy Net Sales
Source: Symbion
Net sales for the division have fallen over recent years, reducing from A$2.76 billion in FY2009 to A$2.54
billion in FY2012. The principal reasons for the decline are:
� Reforms made to the PBS and the impact of mandatory price reductions applied upon the
introduction of generic drugs (which can occur when the patent applying to proprietary branded
drugs expires). All things being equal, lower priced generic drugs reduce the dollar value of
sales, including the dollar value of the division’s wholesaler mark-up; and
� The decision by Pfizer in early 2011 to supply its products directly to pharmacies under an
exclusive logistics arrangement with DHL, reducing the volume of pharmaceuticals that would
otherwise have been distributed.
Notwithstanding the reduction in sales, gross profit margin for the division has increased during the
period FY2009 to FY2012. This improvement has resulted largely from Pharmacy reducing the size of
discounts offered to pharmacists (i.e. by increasing its percentage mark-up closer towards the regulated
maximum).
3.3 Symbion Hospital Services
Hospital is the second largest part of Symbion and operates as a specialist wholesaler and distributor to
more than 300 hospitals, day surgeries and government and non-government health agencies. The
division:
� Supplies more than 14,000 products, including highly specialised drugs under section 100 of the
National Health Act 19537;
� Leverages the same fixed cost infrastructure (warehouses and distribution network) as Pharmacy;
and
� Provides a minimum of once a day delivery to most Symbion contracted hospitals.
7 Highly specialised drugs are medicines for the treatment of chronic conditions. Because of their clinical use or other special features, they are typically restricted to supply through public and private hospitals that have access to appropriate specialist facilities.
$2,761m $2,792m
$2,566m$2,537m
1,700
1,900
2,100
2,300
2,500
2,700
2,900
FY2009 FY2010 FY2011 FY2012
Ne
t S
ale
s (A
$m
)N
et
Sa
les
(A$
m)
Ne
t S
ale
s (A
$m
)N
et
Sa
les
(A$
m)

EBOS Group Limited – Independent Adviser’s Report Page 24
Profile of Symbion
The total size of the pharmaceutical market within the hospital segment is estimated at approximately
A$2.8 billion per annum8. Around 57% of products are distributed by wholesalers, with the balance
distributed directly by manufacturers or by state government departments. Hospital is the largest
supplier of pharmaceutical products within the hospitals segment. Hospital’s primary competitor is CH2,
a company which is 45.5% owned by API.
Hospital’s net sales exceed A$1.0 billion and earnings have grown steadily during recent years (at a rate
faster than the Pharmacy division).
3.4 Symbion Retail Services
Symbion’s offering to retail pharmacies consists of Pharmacy (detailed in Section 3.2 above) and
Symbion Retail Services. A summary of the core elements of the Retail Services division offering is set
out in Table 13 below.
Table Table Table Table 13131313: : : : SSSSymbion Retail Services Offeringymbion Retail Services Offeringymbion Retail Services Offeringymbion Retail Services Offering
Service OfferingService OfferingService OfferingService Offering DescriptionDescriptionDescriptionDescription
Chemmart Pharmacy � A leading national retail pharmacy franchise (over 300 stores) with a focus on health
and wellness.
� Member pharmacies are offered a range of retail management programs and systems,
including:
� A comprehensive suite of health services (e.g. a 20 minute health check,
diabetes support centre and the Kate Morgan Weight Loss program)
� Marketing programs (e.g. catalogues, TV and radio advertising, and a customer
loyalty program)
� Merchandising solutions
Terry White Chemists � One of Australia’s largest pharmacy retailers, with the franchise network comprising
more than 160 individually owned stores.
� The Terry White Chemists brand is owned by Symbion but is managed under license
by Terry White Management (a company owned by Terry White Chemists members).
Pharmacy Choice � Australia’s leading integrated retail support program designed to assist independent
pharmacies develop their businesses and succeed in a changing and highly
competitive retail environment.
� The largest program of its type in the Australian pharmacy market, with more than 700
member pharmacies.
� The Pharmacy Choice program provides support across key business areas such as
merchandising, advertising, operations, buying, and providing training support.
minfos � A pharmacy management and automation software solution.
� Designed, built and supported in Australia, the minfos system supports key aspects of
pharmacy operations, including dispensing, point-of-sale, stock management, and
analytical reporting.
Source: Symbion
3.5 Symbion Consumer Products
The Consumer Products division is responsible for the sale of house brand and private label consumer
products and medicines. As set out in Table 14 below, the three house brands are Chemmart, Terry
White and Pharmacy Choice, with the main private label brand being Faulding.
8 Source: IMS and Symbion management estimate
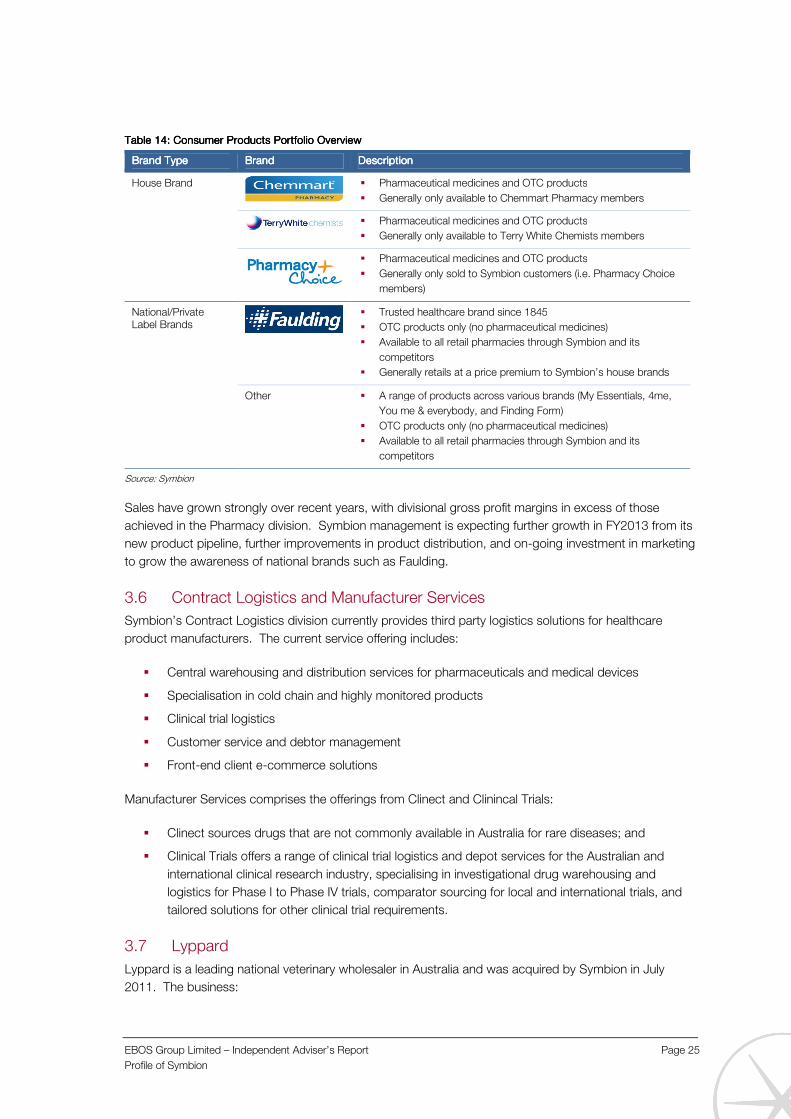
EBOS Group Limited – Independent Adviser’s Report Page 25
Profile of Symbion
Table Table Table Table 14141414: : : : Consumer Products PortfoConsumer Products PortfoConsumer Products PortfoConsumer Products Portfolio Overviewlio Overviewlio Overviewlio Overview
Brand TypeBrand TypeBrand TypeBrand Type BrandBrandBrandBrand DescriptionDescriptionDescriptionDescription
House Brand
� Pharmaceutical medicines and OTC products
� Generally only available to Chemmart Pharmacy members
� Pharmaceutical medicines and OTC products
� Generally only available to Terry White Chemists members
� Pharmaceutical medicines and OTC products
� Generally only sold to Symbion customers (i.e. Pharmacy Choice
members)
National/Private Label Brands
� Trusted healthcare brand since 1845
� OTC products only (no pharmaceutical medicines)
� Available to all retail pharmacies through Symbion and its
competitors
� Generally retails at a price premium to Symbion’s house brands
Other � A range of products across various brands (My Essentials, 4me,
You me & everybody, and Finding Form)
� OTC products only (no pharmaceutical medicines)
� Available to all retail pharmacies through Symbion and its
competitors
Source: Symbion
Sales have grown strongly over recent years, with divisional gross profit margins in excess of those
achieved in the Pharmacy division. Symbion management is expecting further growth in FY2013 from its
new product pipeline, further improvements in product distribution, and on-going investment in marketing
to grow the awareness of national brands such as Faulding.
3.6 Contract Logistics and Manufacturer Services
Symbion’s Contract Logistics division currently provides third party logistics solutions for healthcare
product manufacturers. The current service offering includes:
� Central warehousing and distribution services for pharmaceuticals and medical devices
� Specialisation in cold chain and highly monitored products
� Clinical trial logistics
� Customer service and debtor management
� Front-end client e-commerce solutions
Manufacturer Services comprises the offerings from Clinect and Clinincal Trials:
� Clinect sources drugs that are not commonly available in Australia for rare diseases; and
� Clinical Trials offers a range of clinical trial logistics and depot services for the Australian and
international clinical research industry, specialising in investigational drug warehousing and
logistics for Phase I to Phase IV trials, comparator sourcing for local and international trials, and
tailored solutions for other clinical trial requirements.
3.7 Lyppard
Lyppard is a leading national veterinary wholesaler in Australia and was acquired by Symbion in July
2011. The business:
EBOS Group Limited – Independent Adviser’s Report Page 26
Profile of Symbion
� Supplies over 12,000 product lines;
� Has more than 2,000 customer accounts (comprising mainly veterinarians and veterinary practice
groups); and
� Operates out of warehouses that are independent of Symbion located in Melbourne, Sydney,
Brisbane, Townsville, Perth and Adelaide.
Lyppard management estimates the business holds a 30% market share in a market serviced by three
major players: the remaining two players are Provet (with an estimated 45% market share) and Cenvet
(estimated to have a 10-15% market share).
Lyppard is the third largest contributor to the overall Symbion group earnings (behind Pharmacy and
Hospital), and revenue closely tracks spending on veterinary services. In the pet care sector, the key
driver of veterinary spend is the level of household disposable income. In the rural sector, economic
conditions can affect the demand for veterinary services; during periods of low prices for livestock and
associated products, animal numbers can fall significantly and expenditure on veterinary services can be
cut.
There is currently no regulation of either resale prices or access to the retail end of the veterinary market,
providing a wide scope for future strategic direction.
3.8 Other Symbion Businesses
Other businesses within the Symbion group include:
� APHS PackagingAPHS PackagingAPHS PackagingAPHS Packaging: acquired by Symbion in February 2012. The business operates as a
manufacturer of dose administration aids (e.g. easy-tear medication sachets that contain tablets)
to assist patients to take the right dose of medication at the right time. The business is
essentially a start-up operation and is currently incurring losses (which are expected to continue
until greater scale is attained).
� Symbion DentalSymbion DentalSymbion DentalSymbion Dental: a wholesale distribution business providing a wide range of consumable
products used in dental practices throughout Australia.
3.9 Group Financial Information
3.9.1 Financial Performance
A summary of the financial performance of Symbion for the periods ending December 2011 and
December 2012 is set out in Table 15 below.

EBOS Group Limited – Independent Adviser’s Report Page 27
Profile of Symbion
Table Table Table Table 15151515: Symbion Summary of Historical Financial Performance: Symbion Summary of Historical Financial Performance: Symbion Summary of Historical Financial Performance: Symbion Summary of Historical Financial Performance
12 months to12 months to12 months to12 months to 31 Dec 201131 Dec 201131 Dec 201131 Dec 2011
(A$m)(A$m)(A$m)(A$m)
12 months to12 months to12 months to12 months to 31 Dec 201231 Dec 201231 Dec 201231 Dec 2012
(A$m)(A$m)(A$m)(A$m)
Net SalesNet SalesNet SalesNet Sales $3,692$3,692$3,692$3,692 $3,795$3,795$3,795$3,795
Cost of Goods Sold $3,458 $3,534
Gross PGross PGross PGross Profitrofitrofitrofit $234$234$234$234 $260$260$260$260
Gross Margin 6.3% 6.9%
Other Income $54 $64
Total Operating Expenses $190 $215
EBITDAEBITDAEBITDAEBITDA $98$98$98$98 $109$109$109$109
EBITDA Margin 2.7% 2.9%
Source: ZHHA Audited Financial Statements (adjusted to take account of intra-group arrangements).
The main features of Symbion’s historical financial performance can be summarised as follows:
� Sales growth over recent years has been reasonably limited. Declining revenue in Pharmacy (due
to the impact of on-going PBS reforms) has been offset by growth in net sales in Hospital, the
impact of the Lyppard acquisition in July 2011, and an increase in revenue contribution from
smaller divisions such as Consumer Products.
� Gross margin improved from 6.3% in 2011 to 6.9% for the year ended 31 December 2012. The
majority of this improvement relates to changes in the trading terms with customers (i.e. reducing
the size of the wholesaler discount offered to pharmacists) and the contribution made by higher
margin business units such as Lyppard and Consumer Products.
� Total operating expenses have increased at a greater rate than the growth in sales. This mainly
reflects changes in the general mix of business and investment being made in younger divisions to
position them for future growth.
3.9.2 Financial Position
Symbion’s financial position for the periods to December 2011 and December 2012 is summarised in
Table 16 below. The main features are as follows:
� The investment in non-current assets (A$194 million as at 31 December 2012) comprises a
relatively small proportion of Symbion’s total assets. Around 75% of assets at the end of FY2012
constituted receivables and investment in stock.
� Current debt reduced significantly from A$328 million (31 December 2011) to A$209 million
(31 December 2012), with the reduction reflecting the impact of retained profits and a new term
debt facility which was used in part to finance the acquisition of the Lyppard business.

EBOS Group Limited – Independent Adviser’s Report Page 28
Profile of Symbion
Table Table Table Table 16161616: Symbion Statement of Historical Financial Position: Symbion Statement of Historical Financial Position: Symbion Statement of Historical Financial Position: Symbion Statement of Historical Financial Position
As atAs atAs atAs at 31313131 DecDecDecDec 2012012012011111
(A$m(A$m(A$m(A$m))))
As atAs atAs atAs at 31313131 DecDecDecDec 2012012012012222
(A$m)(A$m)(A$m)(A$m)
Assets
Cash and Equivalents $48 $41
Receivables $529 $529
Inventory $306 $304
Other Current Assets $66 $51
Total Current AssetsTotal Current AssetsTotal Current AssetsTotal Current Assets $950$950$950$950 $924$924$924$924
Property, Plant & Equipment $72 $82
Intangibles and Goodwill $95 $94
Other Non-Current Assets $15 $19
Total NonTotal NonTotal NonTotal Non----Current AssetsCurrent AssetsCurrent AssetsCurrent Assets $182$182$182$182 $194$194$194$194
Total AssetsTotal AssetsTotal AssetsTotal Assets $1,132$1,132$1,132$1,132 $1,119$1,119$1,119$1,119
Liabilities
Payables $542 $552
Current Debt $328 $209
Other Current Liabilities $11 $11
Total Current LiabilitiesTotal Current LiabilitiesTotal Current LiabilitiesTotal Current Liabilities $881$881$881$881 $773$773$773$773
Term Debt $0 $35
Other Non-Current Liabilities $7 $11
Total NonTotal NonTotal NonTotal Non----Current LiabilitiesCurrent LiabilitiesCurrent LiabilitiesCurrent Liabilities $7$7$7$7 $45$45$45$45
Total LiabilitiesTotal LiabilitiesTotal LiabilitiesTotal Liabilities $888$888$888$888 $818$818$818$818
Equity
Retained Earnings $106 $131
Equity $139 $170
Total EquityTotal EquityTotal EquityTotal Equity $244$244$244$244 $301$301$301$301
Source: ZHHA Audited Financial Statements (adjusted to take account of intra-group arrangements).
The majority of Symbion’s debt relates to a securitisation program based on its receivables:
� The program has a current facility limit of A$420 million;
� The program funds a revolving portfolio of receivables from over 2,600 trade debtor accounts
consisting of pharmacists and public and private hospitals in Australia;
� The receivables portfolio is highly diversified, with the 10 largest debtors comprising approximately
10% of the portfolio value; and
� The securitisation trust is controlled by Symbion.
3.10 Prospects and Key Business Risks
3.10.1 Forecast Financial Information
A summary of Symbion’s forecast financial performance for the year ended 31 December 2013 is set out
in Table 17 below. In our view, the most significant features of the forecast are as follows:
� Total net sales are forecast to be reasonably flat. Reduced sales in Pharmacy (due to the on-
going impact of the PBS reforms) are expected to be offset by increased sales in Hospital and
emerging business units such as Consumer Products and APHS Packaging.
� Compared to FY2012, EBITDA is forecast to increase by around $A8 million with an EBITDA
margin of 3.1% (up from 2.9% in FY2012). Given the flat forecast in net sales, most of the
improvement in EBITDA is expected to result from improvement in gross profit margins.

EBOS Group Limited – Independent Adviser’s Report Page 29
Profile of Symbion
Table Table Table Table 17171717: Symbion Statement of Forecas: Symbion Statement of Forecas: Symbion Statement of Forecas: Symbion Statement of Forecast Financial Performancet Financial Performancet Financial Performancet Financial Performance
12 months to12 months to12 months to12 months to 31313131 DecDecDecDec 2012012012013333
(A$m)(A$m)(A$m)(A$m)
Net SalesNet SalesNet SalesNet Sales $3,726$3,726$3,726$3,726
Cost of Goods Sold $3,454
Gross ProfitGross ProfitGross ProfitGross Profit $272$272$272$272
Gross Margin 7.3%
Other Income $71
Total Operating Expenses $226
EBITDAEBITDAEBITDAEBITDA $117$117$117$117
EBITDA Margin 3.1%
Source: Symbion Management Forecast (Unaudited)
Symbion’s statement of forecast financial position as at 31 December 2013 is set out in Table 18 below.
Apart from tighter management of receivables and a continued reduction in debt levels, no significant
change is expected compared to the position in FY2012.
Table Table Table Table 18181818: Symbion Statement of Fore: Symbion Statement of Fore: Symbion Statement of Fore: Symbion Statement of Forecast Financial Position cast Financial Position cast Financial Position cast Financial Position
As at As at As at As at 31313131 DecDecDecDec 2012012012013333
(A$m)(A$m)(A$m)(A$m)
Assets
Cash and Equivalents $30
Receivables $521
Inventory $289
Other Current Assets $50
Total Current Assets $890$890$890$890
Property, Plant & Equipment $94
Intangibles and Goodwill $89
Other Non-Current Assets $19
Total Non-Current Assets $202$202$202$202
Total AssetsTotal AssetsTotal AssetsTotal Assets $1,092$1,092$1,092$1,092
Liabilities
Payables $511
Debt $170
Other Current Liabilities $18
Total Current Liabilities $699$699$699$699
Debt $19
Other Non-Current Liabilities $15
Total Non-Current Liabilities $34$34$34$34
Total LiabilitiesTotal LiabilitiesTotal LiabilitiesTotal Liabilities $733$733$733$733
Equity
Retained Earnings $191
Equity $168
Total EquityTotal EquityTotal EquityTotal Equity $$$$359359359359
Source: Symbion Management Forecast (Unaudited)

EBOS Group Limited – Independent Adviser’s Report Page 30
Profile of Symbion
3.10.2 Key Business Risks
Symbion is exposed to a number of risks common to many businesses, including (among others) reliance
on key customers and suppliers, and the ability to retain key personnel. However, the majority of the key
business risks are market driven. A summary of those market risks is set out in Table 19 below.
Table Table Table Table 19191919: : : : Symbion’s Key Market RisksSymbion’s Key Market RisksSymbion’s Key Market RisksSymbion’s Key Market Risks
Market RiskMarket RiskMarket RiskMarket Risk DescriptionDescriptionDescriptionDescription
PBS Price Reform The package of reforms to the PBS is expected to reduce PBS funding for existing drugs.
The dollar value impact of the reforms is hard to predict, and different estimates exist within
the industry. PBS price reform, particularly driven by the substitution of proprietary brand-
name products (protected by patent) with cheaper generic equivalents, is likely to slowly
drive down the average value (and therefore statutory wholesaler margin) per script.
Against this, costs-to-serve per script are likely to grow steadily, placing pressure on
wholesaler margins.
CSO Funding Rebate The Commonwealth Government has committed to the CSO funding pool until June 2015
under the Fifth Community Pharmacy Agreement. Although most market participants
believe CSO funding will continue in the medium term, there is a risk that Government
funding of the CSO pool will grow more slowly than wholesaler costs, potentially eroding
wholesaler margins over time.
Pharmacy Ownership Rules
Current legislation specifically prevents corporate ownership of pharmacies, which has
excluded supermarkets from entering the pharmacy retailing space. However, large
Australian supermarket chains have in the past made several unsuccessful attempts to
enter this space (a practice which is common in overseas markets such as the US and UK).
If the supermarkets were successful in lobbying the Government to overturn the current ban
and allow their entry into pharmacy retailing, this would have serious negative implications
for existing pharmaceutical wholesalers. Overseas experience has demonstrated that
where the supermarkets have entered the sector at scale, they have been successful in
capturing market share through a combination of customer convenience and low operating
margins. Existing wholesalers would almost certainly lose business as supermarket
volumes would be fulfilled through their own internal supply chains.
Pharmacy Trading Terms Wholesalers typically negotiate trading terms with retail pharmacy customers on an annual
basis. The two most important items are:
� PPPPayment daysayment daysayment daysayment days: Historically, there have been significant differences between the
three major wholesalers in terms of the number of days they have required
customers to pay. The difference in payment days between all three major
wholesalers has reduced in recent years.
� DDDDiscount levelsiscount levelsiscount levelsiscount levels: Most wholesalers have historically rebated a proportion of their
PBS margin (i.e. transferring value to the retailer). In response to recent industry
changes (e.g. PBS reforms and Pfzier’s direct distribution model), the level of
discounting has been reduced.
Whether Symbion can continue to maintain existing trading terms will depend on the
actions of its competitors, the magnitude of on-going industry reforms, and the extent to
which any adverse impacts can be “shared” with retail customers.
Direct Distribution In early 2011 Pfizer decided to supply its products directly to pharmacies under an
exclusive logistics arrangement with DHL. This had a negative impact on Symbion by
reducing the volume of pharmaceuticals that Pharmacy would otherwise have distributed.
If other manufacturers decided to follow Pfizer’s approach, it would materially impact the
wholesale model. Effects would be direct (through volume losses) and potentially indirect
as it could question the need for Government funding of the CSO (which manufacturers
such as Pfizer cannot access).
Source: Symbion Management, Northington Partners' Analysis
All of these key market risks appear to be well understood by market participants. The industry has
employed various strategies to deal with the effects of some of the risks, while others are viewed as
unlikely to materialise (at least in the short-medium term):

EBOS Group Limited – Independent Adviser’s Report Page 31
Profile of Symbion
� PBS ReformPBS ReformPBS ReformPBS Reform:::: Wholesalers should retain the ability to reduce the size of their discounts to offset
the impact of lower script values. Many market players have successfully implemented such
changes to date.
� CSO FundingCSO FundingCSO FundingCSO Funding: Full-line wholesalers will no doubt closely analyse the evolving costs of meeting
their CSO obligations. Together with industry groups such as the Australian Pharmacy Guild,
they should be in a position to actively lobby the Government about any emerging disparity
between CSO funding and the costs to serve.
� Pharmacy Ownership RulePharmacy Ownership RulePharmacy Ownership RulePharmacy Ownership Rules: s: s: s: The prospects of the supermarkets entering the pharmacy retail
space is considered low given the political risks involved and the strength of industry lobby
groups. Additionally, average industry margins are lower now than when supermarkets initially
expressed interest in the possibility of entering the space (making it harder to justify the additional
investment that they would need to make), and the two main supermarket chains are facing a
possible ACCC enquiry into their competitive behaviour in the grocery market (reducing the
chances of regulatory change to pharmacy ownership rules that would work in their favour).
� Pharmacy Trading TermsPharmacy Trading TermsPharmacy Trading TermsPharmacy Trading Terms: : : : Viable wholesalers are a key enabler of pharmacists retaining their
preferred industry structure. Although there appears to be little room for general improvements in
trading terms to improve margins, changes may be possible if they are backed by analysis (as in
recent years) to offset external shocks of reform.
� DiDiDiDirect rect rect rect DDDDistribution istribution istribution istribution RRRRisksisksisksisks: The challenges faced to date by Pfizer (e.g. high discounts, no access
to CSO funding, and the suggestion of dissatisfaction among some pharmacists about lower
service levels than full-line wholesalers) suggest the risk of significant volumes being moved away
from wholesalers by other manufacturers is low.

EBOS Group Limited – Independent Adviser’s Report Page 32
Profile of EBOS
4.0 Profile of EBOS
4.1 Background
4.1.1 Business Overview
EBOS is New Zealand’s largest diversified pharmaceutical, medical and animal care products group,
focussing on wholesaling, logistics and sales and marketing. Headquartered in Christchurch and listed
on the NZSX, the Company employs more than 940 personnel across its operations in New Zealand,
Australia and the Pacific Islands.
EBOS has grown strongly over recent years, with revenue increasing from NZ$307 million in 2007 to
NZ$1.43 billion in 2012 (EBITDA increased from NZ$19 million to NZ$47 million over the same period).
Organic growth has been supplemented by several acquisitions, most notably the NZ$87 million
purchase9 of PRNZ Limited (“PRNZPRNZPRNZPRNZ”) in 2007 and the NZ$105 million purchase of Masterpet Corporation
Limited (“MaMaMaMasterpetsterpetsterpetsterpet”) in 2011.
A high-level summary of EBOS’ business divisions is set out in Table 20, with more detailed information
on each division provided in Section 4.2 to Section 4.7.
Table Table Table Table 20202020: : : : Summary of Summary of Summary of Summary of EBOS EBOS EBOS EBOS Business DivisionsBusiness DivisionsBusiness DivisionsBusiness Divisions
Industry Industry Industry Industry SegmentSegmentSegmentSegment
DivisionDivisionDivisionDivision DescriptionDescriptionDescriptionDescription
Healthcare ProPharma A wholesale supplier of pharmaceuticals to retail pharmacy stores throughout
New Zealand.
OneLink A specialist full-line wholesaler distributing medical consumables and
pharmaceuticals to public and private hospitals in New Zealand.
Healthcare Logistics A pre-wholesale business providing distribution and logistics support to
manufacturers, medical device, and OTC suppliers across New Zealand.
EBOS Healthcare
New Zealand
A specialist sales and marketing business to the medical and retail sectors in
New Zealand.
EBOS Healthcare
Australia
A provider of wholesale services and sales and marketing services to medical
centres, hospitals, specialists and pharmacy wholesalers in Australia.
Animal Care Masterpet Sales, marketing and distribution of pet care brands to customers in New
Zealand and Australia.
Source: Northington Partners' Analysis
The ProPharma division is the most significant contributor to EBOS revenue, comprising over 43% of
FY2012 revenue. However, EBITDA margins from ProPharma are low, and other higher margin business
units make a significant contribution to overall EBOS profitability.
4.1.2 Industry Overview
New Zealand’s total healthcare spend was approximately NZ$21.8 billion in 2012, representing around
10.5% of GDP10. Expenditure by Government accounts for more than 80% of this figure. Over recent
decades, total healthcare spending has increased at a rate greater than the nominal growth in GDP. This
trend is widely expected to continue in the foreseeable future, driven by several key factors as set out in
Table 21 below.
9 Consideration paid for 100% of the shares on issue in PRNZ Limited 10 Source: Statistics New Zealand, Ministry of Health

EBOS Group Limited – Independent Adviser’s Report Page 33
Profile of EBOS
Table Table Table Table 21212121: : : : Key Factors Influencing Key Factors Influencing Key Factors Influencing Key Factors Influencing Projected Projected Projected Projected New Zealand New Zealand New Zealand New Zealand Healthcare ExpenditureHealthcare ExpenditureHealthcare ExpenditureHealthcare Expenditure
FactorFactorFactorFactor DescriptionDescriptionDescriptionDescription
Aging Population An ageing population affects healthcare spending as older people tend to incur more
healthcare costs, particularly in end-of-life care. The demographic shift underway in New
Zealand is significant, with the proportion of the population over 65 forecast to increase
from around 14% currently to around 25% in 205011.
New Technologies Public expectations of the health system increase as technology progressively extends the
range of possible treatment options. New treatments tend to involve new spending with
relatively high unit costs.
Health Consciousness Over recent decades there has been an increase in the general health consciousness of the
New Zealand public. This has resulted in a corresponding preparedness of New
Zealanders to spend a greater proportion of their income on preventative health products,
including OTC and complementary medicines.
Source: Northington Partners' Analysis
The New Zealand pharmaceutical market is a subset of the total healthcare market. The industry
recorded sales of around NZ$1.36 billion in 2012, with sales forecast to increase between 0.3% and
1.0% year on year between 2013 and 201712.
A large portion of New Zealand’s pharmaceutical spending flows through the Pharmaceutical
Management Agency (“PHARMACPHARMACPHARMACPHARMAC””””), an entity which reports directly to the Minister of Health. Operating
within a funding budget, PHARMAC is tasked with securing universal and affordable access to essential
pharmaceuticals to the public. Most of the prescription medications managed by PHARMAC are fully
subsidised by the Government.
PHARMAC contracts directly with the suppliers of pharmaceuticals, with reference prices used for all
drugs. PHARMAC generally only lists and subsidises one version of a generic drug, with the selection
made through a tendering process. Once the subsidy is set by PHARMAC, the ultimate price for ethical
pharmaceuticals is determined as follows:
� The suppliers’ selling prices, which are generally equal to the subsidies provided by PHARMAC.
A premium may apply to some pharmaceuticals for which the consumer pays;
� A margin on PHARMAC’s subsidy that covers stock holding and procurement costs; and
� A dispensing fee which is partly reimbursed to retail pharmacies.
Given that the price ex-supplier is determined by PHARMAC, the only scope available for a wholesaler to
affect wholesale pricing of ethical pharmaceuticals is in terms of its margin. However, the same
regulatory constraints do not apply to OTC pharmaceuticals, where pricing is influenced by competitive
forces. Consequentially, the wholesale margin on OTC pharmaceuticals can be larger than that for the
ethical sector.
The PHARMAC funding process has had the effect of containing both the price and availability of
pharmaceuticals in New Zealand. Due to PHARMAC’s funding policies, some newer medicines have not
been released to market. Industry-sponsored research found that of the 83 new prescription-only
medicines listed on Australia's PBS between May 2000 and October 2006, only 22 were reimbursed in
New Zealand.
11 Source: Statistics New Zealand 12 Source: Statistics New Zealand

EBOS Group Limited – Independent Adviser’s Report Page 34
Profile of EBOS
4.1.3 Corporate Structure
The corporate structure for the EBOS group is set out in Figure 8 below:
Figure Figure Figure Figure 8888: EBOS Group Corporate Structure: EBOS Group Corporate Structure: EBOS Group Corporate Structure: EBOS Group Corporate Structure
Source: EBOS
The ProPharma, Onelink and Healthcare Logistics divisions all operate out of Pharmacy Retailing NZ Ltd.
Healthcare New Zealand and Healthcare Australia operate out of EBOS Group Ltd and EBOS Group Pty
Ltd, respectively, with Masterpet operating out of separate legal entities incorporated in New Zealand and
Australia. A number of dormant companies exist within the overall EBOS group structure; they are not
relevant for the purposes of this report and have therefore been excluded from the corporate structure
diagram represented above.
4.1.4 Significant Historical Events
Key milestones in EBOS’ history are summarised below:
� 1922192219221922: The Company was founded as Early Brothers Trading Co. Ltd
� 1960196019601960: Listing on the New Zealand Stock Exchange
� 1986198619861986:::: The Company name became EBOS Group Ltd
� 1989198919891989: : : : EBOS commenced trading in Australia
� 1990199019901990: : : : Acquired Kempthorne Medical Supplies Ltd, New Zealand’s oldest medical company
� 1993199319931993: : : : Established separate operating divisions to focus on specific market segments
� 1996199619961996: : : : Acquisition of the largest private medical wholesaler in Australia – Richard Thompson & Co
� 2000:2000:2000:2000: Opened EBOS Papua New Guinea
PRNZ Ltd
Pharmacy Retailing
NZ Ltd
EBOS Healthcare (Australia)
Pty Ltd
Healthcare Distributors Pty
Ltd
EBOS Group Pty Ltd
NZ
AUS
Animates NZ Holdings
Ltd
Masterpet Australia Pty Ltd
Botany Bay Imports &
Exports Pty Ltd
Beaphar Australia Pty Ltd
50%
100%
Masterpet Corporation Ltd
EBOS Group Ltd
EBOS Group Limited – Independent Adviser’s Report Page 35
Profile of EBOS
� 2000:2000:2000:2000: Acquired Medic Corporation, a healthcare and scientific company
� 2002200220022002: : : : Completion of the acquisition of Health Support Ltd
� 2002200220022002: : : : Acquisition of the Natures Kiss business, including the hero brand Anti-Flamme
� 2004200420042004: : : : Acquisition of Stelmara Medical & Vernon Carus to expand Australian coverage to
Queensland and Victoria
� 2005200520052005: : : : Acquisition of scientific companies in both Australia and New Zealand
� 2006:2006:2006:2006: Attained Top 50 listing on the NZSX
� 2007200720072007: : : : Acquired 100% of pharmaceutical wholesaler PRNZ Ltd (which comprises the ProPharma
and Healthcare Logistics divisions)
� 2010201020102010: : : : Opened EBOS Fiji, and sold the scientific businesses portfolio to focus on healthcare
markets
� 2012201220122012: : : : Acquired 100% of animal health business Masterpet and, via Masterpet’s ownership, 50%
of Animates pet store group.
4.2 ProPharma
ProPharma distributes ethical and OTC products to retail pharmacies throughout New Zealand and is
currently the largest part of EBOS in terms of revenue and EBITDA contribution. The division:
� Is New Zealand’s only national pharmaceutical wholesaler;
� Operates from 8 branches with a staff of around 260;
� Conducts its business through the ProPharma, PWR (Pharmacy Wholesale Russells) and
Pharmalines brands;
� Supplies around 700 pharmacy stores;
� Has long-term supply relationships with leading pharmacy groups and independent pharmacies:
� Operates a third party logistics distribution centre for NZSX listed Pharmacybrands
Limited (which represents more than 300 community pharmacies operating under the
Unichem, Amcal, Life, Radius and Care Chemists brands); and
� Supplies over 100 independent pharmacies under the Vantage Gold Club label; and
� Serves as the sole specialist service provider for the “Community Client” program delivering
medical products directly to residential addresses on behalf of ACC.
ProPharma (including PWR and Pharmalines) is the market leader in the pharmacy wholesaling sector,
with three co-operative groups holding the majority of the remaining market share: CDC Pharmaceuticals
Limited, Pharmacy Wholesalers (Bay of Plenty) Limited, and Pharmacy Wholesalers (Central) Limited.
Figure 9 below sets out estimated national market share data for December 2012.
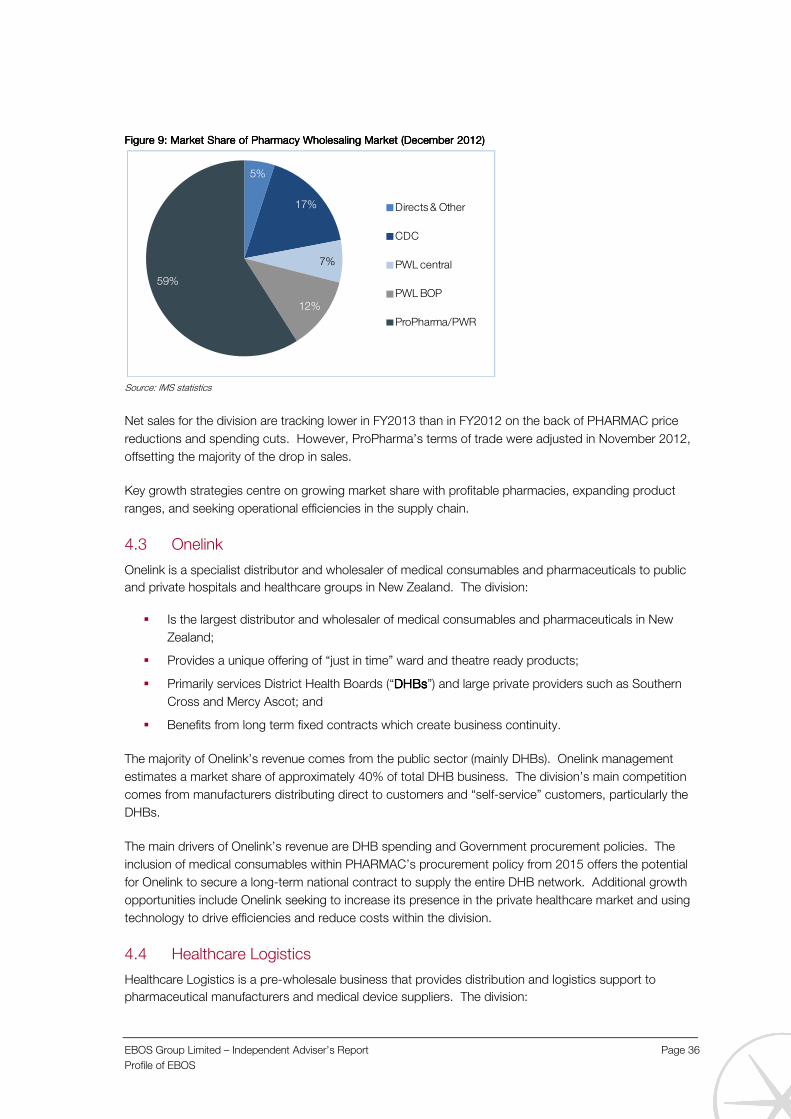
EBOS Group Limited – Independent Adviser’s Report Page 36
Profile of EBOS
Figure Figure Figure Figure 9999: Market Share of Pharmacy Wholesaling Market (December 2012): Market Share of Pharmacy Wholesaling Market (December 2012): Market Share of Pharmacy Wholesaling Market (December 2012): Market Share of Pharmacy Wholesaling Market (December 2012)
Source: IMS statistics
Net sales for the division are tracking lower in FY2013 than in FY2012 on the back of PHARMAC price
reductions and spending cuts. However, ProPharma’s terms of trade were adjusted in November 2012,
offsetting the majority of the drop in sales.
Key growth strategies centre on growing market share with profitable pharmacies, expanding product
ranges, and seeking operational efficiencies in the supply chain.
4.3 Onelink
Onelink is a specialist distributor and wholesaler of medical consumables and pharmaceuticals to public
and private hospitals and healthcare groups in New Zealand. The division:
� Is the largest distributor and wholesaler of medical consumables and pharmaceuticals in New
Zealand;
� Provides a unique offering of “just in time” ward and theatre ready products;
� Primarily services District Health Boards (“DHBsDHBsDHBsDHBs”) and large private providers such as Southern
Cross and Mercy Ascot; and
� Benefits from long term fixed contracts which create business continuity.
The majority of Onelink’s revenue comes from the public sector (mainly DHBs). Onelink management
estimates a market share of approximately 40% of total DHB business. The division’s main competition
comes from manufacturers distributing direct to customers and “self-service” customers, particularly the
DHBs.
The main drivers of Onelink’s revenue are DHB spending and Government procurement policies. The
inclusion of medical consumables within PHARMAC’s procurement policy from 2015 offers the potential
for Onelink to secure a long-term national contract to supply the entire DHB network. Additional growth
opportunities include Onelink seeking to increase its presence in the private healthcare market and using
technology to drive efficiencies and reduce costs within the division.
4.4 Healthcare Logistics
Healthcare Logistics is a pre-wholesale business that provides distribution and logistics support to
pharmaceutical manufacturers and medical device suppliers. The division:
5%
17%
7%
12%
59%
Directs & Other
CDC
PWL central
PWL BOP
ProPharma/PWR

EBOS Group Limited – Independent Adviser’s Report Page 37
Profile of EBOS
� Offers an effective presence for more than 70 multinational pharmaceutical and medical device
companies that do not have their own full service operations in New Zealand;
� Distributes 100% of the vaccines used in New Zealand medical practices;
� Has multiple distribution channels (pharmaceutical wholesalers, pharmacies, hospitals and retail
clients including supermarkets); and
� Provides a full range of distribution services including cold chain and humidity controlled
distribution, and controlled drug storage.
Healthcare Logistics is the leading supplier in the market, with a market share of approximately 45% of
the pharmaceuticals market. Key competitors include DHL, as well as direct supply from manufacturers.
Pricing within the sector is competitive, with DHL in particular pricing aggressively to try and win new
business. Pricing pressures in the high volume pharmaceuticals segment are likely to remain in the near
term. Accordingly, divisional growth is centred on growing market share in high value/low volume
sectors, and expanding into the wider healthcare market, namely consumer products and medical
equipment/consumables.
4.5 EBOS Healthcare New Zealand
EBOS Healthcare New Zealand is a specialist sales and marketing business to the medical and retail
sectors. The division:
� Seeks to represent manufacturers’ brands as they would in their own right, offering sales and
marketing, distribution and IT capabilities;
� Operates as agent for a number of multinational brands, including Abbott, Ansell, AVENT, Becton
Dickinson, Deep Heat, Kimberly Clark, Sunrise, Teleflex, Vernacare and Welch Allyn;
� Has five dedicated business units providing manufacturers access to six core channels; and
� Utilises specialist sales and marketing teams to “follow the patient and provider”.
Around 75% of divisional revenue is derived from the medical sector, with the balance coming from the
retail sector.
Competition within the sector primarily comes from regional or single channel distributors. There is no
one single organisation that competes “like for like” across the entire New Zealand business.
Although growth prospects within the sector depend heavily on overall demand for health services, key
growth opportunities identified by management include securing additional agencies and brands, and
product and brand expansion through dual brands and line extensions. A focus will also remain on
utilising technology to drive greater business efficiencies and the effectiveness of the sales force.
4.6 EBOS Healthcare Australia
EBOS Healthcare Australia runs a similar business to EBOS Healthcare New Zealand. The division has a
strong presence, particularly within New South Wales, but a more limited overall market share than its
New Zealand equivalent business.
EBOS Healthcare Australia has a strong medical sector focus, with revenue primarily derived from GP
practices, day surgeries, hospitals and aged-care facilities. Key Australian offerings include infection
prevention brands like Vernacare and Cutan, consumer brands like Allersearch and hospital niche brands

EBOS Group Limited – Independent Adviser’s Report Page 38
Profile of EBOS
such as Eschmann. The division also continues to develop its own branded medical consumables range
under the In Health label.
As in New Zealand, competition in Australia comes from regional or single channel distributors. However,
there has also been a trend of consolidation toward a smaller number of national networks. In response,
the Australian business has recently expanded the scale of its pharmaceutical offering to obtain a more
substantial national presence, and now provides overnight services to customers from five distribution
centres.
Future growth in Australia is expected to be achieved through market share gains, particularly in
Queensland, South Australia and Western Australia. Based on EBOS’ New Zealand experience,
management believe good opportunities exist in Australia to expand existing market offerings.
4.7 Masterpet
Masterpet provides sales and marketing, wholesaling and distribution of pet care brands throughout New
Zealand and Australia. The business:
� Has its main offices and warehouse distribution in Wellington and Sydney, with sales offices in
three New Zealand and three Australian cities;
� Operates in the pet specialty retail market in New Zealand through the Animates joint venture,
(which it owns in a 50:50 partnership with Pet Barn Australia);
� Services a broad clientele, including specialty retail stores, “Big-Box” retail networks, veterinary
clinics, supermarkets and mass merchants such as The Warehouse and Big W; and
� Has an extensive product range, distributing or retailing everything from dog, cat and fish food to
pet care products such as brushes and shampoos.
As set out in Figure 10 below, Masterpet controls a strong portfolio of its own brands, as well as
distributing a number of well-known third party offerings.
Figure Figure Figure Figure 10101010: : : : Masterpet BrandsMasterpet BrandsMasterpet BrandsMasterpet Brands
Source: EBOS
Masterpet management estimates Masterpet New Zealand holds a less than 10% share in the overall
animal care product market in New Zealand, while Animates is the top ranked brand in the pet shop and
superstores segment, holding a 24% market share. Direct distribution by manufacturers (particularly to

EBOS Group Limited – Independent Adviser’s Report Page 39
Profile of EBOS
the grocery sector, which accounts for 78% of total revenue) is the key source of competition for
Masterpet.
Demand side trends within the industry are favourable, given stable pet populations and the increased
willingness of owners to invest in the health and happiness of their animals. Masterpet is targeting
opportunities for further expansion in Australia and New Zealand through category and channel growth
as well as expanded distribution rights.
4.8 Capital Structure and Ownership
As at 22 May 2013 2013, EBOS had 52,956,571 ordinary shares on issue held by 5,255 shareholders.
The Company’s top 20 shareholders are set out in Table 22 below.
Table Table Table Table 22222222: : : : EBOS’ EBOS’ EBOS’ EBOS’ Top Top Top Top 22220 Shareholders0 Shareholders0 Shareholders0 Shareholders
ShareholderShareholderShareholderShareholder Number of Number of Number of Number of
Shares HeldShares HeldShares HeldShares Held % % % %
ShareholdingShareholdingShareholdingShareholding
1 Whyte Adder No 3 Limited 3,754,868 7.1%
2 Accident Compensation Corporation 3,664,733 6.9%
3 Tea Custodians Limited 3,212,214 6.1%
4 New Zealand Superannuation Fund Nominees Limited 1,907,986 3.6%
5 Custodial Services Limited (A/C 3) 1,900,030 3.6%
6 Forsyth Barr Custodians Limited (1-33) 1,260,631 2.4%
7 Custodial Services Limited (A/C 2) 735,538 1.4%
8 Herpa Properties Limited 710,106 1.3%
9 Custodial Services Limited (A/C 18) 691,172 1.3%
10 CitiBank Nominees (New Zealand) Limited 685,046 1.3%
11 Superlife Trustee Nominees Limited 657,252 1.2%
12 Forsyth Barr Custodians Limited (1-17.5) 515,169 1.0%
13 Peter Miles Merton & CWM Trustee Company LTD 501,277 0.9%
14 Elite Investment Holdings Limited 500,000 0.9%
15 Custodial Services Limited (A/C 4) 497,659 0.9%
16 Forsyth Barr Custodians Limited (1-30) 456,192 0.9%
17 Investment Custodial Services Limited (A/C R) 452,375 0.9%
18 Custodial Services Limited (A/C 1) 444,072 0.8%
19 Investment Custodial Services Limited (A/C C) 439,594 0.8%
20 Mark Brendon Waller & Angela Laura Waller 424,703 0.8%
Top 2Top 2Top 2Top 20 Shareholders0 Shareholders0 Shareholders0 Shareholders 23,410,61723,410,61723,410,61723,410,617 44.2%44.2%44.2%44.2%
Remaining Shareholders 29,545,954 55.8%
Total Shares on IssueTotal Shares on IssueTotal Shares on IssueTotal Shares on Issue 52,956,57152,956,57152,956,57152,956,571 100.0%100.0%100.0%100.0%
Source: EBOS
EBOS is currently a widely held company with substantial shareholders owning less than 25% of the
Company’s shares. Substantial security shareholders (each a “SSHSSHSSHSSH”) as at the date of the last SSH
notices received by EBOS are set out in Table 23 below.

EBOS Group Limited – Independent Adviser’s Report Page 40
Profile of EBOS
Table Table Table Table 23232323: : : : EBOS EBOS EBOS EBOS Substantial Security HoldersSubstantial Security HoldersSubstantial Security HoldersSubstantial Security Holders
ShareholderShareholderShareholderShareholder Number of ShNumber of ShNumber of ShNumber of Shares ares ares ares
HeldHeldHeldHeld % % % %
ShareholdingShareholdingShareholdingShareholding
1 Whyte Adder No. 3 Limited & Herpa Properties Limited 4,464,974 8.4%
2 Accident Compensation Corporation 3,702,775 7.0%
3 Milford Asset Management Limited 3,528,052 6.7%
Substantial Security HoldersSubstantial Security HoldersSubstantial Security HoldersSubstantial Security Holders 11,11,11,11,695695695695,,,,808080801111 22.22.22.22.1111%%%%
Remaining Shareholders 41,260,770 77.9%
Total Shares on IssueTotal Shares on IssueTotal Shares on IssueTotal Shares on Issue 52,956,57152,956,57152,956,57152,956,571 100100100100.0.0.0.0%%%%
Source: EBOS
4.9 Share Price Performance and Liquidity
The performance of EBOS’ shares over the last five years (since May 2008) relative to the NZX50 Index is
shown below in Figure 11. EBOS’s share price has performed well relative to the index, reflecting the
relatively defensive nature of the business during the global financial crises and the successful
implementation and positive market reception of a number of acquisitions (most notably PRNZ in 2007
and Masterpet in 2011). We believe that the share price performance in the last 12 months has also
positively benefited from statements made by the Company that it is seeking growth from further
acquisitions and that it has considered a number of possible targets.
Figure Figure Figure Figure 11111111: : : : EBOS EBOS EBOS EBOS Share Price Performance Relative to NZX50 IndexShare Price Performance Relative to NZX50 IndexShare Price Performance Relative to NZX50 IndexShare Price Performance Relative to NZX50 Index
Source: Capital IQ, Northington Partners’ Analysis
1. Capital return only, not incorporating any allowance for dividends.
On a total shareholder return basis (adjusted for reinvested dividends as well as capital gains) investors in
EBOS have received a return of 20% per annum over the last 10 years.
-
$2.00
$4.00
$6.00
$8.00
$10.00
May-08 May-09 May-10 May-11 May-12 May-13
Sh
are
Pri
ce
Sh
are
Pri
ce
Sh
are
Pri
ce
Sh
are
Pri
ce
NZX50 Rebased EBOS Share Price
EBOS 108%1
NZX50 26%

EBOS Group Limited – Independent Adviser’s Report Page 41
Profile of EBOS
Table Table Table Table 24242424: Total EBOS Shareholder Return: Total EBOS Shareholder Return: Total EBOS Shareholder Return: Total EBOS Shareholder Returnssss
Time PeriodTime PeriodTime PeriodTime Period Total Shareholder Total Shareholder Total Shareholder Total Shareholder
ReturnReturnReturnReturn1111
1 Year 39%
3 Years 23%
5 Years 23%
10 Years 20%
Source: Capital IQ, Northington Partners’ Analysis 1.Total Shareholder Return is calculated as the CAGR of EBOS' share price growth (to 22 May 2013,) assuming all dividends are reinvested
Figure 12 below sets out the daily trading volumes in EBOS during the six month period to 22 May 2013.
Figure Figure Figure Figure 12121212: : : : EBOS Share LiquidityEBOS Share LiquidityEBOS Share LiquidityEBOS Share Liquidity
Source: Capital IQ / Northington Partners’ Analysis
Given the Company’s current market capitalisation and the widely held nature of its shares, share liquidity
in EBOS is modest with less than 5% of the shares on issue trading over the last six months. Further
details on the liquidity of EBOS’ shares are set out in Table 25 below.
Table Table Table Table 25252525: : : : EBOS EBOS EBOS EBOS Share Liquidity Last 6 MonthsShare Liquidity Last 6 MonthsShare Liquidity Last 6 MonthsShare Liquidity Last 6 Months
6 Months to6 Months to6 Months to6 Months to 22 22 22 22 May May May May 2013201320132013
Average Daily Share Trading Volume 21,415
Total Shares Traded (6 Month Period) 2,612,660
Shares on Issue 52,956,571
Total Volume / Shares on Issue 4.9%
Source: Capital IQ / Northington Partners’ Analysis
-
50
100
150
200
250
May-09 May-10 May-11 May-12 May-13
Da
ily V
olu
me
(0
00
sh
are
s)
Da
ily V
olu
me
(0
00
sh
are
s)
Da
ily V
olu
me
(0
00
sh
are
s)
Da
ily V
olu
me
(0
00
sh
are
s)
EBOS Daily Volume (000)

EBOS Group Limited – Independent Adviser’s Report Page 42
Profile of EBOS
4.10 Financial Information
4.10.1 Financial Performance
A summary of the financial performance of EBOS for the period FY2010 to FY2012 (together with the
FY2013 half year to 31 December 2012) is set out in Table 26 below.
Table Table Table Table 26262626: : : : EBOS Statement of Historical Financial PerformanceEBOS Statement of Historical Financial PerformanceEBOS Statement of Historical Financial PerformanceEBOS Statement of Historical Financial Performance
Year ending 30 JuneYear ending 30 JuneYear ending 30 JuneYear ending 30 June FYFYFYFY2010201020102010
(NZ$m)(NZ$m)(NZ$m)(NZ$m)
FYFYFYFY2011201120112011
(NZ$m)(NZ$m)(NZ$m)(NZ$m)
FYFYFYFY2012201220122012
(NZ$m)(NZ$m)(NZ$m)(NZ$m)
6 Months t6 Months t6 Months t6 Months to o o o
Dec Dec Dec Dec 2020202012121212
(NZ$m)(NZ$m)(NZ$m)(NZ$m)
Revenue $1,317 $1,344 $1,429 $755
Cost of Goods Sold $1,186 $1,207 $1,265 $658
Gross ProfitGross ProfitGross ProfitGross Profit $$$$131131131131 $$$$137137137137 $$$$164164164164 $$$$97979797
Gross Margin 10.0% 10.2% 11.5% 12.8%
Total Operating Expenses $91 $96 $117 $70
EBITDAEBITDAEBITDAEBITDA $$$$40404040 $$$$41414141 $$$$44447777 $$$$27272727
EBITDA Margin 3.0% 3.1% 3.2% 3.5%
Depreciation & Amortisation $4 $3 $4 $2
EBITEBITEBITEBIT $$$$33337777 $$$$38383838 $$$$43434343 $$$$22225555
EBIT Margin 2.7% 2.8% 3.0% 3.2%
Net Interest Expense / (Income) $6 $5 $7 $4
Income Tax Expense / (Income) $11 $9 $8 $6
Net IncomeNet IncomeNet IncomeNet Income (continuing(continuing(continuing(continuing operations)operations)operations)operations) $$$$20202020 $$$$23232323 $$$$28282828 $$$$15151515
Source: EBOS Audited Financial Statements (FY2010-FY2012), Unaudited Financial Statements (6 months to 31 December 2012)
The main features of EBOS’ historical financial performance can be summarised as follows:
� Revenue grew at a reasonably modest rate of 2% from FY2010 to FY2011 but increased by 6.3%
from FY2011 to FY2012. Stronger FY2012 revenue reflected the part-year contribution from the
acquisition of Masterpet (December 2011) which, together with revenue improvements in most
divisions, offset an approximate NZ$30 million decrease in revenue from Healthcare Logistics.
Revenue has continued to grow in the six months to 31 December 2012, up around 5% on an
annualised basis.
� Gross profit improved by 19.7% between FY2011 and FY2012, reflecting small improvements in
gross margins across several divisions and the contribution from the significantly higher margin
business of Masterpet.
� Total operating expenses increased from FY2011 to FY2012 reflecting the part year effect of
EBOS inheriting the operating cost base of the Masterpet business, which is also the reason for
the increased cost base (on an annualised basis) for the half year to 31 December 2012.
4.10.2 Financial Position
Table 27 below summarises EBOS’ financial position for the period FY2010 to FY2012 (together with the
FY2013 half year as at 31 December 2012). The main features of the financial position are as follows:
� The investment in property, plant and equipment (NZ$22 million as at 31 December 2012)
represented only 3.4% of total business assets. The majority of assets comprise elements of
working capital (cash, receivables and inventory) and the value attributed to intangibles and
goodwill (see below).

EBOS Group Limited – Independent Adviser’s Report Page 43
Profile of EBOS
� Intangibles and goodwill result from past business acquisitions by EBOS. The largest acquisitions
over recent years were the purchase of PRNZ in 2007 and Masterpet in December 2011.
� The increase in term debt from NZ$57 million in FY2011 to NZ$131 million in FY2012 relates to
the additional debt taken on by EBOS to fund the Masterpet acquisition.
Table Table Table Table 27272727: : : : EBOS Statement of Historical Financial Position EBOS Statement of Historical Financial Position EBOS Statement of Historical Financial Position EBOS Statement of Historical Financial Position
As atAs atAs atAs at 30 Jun 2030 Jun 2030 Jun 2030 Jun 2010101010
(NZ$m)(NZ$m)(NZ$m)(NZ$m)
As atAs atAs atAs at 30 Jun 201130 Jun 201130 Jun 201130 Jun 2011
(NZ$m)(NZ$m)(NZ$m)(NZ$m)
As atAs atAs atAs at 30 Jun 2030 Jun 2030 Jun 2030 Jun 2011112222
(NZ$m)(NZ$m)(NZ$m)(NZ$m)
As atAs atAs atAs at 31 Dec 201231 Dec 201231 Dec 201231 Dec 2012
(NZ$m)(NZ$m)(NZ$m)(NZ$m)
Assets
Cash and Equivalents $56 $100 $53 $42
Trade Receivables $148 $153 $176 $178
Inventory $128 $122 $163 $162
Other Current Assets $3 $4 $5 $5
Total Current AssetsTotal Current AssetsTotal Current AssetsTotal Current Assets $$$$336336336336 $$$$378378378378 $$$$397397397397 $$$$387387387387
Property, Plant & Equipment $18 $17 $23 $22
Investments - - $18 $19
Intangibles and Goodwill $158 $138 $212 $212
Other Non-Current Assets $7 $5 $8 $7
Total NonTotal NonTotal NonTotal Non----Current AssetsCurrent AssetsCurrent AssetsCurrent Assets $$$$182182182182 $$$$160160160160 $$$$261261261261 $$$$259259259259
Total AssetsTotal AssetsTotal AssetsTotal Assets $$$$518518518518 $$$$538538538538 $$$$658658658658 $$$$646646646646
Liabilities
Trade Payables $249 $259 $276 $263
Current Debt - - $11 $9
Other Current Liabilities $13 $9 $16 $13
Total CurrTotal CurrTotal CurrTotal Current Liabilitiesent Liabilitiesent Liabilitiesent Liabilities $$$$262262262262 $$$$268268268268 $$$$302302302302 $$$$286286286286
Term Debt $59 $57 $131 $127
Other Non-Current Liabilities $15 $14 $16 $17
Total NonTotal NonTotal NonTotal Non----Current LiabilitiesCurrent LiabilitiesCurrent LiabilitiesCurrent Liabilities $$$$74747474 $$$$71717171 $$$$147147147147 $$$$144144144144
Total LiabilitiesTotal LiabilitiesTotal LiabilitiesTotal Liabilities $$$$336336336336 $$$$340340340340 $$$$449449449449 $$$$430430430430
Equity
Common Stock $106 $108 $108 $112
Retained Earnings $77 $89 $100 $105
Other Equity $0 $2 $0 $0
TotalTotalTotalTotal EquityEquityEquityEquity $$$$183183183183 $$$$199199199199 $$$$209209209209 $$$$216216216216
Source: EBOS Audited Financial Statements (FY2010-FY2012), Unaudited Financial Statements (6 months to 31 December 2012)
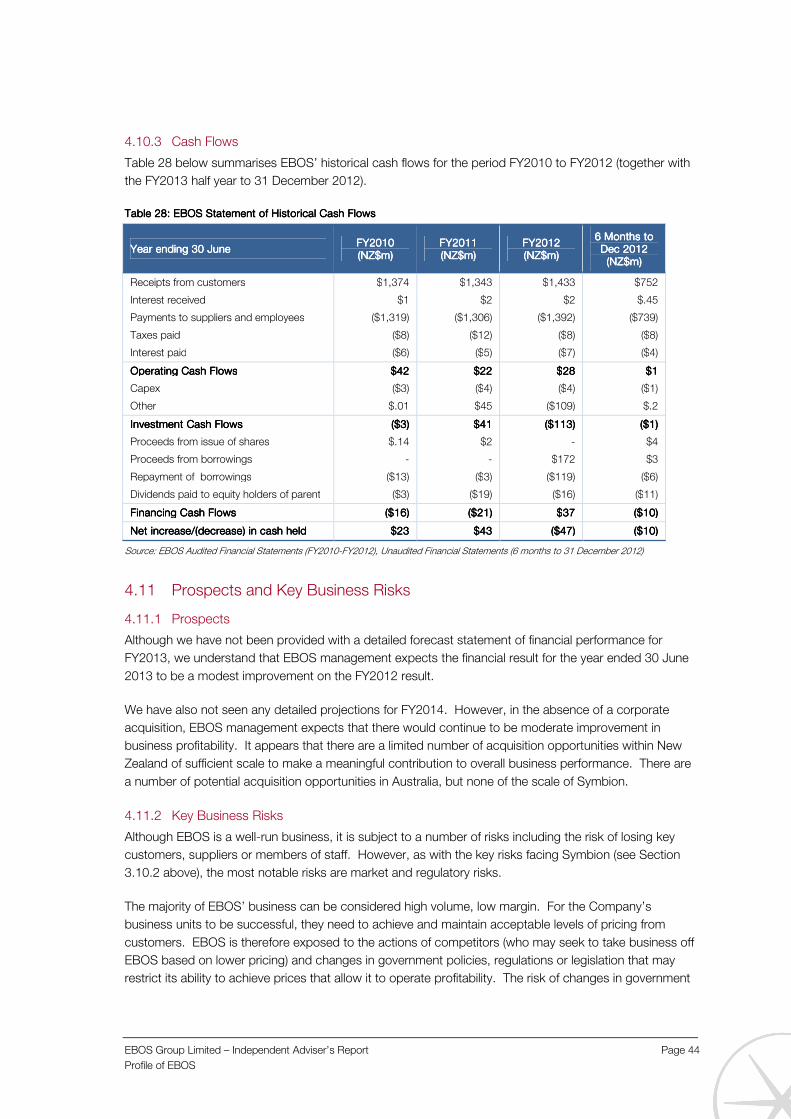
EBOS Group Limited – Independent Adviser’s Report Page 44
Profile of EBOS
4.10.3 Cash Flows
Table 28 below summarises EBOS’ historical cash flows for the period FY2010 to FY2012 (together with
the FY2013 half year to 31 December 2012).
Table Table Table Table 28282828: : : : EBOSEBOSEBOSEBOS Statement of Historical Cash FlowsStatement of Historical Cash FlowsStatement of Historical Cash FlowsStatement of Historical Cash Flows
Year ending 30 JuneYear ending 30 JuneYear ending 30 JuneYear ending 30 June FYFYFYFY2010201020102010 (NZ$m)(NZ$m)(NZ$m)(NZ$m)
FYFYFYFY2011201120112011 (NZ$(NZ$(NZ$(NZ$m)m)m)m)
FYFYFYFY2012201220122012 (NZ$m)(NZ$m)(NZ$m)(NZ$m)
6 Months to 6 Months to 6 Months to 6 Months to Dec Dec Dec Dec 2020202012121212
(NZ$m)(NZ$m)(NZ$m)(NZ$m)
Receipts from customers $1,374 $1,343 $1,433 $752
Interest received $1 $2 $2 $.45
Payments to suppliers and employees ($1,319) ($1,306) ($1,392) ($739)
Taxes paid ($8) ($12) ($8) ($8)
Interest paid ($6) ($5) ($7) ($4)
Operating Cash FlowsOperating Cash FlowsOperating Cash FlowsOperating Cash Flows $$$$42424242 $$$$22222222 $$$$28282828 $$$$1111
Capex ($3) ($4) ($4) ($1)
Other $.01 $45 ($109) $.2
Investment Cash FlowsInvestment Cash FlowsInvestment Cash FlowsInvestment Cash Flows (((($$$$3)3)3)3) $$$$41414141 (((($$$$113)113)113)113) (((($$$$1)1)1)1)
Proceeds from issue of shares $.14 $2 - $4
Proceeds from borrowings - - $172 $3
Repayment of borrowings ($13) ($3) ($119) ($6)
Dividends paid to equity holders of parent ($3) ($19) ($16) ($11)
Financing Cash FlowsFinancing Cash FlowsFinancing Cash FlowsFinancing Cash Flows (((($$$$16)16)16)16) (((($$$$21)21)21)21) $$$$37373737 (((($$$$10)10)10)10)
Net increase/(decrease) in cash heldNet increase/(decrease) in cash heldNet increase/(decrease) in cash heldNet increase/(decrease) in cash held $$$$23232323 $$$$43434343 (((($$$$47)47)47)47) (((($$$$10)10)10)10)
Source: EBOS Audited Financial Statements (FY2010-FY2012), Unaudited Financial Statements (6 months to 31 December 2012)
4.11 Prospects and Key Business Risks
4.11.1 Prospects
Although we have not been provided with a detailed forecast statement of financial performance for
FY2013, we understand that EBOS management expects the financial result for the year ended 30 June
2013 to be a modest improvement on the FY2012 result.
We have also not seen any detailed projections for FY2014. However, in the absence of a corporate
acquisition, EBOS management expects that there would continue to be moderate improvement in
business profitability. It appears that there are a limited number of acquisition opportunities within New
Zealand of sufficient scale to make a meaningful contribution to overall business performance. There are
a number of potential acquisition opportunities in Australia, but none of the scale of Symbion.
4.11.2 Key Business Risks
Although EBOS is a well-run business, it is subject to a number of risks including the risk of losing key
customers, suppliers or members of staff. However, as with the key risks facing Symbion (see Section
3.10.2 above), the most notable risks are market and regulatory risks.
The majority of EBOS’ business can be considered high volume, low margin. For the Company’s
business units to be successful, they need to achieve and maintain acceptable levels of pricing from
customers. EBOS is therefore exposed to the actions of competitors (who may seek to take business off
EBOS based on lower pricing) and changes in government policies, regulations or legislation that may
restrict its ability to achieve prices that allow it to operate profitability. The risk of changes in government

EBOS Group Limited – Independent Adviser’s Report Page 45
Profile of EBOS
policies is arguably a higher risk for EBOS than for businesses operating in different industry sectors
given the highly regulated (and political) nature of the pharmaceutical industry.
Although EBOS’ Australian focussed divisions are subject to Australian regulatory risk, the bulk of the
regulatory risks reside in New Zealand given that is where most of the Company’s businesses are based.
However, market based risks are very real for the Australian divisions, where EBOS management has
already identified those business units as coming under pressure from larger competitors who are able to
offer a more complete national service offering.

EBOS Group Limited – Independent Adviser’s Report Page 46
Profile of EBOS Following the Transaction
5.0 Profile of EBOS Following the Transaction The Transaction is by far the largest acquisition contemplated by EBOS to date. If the Transaction
Conditions are satisfied and the Transaction is implemented, the profile of EBOS will be significantly
altered. The following sections set out high level commentary on various aspects of EBOS’ profile after
the Transaction.
5.1 Market Position
The Transaction will result in EBOS having a significantly enhanced supply and distribution platform for
pharmaceutical products in both Australia and New Zealand. If the Transaction is successfully
implemented, EBOS is expected to have the following market positions:
� Number 1 in combined pharmacy and hospital pharmaceutical wholesaling and distribution in
Australia and in New Zealand;
� Number 1 pharmacy wholesaler in New Zealand;
� Number 2 pharmacy wholesaler in Australia;
� Number 1 in hospital pharmaceutical distribution in New Zealand;
� Number 1 in hospital pharmaceutical distribution in Australia; and
� Number 1 or 2 in pre-wholesale/third party logistics in New Zealand.
5.2 Service Offering and Capability
The businesses of EBOS and Symbion are complementary with a high degree of alignment. As a
combined group, EBOS will have a greater breadth of service offering and capability. Table 29
summarises the current service offerings of EBOS and Symbion, and shows that they are highly
complementary in all but one of the business sectors for the combined entity.
Table Table Table Table 29292929: : : : EBOS Post Transaction Service Offering and EBOS Post Transaction Service Offering and EBOS Post Transaction Service Offering and EBOS Post Transaction Service Offering and CapabilityCapabilityCapabilityCapability
Healthcare Healthcare Healthcare
Logistics and Distribution Manufacturer Services Pharmacy and Hospital Wholesaling
3rd party distribution and logistics solutions. Distribution systems and electronic ordering of supplies for healthcare providers.
Product management solutions to pharmaceutical companies. Clinical trial logistics and depot services.
Specialist wholesaler and distributor of ethical, OTC and consumer products to pharmacies and public and private hospitals.

EBOS Group Limited – Independent Adviser’s Report Page 47
Profile of EBOS Following the Transaction
Healthcare Healthcare Healthcare
Sales and Marketing Retail Brands and Services Veterinary / Pet Products
Sales and marketing of a wide range of healthcare products across consumer, primary care, hospital, aged care and international markets.
Retail pharmacy brand ownership, sales of branded product and operation of pharmacy support and management systems.
Veterinary wholesaler, distributor and retailer of animal healthcare products, pet accessories and premium foods across Australasia.
Source: Northington Partners' Analysis
5.3 Pro-forma Financial Information
The pro-forma financial information set out in this section has been determined on the basis that the
Transaction occurred on 1 July 2012. The numbers presented:
� Represent a simple aggregation of the financial information for each of EBOS and Symbion;
� Are based on 10 months (9 months) of actual results for EBOS (Symbion) and the current
forecast for the remaining 2 months (3 months); and
� Do not include any cost savings or revenue synergies.
5.3.1 Financial Performance
Set out in Table 30 below are the pro-forma financials for FY2013 and prospective financial information
(“PFIPFIPFIPFI”) to 31 December 2013. Although a number of adjustments were made (to take account of the
impact of the Transaction including adjustments to amortisation charges, estimated borrowings costs
and directors costs for the forecast period, and the resulting tax impact of these adjustments), none of
the adjustments were particularly material.
Table Table Table Table 30303030: : : : EBOS EBOS EBOS EBOS PFIPFIPFIPFI
6 months to6 months to6 months to6 months to 31 Dec 201331 Dec 201331 Dec 201331 Dec 2013
(NZ$m)(NZ$m)(NZ$m)(NZ$m)
Revenue from Continuing Operations $3,170
EBITDAEBITDAEBITDAEBITDA $104$104$104$104
Depreciation $7
Amortisation of finite life intangibles $8
Net Interest Expense / (Income) $18
ProfProfProfProfit before Taxit before Taxit before Taxit before Tax $70$70$70$70
Income Tax Expense / (Income) $21
Profit after TaxProfit after TaxProfit after TaxProfit after Tax $49$49$49$49
Source: EBOS (Unaudited)

EBOS Group Limited – Independent Adviser’s Report Page 48
Profile of EBOS Following the Transaction
The increased scale of the combined group is expected to allow for operational efficiency gains and
potential cost rationalisation in premises, operations and back office functions. However, no synergy
gains have been incorporated into the PFI.
5.3.2 Financial Position
A PFI statement of financial position as at 31 December 2013 is set out in Table 31. Because the
Transaction will not have been fully funded by EBOS as at the 30 June 2013 balance date, the pro-forma
financial position at that time is not very useful and has therefore been excluded.
Table Table Table Table 31313131: : : : EBOS EBOS EBOS EBOS PFI Statement of PFI Statement of PFI Statement of PFI Statement of Financial PositionFinancial PositionFinancial PositionFinancial Position
31 Dec 201331 Dec 201331 Dec 201331 Dec 2013 (NZ(NZ(NZ(NZ$m)$m)$m)$m)
AssetsAssetsAssetsAssets
Cash And Equivalents $75
Accounts Receivable $832
Inventory $522
Other Current Assets $63
Property Plant & Equipment $95
Investments $20
Intangibles and Goodwill $898
Other Non-Current Assets $10
Total AssetsTotal AssetsTotal AssetsTotal Assets $2,5$2,5$2,5$2,514141414
LiabilitiesLiabilitiesLiabilitiesLiabilities
Payables $913
Current Debt $211
Other Current Liabilities $39
Term Debt $300
Other Non-Current Liabilities $72
Total LiabilitiesTotal LiabilitiesTotal LiabilitiesTotal Liabilities $$$$1111,,,,535353536666
EquityEquityEquityEquity
Issued Capital $849
Retained Earnings $131
Reserves ($2)
Total EquityTotal EquityTotal EquityTotal Equity $$$$978978978978
Source: EBOS (Unaudited)
5.3.3 Cash Flows
A PFI statement of cash flows to 31 December 2013 for EBOS is set out in Table 32 below. The main
features of the cash flows are the expected receipt of funds from the Rights Issue and the new debt
facility, and the cash payment to Zuellig as part consideration for the Transaction. All of these cash flows
will occur soon after 30 June 2013.

EBOS Group Limited – Independent Adviser’s Report Page 49
Profile of EBOS Following the Transaction
Table Table Table Table 32323232: : : : EBOS EBOS EBOS EBOS PFI Statement of PFI Statement of PFI Statement of PFI Statement of Cash Flows Cash Flows Cash Flows Cash Flows
6 months to6 months to6 months to6 months to 31 Dec 201331 Dec 201331 Dec 201331 Dec 2013
(NZ$m)(NZ$m)(NZ$m)(NZ$m)
Receipts from customers $3,113
Interest received $0
Payments to suppliers and employees ($3,035)
Taxes paid ($17)
Interest paid ($18)
Operating Cash FlowsOperating Cash FlowsOperating Cash FlowsOperating Cash Flows $43$43$43$43
Capex ($15)
Acquisition of Subsidiary ($369)
Other -
Investment Cash FlowsInvestment Cash FlowsInvestment Cash FlowsInvestment Cash Flows ($384)($384)($384)($384)
Proceeds from issue of shares $148
(Increase)/Decrease of investments in Class B Note
($5)
Proceeds from borrowings $140
Repayment of borrowings ($19)
Dividends paid to equity holders of parent ($22)
Financing Cash FlowsFinancing Cash FlowsFinancing Cash FlowsFinancing Cash Flows $242$242$242$242
Net increase/(decrease) in cash heldNet increase/(decrease) in cash heldNet increase/(decrease) in cash heldNet increase/(decrease) in cash held ($100)($100)($100)($100)
Source: EBOS (Unaudited)
5.4 Board and Management Structure
All of the current EBOS directors will remain on the Board after the Transaction. The only change to the
Board’s composition will be the addition of two new Zuellig representatives (Stuart McGregor and Peter
Williams), both of whom will become non-executive directors.
The management structure will also remain essentially unchanged. The Symbion management team, led
by Patrick Davies as CEO, will report directly to Mark Waller (EBOS’ current CEO).
5.5 Post Transaction Financial Metrics
An analysis of key financial metrics for EBOS immediately following the Transaction (calculated on a pro-
forma basis and based on a 30 June 2013 balance date) is set out in Table 33 below.
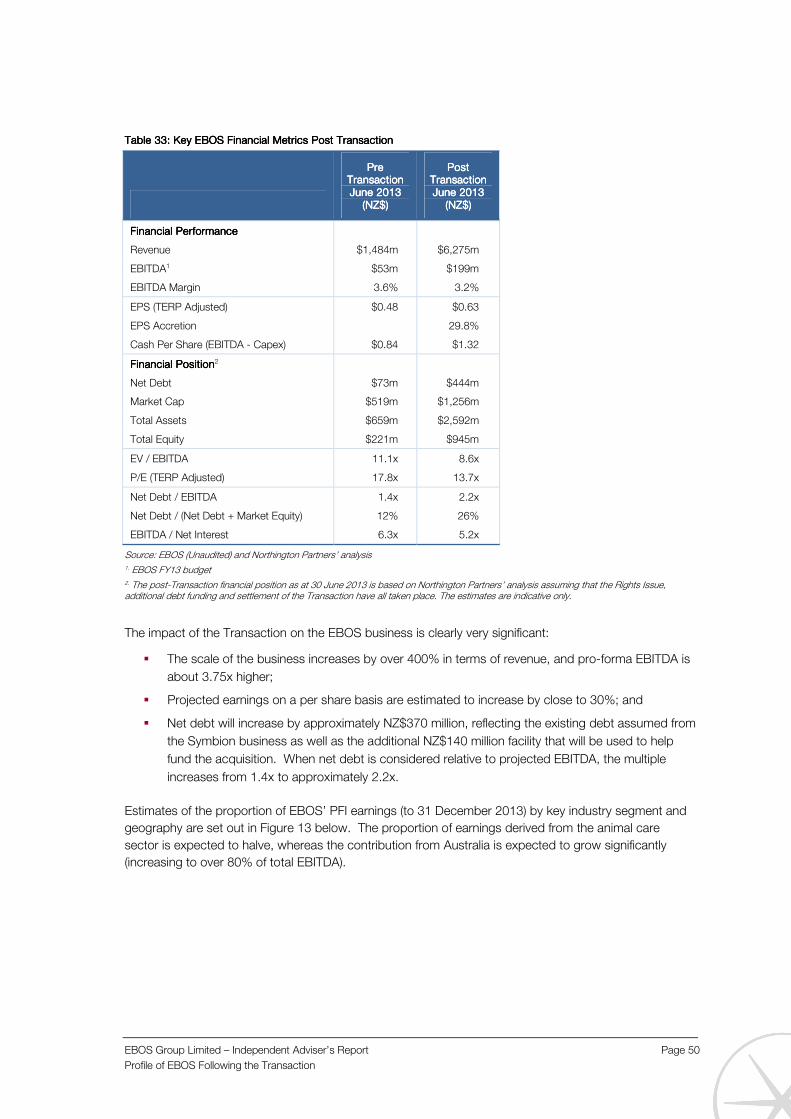
EBOS Group Limited – Independent Adviser’s Report Page 50
Profile of EBOS Following the Transaction
Table Table Table Table 33333333: : : : Key EBOS Financial Metrics Post TransactionKey EBOS Financial Metrics Post TransactionKey EBOS Financial Metrics Post TransactionKey EBOS Financial Metrics Post Transaction
Pre Pre Pre Pre TransactionTransactionTransactionTransaction June 2013June 2013June 2013June 2013
(NZ$)(NZ$)(NZ$)(NZ$)
Post Post Post Post TransactionTransactionTransactionTransaction June 2013June 2013June 2013June 2013
(NZ$)(NZ$)(NZ$)(NZ$)
Financial PerformanceFinancial PerformanceFinancial PerformanceFinancial Performance
Revenue $1,484m $6,275m
EBITDA1 $53m $199m
EBITDA Margin 3.6% 3.2%
EPS (TERP Adjusted) $0.48 $0.63
EPS Accretion 29.8%
Cash Per Share (EBITDA - Capex) $0.84 $1.32
Financial PositionFinancial PositionFinancial PositionFinancial Position2
Net Debt $73m $444m
Market Cap $519m $1,256m
Total Assets $659m $2,592m
Total Equity $221m $945m
EV / EBITDA 11.1x 8.6x
P/E (TERP Adjusted) 17.8x 13.7x
Net Debt / EBITDA 1.4x 2.2x
Net Debt / (Net Debt + Market Equity) 12% 26%
EBITDA / Net Interest 6.3x 5.2x
Source: EBOS (Unaudited) and Northington Partners’ analysis 1. EBOS FY13 budget 2. The post-Transaction financial position as at 30 June 2013 is based on Northington Partners’ analysis assuming that the Rights Issue, additional debt funding and settlement of the Transaction have all taken place. The estimates are indicative only.
The impact of the Transaction on the EBOS business is clearly very significant:
� The scale of the business increases by over 400% in terms of revenue, and pro-forma EBITDA is
about 3.75x higher;
� Projected earnings on a per share basis are estimated to increase by close to 30%; and
� Net debt will increase by approximately NZ$370 million, reflecting the existing debt assumed from
the Symbion business as well as the additional NZ$140 million facility that will be used to help
fund the acquisition. When net debt is considered relative to projected EBITDA, the multiple
increases from 1.4x to approximately 2.2x.
Estimates of the proportion of EBOS’ PFI earnings (to 31 December 2013) by key industry segment and
geography are set out in Figure 13 below. The proportion of earnings derived from the animal care
sector is expected to halve, whereas the contribution from Australia is expected to grow significantly
(increasing to over 80% of total EBITDA).

EBOS Group Limited – Independent Adviser’s Report Page 51
Profile of EBOS Following the Transaction
Figure Figure Figure Figure 13131313: EBOS: EBOS: EBOS: EBOS’’’’ Post Transaction Earnings by Industry Segment and GeographyPost Transaction Earnings by Industry Segment and GeographyPost Transaction Earnings by Industry Segment and GeographyPost Transaction Earnings by Industry Segment and Geography
EBOS (Post EBOS (Post EBOS (Post EBOS (Post TransactiTransactiTransactiTransaction)on)on)on)
EBITDA by Segment EBITDA by Segment EBITDA by Segment EBITDA by Segment
(HY14(HY14(HY14(HY141111))))
EBITDA by EBITDA by EBITDA by EBITDA by
Geography (HY14Geography (HY14Geography (HY14Geography (HY141111))))
Source: EBOS 1. Based on PFI for the half year to December 2013. An AUD/NZD exchange rate of 0.82 has been applied. EBITDA excludes an allocation of corporate overheads.
5.6 Market Capitalisation and NZSX Weighting
The Transaction will result in a substantial increase to EBOS’ market capitalisation, from around NZ$520
million to a level expected to exceed NZ$1,250 million (around $NZ750 million free float market
capitalisation). The higher market capitalisation is expected to result in13:
� An improvement in EBOS’ NZSX 50 ranking from 28th as at 16 May 2013 to a projected ranking
of 21st; and
� An increase in EBOs’ index weighting from 1.0% as at 16 May 2013 to a projected weighting of
around 1.5%.
In broad terms, EBOS’ NZSX 50 ranking and weighting is calculated by “free float” market capitalisation
(and there are liquidity thresholds to enter and remain in the index). For present purposes, the effect of
this methodology is that the 40% shareholding by Zuellig will be deemed a “strategic holding” and will be
excluded from the NZSX 50 ranking and weighting calculation.
We understand that the EBOS board has indicated an intention to dual list EBOS on the ASX by the end
of calendar year 2013. If a dual listing did in fact proceed, it would be reasonable to expect investor
interest levels in EBOS would improve with a resulting increase in share liquidity.
13 EBOS’ expected index ranking and weighting has not been approved or confirmed by NZX and is based on analysis performed by Northington Partners and EBOS.
34%
66%
Animal Care Healthcare
11%
89%
Animal Care Healthcare
17%
83%
Animal Care Healthcare
72%
28%
New Zealand Australia
100%
New Zealand Australia
19%
81%
New Zealand Australia
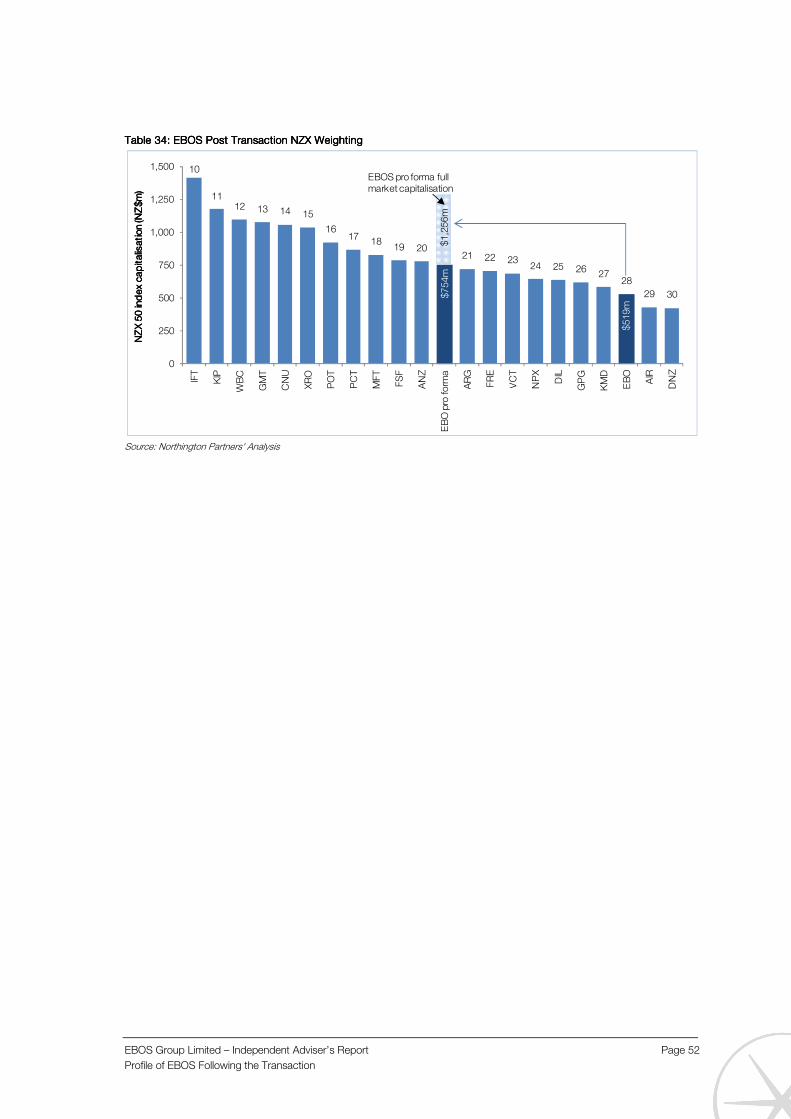
EBOS Group Limited – Independent Adviser’s Report Page 52
Profile of EBOS Following the Transaction
Table Table Table Table 34343434: : : : EBOS Post Transaction NZX WeightingEBOS Post Transaction NZX WeightingEBOS Post Transaction NZX WeightingEBOS Post Transaction NZX Weighting
Source: Northington Partners' Analysis
10
1112 13 14 15
1617
1819 20
21 22 2324 25 26
2728
29 30
0
250
500
750
1,000
1,250
1,500
IFT
KIP
WB
C
GM
T
CN
U
XR
O
PO
T
PC
T
MF
T
FS
F
AN
Z
EB
O p
ro f
orm
a
AR
G
FR
E
VC
T
NP
X
DIL
GP
G
KM
D
EB
O
AIR
DN
Z
NZ
X 5
0 in
de
x c
ap
ita
lisa
tio
n (N
Z$
m)
NZ
X 5
0 in
de
x c
ap
ita
lisa
tio
n (N
Z$
m)
NZ
X 5
0 in
de
x c
ap
ita
lisa
tio
n (N
Z$
m)
NZ
X 5
0 in
de
x c
ap
ita
lisa
tio
n (N
Z$
m)
EBOS pro forma full market capitalisation
$5
19
m
$7
54
m$
1,2
56
m

EBOS Group Limited – Independent Adviser’s Report Page 53
Valuation of Symbion
6.0 Valuation of Symbion
6.1 Valuation Summary
Figure 14 summarises our valuation assessment of Symbion. We have estimated a valuation range of
NZ$973 million to NZ$1,045 million for the equity in the business, based on a 100% control position.
Figure Figure Figure Figure 14141414: Comparison of the Purchase Price to our Valuation Range: Comparison of the Purchase Price to our Valuation Range: Comparison of the Purchase Price to our Valuation Range: Comparison of the Purchase Price to our Valuation Range
Source: EBOS, Northington Partners' Analysis
6.2 Valuation Methodology
In general terms, the value of equity in any company can be determined using a deductive approach that
begins with an estimate of the underlying enterprise value. Enterprise value represents the aggregate
value of the company’s on-going operations assuming that the assets are entirely equity funded. In order
to estimate the aggregate value of equity, the enterprise value is adjusted to account for the level of debt
carried by the company and the values of any other assets and liabilities of the company that are not
needed to maintain the core operations of the business.
A summary of the steps needed to estimate the aggregate equity value of EBOS is set out in Table 35
below.
Table Table Table Table 35353535: General Framework for Assessing Equity Value: General Framework for Assessing Equity Value: General Framework for Assessing Equity Value: General Framework for Assessing Equity Value
StepStepStepStep CommentCommentCommentComment
Value of Operating Assets Represents the aggregate value of the operating assets of the business.
Can be estimated using a variety of methods (see discussion in Section
6.2.1)
Plus Surplus Assets (if any) The value of assets that are not required to support the on-going
operation of the business and which can therefore be sold.
Less Net Debt Defined as interest-bearing debt less cash reserves. Does not
include any components of working capital.
Less Other Liabilities (if any) Accounts for other liabilities that would be borne by the new
owner of the company, such as the net present cost of derivative
exposures.
equals Equity Value Directly comparable to Market Capitalisation
In almost all cases, estimating enterprise value is the most difficult part of the process.
NZ$865m
NZ$973m
NZ$1,045m
NZ$650m
NZ$750m
NZ$850m
NZ$950m
NZ$1,050m
Purchase Price Low Value High Value
Sym
bio
n E
qu
ity
Va
lue
Sym
bio
n E
qu
ity
Va
lue
Sym
bio
n E
qu
ity
Va
lue
Sym
bio
n E
qu
ity
Va
lue

EBOS Group Limited – Independent Adviser’s Report Page 54
Valuation of Symbion
6.2.1 Alternative Methodologies
For a company viewed on a going-concern basis, enterprise value should be determined as a function of
the estimated level of cash returns that the operating assets are expected to generate in the future. The
specific approach that is used to estimate this value is dependent on the nature of the company and the
expectations regarding future performance. The two main approaches usually adopted in the valuation
of publicly listed companies and large private companies are summarised as follows:
� Earnings MultipleEarnings MultipleEarnings MultipleEarnings Multiple: This method determines enterprise value by applying a valuation multiple to
the assessed level of maintainable annual earnings (or cash flows), where the multiple is chosen to
reflect the future growth prospects and risk profile of the business. Depending on the nature of
the business, earnings can be appropriately measured at the EBITDA, EBITA, EBIT, or NPAT
levels.
� DCFDCFDCFDCF: A DCF approach is based on an explicit forecast of the annual cash flows that will be
generated over a specified forecast period (typically between 5 and 10 years). The value of cash
flows that may occur after the end of the explicit forecast period are incorporated into the
valuation process by capitalising an estimate of maintainable cash flows for the terminal period. A
DCF model is therefore usually made up of two components:
(i) The present value of the projected cash flows during the forecast period; and
(ii) The present value of all other cash flows projected to occur after the explicit forecast
period. This component is commonly referred to as the terminal value.
Each approach has some advantages and disadvantages, and the most appropriate choice is dependent
on the characteristics of the business under consideration and the quality of the market data that is
available. The key advantage of the earnings multiple approach is its simplicity. Total enterprise value is
determined on the basis of the actual earnings results for the most recent financial reporting period or the
equivalent projection for next year. Companies with well-established operations should be in a position
to supply reasonably reliable earnings projections for the next one or two years, so the valuation model is
only reliant on an independent assessment of the appropriate earnings multiple. Estimates of an
appropriate multiple are typically based on data derived from other companies that are considered to be
comparable to the target company in relation to growth prospects, capital expenditure requirements, and
risk profiles.
Unfortunately, it is extremely rare that the target company will have any close comparables with respect
to all of these important characteristics. In many cases, earnings multiples extracted from a set of
businesses within exactly the same industry will have a wide range of values that reflect company specific
factors rather than the underlying risk level of the industry itself. It then becomes a matter of judgement
to make a series of adjustments to the implied multiples to properly account for the differences between
the companies. These adjustments are often arbitrary and very difficult to benchmark.
In the majority of cases, the earnings multiple approach is therefore most suited to businesses with a
relatively stable earnings outlook, low capital expenditure requirements, and limited growth opportunities.
For companies with these characteristics, the multiples derived from market data are more likely to
accurately reflect the market’s perception of the underlying quality of the projected earnings stream.
The DCF approach can provide a better valuation treatment for companies with future growth prospects
and high capital expenditure requirements. Because each of these factors can be explicitly incorporated
into the valuation process, the DCF model directly accounts for many important value drivers of the
business under consideration. Accessing the necessary data for a DCF model can however be
EBOS Group Limited – Independent Adviser’s Report Page 55
Valuation of Symbion
problematic, especially when there is no credible process by which to construct the future forecasts of
free cash flows. The discounting process is also reliant on an estimate for the required rate of return.
Because this estimate is not directly observable and must be derived from data collected from other
comparable companies, the DCF value is also reliant on the existence of other companies that have the
same risk profile.
6.2.2 Appropriate Valuation Approach for Symbion
We believe that the earnings multiple valuation framework is most appropriate for Symbion, largely
because that is the approach that was explicitly used by both parties to negotiate the Purchase Price. As
set out in Section 2.1, the enterprise value of Symbion was determined for Transaction purposes as 8.0x
the adjusted EBITDA for FY2012. The aggregate value of the Symbion shares is then calculated as
enterprise value less the agreed value of net debt carried by Symbion as at the Transaction date.
This background to the negotiation process and the valuation framework used by EBOS and Zuellig to
settle on the Transaction values has clear implications for the approach that we should adopt in
determining the reasonableness of the Purchase Price from EBOS’ point of view. In effect, our
assessment of the Purchase Price can be broken down into a benchmarking review of the two key inputs
used by the counterparties in the earnings multiple valuation framework:
� Maintainable Earnings: The Purchase Price was assessed on the basis that adjusted EBITDA for
the financial year ending in December 2012 (Symbion’s FY2012) is a reasonable proxy for the level
of future maintainable earnings for the Symbion business. We have reviewed this assumption in
the context of historical earnings, the Symbion projections for the year ending 31 December 2013,
and our assessment of the key risk factors that may affect the business in the medium term; and
� Earnings Multiple: The agreed valuation of Symbion is based on an EBITDA multiple of 8.0x for the
year ending 31 December 2012. We have benchmarked this value against a range of trading and
transaction evidence for comparable businesses, with a particular focus on API and Sigma,
Symbion’s closest comparators in the Australian market.
Our analysis and conclusions for each of these inputs is summarised below.
6.3 Valuation of Symbion
6.3.1 Estimate of Maintainable Earnings
The Purchase Price is based on adjusted EBITDA for Symbion’s FY2012, implying that both parties to
the Transaction are comfortable that Symbion’s actual earnings level for the last completed financial year
is a reasonable basis for assessing future maintainable earnings. As set out in Section 2.1, the main
adjustment to the actual EBITDA level is the exclusion of the loss generated by the APHS part of the
business, with a resulting adjusted EBITDA level of A$113.0 million.
Compared to the budget for FY2013 and medium term projections beyond the current year, we conclude
that adjusted EBITDA for FY2012 could be considered to be a conservative estimate of maintainable
earnings. A high level comparison of actual earnings for FY2012 with the budget for FY2013 is set out in
Table 36.

EBOS Group Limited – Independent Adviser’s Report Page 56
Valuation of Symbion
Table Table Table Table 36363636: Symbion Adjusted Earnings for FY2012 and Budget for FY2013: Symbion Adjusted Earnings for FY2012 and Budget for FY2013: Symbion Adjusted Earnings for FY2012 and Budget for FY2013: Symbion Adjusted Earnings for FY2012 and Budget for FY2013
12 Months to 31 December12 Months to 31 December12 Months to 31 December12 Months to 31 December FY2012FY2012FY2012FY2012
(A$m)(A$m)(A$m)(A$m) FY2013FY2013FY2013FY2013
(A$(A$(A$(A$m)m)m)m)
Net SalesNet SalesNet SalesNet Sales $$$$3,7953,7953,7953,795 $3,726$3,726$3,726$3,726
Cost of Goods Sold $3,534 $3,454
Gross ProfitGross ProfitGross ProfitGross Profit $$$$260260260260 $272$272$272$272
Gross Margin 6.9% 7.3%
Other Income $64 $71
Total Operating Expenses $215 $226
EBITDA (EBITDA (EBITDA (EBITDA (unadjusted for APHS)unadjusted for APHS)unadjusted for APHS)unadjusted for APHS) $$$$101010109999 $$$$117117117117
APHS Adjustment $3.7 $2.5
EBITDA (EBITDA (EBITDA (EBITDA (adjusted foradjusted foradjusted foradjusted for APHS)APHS)APHS)APHS) $$$$111111113333 $$$$111120202020
EBITDA Margin 3.0% 3.2%
Source: Symbion Audited Financial Statements (FY2012), Symbion Unaudited Projection (FY2013)
Based on our analysis of Symbion’s actual and projected financial performance, we believe that the
FY2013 budget EBITDA level of A$117 million is the best benchmark for estimating the future
maintainable earnings of the business. This view reflects the following considerations:
� Symbion has a track record of earnings growth since it has been under Zuellig control, and the
budgeted level of growth in FY2013 (approximately 8% at the EBITDA level) is lower than the
average growth rate achieved in the past;
� Actual performance over the last two completed financial years has been very close to the
budgeted earnings in each year. This is in part explained by the fact that management
remuneration incentives are dependent on performance against budget, and agreed budget
targets are therefore set at achievable levels; and
� Year-to-date performance for FY2013 is broadly in line with budget.
After adding back an allowance for the expected loss by APHS in FY2013, we adopt a maintainable
EBITDA value of A$120 million.
6.3.2 Determining Appropriate Earnings Multiples
A valuation multiple range can be derived from two sources:
� Implied multiples from recent transactions for similar target companies; and
� Publically traded companies that are considered to be comparable to the subject company.
There is data available for a small number of transactions that have some relevance to this valuation. A
summary of the valuation metrics for these selected transactions is contained in Table 37 below, with
more detailed information set out in Appendix 3.

EBOS Group Limited – Independent Adviser’s Report Page 57
Valuation of Symbion
Table Table Table Table 37373737: Recent Relevant Transactions: Recent Relevant Transactions: Recent Relevant Transactions: Recent Relevant Transactions
DatDatDatDateeee TargetTargetTargetTarget AcquirerAcquirerAcquirerAcquirer Target Target Target Target DescriptionDescriptionDescriptionDescription
Implied EVImplied EVImplied EVImplied EV
(NZ$m)(NZ$m)(NZ$m)(NZ$m)
EV / Hist. EV / Hist. EV / Hist. EV / Hist.
EBITDAEBITDAEBITDAEBITDA
EV / ForEV / ForEV / ForEV / For....
EBITDAEBITDAEBITDAEBITDA
Australia & New Zealand
Dec-11 Masterpet Corporation
EBOS Distributes pet accessories, health care products, and foods for animals in Australasia.
$139 7.0x
Oct-10 Provet Holdings
Henry Schein Distributes veterinary products in Australasia.
$124 7.5x 7.2x
Aug-08
Symbion Health (Drugstore Distribution)
Zuellig Australia Pharmacy Services
Distributes pharmaceuticals and allied products to pharmacies in Australia.
$614 7.2x
Nov-07 Symbion Health
Primary Health Care Limited
Operator of medical, pathology, and imaging facilities, as well as pharmacies across Australia.
$3,673 13.1x 11.1x
Aug-07 Pharmacy Retailing NZ
EBOS Pharmaceutical wholesaler and distributor.
$103 7.9x
May-06 Douglas Pharmaceuticals Australia
Genepharm Australasia
Distributes pharmaceutical products to pharmacies in Australia.
$83 9.7x
Australia & New Zealand AverageAustralia & New Zealand AverageAustralia & New Zealand AverageAustralia & New Zealand Average 9999....4444xxxx 8.8.8.8.0000xxxx
International
Oct-12 PSS World Medical
McKesson Corporation
Provides medical products, supplies, and pharmaceuticals in the United States.
$2,217 10.7x 11.8x
Sep-12 Mediq NV Advent International Corporation
Provides pharmaceuticals, medical supplies, and related care services in Europe and the United States.
$1,487 7.5x 6.8x
Jun-12 Alliance Boots GmbH
Walgreen
Pharmacy-led health and beauty retailing, and pharmaceutical wholesaling and distribution activities internationally.
$32,605 11.0x
Nov-10 Zuellig Pharma (China)
Cardinal Health Distributes pharmaceuticals in China.
$635
Nov-10 Kinray Cardinal Health Distributor of pharmaceutical, generic, and health and beauty products in the United States.
$1,674
Oct-10 Andreae-Noris Zahn AG
Alliance Boots GmbH
Wholesaler of pharmaceutical products to pharmacies and hospitals in Germany and internationally.
$947 7.6x 8.3x
International AverageInternational AverageInternational AverageInternational Average 9.2x9.2x9.2x9.2x 8.9x8.9x8.9x8.9x
Overall AverageOverall AverageOverall AverageOverall Average 9.9.9.9.3333xxxx 8.8.8.8.4444xxxx
Source: Capital IQ and other Public Reports
The most useful data arguably relates to a series of transactions that either involved EBOS or Symbion.
In terms of determining an appropriate earnings multiple for Symbion, we suggest that key features of the
transaction set include:
� EBOS’ acquisition of Masterpet was the most recent transaction and took place at a lower
transaction multiple of 7.0x forward EBITDA. Apart from the differing business focus, scale, and
risk profile between the Masterpet business and Symbion, we also note that the New Zealand
market was generally trading at a much lower level at the time of the transaction. For example,
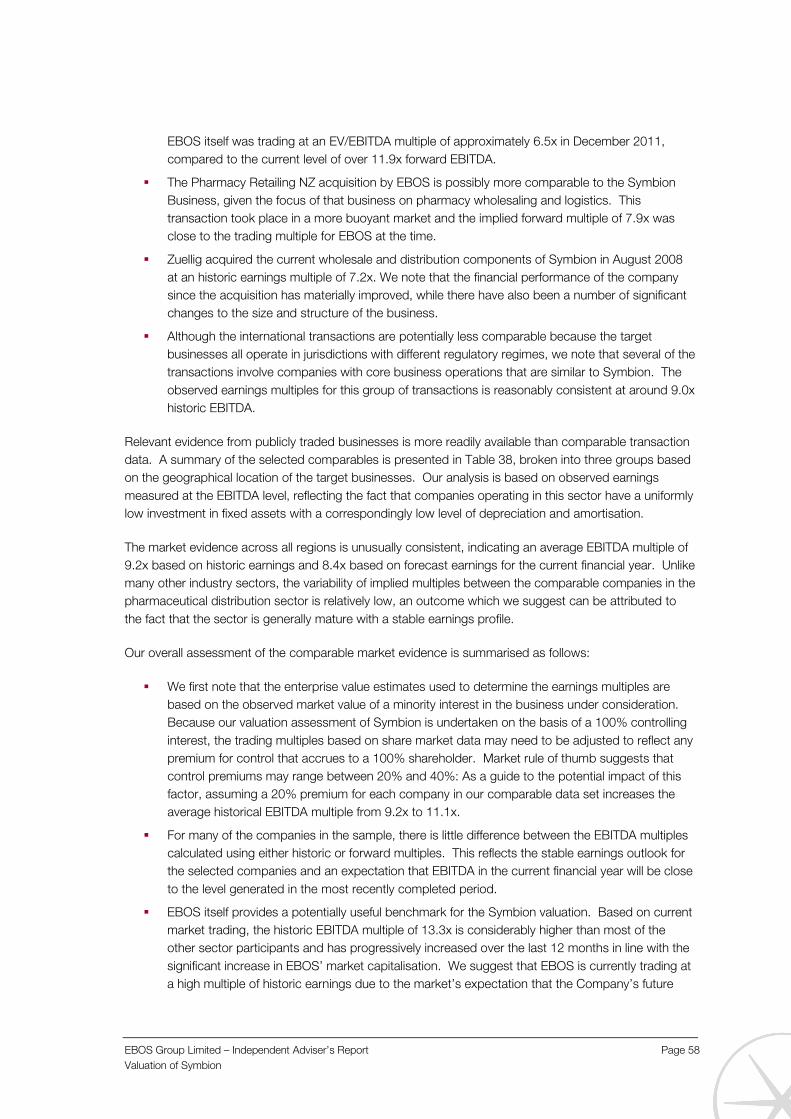
EBOS Group Limited – Independent Adviser’s Report Page 58
Valuation of Symbion
EBOS itself was trading at an EV/EBITDA multiple of approximately 6.5x in December 2011,
compared to the current level of over 11.9x forward EBITDA.
� The Pharmacy Retailing NZ acquisition by EBOS is possibly more comparable to the Symbion
Business, given the focus of that business on pharmacy wholesaling and logistics. This
transaction took place in a more buoyant market and the implied forward multiple of 7.9x was
close to the trading multiple for EBOS at the time.
� Zuellig acquired the current wholesale and distribution components of Symbion in August 2008
at an historic earnings multiple of 7.2x. We note that the financial performance of the company
since the acquisition has materially improved, while there have also been a number of significant
changes to the size and structure of the business.
� Although the international transactions are potentially less comparable because the target
businesses all operate in jurisdictions with different regulatory regimes, we note that several of the
transactions involve companies with core business operations that are similar to Symbion. The
observed earnings multiples for this group of transactions is reasonably consistent at around 9.0x
historic EBITDA.
Relevant evidence from publicly traded businesses is more readily available than comparable transaction
data. A summary of the selected comparables is presented in Table 38, broken into three groups based
on the geographical location of the target businesses. Our analysis is based on observed earnings
measured at the EBITDA level, reflecting the fact that companies operating in this sector have a uniformly
low investment in fixed assets with a correspondingly low level of depreciation and amortisation.
The market evidence across all regions is unusually consistent, indicating an average EBITDA multiple of
9.2x based on historic earnings and 8.4x based on forecast earnings for the current financial year. Unlike
many other industry sectors, the variability of implied multiples between the comparable companies in the
pharmaceutical distribution sector is relatively low, an outcome which we suggest can be attributed to
the fact that the sector is generally mature with a stable earnings profile.
Our overall assessment of the comparable market evidence is summarised as follows:
� We first note that the enterprise value estimates used to determine the earnings multiples are
based on the observed market value of a minority interest in the business under consideration.
Because our valuation assessment of Symbion is undertaken on the basis of a 100% controlling
interest, the trading multiples based on share market data may need to be adjusted to reflect any
premium for control that accrues to a 100% shareholder. Market rule of thumb suggests that
control premiums may range between 20% and 40%: As a guide to the potential impact of this
factor, assuming a 20% premium for each company in our comparable data set increases the
average historical EBITDA multiple from 9.2x to 11.1x.
� For many of the companies in the sample, there is little difference between the EBITDA multiples
calculated using either historic or forward multiples. This reflects the stable earnings outlook for
the selected companies and an expectation that EBITDA in the current financial year will be close
to the level generated in the most recently completed period.
� EBOS itself provides a potentially useful benchmark for the Symbion valuation. Based on current
market trading, the historic EBITDA multiple of 13.3x is considerably higher than most of the
other sector participants and has progressively increased over the last 12 months in line with the
significant increase in EBOS’ market capitalisation. We suggest that EBOS is currently trading at
a high multiple of historic earnings due to the market’s expectation that the Company’s future

EBOS Group Limited – Independent Adviser’s Report Page 59
Valuation of Symbion
earnings will increase as a result of both improvements to its existing business and the impact of
potential acquisitions. The observed earnings multiple for EBOS over the three month period
immediately following the FY2012 results announcement (and at the time that negotiations
between the counterparties commenced) was generally in a range between 10.5x and 11.0x.
Table Table Table Table 38383838: Comparable Trading Multi: Comparable Trading Multi: Comparable Trading Multi: Comparable Trading Multiplesplesplesples
CompanyCompanyCompanyCompany Company Company Company Company DescriptionDescriptionDescriptionDescription
EVEVEVEV
(NZ$m)(NZ$m)(NZ$m)(NZ$m)
EV / EV / EV / EV / FY12 FY12 FY12 FY12
EBITDAEBITDAEBITDAEBITDA
EV / EV / EV / EV / FY13 FY13 FY13 FY13
EBITDAEBITDAEBITDAEBITDA1111
Australia & New Zealand
EBOS Distributor of pharmaceutical and allied products in Australasia.
$625 13.3x 11.9x
Sigma Pharmaceuticals Distributor and retailer of pharmaceutical and allied products in Australia.
$1,031 10.8x 10.3x
Australian Pharmaceutical Industries
Distributor and retailer of pharmaceutical and allied products in Australia.
$519 5.2x 5.8x
Australia & New Zealand AverageAustralia & New Zealand AverageAustralia & New Zealand AverageAustralia & New Zealand Average 9.9.9.9.8888xxxx 9.9.9.9.3333xxxx
United States
McKesson Corporation Distributor of pharmaceuticals, medical supplies, and allied products in the United States.
$35,819 10.2x 9.6x
Cardinal Health Distributor of pharmaceuticals, medical supplies, and allied products in the United States.
$21,789 8.0x 7.6x
AmerisourceBergen Corporation
Provides pharmaceutical distribution and related healthcare services in the United States and Canada.
$15,603 9.1x 9.0x
Henry Schein Distributor of health care products and services primarily to office-based dental, medical, and animal health care practitioners.
$10,939 11.8x 11.0x
Patterson Companies Distributor of dental, veterinary, and rehabilitation supplies.
$5,482 11.2x 11.7x
Owens & Minor Provides distribution and other supply-chain management services to healthcare providers and suppliers.
$2,686 9.0x 8.2x
United States United States United States United States AverageAverageAverageAverage 9.9.9.9.9999xxxx 9.59.59.59.5xxxx
Other International
Sinopharm Group Co Distributor of pharmaceutical and healthcare products in China.
$10,408 9.9x 7.8x
Celesio AG Provides various services for the pharmaceutical and healthcare markets worldwide.
$6,966 13.3x 7.4x
MediPal Holdings Corporation
Distributor of prescription and OTC pharmaceuticals, cosmetics, and daily necessities in Japan.
$2,133 4.4x 4.4x
Suzuken Co Distributor of pharmaceuticals, medical foods, and allied products in Japan.
$1,775 6.5x 6.0x
Toho Holdings Distributor of pharmaceutical products in Japan. $1,450 5.5x 6.5x
Other International Other International Other International Other International AverageAverageAverageAverage 7.97.97.97.9xxxx 6.46.46.46.4xxxx
Overall AverageOverall AverageOverall AverageOverall Average 9.9.9.9.2222xxxx 8.48.48.48.4xxxx
Source: Capital IQ and other Public Reports - Estimates as at 22 May 2013 1Based on consensus estimates of broker’s FY13 forecasts (as reported by Capital IQ)
In terms of direct comparables to Symbion, the other two industry participants in Australia clearly
represent the best benchmarks. The multiples for API and Sigma are again summarised in Figure 15,
along with corresponding multiples for EBOS and an allowance for a 20% control premium.

EBOS Group Limited – Independent Adviser’s Report Page 60
Valuation of Symbion
Figure Figure Figure Figure 15151515: Earnings Multiples for Close Comparables: Earnings Multiples for Close Comparables: Earnings Multiples for Close Comparables: Earnings Multiples for Close Comparables
Source: Capital IQ and Northington Partners’ Analysis
Given their relevance, we have carried out a more comprehensive comparative assessment of Sigma, API
and Symbion as a core element of our benchmarking exercise. Our analysis is summarised below.
Comparative AnalyComparative AnalyComparative AnalyComparative Analysis of Symbion, API and Sigmasis of Symbion, API and Sigmasis of Symbion, API and Sigmasis of Symbion, API and Sigma
Symbion, API and Sigma are the three dominant participants in the Australian pharmaceutical distribution
sector, with an aggregate market share that is close to 90%. All three companies have significant
crossovers in their business operations, albeit with some very important differences in terms of direct
exposure to the broader retail part of the market. Table 39 sets out a side-by-side comparison of some
high level metrics for each business.
The main features of the comparison are as follows:
� Symbion is the largest of the three competitors. Based on estimated enterprise value, Symbion
is marginally larger than Sigma and over twice the size of API;
� Compared to Symbion, Sigma and API have a far greater direct exposure to retail through
ownership of retail outlets in the health and beauty space;
� Symbion has a more diversified business structure, with a total of 33% of revenue generated in
the hospital and “other” sectors. In contrast, Sigma and API have a higher exposure to the
pharmaceutical sector (through both the wholesale and retail operations);
� Average earnings growth (measured at the EBITDA level) over the past four years has been
stronger for Symbion, with a Compound Average Growth Rate (“CAGRCAGRCAGRCAGR”) of 8.6%. The CAGR for
API was 5.7% over the same period, while Sigma’s performance has been relatively flat.
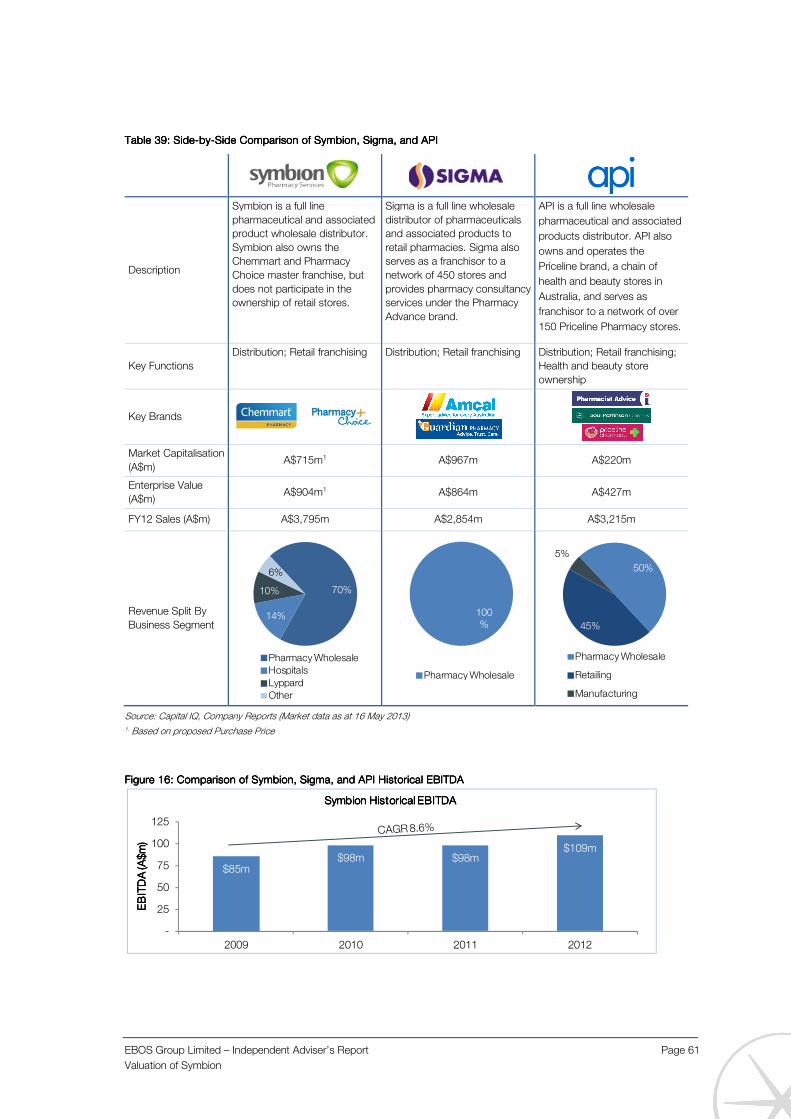
EBOS Group Limited – Independent Adviser’s Report Page 61
Valuation of Symbion
Table Table Table Table 39393939: Side: Side: Side: Side----bybybyby----Side Comparison of Symbion, Sigma, and APISide Comparison of Symbion, Sigma, and APISide Comparison of Symbion, Sigma, and APISide Comparison of Symbion, Sigma, and API
9999
Description
Symbion is a full line
pharmaceutical and associated
product wholesale distributor.
Symbion also owns the
Chemmart and Pharmacy
Choice master franchise, but
does not participate in the
ownership of retail stores.
Sigma is a full line wholesale
distributor of pharmaceuticals
and associated products to
retail pharmacies. Sigma also
serves as a franchisor to a
network of 450 stores and
provides pharmacy consultancy
services under the Pharmacy
Advance brand.
API is a full line wholesale
pharmaceutical and associated
products distributor. API also
owns and operates the
Priceline brand, a chain of
health and beauty stores in
Australia, and serves as
franchisor to a network of over
150 Priceline Pharmacy stores.
Key Functions
Distribution; Retail franchising Distribution; Retail franchising Distribution; Retail franchising;
Health and beauty store
ownership
Key Brands
Market Capitalisation
(A$m) A$715m1 A$967m A$220m
Enterprise Value
(A$m) A$904m1 A$864m A$427m
FY12 Sales (A$m) A$3,795m A$2,854m A$3,215m
Revenue Split By
Business Segment
Source: Capital IQ, Company Reports (Market data as at 16 May 2013) 1. Based on proposed Purchase Price
Figure Figure Figure Figure 16161616: Comparison of Symbion, Sigma, and API Historical EBITDA: Comparison of Symbion, Sigma, and API Historical EBITDA: Comparison of Symbion, Sigma, and API Historical EBITDA: Comparison of Symbion, Sigma, and API Historical EBITDA
70%
14%
10%
6%
Pharmacy WholesaleHospitalsLyppardOther
100%
Pharmacy Wholesale
50%
45%
5%
Pharmacy Wholesale
Retailing
Manufacturing
$85m$98m $98m
$109m
-
25
50
75
100
125
2009 2010 2011 2012
EB
ITD
A (A
$m
)E
BIT
DA
(A$
m)
EB
ITD
A (A
$m
)E
BIT
DA
(A$
m)
Symbion Historical EBITDASymbion Historical EBITDASymbion Historical EBITDASymbion Historical EBITDA

EBOS Group Limited – Independent Adviser’s Report Page 62
Valuation of Symbion
Source: EBOS, Capital IQ, Company Reports
Both Sigma and API are listed on the ASX, and recent share price performance has been mixed. Figure
17 shows share price movements for each company over the last four years relative to both the ASX and
EBOS, and clearly demonstrates that Sigma and API have underperformed both comparators. Sharp
declines in share price were experienced during 2010 and the first half of 2011, before modest
improvements over the last 12 – 18 months. As previously discussed in Section 4.9, the EBOS share
price doubled over the same period.
In our view, the share price declines in the 2-3 year period leading up to 2012 reflect the poor
performance of business units outside of the core pharmaceutical distribution sector. In API’s case, the
issue related to the retail strategy pursued through the Priceline stores and the company’s ability to
compete effectively with supermarkets in the health and beauty segment. There appears to be on-going
market uncertainty over the likely future success of this strategy. For Sigma, overall performance
appears to have been negatively impacted as a consequence of its 2005 acquisition of Arrow
Pharmaceuticals, a manufacturer of generic products. This part of the business did not perform well and
was subsequently divested in 2010.
$69m $72m$65m
$74m
-
20
40
60
80
100
2009 2010 2011 2012
EB
ITD
A (A
$m
)E
BIT
DA
(A$
m)
EB
ITD
A (A
$m
)E
BIT
DA
(A$
m)
Sigma Historical EBITDASigma Historical EBITDASigma Historical EBITDASigma Historical EBITDA
$65m$77m $73m $77m
-
20
40
60
80
100
2009 2010 2011 2012
EB
ITD
A (A
$m
)E
BIT
DA
(A$
m)
EB
ITD
A (A
$m
)E
BIT
DA
(A$
m)
API Historical EBITDAAPI Historical EBITDAAPI Historical EBITDAAPI Historical EBITDA
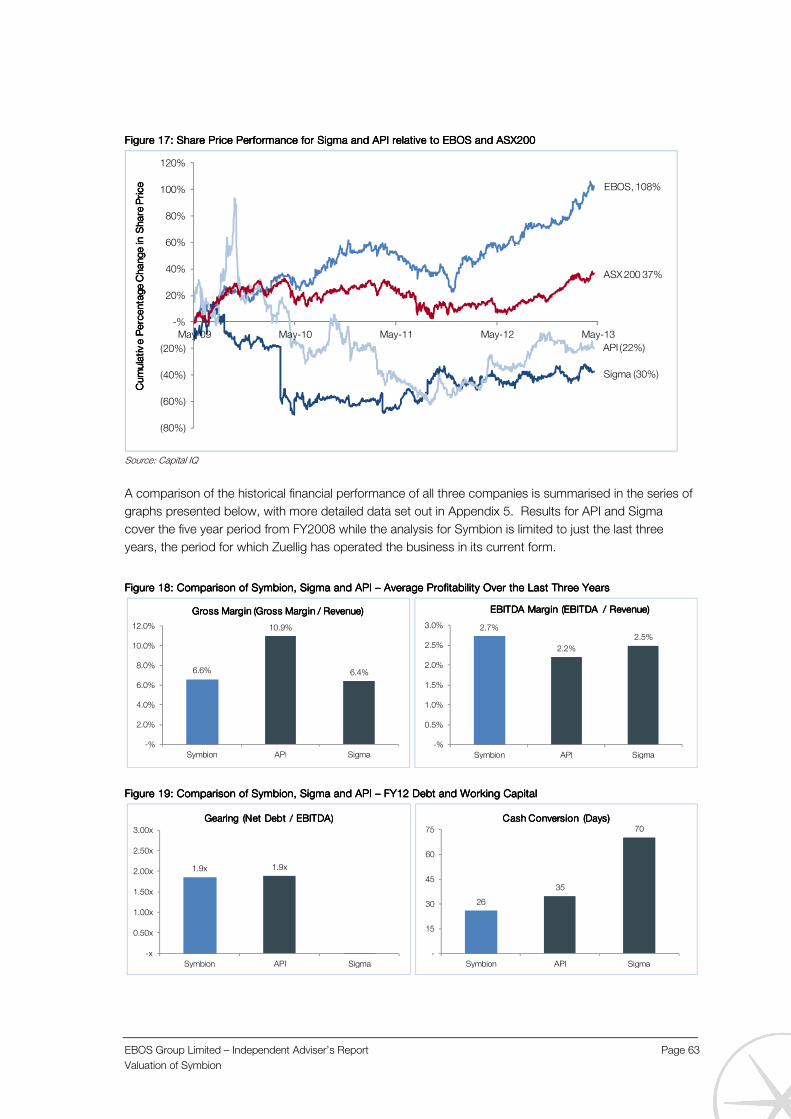
EBOS Group Limited – Independent Adviser’s Report Page 63
Valuation of Symbion
Figure Figure Figure Figure 17171717: Share Price Performance for Sigma and API relative to EBOS and ASX200: Share Price Performance for Sigma and API relative to EBOS and ASX200: Share Price Performance for Sigma and API relative to EBOS and ASX200: Share Price Performance for Sigma and API relative to EBOS and ASX200
Source: Capital IQ
A comparison of the historical financial performance of all three companies is summarised in the series of
graphs presented below, with more detailed data set out in Appendix 5. Results for API and Sigma
cover the five year period from FY2008 while the analysis for Symbion is limited to just the last three
years, the period for which Zuellig has operated the business in its current form.
Figure Figure Figure Figure 18181818: Comparison of Symbion, Sigma and API : Comparison of Symbion, Sigma and API : Comparison of Symbion, Sigma and API : Comparison of Symbion, Sigma and API –––– Average Profitability Over the Last Three YearsAverage Profitability Over the Last Three YearsAverage Profitability Over the Last Three YearsAverage Profitability Over the Last Three Years
Figure Figure Figure Figure 19191919: Comparison of Symbion, Sigma: Comparison of Symbion, Sigma: Comparison of Symbion, Sigma: Comparison of Symbion, Sigma and API and API and API and API –––– FY12 Debt and Working CapitalFY12 Debt and Working CapitalFY12 Debt and Working CapitalFY12 Debt and Working Capital
EBOS, 108%
Sigma (30%)
API (22%)
ASX 200 37%
(80%)
(60%)
(40%)
(20%)
-%
20%
40%
60%
80%
100%
120%
May-09 May-10 May-11 May-12 May-13
Cu
mu
lati
v e
Pe
rce
nta
ge
Ch
an
ge
in S
ha
re P
ric
eC
um
ula
tiv
e P
erc
en
tag
e C
ha
ng
e in
Sh
are
Pri
ce
Cu
mu
lati
v e
Pe
rce
nta
ge
Ch
an
ge
in S
ha
re P
ric
eC
um
ula
tiv
e P
erc
en
tag
e C
ha
ng
e in
Sh
are
Pri
ce
6.6%
10.9%
6.4%
-%
2.0%
4.0%
6.0%
8.0%
10.0%
12.0%
Symbion API Sigma
Gross Margin (Gross Margin / Revenue)Gross Margin (Gross Margin / Revenue)Gross Margin (Gross Margin / Revenue)Gross Margin (Gross Margin / Revenue)
2.7%
2.2%
2.5%
-%
0.5%
1.0%
1.5%
2.0%
2.5%
3.0%
Symbion API Sigma
EBITDA Margin (EBITDA / Revenue)EBITDA Margin (EBITDA / Revenue)EBITDA Margin (EBITDA / Revenue)EBITDA Margin (EBITDA / Revenue)
1.9x 1.9x
-x
0.50x
1.00x
1.50x
2.00x
2.50x
3.00x
Symbion API Sigma
Gearing (Net Debt / EBITDA)Gearing (Net Debt / EBITDA)Gearing (Net Debt / EBITDA)Gearing (Net Debt / EBITDA)
26
35
70
-
15
30
45
60
75
Symbion API Sigma
Cash Conversion (Days)Cash Conversion (Days)Cash Conversion (Days)Cash Conversion (Days)
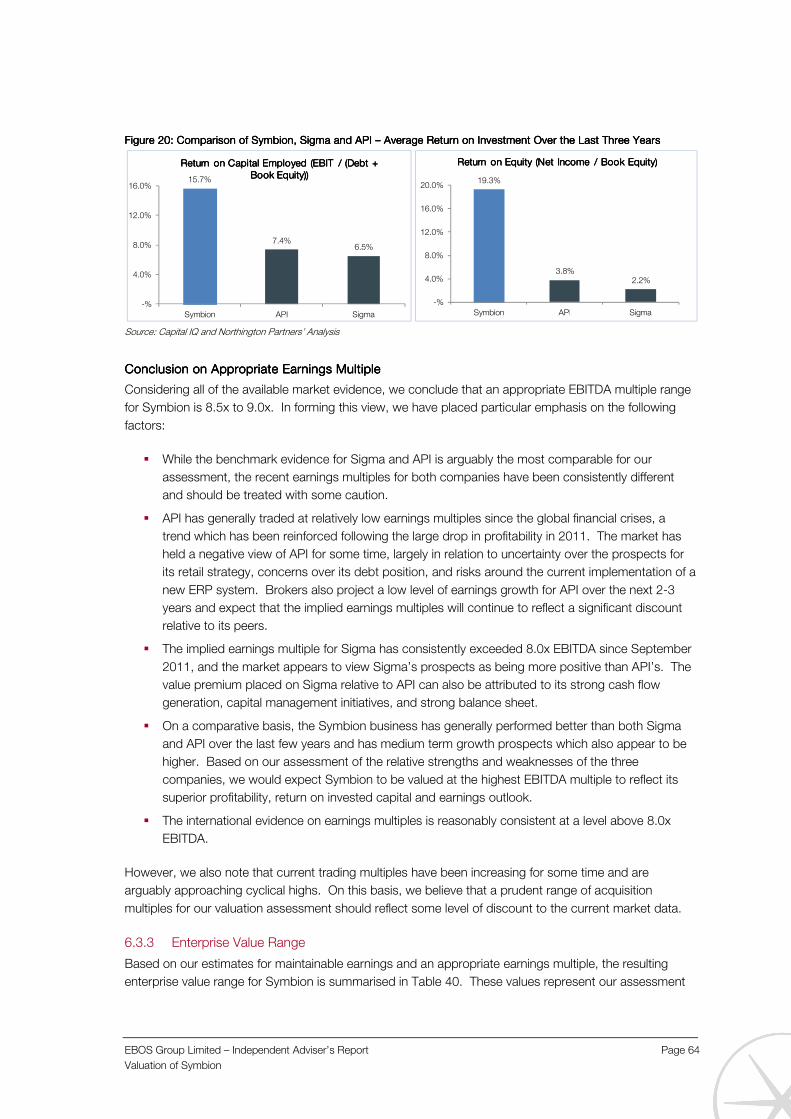
EBOS Group Limited – Independent Adviser’s Report Page 64
Valuation of Symbion
Figure Figure Figure Figure 20202020: Comparison of Symbion, Sigma and API : Comparison of Symbion, Sigma and API : Comparison of Symbion, Sigma and API : Comparison of Symbion, Sigma and API –––– Average Return on Investment Over the Last Three YearsAverage Return on Investment Over the Last Three YearsAverage Return on Investment Over the Last Three YearsAverage Return on Investment Over the Last Three Years
Source: Capital IQ and Northington Partners’ Analysis
Conclusion on Appropriate EConclusion on Appropriate EConclusion on Appropriate EConclusion on Appropriate Earnings Multiplearnings Multiplearnings Multiplearnings Multiple
Considering all of the available market evidence, we conclude that an appropriate EBITDA multiple range
for Symbion is 8.5x to 9.0x. In forming this view, we have placed particular emphasis on the following
factors:
� While the benchmark evidence for Sigma and API is arguably the most comparable for our
assessment, the recent earnings multiples for both companies have been consistently different
and should be treated with some caution.
� API has generally traded at relatively low earnings multiples since the global financial crises, a
trend which has been reinforced following the large drop in profitability in 2011. The market has
held a negative view of API for some time, largely in relation to uncertainty over the prospects for
its retail strategy, concerns over its debt position, and risks around the current implementation of a
new ERP system. Brokers also project a low level of earnings growth for API over the next 2-3
years and expect that the implied earnings multiples will continue to reflect a significant discount
relative to its peers.
� The implied earnings multiple for Sigma has consistently exceeded 8.0x EBITDA since September
2011, and the market appears to view Sigma’s prospects as being more positive than API’s. The
value premium placed on Sigma relative to API can also be attributed to its strong cash flow
generation, capital management initiatives, and strong balance sheet.
� On a comparative basis, the Symbion business has generally performed better than both Sigma
and API over the last few years and has medium term growth prospects which also appear to be
higher. Based on our assessment of the relative strengths and weaknesses of the three
companies, we would expect Symbion to be valued at the highest EBITDA multiple to reflect its
superior profitability, return on invested capital and earnings outlook.
� The international evidence on earnings multiples is reasonably consistent at a level above 8.0x
EBITDA.
However, we also note that current trading multiples have been increasing for some time and are
arguably approaching cyclical highs. On this basis, we believe that a prudent range of acquisition
multiples for our valuation assessment should reflect some level of discount to the current market data.
6.3.3 Enterprise Value Range
Based on our estimates for maintainable earnings and an appropriate earnings multiple, the resulting
enterprise value range for Symbion is summarised in Table 40. These values represent our assessment
15.7%
7.4%6.5%
-%
4.0%
8.0%
12.0%
16.0%
Symbion API Sigma
Return on Capital Employed (EBIT / (Debt + Return on Capital Employed (EBIT / (Debt + Return on Capital Employed (EBIT / (Debt + Return on Capital Employed (EBIT / (Debt + Book Equity))Book Equity))Book Equity))Book Equity))
19.3%
3.8%2.2%
-%
4.0%
8.0%
12.0%
16.0%
20.0%
Symbion API Sigma
Return on Equity (Net Income / Book Equity)Return on Equity (Net Income / Book Equity)Return on Equity (Net Income / Book Equity)Return on Equity (Net Income / Book Equity)
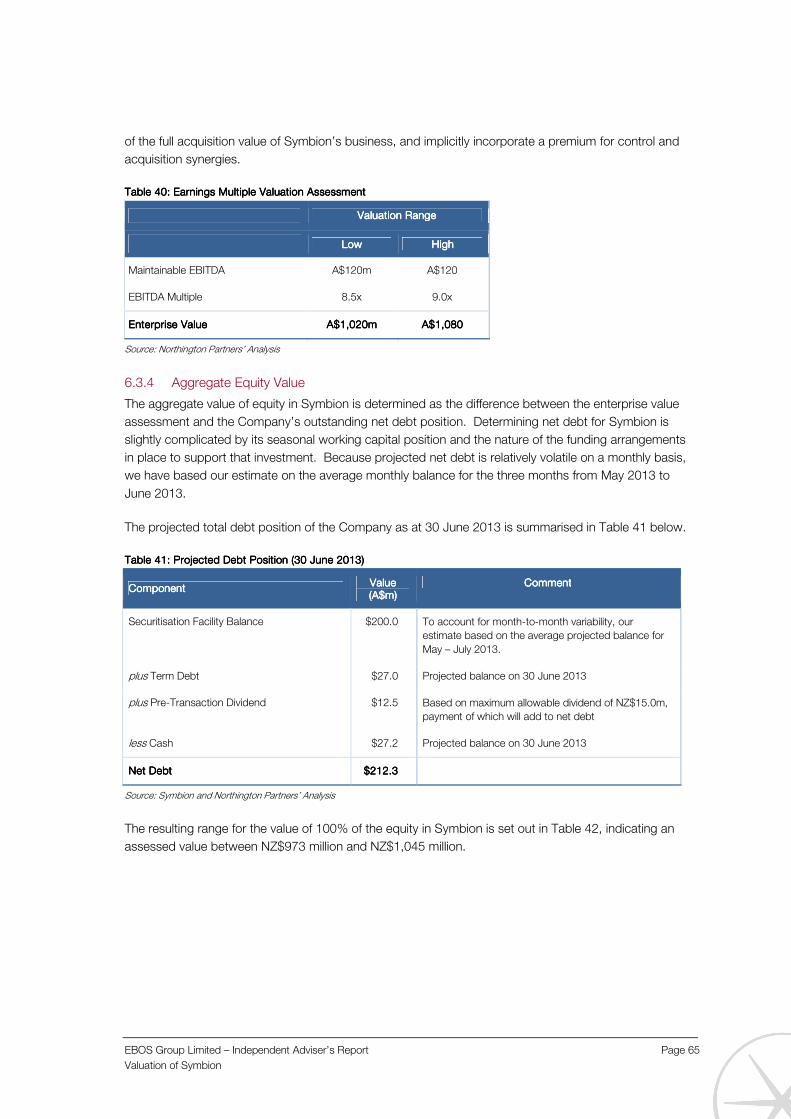
EBOS Group Limited – Independent Adviser’s Report Page 65
Valuation of Symbion
of the full acquisition value of Symbion’s business, and implicitly incorporate a premium for control and
acquisition synergies.
Table Table Table Table 40404040: Earnings Multiple Valuation Assessment: Earnings Multiple Valuation Assessment: Earnings Multiple Valuation Assessment: Earnings Multiple Valuation Assessment
Valuation RangeValuation RangeValuation RangeValuation Range
LowLowLowLow HighHighHighHigh
Maintainable EBITDA A$120m A$120
EBITDA Multiple 8.5x 9.0x
EnterpriEnterpriEnterpriEnterprise Valuese Valuese Valuese Value A$A$A$A$1,0201,0201,0201,020mmmm AAAA$$$$1,1,1,1,080080080080
Source: Northington Partners’ Analysis
6.3.4 Aggregate Equity Value
The aggregate value of equity in Symbion is determined as the difference between the enterprise value
assessment and the Company’s outstanding net debt position. Determining net debt for Symbion is
slightly complicated by its seasonal working capital position and the nature of the funding arrangements
in place to support that investment. Because projected net debt is relatively volatile on a monthly basis,
we have based our estimate on the average monthly balance for the three months from May 2013 to
June 2013.
The projected total debt position of the Company as at 30 June 2013 is summarised in Table 41 below.
Table Table Table Table 41414141: Projected Debt Position (30 June 2013): Projected Debt Position (30 June 2013): Projected Debt Position (30 June 2013): Projected Debt Position (30 June 2013)
ComponentComponentComponentComponent ValueValueValueValue (A(A(A(A$m$m$m$m))))
CommentCommentCommentComment
Securitisation Facility Balance $200.0 To account for month-to-month variability, our
estimate based on the average projected balance for
May – July 2013.
plus Term Debt $27.0 Projected balance on 30 June 2013
plus Pre-Transaction Dividend $12.5 Based on maximum allowable dividend of NZ$15.0m,
payment of which will add to net debt
less Cash $27.2 Projected balance on 30 June 2013
NetNetNetNet DebtDebtDebtDebt $212.$212.$212.$212.3333
Source: Symbion and Northington Partners’ Analysis
The resulting range for the value of 100% of the equity in Symbion is set out in Table 42, indicating an
assessed value between NZ$973 million and NZ$1,045 million.

EBOS Group Limited – Independent Adviser’s Report Page 66
Valuation of Symbion
Table Table Table Table 42424242: Estimated Equity Value Range for Symbion: Estimated Equity Value Range for Symbion: Estimated Equity Value Range for Symbion: Estimated Equity Value Range for Symbion
LowLowLowLow
ValueValueValueValue ($m)($m)($m)($m)
High High High High ValueValueValueValue ($m)($m)($m)($m)
Assessed Enterprise Value A$1,020 A$1,080
less Net Debt (rounded) A$212 A$212
Total Equity Value – A$ A$808 A$868
Assumed A$/NZ$ Exchange Rate1 0.83 0.83
Total Equity Value – NZ$ NZ$NZ$NZ$NZ$973973973973 NZ$NZ$NZ$NZ$1,0451,0451,0451,045
Source: Northington Partners’ Analysis 1.Approximate average exchange rate for five days to 20 May 2013.
Our value range is between 11% and 17% higher than the Purchase Price of NZ$865 million and on that
basis, we suggest that the negotiated Purchase Price is attractive from EBOS shareholders’ point of
view.
The main factors contributing to the difference between the Purchase Price and our assessed valuation
range are as follows:
� The negotiated earnings multiple of 8.0x historic EBITDA is slightly lower than the appropriate level
indicated by the market evidence. As discussed in Section 6.3.2, most of the current trading
evidence indicates historic multiples that are consistently higher than 8.0x, especially when
adjustments are made to allow for the value premium that is usually paid for a 100% control
position;
� We believe that the budget EBITDA level for FY2013 is a more suitable estimate for Symbion’s
maintainable earnings level compared to the actual earnings for the FY2012 year (which was used
in the negotiation of the Purchase Price.) The budget for FY2013 reasonably allows for about an
A$7.0 million increase in earnings over the previous year, which leads to an increase in the
resulting enterprise value for Symbion of between A$59.5 million and A$63.0 million.

EBOS Group Limited – Independent Adviser’s Report Page 67
Assessment of the Merits of the Transaction
7.0 Assessment of the Merits of the Transaction
This section sets out our assessment of the merits of the Transaction from the point of view of existing
EBOS shareholders (other than Zuellig).
7.1 Transaction Purchase Price
Figure 21 summarises our valuation assessment of Symbion, which is set out in detail in Section 6.0. On
a comparative basis, the agreed Purchase Price of NZ$865 million is below the bottom end of our
assessed range of NZ$973 million to NZ$1,045 million.
Figure Figure Figure Figure 21212121: Comparison of the Purchase Price to our Valuation Range: Comparison of the Purchase Price to our Valuation Range: Comparison of the Purchase Price to our Valuation Range: Comparison of the Purchase Price to our Valuation Range
Source: EBOS, Northington Partners' Analysis
We believe that EBOS is acquiring Symbion at an attractive price relative to other similar businesses. As
discussed in Section 2.1, the Purchase Price has been determined on the basis of 8.0x adjusted EBITDA
for the financial year ending 31 December 2012, and in our view both of these chosen pricing parameters
are favourable from EBOS’ point of view:
� Adjusted FY2012 EBITDA of A$113.0 million appears to be a reasonably conservative basis on
which to determine maintainable earnings for the Symbion business. There has been consistent
year-on-year growth in earnings over the last few years and further growth is expected in FY2013
and beyond. Because Symbion management also has a good track record of meeting budget
projections, we suggest that maintainable earnings should more appropriately be based on the
FY2013 budget (A$120.0 million);
� The adjustment to actual EBITDA to partially exclude the negative impact of APHS provides EBOS
with downside protection;
� Based on the available market evidence, we believe that Symbion should be valued at a
maintainable EBITDA multiple range of 8.5x to 9.0x. This assessment is based on a wide range of
relatively comparable transaction and trading evidence, with a particular focus on the market-
based values for Symbion’s two listed competitors in the Australian market (Sigma and API).
The main adjustment to the FY2012 EBITDA used in the Purchase Price determination process relates to
APHS, a newly acquired subsidiary company of Symbion which is currently in a loss making position.
EBOS does not want to be exposed to the risk that the business will remain unprofitable in the future and
has therefore negotiated for Zuellig to underwrite on-going trading losses for the period to June 2015, to
NZ$865m
NZ$973m
NZ$1,045m
NZ$650m
NZ$750m
NZ$850m
NZ$950m
NZ$1,050m
Purchase Price Low Value High Value
Sym
bio
n E
qu
ity
Va
lue
Sym
bio
n E
qu
ity
Va
lue
Sym
bio
n E
qu
ity
Va
lue
Sym
bio
n E
qu
ity
Va
lue

EBOS Group Limited – Independent Adviser’s Report Page 68
Assessment of the Merits of the Transaction
a maximum of NZ$3.0 million in aggregate. This has been achieved by excluding the realised losses
from the adjusted FY12 EBITDA figure, and agreeing that Zuellig will reimburse EBOS for any further
losses incurred by APHS from the completion date of the Transaction through to the end of the June
2015 underwrite period (up to the maximum of NZ$3.0 million).
Although we have not seen a formal forecast for APHS through to the end of June 2015, there is a
chance that the future losses will exceed the NZ$3.0 million threshold and EBOS therefore remains
exposed to that risk. However, the underwriting structure means that EBOS is effectively paying nothing
for the APHS subsidiary and retains a free option to continue with the business if it is expected to
become profitable beyond 2015. EBOS management will also be in a position to take all possible steps
to ensure that the APHS losses do not materially exceed the agreed underwriting level.
A comparison of our chosen multiple range for Symbion to the observed multiples for Sigma, API and
EBOS is set out in Figure 22. Based on the detailed comparative analysis of the three Australian
companies in Section 6.3.2, we believe a multiple range of 8.5x – 9.0x for the Symbion business is readily
justified. Symbion has been the strongest performer over the last few years, arguably has a lower risk
profile given its current business mix and lower direct exposure to the retail sector, and has future growth
prospects that are at least in line with its two main competitors.
Figure Figure Figure Figure 22222222: : : : Forward Forward Forward Forward Earnings Multiple ComparisonEarnings Multiple ComparisonEarnings Multiple ComparisonEarnings Multiple Comparison
Source: EBOS, Capital IQ, Northington Partners' Analysis (market data as at 22 May 2013)
We therefore conclude that the Purchase Price is reasonable from the point of view of EBOS'
shareholders not associated with Zuellig.
7.2 Strategic Fit
As discussed in Section 5.2 above, the businesses of EBOS and Symbion are well aligned and have a
significant amount of overlap in terms of service offering and sector exposure. Indeed, almost 90% of
Symbion’s FY2012 gross profit was derived from operations and/or channels that overlap with existing
EBOS operations. Table 43 below comments on the extent to which Symbion’s key business divisions
overlap with those of EBOS.
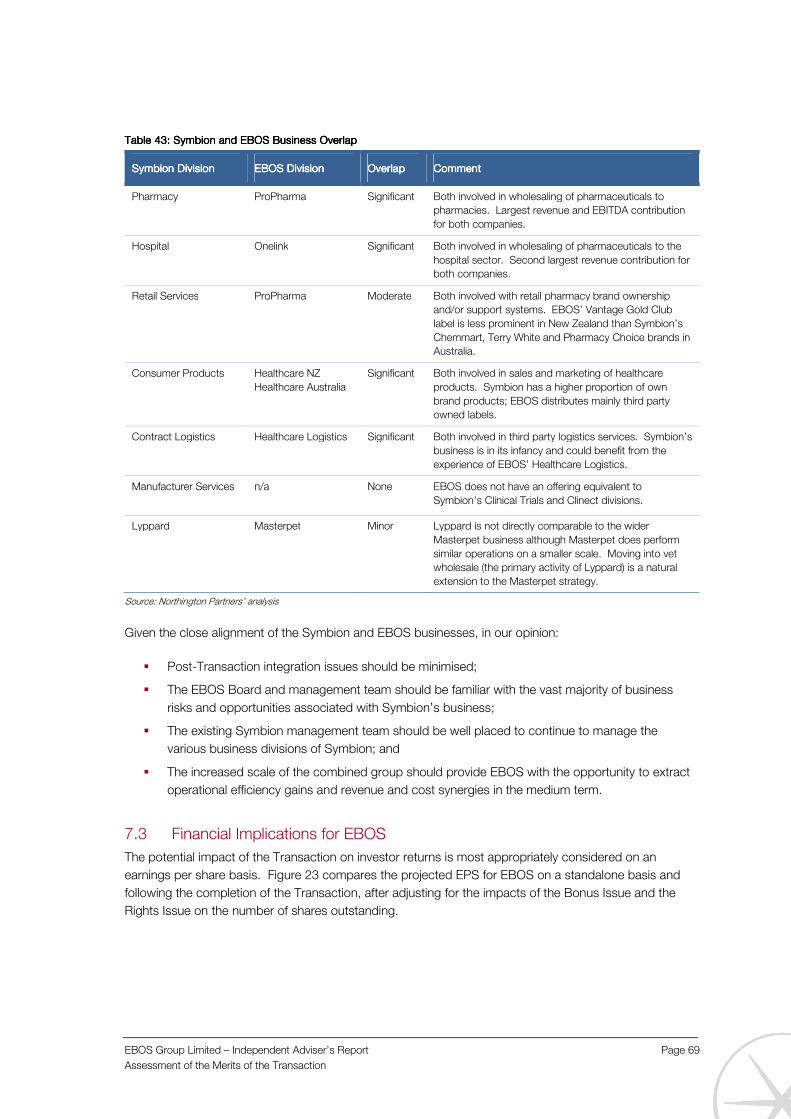
EBOS Group Limited – Independent Adviser’s Report Page 69
Assessment of the Merits of the Transaction
Table Table Table Table 43434343: : : : Symbion and EBOS Business OverlapSymbion and EBOS Business OverlapSymbion and EBOS Business OverlapSymbion and EBOS Business Overlap
Symbion DivisionSymbion DivisionSymbion DivisionSymbion Division EBOS DivisionEBOS DivisionEBOS DivisionEBOS Division OverlapOverlapOverlapOverlap CommentCommentCommentComment
Pharmacy ProPharma Significant Both involved in wholesaling of pharmaceuticals to
pharmacies. Largest revenue and EBITDA contribution
for both companies.
Hospital Onelink Significant Both involved in wholesaling of pharmaceuticals to the
hospital sector. Second largest revenue contribution for
both companies.
Retail Services ProPharma Moderate Both involved with retail pharmacy brand ownership
and/or support systems. EBOS’ Vantage Gold Club
label is less prominent in New Zealand than Symbion’s
Chemmart, Terry White and Pharmacy Choice brands in
Australia.
Consumer Products Healthcare NZ
Healthcare Australia
Significant Both involved in sales and marketing of healthcare
products. Symbion has a higher proportion of own
brand products; EBOS distributes mainly third party
owned labels.
Contract Logistics Healthcare Logistics Significant Both involved in third party logistics services. Symbion’s
business is in its infancy and could benefit from the
experience of EBOS’ Healthcare Logistics.
Manufacturer Services n/a None EBOS does not have an offering equivalent to
Symbion’s Clinical Trials and Clinect divisions.
Lyppard Masterpet Minor Lyppard is not directly comparable to the wider
Masterpet business although Masterpet does perform
similar operations on a smaller scale. Moving into vet
wholesale (the primary activity of Lyppard) is a natural
extension to the Masterpet strategy.
Source: Northington Partners’ analysis
Given the close alignment of the Symbion and EBOS businesses, in our opinion:
� Post-Transaction integration issues should be minimised;
� The EBOS Board and management team should be familiar with the vast majority of business
risks and opportunities associated with Symbion’s business;
� The existing Symbion management team should be well placed to continue to manage the
various business divisions of Symbion; and
� The increased scale of the combined group should provide EBOS with the opportunity to extract
operational efficiency gains and revenue and cost synergies in the medium term.
7.3 Financial Implications for EBOS
The potential impact of the Transaction on investor returns is most appropriately considered on an
earnings per share basis. Figure 23 compares the projected EPS for EBOS on a standalone basis and
following the completion of the Transaction, after adjusting for the impacts of the Bonus Issue and the
Rights Issue on the number of shares outstanding.
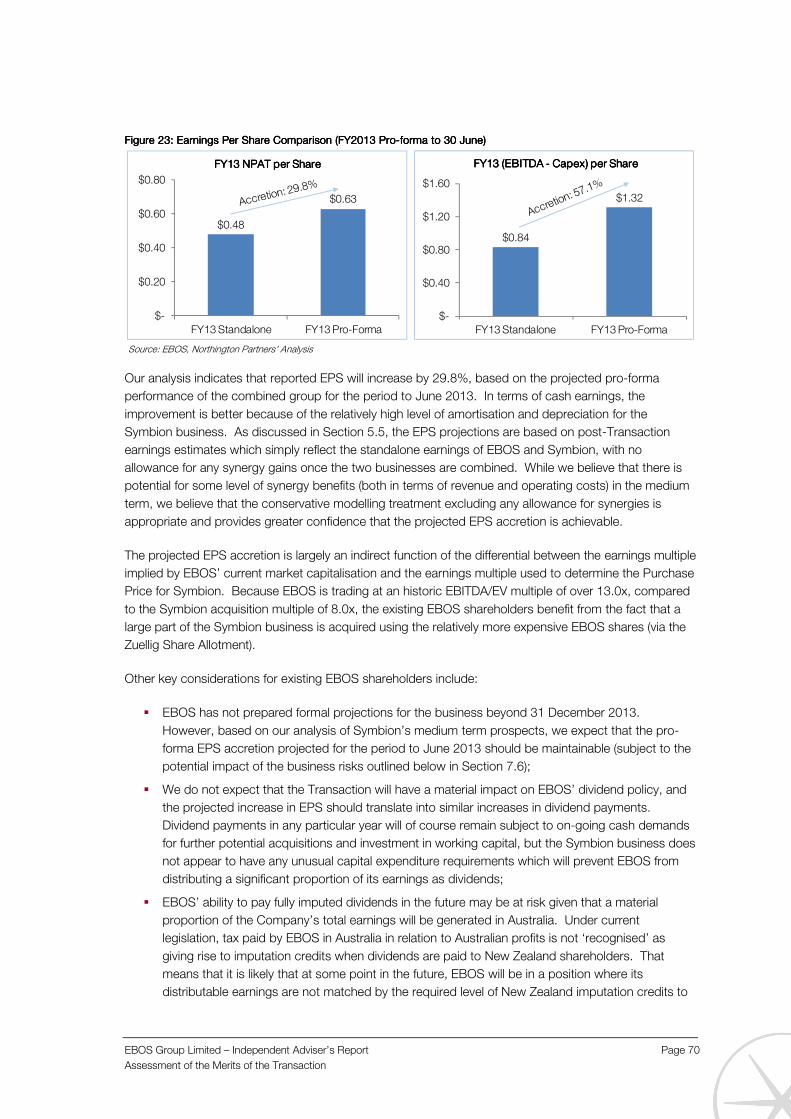
EBOS Group Limited – Independent Adviser’s Report Page 70
Assessment of the Merits of the Transaction
Figure Figure Figure Figure 23232323: Earnings Per Share Comparison (FY2013 Pro: Earnings Per Share Comparison (FY2013 Pro: Earnings Per Share Comparison (FY2013 Pro: Earnings Per Share Comparison (FY2013 Pro----forma to 30 June)forma to 30 June)forma to 30 June)forma to 30 June)
Source: EBOS, Northington Partners' Analysis
Our analysis indicates that reported EPS will increase by 29.8%, based on the projected pro-forma
performance of the combined group for the period to June 2013. In terms of cash earnings, the
improvement is better because of the relatively high level of amortisation and depreciation for the
Symbion business. As discussed in Section 5.5, the EPS projections are based on post-Transaction
earnings estimates which simply reflect the standalone earnings of EBOS and Symbion, with no
allowance for any synergy gains once the two businesses are combined. While we believe that there is
potential for some level of synergy benefits (both in terms of revenue and operating costs) in the medium
term, we believe that the conservative modelling treatment excluding any allowance for synergies is
appropriate and provides greater confidence that the projected EPS accretion is achievable.
The projected EPS accretion is largely an indirect function of the differential between the earnings multiple
implied by EBOS’ current market capitalisation and the earnings multiple used to determine the Purchase
Price for Symbion. Because EBOS is trading at an historic EBITDA/EV multiple of over 13.0x, compared
to the Symbion acquisition multiple of 8.0x, the existing EBOS shareholders benefit from the fact that a
large part of the Symbion business is acquired using the relatively more expensive EBOS shares (via the
Zuellig Share Allotment).
Other key considerations for existing EBOS shareholders include:
� EBOS has not prepared formal projections for the business beyond 31 December 2013.
However, based on our analysis of Symbion’s medium term prospects, we expect that the pro-
forma EPS accretion projected for the period to June 2013 should be maintainable (subject to the
potential impact of the business risks outlined below in Section 7.6);
� We do not expect that the Transaction will have a material impact on EBOS’ dividend policy, and
the projected increase in EPS should translate into similar increases in dividend payments.
Dividend payments in any particular year will of course remain subject to on-going cash demands
for further potential acquisitions and investment in working capital, but the Symbion business does
not appear to have any unusual capital expenditure requirements which will prevent EBOS from
distributing a significant proportion of its earnings as dividends;
� EBOS’ ability to pay fully imputed dividends in the future may be at risk given that a material
proportion of the Company’s total earnings will be generated in Australia. Under current
legislation, tax paid by EBOS in Australia in relation to Australian profits is not ‘recognised’ as
giving rise to imputation credits when dividends are paid to New Zealand shareholders. That
means that it is likely that at some point in the future, EBOS will be in a position where its
distributable earnings are not matched by the required level of New Zealand imputation credits to
$0.48
$0.63
$-
$0.20
$0.40
$0.60
$0.80
FY13 Standalone FY13 Pro-Forma
FY13 NPAT per ShareFY13 NPAT per ShareFY13 NPAT per ShareFY13 NPAT per Share
$0.84
$1.32
$-
$0.40
$0.80
$1.20
$1.60
FY13 Standalone FY13 Pro-Forma
FY13 (EBITDA FY13 (EBITDA FY13 (EBITDA FY13 (EBITDA ---- Capex) per ShareCapex) per ShareCapex) per ShareCapex) per Share

EBOS Group Limited – Independent Adviser’s Report Page 71
Assessment of the Merits of the Transaction
allow for fully-imputed dividend payments. With all else being equal, New Zealand investors will
therefore pay more personal tax in relation to dividend distributions. We note that talks continue
between the New Zealand and Australian Governments regarding the potential for mutual
recognition of tax credits earned in each country with a view to overcoming this issue. However,
at this stage it is not possible to determine the likelihood of legislative changes or when they may
take effect.
� Projected increases in returns should be considered in the context of potential changes in the risk
profile for EBOS’ business. If either the business or financial risks of the business are expected to
materially increase, then a commensurate increase in expected return is needed to compensate
for the higher risk profile. Our assessment of the impact that the Transaction will have on EBOS
from a risk perspective is set out in Section 7.6, where we conclude that while the overall risk
profile of the business will arguably increase, the impact may be relatively limited. On that basis,
the earnings accretion expected from the Transaction appears to be reasonably attractive.
7.4 Funding Impacts
We suggest that the impacts of the proposed funding structure from existing EBOS shareholders’ point
of view (other than Zuellig) should be addressed with reference to the following questions:
� Is the proposed mixture of debt and equity funding reasonable?
� What impact does the proposed Pre-Transaction Placement have on existing shareholders, and is
the pricing of the placement consistent with other recent market transactions?
� What are the potential outcomes from the proposed Rights Issue and is the issue price for shares
to be allotted under the Rights Issue reasonable?
� What is the potential impact of the Zuellig Share Allotment on the control position of the
Company?
The first three of these issues are discussed in more detail in this section, while the impact on the control
position of the Company is set out below in Section 7.5.
7.4.1 Post-Transaction Gearing Position
As discussed in Section 2.2, approximately NZ$379 million of cash is required to partially fund the
Transaction. Figure 24 summarises the intended mix of debt and equity and shows that approximately
63% of the total required funding will be sourced from the issue of new equity.
Figure Figure Figure Figure 24242424: Cash Funding Sources: Cash Funding Sources: Cash Funding Sources: Cash Funding Sources
Source: EBOS, Northington Partners' Analysis
New DebtNZ$140m (37%)
EquityNZ$239m (63%)
Rights IssueNZ$149m
(39%)
Pre-TransactionPlacementNZ$90m (24%)
Total Cash Funding: NZ$379m

EBOS Group Limited – Independent Adviser’s Report Page 72
Assessment of the Merits of the Transaction
The implications of the proposed funding structure can be appropriately considered by comparing EBOS’
gearing position before and after the Transaction. This is summarised in Table 44.
Table Table Table Table 44444444: : : : EBOS Gearing Position Before and After TransactionEBOS Gearing Position Before and After TransactionEBOS Gearing Position Before and After TransactionEBOS Gearing Position Before and After Transaction
Before TransactionBefore TransactionBefore TransactionBefore Transaction
June 2013June 2013June 2013June 2013 ProjectedProjectedProjectedProjected
(NZ$m(NZ$m(NZ$m(NZ$m))))
AfterAfterAfterAfter TransactionTransactionTransactionTransaction
June 2013June 2013June 2013June 2013 ProjectedProjectedProjectedProjected
(NZ$m)(NZ$m)(NZ$m)(NZ$m)
Net Debt $73 $444
Market Equity $519 $1,256
Debt + Debt + Debt + Debt + Market Market Market Market EquityEquityEquityEquity $$$$592592592592 $1,700$1,700$1,700$1,700
Net Debt / (Net Debt + Equity) 12% 26%
EBITDA / Net Debt 1.4x 2.2x
Source: EBOS
Gearing levels for EBOS will increase following the Transaction as a result of two factors:
� The existing level of gearing used by Symbion is higher than that currently used by EBOS, and
EBOS will assume the Symbion debt funding arrangements as part of the Transaction; and
� EBOS will increase its current debt facility by NZ$140 million to help fund the Purchase Price.
Figure 25 compares the projected post-Transaction gearing level for EBOS with Symbion’s two main
competitors in the Australian market, as well as with the broad market averages in both New Zealand
and Australia.
Figure Figure Figure Figure 25252525: EBOS’ Comparative Gearing Position: EBOS’ Comparative Gearing Position: EBOS’ Comparative Gearing Position: EBOS’ Comparative Gearing Position
Source: EBOS, CapitalIQ, Northington Partners’ Analysis (market data as at 22 May 2013)
1.4x
2.2x
2.7x
1.7x 1.8x
-x
0.5x
1.0x
1.5x
2.0x
2.5x
3.0x
EBOS (Pre Transaction)
EBOS (Post Transaction
API Sigma NZX 50 Average ASX 200 Average
Leverage (Net Debt / EBITDA)Leverage (Net Debt / EBITDA)Leverage (Net Debt / EBITDA)Leverage (Net Debt / EBITDA)
12%
26%
49%
14% 15%
-%
10%
20%
30%
40%
50%
60%
EBOS (Pre Transaction)
EBOS (Post Transaction
API Sigma NZX 50 Average ASX 200 Average
Gearing (Net Debt / (Net Debt + Market Equity))Gearing (Net Debt / (Net Debt + Market Equity))Gearing (Net Debt / (Net Debt + Market Equity))Gearing (Net Debt / (Net Debt + Market Equity))

EBOS Group Limited – Independent Adviser’s Report Page 73
Assessment of the Merits of the Transaction
The comparative data indicates that EBOS will have a gearing level which is much higher than Sigma
(which has a net cash position), but which is significantly lower than that of API. While this comparison
has only limited value, we note that API’s debt level is attributed as one of the reasons for its recent poor
perception in the Australian market.
Figure 25 also shows that EBOS will have higher gearing than the market averages in both New Zealand
and Australia. However, we note that EBOS has a track record of stable earnings growth with very
strong cash flows, and is expected to retain a reasonably conservative interest coverage ratio following
the Transaction (with a projected EBITDA / Interest ratio of 5.2x). On that basis, we suggest that EBOS
is in a better position to prudently support a higher level of debt than many businesses included in the
broad market averages.
EBOS’ gearing position during the last four years is presented in Figure 26, which shows that net debt
was very low in the two year period leading up to the Masterpet acquisition during FY2012. At the end of
the financial year following the acquisition, the Net Debt / EBITDA ratio reached 1.9x before subsequently
declining as a result of both debt repayments and increases in EBITDA.
Figure Figure Figure Figure 26262626: EBOS’ Historical Gearing Position: EBOS’ Historical Gearing Position: EBOS’ Historical Gearing Position: EBOS’ Historical Gearing Position
Source: EBOS, Capital IQ, Northington Partners' Analysis
The Transaction will clearly lead to a significant increase in EBOS’ debt level and the associated financial
risk profile of the business. However, in the circumstances we do not believe that the post-Transaction
capital structure of the Company is overly aggressive:
� The EBOS business generates a high level of operational cash flow and has limited capital
expenditure requirements in the short-term. Even allowing for a continuation of the current
dividend policy, the Company should be in a position to reduce its debt position through time if
that is needed; and
� The proposed mixture of funding sources balances the trade-off between using a moderate level
of lower cost debt funding and the Company’s capacity to raise a significant amount of new equity
at a price which minimises the potential dilution to existing shareholders.
7.4.2 Pre-Transaction Placement
Given the relative scale of the Transaction, EBOS needs to raise a significant amount of new equity to
fund the Purchase Price. Excluding the Zuellig Share Allotment, EBOS intends to raise approximately
1.0x
0.1x
1.9x1.7x
1.4x
-x
0.5x
1.0x
1.5x
2.0x
2.5x
30-Jun-09 30-Jun-10 30-Jun-11 30-Jun-12 31-Dec-12 30-Jun-13 Pre Transaction
Ne
t D
eb
t /
EB
ITD
AN
et
De
bt
/ E
BIT
DA
Ne
t D
eb
t /
EB
ITD
AN
et
De
bt
/ E
BIT
DA
nm
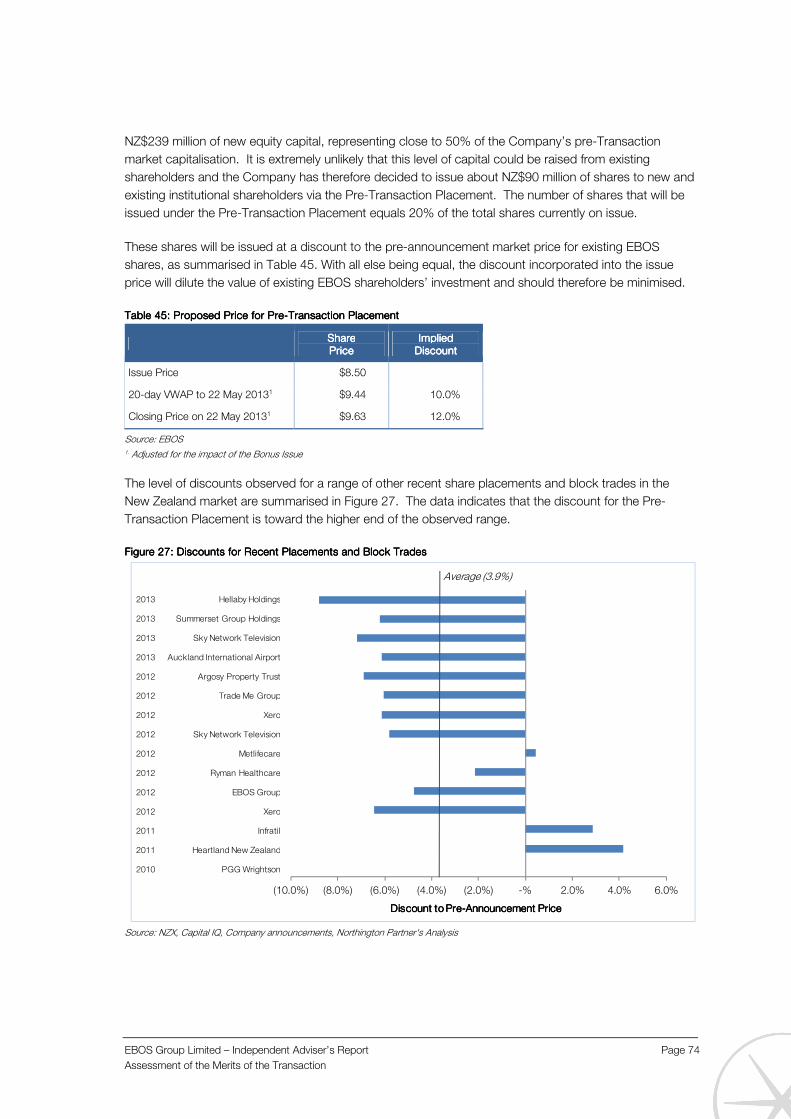
EBOS Group Limited – Independent Adviser’s Report Page 74
Assessment of the Merits of the Transaction
NZ$239 million of new equity capital, representing close to 50% of the Company’s pre-Transaction
market capitalisation. It is extremely unlikely that this level of capital could be raised from existing
shareholders and the Company has therefore decided to issue about NZ$90 million of shares to new and
existing institutional shareholders via the Pre-Transaction Placement. The number of shares that will be
issued under the Pre-Transaction Placement equals 20% of the total shares currently on issue.
These shares will be issued at a discount to the pre-announcement market price for existing EBOS
shares, as summarised in Table 45. With all else being equal, the discount incorporated into the issue
price will dilute the value of existing EBOS shareholders’ investment and should therefore be minimised.
Table Table Table Table 45454545: : : : Proposed Price for PreProposed Price for PreProposed Price for PreProposed Price for Pre----Transaction PlacementTransaction PlacementTransaction PlacementTransaction Placement
ShareShareShareShare PricePricePricePrice
ImpliedImpliedImpliedImplied DiscountDiscountDiscountDiscount
Issue Price $8.50
20-day VWAP to 22 May 20131 $9.44 10.0%
Closing Price on 22 May 20131 $9.63 12.0%
Source: EBOS 1. Adjusted for the impact of the Bonus Issue
The level of discounts observed for a range of other recent share placements and block trades in the
New Zealand market are summarised in Figure 27. The data indicates that the discount for the Pre-
Transaction Placement is toward the higher end of the observed range.
Figure Figure Figure Figure 27272727: Discounts for Recent Placements and Block Trades: Discounts for Recent Placements and Block Trades: Discounts for Recent Placements and Block Trades: Discounts for Recent Placements and Block Trades
Source: NZX, Capital IQ, Company announcements, Northington Partner's Analysis
(10.0%) (8.0%) (6.0%) (4.0%) (2.0%) -% 2.0% 4.0% 6.0%
Discount to Discount to Discount to Discount to PrePrePrePre----Announcement PriceAnnouncement PriceAnnouncement PriceAnnouncement Price
Average (3.9%)
2013 Hellaby Holdings
2013 Summerset Group Holdings
2013 Sky Network Television
2013 Auckland International Airport
2012 Argosy Property Trust
2012 Trade Me Group
2012 Xero
2012 Sky Network Television
2012 Metlifecare
2012 Ryman Healthcare
2012 EBOS Group
2012 Xero
2011 Infratil
2011 Heartland New Zealand
2010 PGG Wrightson

EBOS Group Limited – Independent Adviser’s Report Page 75
Assessment of the Merits of the Transaction
In the circumstances, we believe that the discount for the issue price of the shares under the Pre-
Transaction Placement is reasonable. While it is higher than those for most of the recent market
transactions, we note that:
� Most of the most recent evidence relates to large block trades of existing share parcels, and on
that basis is not directly comparable to the Pre-Transaction Placement;
� The overall EBOS capital raising is large and the discount offered to new investors needs to be
sufficient to ensure that the placement can be successfully implemented; and
� The Pre-Transaction Placement makes up only 39% of the NZ$239 million total new equity capital
being sought, and the impact of the price dilution is therefore relatively limited. We estimate that
the theoretical impact of the placement on EBOS' share value will be a decline of about 1.5%
(approximately NZ$0.15). However, as discussed in further detail below, this potential dilutionary
share price impact should be considered in the context of the overall impacts of the Transaction.
As indicated in Section 2.2, the Pre-Transaction Placement will take place immediately following the
announcement of the Transaction, but prior to the confirmation of the shareholder approvals which are
needed before the Transaction can be confirmed. This means that there is a chance that the capital will
be raised even though the Transaction may not subsequently proceed, with EBOS incurring related
capital raising costs and arguably leaving the Company with surplus capital.
While it would obviously be optimal to structure the capital raising process in a way that avoided the
possibility of this scenario taking place, the timetable constraints for the Transaction mean that there is
little alternative. We also suggest that if this particular Transaction does not proceed, EBOS will continue
to pursue other opportunities that could utilise the new capital. The potential negative impact of this
factor is therefore relatively minor.
7.4.3 Rights Issue
EBOS intends to raise approximately NZ$149 million from the Rights Issue. All shareholders at the time
of the Rights Issue (including the recipients of shares issued under the Pre-Transaction Placement) will
receive an entitlement to acquire 7 new shares for every 20 shares already owned.
The appropriate discount to TERP incorporated into the issue price for any rights issue is a matter of
subjective judgment. In EBOS’ case, it requires striking a balance between encouraging broad
participation in the Rights Issue by all shareholders and not unduly facilitating the acquisition of
discounted EBOS shares by key institutional shareholders (under possible underwriting commitments) at
the expense of minority shareholders who are not in a position to participate.
The issue price of NZ$6.50 per share represents a discount of just over 24% to EBOS’ TERP (based on a
current market share price of NZ$9.44 per share, after allowance for the impact of the Bonus Issue). This
level of discount is generally consistent with the range of discounts observed in a selection of similar
rights issues conducted over the last few years, a summary of which is set below in Figure 28 (with more
detail provided in Appendix 6).
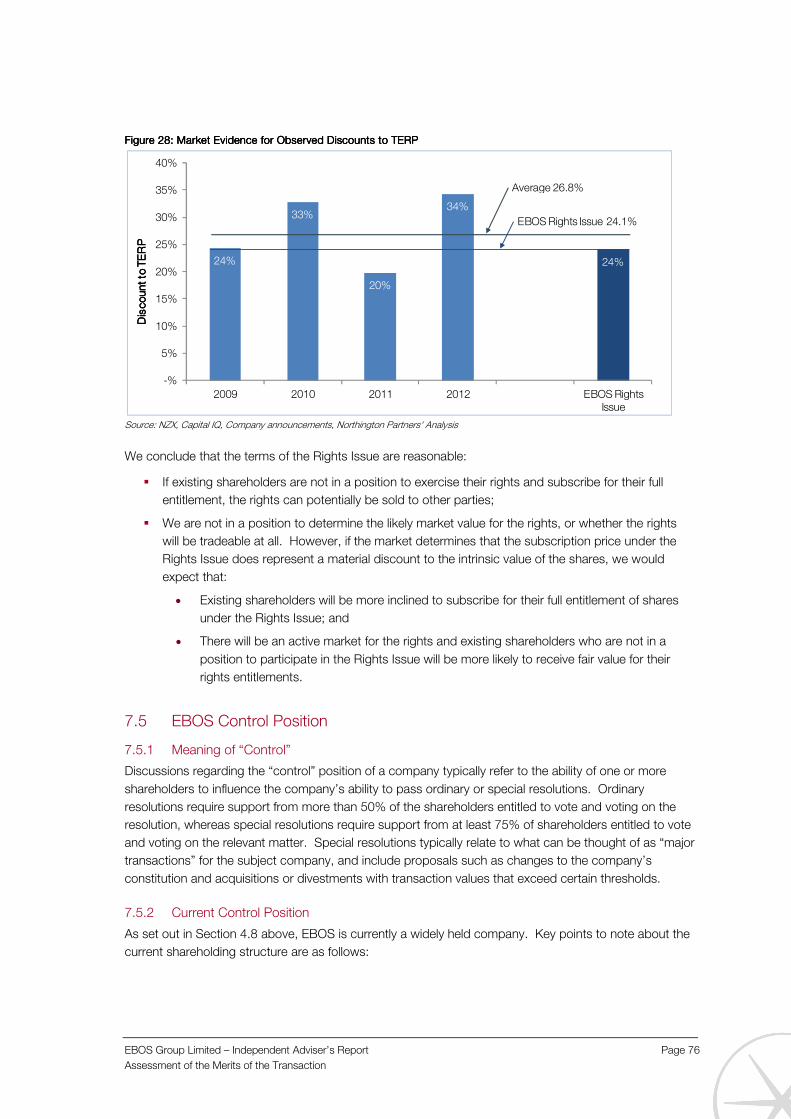
EBOS Group Limited – Independent Adviser’s Report Page 76
Assessment of the Merits of the Transaction
Figure Figure Figure Figure 28282828: Market Evidence for O: Market Evidence for O: Market Evidence for O: Market Evidence for Observed Discounts to TERPbserved Discounts to TERPbserved Discounts to TERPbserved Discounts to TERP
Source: NZX, Capital IQ, Company announcements, Northington Partners' Analysis
We conclude that the terms of the Rights Issue are reasonable:
� If existing shareholders are not in a position to exercise their rights and subscribe for their full
entitlement, the rights can potentially be sold to other parties;
� We are not in a position to determine the likely market value for the rights, or whether the rights
will be tradeable at all. However, if the market determines that the subscription price under the
Rights Issue does represent a material discount to the intrinsic value of the shares, we would
expect that:
• Existing shareholders will be more inclined to subscribe for their full entitlement of shares
under the Rights Issue; and
• There will be an active market for the rights and existing shareholders who are not in a
position to participate in the Rights Issue will be more likely to receive fair value for their
rights entitlements.
7.5 EBOS Control Position
7.5.1 Meaning of “Control”
Discussions regarding the “control” position of a company typically refer to the ability of one or more
shareholders to influence the company’s ability to pass ordinary or special resolutions. Ordinary
resolutions require support from more than 50% of the shareholders entitled to vote and voting on the
resolution, whereas special resolutions require support from at least 75% of shareholders entitled to vote
and voting on the relevant matter. Special resolutions typically relate to what can be thought of as “major
transactions” for the subject company, and include proposals such as changes to the company’s
constitution and acquisitions or divestments with transaction values that exceed certain thresholds.
7.5.2 Current Control Position
As set out in Section 4.8 above, EBOS is currently a widely held company. Key points to note about the
current shareholding structure are as follows:
24%
33%
20%
34%
24%
-%
5%
10%
15%
20%
25%
30%
35%
40%
2009 2010 2011 2012 EBOS Rights Issue
Dis
co
un
t to
TE
RP
Dis
co
un
t to
TE
RP
Dis
co
un
t to
TE
RP
Dis
co
un
t to
TE
RP
Average 26.8%
EBOS Rights Issue 24.1%
EBOS Group Limited – Independent Adviser’s Report Page 77
Assessment of the Merits of the Transaction
� The largest single shareholder is EBOS director Peter Kraus (via Whyte Adder No 3 and Herpa
Properties), with a shareholding level of approximately 8.4%;
� Based on the dates of the last SSH notices received by EBOS, the three existing substantial
security holders (being those shareholders who hold 5% or more of the Company’s shares) hold
a combined shareholding of about 22.1%; and
� The top 20 shareholders (as at 16 April 2013) together hold approximately 44.2% of the
Company’s shares.
No single shareholder currently has the ability to control the direction of EBOS in terms of unilaterally
determining whether an ordinary resolution or special resolution is passed or not. Even if all three
substantial security holders were to act in concert and vote against a special resolution, they would still
require the support of at least one or more other shareholders before their aggregate votes would be
sufficient to defeat the resolution.
7.5.3 Impact of Transaction on Shareholding Levels
If implemented, the Transaction will result in significant changes to the make-up of EBOS’ shareholder
register. The most notable feature will be the impact of the Zuellig Share Allotment, which will result in
Zuellig’s shareholding increasing from its current level of approximately 0.94% to 40.00%14.
The ultimate shareholding levels attained by other shareholders, most particularly those shareholders who
are or will become substantial security holders, will depend on the outcome of the Pre-Transaction
Placement and the Rights Issue. Both of these funding elements of the Transaction will take place after
the finalisation of this report; accordingly, it is not possible for us to make comment in relation to specific
shareholders or shareholding levels that may eventuate. However, we note:
� The Pre-Transaction Placement (which is fully underwritten) is for an amount of approximately
NZ$90 million, representing 20% of the current (pre-Transaction) EBOS shares on issue. Some
of the placement shares may be issued to existing substantial security holders, increasing the
level of their shareholding further above the 5% level. However, we understand the majority of
the Pre-Transaction Placement is expected to be made to new institutional investors or existing
institutional shareholders in EBOS who sit below the SSH level.
� It is possible that the number of SSHs will increase after the Pre-Transaction Placement is
completed. It is not possible at this stage to determine the likelihood of this happening, or the
number of SSHs that may end up on EBOS’ share register.
� If all shareholders entitled to participate in the Rights Issue subscribe for their full entitlement,
there will be no change in relative shareholding levels. However, to the extent that this does not
occur, relative shareholding levels will change as those shareholders who do not fully participate
will have the level of their shareholding diluted.
� As noted in Section 7.4 above, in the event that all shareholders do not fully participate in the
Rights Issue, it is possible that the underwriters (and/or sub-underwriters) will become
shareholders in EBOS. The size of any shareholding by the underwriters/sub-underwriters will
depend on general participation levels in the Rights Issue and the extent of any rights trading
during the specified trading period. It is not possible at this stage to determine the likelihood of
the underwriters/sub-underwriters becoming shareholders, or the size of any such shareholding.
14 As set out in Section 2.2 above, the Transaction has been structured so that Zuellig’s shareholding in EBOS will exactly equal 40.00% after taking account of the Pre-Transaction Placement and the Rights Issue.

EBOS Group Limited – Independent Adviser’s Report Page 78
Assessment of the Merits of the Transaction
� Notwithstanding the uncertainties surrounding the composition of the EBOS share register
following the Pre-Transaction Placement and the Rights Issue, the provisions of the Takeovers
Code will prevent any shareholder (apart from Zuellig) from holding more than 20% of EBOS’
shares. We expect few (if any) other shareholders will end up with a shareholding level higher
than 10%.
7.5.4 Post-Transaction Control Position
An increase in Zuellig’s shareholding to 40.00% will have a material impact on the control position of
EBOS. Key points to note are as follows:
� The overall influence that Zuellig will have in passing ordinary resolutions will increase significantly.
In some cases where a single shareholder holds or controls less than 50% of the voting rights
and the remaining shares are spread across a large number of minority shareholders, the
dominant shareholder can have effective control of the company. This situation arises because
the cornerstone shareholder can often approve ordinary resolutions in situations where a
sufficient number of minority shareholders do not vote. Given it is likely that there will remain a
large number of minority shareholders in EBOS after the Transaction is implemented, it is likely
that Zuellig will have effective control in this particular situation. We suggest that the practical
impact of Zuellig’s cornerstone shareholding position needs to be considered alongside the fact
that:
� It is reasonable to expect Zuellig to act rationally and in a manner that is consistent with
the best interests of all shareholders; and
� Other institutional shareholders will exist on the EBOS shareholder register. These
investors will take an active interest in any resolution that must be considered by
shareholders; the presence of the institutional investors should therefore act as a
counterbalance (albeit somewhat limited) to poor participation by minority shareholders.
� Even if Zuellig does not have effective control (and the ability to pass ordinary resolutions by itself
if other minority shareholder do not vote), it would only require the support of one (maybe two)
other substantial security holders in order to be assured of being able to pass ordinary
resolutions.
� Zuellig will be in a position to veto special resolutions of the Company. However, we do not
believe this fact should of itself be cause for concern. Zuellig has a long-standing association
with pharmaceutical industries across a number or countries, is a reputable investor, and (as
already indicated) can reasonably be expected to act rationally and in a manner that is consistent
with the best interests of all shareholders.
� In terms of passing special resolutions, Zuellig will still need widespread support from a range of
other shareholders.
On balance, Zuellig’s increased influence over the passing of ordinary resolutions will be strictly in line
with its increased shareholding following completion of the Transaction. Although Zuellig may not
necessarily be able to unilaterally pass ordinary resolutions with a 40% shareholding, it could do so with
the support of a small group of existing or new institutional shareholders. However, assuming again that
the investment objectives of Zuellig are closely aligned with those of all of the other major shareholders,
the practical impact of the Zuellig Share Allotment on the voting outcomes for ordinary resolutions may
be limited.

EBOS Group Limited – Independent Adviser’s Report Page 79
Assessment of the Merits of the Transaction
7.6 EBOS Risk Profile
EBOS is exposed to a number of risks which can be categorised as financial risks and business risks.
The key financial risks are discussed above in Section 7.3 and Section 7.4, and a summary of EBOS’ key
existing business risks is set out in Section 4.11.
After the Transaction, EBOS will also become exposed to the main business risks of Symbion (as
detailed in Section 3.10). Table 46 below provides a summary of EBOS’ risk profile before and after the
Transaction.
Table Table Table Table 46464646: : : : Key Business Risks for EBOS Before and After the TransactionKey Business Risks for EBOS Before and After the TransactionKey Business Risks for EBOS Before and After the TransactionKey Business Risks for EBOS Before and After the Transaction
Before the TransactionBefore the TransactionBefore the TransactionBefore the Transaction After the TransactionAfter the TransactionAfter the TransactionAfter the Transaction
� The most significant business risks are market and
regulatory risks. For EBOS to be successful, it needs
to be able to achieve acceptable pricing and
reimbursement from its customers (including
government agencies and third party providers).
� EBOS is exposed to the actions of competitors and
the risk of new government policies, regulations or
legislation that may impact or restrict its ability to
achieve acceptable pricing and therefore operate
profitability.
� Given the geographical focus for the majority of
EBOS’ divisions, the market and regulatory risk
exposure is predominantly New Zealand based.
� However, EBOS’ Australian based divisions are sub-
scale and are exposed to the actions of larger
competitors who seek to offer a more complete
service offering.
� Like EBOS, Symbion operates in a highly competitive
and highly regulated environment. At a general level,
Symbion’s business risks are therefore similar in
nature to those experienced by EBOS - i.e. the
actions of competitors and changes in government
policies and laws.
� At a more detailed level, the different business risk
profile of Symbion reflects the different operating and
regulatory environment in Australia. Symbion has two
significant competitors in API and Sigma, and a lower
overall national market share in its key divisions than
EBOS’ equivalent divisions in New Zealand.
Arguably, the Australian environment is more
competitive than in New Zealand.
� From a regulatory standpoint, Symbion’s key
exposures relate to on-going PBS reforms, whether
CSO funding will continue to match the costs of
servicing, and the possibility of future changes to
pharmacy ownership rules that could allow
supermarkets to enter the pharmacy retailing space.
� The sub-scale risks that EBOS’ existing Australian
divisions are exposed to should be alleviated when
their service offerings can be supplemented with the
fuller, national offering of Symbion.
Source: Northington Partners’ analysis
We conclude that both EBOS and Symbion are exposed to business risks that are well understood by
the respective management teams. Strategies appear to exist to deal with the probable effects of many
of those risks, while other risks appear unlikely to materialise in the near-term. Both businesses have
demonstrated a track record of being able to adapt to key structural changes in their respective
operating markets.
On balance, we believe that the business risk profile for EBOS following the Transaction is not
significantly different to the business risks it currently faces. The increased exposure to the competitive
and regulatory risks in the Australian market is at least partially offset by the benefits of increased scale
and geographical diversification.
EBOS Group Limited – Independent Adviser’s Report Page 80
Assessment of the Merits of the Transaction
7.7 Alternative Options
On the basis of discussions with EBOS management, we understand the Company has considered a
wide range of alternative acquisition opportunities. Most of those opportunities have been Australian
based and on a far smaller scale than Symbion. Compared to these smaller alternative options, the
Transaction offers EBOS a rare opportunity to transform its business and establish itself as a clear sector
leader in the Australasian market. On this basis, the Transaction is preferred by EBOS over the other
transactions that have been considered.
The other two obvious scale opportunities that EBOS could consider are API and Sigma. In our view, the
key considerations in relation to these alternatives are as follows:
� Neither API nor Sigma is as well aligned with EBOS’ existing business as Symbion. Symbion
represents a far better strategic fit in terms of the overlap of service offerings and sector
exposure.
� Symbion is a market leader in a number of its business divisions and is perceived to have a
number of competitive advantages over both API and Sigma.
� API and Sigma are both publicly listed entities on the ASX. Accordingly, acquiring either of these
businesses would require EBOS to make a public takeover offer and adhere to the strict rules
and timeframes regarding the takeover of a listed entity. Given all of the uncertainty in relation to
a public takeover process, acquiring the privately owned Symbion is an easier transaction to
execute with a far higher level of completion certainty.
� The financial performance of Symbion has been better than API or Sigma over recent years.
Notwithstanding this, the Transaction Purchase Price appears to represent better value than
EBOS would likely need to pay for Sigma (based on current trading multiples). Although API is
currently trading on an earnings multiple well below that implied for Symbion, EBOS would likely
need to pay an acquisition premium (typically around 35% in the Australian market) to have a
realistic chance of acquiring API through a public takeover offer. When such a premium is
factored in, the likely price of acquiring API would be similar to or higher than the Purchase Price
to acquire Symbion.
� After the Transaction, EBOS will own 100% of Symbion. There is no guarantee that a public
takeover offer for either API or Sigma would get acceptances sufficient to allow EBOS to achieve
100% ownership of either company.
� EBOS has been able to conduct a detailed due diligence on Symbion’s business. A public
takeover of API or Sigma would initially be limited to publicly available information; any further due
diligence would be limited in scope and need to be conducted over a short time period to comply
with the statutorily imposed time limits of a listed takeover.
Finally, the Transaction should be considered against a status quo position (i.e. if EBOS shareholders do
not approve the Transaction). In our view, the key issues in relation to the status quo alternative are as
follows:
� EBOS has limited growth opportunities in New Zealand (it is a mature business in a mature
market with few acquisition opportunities of scale available);
� EBOS’ Australian divisions are sub-scale and at risk from the actions of larger competitors; and
� The share price of the Company has rallied strongly over the last 12 months on the basis of
comments made by EBOS that it is looking for further acquisitions. If the market’s expectations

EBOS Group Limited – Independent Adviser’s Report Page 81
Assessment of the Merits of the Transaction
of further acquisitions are not met, there is a very real risk that EBOS’ share price could decline
materially as the market contemplates how further earnings growth could be achieved.
7.8 Other Important Impacts of the Transaction
As summarised in Section 5.5, the Transaction will result in EBOS becoming far more reliant on the
Australian market. On a pro-forma basis, earnings generated in Australia will increase from the current
level of approximately 20% of the total to more than 80% after accounting for the Symbion business.
Apart from the dramatic increase in EBOS’ exposure to risks associated with the Australian market and
exchange rate fluctuations, there are two other potential ancillary effects of the increased Australian focus
to consider:
� Organisational StructureOrganisational StructureOrganisational StructureOrganisational Structure: While the current management and governance structure of EBOS will
not dramatically change in the short term (as described in Section 5.4), we suggest that it is likely
that a greater proportion of Board appointees and senior management personnel will in time be
Australian based. Following an initial integration period post-Transaction, the transfer of key roles
to Australia will appropriately reflect the relative importance of that market to the overall business
and is likely to be in the best interests of all shareholders.
� ASX Listing and Share LiquiditASX Listing and Share LiquiditASX Listing and Share LiquiditASX Listing and Share Liquidityyyy: As part of its agreement with Zuellig, EBOS has agreed to a
primary dual listing on the ASX by the end of 2013 (unless a unanimous resolution of EBOS’
Board is passed to the contrary). The desired listing in Australia reflects an expectation that an
increasing proportion of the shares will be owned by Australians in the medium term and that the
ASX listing will therefore improve the overall liquidity in the shares.
It is difficult to assess the impact of the Transaction on the likely liquidity of EBOS’ shares in the
short-medium term. The 40% shareholding held by Zuellig following the completion of the
Transaction cannot be traded until around September 2014 at the earliest15, and we are in no
position to comment on Zuellig’s potential trading activity following the completion of the trading
blackout period: it is possible that Zuellig will retain all of its EBOS shares as a long-term
investment. We also expect that the majority of shares issued under the Pre-Transaction
Placement will be acquired by investors with a long-term investment horizon and that most of
these shares will not be traded in the short term.
However, it is likely that the Transaction will generate more market interest in the Company in
both New Zealand and Australia, based on its increased scale and improved index position. That
increase in interest may in turn lead to the potential for more trading activity over time.
7.9 Fairness Assessment
The key requirement of an Appraisal Report produced for this sort of transaction under NZSX Listing Rule
1.7.2 is an assessment of whether or not the consideration and the terms and conditions of the
Transaction are fair to the EBOS shareholders who are not associated with Zuellig. Although the exact
meaning of the word “fair” is not prescribed in the NZSX Listing Rules, it is usually given a fairly narrow
interpretation which focuses on the price paid or received for the assets under consideration.
In this particular instance given the nature of the Transaction, the main focus for the EBOS shareholders
should be whether the Symbion business is being acquired by EBOS at a price, and on terms and
conditions, which are favourable to Zuellig.
15 Based on Zuellig’s undertaking not to sell any shares until after EBOS’ announcement of its FY2014 earnings results.

EBOS Group Limited – Independent Adviser’s Report Page 82
Assessment of the Merits of the Transaction
All of the relevant terms and conditions of the Transaction are discussed in some detail throughout this
section. As set out in our discussion, we conclude that the terms and conditions of the Transaction
(including the consideration paid by EBOS for the Symbion business) are fair to the EBOS shareholders
who are not associated with Zuellig.

EBOS Group Limited – Independent Adviser’s Report Page 83
Appendix 1: Regulatory Requirements and Scope of this Report
Appendix 1: Regulatory Requirements and Scope of this Report
1.0 Takeovers Code Requirements
1.1 Overview
The Takeovers Code sets out rules governing the conduct of company takeovers in New Zealand. The
provisions of the Takeovers Code apply to any company that is a “Code Company” (as defined in the
Takeovers Code). EBOS is a “Code Company” under Rule 3A of the Code by virtue of it being listed on the
NZSX.
The fundamental rule of the Takeovers Code is set out in Rule 6 and prevents any entity (together with its
associates) from becoming the holder or controller of 20% or more of the voting rights in a “Code Company”
other than via one of several courses of action prescribed in Rule 7 of the Takeovers Code.
Pursuant to Rule 7(d) of the Takeovers Code, a person may become the holder or controller of 20% or more
of a Code Company by an allotment of voting securities that has been approved by an ordinary resolution of
the Code Company.
The Transaction must therefore comply with the provisions set out in the Code relating to the Zuellig Share
Allotment. Rule 18(1) of the Code requires the directors of EBOS to obtain a report from an independent
adviser on the merits of the Zuellig Share Allotment. The independent report must be included with the
information that is sent to EBOS shareholders for the purpose of assisting them to decide whether to
approve the Zuellig Share Allotment.
The exact meaning of the word “merits” is not prescribed in the Takeovers Code and there is no well
accepted, authoritative New Zealand reference that clearly establishes what should be considered when
assessing the merits of a takeover offer. Although the Takeovers Panel has published a guidance note about
the role of an Independent Adviser, it has been careful not to limit the scope of the assessment and states
that the relevant factors that should be taken into consideration will depend on the features of the proposed
transaction as well as the prevailing circumstances of the parties involved. However, the Takeovers Panel
suggests that a merits assessment is broader than a valuation assessment and will include other positive and
negative aspects of a transaction.
1.2 Basis of Assessment
Northington Partners has assessed the merits of the Zuellig Share Allotment on the basis that it is an integral
part of the funding support for the Transaction. Accordingly, our merits assessment considers the Zuellig
Share Allotment in the context of the wider Transaction.
Our assessment included analysis and discussion of:
� The underlying value of the ordinary shares in ZHHA, based on an assessment of the intrinsic value of
Symbion’s business. Our assessment of value has been primarily based on the existing analysis and
financial models prepared by the counterparties and their advisers.
� The consideration offered for ZHHA’s shares, and the implied premium or discount that the Purchase
Price represents relative to our assessment of ZHHA’s underlying value. Given that part of the
consideration for ZHAA comprises the Zuellig Share Allotment, our assessment also considered the
implied issue price of the EBOS shares;
� The projected financial position and financial performance of EBOS following the Transaction, taking
account of the short-term transaction costs, post-Transaction synergies, and the impact of the
intended capital raising that will be carried out to partly fund the Purchase Price. This discussion was

EBOS Group Limited – Independent Adviser’s Report Page 84
Appendix 1: Regulatory Requirements and Scope of this Report
extended to include a comparative assessment of the potential future returns and the risk/reward
dynamics for the Company’s shareholders assuming the Transaction is rejected and the Company
continues to operate under the “status quo”.
� The prospects, attractiveness and risk profile of both EBOS and Symbion, including an assessment of
key industry dynamics for both businesses in the Australian and New Zealand markets.
� Alternative courses of action that may be available to EBOS’ shareholders to derive value from their
investment, including a high level assessment of alternative acquisition options that may be pursued
by the Company.
� The impact of the Zuellig Share Allotment on the control position of EBOS and the future rights and
obligations of Zuellig if the Transaction is successful.
� The likely impact of the Transaction on the liquidity of EBOS’ shares.
� Other financial and non-financial factors we considered relevant in the circumstances.
2.0 NZSX Listing Rules Requirements
2.1 Overview
The Zuellig Share Allotment is subject to NZSX Rule 7.3. Under Listing Rule 6.2.2, an issue of equity
securities under Rule 7.3.1 must be accompanied by an Appraisal Report if the issue is intended or is likely
to result in more than 50% of the securities to be issued being acquired by directors or Associated Persons
of directors of the issuer. Zuellig is an Associated Person (within the meaning of NZSX Listing Rule 1.8) of
Peter Williams and Stuart McGregor who, if approved by shareholders under separate resolutions, will
become directors of the Company on completion of the Transaction. Zuellig will be acquiring all of the
securities being issued pursuant to Rule 7.3.1.
Listing Rule 6.2.2 requires that the Notice of Meeting sent to EBOS shareholders outlining the Transaction
must be accompanied by an Appraisal Report. This report represents the Appraisal Report required by the
Listing Rules and, pursuant to Listing Rule 1.7.2, sets out our opinion on whether or not the consideration
and the terms and conditions of the Transaction are fair to the EBOS shareholders not associated with
Zuellig and the grounds for that opinion.
For the purpose of the Listing Rules we certify that:
� We believe that the EBOS shareholders entitled to vote on the resolution in relation to the Zuellig
Share Allotment will be provided with sufficient information on which to make an informed decision.
The main sources of information are this report and the Notice of Meeting;
� We have been provided with all of the information that we believe is required for the purposes of
preparing this report; and
� The material assumptions on which our opinion has been based are clearly set out in the body of this
report.
The Transaction is also subject to NZSX Listing Rule 9.1 (Disposal or Acquisition of Assets). Rule 9.1.1
prevents a listed entity from entering into a transaction or series of transactions to, among other things,
acquire assets as part of a major transaction unless the transaction is approved by an ordinary resolution of
the listed entity’s shareholders. The Transaction falls within the ambit of Rule 9.1.1 because the Purchase
Price exceeds 50% of the weighted average market capitalisation of EBOS during the 20 business days prior
to the Transaction being announced to the market.

EBOS Group Limited – Independent Adviser’s Report Page 85
Appendix 1: Regulatory Requirements and Scope of this Report
Pursuant to Rule 9.1, the Notice of Meeting to be sent to EBOS shareholders must contain such reports and
other information necessary for shareholders to appraise the implications of the Transaction. Rule 9.1 does
not explicitly state that an independent adviser’s report is required. However, EBOS believes that this report
helps to satisfy the requirements of Rule 9.1 of the Listing Rules.
2.2 Basis of Assessment
In our experience, the form of report required to satisfy Rule 18 of the Takeovers Code will meet most (if not
all) of the reporting requirements for the purposes of Rule 9.1 and Rule 7.3 of the NZSX Listing Rules.
Accordingly, the basis of our assessment of the Transaction for the purposes of the NZSX Listing Rules is the
same as that outlined above for the purposes of the Takeovers Code.

EBOS Group Limited – Independent Adviser’s Report Page 86
Appendix 2: Profile of the Australian Pharmaceuticals Industry
Appendix 2: Profile of the Australian Pharmaceuticals Industry
1.0 Overview
1.1 Products
A broad classification of pharmaceutical products, which include both prescription and non-prescription
products, is set out in Table 47 below.
Table Table Table Table 47474747: : : : Classification of Pharmaceutical ProductsClassification of Pharmaceutical ProductsClassification of Pharmaceutical ProductsClassification of Pharmaceutical Products
ClassificationClassificationClassificationClassification DescriptionDescriptionDescriptionDescription
Ethical Pharmaceutical Products
Medicines which can only be obtained with a prescription from a medical practitioner.
Pharmacist-only and Pharmacy-only Products
Classes of non-ethical products (i.e. no prescription required). Pharmacist-only products must be sold in a pharmacy under the supervision of a pharmacist and must be stored and displayed behind the counter. Pharmacy-only products must be sold in a pharmacy but can be displayed in front of the counter.
Over the Counter (“OTCOTCOTCOTC”) Products
OTC products are non-ethical products. Some must be sold in pharmacies and some may be sold in other retail outlets such as supermarkets.
Source: Northington Partners' Analysis
The majority of ethical pharmaceuticals are supplied through the PBS, a Commonwealth Government
scheme that subsidises the cost of certain prescription only products. Details on the PBS are set out in
paragraph 3.2 below.
1.2 Industry Structure
The Australian pharmaceuticals industry primarily comprises firms involved with the manufacture of
medicines and medical products, and service related segments including wholesaling and distribution. A
comparatively smaller number of firms are involved with bio-medical research and biotechnology. An
overview of the structure of the industry is set out in Figure 29 below.
Figure Figure Figure Figure 29292929: Industry Structure: Industry Structure: Industry Structure: Industry Structure
Source: Northington Partners' Analysis
Multinational
Research-based
Australian
ManufacturersAustralian Generic
Multinational
Generic
Pharmacists
Prescription OTC Healthcare
Other Retail
OTC Healthcare
Hospitals
Wholesalers /
Distributors
Pa
tien
ts /
Co
nsu
me
rs
Manufacturers
Retailers
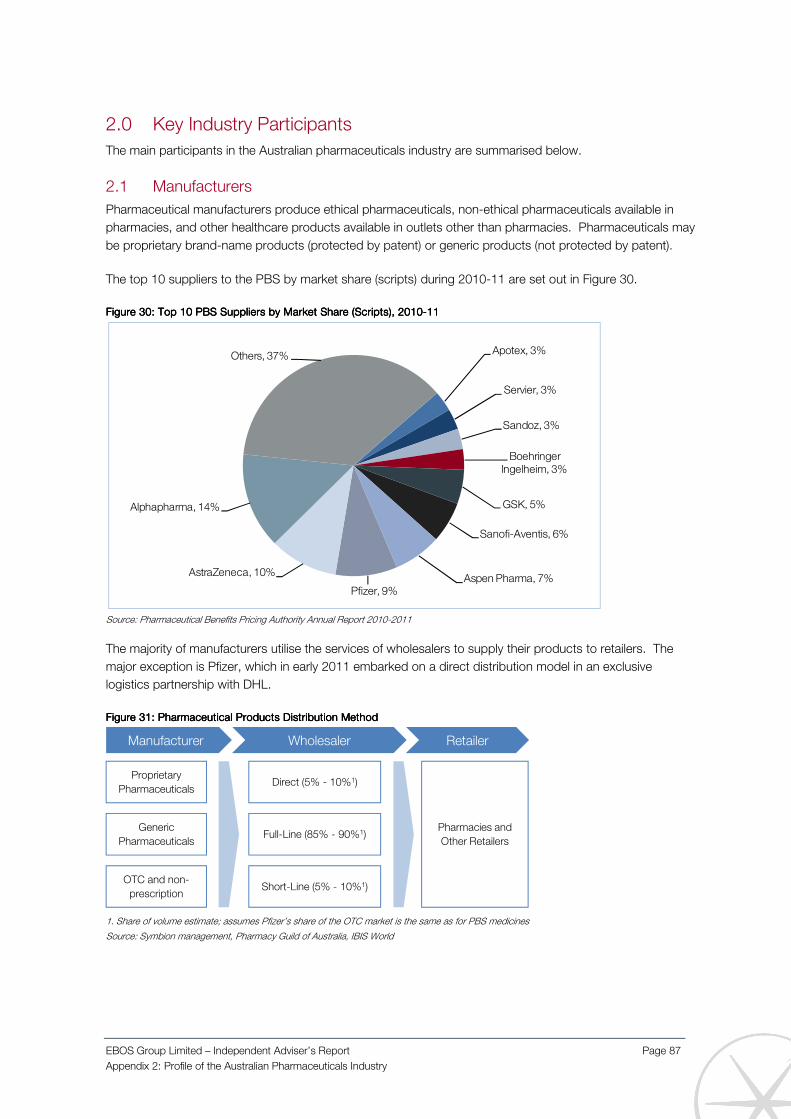
EBOS Group Limited – Independent Adviser’s Report Page 87
Appendix 2: Profile of the Australian Pharmaceuticals Industry
2.0 Key Industry Participants
The main participants in the Australian pharmaceuticals industry are summarised below.
2.1 Manufacturers
Pharmaceutical manufacturers produce ethical pharmaceuticals, non-ethical pharmaceuticals available in
pharmacies, and other healthcare products available in outlets other than pharmacies. Pharmaceuticals may
be proprietary brand-name products (protected by patent) or generic products (not protected by patent).
The top 10 suppliers to the PBS by market share (scripts) during 2010-11 are set out in Figure 30.
Figure Figure Figure Figure 30303030: Top 10 PBS Suppliers by Market Share (Scripts), 2010: Top 10 PBS Suppliers by Market Share (Scripts), 2010: Top 10 PBS Suppliers by Market Share (Scripts), 2010: Top 10 PBS Suppliers by Market Share (Scripts), 2010----11111111
Source: Pharmaceutical Benefits Pricing Authority Annual Report 2010-2011
The majority of manufacturers utilise the services of wholesalers to supply their products to retailers. The
major exception is Pfizer, which in early 2011 embarked on a direct distribution model in an exclusive
logistics partnership with DHL.
Figure Figure Figure Figure 31313131: Pharmaceutical Products Distribution Method: Pharmaceutical Products Distribution Method: Pharmaceutical Products Distribution Method: Pharmaceutical Products Distribution Method
1. Share of volume estimate; assumes Pfizer’s share of the OTC market is the same as for PBS medicines
Source: Symbion management, Pharmacy Guild of Australia, IBIS World
Apotex, 3%
Servier, 3%
Sandoz, 3%
Boehringer Ingelheim, 3%
GSK, 5%
Sanofi-Aventis, 6%
Aspen Pharma, 7%Pfizer, 9%
AstraZeneca, 10%
Alphapharma, 14%
Others, 37%
Proprietary
Pharmaceuticals
Generic
Pharmaceuticals
OTC and non-
prescription
Manufacturer Wholesaler
Direct (5% - 10%1)
Full-Line (85% - 90%1)
Short-Line (5% - 10%1)
Retailer
Pharmacies and
Other Retailers
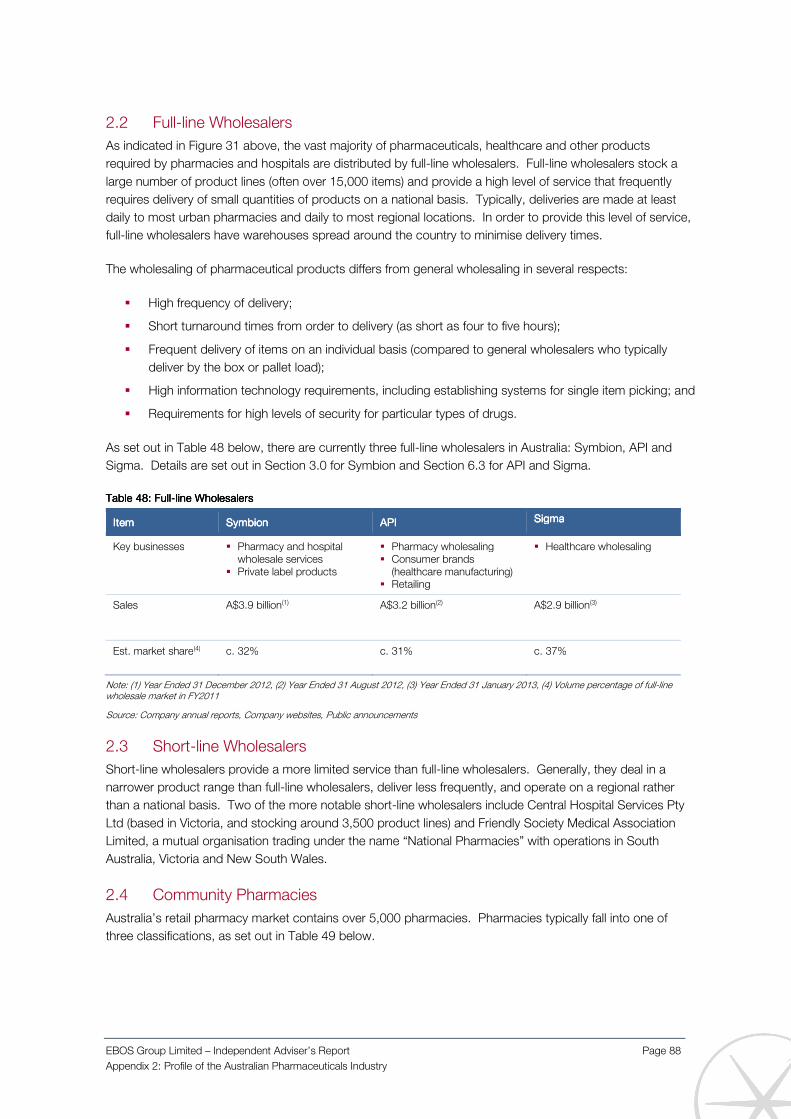
EBOS Group Limited – Independent Adviser’s Report Page 88
Appendix 2: Profile of the Australian Pharmaceuticals Industry
2.2 Full-line Wholesalers
As indicated in Figure 31 above, the vast majority of pharmaceuticals, healthcare and other products
required by pharmacies and hospitals are distributed by full-line wholesalers. Full-line wholesalers stock a
large number of product lines (often over 15,000 items) and provide a high level of service that frequently
requires delivery of small quantities of products on a national basis. Typically, deliveries are made at least
daily to most urban pharmacies and daily to most regional locations. In order to provide this level of service,
full-line wholesalers have warehouses spread around the country to minimise delivery times.
The wholesaling of pharmaceutical products differs from general wholesaling in several respects:
� High frequency of delivery;
� Short turnaround times from order to delivery (as short as four to five hours);
� Frequent delivery of items on an individual basis (compared to general wholesalers who typically
deliver by the box or pallet load);
� High information technology requirements, including establishing systems for single item picking; and
� Requirements for high levels of security for particular types of drugs.
As set out in Table 48 below, there are currently three full-line wholesalers in Australia: Symbion, API and
Sigma. Details are set out in Section 3.0 for Symbion and Section 6.3 for API and Sigma.
Table Table Table Table 48484848: : : : FullFullFullFull----lllline Wholesalersine Wholesalersine Wholesalersine Wholesalers
ItemItemItemItem SymbionSymbionSymbionSymbion APIAPIAPIAPI SigmaSigmaSigmaSigma
Key businesses � Pharmacy and hospital wholesale services
� Private label products
� Pharmacy wholesaling � Consumer brands
(healthcare manufacturing) � Retailing
� Healthcare wholesaling
Sales A$3.9 billion(1) A$3.2 billion(2) A$2.9 billion(3)
Est. market share(4) c. 32% c. 31% c. 37%
Note: (1) Year Ended 31 December 2012, (2) Year Ended 31 August 2012, (3) Year Ended 31 January 2013, (4) Volume percentage of full-line wholesale market in FY2011
Source: Company annual reports, Company websites, Public announcements
2.3 Short-line Wholesalers
Short-line wholesalers provide a more limited service than full-line wholesalers. Generally, they deal in a
narrower product range than full-line wholesalers, deliver less frequently, and operate on a regional rather
than a national basis. Two of the more notable short-line wholesalers include Central Hospital Services Pty
Ltd (based in Victoria, and stocking around 3,500 product lines) and Friendly Society Medical Association
Limited, a mutual organisation trading under the name “National Pharmacies” with operations in South
Australia, Victoria and New South Wales.
2.4 Community Pharmacies
Australia’s retail pharmacy market contains over 5,000 pharmacies. Pharmacies typically fall into one of
three classifications, as set out in Table 49 below.

EBOS Group Limited – Independent Adviser’s Report Page 89
Appendix 2: Profile of the Australian Pharmaceuticals Industry
Table Table Table Table 49494949: : : : Classification of PharmaciesClassification of PharmaciesClassification of PharmaciesClassification of Pharmacies
ClassificationClassificationClassificationClassification % of all % of all % of all % of all pharmaciespharmaciespharmaciespharmacies (1)(1)(1)(1)
DescriptionDescriptionDescriptionDescription
Aligned Brands 25% Groups of retail pharmacies (similar to franchise groups) which are principally marketing groups that allow for joint advertising and promotion. Formed with the purpose of providing support to retail pharmacies, group support generally includes marketing services and may comprise assistance with store layout, promotions and business advice. In many cases, banner group members are able to obtain (or must obtain a certain proportion of) products branded with the name of the banner group. The majority of banner groups are operated by the three full-line wholesalers.
Banner / Buying Groups
30% Buying groups are formed by individual pharmacists with the aim of acting collectively in purchasing so as to obtain cheaper prices than would otherwise be possible if they were acting individually. Buying groups obtain products both from wholesalers and directly from manufacturers.
Independent Pharmacies
45% Independent pharmacies are essentially those that are not part of a banner group or a buying group. Some independents are nonetheless informally aligned with wholesalers by making use of retail support programs offered by those wholesalers (for example, the “Pharmacy Choice” program provided by Symbion).
Note: (1) LEK Consulting Limited estimate
Source: Northington Partners' Analysis
2.5 Hospitals
Public and private hospitals acquire products directly from manufacturers as well as from full-line and short-
line wholesalers. Public hospitals may also obtain products from manufacturers by way of competitive
tender, a process which differs in various states.
3.0 Regulatory Framework
3.1 Overview
The vast majority of therapeutic goods sold in Australia are regulated under the Therapeutic Goods Act 1989
(“TG ActTG ActTG ActTG Act”). Principal features of the TG Act include:
� Setting out the legal requirements for the import, export, manufacture and supply of medicines in
Australia;
� Detailing the requirements for listing or registering of all therapeutic goods in the Australian Register
of Therapeutic Goods (“ARTGARTGARTGARTG”); and
� Establishing many other aspects of the law such as advertising, labelling and product appearance.
The TG Act is supported by Regulations and various Orders and Determinations which provide further details
of matters covered in the TG Act. Many of the TG Act’s requirements are overseen by the Therapeutic
Goods Administration (“TGATGATGATGA”), a business unit of the Australian Government Department of Health and
Ageing, which is responsible for ensuring therapeutic products available in Australia are of an acceptable
standard.
3.2 Pharmaceutical Benefits Scheme
3.2.1 Overview
The PBS is a Commonwealth Government scheme that subsidises the cost of certain prescription only
products. The PBS has been in operation since 1948, with the aim of providing Australian residents and
eligible foreign visitors with reliable and affordable access to a wide range of necessary medicines. Although
all prescription drugs approved by the TGA can be sold (on prescription) in Australia, most are supplied
through the PBS.

EBOS Group Limited – Independent Adviser’s Report Page 90
Appendix 2: Profile of the Australian Pharmaceuticals Industry
Once a drug has received TGA approval, the manufacturer or supplier of the drug may seek to list it on the
PBS. To be listed on the PBS a drug must be recommended by the Pharmaceutical Benefits Advisory
Committee (“PBACPBACPBACPBAC”). The PBAC is an independent expert body comprising medical practitioners,
pharmacists, consumers and health economists. The PBAC assesses clinical evidence to determine the
need for the drug, the efficacy of the treatment against alternatives, and the cost effectiveness of the drug
compared against alternative treatment.
If the PBAC recommends a product for listing on the PBS, the information is sent to the Pharmaceutical
Benefits Pricing Authority (“PBPAPBPAPBPAPBPA”). The PBPA makes recommendations to the Minister for Health and
Ageing on the price and conditions the manufacturer or supplier should receive for supplying medicines to
the PBS. The objective of the PBPA is to secure reliable supply of pharmaceutical products at the most
reasonable cost to Australian taxpayers and consumers consistent with maintaining a sustainable
pharmaceutical industry in Australia. The PBPA also reviews the PBS price of every listed medicine at least
once a year.
Consumers pay a proportion (a “co-payment”) of the cost of all PBS medicines, with the Australian
Government paying the balance of the cost. The amount of the co-payment is adjusted on 1 January each
year in line with the Consumer Price Index. From 1 January 2013, consumers pay up to a maximum of
A$36.10 for most PBS medicines (or A$5.90 if they hold a concession card).
For the year ended 30 June 2012, the total cost of PBS prescriptions was A$9.1 billion, comprising
government expenditure of A$7.6 billion (83.4% of the total cost) and patient contributions of A$1.5 billion
(16.6% of the total cost)16.
3.2.2 PBS Reforms
In 2007, the Australian Government, with the support of the Opposition, passed the most comprehensive
package of changes to the PBS since its inception in 1948 (“PBS ReformsPBS ReformsPBS ReformsPBS Reforms”). The PBS Reforms created
structural changes to the PBS intended to maintain the efficiency and sustainability of the scheme and to
provide certainty about pricing policy for the Australian pharmaceutical industry. A key objective of the
reforms was to encourage physicians to prescribe more generic (non-branded) pharmaceuticals which,
together with other initiatives, were originally estimated to produce savings to government of more than
A$3billion over 10 years.
The PBS Reforms were designed to cover the three main functions which concern the supply of medicines –
manufacturing, wholesaling and dispensing – and included the following elements:
� The creation of two separate formularies – F1 consists of drugs listed for which there is only one
brand listed on the PBS and F2 consists of drugs where there are two or more brands listed on the
PBS.
� A series of price reductions were applied to F2 drugs.
� The first time a new drug is listed on the PBS, the price of that drug is reduced by 12.5%.
� Progressive introduction of a system of price disclosure for all F2 medicines.
� A change to the pharmacy mark-up structure resulting in an increase in mark-ups for many
medicines.
� An incentive for pharmacies to process claims online (using PBS Online).
� A premium-free dispensing incentive to encourage dispensing of brands of substitutable PBS
medicines that cost consumers no more than the co-payment.
16 Source: Department of Health and Ageing (“DoHADoHADoHADoHA”); data reported on a cash accounting basis.

EBOS Group Limited – Independent Adviser’s Report Page 91
Appendix 2: Profile of the Australian Pharmaceuticals Industry
� An incentive for wholesalers to increase their participation in the Community Service Obligation
(“CSOCSOCSOCSO”) pool (details on the CSO are set out in Section 3.2.4 below).
� Funding for a campaign to increase consumer awareness of the safety and effectiveness of generic
medicines.
As a result of the evaluation of the PBS Reforms, a Memorandum of Understanding (“MOUMOUMOUMOU”) was signed in
September 2010 between the Australian government and Medicines Australia (the peak body representing
the manufacturers and suppliers of proprietary medicines in Australia). The MOU is designed to continue the
innovations and reforms to the PBS between 2010 and 2014 (“Additional PBS ReformsAdditional PBS ReformsAdditional PBS ReformsAdditional PBS Reforms”) and includes
additional price reductions (16% instead of the previous 12.5%) for a new listing of a PBS drug as a
competitor drug.
Another key component of the Additional PBS Reforms was the introduction of an expanded and
accelerated price disclosure (“EAPDEAPDEAPDEAPD”) regime, which expanded on the price disclosure regime that applied to
F2 drugs under the PBS Reforms. Essentially, in the second year that an off-patent drug is listed on the PBS
alongside a competitor generic drug, the EAPD regime requires the manufacturer to disclose monthly volume
and price data. The PBS listed price for that drug is then adjusted annually to the weighted average
disclosed price. Since its introduction, the price disclosure regime has had the effect of increasing the
penetration of generic drugs and reducing average prices for off-patent drugs.
3.2.3 Community Pharmacy Agreements
Community Pharmacy Agreements entered into between the Australian Government and the Pharmacy Guild
of Australia (the national body representing community pharmacies) are a key part of the regulatory
landscape. The Agreements provide remuneration for around 5,000 community pharmacies for the
dispensing of PBS medicines (including details around dispensing fees and pharmacy and wholesaler mark-
ups), the provision of pharmacy programs and services, and the CSO arrangements with pharmaceutical
wholesalers.
The current agreement, the Fifth Community Pharmacy Agreement, was signed on 3 May 2010 and took
effect on 1 July 2010 for a period of five years.
3.2.4 Community Service Obligation
As part of the Fourth Community Pharmacy Agreement, the Australian Government provided funding for a
CSO Funding Pool in addition to the wholesale mark-up included in remuneration for pharmacists. The
objective of the CSO Funding Pool (approximately A$182 million in 2012/13) is to ensure that arrangements
are in place to provide all Australians with on-going and timely access to the full range of PBS medicines via
their community pharmacy.
The CSO Funding Pool provides financial support to pharmaceutical wholesalers (typically full-line
wholesalers) supplying the full range of PBS medicines to community pharmacies across Australia,
regardless of pharmacy location and the relative cost of supply.
The Australian Government has committed to the on-going operation of the CSO Funding Pool until June
2015 under the Fifth Community Pharmacy Agreement.
3.2.5 Pricing of PBS Pharmaceuticals
When a community pharmacist supplies a PBS listed pharmaceutical, the pharmacist is paid the PBS
dispensed price of the pharmaceutical, less the amount of any co-payment from the consumer. The PBS
dispensed price consists of:

EBOS Group Limited – Independent Adviser’s Report Page 92
Appendix 2: Profile of the Australian Pharmaceuticals Industry
� The cost to the pharmacist;
� A mark-up by the pharmacist;
� Dispensing fees; and
� Any other fees the pharmacist is entitled to (e.g. special handling fees for dangerous drugs).
3.2.6 Cost to the Pharmacist
The cost to the pharmacist is made up of the manufacturer’s price (as determined by the PBPA) plus a mark-
up added by the wholesaler. The wholesaler mark-up is regulated under the terms of the Fifth Community
Pharmacy Agreement, as set out in Table 50 below. Wholesalers may apply a lesser mark-up than the
regulated maximum (which is a reasonably common occurrence as wholesalers seek to win business from
pharmacies).
Table Table Table Table 50505050: : : : Regulated Wholesaler MarkRegulated Wholesaler MarkRegulated Wholesaler MarkRegulated Wholesaler Mark----upupupup
PBS Manufacturer PricePBS Manufacturer PricePBS Manufacturer PricePBS Manufacturer Price Wholesaler MarkWholesaler MarkWholesaler MarkWholesaler Mark----upupupup
Up to and including $930.06 7.52% of the manufacturer’s price
Over $930.06 $69.94 (maximum price)
Source: Fifth Community Pharmacy Agreement
3.2.7 Pharmacy Mark-up
The pharmacy mark-up covers the costs to the pharmacist of storing and handling PBS pharmaceuticals.
The mark-up is added to the cost to the pharmacist of the product from the wholesaler and is a compulsory
charge to the consumer. As set out in Table 51 below, there are six levels of pharmacy mark-up allowed
under the terms of the Fifth Community Pharmacy Agreement. The level of mark-up remains the same,
regardless of the quantity of medicines supplied.
Table Table Table Table 51515151: : : : Regulated Pharmacy MarkRegulated Pharmacy MarkRegulated Pharmacy MarkRegulated Pharmacy Mark----upupupup
Cost of medicine to pharmacistCost of medicine to pharmacistCost of medicine to pharmacistCost of medicine to pharmacist Pharmacy MarkPharmacy MarkPharmacy MarkPharmacy Mark----upupupup
Up to and including $30.00 15%
Between $30.01 and $45.00 $4.50
Between $45.01 and $180.00 10%
Between $180.01 and $450.00 $18.00
Between $450.01 and $1,750.00 4%
Over $1,750.00 $70.00
Source: Fifth Community Pharmacy Agreement
3.2.8 Dispensing Fees
A “ready prepared” dispensing fee applies for PBS pharmaceuticals that do not require further preparation or
compounding, which is the case for the bulk of PBS medicines. This fee is a compulsory addition to the
pharmacy mark-up component, regardless of the cost of the medicine. The current ready prepared fee is
$6.52. Only one fee is paid for each prescription, regardless of quantity.

EBOS Group Limited – Independent Adviser’s Report Page 93
Appendix 2: Profile of the Australian Pharmaceuticals Industry
Different fee levels (or additional fees) apply in the case of pharmaceuticals that cannot be ready prepared or
constitute dangerous or highly specialised drugs.
3.2.9 Summary
An illustration of how the retail price of a PBS pharmaceutical is calculated (assuming a manufacturer price of
$100 as the starting point) is set out in Figure 32 below.
Figure Figure Figure Figure 32323232: Example of Pharmaceutical Retail Price Calculation: Example of Pharmaceutical Retail Price Calculation: Example of Pharmaceutical Retail Price Calculation: Example of Pharmaceutical Retail Price Calculation
Source: Fifth Community Pharmacy Agreement, Northington Partners' Analysis
3.3 Pharmacy Ownership and Location Rules
On 1 July 2010, a national scheme (covering all states and territories) was established for the registration and
accreditation of health professionals, including pharmacists. However, the scheme does not address the
rules regarding pharmacy ownership, which continues to be the responsibility of individual states and
territories. As a result there are variances from state to state on who may have an ownership interest in a
pharmacy business, and how many such businesses a person or entity can have an ownership interest in.
As a general rule (exceptions do exist), all jurisdictions within Australia restrict ownership of a pharmacy
business to pharmacists, entities owned by pharmacists, and friendly societies operated for the benefit of
their members. For pharmacist owners (excluding friendly societies), ownership is generally restricted to 4-6
pharmacy businesses in order to restrict the formation of corporatised chains.
Although large supermarket chains in Australia have made several attempts to enter the pharmacy space
(which is common in many overseas markets such as the US and UK), they are currently banned from doing
so under the terms of the Fifth Community Pharmacy Agreement. It is unclear whether the supermarkets will
lobby for this ban to be overturned before negotiations commence on the Sixth Community Pharmacy
Agreement which will come into force in July 2015.
There are strict rules governing where new pharmacies can be located, or the re-location of existing
pharmacies. These rules are designed to prevent new pharmacies competing against existing practices.
$100.00
$88.67
$7.50 $10.75 $36.10
$6.52
-
20
40
60
80
100
120
140
Manufacturer Price Wholesale regulated mark-up
Pharmacy regulated mark-up and fees
Retail Price
A$
A$
A$
A$
$124.80
Pharmacy Mark-up
Dispensing Fee
Consumer Co-payment
Government Payment

EBOS Group Limited – Independent Adviser’s Report Page 94
Appendix 2: Profile of the Australian Pharmaceuticals Industry
4.0 Industry Trends
4.1 Size
As set out in Figure 33 below, total pharmaceutical industry turnover has increased from around A$12.7
billion in 2005 to around A$21.3 billion in 2011. Growth in the industry has been driven principally by PBS
and OTC expenditure.
Figure Figure Figure Figure 33333333: Pharmaceuticals Industry Turnover: Pharmaceuticals Industry Turnover: Pharmaceuticals Industry Turnover: Pharmaceuticals Industry Turnover
Notes: (1) Hospitals data excludes PBS drugs but includes highly specialised drugs
Source: Australian Institute of Health and Welfare.
4.2 Outlook
On 14 May 2013, the Commonwealth Government announced its budget for 2013-14 (“BudgetBudgetBudgetBudget”). The
Budget states that total healthcare expenditure is estimated to increase by a total of 8.6% in real terms
through to 2016-17, driven by a growing and ageing population. However, the PBS expenditure component
of the Budget is estimated to grow at a lower rate of 5% in real terms.
Figure 34 below sets out the Budget’s forecast expenditure on pharmaceutical benefits and services from
2012-13 through to 2016-17.
-
5
10
15
20
25
2005 2006 2007 2008 2009 2010 2011
A$
bn
A$
bn
A$
bn
A$
bn
Other
Hospitals
OTC
PBS and RPBS (co-payment)
PBS and RPBS (government)

EBOS Group Limited – Independent Adviser’s Report Page 95
Appendix 2: Profile of the Australian Pharmaceuticals Industry
Figure Figure Figure Figure 34343434: Forecast Pharmaceutical Benefits and Services Expenditure: Forecast Pharmaceutical Benefits and Services Expenditure: Forecast Pharmaceutical Benefits and Services Expenditure: Forecast Pharmaceutical Benefits and Services Expenditure
Source: Australian Commonwealth Budget
1. Includes expenditure on pharmaceuticals, pharmaceutical services, and targeted assistance (pharmaceuticals), but excludes expenditure on community pharmacy, pharmaceutical awareness and targeted assistance (aids and appliances).
One of the stated purposes of the PBS Reforms and Additional PBS Reforms was to reduce the cost of off-
patent drugs and create funding headroom for the listing of new and innovative drugs. Although the
Government initially estimated (before the reforms) the savings from the PBS Reforms to be around A$3
billion over 10 years, a number of subsequent estimates in 2009-10 commissioned for the Government and
other industry participants suggested the savings may be in the range of A$5.8 billion to A$7.4 billion17. A
more recent report prepared in May 2013 for Medicines Australia by Victoria University’s Centre for Strategic
Economic Studies18 (“May 2013 May 2013 May 2013 May 2013 CESC CESC CESC CESC ReportReportReportReport”) concluded that:
� Together, the PBS Reforms and Additional PBS Reforms are likely to deliver cumulative savings of
around A$17.9 billion in the period 2010-11 to 2017-18.
� Estimated savings attributable to the PBS Reforms of A$14.5 billion (2010-11 to 2017-18) are
around five times the original estimate of A$3 billion and around twice the Government’s revised
estimate of A$5.8 billion in 2010.
� Around 70% of the total estimated savings of A$14.5 billion (2010-11 to 2017-18) from the PBS
Reforms is attributable to the price disclosure regime, confirming that there is a high level of
competition between suppliers in the off-patent (F2 formulary) market, resulting in price reductions.
� In the period 2010-11 to 2017-18, around 85% of the savings from the Additional PBS Reforms will
be borne by manufacturers, with the balance split between wholesalers (6%) and pharmacists (9%).
The Government will be the overwhelming beneficiary of the reforms (94%), with consumers
benefiting around 6%.
� Overall PBS expenditure will remain constrained and the impact of any new listings on the PBS is not
likely to threaten the sustainability of the PBS.
� There has been a significant decline in the number of new innovative medicines listed on the PBS
since 2009-10, with 2011-12 having the lowest number of new medicines listed in 20 years.
The May 2013 CESC Report also modelled the level of expenditure expected on new medicines that enter
the PBS. Assuming that the PBS formulary increases by 20 medicines per year and the average cost of
each grows by 4% per year, it was estimated that the net effect of new medicines would be an additional
A$1,459 million per year in PBS expenditure by 2017-18. As set out in Figure 35 below, the modelled level
17 Medicines Australia – Centre for Strategic Economic Studies (2009), Pharmacy Guild of Australia – Illuminate Consulting (2009), and DoHA – PwC (2010). 18 “The Impact of Further PBS Reforms” (May 2013), Dr Kim Sweeny, Centre for Strategic Economic Studies, Victoria University.
$9,849m
$10,265m
$10,769m
$11,210m
$11,685m
9,500
10,000
10,500
11,000
11,500
12,000
2013 (Est. Actual) 2014 (Budget) 2015 (Forecast) 2016 (Forecast) 2017 (Forecast)
A$
mA
$m
A$
mA
$m
PPharmaceuticals and Services1
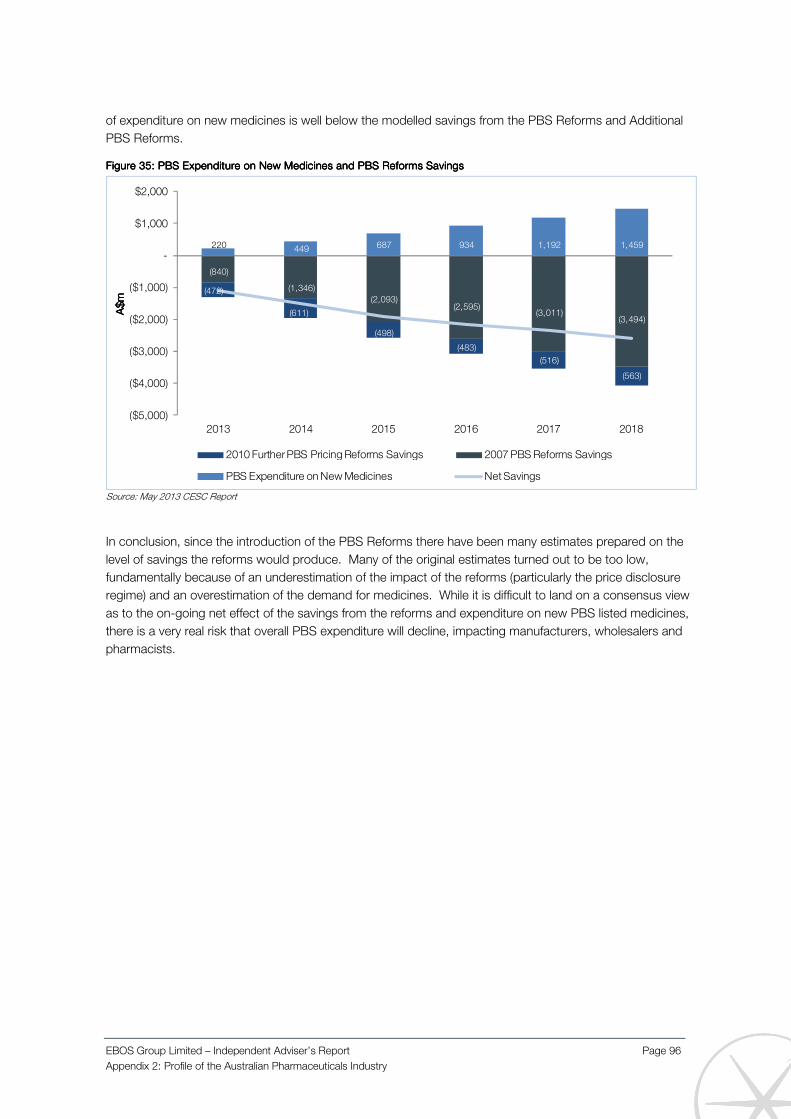
EBOS Group Limited – Independent Adviser’s Report Page 96
Appendix 2: Profile of the Australian Pharmaceuticals Industry
of expenditure on new medicines is well below the modelled savings from the PBS Reforms and Additional
PBS Reforms.
Figure Figure Figure Figure 35353535: PBS Expenditure on New : PBS Expenditure on New : PBS Expenditure on New : PBS Expenditure on New MedicinesMedicinesMedicinesMedicines and PBS Reforms Savingsand PBS Reforms Savingsand PBS Reforms Savingsand PBS Reforms Savings
Source: May 2013 CESC Report
In conclusion, since the introduction of the PBS Reforms there have been many estimates prepared on the
level of savings the reforms would produce. Many of the original estimates turned out to be too low,
fundamentally because of an underestimation of the impact of the reforms (particularly the price disclosure
regime) and an overestimation of the demand for medicines. While it is difficult to land on a consensus view
as to the on-going net effect of the savings from the reforms and expenditure on new PBS listed medicines,
there is a very real risk that overall PBS expenditure will decline, impacting manufacturers, wholesalers and
pharmacists.
220 449 687 934 1,192 1,459
(840)
(1,346)
(2,093)(2,595)
(3,011)(3,494)
(472)
(611)
(498)
(483)
(516)
(563)
($5,000)
($4,000)
($3,000)
($2,000)
($1,000)
-
$1,000
$2,000
2013 2014 2015 2016 2017 2018
A$
mA
$m
A$
mA
$m
2010 Further PBS Pricing Reforms Savings 2007 PBS Reforms Savings
PBS Expenditure on New Medicines Net Savings
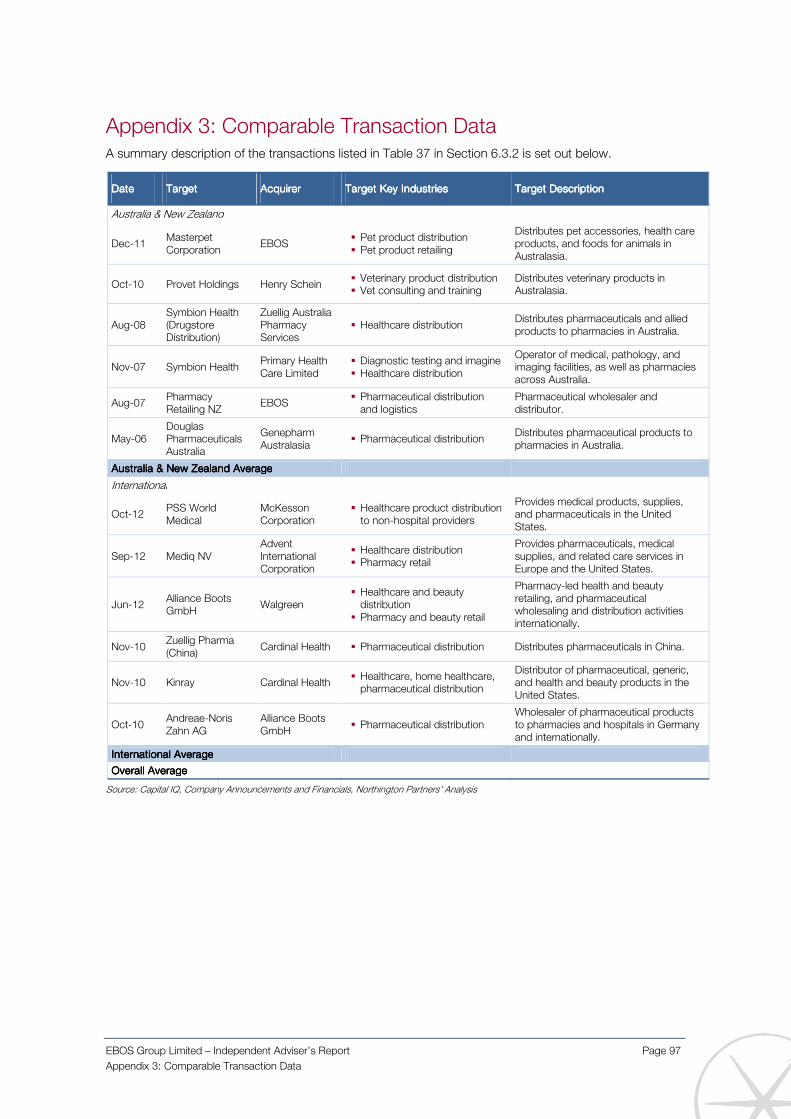
EBOS Group Limited – Independent Adviser’s Report Page 97
Appendix 3: Comparable Transaction Data
Appendix 3: Comparable Transaction Data A summary description of the transactions listed in Table 37 in Section 6.3.2 is set out below.
DateDateDateDate TargetTargetTargetTarget AcquirerAcquirerAcquirerAcquirer Target Key IndustriesTarget Key IndustriesTarget Key IndustriesTarget Key Industries TTTTarget arget arget arget DescriptionDescriptionDescriptionDescription
Australia & New Zealand
Dec-11 Masterpet Corporation
EBOS � Pet product distribution � Pet product retailing
Distributes pet accessories, health care products, and foods for animals in Australasia.
Oct-10 Provet Holdings Henry Schein � Veterinary product distribution � Vet consulting and training
Distributes veterinary products in Australasia.
Aug-08 Symbion Health (Drugstore Distribution)
Zuellig Australia Pharmacy Services
� Healthcare distribution Distributes pharmaceuticals and allied products to pharmacies in Australia.
Nov-07 Symbion Health Primary Health Care Limited
� Diagnostic testing and imagine � Healthcare distribution
Operator of medical, pathology, and imaging facilities, as well as pharmacies across Australia.
Aug-07 Pharmacy Retailing NZ
EBOS � Pharmaceutical distribution
and logistics Pharmaceutical wholesaler and distributor.
May-06 Douglas Pharmaceuticals Australia
Genepharm Australasia
� Pharmaceutical distribution Distributes pharmaceutical products to pharmacies in Australia.
Australia & New Zealand AverageAustralia & New Zealand AverageAustralia & New Zealand AverageAustralia & New Zealand Average
International
Oct-12 PSS World Medical
McKesson Corporation
� Healthcare product distribution to non-hospital providers
Provides medical products, supplies, and pharmaceuticals in the United States.
Sep-12 Mediq NV Advent International Corporation
� Healthcare distribution � Pharmacy retail
Provides pharmaceuticals, medical supplies, and related care services in Europe and the United States.
Jun-12 Alliance Boots GmbH
Walgreen � Healthcare and beauty
distribution � Pharmacy and beauty retail
Pharmacy-led health and beauty retailing, and pharmaceutical wholesaling and distribution activities internationally.
Nov-10 Zuellig Pharma (China)
Cardinal Health � Pharmaceutical distribution Distributes pharmaceuticals in China.
Nov-10 Kinray Cardinal Health � Healthcare, home healthcare,
pharmaceutical distribution
Distributor of pharmaceutical, generic, and health and beauty products in the United States.
Oct-10 Andreae-Noris Zahn AG
Alliance Boots GmbH
� Pharmaceutical distribution Wholesaler of pharmaceutical products to pharmacies and hospitals in Germany and internationally.
International AverageInternational AverageInternational AverageInternational Average
Overall AverageOverall AverageOverall AverageOverall Average
Source: Capital IQ, Company Announcements and Financials, Northington Partners' Analysis
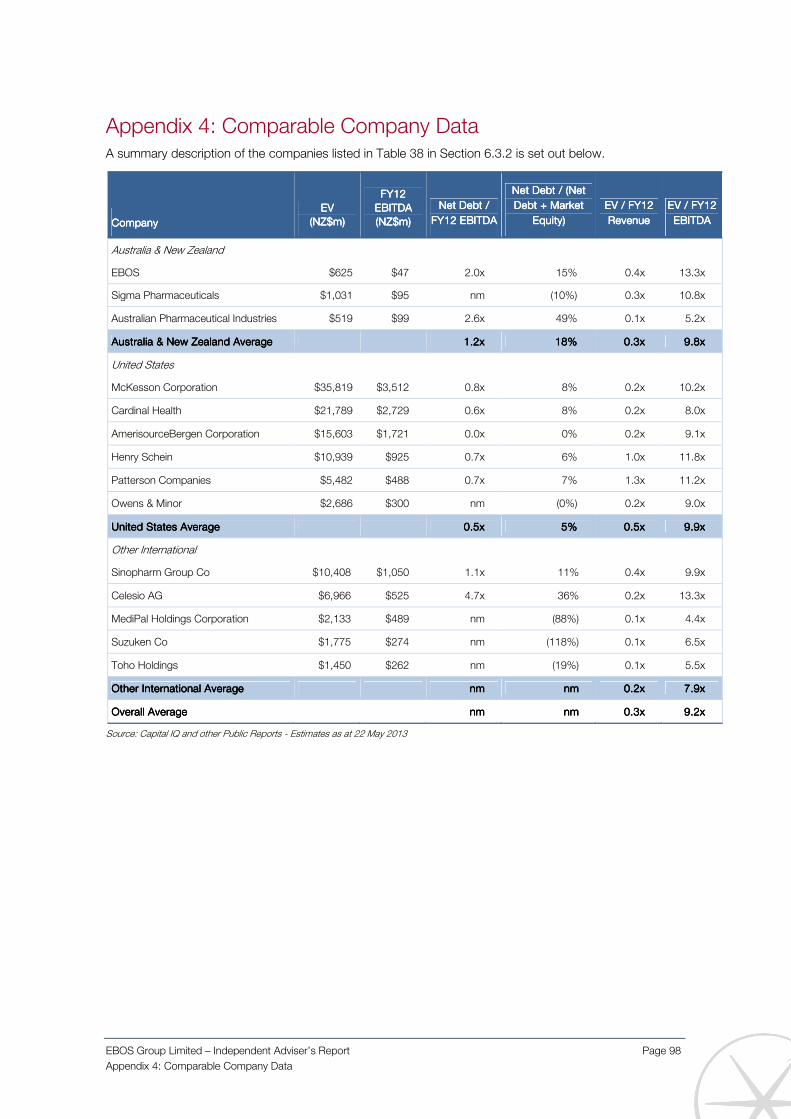
EBOS Group Limited – Independent Adviser’s Report Page 98
Appendix 4: Comparable Company Data
Appendix 4: Comparable Company Data A summary description of the companies listed in Table 38 in Section 6.3.2 is set out below.
CompanyCompanyCompanyCompany
EVEVEVEV
(NZ$m)(NZ$m)(NZ$m)(NZ$m)
FY12 FY12 FY12 FY12
EBITDAEBITDAEBITDAEBITDA
(NZ$m)(NZ$m)(NZ$m)(NZ$m)
Net Debt / Net Debt / Net Debt / Net Debt /
FY12 EBITDAFY12 EBITDAFY12 EBITDAFY12 EBITDA
Net Debt / (Net Net Debt / (Net Net Debt / (Net Net Debt / (Net
DebDebDebDebt + t + t + t + Market Market Market Market
Equity)Equity)Equity)Equity)
EV / FY12 EV / FY12 EV / FY12 EV / FY12
RevenuRevenuRevenuRevenueeee
EV / FY12 EV / FY12 EV / FY12 EV / FY12
EBITDAEBITDAEBITDAEBITDA
Australia & New Zealand
EBOS $625 $47 2.0x 15% 0.4x 13.3x
Sigma Pharmaceuticals $1,031 $95 nm (10%) 0.3x 10.8x
Australian Pharmaceutical Industries $519 $99 2.6x 49% 0.1x 5.2x
Australia & NewAustralia & NewAustralia & NewAustralia & New Zealand AverageZealand AverageZealand AverageZealand Average 1.2x1.2x1.2x1.2x 18%18%18%18% 0.3x0.3x0.3x0.3x 9.8x9.8x9.8x9.8x
United States
McKesson Corporation $35,819 $3,512 0.8x 8% 0.2x 10.2x
Cardinal Health $21,789 $2,729 0.6x 8% 0.2x 8.0x
AmerisourceBergen Corporation $15,603 $1,721 0.0x 0% 0.2x 9.1x
Henry Schein $10,939 $925 0.7x 6% 1.0x 11.8x
Patterson Companies $5,482 $488 0.7x 7% 1.3x 11.2x
Owens & Minor $2,686 $300 nm (0%) 0.2x 9.0x
United States United States United States United States AverageAverageAverageAverage 0.5x0.5x0.5x0.5x 5%5%5%5% 0.5x0.5x0.5x0.5x 9.9x9.9x9.9x9.9x
Other International
Sinopharm Group Co $10,408 $1,050 1.1x 11% 0.4x 9.9x
Celesio AG $6,966 $525 4.7x 36% 0.2x 13.3x
MediPal Holdings Corporation $2,133 $489 nm (88%) 0.1x 4.4x
Suzuken Co $1,775 $274 nm (118%) 0.1x 6.5x
Toho Holdings $1,450 $262 nm (19%) 0.1x 5.5x
Other International Other International Other International Other International AverageAverageAverageAverage nmnmnmnm nmnmnmnm 0.2x0.2x0.2x0.2x 7.9x7.9x7.9x7.9x
Overall AverageOverall AverageOverall AverageOverall Average nmnmnmnm nnnnmmmm 0.3x0.3x0.3x0.3x 9.2x9.2x9.2x9.2x
Source: Capital IQ and other Public Reports - Estimates as at 22 May 2013
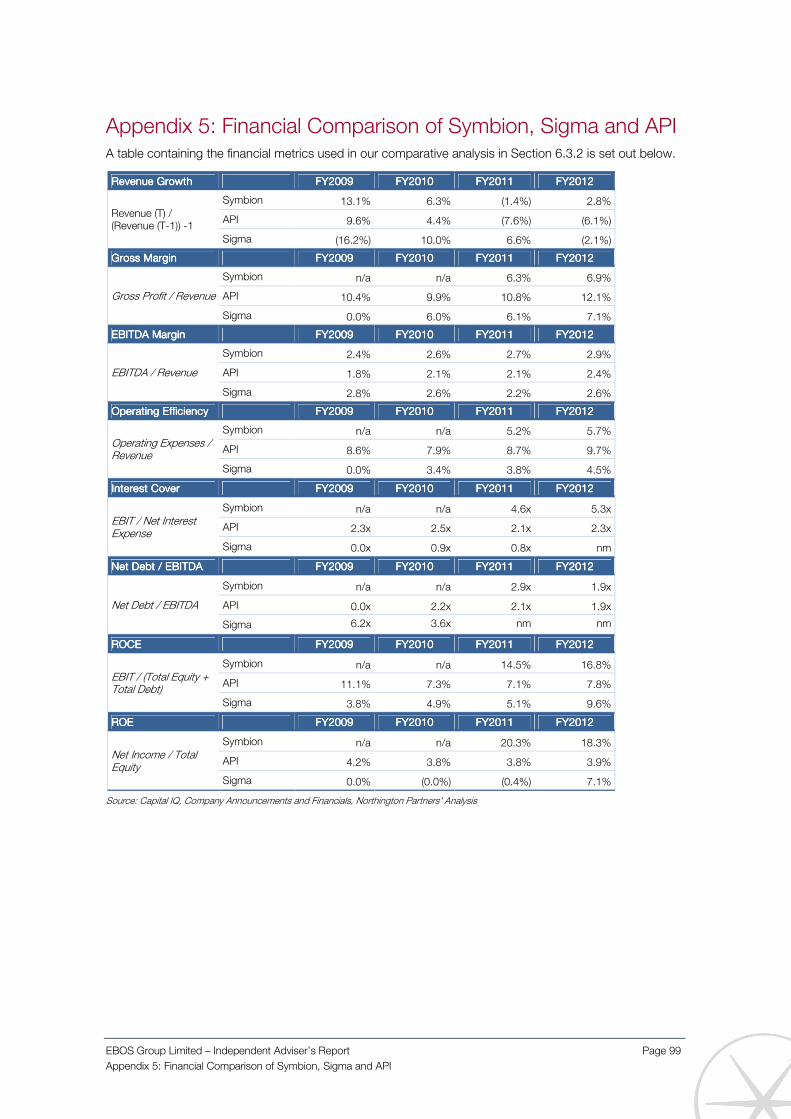
EBOS Group Limited – Independent Adviser’s Report Page 99
Appendix 5: Financial Comparison of Symbion, Sigma and API
Appendix 5: Financial Comparison of Symbion, Sigma and API A table containing the financial metrics used in our comparative analysis in Section 6.3.2 is set out below.
Revenue GrowthRevenue GrowthRevenue GrowthRevenue Growth FY20FY20FY20FY2009090909 FYFYFYFY2010201020102010 FYFYFYFY2011201120112011 FYFYFYFY2012201220122012
Revenue (T) / (Revenue (T-1)) -1
Symbion 13.1% 6.3% (1.4%) 2.8%
API 9.6% 4.4% (7.6%) (6.1%)
Sigma (16.2%) 10.0% 6.6% (2.1%)
Gross MarginGross MarginGross MarginGross Margin FY2009FY2009FY2009FY2009 FY2010FY2010FY2010FY2010 FY2011FY2011FY2011FY2011 FY2012FY2012FY2012FY2012
Gross Profit / Revenue
Symbion n/a n/a 6.3% 6.9%
API 10.4% 9.9% 10.8% 12.1%
Sigma 0.0% 6.0% 6.1% 7.1%
EBITDA MarginEBITDA MarginEBITDA MarginEBITDA Margin FY2009FY2009FY2009FY2009 FY2010FY2010FY2010FY2010 FY2011FY2011FY2011FY2011 FY2012FY2012FY2012FY2012
EBITDA / Revenue
Symbion 2.4% 2.6% 2.7% 2.9%
API 1.8% 2.1% 2.1% 2.4%
Sigma 2.8% 2.6% 2.2% 2.6%
Operating EfficiencyOperating EfficiencyOperating EfficiencyOperating Efficiency FY2009FY2009FY2009FY2009 FY2010FY2010FY2010FY2010 FY2011FY2011FY2011FY2011 FY2012FY2012FY2012FY2012
Operating Expenses / Revenue
Symbion n/a n/a 5.2% 5.7%
API 8.6% 7.9% 8.7% 9.7%
Sigma 0.0% 3.4% 3.8% 4.5%
Interest CoverInterest CoverInterest CoverInterest Cover FY2009FY2009FY2009FY2009 FY2010FY2010FY2010FY2010 FY2011FY2011FY2011FY2011 FY2012FY2012FY2012FY2012
EBIT / Net Interest Expense
Symbion n/a n/a 4.6x 5.3x
API 2.3x 2.5x 2.1x 2.3x
Sigma 0.0x 0.9x 0.8x nm
Net Debt / EBITDANet Debt / EBITDANet Debt / EBITDANet Debt / EBITDA FY2009FY2009FY2009FY2009 FY2010FY2010FY2010FY2010 FY2011FY2011FY2011FY2011 FY2012FY2012FY2012FY2012
Net Debt / EBITDA
Symbion n/a n/a 2.9x 1.9x
API 0.0x 2.2x 2.1x 1.9x
Sigma 6.2x 3.6x nm nm
ROCEROCEROCEROCE FY2009FY2009FY2009FY2009 FY2010FY2010FY2010FY2010 FY2011FY2011FY2011FY2011 FY2012FY2012FY2012FY2012
EBIT / (Total Equity + Total Debt)
Symbion n/a n/a 14.5% 16.8%
API 11.1% 7.3% 7.1% 7.8%
Sigma 3.8% 4.9% 5.1% 9.6%
ROEROEROEROE FY2009FY2009FY2009FY2009 FY2010FY2010FY2010FY2010 FY2011FY2011FY2011FY2011 FY2012FY2012FY2012FY2012
Net Income / Total Equity
Symbion n/a n/a 20.3% 18.3%
API 4.2% 3.8% 3.8% 3.9%
Sigma 0.0% (0.0%) (0.4%) 7.1%
Source: Capital IQ, Company Announcements and Financials, Northington Partners' Analysis

EBOS Group Limited – Independent Adviser’s Report Page 100
Appendix 6: Market Evidence for Rights Issues
Appendix 6: Market Evidence for Rights Issues A table outlining the evidence referred to in Section 7.4.3 is set out below.
DateDateDateDate IssuerIssuerIssuerIssuer
OfferedOfferedOfferedOffered
((((NZNZNZNZ$m)$m)$m)$m)
Offer PriceOffer PriceOffer PriceOffer Price
((((NZNZNZNZ$)$)$)$) Discount to TERPDiscount to TERPDiscount to TERPDiscount to TERP
2012 Rubicon $21 $0.22 34.3%
2011 Goodman Fielder $338 $0.59 27.0%
2011 Pacific Edge $16 $0.19 21.8%
2011 Scott Technology $10 $1.20 18.6%
2011 Contact Energy $331 $5.05 12.0%
2010 Wellington Drive Technologies $8 $0.01 66.9%
2010 Mercer Group $9 $0.05 41.7%
2010 Hellaby Holdings $28 $1.30 21.5%
2010 Dorchester Pacific $10 $0.10 22.1%
2010 Pike River Coal $40 $0.88 22.4%
2010 NZ Windfarms $31 $0.15 34.2%
2010 Rubicon $21 $0.60 39.2%
2010 Auckland International Airport $126 $1.65 14.7%
2009 PGG Wrightson $181 $0.45 21.5%
2009 Pyne Gould Corporation $237 $0.40 20.7%
2009 Skellerup Holdings $22 $0.40 21.3%
2009 Tower $81 $1.34 19.5%
2009 Fisher & Paykel Appliances $143 $0.41 27.4%
2009 NZX $21 $4.00 38.6%
2009 AMP NZ Office Trust $201 $0.65 16.2%
2009 Allied Farmers $8 $0.40 25.2%
2009 Nuplex Industries $133 $0.23 13.2%
2009 Pike River Coal $41 $0.70 15.1%
2009 Metlifecare $38 $1.08 49.3%
AverageAverageAverageAverage 22226666....8888%%%%
Source: Capital IQ, Company Announcements and Financials, Northington Partners' Analysis

EBOS Group Limited – Independent Adviser’s Report Page 101
Appendix 7: Sources of Information Used in This Report
Appendix 7: Sources of Information Used in This Report Other than the information sources referenced directly in the body of the report, this assessment is also
reliant on the following sources of information:
� Annual reports for EBOS for 2010, 2011 and 2012
� Audited financial statements for EBOS for the period FY2010 to FY2012, and unaudited financial
statements for the six month period ending 31 December 2012
� Audited financial statements for ZHHA for the period FY2010 to FY2012
� Presentations prepared by EBOS and Symbion management in respect of the operations and
prospects for their respective businesses
� Draft Notice of Special Meeting of shareholders and explanatory memorandum (relating to the
proposed acquisition of Symbion and the issue of shares in EBOS)
� Discussions and correspondence with senior management of EBOS
� Various correspondence with senior management of Symbion
� Due diligence reports on Symbion’s business prepared by Chapman Tripp (legal review), Ernst &
Young (tax review), Deloitte (financial information review), and LEK Consulting (pharmaceutical market
review)
� Financial models prepared by UBS New Zealand Limited
� An investor presentation prepared for the benefit of institutions considering participating in the Pre-
Transaction Placement
� The websites of EBOS and Symbion
� The websites of various governmental and industry bodies involved in the Australian healthcare
sector (including statistics or reports included on those websites)
� Various other documents that we considered necessary for the purposes of our analysis
EBOS Group Limited – Independent Adviser’s Report Page 102
Appendix 8: Declarations, Qualifications and Consents
Appendix 8: Declarations, Qualifications and Consents
Declarations
This report is dated 27 May 2013 and has been prepared by Northington Partners at the request of the
independent directors of EBOS to fulfil the reporting requirements pursuant to Rule 18 of the Takeovers
Code and Rule 6.2.2 of the NZSX Listing Rules. This report, or any part of it, should not be reproduced or
used for any other purpose. Northington Partners specifically disclaims any obligation or liability to any party
whatsoever in the event that this report is supplied or applied for any purpose other than that for which it is
intended.
Prior drafts of this report were provided to EBOS, Symbion and their respective advisers for review and
discussion. Although minor factual changes to the report were made after the release of the first draft, there
were no changes to our methodology, analysis, or conclusions.
This report is provided for the benefit of all of the shareholders of EBOS (other than Zuellig or any entity
associated with Zuellig), and Northington Partners consents to the distribution of this report to those people.
The engagement terms did not contain any term which materially restricted the scope of our work.
Qualifications
Northington Partners provides an independent corporate advisory service to companies operating
throughout New Zealand. The company specialises in mergers and acquisitions, capital raising support,
expert opinions, financial instrument valuations, and business and share valuations. Northington Partners is
retained by a mix of publicly listed companies, substantial privately held companies, and state owned
enterprises.
The individuals responsible for preparing this report are Greg Anderson B.Com, M.Com (Hons), Ph.D, Steven
Grant B.Com, LLB (Hons) and Mark Cahill BSC, M.Com. Each individual has a wealth of experience in
providing independent advice to clients relating to the value of business assets and equity instruments, as
well as the choice of appropriate financial structures and governance issues.
Northington Partners has been responsible for the preparation of numerous Independent Reports in relation
to takeovers, mergers, and a range of other transactions subject to the Takeovers Code and NZSX Listing
Rules.
Independence
Northington Partners has not been previously engaged on any matter by EBOS or (to the best of our
knowledge) by any other party to the proposed transaction that could affect our independence. None of the
Directors or employees of Northington Partners have any other relationship with any of the Directors or
substantial security holders of the parties involved in the proposed Transaction.
The preparation of this independent report will be Northington Partners’ only involvement in relation to the
Transaction. Northington Partners will be paid a fixed fee for its services which is in no way contingent on
the outcome of our analysis or the content of our report.
Northington Partners does not have any conflict of interest that could affect its ability to provide an unbiased
report.
EBOS Group Limited – Independent Adviser’s Report Page 103
Appendix 8: Declarations, Qualifications and Consents
Disclaimer and Restrictions on the Scope of Our Work
In preparing this report, Northington Partners has relied on information provided by EBOS, Symbion and their
respective advisers. Northington Partners has not performed anything in the nature of an audit of that
information, and does not express any opinion on the reliability, accuracy, or completeness of the information
provided to us and upon which we have relied.
Northington Partners has used the provided information on the basis that it is true and accurate in material
respects and not misleading by reason of omission or otherwise. Accordingly, neither Northington Partners
nor its Directors, employees or agents, accept any responsibility or liability for any such information being
inaccurate, incomplete, unreliable or not soundly based or for any errors in the analysis, statements and
opinions provided in this report resulting directly or indirectly from any such circumstances or from any
assumptions upon which this report is based proving unjustified.
We reserve the right, but will be under no obligation, to review or amend our report if any additional
information which was in existence on the date of this report was not brought to our attention, or
subsequently comes to light.
Indemnity
EBOS has agreed to indemnify Northington Partners (to the maximum extent permitted by law) for all claims,
proceedings, damages, losses (including consequential losses), fines, penalties, costs, charges and
expenses (including legal fees and disbursements) suffered or incurred by Northington Partners in relation to
the preparation of this report, except to the extent resulting from any act or omission of Northington Partners
finally determined by a New Zealand Court of competent jurisdiction to constitute negligence or bad faith by
Northington Partners.
EBOS has also agreed to promptly fund Northington Partners for its reasonable costs and expenses
(including legal fees and expenses) in dealing with such claims or proceedings upon presentation by
Northington Partners of the relevant invoices.

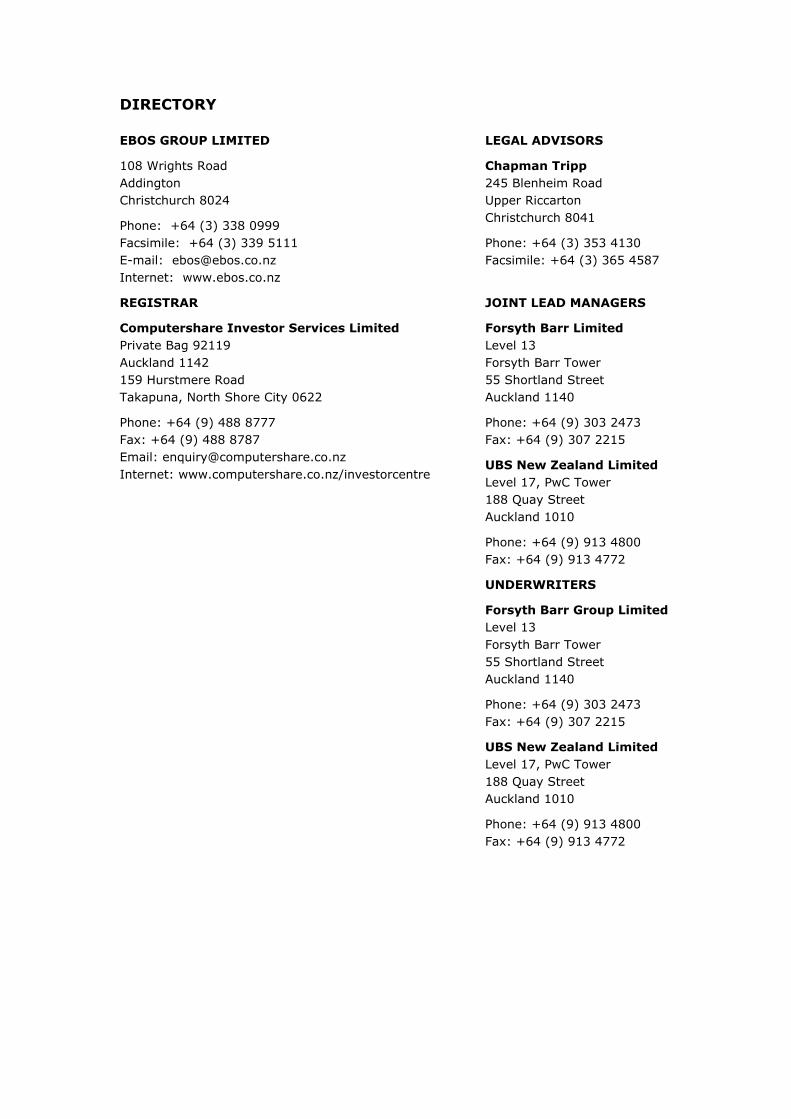
DIRECTORY
EBOS GROUP LIMITED
108 Wrights Road Addington Christchurch 8024
Phone: +64 (3) 338 0999 Facsimile: +64 (3) 339 5111 E-mail: [email protected] Internet: www.ebos.co.nz
LEGAL ADVISORS
Chapman Tripp 245 Blenheim Road Upper Riccarton Christchurch 8041
Phone: +64 (3) 353 4130 Facsimile: +64 (3) 365 4587
REGISTRAR
Computershare Investor Services Limited Private Bag 92119 Auckland 1142 159 Hurstmere Road Takapuna, North Shore City 0622
Phone: +64 (9) 488 8777 Fax: +64 (9) 488 8787 Email: [email protected] Internet: www.computershare.co.nz/investorcentre
JOINT LEAD MANAGERS
Forsyth Barr Limited Level 13 Forsyth Barr Tower 55 Shortland Street Auckland 1140
Phone: +64 (9) 303 2473 Fax: +64 (9) 307 2215
UBS New Zealand Limited Level 17, PwC Tower 188 Quay Street Auckland 1010
Phone: +64 (9) 913 4800 Fax: +64 (9) 913 4772
UNDERWRITERS
Forsyth Barr Group Limited Level 13 Forsyth Barr Tower 55 Shortland Street Auckland 1140
Phone: +64 (9) 303 2473 Fax: +64 (9) 307 2215
UBS New Zealand Limited Level 17, PwC Tower 188 Quay Street Auckland 1010
Phone: +64 (9) 913 4800 Fax: +64 (9) 913 4772
