“eat your greens!” - home | arizona prevention … county...2 project background on august 20,...
TRANSCRIPT
“EAT YOUR GREENS!”
Evaluation Report
Results of a Healthy
Vending Initiative in
Pima County,
Arizona through the
Communities
Putting Prevention
to Work Initiative
Prepared by the CPPW
Evaluation Team
University of Arizona
College of Public
Health
&
Pima County Health
Department
2012

1
Table of Contents
Project Background .................................................................................................................... 2
Best Practices ............................................................................................................................ 2
Education ............................................................................................................................... 2
Stakeholder Buy-In ................................................................................................................. 2
Targeting ................................................................................................................................ 3
Pricing .................................................................................................................................... 3
Guiding Healthier Choices ...................................................................................................... 3
Project Description ..................................................................................................................... 5
Dietary Guidelines .................................................................................................................. 5
Guiding Choices ..................................................................................................................... 6
Contractor Buy-in ................................................................................................................... 7
Targeting ................................................................................................................................ 7
Education ............................................................................................................................... 7
Monitoring .............................................................................................................................. 8
Evaluation Methodology ............................................................................................................. 9
Evaluation Results ....................................................................................................................10
Baseline Assessment ...........................................................................................................10
Post Intervention Results .....................................................................................................11
Employee Interest Post Survey ............................................................................................12
“Eat Your Greens!” (EYG) Evaluation Results .......................................................................16
Sustainability of Efforts ..........................................................................................................17
Conclusion ................................................................................................................................18
References ...............................................................................................................................18
2
Project Background
On August 20, 2010, Pima County Communities Putting Prevention to Work (CPPW) Policy
Staff were directed by the Pima County Administrator to review the contents of all vending
machines on County property and to provide policy recommendations designed to reduce
unhealthy food options that could lead to increased risks for diabetes or obesity. Additionally, it
was requested that an action plan be developed to implement a policy change that would
provide an environment supporting healthy behavior.
In order to provide an in-depth understanding of the various nutritional standards and vending
machine policies that are currently in place in the country, research was conducted by CPPW
Policy Staff to compare findings and identify best practices. Federal requirements for nutrition
exist as a foundation upon which state departments of education develop their own policies for
school nutrition. These requirements are outlined by the National School Lunch Program
(NSLP) and apply solely to children in school. These guidelines, however, have served as a
sufficient foundation for county and city jurisdictions to develop their own standards with respect
to workplace wellness and vending machine policies. In essence, the standards that are laid out
by the states and county/city jurisdictions were often much more strict in their requirements for
healthy foods and beverages than those identified by the federal government.
Best Practices
In researching various jurisdictions with vending machine policies, a series of “lessons learned”
brought to light various practices and key observations that were needed in order to keep
policies viable, effective and sustainable. The following serves to provide some information with
respect to the educational efforts made to promote the vending machine polices, the efforts that
were made to involve key stakeholders, the targeting of nutritional content, and practices that
were implemented to help guide the choices of individuals using the vending machines.
Education
Education served as a vital component for the implementation of any successful vending
machine policy and proved to remain an on-going task for various jurisdictions. It proved
advantageous to have promotional and educational materials printed prior to the implementation
of the program. It was equally important to allow adequate time to fully inform and educate staff
and the public about the new program and its benefits.1 It was key that the nutritional standards
and the reasons for their adoptions were explained in a manner that the public could
understand.2
Stakeholder Buy-In
Effective communication with vendors and customers was crucial for successfully implementing
a healthy vending policy. To accomplish this, outreach and education to vendors and customers
was effective in illustrating the value of making healthier choices. It should be noted that
vendors in certain jurisdictions did not understand why they were restricted to a list of approved
foods that was less expansive than the range of merchandise they had previously sold.
However, through effective education and outreach, vendors became promoters of healthier
3
options. In the case of one county, the vendor now regards the program as beneficial and is
promoting healthier options with other customers.3 Some methods that were used to adequately
engage customers were surveys and taste tests.4 This approach served the dual purpose of
educating customers on healthier vending and providing feedback on the selection of healthy
options. It was also advantageous to include staff at each worksite in product selection,
implementation, monitoring, and evaluation of the program as it assisted with buy-in and support
from the employees.
Targeting
Across jurisdictions different approaches were taken to providing healthier options that complied
with the nutritional guidelines mandated by the states and various review committees. Los
Angeles County, for instance, took a phasing-in approach in which in the first year, 25 percent of
all foods and beverages in County-contracted vending machines placed within County facilities
and offices were required to follow nutritional guidelines. Two years later, this amount was
increased to 33 percent and by 2011 Los Angeles County targeted 50 percent of all foods and
beverages in County-contracted vending machines within County facilities.5 Santa Clara County
took a similar approach in which the first year, the policy required that 25 percent of the items in
vending machines needed to be healthy options with that percentage increasing in subsequent
years.6 San Diego County however took a different approach and made the decision to include
different standards for snacks and beverages. Through their plan, 100 percent of food and
beverages sold in facilities most often used by children and youth had to immediately meet the
nutritional standards set forth by their policy, while 50 percent of food and beverages sold in
facilities most often used by adults needed to meet the nutritional standards of the policy. This
approach helped gain acceptance for the policy in San Diego County for both the workforce and
public.71
Pricing
Research indicated that if policies were implemented that encouraged the sale of healthier food
and beverage items at a price point equal or below the unhealthy items, the healthy items sold
at an increased rate. In a study conducted by the University of Minnesota School of Public
Health, the prices of low-fat vending machine items were reduced by 50 percent. This led to an
increase in purchases of the low-fat items from 80 percent to 93 percent.8,9 Thus creating pricing
strategies that make healthier food items more economically attractive to individuals can be an
effective strategy to direct individuals to make healthier choices.
Guiding Healthier Choices
Understanding that education about healthy snacks serves as a major factor in impacting and
reducing the poor choices of employees and the public, various unique and innovative programs
have been developed to provide more informed decisions when purchasing snacks or
beverages from vending machines.
4
New York City instituted a policy that included calorie labeling for their vending machines.
Every machine must display the total calorie content for each item clearly, conspicuously and
adjacent or in close proximity to the item being sold. It is also stipulated that a font and format
must be used that is prominent in size and appearance as that which is used to post either the
name or price of the beverage where it can be seen before the consumer presses the button to
make a selection. The city has sole discretion regarding the display of calorie information.10
Utilizing guidelines based on California’s Senate Bill 12 (SB12), Marin County worked to
develop a protocol for educating both vendors and consumers about the new guidelines. The
educational tool known as “Better for You” consists of a simple three-step color coding system.
According to the system, Green signifies “Go for it!” meaning that the product meets all the
guidelines of SB12. Orange signifies “Caution!” or that the products meet only part of guidelines
and finally, Red signifies “Stop!” or that those purchasing the product may want to provide
further consideration prior to their purchase.11
The Public Health Department of the Contra Costa County designed a star system to assist
patrons in choosing foods that met the healthy criteria established by their policy. Posters with a
green star logo describe the benefits of healthy choices and are placed next to vending
machines. Green star stickers are placed next to the healthy items inside the vending machines
to indicate healthy options.12
5
Project Description
CPPW Policy Staff made the following recommendations based to Pima County administration
as a stable foundation for Pima County’s vending machine policy pilot effort.
The policy is all inclusive and covers a range of topics including, dietary guidelines, stakeholder
buy-in, educational component that should be pursued for Pima County staff and the public, as
well as the targeting and pricing of healthy products in County vending machines. Finally it
emphasizes the effort that should be made to guide the vending machine choices of Pima
County employees and the general public as well as ensuring compliance through routine
monitoring.
In an effort to ensure policy and program sustainability, it was recommended that a pilot study
be conducted in the Herbert K. Abrams Public Health Center (Abrams Building) as it is home to
many HMI vending machines and the Pima County Health Department. The Abrams Building
was a perfect building to conduct a pilot study due to the number of vending machines as well
as the diversity of individuals who use the building. The goal of the pilot study was to identify
program challenges, concerns, and opportunities prior to county-wide implementation. The pilot
study included the use of preexisting machines, marketing and educational materials, and
consumer follow-up. The pilot was conducted for a period of 3 months between September
2011 and December 2011.
Dietary Guidelines
Based upon jurisdictional research, the following dietary guidelines for foods and beverages that
are placed in vending machines were recommended. These guidelines were developed by
analyzing and assessing the standards that were developed by other jurisdictions and
determining those that best fit Pima County to accomplish our policy goals.
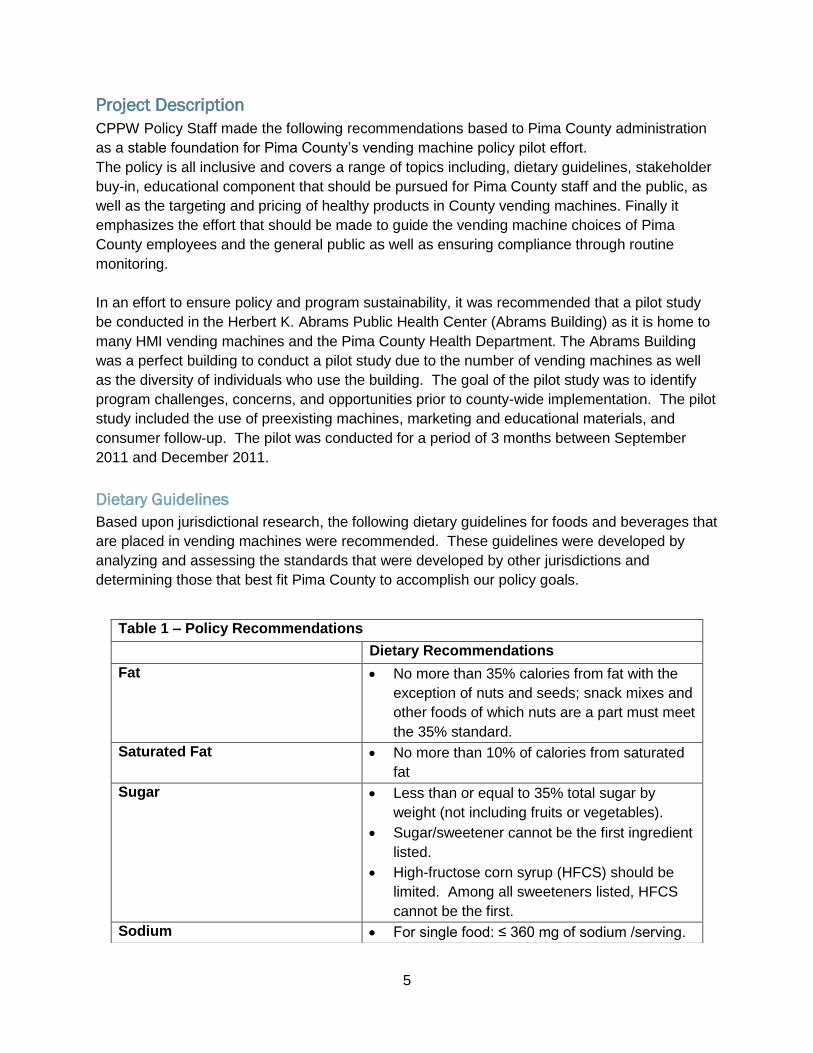
Table 1 – Policy Recommendations
Dietary Recommendations
Fat No more than 35% calories from fat with the
exception of nuts and seeds; snack mixes and
other foods of which nuts are a part must meet
the 35% standard.
Saturated Fat No more than 10% of calories from saturated
fat
Sugar Less than or equal to 35% total sugar by
weight (not including fruits or vegetables).
Sugar/sweetener cannot be the first ingredient
listed.
High-fructose corn syrup (HFCS) should be
limited. Among all sweeteners listed, HFCS
cannot be the first.
Sodium For single food: ≤ 360 mg of sodium /serving.
6
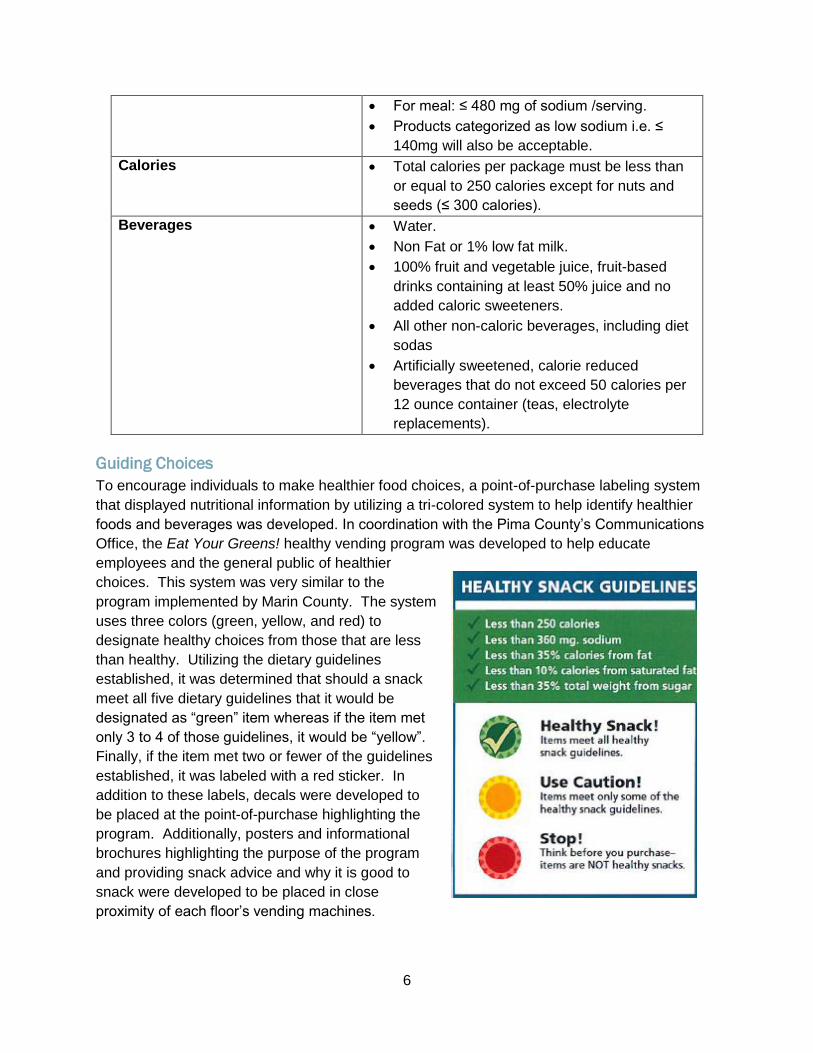
Guiding Choices
To encourage individuals to make healthier food choices, a point-of-purchase labeling system
that displayed nutritional information by utilizing a tri-colored system to help identify healthier
foods and beverages was developed. In coordination with the Pima County’s Communications
Office, the Eat Your Greens! healthy vending program was developed to help educate
employees and the general public of healthier
choices. This system was very similar to the
program implemented by Marin County. The system
uses three colors (green, yellow, and red) to
designate healthy choices from those that are less
than healthy. Utilizing the dietary guidelines
established, it was determined that should a snack
meet all five dietary guidelines that it would be
designated as “green” item whereas if the item met
only 3 to 4 of those guidelines, it would be “yellow”.
Finally, if the item met two or fewer of the guidelines
established, it was labeled with a red sticker. In
addition to these labels, decals were developed to
be placed at the point-of-purchase highlighting the
program. Additionally, posters and informational
brochures highlighting the purpose of the program
and providing snack advice and why it is good to
snack were developed to be placed in close
proximity of each floor’s vending machines.
For meal: ≤ 480 mg of sodium /serving.
Products categorized as low sodium i.e. ≤
140mg will also be acceptable.
Calories Total calories per package must be less than
or equal to 250 calories except for nuts and
seeds (≤ 300 calories).
Beverages Water.
Non Fat or 1% low fat milk.
100% fruit and vegetable juice, fruit-based
drinks containing at least 50% juice and no
added caloric sweeteners.
All other non-caloric beverages, including diet
sodas
Artificially sweetened, calorie reduced
beverages that do not exceed 50 calories per
12 ounce container (teas, electrolyte
replacements).
7
Contractor Buy-in
During the initial planning stages of the pilot program, it proved critical for County management
to work with the Business Enterprise Program (B.E.P.) and HMI Vending (HMI) in an effort to
discuss strategies to mitigate any negative effects that moving to more healthy vending options
might have for the operator. Understanding that 25 percent of the gross profits received from
vending sales went to assist the County’s contracted visually-impaired operator, an effort was
made to closely review preliminary sales data to ensure that top-selling items would not be
removed from the vending machine, but instead be reduced in quantity thereby providing space
for healthier snacks. With the support of both B.E.P. and HMI, a comprehensive targeting plan
was developed from this concept.
Additionally, Pima County Health Department’s CPPW Division worked directly with HMI to
develop a list of possible healthy snacks that could be sold in vending machines based on the
developed dietary guidelines developed. This effort that was made to not only increase the
variety of healthy options available to County employees and the general public, but to also
boost contractor buy-in. By working with HMI to develop a list of new snacks it was assured that
sales could remain steady or increase if the proper steps were taken to promote the new snacks
and an opportunity was given to employees to sample the new items through a taste-testing
event. This effort helped to quell fears of plunging sales with the introduction of healthy items.
Targeting
Utilizing the Eat Your Greens! healthy vending program, the Communities Putting Prevention to
Work division worked with HMI to require that all of the Abrams Building vending machines
contain 50 percent Green items, while 25 percent would consist of the highest selling Yellow
items and the remaining 25 percent would consist of the highest selling Red items. This method
of targeting was proposed as a way to provide healthier options in a manner that was beneficial
to County employees, the general public, and the contracted vendor.
Education
The County took a proactive approach in providing educational information centered on the
benefits of making healthier food choices. This process was achieved through a variety of
methods including printed educational brochures, posters, vending machine decal signage,
newsletters, and a taste-testing event. In the week prior to the start of the pilot, brochures and
posters were displayed in close proximity to the vending machines at the Abrams Building
highlighting the program. Additionally, HMI staff placed decals near the pricing of each item in
the vending machines to designate healthy snacks from unhealthy ones and placed decals
highlighting the program at the point-of-purchase for each machine. This effort helped to
develop a sense of awareness around healthy snacking the week prior to pilot kick-off. To
increase this awareness, a special taste-testing event was held the week that followed so that
County employees could sample healthy vending snacks that were already available to them in
the building’s vending machines as well as snacks that could be made available. A simple
feedback survey was provided so that the employees could rate each item and their likelihood of
purchase. The sampling and feedback helped to foster a sense of buy-in for the healthy
vending program from the employees and also helped to promote items that they otherwise may
8
have never tried on their own. Finally, in an effort to help promote awareness of the healthy
options available in the vending machines as well as education about the importance of healthy
snacking, a newsletter was developed and distributed to Abrams Building’s employees via the
Pima County Health Department’s listserv. It was identified through the pilot that educational
efforts needed to be ongoing in order to effectively inform individuals of healthy eating habits
and the value of making better choices.
Monitoring
During the pilot, Pima County Health Department’s CPPW Division worked with HMI to ensure
that snacks that were placed in the vending machine complied with the Eat Your Greens! tri-
colored healthy vending program. This helped to guarantee that snacks were not mislabeled
after the vending spindles were restocked which could result in an individual purchasing an item
with the incorrect color designation. Consistent and periodic monitoring was critical to make
certain that the provisions of the policy were put into practice and to guarantee that healthy
foods are being sold as initially agreed upon. This quality assurance process helped to
guarantee that HMI accurately designated products in accordance with the guidelines set forth
by pilot and that they ensured that the machines were adequately stocked.
9
Evaluation Methodology
The vending machine pilot was carefully evaluated in order to ascertain the feasibility of the
vending policy change with in the Pima County environment. Data collection activities include
the following.
1. NEMS-V: The online assessment tool known as the Nutrition Environment Measures Survey
for Vending (NEMS-V) was used to inventory and categorize items at the Abrams Building
two months prior to the implementation of the vending pilot. This tool provided a “snap shot”
of items being offered in vending machines prior to the inception of the pilot program.
2. Employee Interest Survey: The 16-question employee interest survey was disseminated to
employees working in the Abrams Building prior to the start of the intervention project to
determine vending machine preferences and practices both before and after the pilot. The
same survey was disseminated again as a post assessment to employees six months after
the intervention project was implemented. The survey was advertised to Pima County staff
in the Abrams Building through administrative emails and the survey was circulated online
through SurveyMonkey®. At baseline, 242 Pima County employees completed the survey
and 159 employees completed the post survey. For reasons of confidentiality, the
evaluation team did not match the pre and post survey but rather used the survey to take a
snapshot of current vending practices. The survey assessed respondents’ snack purchasing
behaviors and their attitudes around healthier vending options if they were to become
available. At post survey, additional questions about the “Eat Your Greens!” intervention
were added specifically related to the policy being implemented.
3. Vending Sales Data Analysis: In order to assess changes in purchasing practices among
employees and Abrams visitors, Pima County collected purchasing data. Third-party
vendors HMI contracted to stock the vending machines in the Abrams Building provided
data from the vending machine sales for a 4-month period prior to the intervention and again
for the 4-month period of the pilot intervention. To help facilitate this process, HMI ensured
that the vending machines on each floor mirrored one another with respect to the snacking
options available. HMI then provided logging sheets that tallied the number of items sold
per vending machine during each week of restocking. An analysis of vending sales was
completed to determine whether healthier snack options will sell more than less healthful
items.
10
Evaluation Results
Baseline Assessment
NEMS-V
Baseline evaluation data indicate the need for a policy intervention in the Abrams Building
focusing on healthy snack alternative. According to the NEMS-V, prior to the intervention 22%
of vending items met the Green standard and 30% of vending items met the Yellow standard.
Half of the items (48%) were classified as being Red. It is worth noting that at the time of the
NEMS-V, some changes in the vending machine selection toward healthy options had already
been initiated by the vendor.
Employee Interest PreSurvey
The Employee Interest Survey was disseminated at two distinct times both prior to and 6
months after the initiation of the pilot intervention. The pre survey consisted of 16 questions
while the post survey consisted of 21 questions. The majority of survey respondents were
females between the age ranges of 50-59 years.
The Employee Interest PreSurvey found that vending machines were used on a regular basis by
23% of the employees (one or two times a week). The most popular vending machine items
were chips, water and candy. On average, taste, freshness, and the price of the snack were
factors considered most important by employees when making a vending purchase. Factors
such as the number of calories or the amount of fat in a snack were rated 6th and 7th in
importance, on average. Nearly half (41%) of employees found it easy/very easy to distinguish
the healthy snacks in the vending machines, while 16% found it difficult/very difficult.
Employees overall expressed support for healthy options in the vending machines (65%), and
68% were willing to pay more for a healthy snack.
As a baseline measure of the efforts of Pima County Administration in supporting accessibility of
healthy snacks, 60% of employees answering the pre survey were aware of the healthy items
available in the vending machines and 66% agree/strongly agree that their organization valued
their health.
11
Post Intervention Results
Vending Sales
Baseline Vending Sales: June 17th – September 14th, 2011**
**Missing sales dates: June 25th – July 5
th, 2011; August 6
th – September 1
st, 2011
Post-Pilot Intervention Dates: September 15th, 2011 – December 30th, 2011*
*Missing sales dates: December 6th – December 21
st, 2011
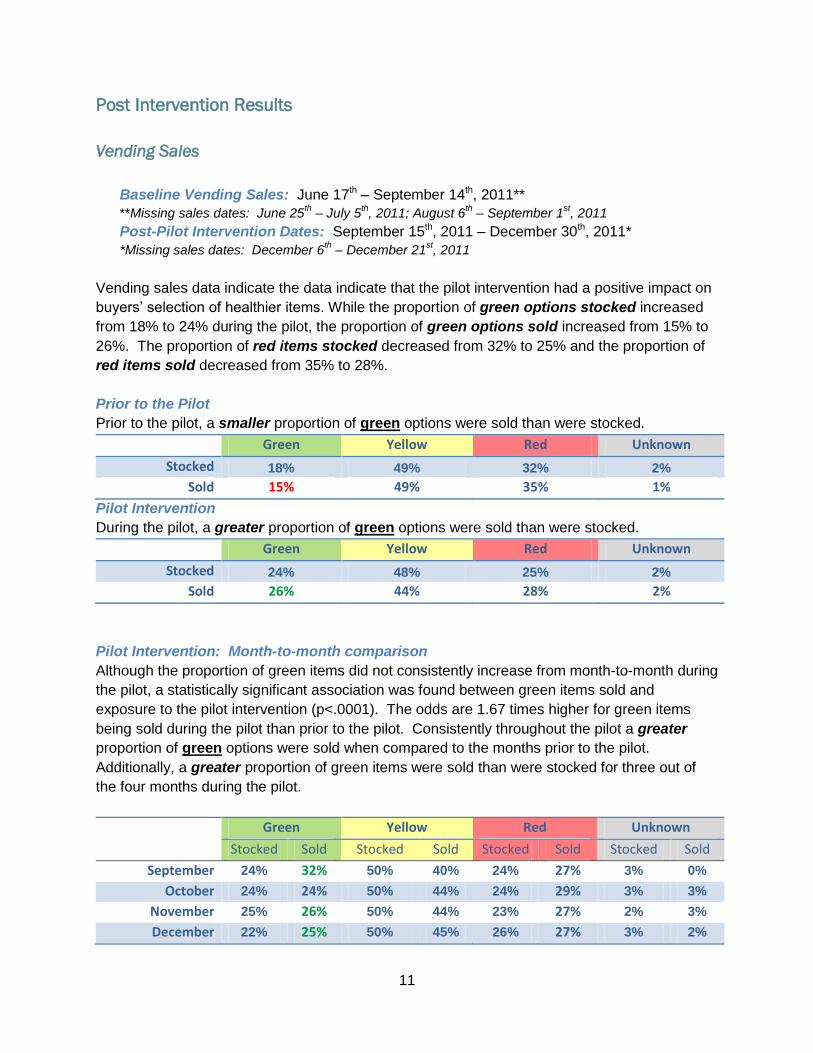
Vending sales data indicate the data indicate that the pilot intervention had a positive impact on
buyers’ selection of healthier items. While the proportion of green options stocked increased
from 18% to 24% during the pilot, the proportion of green options sold increased from 15% to
26%. The proportion of red items stocked decreased from 32% to 25% and the proportion of
red items sold decreased from 35% to 28%.
Prior to the Pilot
Prior to the pilot, a smaller proportion of green options were sold than were stocked.
Green Yellow Red Unknown
Stocked 18% 49% 32% 2%
Sold 15% 49% 35% 1%
Pilot Intervention
During the pilot, a greater proportion of green options were sold than were stocked.
Green Yellow Red Unknown
Stocked 24% 48% 25% 2%
Sold 26% 44% 28% 2%
Pilot Intervention: Month-to-month comparison
Although the proportion of green items did not consistently increase from month-to-month during
the pilot, a statistically significant association was found between green items sold and
exposure to the pilot intervention (p<.0001). The odds are 1.67 times higher for green items
being sold during the pilot than prior to the pilot. Consistently throughout the pilot a greater
proportion of green options were sold when compared to the months prior to the pilot.
Additionally, a greater proportion of green items were sold than were stocked for three out of
the four months during the pilot.
Green Yellow Red Unknown
Stocked Sold Stocked Sold Stocked Sold Stocked Sold
September 24% 32% 50% 40% 24% 27% 3% 0%
October 24% 24% 50% 44% 24% 29% 3% 3%
November 25% 26% 50% 44% 23% 27% 2% 3%
December 22% 25% 50% 45% 26% 27% 3% 2%
12
Employee Interest PostSurvey
The table below describes the gender and age of participants in the Employee Survey. While
the number of respondents differs between pre and post questionnaire, the gender and age of
respondents is similar at both times and accurately represents the staff employed in the Abrams
building.
Presurvey Postsurvey
Number of Respondents 242 159
Gender
Male
Female
21.5%
78.5%
22.9%
77.1%
Age Range
20-29
30-39
40-49
50-59
60+
10.7%
20.2%
22.3%
37.2%
9.5%
10.5%
19.1%
16.4%
41.4%
12.5%
Purchasing Interest and Behaviors
From pre to post survey the percentage of employees regularly using vending machines
decreased from 23% to 14%, while the percentage that used the vending machines less than
once a week rose from 68% to 78%. More time is needed to assess the permanence of this
trend or the impact in overall sales. However, the post employee survey identified no changes
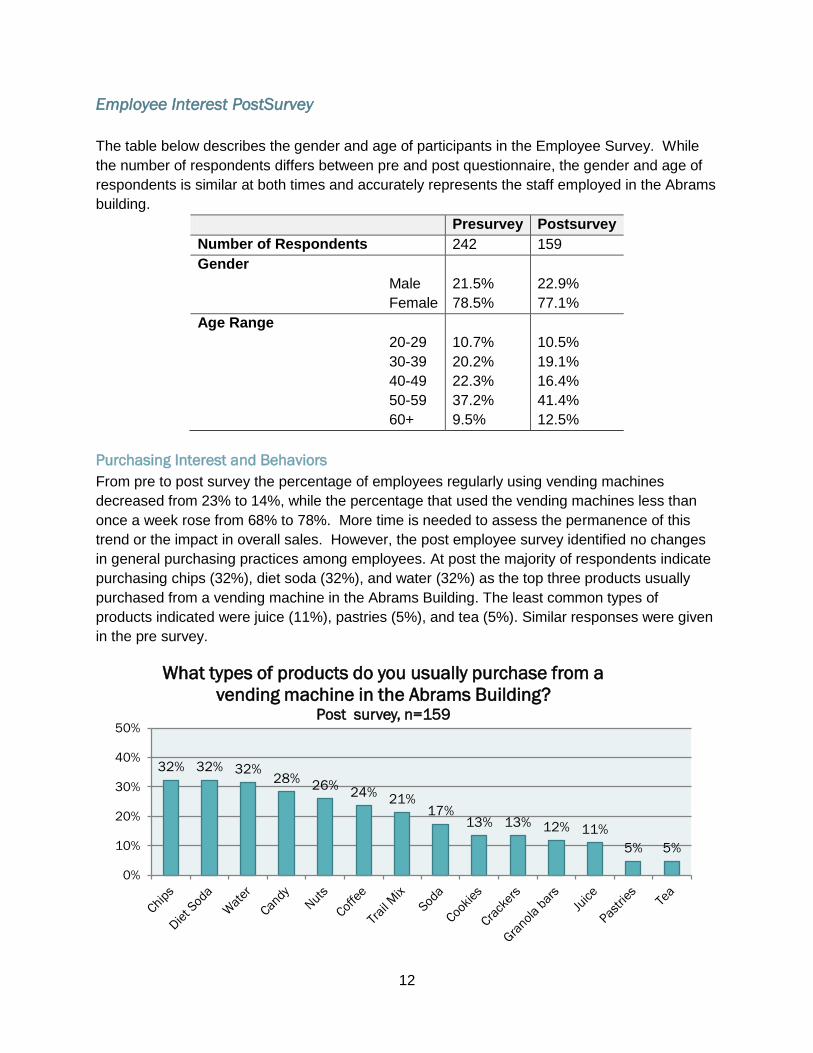
in general purchasing practices among employees. At post the majority of respondents indicate
purchasing chips (32%), diet soda (32%), and water (32%) as the top three products usually
purchased from a vending machine in the Abrams Building. The least common types of
products indicated were juice (11%), pastries (5%), and tea (5%). Similar responses were given
in the pre survey.
32% 32% 32% 28%
26% 24%
21% 17%
13% 13% 12% 11%
5% 5%
0%
10%
20%
30%
40%
50%
What types of products do you usually purchase from a
vending machine in the Abrams Building? Post survey, n=159

13
There was very little difference in the amount of money
that employees spent at the vending machine between
pre and post survey. At post survey, the majority of
respondents (55%) indicate spending on average less
than $1.00 per week on snack foods and beverages in
vending machines in the Abrams building followed by
$1.00 - $2.00 per week (23% and 31%). A very small
percentage of respondents (less than 5% for both
surveys) indicate spending more than $4.00 per week in
the vending machines.
When asked to identify certain food characteristics that are important to consider making a
purchasing decisions, as with the pre survey the majority of respondents at post selected snack
taste, freshness, and cost to be the most important. Value, hunger, and calorie count were also
considered important in a person’s snack purchasing decision. When asked which type of
0
20
40
60
80
100
120
140
160
180
When making a choice at a vending machine, how important
is ...
Post Survey
Not At All Important Somewhat Important Very Important
Top Snacks People Would Likely
Purchase:
1. Nuts
2. Water
3. Dried Fruit
4. 100 Calorie Packets
5. Whole Wheat/Grain Crackers
6. Pretzels
14
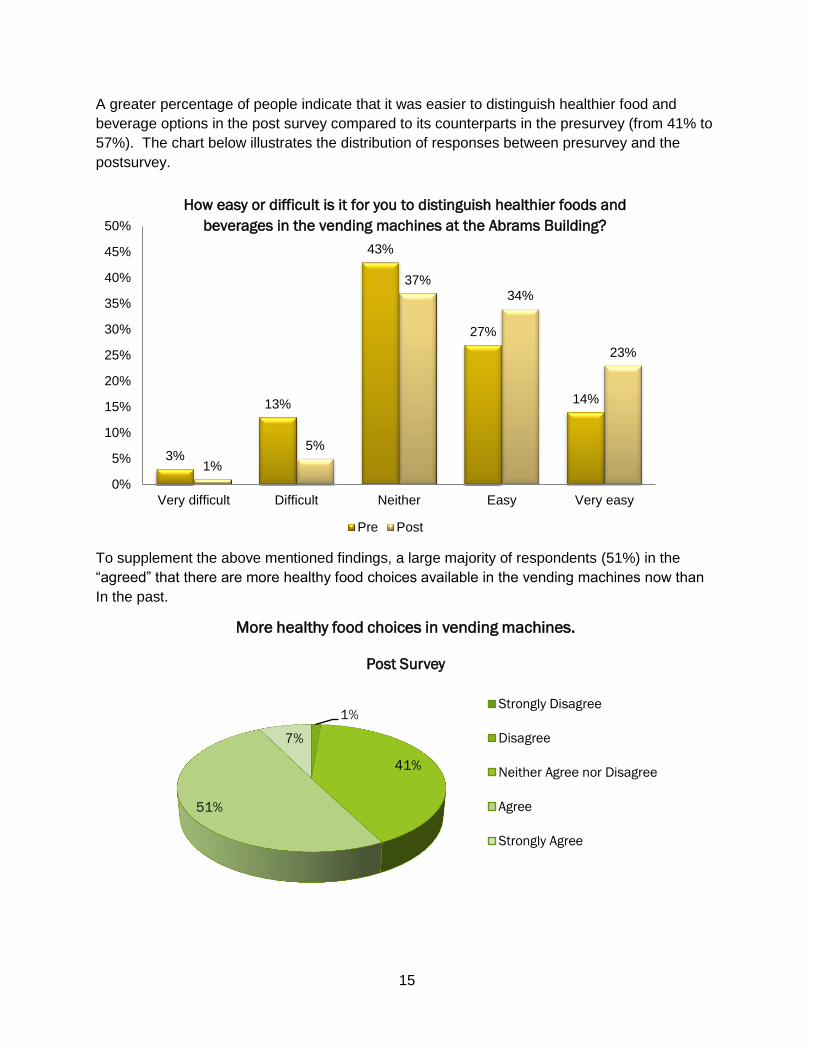
60%
82%
0%
10%
20%
30%
40%
50%
60%
70%
80%
90%
100%
I am aware of the healthier food items
available.
Pre
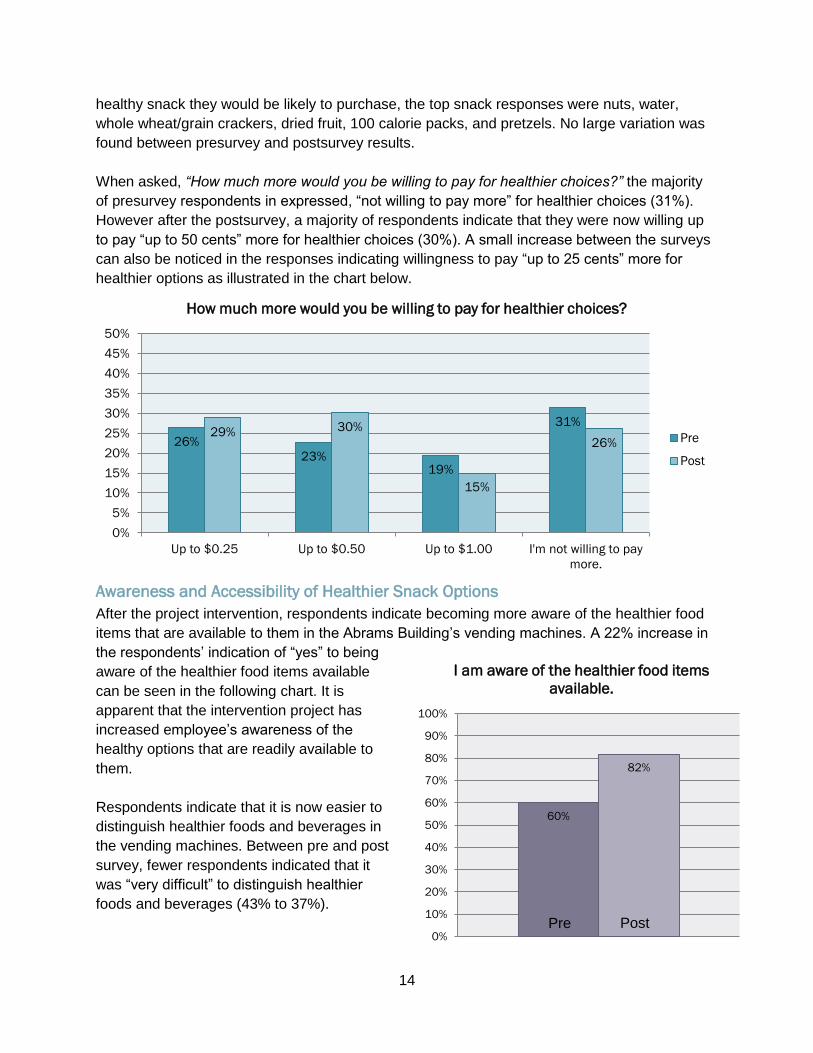
healthy snack they would be likely to purchase, the top snack responses were nuts, water,
whole wheat/grain crackers, dried fruit, 100 calorie packs, and pretzels. No large variation was
found between presurvey and postsurvey results.
When asked, “How much more would you be willing to pay for healthier choices?” the majority
of presurvey respondents in expressed, “not willing to pay more” for healthier choices (31%).
However after the postsurvey, a majority of respondents indicate that they were now willing up
to pay “up to 50 cents” more for healthier choices (30%). A small increase between the surveys
can also be noticed in the responses indicating willingness to pay “up to 25 cents” more for
healthier options as illustrated in the chart below.
Awareness and Accessibility of Healthier Snack Options
After the project intervention, respondents indicate becoming more aware of the healthier food
items that are available to them in the Abrams Building’s vending machines. A 22% increase in
the respondents’ indication of “yes” to being
aware of the healthier food items available
can be seen in the following chart. It is
apparent that the intervention project has
increased employee’s awareness of the
healthy options that are readily available to
them.
Respondents indicate that it is now easier to
distinguish healthier foods and beverages in
the vending machines. Between pre and post
survey, fewer respondents indicated that it
was “very difficult” to distinguish healthier
foods and beverages (43% to 37%).
26%
23% 19%
31% 29% 30%
15%
26%
0%
5%
10%
15%
20%
25%
30%
35%
40%
45%
50%
Up to $0.25 Up to $0.50 Up to $1.00 I'm not willing to pay
more.
How much more would you be willing to pay for healthier choices?
Pre
Post
Post
15
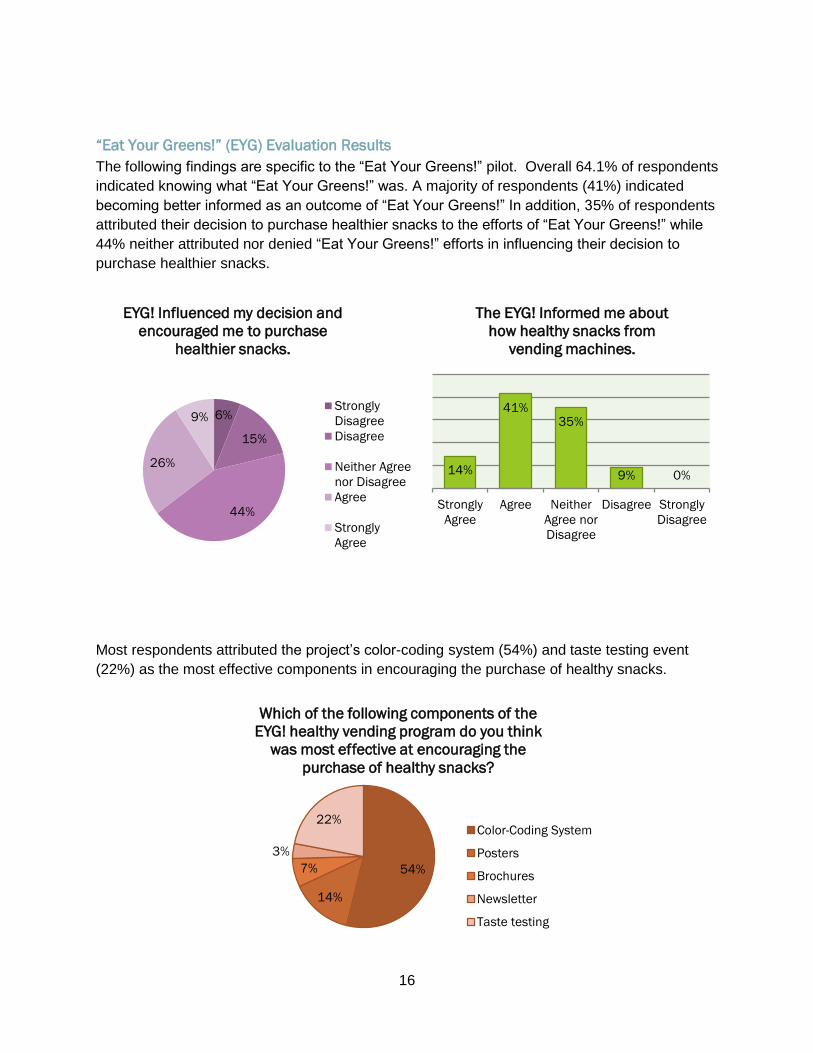
A greater percentage of people indicate that it was easier to distinguish healthier food and
beverage options in the post survey compared to its counterparts in the presurvey (from 41% to
57%). The chart below illustrates the distribution of responses between presurvey and the
postsurvey.
To supplement the above mentioned findings, a large majority of respondents (51%) in the
“agreed” that there are more healthy food choices available in the vending machines now than
In the past.
3%
13%
43%
27%
14%
1%
5%
37% 34%
23%
0%
5%
10%
15%
20%
25%
30%
35%
40%
45%
50%
Very difficult Difficult Neither Easy Very easy
Pre Post
1%
41%
51%
7%
More healthy food choices in vending machines.
Post Survey
Strongly Disagree
Disagree
Neither Agree nor Disagree
Agree
Strongly Agree
How easy or difficult is it for you to distinguish healthier foods and
beverages in the vending machines at the Abrams Building?
16
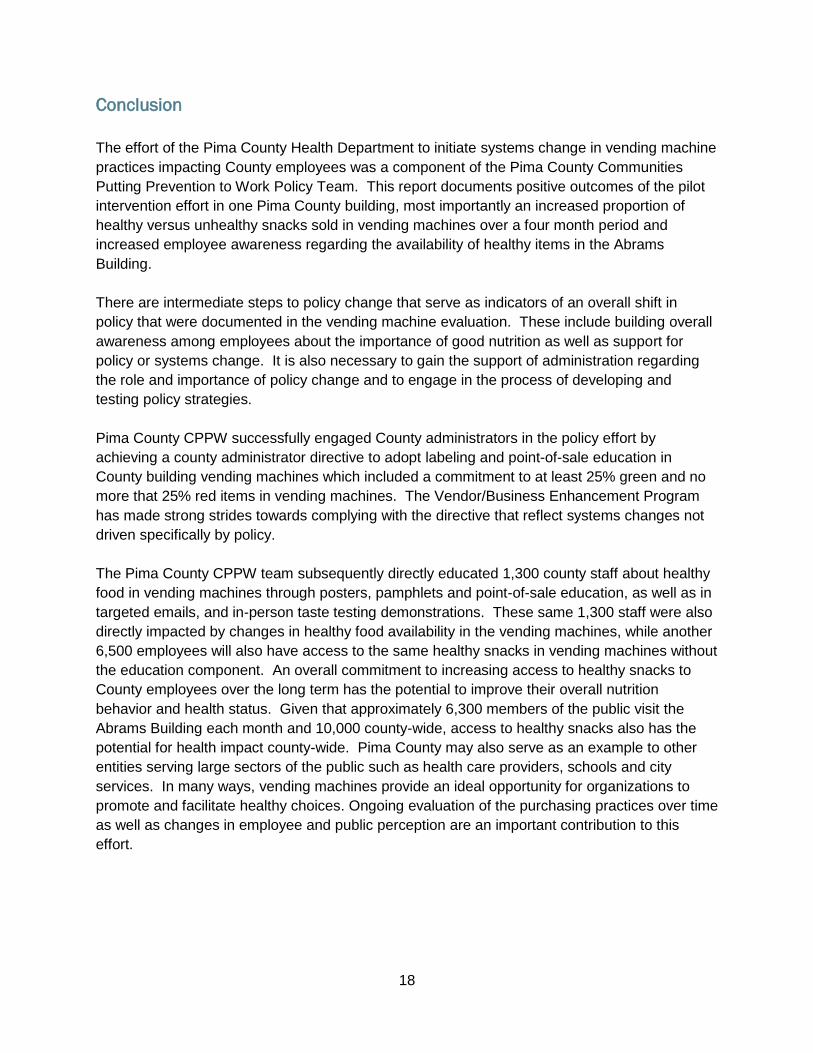
54%
14%
7%
3%
22%
Which of the following components of the
EYG! healthy vending program do you think
was most effective at encouraging the
purchase of healthy snacks?
Color-Coding System
Posters
Brochures
Newsletter
Taste testing
“Eat Your Greens!” (EYG) Evaluation Results
The following findings are specific to the “Eat Your Greens!” pilot. Overall 64.1% of respondents
indicated knowing what “Eat Your Greens!” was. A majority of respondents (41%) indicated
becoming better informed as an outcome of “Eat Your Greens!” In addition, 35% of respondents
attributed their decision to purchase healthier snacks to the efforts of “Eat Your Greens!” while
44% neither attributed nor denied “Eat Your Greens!” efforts in influencing their decision to
purchase healthier snacks.
Most respondents attributed the project’s color-coding system (54%) and taste testing event
(22%) as the most effective components in encouraging the purchase of healthy snacks.
6%
15%
44%
26%
9%
EYG! Influenced my decision and
encouraged me to purchase
healthier snacks.
Strongly
Disagree
Disagree
Neither Agree
nor Disagree
Agree
Strongly
Agree
0% 9%
35% 41%
14%
Strongly
Disagree
DisagreeNeither
Agree nor
Disagree
AgreeStrongly
Agree
The EYG! Informed me about
how healthy snacks from
vending machines.

17
Sustainability of Efforts
There was a slight increase in respondents’ perception that their current workplace believes in
the importance of health (3.75 to 3.86). Overall respondents indicated agreeing with the
statement, “My organization feels my health is important.”
In the interest of project sustainability post CPPW funding cycle, respondents were asked to
provide ways they believed Pima County should continue to support healthy eating and physical
activity for its employees across all sites.
The most shared recommendations amongst all of the respondents are the following:
1. Provide an onsite gym or safe space (i.e. walking trail) for employees to partake in
physical activity.
2. Increase access to healthy eating options through food carts, healthy vending, and
markets for employees.
3. Permit 15 minute exercise breaks to all employees throughout the day or provide a paid
exercise program during lunch.
4. Continue maintaining current wellness programs (i.e. Eat Your Greens!), host physical
activity classes and facilitate walking clubs for employees to engage.
5. Partner with the YMCA or other facility to provide gym membership discounts to all
county employees.
3.75
3.86
1.00 1.50 2.00 2.50 3.00 3.50 4.00
Pre
Post
Rating Average
My organization feels my health is important.
Ratings:
Strongly Disagree (1)
Disagree (2)
Neither (3)
Agree (4)
Strongly Agree (5)
18
Conclusion
The effort of the Pima County Health Department to initiate systems change in vending machine
practices impacting County employees was a component of the Pima County Communities
Putting Prevention to Work Policy Team. This report documents positive outcomes of the pilot
intervention effort in one Pima County building, most importantly an increased proportion of
healthy versus unhealthy snacks sold in vending machines over a four month period and
increased employee awareness regarding the availability of healthy items in the Abrams
Building.
There are intermediate steps to policy change that serve as indicators of an overall shift in
policy that were documented in the vending machine evaluation. These include building overall
awareness among employees about the importance of good nutrition as well as support for
policy or systems change. It is also necessary to gain the support of administration regarding
the role and importance of policy change and to engage in the process of developing and
testing policy strategies.
Pima County CPPW successfully engaged County administrators in the policy effort by
achieving a county administrator directive to adopt labeling and point-of-sale education in
County building vending machines which included a commitment to at least 25% green and no
more that 25% red items in vending machines. The Vendor/Business Enhancement Program
has made strong strides towards complying with the directive that reflect systems changes not
driven specifically by policy.
The Pima County CPPW team subsequently directly educated 1,300 county staff about healthy
food in vending machines through posters, pamphlets and point-of-sale education, as well as in
targeted emails, and in-person taste testing demonstrations. These same 1,300 staff were also
directly impacted by changes in healthy food availability in the vending machines, while another
6,500 employees will also have access to the same healthy snacks in vending machines without
the education component. An overall commitment to increasing access to healthy snacks to
County employees over the long term has the potential to improve their overall nutrition
behavior and health status. Given that approximately 6,300 members of the public visit the
Abrams Building each month and 10,000 county-wide, access to healthy snacks also has the
potential for health impact county-wide. Pima County may also serve as an example to other
entities serving large sectors of the public such as health care providers, schools and city
services. In many ways, vending machines provide an ideal opportunity for organizations to
promote and facilitate healthy choices. Ongoing evaluation of the purchasing practices over time
as well as changes in employee and public perception are an important contribution to this
effort.
19
References
1. Bay Area Nutrition & Physical Activity Collaborative (2010). Healthy Vending Machine Toolkit. Marin County.
2. Bay Area Nutrition & Physical Activity Collaborative (2010). Healthy Vending Machine Toolkit. Santa Clara County.
3. Bay Area Nutrition & Physical Activity Collaborative (2010). Marin County.
Healthy Vending Machine Memorandum of Understanding - Marin County
Department of Health and Human Services.
4. Bay Area Nutrition & Physical Activity Collaborative (2010). Healthy Vending Machine Toolkit. Marin County.
5. County of Los Angeles Public Health (2006). Memorandum: Los Angeles County Food Policy. Los Angeles County Food Policy: Summary of the Implementation Plan.
6. Bay Area Nutrition & Physical Activity Collaborative (2010). Healthy Vending
Machine Toolkit. Santa Clara County.
7. Bay Area Nutrition & Physical Activity Collaborative (2010). Healthy Vending
Machine Toolkit. San Diego County.
8. French SA, Jeffrey RW, Story M, Hannan P, Snyder MP. A pricing strategy to
promote low-fat snack choices through vending machines. American Journal of
Public Health. 1997;87:849-851.
9. French SA, Jeffrey RW, Story M, et al. Pricing and promotion effects of low-fat
vending snack purchases: the CHIPS study. American Journal of Public Health.
2001;91:112-117.
10. New York City Beverage Vending Machine Standards (2009).
11. Bay Area Nutrition & Physical Activity Collaborative (2010). Marin County.
Healthy Vending Machine Memorandum of Understanding - Marin County
Department of Health and Human Services.
12. Bay Area Nutrition & Physical Activity Collaborative (2010). Contra Costa
County. Healthy Vending Machine Policy.