easyscopeiii user manual - easysync ltd · before connecting the instrument to the pc, easyscopeiii...
TRANSCRIPT

EasySync Ltd
Unit 1, 2 Seaward Place, Centurion Business Park, Glasgow, G41 1HH, United Kingdom
Tel.: +44 (0) 141 418 0181 Fax: + 44 (0) 141 418 0110
E-Mail (Support): [email protected] Web: http://www.easysync.co.uk
Neither the whole nor any part of the information contained in, or the product described in this manual, may be adapted or reproduced in any material or electronic form without the prior written consent of the copyright holder. This product and its documentation are supplied on an as-is basis and no warranty as to their suitability for any particular purpose is either made or implied. EasySync Ltd will not accept any claim for damages howsoever arising as a result of use or failure of this product. Your statutory rights are not affected. This product or any variant of it is not intended for use in any medical appliance, device or system in which the failure of the product might reasonably be expected to result in personal injury. This document provides preliminary information that may be subject to change without notice. No freedom to use patents or other intellectual property rights is implied by the publication of this document. EasySync Ltd, Unit 1, 2 Seaward Place, Centurion Business Park, Glasgow, G41 1HH, United Kingdom. Scotland Registered Number: SC224924
Copyright © 2012 EasySync Limited
EasySync Ltd
EasyScopeIII for DS60M10
User Guide Document Reference No.: ES_000095
Rev 1.1
Issue Date: 2012-11-19

Document Reference No.: ES_000095 EasyScopeIII for DS60M10 User Guide
Rev 1.1 Clearance No.: ES #049
©2012 EasySync Ltd. 2
1 Introduction ................................................................................... 5
2 Installing EasyScopeIII .................................................................. 6
2.1 Windows ....................................................................................................... 6
2.1.1 Installing the software ............................................................................... 6
2.1.2 Installing the USB Driver ............................................................................ 9
2.2 Mac OS ........................................................................................................ 10
3 Scope Mode .................................................................................. 14
3.1 Overview ..................................................................................................... 14
3.2 Features ...................................................................................................... 15
3.3 Front Panel Functions .................................................................................. 16
3.3.1 Run/Stop and Single Buttons .................................................................... 16
3.3.2 Time Base Settings ................................................................................. 17
3.3.3 Volts/div Settings .................................................................................... 18
3.3.4 GND ...................................................................................................... 19
3.3.5 Trigger Settings ...................................................................................... 21
3.3.6 AC/DC Coupling ...................................................................................... 24
3.3.7 Invert .................................................................................................... 24
3.3.8 XY ........................................................................................................ 25
3.3.9 Slider .................................................................................................... 25
3.3.10 FFT Display ............................................................................................ 26
3.3.11 Meter A and Meter B ................................................................................ 31
3.3.12 Cursors ................................................................................................. 32
3.3.13 Auto Set ................................................................................................ 34
3.4 Menu Functions ........................................................................................... 35
3.4.1 File Menu ............................................................................................... 35
3.4.2 Screen Menu .......................................................................................... 35
3.4.3 Tools Menu ............................................................................................ 39
3.4.4 Display Options ...................................................................................... 40
3.4.5 Help Menu ............................................................................................. 40
3.5 Error Messages ............................................................................................ 41
3.5.1 Please Connect DS60M10 HS Scope ........................................................... 41
3.5.2 For XY Mode, both Channel A and B should be on ........................................ 41
3.5.3 Please run scope first .............................................................................. 42
3.5.4 Cannot start scope .................................................................................. 42
4 Logger Mode ................................................................................. 43
4.1 Overview ..................................................................................................... 43
Document Reference No.: ES_000095 EasyScopeIII for DS60M10 User Guide
Rev 1.1 Clearance No.: ES #049
©2012 EasySync Ltd. 3
4.2 Features ...................................................................................................... 44
4.3 Front Panel Functions .................................................................................. 45
4.3.1 Start Button ........................................................................................... 45
4.3.2 Stop Button ............................................................................................ 45
4.3.3 Sample Interval ...................................................................................... 46
4.3.4 Channel Enable buttons ........................................................................... 47
4.3.5 Slide bar ................................................................................................ 47
4.3.6 Scale Panel ............................................................................................ 47
4.4 Toolbar Buttons ........................................................................................... 48
4.4.1 Open Chart ............................................................................................ 48
4.4.2 Save Chart ............................................................................................. 48
4.4.3 Print Chart Area ...................................................................................... 48
4.4.4 Copy Chart to Clipboard ........................................................................... 48
4.4.5 Zoom In/Out .......................................................................................... 48
4.4.6 Cursors ................................................................................................. 49
4.4.7 TestMode Waveform ................................................................................ 51
4.4.8 Memo Window ........................................................................................ 51
4.4.9 Info Window ........................................................................................... 51
4.4.10 X-Control Window ................................................................................... 52
4.4.11 Y-Control Window ................................................................................... 52
4.5 Sub Panel Functions .................................................................................... 53
4.5.1 Memo Window ........................................................................................ 53
4.5.2 Info Window ........................................................................................... 54
4.5.3 X-Control Window ................................................................................... 55
4.5.4 Y-Control Window ................................................................................... 56
4.6 Menu Functions ........................................................................................... 57
4.6.1 File Menu ............................................................................................... 57
4.6.2 Run Menu .............................................................................................. 58
4.6.3 Edit Menu .............................................................................................. 58
4.6.4 View Menu ............................................................................................. 64
4.6.5 Window Menu ......................................................................................... 66
4.6.6 Help Menu ............................................................................................. 66
4.6.7 Mode Menu ............................................................................................ 67
Technical Support ................................................................................................. 68
5 Contact Information ..................................................................... 69
Appendix A - List of Figures ............................................................... 70

Document Reference No.: ES_000095 EasyScopeIII for DS60M10 User Guide
Rev 1.1 Clearance No.: ES #049
©2012 EasySync Ltd. 4
Appendix B - Revision History ............................................................ 71

Document Reference No.: ES_000095 EasyScopeIII for DS60M10 User Guide
Rev 1.1 Clearance No.: ES #049
©2012 EasySync Ltd. 5
1 Introduction EasyScopeIII is an easy to use but powerful Digital Sampling Oscilloscope application program for the USB Instruments DS60M10.
Figure 1.1 – EasyScopeIII GUI

Document Reference No.: ES_000095 EasyScopeIII for DS60M10 User Guide
Rev 1.1 Clearance No.: ES #049
©2012 EasySync Ltd. 6
2 Installing EasyScopeIII EasyScopeIII can be installed on both Windows and Mac OS. This section guides the users through the process of installing the application on each operating system.
2.1 Windows
2.1.1 Installing the software
Before connecting the instrument to the PC, EasyScopeIII program should be installed. The software can be downloaded royalty-free from the EasySYNC website: http://www.easysync-ltd.com/page/13/software.html.
Start the installation by double-clicking the installation package. The following screen will appear.

Document Reference No.: ES_000095 EasyScopeIII for DS60M10 User Guide
Rev 1.1 Clearance No.: ES #049
©2012 EasySync Ltd. 7
Click on the “Next” button to bring the License Agreement screen.
If you agree with the terms and conditions of the Licence Agreement, click on “I Agree” button, else click on “Cancel” button. Agreeing on the terms and conditions will bring to the following screen.
Document Reference No.: ES_000095 EasyScopeIII for DS60M10 User Guide
Rev 1.1 Clearance No.: ES #049
©2012 EasySync Ltd. 8
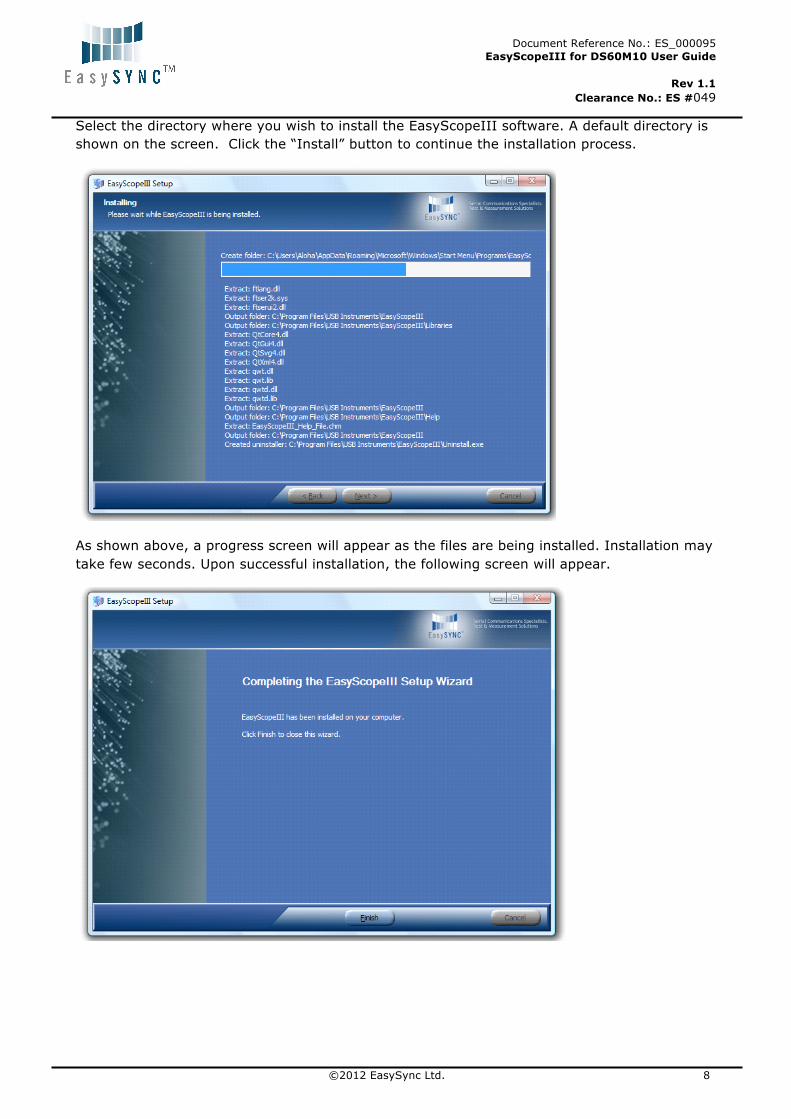
Select the directory where you wish to install the EasyScopeIII software. A default directory is shown on the screen. Click the “Install” button to continue the installation process.
As shown above, a progress screen will appear as the files are being installed. Installation may take few seconds. Upon successful installation, the following screen will appear.
Document Reference No.: ES_000095 EasyScopeIII for DS60M10 User Guide
Rev 1.1 Clearance No.: ES #049
©2012 EasySync Ltd. 9
2.1.2 Installing the USB Driver
Before using EasyScopeIII the USB driver needs to be installed. This is done by plugging the instrument into a spare USB port on the PC. The instrument should be plugged into a USB hub port of your PC or alternatively, a self-powered USB hub (one that has its own power supply).
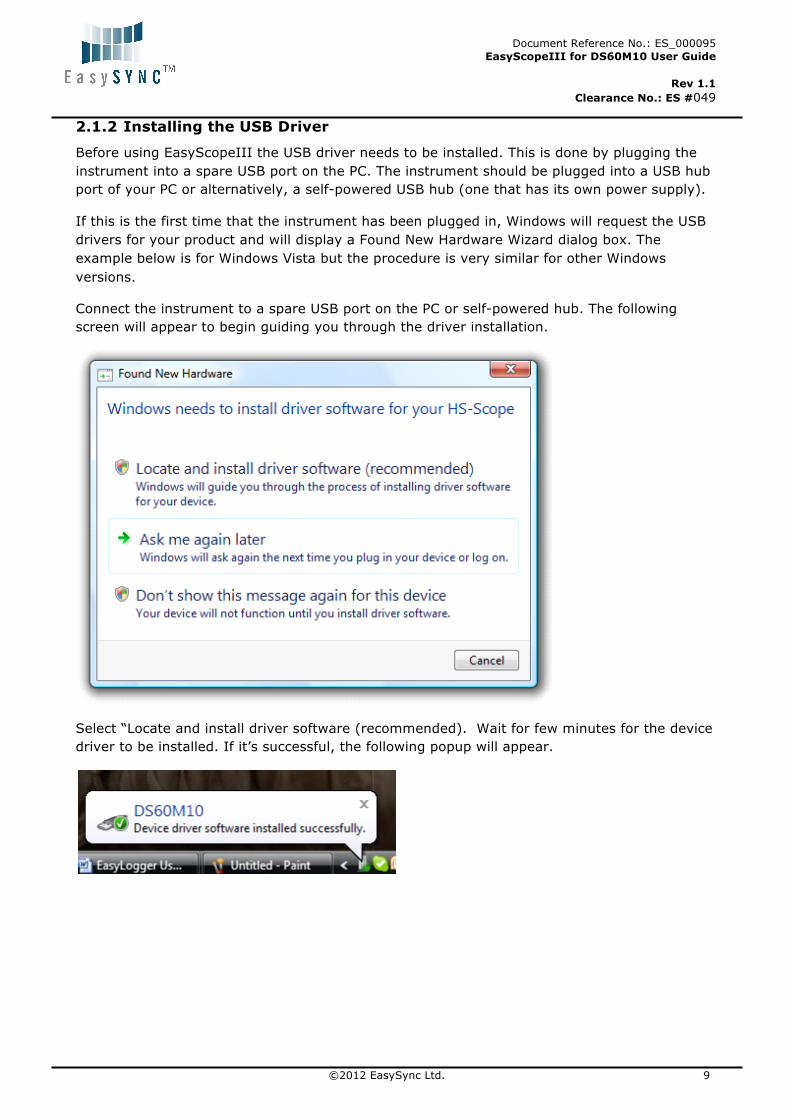
If this is the first time that the instrument has been plugged in, Windows will request the USB drivers for your product and will display a Found New Hardware Wizard dialog box. The example below is for Windows Vista but the procedure is very similar for other Windows versions.
Connect the instrument to a spare USB port on the PC or self-powered hub. The following screen will appear to begin guiding you through the driver installation.
Select “Locate and install driver software (recommended). Wait for few minutes for the device driver to be installed. If it’s successful, the following popup will appear.
Document Reference No.: ES_000095 EasyScopeIII for DS60M10 User Guide
Rev 1.1 Clearance No.: ES #049
©2012 EasySync Ltd. 10
2.2 Mac OS
The USB driver for Mac OS is embedded within the software. As a result, no separate installation for the driver is needed.
To install EasyScopeIII on Mac OS, the following steps should be followed. The example below is for Mac OS X Mountain Lion but the procedure should be very similar for other Mac OS versions.
By default, MAC OS may not allow unsigned third-party applications to be installed. In order to overcome this restriction, the security settings need to be changed.
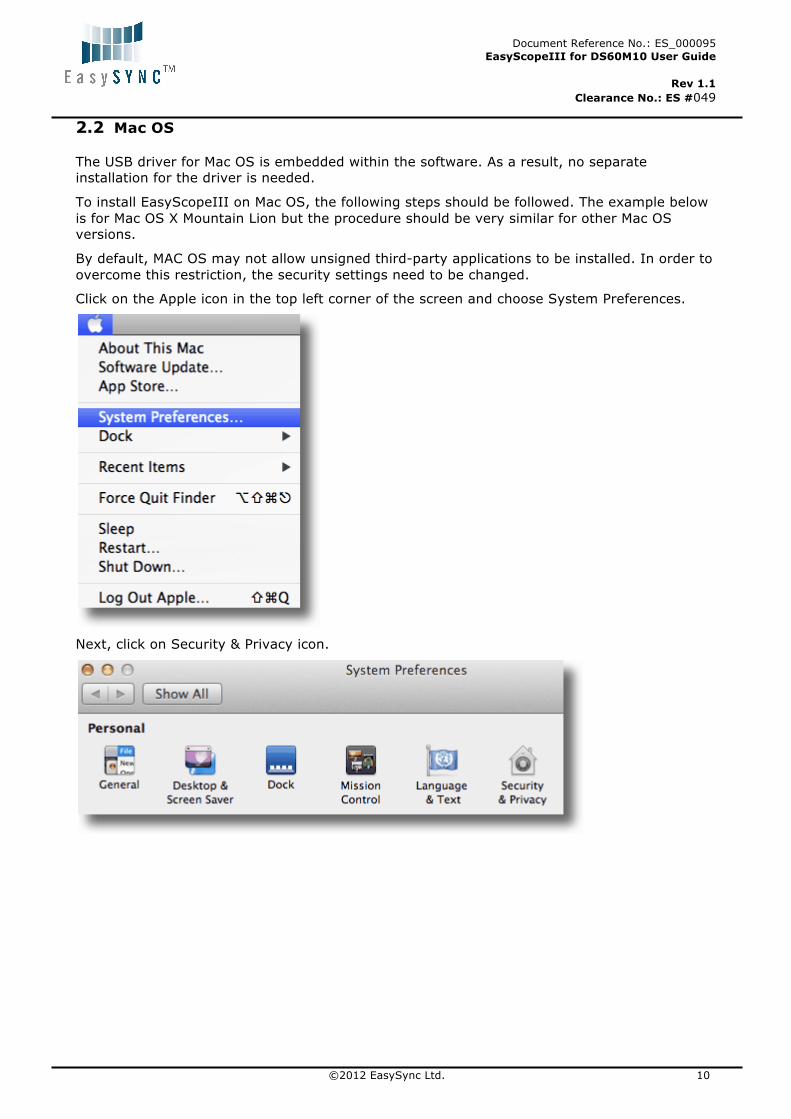
Click on the Apple icon in the top left corner of the screen and choose System Preferences.
Next, click on Security & Privacy icon.
Document Reference No.: ES_000095 EasyScopeIII for DS60M10 User Guide
Rev 1.1 Clearance No.: ES #049
©2012 EasySync Ltd. 11
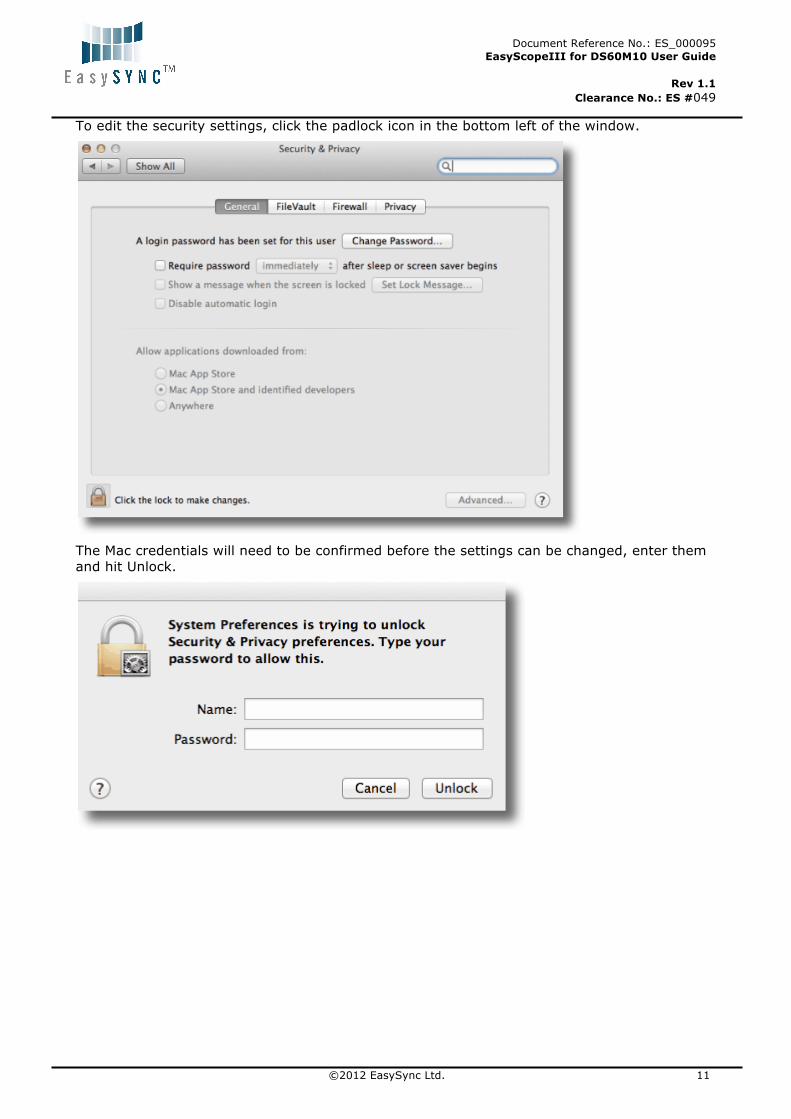
To edit the security settings, click the padlock icon in the bottom left of the window.
The Mac credentials will need to be confirmed before the settings can be changed, enter them and hit Unlock.
Document Reference No.: ES_000095 EasyScopeIII for DS60M10 User Guide
Rev 1.1 Clearance No.: ES #049
©2012 EasySync Ltd. 12
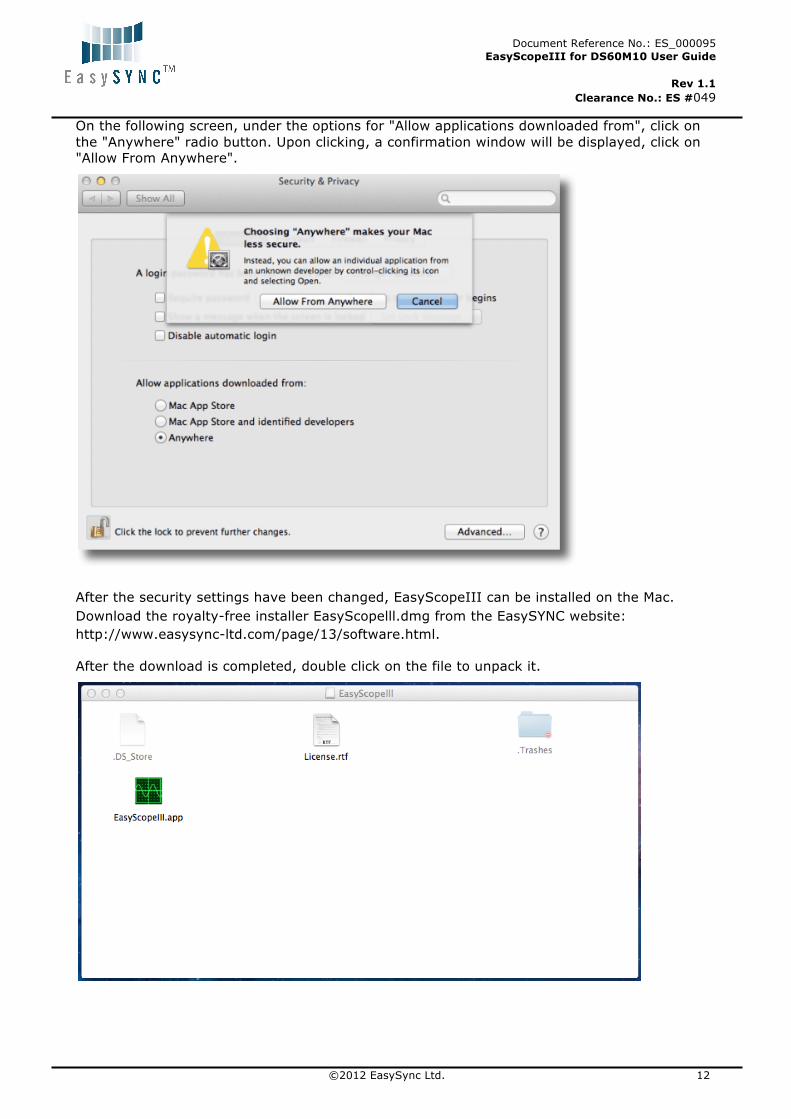
On the following screen, under the options for "Allow applications downloaded from", click on the "Anywhere" radio button. Upon clicking, a confirmation window will be displayed, click on "Allow From Anywhere".
After the security settings have been changed, EasyScopeIII can be installed on the Mac. Download the royalty-free installer EasyScopelll.dmg from the EasySYNC website: http://www.easysync-ltd.com/page/13/software.html.
After the download is completed, double click on the file to unpack it.
Document Reference No.: ES_000095 EasyScopeIII for DS60M10 User Guide
Rev 1.1 Clearance No.: ES #049
©2012 EasySync Ltd. 13
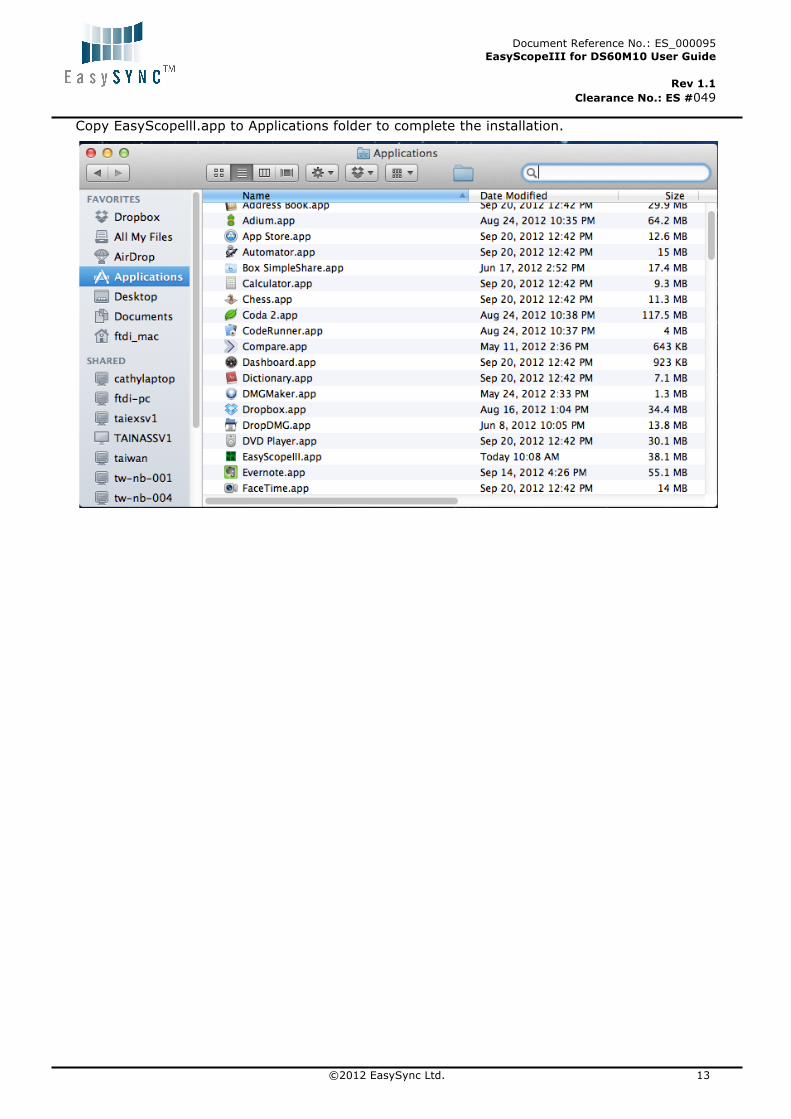
Copy EasyScopelll.app to Applications folder to complete the installation.
Document Reference No.: ES_000095 EasyScopeIII for DS60M10 User Guide
Rev 1.1 Clearance No.: ES #049
©2012 EasySync Ltd. 14
3 Scope Mode
3.1 Overview
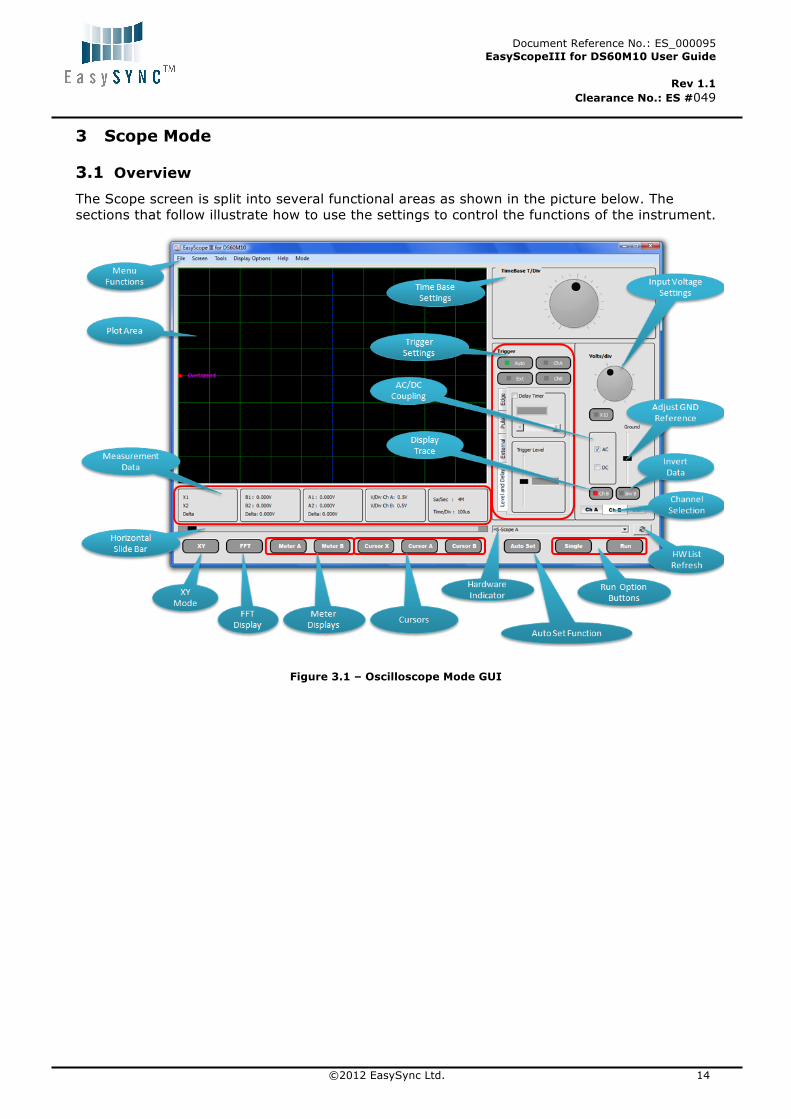
The Scope screen is split into several functional areas as shown in the picture below. The sections that follow illustrate how to use the settings to control the functions of the instrument.
Figure 3.1 – Oscilloscope Mode GUI
Document Reference No.: ES_000095 EasyScopeIII for DS60M10 User Guide
Rev 1.1 Clearance No.: ES #049
©2012 EasySync Ltd. 15
3.2 Features
• Easy to use visual display • F.F.T. (Fast Fourier Transform) display • 2 oscilloscope channels • Advanced trigger settings including edge and pulse triggering • Delayed time base function • External trigger • Integrated digital volt meters • Auto Set function • Time base from 100 ns/div to 200 ms/div • Input ranges from 0.025 V/div to 5 V/div • Cursor markers for voltage measurement • Cursor markers for time / frequency measurement • Save oscilloscope screens to Windows BMP files • Saves previously selected Gain, Time Base, Trigger Settings. • Export most recent oscilloscope traces to a CSV file • Screen printout facility • AC/DC coupling support • Support for x1 and x10 probes • Persistence mode display

Document Reference No.: ES_000095 EasyScopeIII for DS60M10 User Guide
Rev 1.1 Clearance No.: ES #049
©2012 EasySync Ltd. 16
3.3 Front Panel Functions
3.3.1 Run/Stop and Single Buttons
Before running the scope, select the hardware from the combo box as shown below.
This combo box shows “No Hardware found” when no hardware is connected and the name of the device when Hardware is connected. The Refresh button on the right of the combo box can be clicked to update the hardware list.
On starting the scope, the program is in idle mode and displays two buttons on the bottom toolbar with the captions "Single" and "Run". In order to display a trace on the oscilloscope you need to click on either of the "Run" or "Single" buttons.
On clicking the "Run" or "Single" buttons captured data will be displayed on the screen providing that the trigger conditions are met or auto trigger is enabled and the trace display buttons are active.
The "Run" button is used to continuously capture and display data. When the "Run" button is clicked, the capture / display begin and the caption of the button changes to "Stop". Please refer to the figure below.
The "Single" button is not active as the two functions are mutually exclusive. To stop the capture, click on the "Stop" button and the oscilloscope will change back into idle mode.
The "Single" button captures one screen's worth of data then returns the program to idle mode. When the "Single" button is clicked, the instrument waits on the trigger conditions being met before updating the display with a single buffer of data and the caption of the "Run" button changes to "Stop".
The "Single" button is "greyed-out" as the function is currently running. If the instrument does not trigger, it can be returned to idle mode by clicking the "Stop" button.
The last captured data buffer will remain displayed on the screen as long as the user does not change any of the oscilloscope settings. If desired, the screen display can be saved to a WindowsBitmap (.bmp) format file, exported to a comma separated values (.csv) file for analysis using third party programs or can be printed by any printer connected to the P.C. These subjects are dealt with in later topics.
Document Reference No.: ES_000095 EasyScopeIII for DS60M10 User Guide
Rev 1.1 Clearance No.: ES #049
©2012 EasySync Ltd. 17
An alternative to the Run / Stop button is provided through the File Menu at the top of the application screen. Click on "File" to select the drop down menu as shown in the figure below.
Click on "Run" or "Stop" as desired. Clicking on "Exit" will quit the EasyScope application.
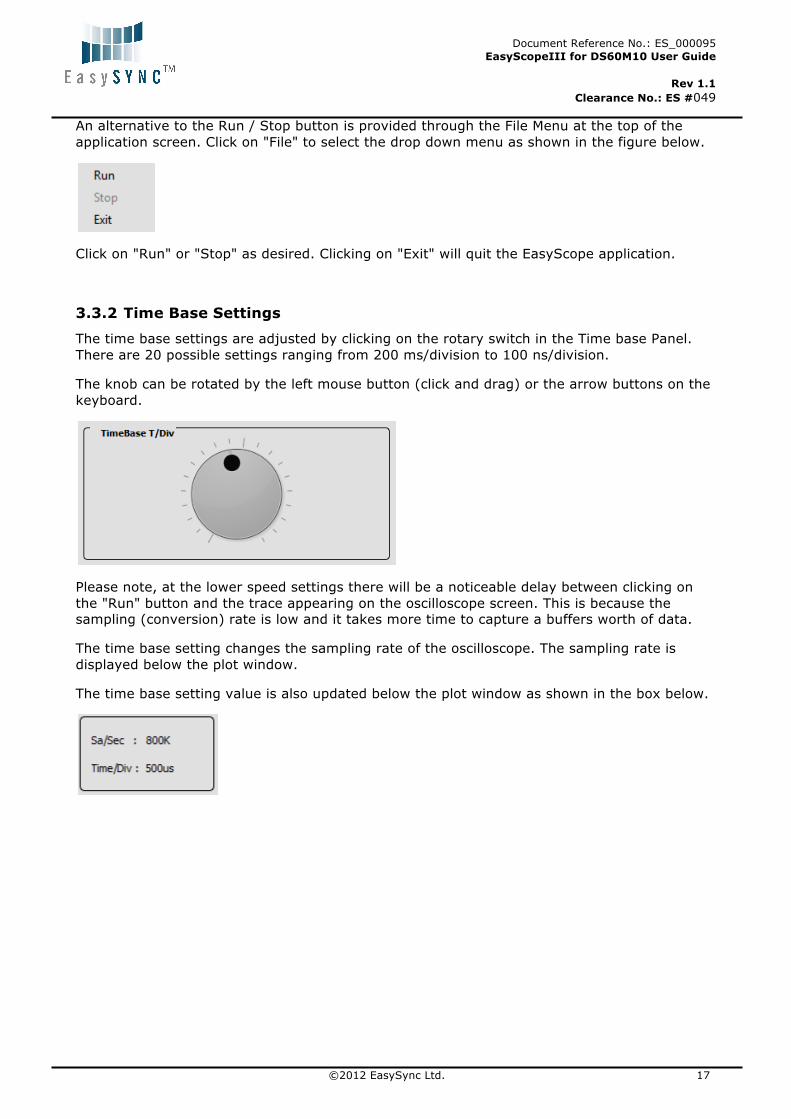
3.3.2 Time Base Settings
The time base settings are adjusted by clicking on the rotary switch in the Time base Panel. There are 20 possible settings ranging from 200 ms/division to 100 ns/division.
The knob can be rotated by the left mouse button (click and drag) or the arrow buttons on the keyboard.
Please note, at the lower speed settings there will be a noticeable delay between clicking on the "Run" button and the trace appearing on the oscilloscope screen. This is because the sampling (conversion) rate is low and it takes more time to capture a buffers worth of data.
The time base setting changes the sampling rate of the oscilloscope. The sampling rate is displayed below the plot window.
The time base setting value is also updated below the plot window as shown in the box below.
Document Reference No.: ES_000095 EasyScopeIII for DS60M10 User Guide
Rev 1.1 Clearance No.: ES #049
©2012 EasySync Ltd. 18
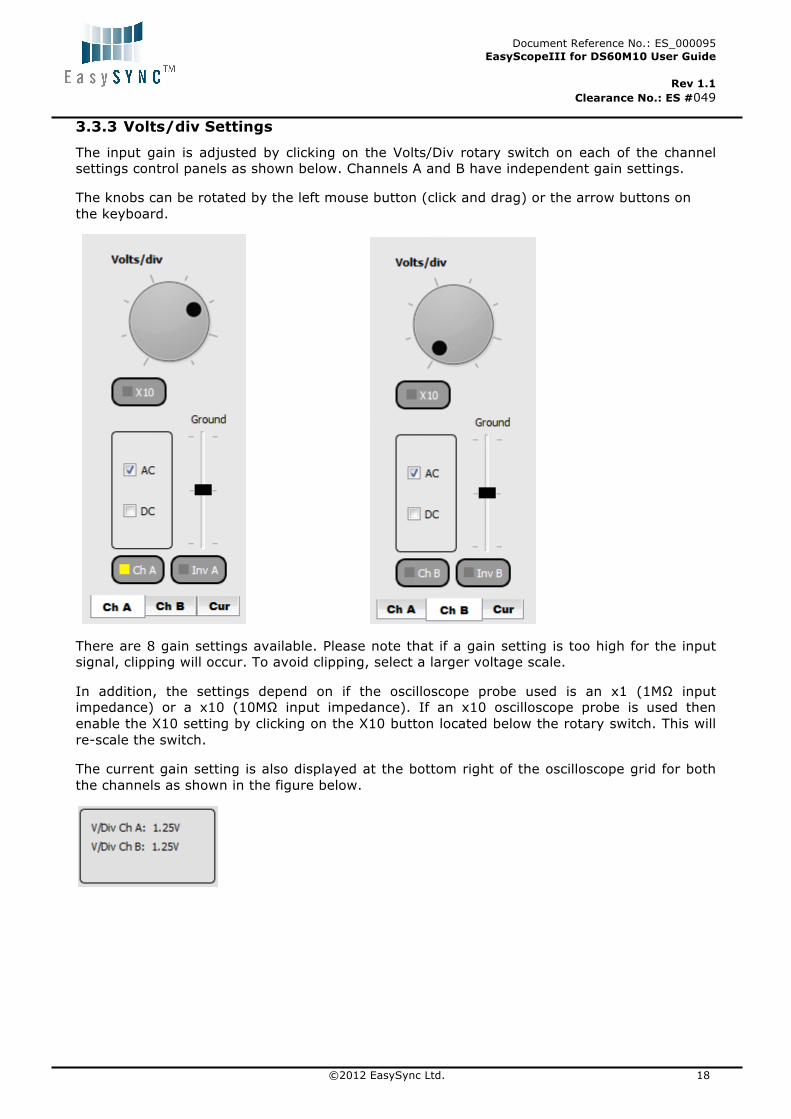
3.3.3 Volts/div Settings
The input gain is adjusted by clicking on the Volts/Div rotary switch on each of the channel settings control panels as shown below. Channels A and B have independent gain settings.
The knobs can be rotated by the left mouse button (click and drag) or the arrow buttons on the keyboard.
There are 8 gain settings available. Please note that if a gain setting is too high for the input signal, clipping will occur. To avoid clipping, select a larger voltage scale.
In addition, the settings depend on if the oscilloscope probe used is an x1 (1MΩ input impedance) or a x10 (10MΩ input impedance). If an x10 oscilloscope probe is used then enable the X10 setting by clicking on the X10 button located below the rotary switch. This will re-scale the switch.
The current gain setting is also displayed at the bottom right of the oscilloscope grid for both the channels as shown in the figure below.

Document Reference No.: ES_000095 EasyScopeIII for DS60M10 User Guide
Rev 1.1 Clearance No.: ES #049
©2012 EasySync Ltd. 19
3.3.4 GND
The ground (0V) reference is shown by a small arrow on the left hand side of the screen. The colour of the arrow matches the colour of the trace display. The default colours are yellow for channel A and red for channel B as shown below.
In the figure below, the Channel A and B Ground cursors are shown on the left side of the plot area.

Document Reference No.: ES_000095 EasyScopeIII for DS60M10 User Guide
Rev 1.1 Clearance No.: ES #049
©2012 EasySync Ltd. 20
Initially the arrows for the both the channels are overlapped and “Overlapped” text is indicated. Please refer to the figure below.
To adjust the ground reference setting, use the "GND" Slider on each channel control panel as shown in the figure below. Each GND reference button will adjust the ground reference for that channel only. The GND reference can be changed both in idle mode and in run mode.
The slider can be adjusted by the left mouse button (click and drag) or the arrow buttons on the keyboard.

Document Reference No.: ES_000095 EasyScopeIII for DS60M10 User Guide
Rev 1.1 Clearance No.: ES #049
©2012 EasySync Ltd. 21
3.3.5 Trigger Settings
Basic trigger settings are configured using the controls on the trigger panel as shown in the figure below.
Auto
Allows the scope to free-run and constantly collect data without waiting for a trigger event.
ChA
Forces the scope to wait on a trigger event on Channel A defined by the other trigger controls before the display is updated.
ChB
Forces the scope to wait on a trigger event on Channel B defined by the other trigger controls before the display is updated.
Trigger Modes
Edge Trigger
The default mode is edge trigger which can be set to trigger on a rising or falling edge using the front panel. The default is the rising edge.

Document Reference No.: ES_000095 EasyScopeIII for DS60M10 User Guide
Rev 1.1 Clearance No.: ES #049
©2012 EasySync Ltd. 22
In the figure below, icon indicates -ve (falling) edge and icon indicates +ve (rising) edge.
The figure below shows a rising edge. The dotted blue line indicates the trigger point.
The figure below shows a falling edge. The dotted blue line indicates the trigger point.

Document Reference No.: ES_000095 EasyScopeIII for DS60M10 User Guide
Rev 1.1 Clearance No.: ES #049
©2012 EasySync Ltd. 23
Pulse Trigger
Pulse from this menu disables edge trigger and enables pulse trigger. The user must select either Negative or Positive pulse from a sub menu as shown in the figure below.
The figure below shows the Pulse Width Trigger option.
The user can then select options to trigger on a pulse of length greater than or less than the time indicated by the horizontal slide bar. The value of the slide bar is displayed in the box above the slide bar may be changed by clicking on and dragging the slider.
This triggering method can be an extremely useful tool for finding "glitches".
The Box that displays Pulse Width values is a read-only.
External Trigger
Forces the scope to wait on a level sensitive external trigger event. When this option is selected, the High/Low button becomes visible as shown in the figure below.
This will cause the scope to trigger when the external trigger input signal is above or below the external trigger level. Please note that this option uses the right hand BNC connector with the green LED.
The external trigger voltage is limited between -3.3V to 3.3V due to the Hardware.
Other Controls
Trigger Level Slider
Use the "Trigger Level" slider to set the desired trigger level voltage. The trigger level is shown as an arrow with a "T" to the right of the oscilloscope screen and is displayed numerically beside the slider. The colour of the "T" arrow matches the colour of the trace that has been selected as the trigger source. If Ext trigger is selected, the "T" arrow colour is magenta.

Document Reference No.: ES_000095 EasyScopeIII for DS60M10 User Guide
Rev 1.1 Clearance No.: ES #049
©2012 EasySync Ltd. 24
Delay from Trigger
The Delay from Trigger option allows the data capture to be delayed from the trigger point by a specified time by using the by using the Delay from Main Time Base slide bar.
The delay timer box that displays values is a read-only as shown in the figure below.
The delay range values are updated according to the time base settings.
3.3.6 AC/DC Coupling
AC/DC coupling is controlled by miniature relays inside the oscilloscope. To select AC or DC coupling click on the AC/DC selector switch on each channel control panel. This will instruct the oscilloscope to change the coupling from AC to DC or vice-versa for that channel.
DC coupling allows both DC and AC signals through, while AC coupling accepts only AC signals. If the oscilloscope is AC coupled, then the DC portion of the waveform is blocked and only the AC portion is displayed.
As an example, the figure below shows AC coupling selected.
3.3.7 Invert
An invert button is located on each of the channel control panels.
Clicking the invert button has the effect of flipping the captured data about the ground reference value for that channel.
Document Reference No.: ES_000095 EasyScopeIII for DS60M10 User Guide
Rev 1.1 Clearance No.: ES #049
©2012 EasySync Ltd. 25
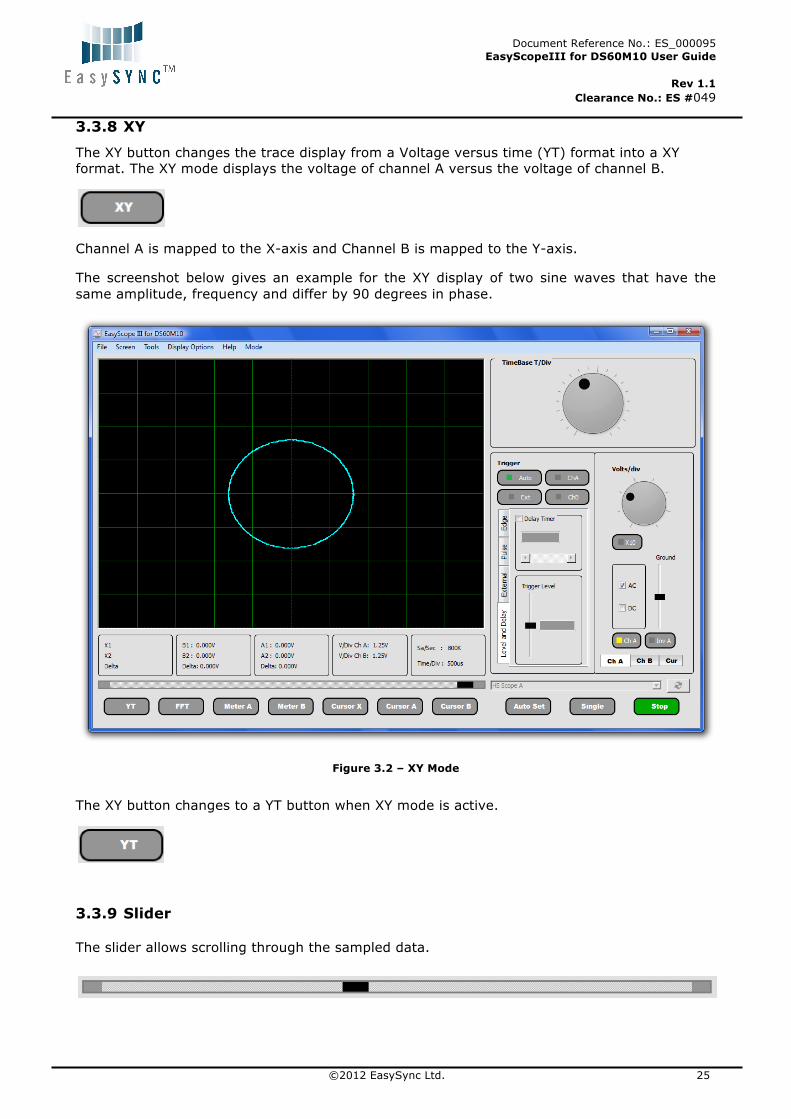
3.3.8 XY
The XY button changes the trace display from a Voltage versus time (YT) format into a XY format. The XY mode displays the voltage of channel A versus the voltage of channel B.
Channel A is mapped to the X-axis and Channel B is mapped to the Y-axis.
The screenshot below gives an example for the XY display of two sine waves that have the same amplitude, frequency and differ by 90 degrees in phase.
Figure 3.2 – XY Mode
The XY button changes to a YT button when XY mode is active.
3.3.9 Slider
The slider allows scrolling through the sampled data.

Document Reference No.: ES_000095 EasyScopeIII for DS60M10 User Guide
Rev 1.1 Clearance No.: ES #049
©2012 EasySync Ltd. 26
3.3.10 FFT Display
3.3.10.1 FFT Overview
A Fast Fourier Transform (FFT) window may be accessed by clicking the FFT Display button.
The FFT window will appear as shown in the figure below.
Figure 3.3 – FFT Window
There are two pairs of cursors which may be used to measure differences in frequency. To the top of the cursors are the labels ChA C1, ChA C2 for channel A and ChB C1 and ChB C2 for channel B on the chart. To move a cursor, place the mouse pointer over the cursor you wish to move, and holding down the left mouse button drag the cursor to the point you wish to measure. Channels along with their cursors can be made active or inactive by clicking on the ChA and ChB buttons.
The value of the spectrum at the cursors' position will be updated every time the cursors move.

Document Reference No.: ES_000095 EasyScopeIII for DS60M10 User Guide
Rev 1.1 Clearance No.: ES #049
©2012 EasySync Ltd. 27
To move the cursors, select the Cursor tab and select the corresponding cursor. Please refer to the figure below.
The coloured panel on the button is illuminated when the channel is active.
When the zoom function or zero padding option is active, the scroll bar at the bottom of the plot area may be used to scan through the FFT data.
The zoom function is active for 3 values. The options are as follows:
First Zoom In: 50% of original scale.
First Zoom In: 25% of original scale.
First Zoom In: 12.5% of original scale.
3.3.10.2 Man
Clicking the "Man" button in the FFT window enables the up/down buttons and changes the button caption to "Auto". This allows the vertical scale of the plot to be changed manually.
Clicking on "Auto" will enable auto scaling for the vertical axis.
When manual mode is active, the initial scale for the Y-axis is 50 as shown in the figure below.
This value is incremented by 100, every time the up arrow is pressed, so that the y-axis scale is set to the value in the spin box.

Document Reference No.: ES_000095 EasyScopeIII for DS60M10 User Guide
Rev 1.1 Clearance No.: ES #049
©2012 EasySync Ltd. 28
3.3.10.3 Averaging
The averaging option may be used to help eliminate noise from measurements. The averaging options available are off, 5, 10, 20 and 50 sweeps.
3.3.10.4 Zero Pad
Zero padding may be used to artificially increase the number of data points included in the FFT. The default is no zero padding and using the 1024 points obtained from the data buffer. The FFT is always 1024 samples around the trigger point even if 2K, 4K or 8K buffer used.
Zero padding will allow the use of the standard 1K buffer or zero padded 2K, 4K, 8K or 16K data sets.
Increasing the zero padding has the effect of stretching the frequency axis which will allow more accurate measurement with the cursors.
3.3.10.5 File Menu
The File menu allows access to the two features described below
Save As
This allows the FFT screen to be saved as a Windows Bitmap (.bmp) file. When selected, a Save As dialog box appears and prompts the user for a filename.
The print option allows the user to send the FFT screen directly to an installed printer.
3.3.10.6 FFT Window Menu
The FFT screen display can be changed to use a number of different windowing algorithms. The available windows are displayed when the FFT Window menu is selected as shown in the figure below.
The default window is Rectangle.

Document Reference No.: ES_000095 EasyScopeIII for DS60M10 User Guide
Rev 1.1 Clearance No.: ES #049
©2012 EasySync Ltd. 29
Document Reference No.: ES_000095 EasyScopeIII for DS60M10 User Guide
Rev 1.1 Clearance No.: ES #049
©2012 EasySync Ltd. 30
Rectangle
Rectangle window function replaces all but N values of a data sequence by zeroes to appear as though the waveform suddenly turns on and off.
Bartlett
Similar to Triangular function but Bartlett window always ends with zeroes at sample 1 and n.
Blackman
The periodic Blackman window is constructed by extending the desired window length by one sample to N+1, constructing a symmetric window, and removing the last sample. The periodic version is the preferred method when using a Blackman window in spectral analysis because the discrete Fourier transform assumes periodic extension of the input vector.
Blackman-Harris
Blackman-Harris window function is a good general purpose window, having side lobe rejection in the high 90s dB and having moderately wide main lobe.
Hamming
Window is optimized to minimize the maximum side lobe, giving it a height of about one-fifth of the Hann window.
Hanning
Hannning window function is useful for noise measurements where better frequency resolution than some of the other windows is desired but moderate side lobes do not present a problem.
Parzen
Parzen window is an approach to estimate densities assuming that region is a dimensional hypercube.
Welch
An improvement of the standard periodogram spectrum estimating method, it reduces noise in the estimated power spectra in exchange of reducing the frequency resolution.
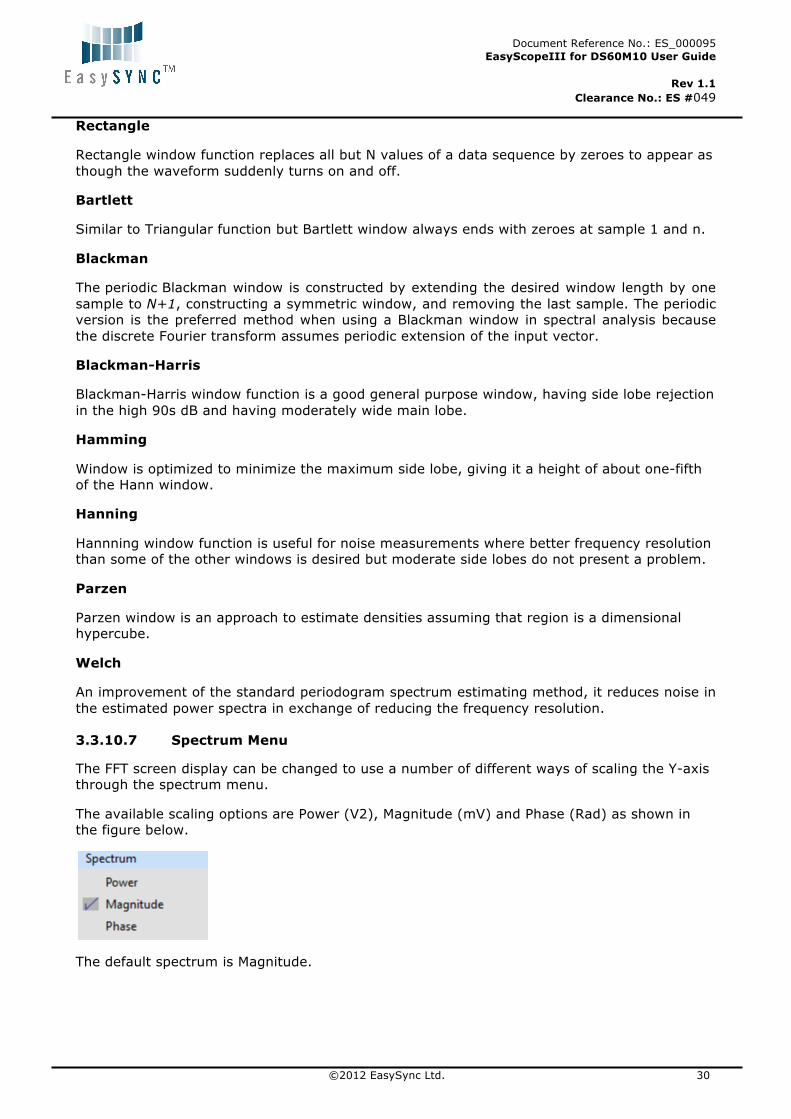
3.3.10.7 Spectrum Menu
The FFT screen display can be changed to use a number of different ways of scaling the Y-axis through the spectrum menu.
The available scaling options are Power (V2), Magnitude (mV) and Phase (Rad) as shown in the figure below.
The default spectrum is Magnitude.

Document Reference No.: ES_000095 EasyScopeIII for DS60M10 User Guide
Rev 1.1 Clearance No.: ES #049
©2012 EasySync Ltd. 31
3.3.11 Meter A and Meter B
The "Meter A" and "Meter B" buttons display small panels as shown below showing six measurements of the data displayed at that time for each channel. The available measurements are:
• Mean Voltage • True RMS Voltage • Peak to Peak Voltage • Minimum Voltage • Maximum Voltage • Frequency.
Document Reference No.: ES_000095 EasyScopeIII for DS60M10 User Guide
Rev 1.1 Clearance No.: ES #049
©2012 EasySync Ltd. 32
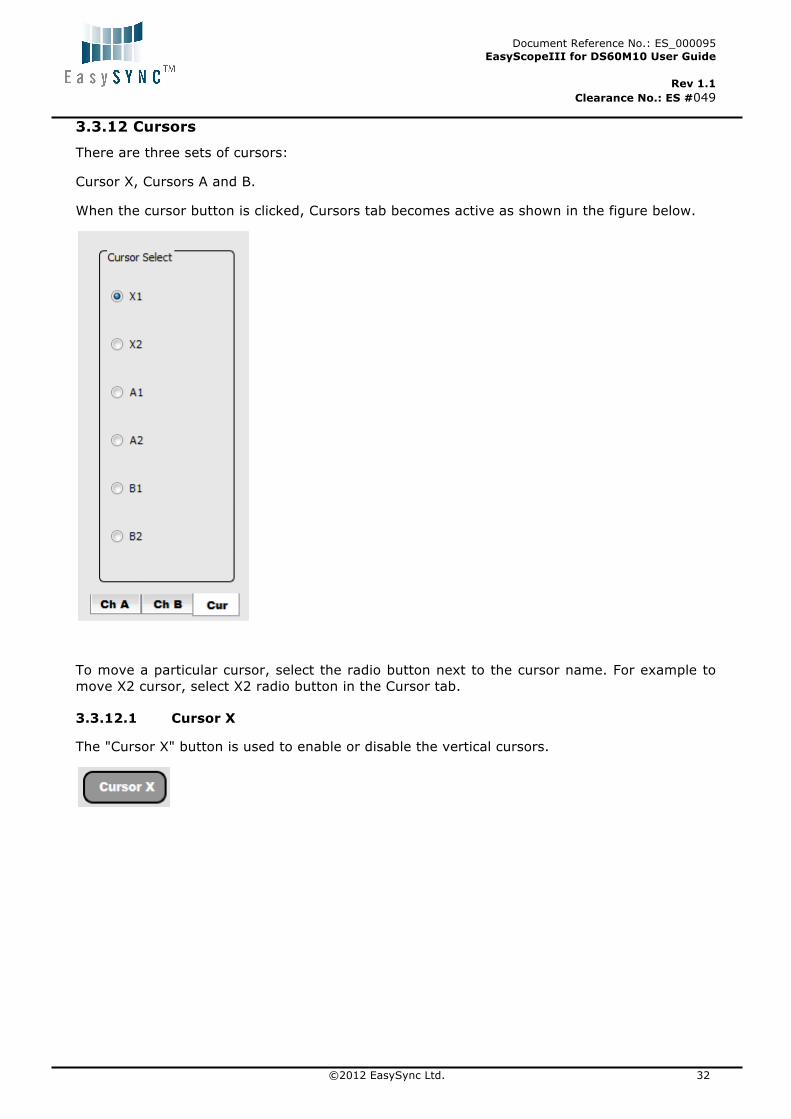
3.3.12 Cursors
There are three sets of cursors:
Cursor X, Cursors A and B.
When the cursor button is clicked, Cursors tab becomes active as shown in the figure below.
To move a particular cursor, select the radio button next to the cursor name. For example to move X2 cursor, select X2 radio button in the Cursor tab.
3.3.12.1 Cursor X
The "Cursor X" button is used to enable or disable the vertical cursors.

Document Reference No.: ES_000095 EasyScopeIII for DS60M10 User Guide
Rev 1.1 Clearance No.: ES #049
©2012 EasySync Ltd. 33
The vertical cursors may be used to measure the duration of a section of a waveform as shown in the figure below.
The cursor label values are updated in the box below the oscilloscope grid as shown in the figure below.
3.3.12.2 Cursor A and Cursor B
The "Cursor A" and "Cursor B" buttons are used to enable or disable the horizontal cursors.
Important: Cursor A (A1, A2) must only be used to measure channel A and cursor B (B1, B2) must only be used to measure channel B. Mixing up the cursors will cause incorrect values to be displayed.

Document Reference No.: ES_000095 EasyScopeIII for DS60M10 User Guide
Rev 1.1 Clearance No.: ES #049
©2012 EasySync Ltd. 34
The horizontal cursors can be used to measure the voltage difference between two points of a trace as shown in the figure below.
The values of the cursor positions are displayed at the bottom of the plot area (as shown below), along with the difference between them.
3.3.13 Auto Set
Clicking the "Auto Set" button will launch the auto set function.
The auto set function attempts to home in on a signal and display it clearly on the plot area by optimising the time base and gain settings for the detected signal. If no signal is detected, the auto set function will terminate.
Document Reference No.: ES_000095 EasyScopeIII for DS60M10 User Guide
Rev 1.1 Clearance No.: ES #049
©2012 EasySync Ltd. 35
3.4 Menu Functions
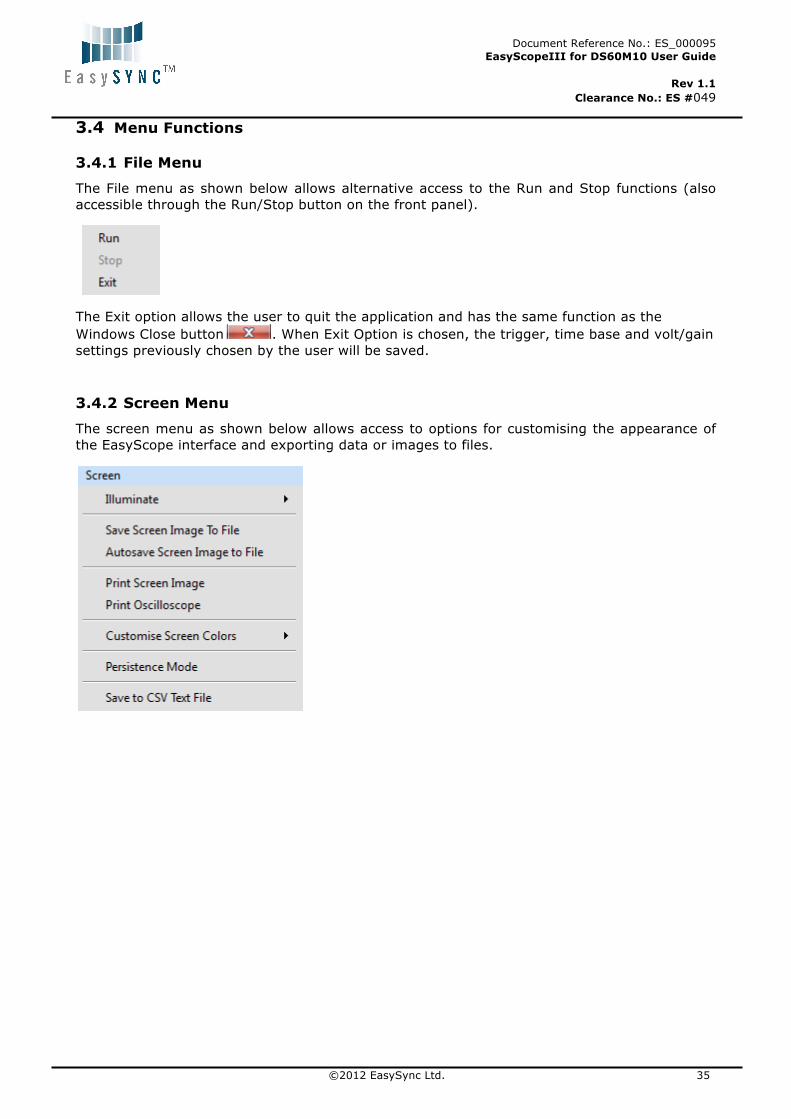
3.4.1 File Menu
The File menu as shown below allows alternative access to the Run and Stop functions (also accessible through the Run/Stop button on the front panel).
The Exit option allows the user to quit the application and has the same function as the Windows Close button . When Exit Option is chosen, the trigger, time base and volt/gain settings previously chosen by the user will be saved.
3.4.2 Screen Menu
The screen menu as shown below allows access to options for customising the appearance of the EasyScope interface and exporting data or images to files.

Document Reference No.: ES_000095 EasyScopeIII for DS60M10 User Guide
Rev 1.1 Clearance No.: ES #049
©2012 EasySync Ltd. 36
The menu items have the following functions:
Illuminate
The illuminate option controls the brightness of the grid on the scope display.
With the grid illuminated, it is a bright green colour as shown in the figure below.
When the grid is not illuminated, it is a dark green.

Document Reference No.: ES_000095 EasyScopeIII for DS60M10 User Guide
Rev 1.1 Clearance No.: ES #049
©2012 EasySync Ltd. 37
When the grid is dim, it is barely visible.
Although the gird colour can be changed, the illumination only works with the default colour (green).
Save Screen Image to File
This allows the plot area to be saved to a Windows Bitmap (.bmp) file. A Save As dialog box appears and prompts the user to provide a filename for the image.
AutoSave Screen Image to File
This feature works like a data buffer to record events. Sample rate is 6 screens/second.
The recording of images takes place for 10 secs for a total of 60 saved screens.
The images are saved in a new folder created as “Autosaved Images” in the folder "My Documents\EasyScopeIII".
Print Screen Image
Sends the plot area of the EasyScope window to the printer.
Allows configuration of a printer that is already installed. Options include Page Range and Number of copies.
Print Oscilloscope
Send the whole EasyScope window image to the printer.
Allows configuration of a printer that is already installed. Options include Page Range and Number of copies.

Document Reference No.: ES_000095 EasyScopeIII for DS60M10 User Guide
Rev 1.1 Clearance No.: ES #049
©2012 EasySync Ltd. 38
Customise Screen Colours
This brings up a sub-menu as shown below that allows full customisation of the grid and backgrounds used. Colours can be reset to the original scheme by selecting "Restore Default Colours".
Persistence Mode
Persistence mode superimposes multiple waveforms on the same view, with newer waveforms as shown below.
This is useful for spotting glitches and to measure jitter, when you need to see a rare fault event hidden in a series of repeated normal events.
The persistence mode display can be turned On/Off using this option. The ‘persistence value’ is 127 and it cannot be configured.
Save To CSV Text File
This option exports the most recent oscilloscope traces to a comma separated values (.csv) file. Column A contains the most recent trace for Channel A while column B contains the most

Document Reference No.: ES_000095 EasyScopeIII for DS60M10 User Guide
Rev 1.1 Clearance No.: ES #049
©2012 EasySync Ltd. 39
recent trace for Channel B. The values which will be saved are the raw ADC values within the scale from 0 to 1023.
3.4.3 Tools Menu
The Tools Menu is shown below.
FFT Display
The FFT Display Option has the same function as the FFT Button.
Test Mode
In test mode the EasyScope does not acquire real data but provides simulated data from a counter. This allows the communication with the PC to be verified. The display observed in test mode should always be a saw tooth type. The wave is at a frequency of 30MHz.
Test mode must be disabled to acquire real data.
Math Functions
The Math Function menu has three options as shown in the figure below.

Document Reference No.: ES_000095 EasyScopeIII for DS60M10 User Guide
Rev 1.1 Clearance No.: ES #049
©2012 EasySync Ltd. 40
A + B
This function adds the values of Channels A and B and displays the result waveform as a sum of these two waveforms.
A - B
This Function subtracts the values of Channels B from Channel A and displays the result as a difference of these two waveforms.
A x B
This function multiplies the values of Channels A and B and displays the result waveform as a product of these two waveforms.
Important: Each of the resulting signals (A + B, A - B, A x B) has a corresponding volts/div value. This value is displayed below the volts/div values for channel A and channel B.
3.4.4 Display Options
The Display Options becomes active after the Scope is stopped. There are two options as shown below.
Zoom In
The plot area has the option to be zoomed in twice.
First time Zoom In: 50% of the original scale.
Second time Zoom In: 25% of the original scale.
Zoom Out
The plot area has the option to be zoomed out twice.
3.4.5 Help Menu
The following options are available through the Help menu as shown in the figure below.

Document Reference No.: ES_000095 EasyScopeIII for DS60M10 User Guide
Rev 1.1 Clearance No.: ES #049
©2012 EasySync Ltd. 41
3.4.5.1 HTML Help
Selecting HTML Help from the menu will launch this help file.
3.4.5.2 About
The About option displays version information and release dates.
3.4.5.3 USB-Instruments Web Site
This will connect to the Internet and take the user directly to the EasySync USB Instruments web site where information can be found on products and updates.
3.5 Error Messages
3.5.1 Please Connect DS60M10 HS Scope
This error occurs if no hardware is connected to the PC when EasyScopeIII starts or when the refreshing button is clicked.
This error is resolved when the hardware is connected to the PC.
3.5.2 For XY Mode, both Channel A and B should be on
This error occurs when only one channel is active, when XY mode is selected.
This error is resolved when both channels are active when XY button is pressed.

Document Reference No.: ES_000095 EasyScopeIII for DS60M10 User Guide
Rev 1.1 Clearance No.: ES #049
©2012 EasySync Ltd. 42
3.5.3 Please run scope first
This error occurs when Auto Set button is clicked, without running the scope first.
This error is resolved when the Run button is clicked before the Auto Set button.
3.5.4 Cannot start scope
This error occurs when the Run button or Single button is clicked without any hardware connected to the PC.
This error is resolved when the hardware is connected to the PC.

Document Reference No.: ES_000095 EasyScopeIII for DS60M10 User Guide
Rev 1.1 Clearance No.: ES #049
©2012 EasySync Ltd. 43
4 Logger Mode
To switch between Scope Mode and Data Logger Mode, select the Mode Menu
4.1 Overview The data logger has a simple layout with easy to use controls. The main controls and features are highlighted below. A full explanation of each feature is provided in the sections that follow.
Figure 4.1 – Data Logger Mode GUI
Document Reference No.: ES_000095 EasyScopeIII for DS60M10 User Guide
Rev 1.1 Clearance No.: ES #049
©2012 EasySync Ltd. 44
4.2 Features
• Attractive, easy to use visual display
• Input saturation ranges from 0.1 V to 20 V
• 2 logging channels
• Integrated switch to halt data capture through hardware
• User-defined sampling rate
• Save screens to Windows BMP files
• Export data to CSV file
• Load saved traces for display
• Screen printout facility
• Memo functions to comment data
• AC/DC coupling support
• Support for x1 and x10 probes
• User-defined display colour themes
Document Reference No.: ES_000095 EasyScopeIII for DS60M10 User Guide
Rev 1.1 Clearance No.: ES #049
©2012 EasySync Ltd. 45
4.3 Front Panel Functions
4.3.1 Start Button
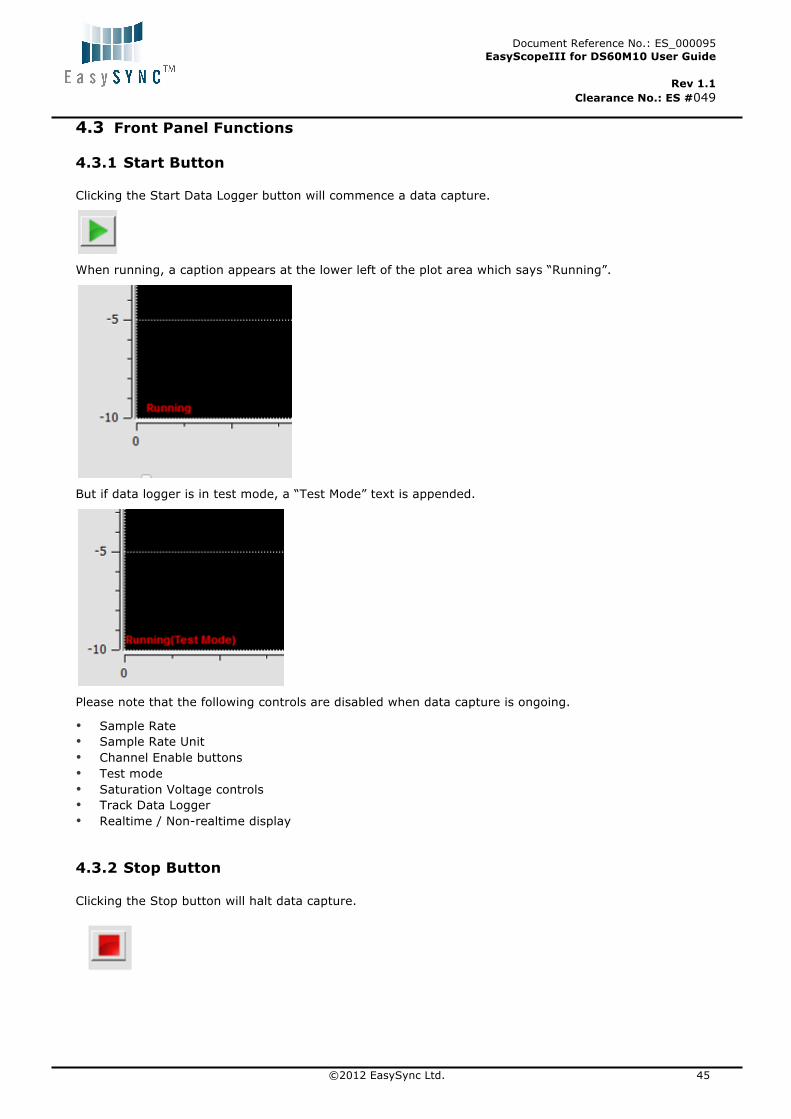
Clicking the Start Data Logger button will commence a data capture.
When running, a caption appears at the lower left of the plot area which says “Running”.
But if data logger is in test mode, a “Test Mode” text is appended.
Please note that the following controls are disabled when data capture is ongoing.
• Sample Rate • Sample Rate Unit • Channel Enable buttons • Test mode • Saturation Voltage controls • Track Data Logger • Realtime / Non-realtime display
4.3.2 Stop Button
Clicking the Stop button will halt data capture.
Document Reference No.: ES_000095 EasyScopeIII for DS60M10 User Guide
Rev 1.1 Clearance No.: ES #049
©2012 EasySync Ltd. 46
When stopped, a caption appears on the lower left of the plot area which says “Stopped”.
Also, the disabled controls (as stated in "Start Button") will be re-enabled.
4.3.3 Sample Interval
Use the Sample Interval control to specify the logging rate.
This must be set before starting data capture. This will be disabled when data logger is in running mode and will be re-enabled after stopping.
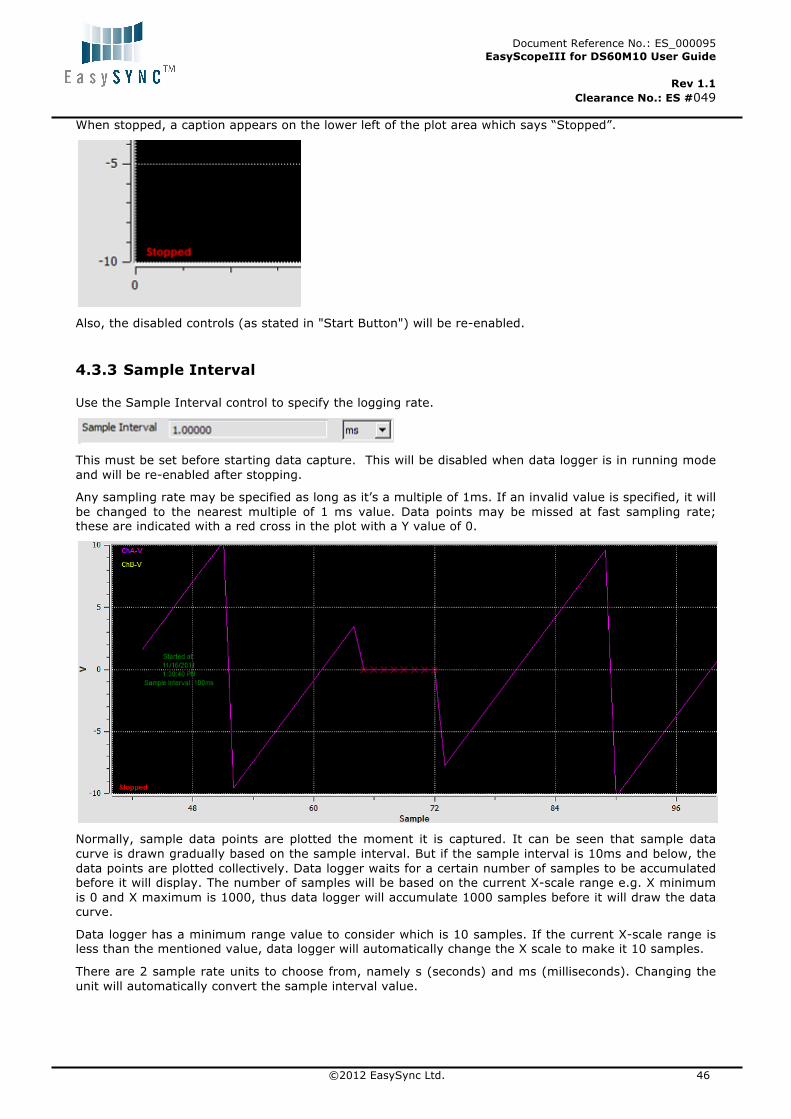
Any sampling rate may be specified as long as it’s a multiple of 1ms. If an invalid value is specified, it will be changed to the nearest multiple of 1 ms value. Data points may be missed at fast sampling rate; these are indicated with a red cross in the plot with a Y value of 0.
Normally, sample data points are plotted the moment it is captured. It can be seen that sample data curve is drawn gradually based on the sample interval. But if the sample interval is 10ms and below, the data points are plotted collectively. Data logger waits for a certain number of samples to be accumulated before it will display. The number of samples will be based on the current X-scale range e.g. X minimum is 0 and X maximum is 1000, thus data logger will accumulate 1000 samples before it will draw the data curve.
Data logger has a minimum range value to consider which is 10 samples. If the current X-scale range is less than the mentioned value, data logger will automatically change the X scale to make it 10 samples.
There are 2 sample rate units to choose from, namely s (seconds) and ms (milliseconds). Changing the unit will automatically convert the sample interval value.

Document Reference No.: ES_000095 EasyScopeIII for DS60M10 User Guide
Rev 1.1 Clearance No.: ES #049
©2012 EasySync Ltd. 47
4.3.4 Channel Enable buttons
The channel enable buttons can be used to enable or disable a logging channel. When enabled, the channel enable buttons have the same colour as the channel trace.
Otherwise, they are greyed out.
These buttons are disabled when data logger is in running mode.
4.3.5 Slide bar
The slide bar allows scrolling through the logged data.
The plot area is updated as the scroll bar is moved. If tracking is enabled, the slide bar is disabled. The slide bar can be operated by dragging the handle or by clicking on it.
4.3.6 Scale Panel
The scale panel indicates the area of the chart currently visible. The default values before logging are shown below.
The values are updated when scaling values are updated.

Document Reference No.: ES_000095 EasyScopeIII for DS60M10 User Guide
Rev 1.1 Clearance No.: ES #049
©2012 EasySync Ltd. 48
4.4 Toolbar Buttons
4.4.1 Open Chart
Clicking the Open Chart button will display an open dialog box.
The user can then browse a CSV file (*.csv) which can be imported back into the data logger for viewing. If there are memo markers accompanying the sample data, it will also be shown in the chart.
When a file is opened, the sample rate and sample rate unit will be updated based on the value in the CSV file. Also Clear Screen option is disabled.
4.4.2 Save Chart
Clicking the Save Chart button will display a save dialog box that allows the user to save the current data chart in CSV format. After saving, the filename will be listed in Window menu.
If there are memo markers in the chart, it will also be saved.
4.4.3 Print Chart Area
Clicking the Print Chart button prints the current plot area of the data logger.
The data printed can be changed by using the slide bar or zoom controls.
4.4.4 Copy Chart to Clipboard
Clicking the Copy Chart To Clipboard button places a copy of the current plot area on the Windows clipboard, thus it allows an image of the plot area to be pasted in a document of spreadsheet.
4.4.5 Zoom In/Out
The Zoom In and Zoom Out buttons allows the user to enlarge or reduce areas of the chart.
To zoom in, click the Zoom In button and then click on a location on the chart. This will reduce the number of samples to be displayed around the location (i.e. enlarging the area). To zoom out, click the Zoom Out button and then click on a location on the chart. This will increase the number of samples to be

Document Reference No.: ES_000095 EasyScopeIII for DS60M10 User Guide
Rev 1.1 Clearance No.: ES #049
©2012 EasySync Ltd. 49
displayed around the location, which allows users to see more of the graph. The minimum number of samples that can be displayed is 10. The maximum number of samples is determined by the user’s choice in the Settings Window.
4.4.6 Cursors Three cursors are available. They have different colours and names to allow them to be distinguished easily.
Data Cursor
The color of the Data Cursor is blue. Missed Sample Cursor
The color of the Missed Cursor is pink. Memo (Marker) Cursor
The color of the Memo Cursor is green.
Figure 4.2 – Data Logger Window with Cursors

Document Reference No.: ES_000095 EasyScopeIII for DS60M10 User Guide
Rev 1.1 Clearance No.: ES #049
©2012 EasySync Ltd. 50
When the user clicks on any of the cursor icons on the main toolbar, he/she may select whether the cursor is associated with channel A or channel B by selecting the desired channel from the pop-up menu (shown below). The memo cursor has another option to be associated with the memo markers on the plot. The popup menu will only be enabled if there is data in the plot.
If more than one cursor are turned on, the user can set a cursor to be active by choosing one of the three radio buttons on the top right side of the plot area. It is indicated by the red arrow in the screenshot below.
The user can move each of the cursors by first setting it as the active cursor, then pressing down the left mouse button on the plot area and move the mouse cursor. The active cursor will follow the current mouse cursor’s movement and automatically sync to the samples on the curve. The x and y coordinates of each active cursor are displayed in the Cursor Panel at the bottom left of the main window.

Document Reference No.: ES_000095 EasyScopeIII for DS60M10 User Guide
Rev 1.1 Clearance No.: ES #049
©2012 EasySync Ltd. 51
The delta column can be made to display the differences in x and y between two of the cursors. Left click on the word "Delta" and the following menu will appear:
Selecting "Data - Missed", "Data - Memo" or "Missed - Memo" will display the differences between those cursors. The delta values can be turned off by selecting "Off". The following example shows the differences in x and y values between the Data and Memo cursors.
4.4.7 TestMode Waveform
Clicking the TestMode Waveform button activates the data logger test mode. This produces a saw-tooth waveform without any input to the device. The frequency of the waveform is 30 MHz.
Please note that input to the device will be ignored while running in a test mode.
4.4.8 Memo Window
Clicking the Memo Window button shows the Memo window.
This allows markers and information to be added to the chart.
4.4.9 Info Window
Clicking the Info Window shows the Info Window. It shows the information of the current chart.

Document Reference No.: ES_000095 EasyScopeIII for DS60M10 User Guide
Rev 1.1 Clearance No.: ES #049
©2012 EasySync Ltd. 52
4.4.10 X-Control Window
Clicking the X-Control Window button shows the X-Control Window. This allows the range and x scale to be changed.
4.4.11 Y-Control Window
Clicking the Y-Control Window button shows the Y-Control Window. This allows the range and y scale to be changed.
Document Reference No.: ES_000095 EasyScopeIII for DS60M10 User Guide
Rev 1.1 Clearance No.: ES #049
©2012 EasySync Ltd. 53
4.5 Sub Panel Functions
4.5.1 Memo Window
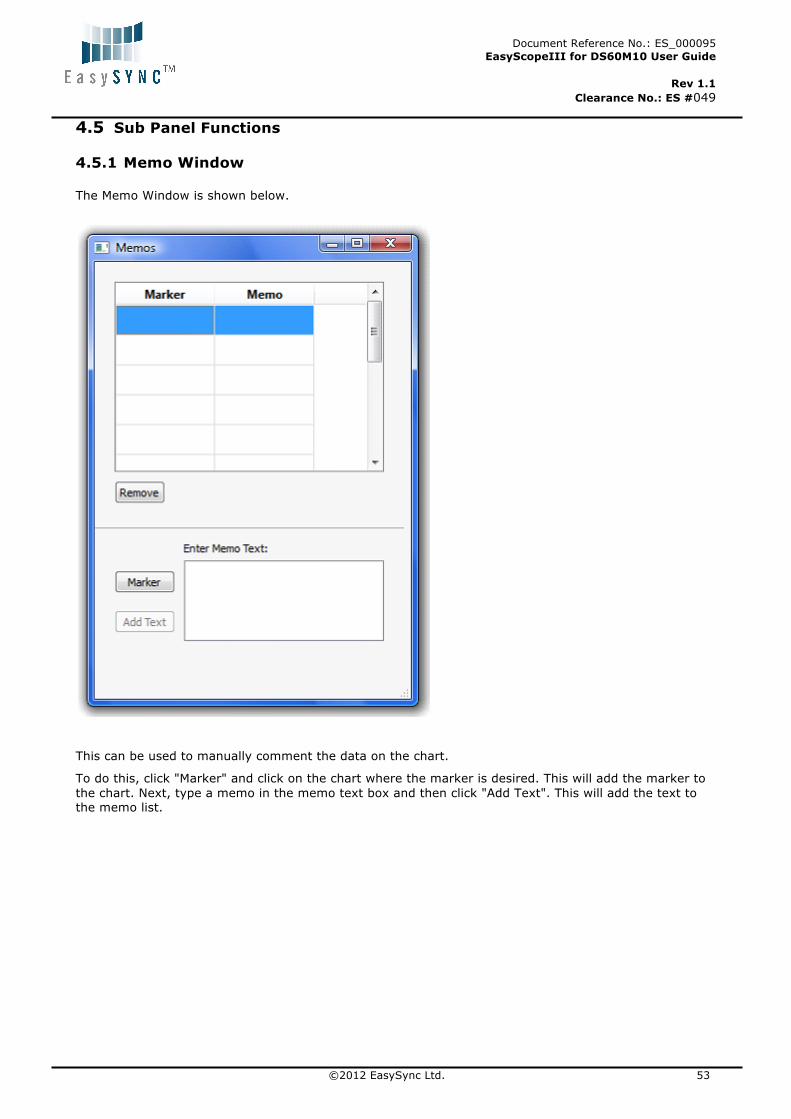
The Memo Window is shown below.
This can be used to manually comment the data on the chart.
To do this, click "Marker" and click on the chart where the marker is desired. This will add the marker to the chart. Next, type a memo in the memo text box and then click "Add Text". This will add the text to the memo list.

Document Reference No.: ES_000095 EasyScopeIII for DS60M10 User Guide
Rev 1.1 Clearance No.: ES #049
©2012 EasySync Ltd. 54
The screenshot below gives an example when a marker called “My Marker” is inserted into the plot area.
This process may be repeated to add multiple markers to the chart. The markers appear as yellow diamonds with red border. The memo cursor can be used to keep track of the exact location of the markers on the plot area.
To remove markers, simply select the marker from the list in the Memo Window and click "Remove".
4.5.2 Info Window
The Info Window contains the general data for the current chart such as the start date, start time, sample interval value. Also the following channel information is shown:
• Current number of samples • Maximum voltage value (in mV) • Minimum voltage value (in mV) • Current number of missed samples

Document Reference No.: ES_000095 EasyScopeIII for DS60M10 User Guide
Rev 1.1 Clearance No.: ES #049
©2012 EasySync Ltd. 55
If data logger is capturing data, the information displayed in this window is kept on updating.
4.5.3 X-Control Window
The X-Control Window allows the user to manually control the X-axis scale.
Clicking on Time or Samples tab allows the user to change the unit of the X-axis. For Time domain, the values are in seconds. Alternatively, the user can click on the X-axis labels to change the unit of the X-axis. The X-axis label is located on the lower right of the plot area.

Document Reference No.: ES_000095 EasyScopeIII for DS60M10 User Guide
Rev 1.1 Clearance No.: ES #049
©2012 EasySync Ltd. 56
Only positive values can be inputted for the minimum and maximum X scale. Any invalid value will revert back to the previous value.
Any changes in the X-Control Window will only take effect once Apply button is clicked.
4.5.4 Y-Control Window
The Y-Control window (shown below) allows the chart Y-scale to be customised.
The window is divided into three sections. Each is described below:
Y-Scale
This allows the range of the Y scale to be manually adjusted. Simply enter the desired maximum and minimum values in the text boxes and click "Apply" to change the scale.
Y-Scale Parameter
This allows the units of the Y-axis to be changed. Volts (V) and milli-Volts (mV) are provided by default, but custom units may be created by clicking the "New" button and filling in the form below. Click "OK" to add the new units to the list of available units.
Custom units can be removed from the list by selecting them from the combo box and then clicking "Remove".

Document Reference No.: ES_000095 EasyScopeIII for DS60M10 User Guide
Rev 1.1 Clearance No.: ES #049
©2012 EasySync Ltd. 57
Saturation Voltage (V)
This panel provides control over the ADC saturation Voltage limit and coupling for channel A and channel B. In addition, activating the "X10" checkbox will re-scale for a X10 probe. Channel A or channel B can be configured by selecting the appropriate tab from the right hand edge of the Saturation Voltage panel.
4.6 Menu Functions
4.6.1 File Menu
The File menu provides an alternative access to functions available in the main toolbar.
Load
This provides the same functionality as the Open Chart button from the main toolbar. An open dialog box is shown to allow user to select a CSV file to be loaded.
Save
This provides the same functionality as the Save Chart button from the main toolbar. A save dialog box is shown to allow users to save the current data to a CSV file (*.csv) or to a Bitmap file (*.bmp).
Close
The Close option clears the plot area. The chart is no longer selectable from Window menu and Clear Screen option is re-enabled.
Print Chart Area
This provides the same functionality as the Print Chart Area from the main toolbar.
Print Data Logger
This option sends the whole data logger panel image to the printer rather than just the plot area. This can provide a useful record of the data logger settings used to acquire the trace.
Restore Backup
Selecting Restore Backup will load data from the previous run if “Backup Data on Exit” is enabled in the Settings options of the Edit menu. If “Backup Data on Exit” is disabled, the option will be greyed out.
Exit
The Exit option allows the user to quit the application. This has the same function as the Windows Close button.
Document Reference No.: ES_000095 EasyScopeIII for DS60M10 User Guide
Rev 1.1 Clearance No.: ES #049
©2012 EasySync Ltd. 58
Upon exiting, some settings are saved in a configuration file. The saved settings will be used when the application is loaded again.
4.6.2 Run Menu
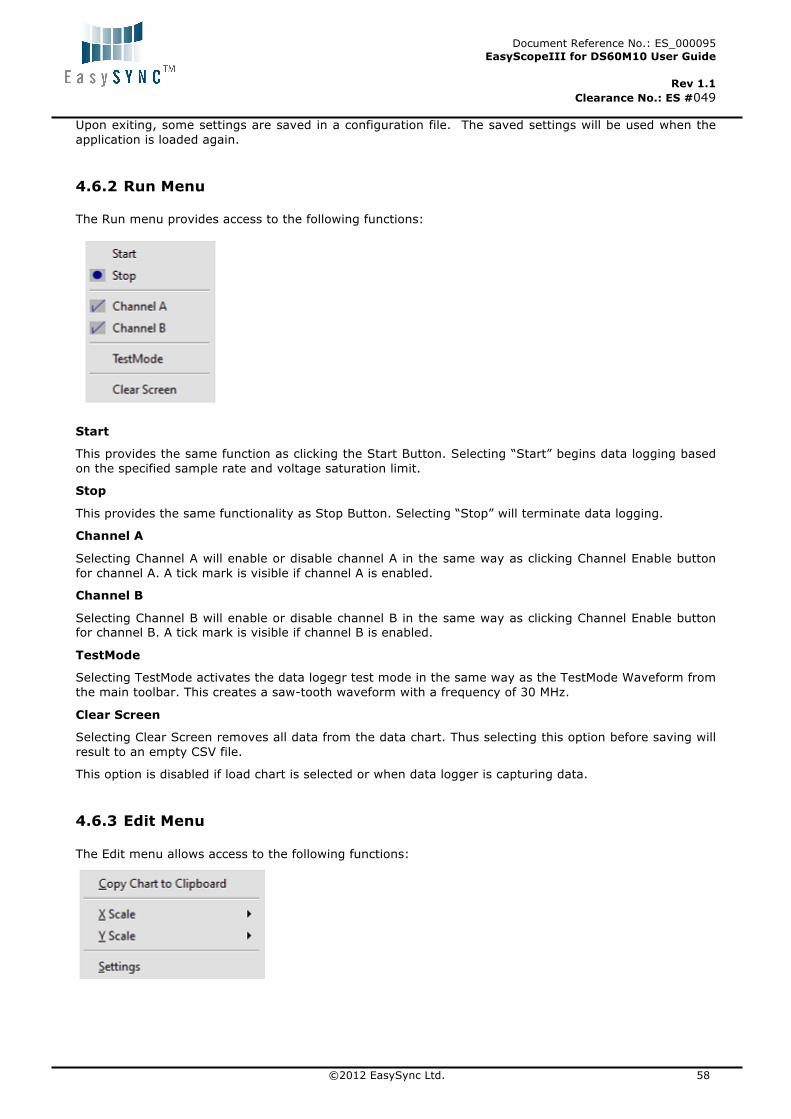
The Run menu provides access to the following functions:
Start
This provides the same function as clicking the Start Button. Selecting “Start” begins data logging based on the specified sample rate and voltage saturation limit.
Stop
This provides the same functionality as Stop Button. Selecting “Stop” will terminate data logging.
Channel A
Selecting Channel A will enable or disable channel A in the same way as clicking Channel Enable button for channel A. A tick mark is visible if channel A is enabled.
Channel B
Selecting Channel B will enable or disable channel B in the same way as clicking Channel Enable button for channel B. A tick mark is visible if channel B is enabled.
TestMode
Selecting TestMode activates the data logegr test mode in the same way as the TestMode Waveform from the main toolbar. This creates a saw-tooth waveform with a frequency of 30 MHz.
Clear Screen
Selecting Clear Screen removes all data from the data chart. Thus selecting this option before saving will result to an empty CSV file.
This option is disabled if load chart is selected or when data logger is capturing data.
4.6.3 Edit Menu
The Edit menu allows access to the following functions:

Document Reference No.: ES_000095 EasyScopeIII for DS60M10 User Guide
Rev 1.1 Clearance No.: ES #049
©2012 EasySync Ltd. 59
Copy Chart to Clipboard
This option provides the same functionality as the Copy Chart to Clipboard button from the main toolbar. This copies an image of the plot area to the Windows clipboard for pasting into documents or spreadsheets.
X Scale
Selecting X Scale displays the following sub-menu.
This allows the user to change the X-axis unit between time and sample number. The unit of the X-axis can also be changed through X-Control Window or by clicking on the axis label located on lower right of the plot area.
Y Scale
Selecting Y Scale displays the following sub-menu.
This allows the user to change the Y-axis unit to V (Volts), mv (millivolts) and custom units. The unit of the Y-axis can also be changed through the Y-Control Window or by clicking on the axis label located on the upper left of the plot area.
Custom units can be added through the Y-Control Window.
The current Y-axis unit is displayed in the upper left of the plot area. It is shown after the channel name. Please refer to the figure below.
Document Reference No.: ES_000095 EasyScopeIII for DS60M10 User Guide
Rev 1.1 Clearance No.: ES #049
©2012 EasySync Ltd. 60
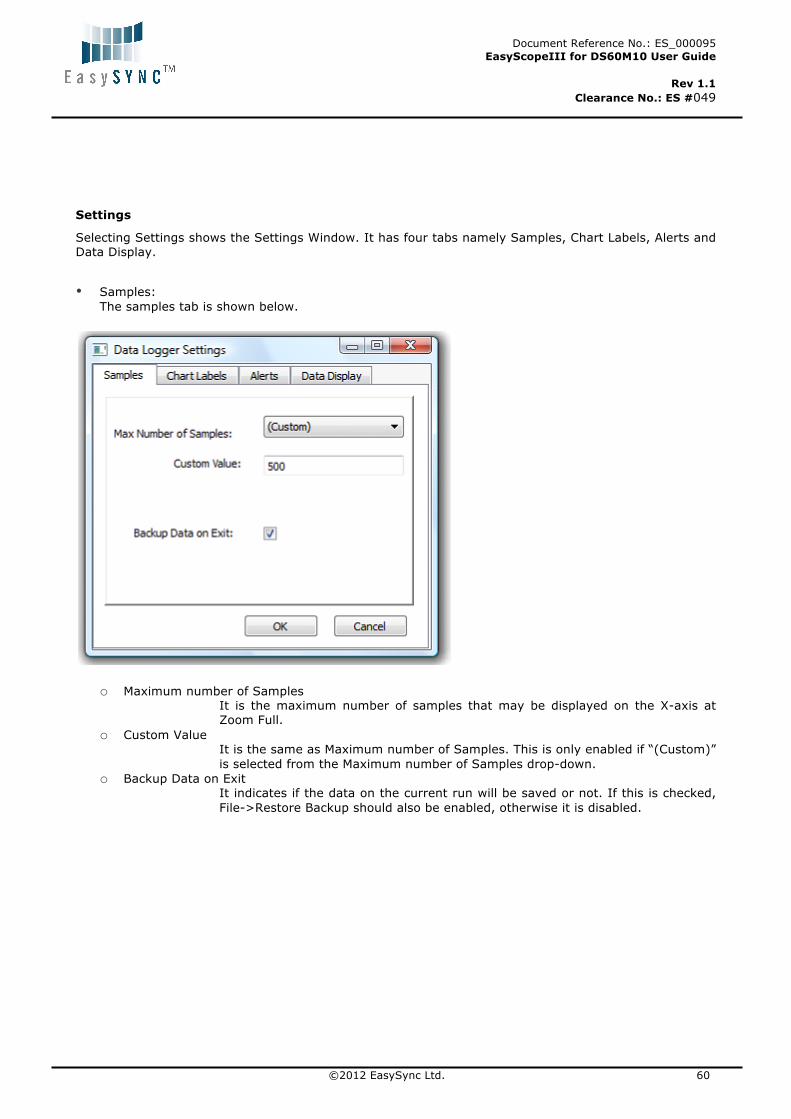
Settings
Selecting Settings shows the Settings Window. It has four tabs namely Samples, Chart Labels, Alerts and Data Display.
• Samples:
The samples tab is shown below.
o Maximum number of Samples It is the maximum number of samples that may be displayed on the X-axis at Zoom Full.
o Custom Value It is the same as Maximum number of Samples. This is only enabled if “(Custom)” is selected from the Maximum number of Samples drop-down.
o Backup Data on Exit It indicates if the data on the current run will be saved or not. If this is checked, File->Restore Backup should also be enabled, otherwise it is disabled.

Document Reference No.: ES_000095 EasyScopeIII for DS60M10 User Guide
Rev 1.1 Clearance No.: ES #049
©2012 EasySync Ltd. 61
• Chart Labels: The chart labels tab is shown below.
This allows customization of which text labels are visible on the plot area at the start and stop markers. Checking the “Display on Chart” option for memos shows memos on the plot area.
Document Reference No.: ES_000095 EasyScopeIII for DS60M10 User Guide
Rev 1.1 Clearance No.: ES #049
©2012 EasySync Ltd. 62
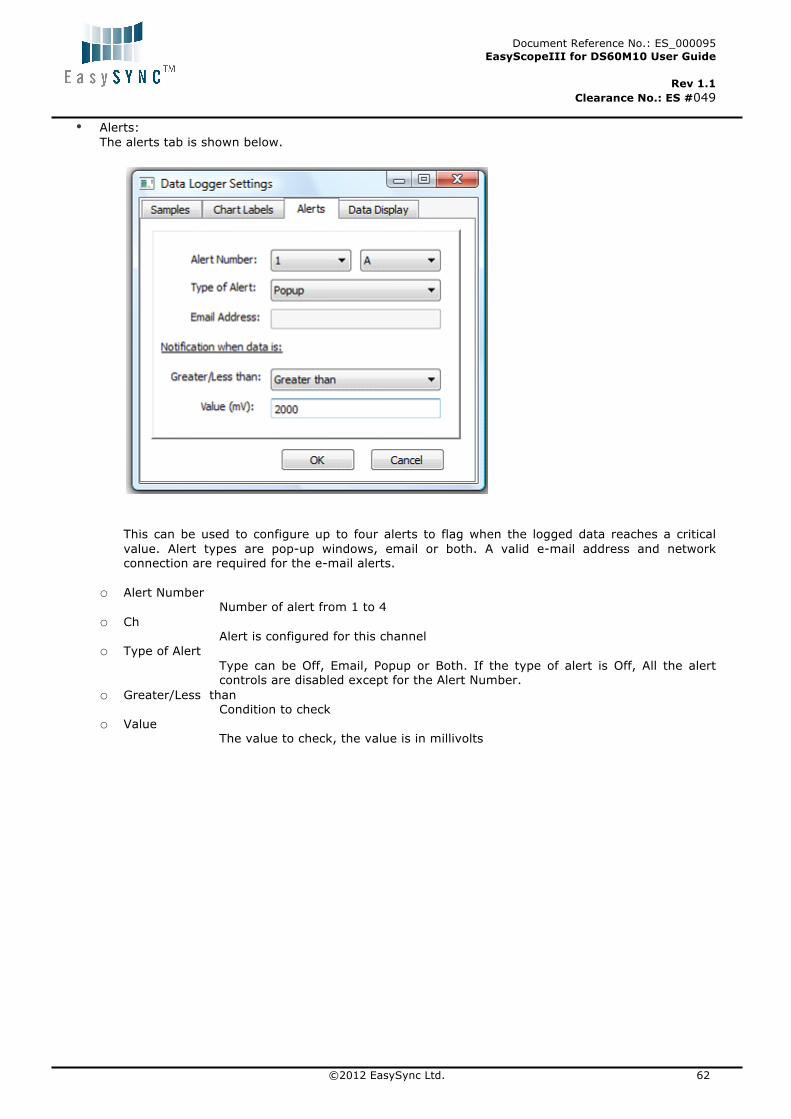
• Alerts: The alerts tab is shown below.
This can be used to configure up to four alerts to flag when the logged data reaches a critical value. Alert types are pop-up windows, email or both. A valid e-mail address and network connection are required for the e-mail alerts.
o Alert Number Number of alert from 1 to 4
o Ch Alert is configured for this channel
o Type of Alert Type can be Off, Email, Popup or Both. If the type of alert is Off, All the alert controls are disabled except for the Alert Number.
o Greater/Less than Condition to check
o Value The value to check, the value is in millivolts

Document Reference No.: ES_000095 EasyScopeIII for DS60M10 User Guide
Rev 1.1 Clearance No.: ES #049
©2012 EasySync Ltd. 63
• Data Display: The Data Display tab is shown below.
This controls whether the logged data will be displayed in the plot area as it is captured or not. Selecting Non-realtime Display allows faster logging since the overhead of plotting the data points on the plot area is eliminated. When data logging is stopped, the data points will be drawn in the plot area based on the current x-axis scale.

Document Reference No.: ES_000095 EasyScopeIII for DS60M10 User Guide
Rev 1.1 Clearance No.: ES #049
©2012 EasySync Ltd. 64
For Non-realtime Display, the current number of data points captured is display.
4.6.4 View Menu
The View menu allows the user to change the appearance of the data logger.

Document Reference No.: ES_000095 EasyScopeIII for DS60M10 User Guide
Rev 1.1 Clearance No.: ES #049
©2012 EasySync Ltd. 65
Customise Screen Colours
Selecting Customise Screen Colours shows the following sub-menu:
Selecting any of the options allows the user to select a new colour for the selected item. Selecting “Restore Defaults” resets all colour settings to the original colours. Below are the default colours:
• Background – black • Grid – green • ChA Trace -‐ yellow • ChB Trace -‐ red
ChA Trace
This allows channel A trace to be made visible or invisible. This option does not affect if data is logged or not. To enable or disable logging on channel A, use Channel Enable Button on the front panel or toggle Channel A from the Run menu.
ChB Trace
This allows channel B trace to be made visible or invisible. This option does not affect if data is logged or not. To enable or disable logging on channel B, use Channel Enable Button on the front panel or toggle Channel B from the Run menu.
Text Labels
This allows the text labels to be visible or invisible. This will toggle whether the start and stop marker text labels are shown in the chart area or not.
Track Data Logger
Selecting Track Data Logger will check or uncheck the tracking option. This will toggle whether the chart updates constantly to show the newly acquired data or allow the display to remain static.
If this option is enabled, the Slide bar is disabled and the application will automatically update the Slide bar value. Otherwise if this option is disabled, the Slide bar is enabled to allow the user to show any part of the chart.
If this option is enabled, the user cannot modify the X scale values through the X-Control Window. All the controls in this window are disabled except for Close and tab navigation.
Grid
This allows the grid lines to be visible or invisible.
Zoom
Selecting Zoom from the menu displays the following sub-menu.
In and Out options provide the same function as Zoom In and Zoom Out buttons from the main toolbar. Alternatively, the user can use the shortcut keys for each option.
Document Reference No.: ES_000095 EasyScopeIII for DS60M10 User Guide
Rev 1.1 Clearance No.: ES #049
©2012 EasySync Ltd. 66
The Full option scales the scales the X-axis to display the number of data points specified in Max Samples of the Settings section of the Edit menu.
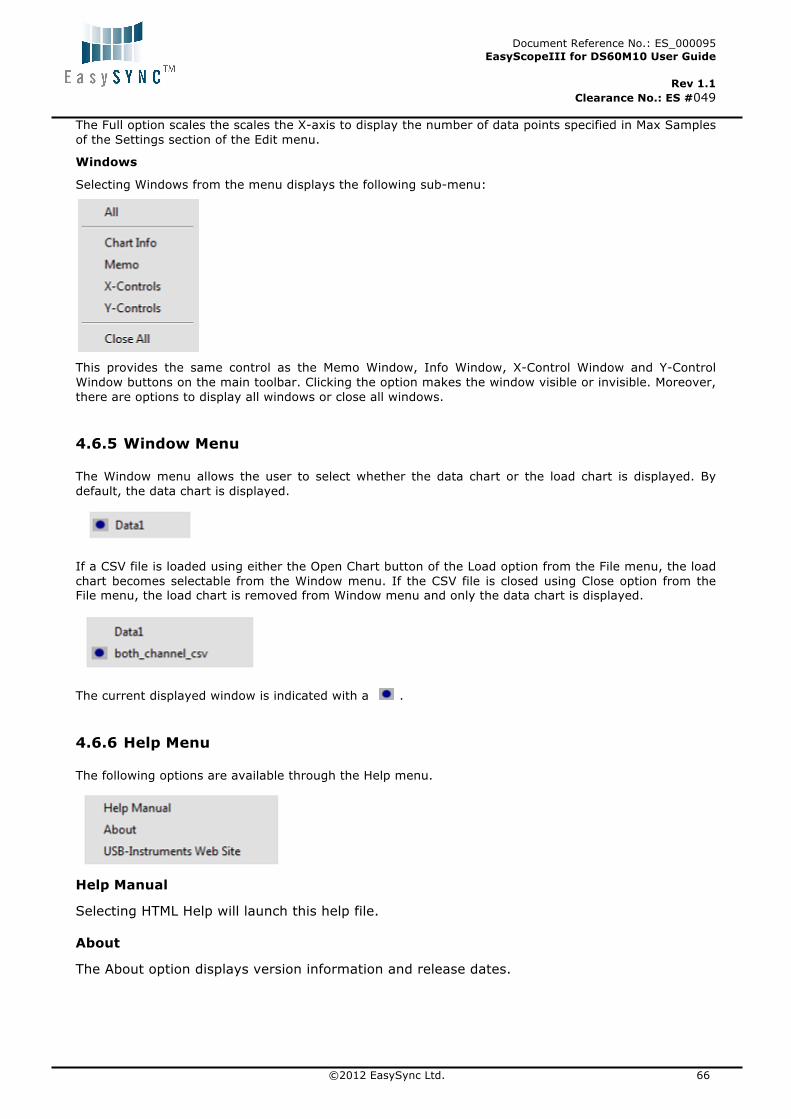
Windows
Selecting Windows from the menu displays the following sub-menu:
This provides the same control as the Memo Window, Info Window, X-Control Window and Y-Control Window buttons on the main toolbar. Clicking the option makes the window visible or invisible. Moreover, there are options to display all windows or close all windows.
4.6.5 Window Menu
The Window menu allows the user to select whether the data chart or the load chart is displayed. By default, the data chart is displayed.
If a CSV file is loaded using either the Open Chart button of the Load option from the File menu, the load chart becomes selectable from the Window menu. If the CSV file is closed using Close option from the File menu, the load chart is removed from Window menu and only the data chart is displayed.
The current displayed window is indicated with a .
4.6.6 Help Menu
The following options are available through the Help menu.
Help Manual
Selecting HTML Help will launch this help file.
About
The About option displays version information and release dates.

Document Reference No.: ES_000095 EasyScopeIII for DS60M10 User Guide
Rev 1.1 Clearance No.: ES #049
©2012 EasySync Ltd. 67
USB-Instruments Web Site
This will connect to the Internet and take the user directly to the EasySync USB Instruments web site where information can be found on products and updates.
4.6.7 Mode Menu
The Mode menu allows the user to change the mode from data logger to scope mode. If the mode is changed to scope, the current settings are saved and will be retrieved once data logger mode is chosen.

Document Reference No.: ES_000095 EasyScopeIII for DS60M10 User Guide
Rev 1.1 Clearance No.: ES #049
©2012 EasySync Ltd. 68
Technical Support
Technical support may be obtained from your nearest EasySync office:
United Kingdom: [email protected]
United States: [email protected]
Document Reference No.: ES_000095 EasyScopeIII for DS60M10 User Guide
Rev 1.1 Clearance No.: ES #049
©2012 EasySync Ltd. 69
5 Contact Information
Head Office – Glasgow, UK EasySync Limited Unit 1, 2 Seaward Place, Centurion Business Park Glasgow, G41 1HH United Kingdom Tel: +44 (0) 141 418 0181 Fax: +44 (0) 141 418 0110 E-mail (Sales) [email protected] E-mail (Support) [email protected] E-mail (General Enquiries) [email protected] Web Site URL http://easysync.co.uk Web Shop URL http://easysync.co.uk
Branch Office – Hillsboro, Oregon, USA EasySync Limited (USA) 7130 SW Fir Loop Tigard, OR 97223 USA Tel: +1 (503) 547 0909 Fax: +1 (503) 547 0990 E-Mail (Sales) [email protected] E-Mail (Support) [email protected] E-Mail (General Inquiries) [email protected] Web Site URL http://easysync-ltd.com Web Shop URL http://easysync-ltd.com

Document Reference No.: ES_000095 EasyScopeIII for DS60M10 User Guide
Rev 1.1 Clearance No.: ES #049
©2012 EasySync Ltd. 70
Appendix A - List of Figures
List of Figures
Figure 1.1 – EasyScopeIII GUI ........................................................................................................................ 5
Figure 3.1 – Oscilloscope Mode GUI ........................................................................................................... 14
Figure 3.2 – XY Mode .................................................................................................................................... 25
Figure 3.3 – FFT Window .............................................................................................................................. 26
Figure 4.1 – Data Logger Mode GUI ............................................................................................................. 43
Figure 4.2 – Data Logger Window with Cursors ......................................................................................... 49
Document Reference No.: ES_000095 EasyScopeIII for DS60M10 User Guide
Rev 1.1 Clearance No.: ES #049
©2012 EasySync Ltd. 71
Appendix B - Revision History
Version 1.0 Initial release 09th November 2012
Version 1.1 Release 11th November 2012