easy user guide en
TRANSCRIPT
USTER® STATISTICS 2013 Application Report
Easy User Guide

USTER® STATISTICS 2013 2 (27)
THE STANDARD FROM FIBER TO FABRIC
Copyright 2013 by Uster Technologies AG All rights reserved. No part of this publication may be reproduced, stored in a re-trieval system, translated or transmitted in any form or by any means, electronical-ly, mechanically, photocopying, recording or otherwise, without the prior permission in writing of the copyright owner.

USTER® STATISTICS 2013 3 (27)
THE STANDARD FROM FIBER TO FABRIC
Contents
General information about USTER® STATISTICS ................... 4 1
1.1 What are USTER® STATISTICS? What benefits do they offer? .. 4
1.2 What do USTER® STATISTICS levels mean? ............................. 4
1.3 How are the USTER® STATISTICS generated? .......................... 4
1.4 In which formats are USTER® STATISTICS available? ............... 5
1.5 How can USTER® STATISTICS data be used? ........................... 5
1.6 What other information can be found in the USTER® STATISTICS? .............................................................................. 5
Using the USTER® STATISTICS charts .................................... 6 2
2.1 Definition of specifications ............................................................ 7
2.1.1 Definition of fiber specification ..................................................... 7
2.1.2 Definition of the sliver specification .............................................. 8
2.1.3 Definition of the roving specification ............................................. 9
2.1.4 Definition of the yarn specification ............................................. 10
2.1.5 Definition of the yarn specification for USTER® CLASSIMAT .... 11
2.1.6 Definition of the fiber processing specification ........................... 12
2.1.7 Definition of the yarn processing specification ........................... 13
2.2 Determination of USTER® STATISTICS Percentile level ........... 14
2.2.1 Determination of the USTER® STATISTICS Percentile level based on a measured value ....................................................... 14
2.2.2 Determination of the USTER® STATISTICS Percentile level for a measured yarn value for USTER® CLASSIMAT ........................ 15
2.2.3 Determination of the USTER® STATISTICS Percentile level based on a measured fiber value for fiber processing charts ..... 16
2.2.4 Determination of the USTER® STATISTICS Percentile level for yarn processing charts ............................................................... 17
2.3 Printing graphs or a whole chapter ............................................ 18
2.4 Information about synthetic fibers .............................................. 19
Using the USTER® STATISTICS interactive tables ................ 20 3
3.1 Determining the USTER® STATISTICS level for measured values21
3.2 Determining the absolute values for a given USTER® STATISTICS level ...................................................................... 22
3.3 USTER® CLASSIMAT Matrix ..................................................... 23
Using the USTER® STATISTICS numeric tables .................... 25 4
4.1 Definition of the yarn specification ............................................. 25
Further help using USTER® STATISTICS ............................... 26 5

USTER® STATISTICS 2013 4 (27)
THE STANDARD FROM FIBER TO FABRIC
General information about USTER® STATISTICS 1 1.1 What are USTER® STATISTICS? What benefits do they
offer? USTER® STATISTICS are the only established benchmark for the worldwide textile industry. Cotton fibers, as well as yarns made from various other raw materials, are measured and compared against each other. USTER® STATISTICS offer reference values for specialists and managers along the textile value chain, from fiber producers and spinners to weavers, knitters, garment makers, retailers and traders as well as help-ing manufacturers to improve production processes. USTER® STATISTICS are also often used as the basis for yarn specifications in textile trading contracts. 1.2 What do USTER® STATISTICS levels mean? USTER® STATISTICS levels, also known as USTER® STATISTICS Percentiles, express how many spinning mills worldwide are able to produce a yarn at the specified level or better. For example, if a spinning mill reaches the 5% value, it means that only 5% of spinning mills worldwide are able to produce a yarn at this quality level or better. At the other extreme, if a measured value corresponds, for example, to the 95% level in the USTER® STATISTICS, it means that 95% of the spinning mills worldwide are able to produce a yarn which is better than this value. Thus, in the case of yarns and slivers, it can be seen that the lower the USTER® STATISTICS level, the better the yarn or sliver quality. With raw fibers, however, a high or low USTER® STATISTICS level does not provide a quality assessment, since fiber parameters are inherent to the material at this stage. 1.3 How are the USTER® STATISTICS generated? Samples for the USTER® STATISTICS are collected from textile regions all over the world over a time period of 5 to 6 years. They are tested constantly in the laboratories of Uster Technologies, Switzerland, as well as in Suzhou, China (Chinese samples only), at standard conditions and under strict testing guidelines. Data analysis and the generation of the graphs are done in the headquarters in Switzerland by experienced textile technolo-gists. It is of utmost importance to check the data for its consistency with former releases of the USTER® STATISTICS as well as for the significance of the data. All values for the USTER® STATISTICS are obtained by using the laboratory instruments of Uster Technologies. Thus, the USTER® STATISTICS values are only valid for parameters tested with laboratory instruments made by Uster Technologies.

USTER® STATISTICS 2013 5 (27)
THE STANDARD FROM FIBER TO FABRIC
1.4 In which formats are USTER® STATISTICS available? The reference values of USTER® STATISTICS are displayed in different formats:
Incorporated into the reports from USTER® instruments In an interactive version on the USTER website (www.uster.com)
after registry for a password which is free of charge In an interactive version on a CD-ROM, which can be ordered free
of charge from the USTER website. 1.5 How can USTER® STATISTICS data be used? The data in the USTER® STATISTICS can be presented either as charts or as tables. There are separate charts for the different process stages, such as fiber, sliver, and yarn, as well as a separate chapter for the correlation between fiber and yarn parameters. 1.6 What other information can be found in the USTER®
STATISTICS? On the landing page of the USTER® STATISTICS, various downloads are offered:
Application handbook USTER® STATISTICS Application report USTER® STATISTICS USTER® STATISTICS Easy User Guide
Landing page of the USTER® STATISTICS
USTER® STATISTICS 2013 6 (27)
THE STANDARD FROM FIBER TO FABRIC
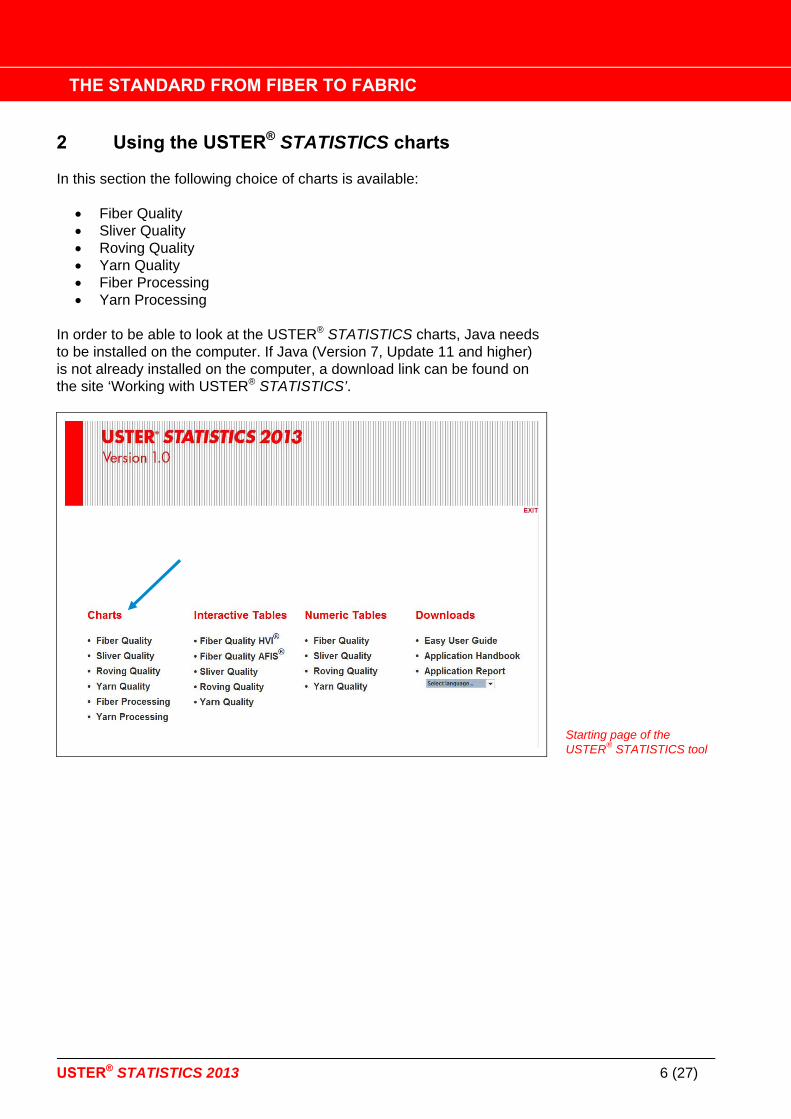
Using the USTER® STATISTICS charts 2 In this section the following choice of charts is available:
Fiber Quality Sliver Quality Roving Quality Yarn Quality Fiber Processing Yarn Processing
In order to be able to look at the USTER® STATISTICS charts, Java needs to be installed on the computer. If Java (Version 7, Update 11 and higher) is not already installed on the computer, a download link can be found on the site ‘Working with USTER® STATISTICS’.
Starting page of the USTER® STATISTICS tool

USTER® STATISTICS 2013 7 (27)
THE STANDARD FROM FIBER TO FABRIC
2.1 Definition of specifications 2.1.1 Definition of fiber specification After selecting one of the six chart options (see arrow in figure above), you can continue with the definition of specifications.
Statistics: Selected option is shown.
Yarn type and Process are greyed out as they don’t apply to this graph type of fiber quality.
Product: Select the USTER® instrument on which the sample was test-ed. In this case, it’s either USTER® HVI or USTER® AFIS.
Specification: Select the requested parameter.
Please note, that these charts are based on the corresponding fiber length.
Definition of fiber specifications

USTER® STATISTICS 2013 8 (27)
THE STANDARD FROM FIBER TO FABRIC
2.1.2 Definition of the sliver specification
Statistics: Selected option is shown.
Yarn type: Select either from cotton or a cotton/polyester blend.
Process: Select the spinning technology (ring, OE rotor).
Product and Count are greyed out as they don’t apply to this graph type of sliver quality.
Specification: Select the requested parameter.
Please note, that these charts are based on the sliver count.
Definition of sliver specifications

USTER® STATISTICS 2013 9 (27)
THE STANDARD FROM FIBER TO FABRIC
2.1.3 Definition of the roving specification
Statistics: Selected option is shown.
Yarn type: Select from different raw materials and blends.
Process: Select the spinning technology (ring, compact).
Product and Count are greyed out as they don’t apply to this graph type of roving quality.
Specification: Select the requested parameter.
Please note, that these charts are based on the roving count.
Definition of roving specifi-cations

USTER® STATISTICS 2013 10 (27)
THE STANDARD FROM FIBER TO FABRIC
2.1.4 Definition of the yarn specification
Statistics: Selected option is shown.
Yarn type: Select from different raw materials and blends.
Process: Select the spinning technology (ring yarn, compact yarn, OE rotor yarn, airjet yarn, plied yarn*), format (bobbins, cones) and application process of the yarn (weaving, knitting).
Product: Select the USTER® instrument on which the sample was test-ed.
Count is greyed out as it doesn’t apply to this graph type of yarn quality.
Specification: Select the requested parameter.
Please note, that these charts are based on the yarn count.
* Please note also, that for plied yarns the yarn count is taken as if it were a single yarn count.
Definitions of yarn specifications

USTER® STATISTICS 2013 11 (27)
THE STANDARD FROM FIBER TO FABRIC
2.1.5 Definition of the yarn specification for USTER® CLASSIMAT The following description is valid for USTER® CLASSIMAT QUANTUM as well as for USTER® CLASSIMAT 5.
Statistics: Selected option is shown.
Yarn type: Select from different raw materials and blends.
Process: Select the spinning technology (ring yarn, compact yarn, OE rotor yarn, airjet yarn, plied yarn*), format (cones) and application process of the yarn (weaving, knitting).
Product: Select the USTER® instrument on which the sample was test-ed.
Count: Select between - coarse: > Ne 12 and <= Ne 20 - medium: > Ne 20 and <= Ne 40 - fine: > Ne 40
Specification: Select the requested parameter.
Please note that not all count ranges are available for all materials.
* Please note also, that for plied yarns the yarn count is taken as if it were a single yarn count.
Definition of yarn specifications for USTER® CLASSIMAT

USTER® STATISTICS 2013 12 (27)
THE STANDARD FROM FIBER TO FABRIC
2.1.6 Definition of the fiber processing specification
Statistics: Selected option is shown.
Yarn type: Greyed out as it doesn’t apply to fiber processing quality. Only processes for 100% cotton are available.
Process: Select the spinning technology (ring, compact, OE rotor).
Product and Count are greyed out as they don’t apply to these types of fiber processing quality charts.
Specification: Select the requested parameter.
Defining fiber processing specifica-tions

USTER® STATISTICS 2013 13 (27)
THE STANDARD FROM FIBER TO FABRIC
2.1.7 Definition of the yarn processing specification
Selected option is shown.
Yarn type: Select from different raw materials and blends.
Process: Select the spinning technology (ring yarn or compact yarn) and application of the yarn (weaving, knitting).
Product and Count and Specification: These lines are greyed out as they don’t apply to yarn processing quality. The deviation is only pro-vided for the parameters in the chart.
Defining yarn processing specifications

USTER® STATISTICS 2013 14 (27)
THE STANDARD FROM FIBER TO FABRIC
2.2 Determination of USTER® STATISTICS Percentile level 2.2.1 Determination of the USTER® STATISTICS Percentile level
based on a measured value The principle for determining the USTER® STATISTICS Percentile value described below applies also to the charts for fiber quality, sliver quality as well as roving quality.
By moving the cursor over the chart the cross lines will appear.
First, the count of the measured yarn must be found on the x-axis by pointing the cursor on the correct yarn count.
Then the measured value needs to be selected by pointing the cursor on the value (y-axis).
On the right-hand side of the graph, a text field with the selected data (count or length of the selected material in different units and the measured value of the selected parameter) will appear. In this example, the yarn count is Ne 20.20 and the evenness CVm = 14.2%.
The resulting USTER® STATISTICS level is displayed in the same text field. In the example below, it is USTER® STATISTICS Percentile (USPTM) 50%.
Determining the USTER® STATISTICS Percentile level of a measured value

USTER® STATISTICS 2013 15 (27)
THE STANDARD FROM FIBER TO FABRIC
2.2.2 Determination of the USTER® STATISTICS Percentile level for a measured yarn value for USTER® CLASSIMAT
The following description is valid for USTER® CLASSIMAT QUANTUM as well as for USTER® CLASSIMAT 5.
By moving the cursor over the chart cross lines will appear.
The requested class must be found on the x-axis.
The measured value needs to be selected by pointing the cursor on the value (y-axis).
On the right-hand side of the chart, a text field will appear showing the selected data and the USTER® STATISTICS Percentile value.
The resulting USTER® STATISTICS Percentile (USPTM) level in this example is 50% for a value of 23 in the B1 class.
Determining the USTER® STATISTICS Percentile level of a yarn measured on USTER® CLASSIMAT

USTER® STATISTICS 2013 16 (27)
THE STANDARD FROM FIBER TO FABRIC
2.2.3 Determination of the USTER® STATISTICS Percentile level based on a measured fiber value for fiber processing charts
By moving the cursor over the chart cross lines will appear.
On the x-axis, the process steps from bale to roving (for ring and com-pact spinning) or up to finisher sliver (for OE-rotor spinning) is displayed.
The measured USTER® AFIS value needs to be selected by pointing the cursor on the value (y-axis).
On the right-hand side of the chart, a text field will appear showing the selected data and the USTER® STATISTICS Percentile value.
The resulting USTER® STATISTICS Percentile (USPTM) level in this example is 50% for a value of 61 neps per gram in the ribbon lap.
Determining the USTER® STATISTICS Percentile level based on a measured intermediate product in preparation

USTER® STATISTICS 2013 17 (27)
THE STANDARD FROM FIBER TO FABRIC
2.2.4 Determination of the USTER® STATISTICS Percentile level for yarn processing charts
By moving the cursor over the chart cross lines will appear.
On the x-axis, some of the most important yarn parameters are given: - Yarn evenness CVm - Imperfections: Thin -40%, Thick +50%, Neps +200% - Hairiness - Tenacity Due to the low number of events for thin places of -50%, the level of -40% was selected here. Percentage-wise, the increase from 2 to 4 thin places of thin -50% is 100%. But looking at the absolute numbers the difference is not significant.
The y-axis indicates the deviation for the chosen parameter from bobbin to cone. The following two examples should clarify how the chart must be understood.
- Hairiness: for 50% of the yarns in spinning mills, the hairiness increases from bobbin to cone by 26% (see picture below).
- Tenacity: for 95% of the yarns in spinning mills, the tenacity drops from bobbin to cone by 9%.
On the right-hand side of the chart, a text field will appear showing the selected data and the USTER® STATISTICS Percentile value. In this example (for hairiness) the 50% value is at 26% deviation.
Determining the USTER® STATISTICS Percentile level for yarn processing

USTER® STATISTICS 2013 18 (27)
THE STANDARD FROM FIBER TO FABRIC
2.3 Printing graphs or a whole chapter There are two possibilities for printing:
Printing only the shown chart
Printing the whole chapter (PDF file)
When selecting ‘Print Chapter’ a PDF will open including all available parameters of the selected material. Please note before printing that the number of pages might be high depending on the amount of parameters in a chapter.
Printing options for single charts and chapters
USTER® STATISTICS 2013 19 (27)
THE STANDARD FROM FIBER TO FABRIC
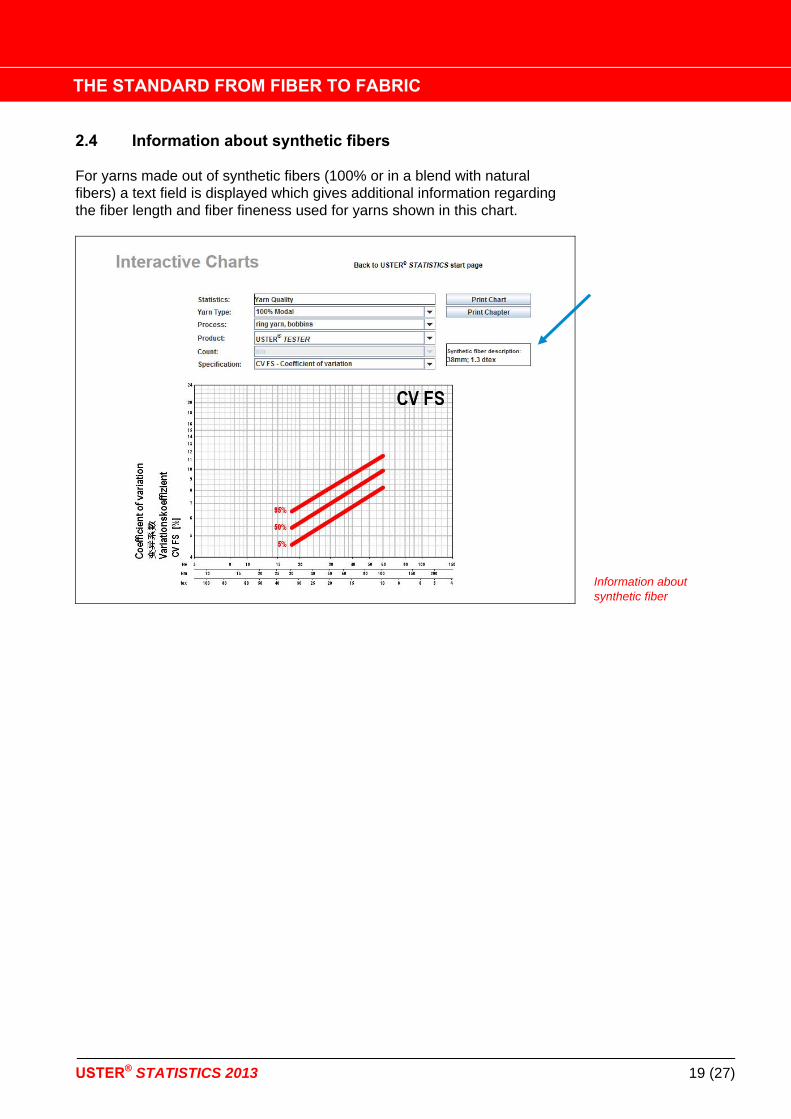
2.4 Information about synthetic fibers For yarns made out of synthetic fibers (100% or in a blend with natural fibers) a text field is displayed which gives additional information regarding the fiber length and fiber fineness used for yarns shown in this chart.
Information about synthetic fiber

USTER® STATISTICS 2013 20 (27)
THE STANDARD FROM FIBER TO FABRIC
Using the USTER® STATISTICS interactive 3tables
These tables are very useful for quick information about:
- the absolute values corresponding to a specific USTER® STATISTICS Percentile level
- the USTER® STATISTICS Percentile level in case absolute measurement values are available
These interactive tables are available for: Fiber Quality HVI® Fiber Quality AFIS® Sliver Quality Roving Quality Yarn Quality
Selecting the USTER® STATISTICS interactive tables
The USTER® STATISTICS tables can be used in two ways:
Determining the USTER® STATISTICS level for a measured value Determining the absolute value for a given USTER® STATISTICS
level

USTER® STATISTICS 2013 21 (27)
THE STANDARD FROM FIBER TO FABRIC
3.1 Determining the USTER® STATISTICS level for measured values
If absolute measurement values are known or given, the corresponding USTER® STATISTICS level can be obtained with the USTER® STATISTICS interactive tables. The following description is based on yarn values. However, it works the same for fiber quality (USTER® HVI and USTER® AFIS), sliver, or roving quality. The only difference is that for the fiber parameters, the fiber length (either UHML for HVI® or UQL (w) for AFIS®) must be selected instead of the count.
The specification of the measured yarn must be selected in the fields ‘Material’ and ‘Process’.
The yarn count must be entered and the count unit must be selected. Please note that the available count range is displayed below the entry field.
It is important to select the field ‘I have measurement values and I am looking for corresponding USPTM’.
Next, the known test results must be typed into the empty fields in the table. An example is given in the figure below.
Determining the USTER® STATISTICS level for measured values

USTER® STATISTICS 2013 22 (27)
THE STANDARD FROM FIBER TO FABRIC
To determine the USTER® STATISTICS level, the ‘Calculate’ button
needs to be clicked. The system will calculate the corresponding USTER® STATISTICS levels and mark them in different colors.
By marking a box in the furthest column (‘Chart Download’) correspond-ing charts can be selected for download as a PDF. In this download, the shown chart includes an indication of the value given in the table (see figure below).
Chart download from the interactive table
For printing it is recommended to download the table first as a PDF file.
The ‘Reset’ button clears all fields and a new calculation can be started. 3.2 Determining the absolute values for a given USTER®
STATISTICS level Conversely, it is also possible to calculate the absolute values for a given USTER® STATISTICS level. To obtain this information, the following steps need to be followed:
The specification of the particular yarn must be selected in the fields ‘Material’ and ‘Process’.
The material count or fiber length (for fiber quality measured with USTER® HVI or USTER® AFIS) must be entered and the unit must be selected.
The requested USTER® STATISTICS level must be typed into the empty field ‘USPTM’.
This value can be pasted into all fields by clicking on the button ‘Paste USP into all Fields’. If required, it is also possible to enter different USTER® STATISTICS levels for each parameter in the table below di-rectly.

USTER® STATISTICS 2013 23 (27)
THE STANDARD FROM FIBER TO FABRIC
Determining the parameter values for a given USTER® STATISTICS level
To determine the absolute values for the specific USTER® STATISTICS levels, the ‘Calculate’ button needs to be clicked. After calculation, the corresponding values will be indicated in the table in the column below ‘Value’.
It is recommended to download the table as a PDF before printing.
By selecting a field in the column on the furthest right (‘Chart Download’) the corresponding charts can be selected for download as a PDF
3.3 USTER® CLASSIMAT Matrix Different levels of CLASSIMAT matrices are given (USTER® CLASSIMAT QUANTUM and USTER® CLASSIMAT 5 (Provisional)). They are displayed in the interactive yarn tables [ ? ]. Thick and Thin places per classes (NSLT):
Top 9: The sum of the NSL events at the related 9 classes per 100 km: A4+B3+B4+C3+C4+D2+D3+D4+E. The related classes are shown in the related matrix and highlighted with grey color. In this example, there are no events.

USTER® STATISTICS 2013 24 (27)
THE STANDARD FROM FIBER TO FABRIC
Defined USTER® CLASSIMAT Matrix- NSL
Top 12: The sum of the NSL events at the related 12 classes per 100
km: A3+A4+B3+B4+C3+C4+D2+D3+D4+E+F+G. In this example, the value is equal to 3 events per 100km.
Top 16: The sum of the NSL events at the related 16 classes per 100 km: A3+A4+B2+B3+B4+C1+C2+C3+C4+D1+D2+D3+D4+E+F+G. In this example, the value is equal to 18 events per 100 km.
Shows the remaining events in the yarn (white).
Shows the cleared events (grey).
USTER® CLASSIMAT 5 Matrix for NSLT

USTER® STATISTICS 2013 25 (27)
THE STANDARD FROM FIBER TO FABRIC
Using the USTER® STATISTICS numeric tables 4 The numeric tables of the USTER® STATISTICS were created for those customers who prefer to check the five main USTER® STATISTICS Percentile levels in a table instead of a graphic format.
Start screen of the USTER®
STATISTICS tool
4.1 Definition of the yarn specification
Select the Material.
Select the Process.
Select the Instrument.
Select the Parameter. Each numeric table will give the absolute values for only one single parameter.
Click on Calculate.
Selection screen for Yarn Quality Numeric Tables

USTER® STATISTICS 2013 26 (27)
THE STANDARD FROM FIBER TO FABRIC
The following table will be shown as the output. It shows the USTER® STATISTICS Percentile levels for the whole count range for the selected parameter. This table can be downloaded as a PDF for printing or further processing.
Numeric tables of the USTER® STATISTICS
Further help using USTER® STATISTICS 5 For further assistance with the use and application of USTER® STATISTICS please contact [email protected].

USTER® STATISTICS 2013 27 (27)
THE STANDARD FROM FIBER TO FABRIC
Uster Technologies AG Sonnenbergstrasse 10 CH-8610 Uster / Switzerland Phone +41 43 366 36 36 Fax +41 43 366 36 37 www.uster.com [email protected]
01.13 / © Copyright 2013 Uster Technologies AG