east texas air quality forecasting systems (etaq-f) evaluation of summer 2006 simulations for...
TRANSCRIPT

East Texas Air Quality Forecasting Systems (ETAQ-F)
Evaluation of Summer 2006 Simulationsfor TexAQS-II and Transition to Assessment Study
Daewon W. ByunDaewon W. Byun
F. Ngan, X. Li, D. Lee, S. T. Kim, H.C. Kim, I.B. Oh, and F. Cheng
Institute for Multi-dimensional Air Quality Studies (IMAQS)
University of Houston (UH)

http://www.imaqs.uh.edu/http://www.imaqs.uh.edu/

AQF Modeling Domains – F1 AQF Modeling Domains – F1 (June 2005 – Current)(June 2005 – Current)
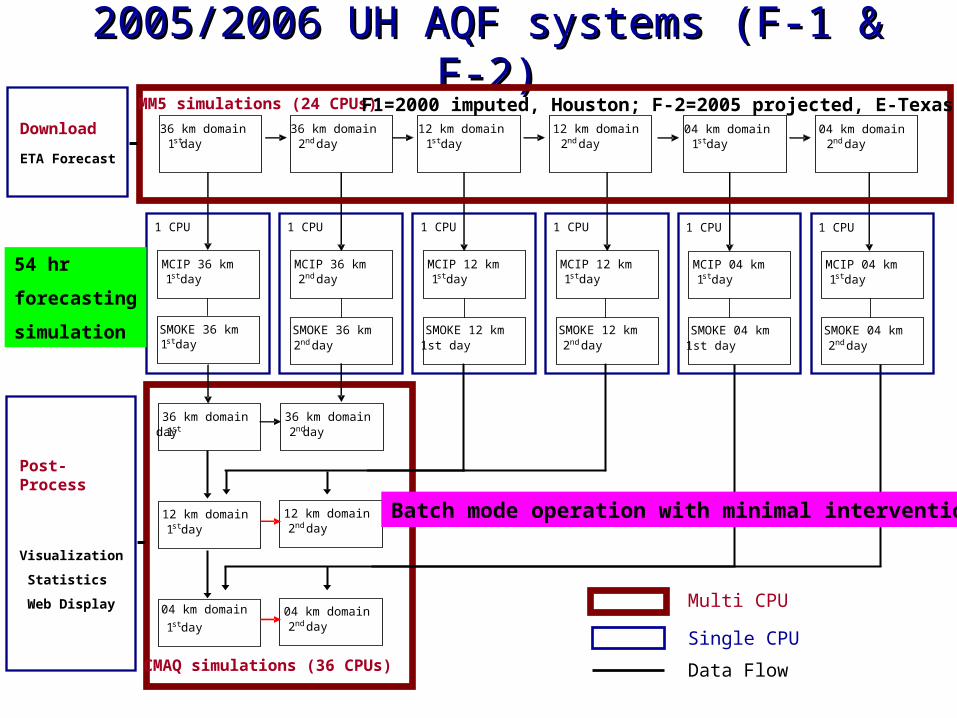
2005/2006 UH AQF systems (F-1 & F-2)2005/2006 UH AQF systems (F-1 & F-2)
1 CPU
MCIP 36 km1 st day
SMOKE 36 km1 st day
1 CPU
MCIP 36 km2nd day
SMOKE 36 km2nd day
1 CPU 1 CPU
MCIP 12 km1 st day
MCIP 12 km1 st day
SMOKE 12 km1st day
SMOKE 12 km2nd day
36 km domain1 st day
36 km domain2nd day
12 km domain1 st day
12 km domain2nd day
Download
ETA Forecast
MM5 simulations (24 CPUs)
36 km domain1 st day
36 km domain2nd day
12 km domain1 st day
12 km domain2nd day
04 km domain
1 st day04 km domain
2nd day
Post-Process
Visualization
Statistics
Web Display
CMAQ simulations (36 CPUs)
04 km domain1 st day
04 km domain2nd day
1 CPU 1 CPU
MCIP 04 km1 st day
MCIP 04 km1 st day
SMOKE 04 km1st day
SMOKE 04 km2nd day
Multi CPU
Single CPU
Data Flow
F1=2000 imputed, Houston; F-2=2005 projected, E-Texas
Batch mode operation with minimal intervention
54 hr
forecasting
simulation

Time series of regional daily max ozoneJune 2005 – May 2006

2006 June – 2006 Oct (TexAQS-II)UH (Univ. of Houston)
AQF (Air Quality Forecasting) SystemsSpatial Resolution Spatial Resolution
36 km 36 km : U.S. Continent: U.S. Continent12 km 12 km : East Texas (2005) State of TX, LA, OK, AR, and MS : East Texas (2005) State of TX, LA, OK, AR, and MS
(2006)(2006)04 km 04 km : Houston and Galveston Area (F1) / HGA & DFW (F2 & : Houston and Galveston Area (F1) / HGA & DFW (F2 &
F3)F3)MM5 – 43 layers, CMAQ-23 layersMM5 – 43 layers, CMAQ-23 layers
Operation Period and Duration (May 2005 ~ Current)Operation Period and Duration (May 2005 ~ Current)Spin-up Spin-up : 6 hrs: 6 hrs
(0(0thth day 18 CST – 0 day 18 CST – 0thth day 23 CST) day 23 CST) Forecasting Forecasting : 46 hrs : 46 hrs
(1(1stst day 00 CST – 2 day 00 CST – 2ndnd day 23 CST) day 23 CST)
Different Air Quality Forecasting SystemsDifferent Air Quality Forecasting SystemsForecast 1 (F1) : MM5 modified by UH + TEI imputed for 2000 + CMAQ Forecast 1 (F1) : MM5 modified by UH + TEI imputed for 2000 + CMAQ v4.4 v4.4 Forecast 2 (F2) : MM5 modified by UH + TEI imputed & projected for Forecast 2 (F2) : MM5 modified by UH + TEI imputed & projected for 2005 + CMAQ v4.42005 + CMAQ v4.4

Modeling Domains – F2, TexAQS-IIModeling Domains – F2, TexAQS-II

Anthropogenic Emissions: for F1 Anthropogenic Emissions: for F1 (2005 & 2006)(2005 & 2006)
TEI 2000 Base5b TEI 2000 Base5b – TexAQS 2000 episode used for State Implementation PlanTexAQS 2000 episode used for State Implementation Plan– The day of WeekThe day of Week
Aug. 25Aug. 25thth Friday, Aug. 26 Friday, Aug. 26thth Saturday, Aug. 27 Saturday, Aug. 27thth Sunday, Aug. 3 Sunday, Aug. 300thth Monday ~ Thursday Monday ~ Thursday
– CB4, SAPRC99, and RADM2CB4, SAPRC99, and RADM2– Area & Non-road: 2000 Emissions InventoryArea & Non-road: 2000 Emissions Inventory
NEI99 (Final version 3)NEI99 (Final version 3)– CONUS 36-km domainCONUS 36-km domain– Particulate matters and precursors (NH3, SO2)Particulate matters and precursors (NH3, SO2)
Processor: SMOKE version 2.1Processor: SMOKE version 2.1– Internal database: TCEQ’s (for spatial and temporal allocation) DefaInternal database: TCEQ’s (for spatial and temporal allocation) Defa
ult & TCEQ’s for chemical speciationult & TCEQ’s for chemical speciation

Anthropogenic Emissions for F2 (2006)Anthropogenic Emissions for F2 (2006) Projected Texas EGU NOx emissionsProjected Texas EGU NOx emissionsafter State Implementation Plan (SIP)after State Implementation Plan (SIP)
2007 emissions inventory were projected from 2000 EI with growth and control factors from TCEQ. For HG NOx emissions for 2005, a factor of 1.747 was applied on 2007 EI based on the 2005/2007 MECT (Mass Emission Cap and Trade) allowances.
2000 2005 2007

Anthropogenic Emissions: for F2 (2006) Anthropogenic Emissions: for F2 (2006) VOC emissions for imputation after SIPVOC emissions for imputation after SIP
UH AQF system uses additional VOC emissions at the 2007 level.
2000 2007

MOBILE6 NOx emissions for 2000 and 2007MOBILE6 NOx emissions for 2000 and 2007
The emissions amounts for each county, vehicle type, hour and species were determined for 2005 based on those for 2000 and 2007. Then, the factor was applied on 2007 MOBILE6 emissions to get 2003 emissions.
2000 2007
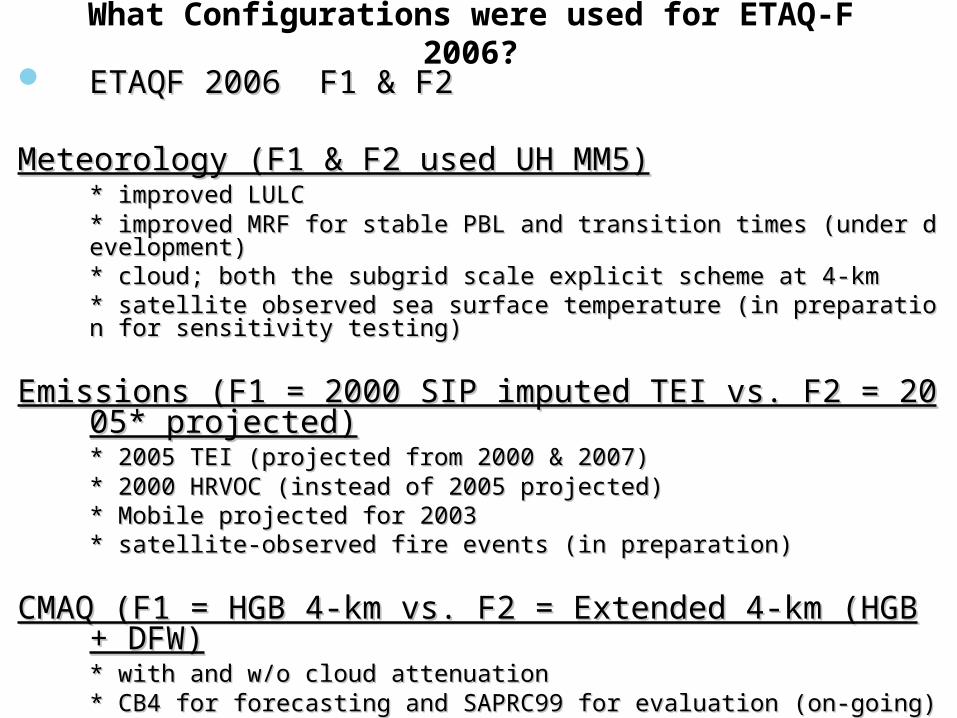
What Configurations were used for ETAQ-F 2006? ETAQF 2006 F1 & F2 ETAQF 2006 F1 & F2
Meteorology (F1 & F2 used UH MM5)Meteorology (F1 & F2 used UH MM5)* improved LULC* improved LULC* improved MRF for stable PBL and transition times (under development)* improved MRF for stable PBL and transition times (under development)* cloud; both the subgrid scale explicit scheme at 4-km* cloud; both the subgrid scale explicit scheme at 4-km* satellite observed sea surface temperature (in preparation for sensitivity testing)* satellite observed sea surface temperature (in preparation for sensitivity testing)
Emissions (F1 = 2000 SIP imputed TEI vs. F2 = 2005* projected)Emissions (F1 = 2000 SIP imputed TEI vs. F2 = 2005* projected)* 2005 TEI (projected from 2000 & 2007)* 2005 TEI (projected from 2000 & 2007)* 2000 HRVOC (instead of 2005 projected) * 2000 HRVOC (instead of 2005 projected) * Mobile projected for 2003* Mobile projected for 2003* satellite-observed fire events (in preparation)* satellite-observed fire events (in preparation)
CMAQ (F1 = HGB 4-km vs. F2 = Extended 4-km (HGB + DFW)CMAQ (F1 = HGB 4-km vs. F2 = Extended 4-km (HGB + DFW)* with and w/o cloud attenuation* with and w/o cloud attenuation* CB4 for forecasting and SAPRC99 for evaluation (on-going)* CB4 for forecasting and SAPRC99 for evaluation (on-going)* Better regional characterization at 12-km resolution* Better regional characterization at 12-km resolution

Monitoring site on Houston-Galveston domain F1Monitoring site on Houston-Galveston domain F1
Model: F1

1
2
3
8
9
13
15
17
19
2628
31
34
35
38
45
52
53 55
56
59
60
61
63
64
6970
7173
7576
77
78
81
82
84
85
87
94
96
114165
198
311
402
405
406
408
409410 411
416503 504
505 506
551552
553554
555
556
557
558
559560561
562
570572
601
613
614
617
618
619620622
627
628
639
640
643
645
646
647
649
650
651
674
675
678
1016
1019
1027
1032
Monitoring sites for Dallas & Houston domain F2Monitoring sites for Dallas & Houston domain F2
Model: F2

Each models comparison, July 2006
Date(day)
0 5 10 15 20 25 30
Da
ily M
axi
m O
3 C
on
c.(p
pb
)
20
40
60
80
100
120
140
160
180
Obs.F-1F-2
Each models comparison, June 2006
Date(day)
0 5 10 15 20 25 30
Dai
ly M
axi
m O
3 C
onc.
(ppb
)
20
40
60
80
100
120
140
160
180
Obs.F-1F-2
Each models comparison, Sep. 2006
Date(day)
0 5 10 15 20 25 30
Dai
ly M
axim
O3
Con
c.(p
pb)
20
40
60
80
100
120
140
160
180
Obs.F-1F-2
Each models comparison, Aug. 2006
Date(day)
0 5 10 15 20 25 30
Dai
ly M
axim
O3
Con
c.(p
pb)
20
40
60
80
100
120
140
160
180
Obs.F-1F-2
June 2006 July 2006
August 2006 September 2006
8/23 rain missed
9/14 upset event
rain missed
Aug 19 - pcpn

NO
x C
on
c.(
pp
b)
0
10
20
30
40
50
F1Obs.
Time(day)
0 30 60 90 120
NO
x C
on
c.(
pp
b)
0
10
20
30
40
50
F2Obs
June July August September
NOx daily mean time series for F1 & F2NOx daily mean time series for F1 & F2
Started using projected emissions (July 17)
2000 TEI
“projected” 2005 TEI
Aug 23rd rain missed in AQF

O3 Scatter plot for F2 (daily max)O3 Scatter plot for F2 (daily max)
F1 F2

MM5 re-simulationMM5 re-simulation
Improving wind simulation is the most important factor Improving wind simulation is the most important factor for better AQM performancefor better AQM performance
– FDDA is a proven technique to improve the meteorology reanalysisFDDA is a proven technique to improve the meteorology reanalysis – Using IMAQS MM5-based Real-Time data assimilation framework, multipUsing IMAQS MM5-based Real-Time data assimilation framework, multip
le observational datasets from le observational datasets from Meteorological Assimilation Data Meteorological Assimilation Data Ingest System (MADIS) and CAMS met data. Ingest System (MADIS) and CAMS met data.
A comprehensive surface obs. (SFC – from ASOS by NOAA/NWS)A comprehensive surface obs. (SFC – from ASOS by NOAA/NWS)Improved radiosonde observations (RAOB)Improved radiosonde observations (RAOB)Aircraft sounding (ACARS) windsAircraft sounding (ACARS) windsImproved NOAA Profiler Network (NPN) dataImproved NOAA Profiler Network (NPN) data
– Tested a variety of assimilation configurations to identify the best combiTested a variety of assimilation configurations to identify the best combination to arrive at “TMNS11”nation to arrive at “TMNS11”
Start from 36km MM5 simulation using EDAS (to provide BC for nest domain)Start from 36km MM5 simulation using EDAS (to provide BC for nest domain) nest down to 12-kmMADIS & CAMS data to improve MM5 to improvenest down to 12-kmMADIS & CAMS data to improve MM5 to improve

Data sets used for FDDAData sets used for FDDA
Multi-step FDDA
Grid
Nudging
3 hourly – 12 km
Hourly – 4km
Pink dots: CAMS
Black dots: MADIS SFC
(not shown) Upper air dataProfiler dataSounding dataAircraft dataSatellite data

Multi-Step FDDA with MM5Multi-Step FDDA with MM5
36km & 12km (3D nudging for u,v for everywhere, T & RH nudging in free atmospher36km & 12km (3D nudging for u,v for everywhere, T & RH nudging in free atmosphere)e)
4-km domain 4-km domain grid & surface nudging for wind components only grid & surface nudging for wind components only
Multi-step FDDA
12-, 4-km domain Multi-step nest-down assimilation
Grid
Nudging
3 hourly – 12 km
Hourly – 4km
SFC nudging

H
80 ppb
8/14
H
110 ppb
8/15
8/148/14 High pressure system in the Gulf, SW synoptic windHigh pressure system in the Gulf, SW synoptic wind
O3 peak (80 pbb) at NE of Harris countyO3 peak (80 pbb) at NE of Harris county
8/158/15 Similar weather pattern as 8/14Similar weather pattern as 8/14
O3 peak (110 ppb) at E of Harris & moved O3 peak (110 ppb) at E of Harris & moved northwardnorthward
8/16 Cold front near Dallas, W synoptic wind
O3 peak (140 ppb) at NE of downtown
8/17 Affected by front , N/NE wind
O3 peak (~150 ppb) at Deer Park
8/18 No strong system, light and variable wind
High background, O3 (~120 ppb) at W of Harris
8/198/19 Precipitation 9 – 11 CST, NE windPrecipitation 9 – 11 CST, NE wind
O3 peak (~75 ppb) at NW of downtownO3 peak (~75 ppb) at NW of downtown
8/208/20 No strong system, light and variable windNo strong system, light and variable wind
O3 (110 ppb) at Clinton & passed through downtownO3 (110 ppb) at Clinton & passed through downtown
8/218/21 No strong system, SE/E windNo strong system, SE/E wind
O3 peak (~90 ppb) at NW of downtownO3 peak (~90 ppb) at NW of downtown
140 ppb
8/16 front
150 ppb
front8/17
120 ppb
8/18 high O3 background
70 ppb
8/19 Rainfall at 9 – 11 CST
110 ppb
8/20
90 ppb
8/21
Overview of weather patterns and O3 levels

Does the Assimilation Improve Met Does the Assimilation Improve Met Simulations?Simulations?
AQF TMNS11
8/14
8/16

Does the Assimilation Improve Met Does the Assimilation Improve Met Simulations?Simulations?
8/17
8/18
AQF TMNS11

Does the Assimilation Improve Met Does the Assimilation Improve Met Simulations?Simulations?

CMAQ re-simulation summaryCMAQ re-simulation summary
Better Met. Better Air Quality simulation?AQFn (F2 emissions) vs. TMNS11n
CMAQ re-simulation nickname & description1) AQFn F1 MM5 fcst + F2 level AQF emission
2) TMNS11n TMNS11/MCIPn + F2 level AQF emission
AQFn TMNS11n

AQFn vs TMNS11n : High O3 day
- Met. changes in AQM - Met. changes in AQM changed O3 level & spatial distribution significantly changed O3 level & spatial distribution significantly- TMNS11 reproduced O3 conc. better than AQF- TMNS11 reproduced O3 conc. better than AQF
August 16, 2006

(1)AQFn vs TMNS11n : High O3 day August 17, 2006

AQFn vs TMNS11n : Low O3 day
- TMNS11 didn’t reproduce O3 conc. better than AQF- TMNS11 didn’t reproduce O3 conc. better than AQF
August 14, 2006

Evaluation of CMAQ Assessment Runs< TMNS11,c90,c91 >< TMNS11,c90,c91 >- Stats. : no big difference- Stats. : no big difference- high R,IOA(except 8/19)- high R,IOA(except 8/19)
Mean BiasMean Bias- low emiss. - low emiss. - bias - bias- high emiss. - high emiss. + bias + bias
- all positive (except 8/19)- all positive (except 8/19)- need further improvement- need further improvement

SummarySummary
MM5 re-simulation resultsMM5 re-simulation results To improve Met simulation : several assimilation methods/data testedTo improve Met simulation : several assimilation methods/data tested TMNS11 provides better met.TMNS11 provides better met.
- removal of some not observed T-storm development- removal of some not observed T-storm development - reduction of WD bias- reduction of WD bias - more realistic wind variations overall- more realistic wind variations overall -but still unwanted flow patterns occurred : 8/18~19-but still unwanted flow patterns occurred : 8/18~19
CMAQ re-simulation resultsCMAQ re-simulation results - Assimilation provides better O3 level & spatial distributions more often- Assimilation provides better O3 level & spatial distributions more often
- Not always improve met & air quality simulation results- Not always improve met & air quality simulation results Careful evaluation with various data necessary for each dayCareful evaluation with various data necessary for each day
to find causes of discrepancyto find causes of discrepancy
Acknowledgement: HARC, TCEQ, EPA, NASAAcknowledgement: HARC, TCEQ, EPA, NASA
http://www.imaqs.uh.edu/http://www.imaqs.uh.edu/