east african journal of public health volume 5 number 3...
TRANSCRIPT

East African Journal of Public Health Volume 5 Number 3 December 2008
133
133
“DELIVERING” ON THE MDGS?: EQUITY AND MATERNAL HEALTH IN GHANA, ETHIOPIA AND
KENYA
Meg Wirth1, Emma Sacks* 2, Enrique Delamonica3, Adam Storeygard2, Alberto Minujin4 and Deborah Balk2
Abstract
Objective(s): The Millennium Development Goals (MDGs) have put maternal health in the mainstream, but there is a need to go
beyond the MDGs to address equity within countries. We argue that MDG focus on maternal health is necessary but not sufficient.
This paper uses Demographic and Health Survey (DHS) data from Kenya, Ethiopia and Ghana to examine a set of maternal health
indicators stratified along five different dimensions. The study highlights the interactive and multiple forms of disadvantage and
demonstrates that equity monitoring for the MDGs is possible, even given current data limitations.
Methods: We analyse DHS data from Ghana, Kenya and Ethiopia on four indicators: skilled birth attendant, contraceptive
prevalence rate, AIDS knowledge and access to a health facility. We define six social strata along five different dimensions: poverty
status, education, region, ethnicity and the more traditional wealth quintile. Data are stratified singly (e.g. by region) and then
stratified simultaneously (e.g. by region and by education) in order to examine the compounded efect of dual forms of vulnerability.
Results: Almost all disparities were found to be significant, although the stratifier with the strongest effect on health outcomes varied
by indicator and by country. In some cases, urban-dwelling is a more significant advantage than wealth and in others, educational
status trumps poverty status. The nuances of this analysis are important for policymaking processes aimed at reaching the MDGs
and incorporating maternal health in national development plans.
Conclusion(s): The article highlights the following key points about inequities and maternal health: 1) measuring and monitoring
inequity in access to maternal health is possible even in low resource settings—using current data 2) statistically significant health
gaps exist not just between rich and poor, but across other population groups as well, and multiple forms of disadvantage confer
greater risk and 3) policies must be aligned with reducing health gaps in access to key maternal health services.
Conflict of Interest: The authors declare that there are no conflicts of interest. The lead author had full access to the data used in this
paper and the final responsibility for the decision to submit for publication.
Introduction
The fifth Millennium Development Goals (MDG) places the improvement of maternal health in the mainstream development agenda. Such attention to maternal health is long overdue, as progress in recent decades has been shamefully limited. In sub-Saharan Africa, maternal mortality increased from 1990 to 2000 in many countries, in large part due to health system collapse, increasing poverty among women, lack of access to skilled care for delivery, weak national human resource management and lack of political will and financial commitment (1-3). Currently, the African region accounts for 48% of the global annual toll of 529,000 maternal deaths (3).
At the same time that the MDGs are gaining traction, the international health community is grappling with the importance of going beyond country averages, documenting socio-economic differences in health and ensuring that programs ‘reach the poor’ (4-8). Maternal health, and in particular access to skilled birth attendants, is highly stratified by poverty and other social determinants of health (9-13). And maternal mortality is a sensitive marker of disadvantage (9,14-15). Nevertheless, the equity dimension of the maternal health MDG, indeed many of the health MDGs, has not influenced the main instruments of development policy—the Poverty Reduction Strategy Papers (PRSPs), Medium Term Expenditure Frameworks (MTEFs), and MDG reports. We argue that MDG focus on maternal health is necessary but not sufficient. It is critical that the MDGs incorporate a focus on equity—for practical as well as ethical reasons, including human rights (16-18). In practice,
Correspondence to: Emma Sacks, [email protected]
1Independent Global Health Consultant to Center for International Earth Science
Information Network (CIESIN), 2Center for International Earth Science
Information Network (CIESIN), Columbia University; CIESIN – Earth Institute,
Columbia University, Palisades, NY, USA, 3Global Policy Section, Division of Policy
and Planning, United Nations Children’s Fund (UNICEF), 4Graduate Program on
International Affairs, The New School for Social Research, NY, USA
an equity focus means that monitoring of the MDGs and designing policies to meet them should ensure that the worst-off groups benefit at the same or greater rate as the better-off groups. But who are the worst-off groups? We know that poor women usually fare worse than rich (3,7,9), but too often the determination “worst-off” stops there. The focus on wealth quintiles reflects a conception of poverty as largely a function of material deprivation rather than as a function of “powerlessness and vulnerability linked to systemic discrimination” (4,19). Inequity is a concept that is broader than poverty. Operationally we use the WHO definition of health equity: “the absence of unfair and avoidable or remediable differences in health among populations or groups defined socially, economically, demographically or geographically” (20).
A full analysis of inequity will have important policy implications. A more nuanced picture of inequity could capture avoidable disparities between identifiably different population groups. These approaches could have significant bearing on the priorities and policies identified in key development agendas including the rate of progress in reaching the MDGs. Some countries have adopted approaches to the PRSPs or MDGs that define vulnerable groups and make their welfare an explicit policy focus.19,21 For example, in Ghana, a PRSP focus on poverty reduction resulted in Highly Indebted Poor Countries (HIPC) relief funds being specifically allocated to the health sector in keeping with an equity resource allocation formula that focuses on the four poorest regions of the country and that offers free delivery services for mothers in these regions, training human resources for the poorest areas of the country, a health insurance initiative for the poor (21). Unfortunately, it is too early to assess the impact of these changes. A similar approach in Bolivia has not had much of an impact yet. (22).
In this article we focus on three countries in sub-Saharan Africa—Ghana, Ethiopia and Kenya—and use

East African Journal of Public Health Volume 5 Number 3 December 2008
134
134
DHS data to explore equity in reproductive and maternal health in these settings. We look at several indicators and examine the distribution of these across five social stratifiers. The set of indicators is purposefully broad in order to highlight a range of factors which are related to reproductive risk and maternal health. First, simple bivariate analysis is used to determine which stratifiers are significant. Next, we undertake simultaneous stratification to determine the dual effect of two kinds of social stratification, e.g. poverty and education. The article highlights the following key points about inequities and maternal health: 1) measuring and monitoring inequity in access to maternal health is possible even in low resource settings—using current data 2) statistically significant health gaps exist not just between rich and poor, but across other population groups as well, and multiple forms of disadvantage confer greater risk and 3) policies must be aligned with reducing health gaps in access to key maternal health services.
Methodology We consider four indicators of reproductive and
maternal health along five social dimensions. First, the percentage of births attended by skilled birth attendant (SBA) is a key intermediate indicator linked to the MDG target on maternal mortality, which cannot be directly measured for population subgroups in most data poor settings.9 Though highly imperfect, the SBA indicator captures an important dimension of the health system—the distribution of human resources appropriately skilled in delivery care and accessible at a health facility or in the community. The second indicator, contraceptive prevalence rate (modern method; CPR-MM) is also critical to the reduction of maternal mortality. Access to contraception allows limiting and spacing pregnancies which thereby lowers each woman’s lifetime risk of unsafe abortion and obstetric mortality. Third, ‘Access to a health facility’ is derived from a question in the family planning section of the DHS module and indicates whether a woman has used the services of a health facility in the last year. Emergency obstetric care facilities (EmOC), another key health systems indicator, are not measured by standard DHS surveys and so the ‘access’ indicator is an imperfect but important substitute for the EmOC indicator.16 Finally, we consider one AIDS knowledge indicator which measures the percentage of women aged 15-24 who know that a person can protect herself from HIV infection by consistent condom use. Though not comprehensive, this set of indicators covers access to the health system, health knowledge and prevention.
For Ethiopia and Kenya, the social stratifiers are education (mother's highest level, grouped into None, Primary and Secondary with Non-formal curricula and strictly religious education excluded), residence (urban or rural), region, ethnicity, wealth by quintile and wealth by poverty line. Ghana’s 1998 DHS does not allow creation of a wealth index because it does not contain information about the appropriate household assets. Ethnicities were recoded into dominant, not dominant, and secondary dominant categories based on relevant literature to create larger classes of stratifiers called the ‘ethnicity recode’
variable (26). A "wealth by poverty line" variable was created using existing wealth indices to complement the stratification by wealth quintile with a simple policy-relevant distinction between rich and poor (27-28). World Development Indicators data for percentage of population living below the poverty line were applied to the wealth index data. In order to create a more policy-friendly indicator, we used external data on the percentage of the population living below the national poverty line. This group below the national poverty line was labelled ‘poor’ while those above the poverty line were labelled ‘non-poor.’
Data are drawn from DHS surveys of Ethiopia (2000), Ghana (1998), and Kenya (1998) (23-25). Measures are calculated from individual level data or recorded from DHS reports and website. Indicator definitions were harmonized across countries when possible. Some of our indicators differ from those in the DHS reports. For example, values of “Don’t Know” or “Missing” were excluded from our analysis, whereas in DHS reports these categories are sometimes explicitly reported, or considered equivalent to “No”. DHS reports contraceptive prevalence rates for women currently in union, whereas we report for all women.
We present simple bivariate analysis as well as ‘simultaneous stratification’ wherein each health indicator is calculated each for all possible joint categories of all pairs of stratifiers.*
Through simple stratification, or bivariate analysis, we determined how the values for each health indicator are distributed across population groups, taking each stratifier in turn (e.g. ethnic group, educational group, etc). Then, in order to assess the combined effect of two forms of stratification, each pair of stratifiers underwent simultaneous stratification (trivariate analysis). For example, we calculate the CPR-MM for women with secondary education in the dominant ethnic group in Kenya, or rate of skilled birth attendance among urban women in the poorest quintile in Ghana.
Results
1. Bivariate Analysis
Despite continued attention to reproductive health issues, maternal and reproductive health status in much of the world remains dismal. For example, in Ghana and Kenya access to a skilled birth attendant stood at just under 45 % while in Ethiopia it was only 5.6%. Yet for almost every stratifier studied across the four indicators, there are statistically significant disparities. In Ethiopia, despite this 5.6% national average, SBA is accessible to women with a secondary education at 45%, women of Tigray ethnicity at 45%, women in Addis at 69.3% and women in the highest wealth quintile at 25.4%.
SBA and CPR-MM
Figure 1a-d displays whiskerplots for two key indicators: SBA and CPR-MM in Kenya and Ethiopia. At a glance, it’s clear that regional variation in SBA in

East African Journal of Public Health Volume 5 Number 3 December 2008
135
135
Ethiopia is quite large. This is skewed due to Addis Ababa (the capital, where about 5% of the population resides), where access to an SBA covers more than two thirds of the women. Secondary education and membership in the highest wealth quintile have enormous benefits in terms of access to a SBA (3% for no formal education versus 45% for secondary) (see Figure 1).
In Kenya, analysis by wealth quintile yields a stepwise gradient for SBA—with a range that is greater than occurs across regions. Secondary education also makes a substantial difference for delivery assistance by SBA (72%, as opposed to 27% for those with ’none’ and 36% for those with ‘primary’). A similar range exists for ethnicity, where 27% of the Mijikenda/Swahili deliver with an SBA and 71% of the Kikuyu deliver with an SBA. In Ghana (not shown) SBA is most unevenly distributed across regions and ethnicities, though education yields a 2.5-fold difference in access at the extremes.
Comparing CPR-MM, in Ethiopia, we see less striking regional variation than with SBA, which is expected, given the extremely low absolute level of coverage (5%). Yet still we see inequities across educational group, region, residence and wealth quintile. In Kenya, access to CPR-MM is lower than access to a SBA. Ethnicity seems to matter more while education matters less in terms of distribution of access across these population groups. Although there is a relatively small difference in CPR-MM for urban- and rural-dwellers (20% vs. 30%), there is a larger differential by region with 40% coverage in the Central region and only 16% along the Coast and Western regions. In Ghana (not shown in Figure 1), the national average for CPR-MM is quite low (11%), and though disparities do exist, they are far less pronounced than was the case for SBA. For CPR-MM disparities across region and ethnicity appear to be the greatest.
Access to a health facility
The ‘access to a health facility’ indicator reveals a different set of disparities. In Kenya, about half of all women sought health care services for themselves or their children within the past year, a statistic that does not vary much by level of education (47% to 55%) or by type of residence (50% to 53%). The differences between the women in the lowest and highest quintiles also ranged only from 45% to 52%, with the main difference being between the two lowest quintiles. But both region and ethnicity do dramatically stratify ‘access’ in Kenya with a twofold difference between groups having the highest and lowest percentages with access to a health facility (significant at 5%).
In Ethiopia, nationwide, 36 % of women visited a health facility in the year previous to the survey. This ‘access’ indicator varies far more by educational level (from 34 to 51%) and by poverty status than it did in Kenya. In Ethiopia, access to health care among the wealthiest quintile is a third higher than the national average. The ethnic group with the highest access is also just a third above the national average (similar to the advantage enjoyed by urban women). By contrast, the
variation across regions and ethnic groups is not as pronounced as in Kenya.
AIDS Knowledge
AIDS knowledge is inequitably distributed across all analyzed population groupings in Kenya, Ghana and Ethiopia. In Ghana, the greatest disparities, in this indicator are between regions (a four-fold differential between the extremes) followed by education and ethnicity (three-fold differentials). In Kenya, the greatest disparity is found in education, though wealth quintile and region as well as residence are not far behind. In Kenya, this indicator is a bit more equitably distributed, with ethnicity, residence and wealth by poverty line showing gaps of 1.5 fold at the extremes. Education is the greatest stratifier in Kenya for this AIDS knowledge indicator. In Ethiopia, however, the low national average of 17% is striated by astounding disparities: a nine-fold difference in AIDS knowledge between mothers with no education and those with secondary education, 20-fold across extremes of ethnic groups; 12-fold across wealth quintile extremes; six-fold across urban/rural residence. In Ethiopia, the national average of condom utilization is zero (modern contraception use stands at 5%)
Thus, the bivariate analysis yields a picture of the level and range of disparities across different indicators and stratifiers—and allows testing for level of statistical significance.
2. Simultaneous stratification
Simultaneous stratification yields surprising results indicating importance of dual forms of marginalization and complexity of inequity. Space does not permit a full analysis of each pair of stratifiers for each indicator. This section highlights a few striking findings with relevance to policy.
Substratifying poverty status:
Even amongst the poor there are enormous inequities
in access to care. As Figure 2 indicates for Kenya, access to an SBA is significantly different by level of education amongst both the ‘poor’ and the ‘not poor’. Non-poor women with no education use SBAs 40% of the time while women with the highest educational levels access a SBA for 77% of deliveries. For the poor, on the other hand, only 19% women with no education access a SBA while women with secondary or more education access SBA at 43%. Importantly, the most highly educated poor women have access to SBA at a rate only equivalent to the rates attained by the ‘not poor’ with no education. It seems that in access to SBA, education is helpful, but still dramatically constrained by poverty status. Figure 3 is a spidergraph of four different maternal health indicators in Ethiopia with different combinations of wealth quintile and education as the ‘strands’ of the web. The Figure depicts the way that membership in the lowest versus the highest quintile is ‘mediated’ by level of education for each of the maternal health indicators depicted.

East African Journal of Public Health Volume 5 Number 3 December 2008
136
136
Substratifying Educational Groups:
The dual effect of education and other stratifiers (e.g. poverty status, ethnicity or residence) is highlighted through simultaneous stratification. In Kenya, within each educational group, there is a clear, stepwise gradient across wealth quintiles in access to skilled birth attendant. CPR-MM amongst women with no education ranges from 10 and 11% respectively in the lowest two quintiles to 22% in the highest quintile. CPR-MM for women with primary and secondary education is similarly stratified across wealth quintiles. On the other hand, for the ‘access to a health facility” indicator, even amongst those with no education, access ranges from 44% in the poorest quintile to 56% in the richest. Surprisingly, in the primary and secondary education groups, the poorest quintile is similar to or higher than the richest quintile among the non-educated for access to a health facility.
Similarly, in Ghana, within each level of education ethnicity groupings reveal disparities. Amongst those with “no education”, the three ethnic groupings exhibit an increasing level of access to SBA—though ethnic differentials seem to decrease as the level of education increases.
In Ethiopia, CPR-MM use is relatively low among all groups, but is especially low for women with either no or only primary education who are also in the poorest wealth quintile (see Figure 3). Not unexpectedly, the highest usage belongs to women with secondary education and in the wealthiest quintile. The range for knowledge about condoms and AIDS is quite substantial. About 75% of wealthy and educated women know that condoms prevent AIDS, while almost none of the poorest uneducated women are aware of that fact. Amongst the top and bottom quintiles, education has a significant effect, but wealth appears more important than education.
When comparing the three countries’ CPR-MM rate in terms of education substratified by urban/rural residence, Kenya has both the best aggregate results but also the largest disparities. In Ethiopia, access to education makes a much bigger difference in use of CPR-MM for urban dwellers as opposed to rural, while in Kenya, this urban/rural distinction makes very little difference.
Substratifying region:
Allocation of national budgets, particularly in the
context of decentralization, is one way to prioritize marginalized geographic areas. However, results from simultaneous stratification show that allocation to a region as a whole will not necessarily reach the most needy. For example, in Ghana, with a national average for access to a SBA of 44%, the Greater Accra region’s rate of 73% might indicate that it should be bypassed for regions of greater need. However, by simultaneously stratifying region by residence, the urban rate for SBA in Greater Accra is 86% and the rural is 23%. In the far more marginalized Northern region, additional stratification shows that SBA is 40% for urban dwellers and 6% for rural dwellers. Likewise, in Kenya, Nyanza is one of the regions with the lowest levels of SBA, yet simultaneous stratification reveals a statistically significant urban advantage over rural areas (see Figure 4). In about half of the regions, education is also a highly significant stratifier of access to SBA. Turning to CPR-MM, and substratification by education, in Greater Accra 7% of women with no education had access to modern methods compared to 14% for those with secondary education.
In Ethiopia, while access to health services in rural areas stands at 33%, in urban areas it is 49 % (the national average is 36%), higher by a factor of 1.5. However, the gap between the ‘worst-off’ region’s rural population and the ‘best-off’ region’s urban population is 2.4. In Greater Accra 7 % of women with no education had access to modern methods compared to 14% for those with secondary education.
While, the relative importance of education and residence are not the same in every country, these results are consistent with the queuing hypothesis29 whereby the better-off benefit first from improvements in access and the worse-off must “wait in line” for their turn.
Figure 1a-d: Whiskerplots of SBA and CPR-MM across six stratifiers for Kenya and Ethiopia*
KENYA: Percentage of births with skilled attendant
0
10
20
30
40
50
60
70
80
90
Education
Ethnicity
Ethnic Recode
Region
Residence
Wealth by
quintile
Wealth by
poverty line

East African Journal of Public Health Volume 5 Number 3 December 2008
137
137
ETHIOPIA: Percentage of births w ith skilled attendant
0
10
20
30
40
50
60
70
80
Education
Ethnicity
Ethnic Recode
Region
Residence
Wealth by
quintile
Wealth by
poverty line
KENYA: Contraceptive Prevalence Rate - Modern Methods
0
5
10
15
20
25
30
35
40
45
50
Education
Ethnicity
Ethnic Recode
Region
Residence
Wealth by
quintile
Wealth by
poverty line
ETHIOPIA: Contraceptive Prevalence Rate - Modern Methods
0
5
10
15
20
25
30
35
40
45
50
Education
Ethnicity
Ethnic Recode
Region
Residence
Wealth by
quintile
Wealth by
poverty line

East African Journal of Public Health Volume 5 Number 3 December 2008
138
138
Figure 2: Percentages of Deliveries Assisted by SBA: Poverty line by Education
Figure 3: Dual effect of education and wealth quintile on four maternal health indicators, Ethiopia, 2000
Delivery Assisted by SBA: Kenya, Poverty line x
education
0
10
20
30
40
50
60
70
80
90
None Primary Secondary
or more
None Primary Secondary
or more
Education Education
Not Poor Poor
Wealth by poverty line
KENYA: Percentage of Deliveries Assisted by SBA:
Poverty line by Education
Ethiopia
0
10
20
30
40
50
60
70
80
90
Access to Health Care - Visited Facility in Last
Year
AIDS Knowledge - A Healthy Person Can Have
AIDS
AIDS Knowledge - Use Condom During Sex
CPR - Modern Method
No educ & bottom 20 No educ & top 20 PrimEduc & bottom 20 PrimEduc & top 20 Sec Educ & top 20

East African Journal of Public Health Volume 5 Number 3 December 2008
139
139
Kenya
0
20
40
60
80
Access to Health Care - Visited Facility in Last
Year
AIDS Knowledge - Use Condom During Sex
CPR - Modern Method
Deliv Assist by SBA
CoastRur CoastUrb Nyanza Rur Nyanza Urb Rift Valley Rur Rift Valley Urb
Figure 4: Maternal and reproductive health indicators simultaneously stratified by region and residence, Kenya, 1998
Discussion
Part of the power of the Millennium Development
Goals lies in their parsimony—eight succinct goals summarize the development aspirations for much of humanity. And yet, the MDGs are complemented by a list of targets which are often augmented by competing national priorities. To some, adding the equity dimension to the goals is just that—an unwelcome addition to an agenda many countries are hard-pressed to meet.
This analysis sought to document some techniques for developing a more nuanced understanding of inequities in maternal and reproductive health in three African countries. As shown here in examples from Ghana, Kenya and Ethiopia, the ramifications of the stratified data on maternal and reproductive health from poor countries deserve serious attention. And though adding an equity dimension to the MDGs may complicate the course toward meeting them, it seems a systemic reduction in poverty, in all its forms, requires just such an endeavour. Certainly, oversimplifying our approach to poverty reduction and to maternal health is not the answer.
First, it is important to note that basic data on reproductive and maternal health is available in countries such as Ghana, Ethiopia and Kenya and amenable to fairly simple statistical equity analysis. In the last several years, analysis of DHS data by wealth quintile has both pushed and supported the growing interest in ‘reaching the poorest (8). And for almost every maternal or reproductive health indicator in each country studied here, wealth quintiles are a strong, statistically significant stratifier. But other stratifiers—ethnicity, maternal education, region and residence—are similarly significant and often more pronounced.
Second, the technique of simultaneous stratification
used allows a quantitative assessment of how dual forms of marginalization affect key health indicators. As one might expect, multiple forms of marginalization often confer greater risk. We present some results based upon substratifying poverty, education and region. These results suggest that in order to fine-tune policies to reach the most marginalized, simple allocation formulas targeting a particular region or ‘the poor’ are not be sufficiently nuanced.
In a full country-level analysis, other indicators and stratifiers (including age) could enhance the utility of this exercise. And other indicators such as antenatal care, postnatal care, place of delivery and age at first marriage (10,30,31), are important components of a full suite of reproductive health indicators. The use of the Sisterhood Method to stratify MMR by poverty level is an important methodological advance that could be replicated (9), and better indicators could be constructed to get at harder issues related to access to Emergency obstetric care (EmOC) (16).
Though inequities abound, the patterns and breadth of the disparities are varied depending upon which indicator and which country is studied. This large variability in the magnitude of inequities reveals that they are not somehow fixed or natural (12). The results for Kenya show that the present patterns of development are able to ensure equity in the process of improvement. Our findings have direct implications for policies as well as broader conceptual ramifications.
The primary policy implication is that policies such as the PRSPs and MDG-focused development could and should become more equity-focused. Policies must be aligned with reducing health gaps in access to key maternal health services. The MDG targets themselves can be framed in terms of the precise health gaps that

East African Journal of Public Health Volume 5 Number 3 December 2008
140
140
need to be closed while reaching the MDG, and indicators can be monitored for trends over time (16). The information on disparity could help to modify the ‘top down’ pattern so often seen. In order to ensure that equity remains on the radar screen, the MDG targets should be worded so as to explicitly reference the health gaps that should be remediated (16).
Other MDGs are also determinants of health—notably, education (MDG 2) and poverty (MDG 1). Overt attention to these links between the MDGs is also critical. Poverty is multi-dimensional—the wealth quintile focus must be complemented by a broader conception of marginalization that includes ethnicity, geography and educational level.
The link between women’s education and health is reinforced by the data presented here. In Ghana, for example, education is one way in which ethnic disparities are mediated—and another reason to embrace women’s education as a key input to the development process. Admittedly, choices must be made—direct intervention to reduce health disparities would perhaps more quickly close the health gap between educational groups as action on these gaps can’t wait a generation for all women to reach secondary education.
Ethnicity is politically fraught and sometimes coupled with other forms of disadvantage. Some countries are tackling the issues of indigenous populations head on by specifying new MDGs or targets that prioritize certain ethnic groups.19 For others, such an approach would be politically risky.
Conceptually, the variation in the degree of inequities across indicators and by country may call for innovative approaches and a more calibrated approach to equity. For example, some countries have considered an index which takes into account multiple dimensions of deprivation including geographic location, income poverty and ethnicity. In every case, these measures should act only as a starting point and in-depth qualitative research should be used to compliment the numerical findings. Countries can use simple statistics to begin this process, but must tailor their programs to fit the specific needs of their population. In addition, special attention must be paid to conflict-laden regions, where the most affected populations may also be the least likely to be included in demographic surveys. Though equity analysis does highlight particular groups of the population that are marginalized, this finding in itself does not lead to a policy recommendation for targeting of health programs. Indeed, the complexity and variation in inequities may suggest universal coverage as a more efficient, effective means of improving maternal health.
Conflict of interest statements
The authors declare that there are no conflicts of
interest. All authors had full access to the data used in this paper and the responsibility for the decision to submit for publication.
Role of funding source
This work was undertaken as a partnership between UNICEF and CIESIN, part of the Earth Institute at Columbia University. The original data analysis was funded by the UN Millennium Project’s Task Force 4 on Child health and maternal health and later by the World Bank Poverty Mapping Project of the Japan PHRD. This work resulted in a large data set encompassing six countries and this paper is a separate outgrowth of that original dataset and the associated background paper. M Wirth was an independent consultant to CIESIN . E. Delamonica was employed by the Research Division at UNICEF. A. Minujin was at the New School for Social Research. D. Balk, A. Storeygard and E. Sacks were employed by CIESIN, The Earth Institute for the bulk of the time during which this work was undertaken.
This paper was presented in various stages at the UNU-WIDER Conference on Health Equity in Helsinki, Finland, October 2006 (E.S.); the Women eliver Conference in London, UK, October 2007 (E.S.); the IUSSP International Seminar on Health Inequities, Cairo, Egypt, February 2008 (E.S.); and the Unite for Sight Global Health and Development Conference at Yale University, Connecticut, US, April 2008 (M.W. and E.S.).
References 1. Stanton C, Blanc A, Croft T, Choi Y. Skilled care at birth in the developing
world: progress to date and strategies for expanding coverage. Journal of
Biosocial Science 2006 Mar 8:1-12.
2. Wagstaff A, Claeson M. Millennium Development Goals for Health,
Nutrition and Population: Rising to the Challenges. Washington D.C: World
Bank 2004.
3. Road Map for Accelerating the Attainment of the MDGs Related to Maternal
and Newborn Health in Africa: African Regional Reproductive Health Task
Force, 2004.
4. Vega J, Irwin A. Tackling health inequalities: new approaches in public
policy. Bulletin of the World Health Organization 2004;82(7):482.
5. Minujin A, Delamonica E. Mind the Gap! Widening Child Mortality
Disparities. Journal of Human Development 2003a;4(3):397-418.
6. Pande RP, Yazbeck AS. What’s in a country average? Wealth, gender and
regional inequalities in immunization in India. Soc Sci Med
2003;Dec;57(11):2075-88.
7. Gwatkin DR, Rutstein S, Johnson K, Suliman EA, Wagstaff A. Initial
country-level information about socio-economic differences in health,
nutrition, and population. Washington, DC: World Bank, 2003.
8. Gwatkin DR. Who would gain most from efforts to reach the Millennium
Development Goals for health? An inquiry into the possibility of progress
that fails to reach the poor. HNP Discussion Paper. Washington, DC: World
Bank, 2002.
9. Graham WJ, Fitzmaurice AE, Bell JS, Cairns JA. The familial technique for
linking maternal death with poverty. Lancet 2004;363:23–27.
10. AbouZahr C, Wardlaw T. Antenatal care in developing countries: promises,
achievements and missed opportunities. An analysis of trends, levels, and
differentials, 1990–2001. Geneva: World Health Organization and United
Nations Children’s Fund, 2004.
11. Minujin A, Delamonica E. Equality Matters for a World Fit for Children:
Lessons from the 90s. UNICEF Staff Working Papers: Division of Policy and
Planning Series, 2003b.
12. Kunst AE, Houweling T. A Global Picture of Poor-rich Differences in the
Utilisation of Delivery Care. In: Brouwere VD, Lerberghe W.Van ed. Safe
Motherhood Strategies: A Review of the Evidence. Antwerp: ITG Press,
2001: 297-315.
13. Pate E, Collado C, Solís JA. Health Equity and Maternal Mortality.
http://www.paho.org/English/DBI/Op08/OP08_09.pdf. Accessed April 1,
2006
14. McCoy D, Rowson M. Improving Maternal Health in Low and Middle
Income Countries Effectively and Equitably. New York, 2004.
15. Matthews Z. Maternal Mortality and Poverty. London: DFID Resource
Centre for Sexual and Reproductive Health, 2002.
16. Task Force on Child Health and Maternal Health. Who's Got the Power?
Transforming Health Systems for Women and Children. New York: UN
Millennium Project 2005.
17. Alston P. Ships Passing in the Night: The Current State of the Human Rights
and Development Debate seen through the Lens of the Millennium
Development Goals. Human Rights Quarterly 2005;27(3):755-829.
18. Braveman P, Gruskin S. Defining equity in health. Journal of Epidemiology
and Community Health 2003;57:254-258.
19. Tomei M. Indigenous and Tribal Peoples: An Ethnic Audit of Selected
Poverty Reduction Strategy Papers. Geneva: International Labour Office,
2005.

East African Journal of Public Health Volume 5 Number 3 December 2008
141
141
20. Secretariat of the Commission on Social Determinants of Health. Towards a
Conceptual Framework for Analysis and Action on the Social Determinants
of Health. Geneva: WHO, 2005: Discussion paper for the Commission on
Social Determinants of Health.
21. Buckle G. Do PRSP’s Deliver? Ghana Case Study: National Catholic
Secretariat, Department of Health, Ghana, 2003.
22. Ayalew Z, Christie L, Cota C, et al. Evaluating the Impact of PRSP on Child
Poverty: the case of Bolivia. UNICEF Working Paper. New York, 2005
23. Central Statistical Authority [Ethiopia] and ORC Macro. (2001). Ethiopia
Demographic and Health Survey 2000. Addis Ababa, Ethiopia and
Calverton, Maryland, USA: Central Statistical Authority and ORC Macro.
24. Ghana Statistical Service (GSS) and Macro International Inc. (MI). (1999).
Ghana Demographic and Health Survey 1998. Calverton, Maryland: GSS
and MI.
25. National Council for Population and Development (NCPD), Central Bureau
of Statistics (CBS) (Office of the Vice President and Ministry of Planning and
National Development) [Kenya], and Macro International Inc. (MI). (1999).
Kenya Demographic and Health Survey 1998. Calverton, Maryland: NDPD,
CBS, and MI.
26. Brockerhoff and Hewett. Inequality of child mortality among ethnic groups
in sub-Saharan Africa. Pp. 30-41. Bulletin of the World Health Organization
2000 78(1)
27. Filmer D, Pritchett L. Estimating wealth effects without expenditure data—
or tears: an application to educational enrollments in states of India.
Demography 2001;38:115–32.
28. Sahn DE, Stifel DC. Poverty Comparisons Over Time and Across Countries
in Africa. World Development 2000;28(12):2123-2155.
29. Vandemoortele J. Absorbing social shocks, protecting children and reducing
poverty: The role of basic social services. Evaluation, Policy and Planning
Series. New York: UNICEF, 2000.
30. Wirth M, Balk, D et al. Setting the stage for equity-sensitive monitoring of
the maternal and child health MDGs. Bulletin of the World Health
Organization. 2006:84(7).
31. Magadi MA, Zulu EM, Brockerhoff M. The inequality of maternal health
care in urban Sub-Saharan Africa in the 1990s. Population Studies
2003;57(3):347-366.

East African Journal of Public Health Volume 5 Number 3 December 2008
142
142
Introduction
The survival of children in developing countries
depends on the family’s’ and community’s ability to access basic needs to support life. Each year at least 3 million children under the age of five die in the developing world due to environmental-related illnesses (1). Worldwide, diarrhea claims the lives of 2 million children each year. Over 80-90% of these cases are due to environmental conditions in particular inadequate water supply and sanitation (2). Almost 42 million people in Kenya, Uganda and Tanzania do not have access to improved water supply and 13 million do not have improved sanitation facilities (3). Evidence indicates that the primary causes of many childhood illnesses in the three countries are water related (4). Among these illnesses, diarrhea remains one of the most important environmental health problem. Integrated Management of Childhood Illness [IMCI] is the main framework within which the current child health interventions are implemented in developing countries. Stronger emphasis was initially on the treatment and management of cases. However, a community component [Community IMCI] was introduced with a set of sixteen key family practices which aim at addressing child health, survival and development at household and community levels. The family practices target among others, diarrhea prevention and control through use of safe water supplies and
Contact Author: Doreen M. Othero, Maseno University, School of Public Health and
Community Development, Private Bag, Maseno-Kenya, E-mail:
[email protected] or [email protected]; Tel: +254 722762222, 734893307
1Maseno University, School of Public Health,
2 Kenya National AIDS Control
Council, 3Kenyatta University, Communication Technology Department,
4.Great
Lakes University of Kisumu, 5Kenyatta University, Sociology Department
sanitation facilities, food hygiene, correct management of diarrhoea at home, prompt referral of a sick child and adherence to advice and treatment. The objective of this study was therefore to explore the mothers’/caregivers’
perceptions on the causes of diarrhoea among under-fives and how it is managed at home before seeking help from skilled health service providers. The study was done in Nyando District Kenya, between 2004 and 2006. The variables investigated included: perceived causes of diarrhoea, action taken during diarrhoeal illness, recognition of signs of dehydration, feeding and fluid intake during diarrhoeal illness, feeding during convalescence and follow-up and compliance to treatment.
Literature Review
Diarrhoea remains one of the leading killers of young children. Perceptions of mothers regarding causes of diarrhoea in children are a recipe to timely and proper management at home and subsequent referral for skilled care. The education of mothers on home management of diarrhoea and the proper use of ORS can significantly reduce complications related to diarrhoea. A study by Ene-Obong et.al (5) in Nigeria revealed that majority of mothers perceived that diarrhoea was caused by teething. In most of the cases, mothers treated diarrhoea with a combination of drugs including antibiotics, anti-diarrhoeal and herbal medicine. These drugs were prescribed mainly by mothers themselves and local shopkeepers. Knowledge on the adverse effects of the drugs was found to be minimal hence underscoring the need for appropriate primary care education among mothers.Bhutta (6) indicated that a two-week course of zinc once daily significantly reduced severity and duration of diarrhoea and mortality in young children. The need for adequate instructions to the mothers on administration of the zinc tablets was underscored. A study by Ellis et.al (7) in Mali revealed that although nearly all mothers knew that Oral Rehydration Solution (ORS) could replace lost fluids, its inability to stop diarrhoea caused them to seek antibiotics from local markets, traditional medicines or anti-malarials to cure the illness. Parents often deemed ORS insufficient
Abstract
Introduction: Diarrheal disease is a major cause of morbidity and mortality among under-fives especially in rural and peri-urban
communities in developing countries. Home management of diarrhea is one of the key household practices targeted for enhancement
in the Community Integrated Management of Childhood Illness (C-IMCI) strategy.
Objective: The aim of this study was to determine the perceptions of mothers/caregivers regarding the causes of diarrhea among
under-fives and how it was managed in the home before seeking help from Community Health Workers or health facilities.
Design: A household longitudinal study was conducted in Nyando district, Kenya in 2004-2006 adopting both qualitative and
quantitative approaches.
Subjects: A total of 927 mothers/caregivers of under-fives participated in the study.
Main outcome measures: Perceived causes of childhood diarrhoea, action taken during diarrhea, fluid intake, recognition of signs of
dehydration, feeding during convalescence, adherence to treatment and advice.
Results: Majority of the respondents 807(87.1%) reported that their children had suffered from diarrhea within the last 2 weeks before
commencement of the study. Diarrhea was found to contribute to 48% of child mortality in the study area. Perceived causes of
diarrhea were: unclean water 524(55.6%), contaminated food 508(54.9%), bad eye 464 (50.0%), false teeth 423(45.6%) and breast
milk 331(35.8%). More than 70% of mothers decreased fluid intake during diarrhea episodes. The mothers perceived wheat flour, rice
water and selected herbs as anti-diarrheal agents. During illness, 239(27.8%) of the children were reported not to have drunk any
fluids at all, 487(52.5%) drunk much less and only 93(10.0%) were reported to have drunk more than usual. A
significant 831(89.6%) withheld milk including breast milk with the notion that it enhanced diarrhea.
Conclusion: Based on these findings, there is need to develop and implement interactive communication strategies for the health
workers and mothers to address perceptions and misconceptions and facilitate positive change in the household practice on
management of diarrhea among under-fives.
HOME MANAGEMENT OF DIARRHEA AMONG UNDERFIVES IN A RURAL COMMUNITY IN
KENYA: HOUSEHOLD PERCEPTIONS AND PRACTICES
Doreen M. Othero1, Alloys S.S Orago2, Ted Groenewegen3, Dan O. Kaseje4 and Otengah P.A5

East African Journal of Public Health Volume 5 Number 3 December 2008
143
143
and judged that an additional treatment should be combined with ORS to cure diarrhoea.
An observational study in Somalia by Ibrahim et.al., showed that use of ORS during childhood diarrhoea at home was popular among infants compared to older children, as were children in smaller households. ORS was used mostly by non-farming, young and literate mothers. The findings suggested that the use of ORS is associated with a mother’s ability to allocate time to health care and her general position in the household since mothers in-law and husbands also made decisions on the management of sick children at home.
Materials and Methods
Study area and population
Nyando District is one of the 112 districts that make
Kenya and one of the 16 districts in Nyanza Province. It lies in the eastern part of a large lowland surrounding the Nyanza Gulf, much of it comprising of predominantly black cotton soils with poor drainage and perennial flooding. The top five diseases causing morbidity and mortality among under-fives in Nyando district are: malaria, acute respiratory tract infections, malnutrition, diarrhoea and measles. Lack of access to safe drinking water is a major cause of diarrhoeal diseases. The latter are prevalent despite the fact that the district has expansive water surfaces most of which is raw and unclean water. The study population comprised of mothers/caregivers of under-fives residing in the study area for a period of not less than six months. Ministry of Health staff and Community Own Resource Persons (CORPs) were also interviewed.
Data collection
To determine the mothers’/caregivers’ practices on the causes and management of diarrhoea, a semi-structured questionnaire was administered to 927 randomly sampled respondents in 3 out of the 5 divisions that form the district. To explore the experiences, knowledge and perceptions on management of diarrhoea, six homogenous focus group discussions (FGDs) were held with purposively selected groups of mothers/caregivers and community health workers. A total of 42 key informants (KIs) were also interviewed including 4 health workers at policy level, 12 implementing health workers, 12 community leaders and 14 community health worker group leaders. These KIs were purposively selected based on their involvement in implementation of child health programmes or position in the community. FGD and key informant thematic guides were used to collect qualitative data.
Health workers provided information on the link between the community and the health facilities, the kind of facilitation they provided to enhance referral of children with diarrhoea and their experiences about mothers’/caregivers’ health seeking behaviour.
Data analysis and presentation
Quantitative data was analyzed using SPSS version
12.0 to generate frequencies and cross tabulations. The
key variables investigated were: perceived causes of diarrhoea among children, danger signs in a child with diarrhoea, remedies for treating diarrhoea at home, fluid replacement for a child with diarrhoea, feeding of a child with diarrhoea, seeking skilled treatment for a child with diarrhoea, follow-up and adherence to health worker treatment and advice. Qualitative data was manually transcribed, categorized and summarized according to the study objectives. Recurrent and emerging themes were identified and organized into meaningful categories with verbatim reporting where necessary. For comprehensiveness, quantitative and qualitative data was integrated for complementary and validation purposes.
Results
Age, gender and marital status of respondents
A total of 927 mothers/caregivers responded to the
questionnaire majority of them being females 896 (96.7%) aged between 15 and 25 years. A small proportion 28 (3.0%) were grandparents aged between 49-56 years and were basically caring for their orphaned grandchildren. Age, gender and marital status of the respondents were not significant factors (P=0.06, 0.08 and 0.05 respectively).
Table 1: Age and marital status of respondents
Age Distribution Frequency Proportion (%)
15-25yrs 608 65.6 26-35 yrs 257 27.8 36 - 45 yrs 57 6.1 >45 yrs 5 0.5 Total 927 100
Marital status
Single 94 10.1 Married 753 81.3 Divorced 3 0.3 Separated 3 0.3 Widowed 74 8.0
Total 927 100
Perceived causes of diarrhoea
A large proportion 814 (87.8%) of the respondents
affirmed that their last child had suffered from diarrhoea in the last two weeks. The commonest perceived cause of diarrhoea was unclean water 539 (58.2%) followed by bad food 490 (52.9%) as shown in Figure 1.
Recognition of signs of dehydration
The study investigated the mothers’ and caregivers’ knowledge on signs of dehydration which are indicative of severe illness. These included: excessive thirst, sunken eyes and fontanel, skin pinch returning slowly and excessive drowsiness or unconsciousness. Action taken in case of the above signs was also investigated. Majority of respondents 692 (76.4%) were not able to mention any of the danger signs. Only 29 (3.1%) of the mothers new all the danger signs. Knowledge of danger signs is important because it leads to early referral of very sick children. Failure to refer such children results in major complications or death.

East African Journal of Public Health Volume 5 Number 3 December 2008
144
144
Action taken during diarrhoea
Most of the mothers reported to have given their
children anti-diarrhoeal drugs (45.3%), home-made fluids (18.7%), taken to the health facility (14.9%), given ORS (13.4%) and given herbal medicine (7.7%) as shown in figure 2 below. In-depth interviews with Community Health Workers (CHWs) as key informants revealed that mothers in the study area lacked adequate knowledge on the management of diarrhoea. They further affirmed that misconceptions of the causes of diarrhoea contributed to its mismanagement.
Figure 1: Perceived causes of diarrhoea among under-fives
52.958.2
42.646.9
33.1
0
10
20
30
40
50
60
Pro
portio
n (%
)
Bad food Unclean
water
False teeth Bad eye Breast milk
Perceived causes of diarrhoea
Figure 2: Action taken when child had diarrhoea
14.9
7.7
18.713.4
45.3
05
101520253035404550
Gave
antidia
rrhoel
dru
g
Gave O
RS
Gave h
om
e-
made flu
ids
Gave h
erb
al
medicin
e
Took to
health facility
Action taken
Pro
portion
Fluid intake and feeding during diarrhoea
The study investigated the mothers’/caregivers’
feeding practices during child diarrhoea. The respondents were asked whether the child was given less, same amount or more than usual to eat and/or drink during the last attack of diarrhoea. Majority of respondents 465 (50.2%) reported that the children drunk much less, 90 (9.7%) affirmed that the children drunk more than usual while 256 (27.6%) reported that the child did not drink or eat
anything during the last attack of diarrhoea details of which are shown in figure 3. Figure 3: Fluid intake during illness
10.9
5.3
3.3
20.5
59.9
0.0
10.0
20.0
30.0
40.0
50.0
60.0
70.0
Did not
drink at all
Much less Somewhat
less
About the
same
More than
usual
Fluid intake
Pro
portio
n (%
)
On responding to the question on whether the children ate less, the same or more than usual during illness, again responses indicated that majority of them 362(39.0%) did not eat at all during illness, while only 64(6.9%) ate more than usual. Those who withheld feeds and fluids felt that continued feeding increased the frequency of lose stools. One mother in a focus group discussion stated: “…the
more fluids a child drinks when he/she has diarrhoea, the
more frequent the lose stools and more so milk…” This misconception could result into many children suffering from dehydration and finally death.
Feeding during convalescence
On feeding during convalesce, 719 (77.6%) of the respondents reported that the children ate the same as usual (Figure 4). Findings from focus group discussions with mother/caregivers revealed that knowledge deficit on the need to increase feeds was the main problem why some sick children were not fed adequately during or after illness. These findings depicted a dangerous trend because there was no compensation for the worn out cells and tissues as the children still fed on the usual amount they were eating before illness. This could be a recipe for malnutrition.

East African Journal of Public Health Volume 5 Number 3 December 2008
145
145
Figure 4: Child feeding during convalescence
75%
16%
9%
Same as usual
More than usual
Don’t know
Follow-up and compliance with treatment
A significant proportion of respondents 421 (45.4%) reported that they stopped giving the children medication on noting improvement in the condition. Most of the respondents had a misconception that too much medication in the children’s bodies was not safe and they expressed that completion of the prescribed medicines would amount to overdosing the children. A small proportion 255 (27.5%) affirmed having taken the children back to the health facilities for review following completion of medication as shown in table 2 below. Most of them did not understand why it was necessary to take the children back if the latter had improved.
Table 2: Follow-up and compliance to treatment
Follow-up and Compliance N=927 Proportion (%)
Demonstration given on administration of medicine
305 32.9
Medication completed 506 54.6
Child taken back for review 255 27.5
Advice given on home care 260 28.1
Counselling done on prevention of recurrence of infection
180 19.4
Multiple responses
Discussion
According to the Community Integrated Management of Childhood Illness (C-IMCI) strategy (3), caregivers at home should have adequate knowledge on the causes and treatment of diarrhoea using appropriate remedies including home-made fluids such as porridge, fresh fruit juices, milk, salt/water solution and breast milk but not herbs. Meanwhile a child is closely observed for any signs of dehydration following which urgent referral is made. This study established that most mothers gave their children anti-diarrhoeal drugs (45.3%) and gave less fluid (50.2%), no food (39.0%) and argued that continued feeding made the diarrhoea worse, a practice that predisposed the child to severe dehydration. This is in line with a study in Mali by Ellis et.al (7) which revealed that nearly all parents interviewed knew that Oral Rehydration Solution (ORS) could replace lost fluids, but its inability to stop diarrhoea caused parents to seek antibiotics from
local markets, traditional medicines or anti-diarrhoeal drugs to cure the illness. The notion of combining multiple treatments to ensure the greatest therapeutic benefit was prevalent, and modern medicines were often administered simultaneously with traditional therapies.
Appropriate home treatment also involves early recognition of the illness, prompt use of relevant pharmaceuticals and avoidance of ineffective and harmful treatments. Baros and Victoria (8) in their study on breast feeding and diarrhoea among Brazilian children affirmed that not all infections needed to be treated by health professionals. Uncomplicated diarrhoea could be managed successfully at home by continuing to feed the child, offering more fluids and administering Oral Rehydration Solution (ORS) correctly.
Interventions to improve home treatment of diarrhoea could reduce child deaths by up to 40%. It is therefore required that a child’s feeds are increased during illness in order to help the body fight the offending organisms. Due to the likely loss of appetite, the feeds should be appetizing and nutritious and given in small frequent amounts according to the child’s ability to tolerate. It also recommends that during convalescence, the feeds should be increased to help the body develop new cells to replace the ones worn out during illness. This study established that most children drunk and fed less than usual when they were sick and the most common feeds were made of starchy porridge. These findings are similar to a study by Jinadu et.al (9) in Nigeria which revealed that mothers perceived raw corn starch as an antidiarrheal agent and thought that any foods with sugar including breast milk caused frequent watery stool.
This study established that a significant proportion of respondents (45.6%) stopped giving the children medication on noting improvement in the condition. Most of the respondents observed that too much medication in the children’s bodies was not safe and they felt that completion of the prescribed medicines would result in overdosing the child. A minority of the respondents (27.5%) reported having taken the children back to the health facilities for review following completion of medication. To ensure that sick children recover quickly and completely, caregivers must adhere to the advice given by the health provider. Improving compliance to dosage and consumption of drugs is also important for reducing build up of resistance to medications. Similar findings were revealed in an evaluation survey of communication strategies for Community IMCI by USAID and DFID in 2001 as reported by WHO (2). The survey further showed that very few mothers followed advice given by the health workers and most of them tended to share the medicines with other mothers.
Conclusions
This study has demonstrated that mothers/caregivers
have diverse perceptions on causes and treatment of diarrhoea some of which are harmful to the health of a child. Key among the findings is inability to recognize signs of dehydration and the use of anti-diarrhoeal drugs to stop diarrhoea. However, some reported practices such as use of home made fluids are useful hence the need for their enhancement. There is need to implement interactive

East African Journal of Public Health Volume 5 Number 3 December 2008
146
146
communication strategies for mothers/caregivers and health workers at community level in order to facilitate sustainable positive change in the practice on home management of diarrhoea among under-fives. The communication strategies should recognize the key role played by culture in influencing perceptions of the mothers/caregivers.
References 1. Rukunga G, Mutethia D, Kioko T. Assessment of Environmental Interventions
for Child Survival in Kenya, WELL Scoping Study 2002, WELL - WEDC, UK
2. WHO. The Management of nutrition in major emergencies. WHO 2002
(Decision Chart), Geneva, 2002:.75
3. WHO/UNICEF. Integrated Management of Childhood Illness Information,
Division of Child and Adolescent Health and Development 1999. Switzerland
4. Sharma NP et al. African Water Resources: Challenges and Opportunities for
Sustainable Development. World Bank Technical Paper Africa Technical
Department Series 1996, Washington, USA.
5. Ene-Obong HN, Iroegbu CU, Uwaegbute AC. Journal of Health, Population
and Nutrition, 2000; 18(2):97-102.
6. Bhutta PM. Therapeutic effects of oral zinc in acute and persistent diarrhoea
in children in developing countries: Pooled analysis of randomized controlled
trials. American Journal of Clinical Nutrition 2000, 72(6):1516-1522).
7. Ellis AA, Winch P, Daou Z, Gilroy KE, Swedberg E. Social Science and
Medicine 2007, 64(3):701-702.
8. Baros F and Victoria, G . “Breastfeeding and diarrhoea in Brazilian children”.
The population Council of New York, New York 2000, USA.
9. Jinadu MK, Odebiyi O, Fayewonyom BA. Tropical Medicine and
International Health 1996, 1(5):684-9.
10. Ibrahim MM, Aden AS, Omar HM, Wall S, Persson LA. Annals of Tropical
Paediatrics 1994, 14(3):215-22.
11. Kenya Demographic and Health Survey. National Council for Population and
Development. Ministry of Planning and National Development 1993.

East African Journal of Public Health Volume 5 Number 3 December 2008
147
UTILIZATION OF THE HEALTH CARE DELIVERY SYSTEM IN A DISTRICT OF NORTH INDIA.
Nath Bhola1, Kumari R1, and Tanu Nidha2
Abstract
Background: India has one of the most extensive health infrastructures- a three-tier hierarchical referral system- for the provision of
effective and efficient health services to the majority of its population. In this study we have tried to evaluate the utilization of such a
wide health infrastructure and the various factors affecting it. We have also tried to find the factors that motivated the patients to visit
the present health facility and the key persons who motivated them to do so.
Methods: Time bound cross-sectional study.
Setting: Three types of referral health facilities in Lucknow District
Participants: A total of 1265 patients were interviewed during the four months of the period of survey from these three types of
referral health facilities.
Results: The present study revealed that majority of the patients coming to all the three referral centres were the new patients (89%),
about two-thirds of whom had come there directly. Overall, only one tenth of the patients attending the secondary and tertiary level
public health facilities were referred by someone. Most of the indirect patients had self referred themselves. About eight and nine
percent of the indirect and referred patients could reach the present site of treatment only after more than two years of rummaging
and about 13% and 11% had spent more than ten thousand rupees respectively, which in some cases even amounted to lakh rupees.
Conclusions: The utilization of the referral system of the health care delivery in India needs to be augmented. Before planning future
reforms such as decentralization, incorporation of the Indian system of Medicine, and other steps we need to develop mechanisms to
see that the plans are materialized.
Key Words: Utilization, Health care delivery System, Cost effectiveness, Referral System, India
Introduction
Health services in India rest traditionally upon a
three-tier hierarchy of central, intermediate and peripheral levels (1,2). With the aim of achieving an optimal level of health for its people, the Government of India launched the Rural Health Scheme in 1977 which is a three-tier system of health care delivery in rural areas based on the recommendations of the Srivastav Committee in 1975 (3). Apart from other areas of action, the committee recommended the development of a ‘Referral Services Complex’ by establishing proper linkages between the Primary Health Centre and higher level referral and service centres (4). The flow of health services in different countries is similar with some variations tailored according to the existing situation as is depicted in the Figure 1 (5). The results of the present study therefore can be applied in different situations based on the specific needs.
The objective of the present study was to evaluate the adequate utilization of such a wide and huge health infrastructure which may be influenced by its accessibility and the cost effectiveness of the services apart from various other factors. We have also tried to calculate the expenditure incurred and the duration spent by the indirect and the referred patients prior to the arrival at the present health facility. We have made an effort to postulate the reasons for the existing lacunae in the system and thus provide food for thought to the planners.
Correspondence to: Dr. Bhola Nath, 124A/186, Block No.11, Govind Nagar,
Kanpur, Uttar Pradesh, 208006 – India, Telephone No. +91-9415161823
E-mail [email protected], [email protected], 1Department of Community
Medicine, 2King George Medical University, Lucknow, India
Department of Community Medicine, G.S.V.M. Medical College, Kanpur
Methodology
Study Design
The present study was a cross sectional study conducted among the patients attending the government allopathic health facilities of Lucknow, a centrally placed district of Uttar Pradesh, a state in north India.
Setting
The sampling frame consisted of all the allopathic government health facilities of Lucknow district providing secondary and tertiary levels of health care. At the Tertiary level, it consisted of the King George Medical University and Sanjay Gandhi Post Graduate Institute with their associated hospitals. At the secondary level, Balrampur District Hospital, Civil hospital and eight Community Health Centres were included in the sampling frame.
Period of study
The data collection was carried out from April 2006 to July 2006.
Sampling
Sample Size
The number of patients interviewed was limited by the time frame of the survey. We could interview a total of 1265 patients during the four month survey period at the four health facilities.
Sampling Technique
At the tertiary level, Medical College (MC) was randomly selected while at the secondary level, Balrampur District hospital and two Community Health Centres (CHCs) were randomly selected. Further at the Medical College a total of 669 patients could be interviewed at the Out-Patient Departments (OPD) of

East African Journal of Public Health Volume 5 Number 3 December 2008
148
Medicine, General Surgery, Obstetrics and Gynaecology, Paediatrics, Orthopaedics, Otorhinolaryngology, Ophthalmology, Cardiology, Neurology, Tuberculosis & Chest diseases. At the District hospital (DH), 395 patients attending the OPD’s of Medicine, General surgery, Obstetrics & Gynaecology and Paediatrics were interviewed while 201 patients were interviewed from the two randomly selected CHCs.
Selection of the participants
The selection of the patients was through systematic random sampling, depending upon the previous years OPD attendance and the time taken to complete the interview.
Inclusion Criteria:
A “new” or “referred” patient attending the OPD of the respective health care facility was included in the study. A “new” patient was any patient attending the present health facility for the first time for the present episode of illness. The new patients were again divided into two groups of “direct” and “indirect” patients. The “direct” patients were those who had not consulted anywhere else and had come directly to the present health facility for the present episode of illness, while the “indirect” patients had consulted at other health facilities prior to the visit to the present health facility. These “indirect” patients had either self referred themselves or had been motivated by someone. They were not provided with a written referral note even if they were motivated by a doctor. The “referred” patients included those referred to the present health care facility with a referral note by a health professional.
Exclusion Criteria
Patients working in the health care facility, Follow up patients attending the OPD of the respective health care facility, Tools of data collection:
Permission to conduct the study was obtained from the respective health care facilities. Informed verbal consent was taken before starting the interview from each patient after explaining him/her the objectives of the study. To ensure comparability of the data collected, the interview was taken by the same person at each of the health facility. A quantitative structured interview schedule was used to record information pertaining to the sociodemographic characteristics of the patient, the motivating factors that brought them to the health facility, the reasons for coming to the present health facility after having consulted somewhere else, the duration of treatment at the other health facility and the expenditure in terms of direct costs incurred in the process. We also asked the patients about the person who motivated him/her to visit the present health facility as well as the qualification of the doctor who referred the patient.
Analysis
Data were tabulated on Microsoft Excel sheet and analyzed using the software `Epi Info version 6 and Microsoft Excel (Analysis toolpak) for Windows XP.
Results
It was observed that the majority of the patients were in the economically productive age group. The distribution regarding the locality of the patients was in accordance with the distribution of the population in the district, with around 70% coming from an urban locality. As expected the proportion of the urban patients was more in the MC and the DH while that at the CHC mostly consisted of the rural population. It was observed that most of the patients coming to the public health facilities were the new patients, about two-thirds of which had come directly. Only one tenth of the patients attending the secondary and tertiary level public health facilities were referred by a health professional (Not shown in the table).
Faith on the doctors and health facility (81%), availability of the specialists (54.5%), the proximity of the health facility (29%) and cost effectiveness of the treatment provided (24.8%) were cited as the major reasons for direct visit to the health facility (Table 1).
Inability to derive any substantial benefit from the treatment provided at the other health facilities was the most common reason (87.1%) for the visit to the present health facility in the indirect patients. About 17% and 13% of the patients cited cost effectiveness of the public health facilities and the availability of a specialist respectively as a reason for the change in the place of consultation (Table 2).
While some significant differences were observed in the duration spent to reach the present health facility between the indirect patients and the referred patients at the various health facilities, the differences were not found to be significant on the whole except for those who took six to twelve months to reach the present health facility. Unfortunately, eight and nine percent of the indirect and the referred patients respectively could reach the present site of treatment only after more than two years of rummaging (Table 3).
Evaluation of the direct costs involved in obtaining the treatment prior to arrival at the present health facility revealed that about three out of five patients had spent more than 1000 Rupees before visiting the present health facility in both the groups, with about 13% and 11% of the indirect and the referred patients respectively spending more than ten thousand rupees, which in some cases even amounted to lakh rupees (Table 4). We observed no statistically significant differences with respect to the expenditure in the two groups of the patients.
Most of the indirect patients (76.2%) had self referred themselves, while others were motivated by the doctors or the staff of some health care facility. People who had received satisfactory treatment from the MC also motivated others to seek treatment from there (Table 5). Majority of the patients were referred by a specialist (68.3%) or a MBBS doctor (15.8%). The referrals made by the practitioners of other system of medicine to the allopathic health facilities was not very encouraging (12.3%) (Table 6).

East African Journal of Public Health Volume 5 Number 3 December 2008
149
Table 1. Motivating factors for the direct visit of the patients to the public health facilities of Lucknow district
Medical College, b- District Hospital, c- Community Health Centre
Tertiary Secondary
MCa (321) DHb(301) CHCc(172)
No. Factors
for
Level of
health
Total
(794) No. % No. %
Cost effectiveness 27 8.4 120 39.9 50 29.1 197 24.8
Faith on doctors and health facility 243 75.7 267 88.7 133 77.3 643 81.0
Facilities for investigations present 5 1.6 5 1.7 2 1.2 12 1.5
Someone known works in the health facility
29 9.0 6 2.0 2 1.2 37 4.7
Specialists available 189 58.9 229 76.1 15 8.7 433 54.5
Near to residence 34 10.6 63 20.9 133 77.3 230 29.0
Someone known lives in Lucknow 5 1.6 5 1.7 0 0 10 1.3
Table 2. Reasons for consulting the public health facility in the indirect patientsa
Level of health care
Tertiary Secondary
MCb(229) DHc(75) CHCd(28)
Total(332)
Reasons
No. % No. % No. % No. %
No benefit 205 89.5 62 82.7 22 78.6 289 87.1
Cost effectiveness 24 10.5 26 34.7 6 21.4 56 16.9
Specialists available 36 15.7 4 5.3 2 7.1 42 12.6
Someone known lives in Lucknow 13 5.7 4 5.3 0 0 17 5.1
Someone known works in the health facility
13 5.7 0 0 0 0 13 3.9
Other 31 13.5 9 12.0 3 10.7 43 12.9 a- Includes multiple responses, b- Medical College, c- District Hospital, d- Community Health Centre

East African Journal of Public Health Volume 5 Number 3 December 2008
150
Table 3. Duration of treatment in the indirect and referred patients prior to the visit to the present health facility.
Duration of treatment Types of patients
< 1 months 1-6 months 6-12 months 1 – 2 years > 2 years
Medical college Indirect patients 229 102 (44.5) 75 (32.7) 19 (8.2) 10 (4.4) 23 (10.0)
Referred 119 59 (49.6) 39 (32.8) 3 (2.5) 6 (5.0) 12 (10.1)
χ2 value
P value
19.43 0.00
0.00 0.99
4.40 0.03
0.08 0.77
0.00 0.99
District Hospital
Indirect patients 75 40 (53.3) 24 (32.0) 7 (9.3) 1 (1.3) 3 (4.0)
Referred 19 17 (89.5) 1 (5.3) 0 (0) 0 (0) 1 (5.3) χ2 test
P value 8.21 0.00
5.49 0.01
0.80 0.37
0.56 0.45
0.15 0.69
Community Health Centre
Indirect patients 28 21 (75.0) 3 (10.7) 2 (7.1) 1 (3.6) 1 (3.6)
Referred 1 1 (100) 0 (0) 0 ( 0) 0 ( 0) 0 ( 0)
χ2 test
P value 0.38 0.53
1.76 0.18
3.00 0.08
6.74 0.00
6.74 0.00
Total indirect patients 332
163 (49.1)
102 (30.7)
28 (8.4)
12 (3.6)
27 (8.1)
Total referred patients 139 77 (55.4) 40 (28.8) 3 (2.1) 6 (4.3) 13 (9.4)
χ2 test
P value 1.55 0.21
0.18 0.67
6.26 0.01
0.13 0.71
0.19 0.66
Number in Parentheses indicate percentages P value less than 0.05 is considered significant
Table 4. Direct cost of treatment in the indirect and referred patients prior to the visit to the present health facility.
Money spent (INR) in the treatment prior to coming to the present health facility
Types of patients <1000 1000-5000 5000-10000 ≥10000
Medical College
Indirect patients 229 93 (40.6) 72 (31.4) 23 (10.0) 41 (17.9)
Referred 119 47 (39.5) 38 (31.9) 19 (16.0) 15 (12.6)
χ2 test
P value 0.04 0.84
0.01 0.92
2.58 0.10
1.62 0.20
District Hospital
Indirect patients 75 40 (53.3) 26 (34.7) 6 (8.0) 3 (4.0)
Referred 19 13 (68.4) 5 (26.3) 0 (0) 1 (5.3)
χ2 test
P value 1.39 0.23
0.47 0.49
1.61 0.20
0.06 0.80
Community Health Centre
Indirect patients 28 20 (71.4) 4 (14.2) 3 (10.7) 1 (3.6)
Referred 1 1 (100) 0 (0) 0 ( 0) 0 ( 0)
χ2 test
P value 0.38 0.53
0.16 0.68
1.76 0.18
6.74 0.00
Total indirect patients 332 153 (46.1) 102 (30.7) 32 (9.6) 45 (13.6)
Total referred patients 139 61 (43.9) 43 (30.9) 19 (13.7) 16 (11.5)
χ2 test
P value 0.19 0.66
0.00 0.96
1.64 0.19
0.36 0.54
Number in Parentheses indicate percentages, P value less than 0.05 is considered significant

East African Journal of Public Health Volume 5 Number 3 December 2008
151
Table 5. Distribution of the indirect patients according to the persons who motivated them to visit the present health facility Level of health care
Person who motivated to consult the
concerned health facility
tertiary Secondary Total
MCb (229_ DHc (75) CGC (28)
No. % No. % No. % No. %
Self 174 76.0 57 76.6 22 78.6 253 76.2 Government Doctor 23 10.0 26 34.6 6 21.4 55 16.5 Private Doctor 8 3.5 1 1.3 0 0 9 2.7 Staff of some health care facility 31 13.5 3 4.0 2 7.1 36 10.8 Neighbour 12 5.2 4 5.3 0 0 16 4.8 Person who had a already visited this facility and got relieved
13 5.7 0 0 0 0 13 3.9
Others 26 11.4 9 12.0 3 10.7 38 11.4
a- Includes multiple responses, b- Medical College, c- District Hospital, d- Community Health Centre
Table 6. Distribution of the patients according to the qualification of the doctor who referred them to the present health facility.
a- Medical College, b- District Hospital, c- Community Health Centre
Level of health care
Tertiary Secondary MCa (119) DHb (19) CHCc (1)
Total (139)
Qualification No. % No. % No. % No. %
Quack 3 2.5 2 10.5 0 0 5 3.6
Unani 5 4.2 3 15.8 0 0 8 5.8
Ayurvedic 2 2.5 4 21.1 0 0 6 4.3
Homeopathy 3 1.7 0 0 0 0 3 2.2
M.B.B.S. 16 13.4 5 26.3 1 100 22 15.8
Specialist and above 90 75.6 5 26.3 0 0 95 68.3
Figure 1: The flow of care between the four different levels of health care in different countries

East African Journal of Public Health Volume 5 Number 3 December 2008
152
Discussion:
The present study was an attempt to study the utilization of the existing health care delivery system in a district of North India. Since the health care delivery system in different countries is similar with some differences, the findings of the study will be helpful while we try to make certain reforms in the health care delivery system of the country, especially the developing ones, to increase the effectiveness and efficiency of the system.
We observed that majority of the patients coming to all the three “referral” centers, particularly the CHCs were the new patients. Strikingly, only one out of 201 patients was referred to the “first referral centre” of the health care delivery system in India i.e. the CHC, indicating a grave underutilization of the system. This is especially important in the light of the fact that, the health system of India is composed of different health centers and hospitals which act as a hierarchy of referral centers to deliver different levels of health care (1,2).
The correspondingly low proportion of referred patients and a high percentage of the direct patients to the MC coerces us to give a thought to the health care delivery system in the urban areas which has largely been neglected and hence been deprived of the government institutions for the primary level of health care. The planners have always portrayed India as a rural country and developed plans accordingly. The recent improvements envisaged in the National Rural Health Mission (NRHM) have also been focused mainly on the rural areas (6). The rapid urbanization and the mushrooming of the slums in the urban areas, and the consequent needs of the people have largely been ignored (7). The private sector flourishing in the urban areas is not within the reach of the common man and the accessibility to the various health insurance schemes and other agencies such as Railways and Defence services is also limited (8,9).This is bound to put the pressure on the specialized health services. We therefore have to plan a similar system of health care delivery in the urban areas as is running in the rural areas with simultaneous plans to ensure its utilization.
The awareness of the general population regarding their health and their effort to consult the best available doctor and health facility for restoration of their optimal health is a good sign, but is not without other undesirable consequences. It imposes overburden on the specialized health facilities as revealed by another study also in another developing country (10). Unfortunately this burden is more due to the common ailments rather than cases requiring specialized care. Gate keeping arrangements by defining the catchments area of the health facilities and taking measures for ensuring channelisation of the patients through the various levels of health care system as was conceptualized at the beginning might be a helpful solution. This has been successfully experimented in Kharar Hospital in Punjab (11).
Cost effectiveness of the health care was one of the important reasons responsible for the direct and indirect
visit to the health facilities. Analysis of the data from the 1999 Health Sector Beneficiary Assessment in Mozambique, another developing country, suggested that physical access, education, and economic variables remain important determinants in decisions about outpatient visits (12). This finding becomes more important when majority of the patients (about 70%) in our study belonged to the lower socioeconomic status, thus emphasizing the monetary constraint that they would face while spending on the process of consultation with the doctor which would include the direct costs incurred on the transportation, registration, investigations and the treatment and the indirect cost in terms of loss of wages due to the absenteeism from the work (13). On the other hand, not citing cost effectiveness as the “most” important reason for the visit emphasizes that factors such as faith and satisfaction are more important for a patient who is ready to pay for receiving the specialized care despite the financial limitations.
A perplexing finding of the study was the proximity of the health facility being the major reason for the direct visit to the CHC. People were treating the CHC as a Primary health centre (PHC) and visiting it for treatment of common ailments, because of the non availability of a PHC in the near vicinity as stated by 77% of the people. This compels us to question the location of the various PHCs and the definition of their catchment area. If the accessibility of a CHC is better than a PHC, it is destined to draw more patients than the PHC which will hence be underutilized. Therefore the accessibility of the health facility as a major factor in the utilization of the health service which has also been highlighted in the principles of Primary health care cannot be overemphasized and the practical aspects need to be reviewed (14).
About 87% of the indirect patients had resorted to a change in place of the consultation because of their inability to derive any benefit from the treatment provided at the other health facilities. Further, since they were not referred to the present health facility by a health professional, their certainty of arrival at the appropriate place of treatment was still questionable and may well add to the plight of their situation as revealed by another study also (15).
The delay in the arrival of the indirect as well as referred patients at the MC was significant in the light of the fact that the best course of management for most of the diseases is early diagnosis and treatment for the prevention of complications which are mostly irreversible. The effect of a delay in treatment is further compounded by the expenditure on the health care during this period especially when it is not accompanied by any satisfactory benefit. Late referral also limits therapeutic options, and these limitations have consequences on long-term outcomes. The consequences of late referral in terms of increased morbidity, mortality, and resource utilization, as well as adverse impact on patients' quality of life and missed opportunities for pre-emptive treatment have been emphasized by Levin A (16) and Alebiosu CO (17) in their study.

East African Journal of Public Health Volume 5 Number 3 December 2008
153
With a per capita income of Rs. 22,379 annually (18) expenditure (in terms of direct costs) of more than 1000 Rupees before visiting the present health facility in about three out of five patients is quite high. The indirect costs involved were not evaluated and could well add to the gravity of the situation. Especially surprising was the finding that a substantial number of the patients were referred to the health facility after they had spent more than ten thousand rupees, indicating a delay in the decision to refer. Specific guidelines regarding the referral of the patients would be helpful in making timely referral, thus economizing on both time and money and more importantly the health of the patient. The presence of majority of the patients in the economically productive groups adds to the indirect cost of the treatment. Another major group of the patients were the children who were usually accompanied by some elder person mostly the mother or the father, which implies that they must have taken a days off from the regular duties further adding to the indirect cost of the consultation. The dependant status of about three-fourths of the total patients is also a significant finding in terms of the economic burden subjected to the bread earner of the family.
The referral through the Indian system of medicines (ISM) such as Ayurvedic, Homeopathic or Unani system was not found to be very heartening. The integration of the ISM in the health system of the country as is envisaged in the National Rural Health Mission, still waits to be materialized (19). With the widespread quackery in the country (20,21), it was not surprising to see people being consulted by quacks, but it was unusual to see them participating in the referral system and sending the patients for better treatment at the specialized health facilities. This is a good sign and we can think of mainstreaming them in the health system of the country with some training as has been successfully experimented with the village health guides and the local dais.
We therefore come to the conclusion that the utilization of the referral system of the health care delivery in India still needs to be enhanced and before planning future reforms such as decentralization, incorporation of the Indian system of Medicine, infrastructural corrections and other steps we need to develop mechanisms to see that the plans are materialized. Regular and independent evaluation would help us to assess the achievement of the stated objectives and the reasons for non achievement. The present study might serve as an eye opener and oblige us to think beyond the horizon, to question the establishment of such a huge infrastructure and its appropriate utilization.
Limitations:
The present study was a time bound study and therefore lacks an appropriate sample size calculation. Although the information about the number of referred patients could well be obtained by a primary data but the secondary data provided by the present study would help in supplementing the information along with educing the reasons for the
existing situation. We also lacked data for comparison due to the relative lack of other similar studies, which was another limitation for our study. A prospective study on the patients referred to the higher centers would provide us with a clearer picture about the compliance with and defect in the referral system.
References:
1. Rural Health Care System in India. (Available at
http://mohfw.nic.in/dofw%20website/Bulletin%20on%20RHS%20-%2006%20-
%20PDF%20Files/Genesis%20and%20Evolution%20of%20RHCS-
Modified.htm, Accessed April, 2008)
2. Organizational Structure (Available at
httpnagahealth.nic.invision%20of%20Deptt.htm, Accessed April, 2008)
3. Park K. Health Care of the community. Park’s Text Book of Preventive and
Social Medicine. 18th Edition. Jabalpur: Banarsidas Bhanot Publishers; 2005:
695.
4. Park K. Health Planning and Management. Park’s Text Book of Preventive and
Social Medicine. 18th Edition. Jabalpur: Banarsidas Bhanot Publishers; 2005:
672.
5. Kishore. J Medical Dictionary of Public health. 2nd
Edition. New Delhi: Century
Publication; 2002: 402-403
6. National Rural Health Mission (2005-2012). Ministry of Health and Family
Welfare, Government of India. (Available at
http://mohfw.nic.in/NRHM/Task_grp/Mission_Document.pdf, Accessed April,
2008
7. Srinivasa C, Urban Health Care in India. (Available at
http://www.ananthapuri.com/article.asp?title=Urban-Health-Care-in-
India&id=44, Accessed April, 2008)
8. Ministry of Health & Family Welfare, Report of the National Commission on
Macroeconomics and Health, Government of India, New Delhi, August 2005: 5
9. Bagchi D, Towards Accessibility of Health Services by the Poor in India through
Micro Health Insurance Scheme: An Exploratory Study. (Available at
http://www.rmi.nccu.edu.tw/apria/docs/Concurrent%20V/Session%201/3607he
alth_insurance_apria_2007.doc, Accessed April, 2008)
10. Atkinson S, Ngwengwe A, Macwan'gi M, Ngulube TJ, Harpham T, O'Connell
A. The referral process and urban health care in sub-Saharan Africa: the case
of Lusaka, Zambia.
11. Soc Sci Med 1999 Jul; 49(1):27-38.
12. Organization of the referral system, Kharar Hospital, Punjab (Available at
http://www.cbhi-hsprod.nic.in/listdetails.asp?roid=223, Accessed April, 2008 ).
13. Lindelow M. Understanding spatial variation in the utilization of health
services: does quality matter? CSAE & the World Bank. (Available at
http://www.bepress.com/cgi/viewcontent.cgi?article=1212&context=csae,
Accessed April, 2008)
14. Department of Health and Human Services, Report on Disease-specific
estimates of direct and indirect costs of illness and NIH support, National
Institutes of Health, Bethesda, U.S.A., February 2000.
15. WHO (1978). Alma Ata 1978: Primary Health Care, HFA Sr. No. 1.
16. Ravinder P.S. Makkar, Monga A, Arora A, Mukhopadhyay S, Gupta AK. Self-
referral to specialists – a dodgy proposition. Int J Health Care Qual Assur 2003;
16(2): 87 – 89.
17. Levin A. Consequences of late referral on patient outcomes. Nephrol Dial
Transplant 2000; 15(3):8-13.
18. Alebiosu CO. Detrimental effects of late referral for dialysis. Afr J Health Sci
2001 Jan-Jun; 8(1-2):89-92.
19. Government of India, Revised estimates of Annual National Income, 2006-07
and Quarterly estimates of Gross Domestic Product, 2006-07, Press Information
Bureau, May 2007. (Available at http://mospi.nic.in/pressnote_31may07.htm,
Accessed April, 2008)
20. Kishore J. National Rural Health Mission (2005-2012). National Health
Programmes of India. 6th Edition. New Delhi: Century Publication; 2006: 36-
41.
21. After kidney scam, India looking at anti-quackery bill, Indian E news, Sunday 3
Feb 2008. (Available at http://www.indiaenews.com/health/20080203/95322.htm)
22. Umre AG. Quackery — A Burning Threat of Human Health. J Indian Med
Assoc 2007 Aug; 105(8):423.

East African Journal of Public Health Volume 5 Number 3 December 2008
154
WHY PATIENTS MISS FOLLOW-UP APPOINTMENTS: A PROSPECTIVE CONTROL-MATCHED STUDY
G. Van der Meer and J.W. Loock
Abstract:
Objectives: To investigate missed appointments in a South African tertiary hospital.
Study Design: Prospective, descriptive series with controls.
Setting: T he ENT/Oncology clinic at Tygerberg Academic Hospital, South Africa. Subjects: 305 patients with a head and neck
malignancy who had follow-up appointments over 4 consecutive months between June and September 2006. A control group of 31
patients who attended the clinic was recruited in September 2006.
Method: Analysis of the clinic attendance statistics to identify patients who missed follow-up appointments followed by a file review
and interview of these patients. The results were compared with a control group. Outcome measures: 1) Incidence rate of failure to
attend follow-up. 2) Causative factors
Results: 51 (17%) booked patients missed their appointments. Non-attenders were most likely to miss their follow-up between 6 and
12 months (17/31) after treatment. No correlations were found between diagnosis, disease stage and missed appointments.
Reasons include: transport (19 responses), ill-health (6) and financial constraints (5). State transport was unavailable to almost two-
thirds of the responders who cited transport as a problem.
Conclusions: The 17% missed appointment rate is largely due to transport constraints. The commonest time for patients to miss
appointments is the 6-12 month follow-up period. The authors seek to identify patients at risk of missed appointments and suggest
interventions to decrease this incidence.
Keywords: Cancer, Appointments, Transport, Follow-up
Introduction:
Missed appointments remain a ubiquitous part of any health care system. The implications of missed appointments to health systems include: 1) Financial Impact: 6 million missed appointments in the United Kingdom in 1997 cost an estimated €300 million (1).
2) Underutilization of facilities (2).
3) Neglect of treatable conditions leads to an increased demand at a later stage (3).
The implications for patients include: 1) Delayed treatment of potential complications of the cancer treatment. 2) Missing early signs of malignancy recurrence. 3) Long delays to a new follow-up date. 4) Possible permanent loss to follow-up as the patient disappears from clinic records.
In the developed world, studies have been conducted in an attempt to elucidate the causes and to diminish the incidence of missed appointments. South Africa has unique pressures with regard to health care attendance, including pervasive poverty, long distances and health care system constraints which makes comparison with developed countries difficult
Figures for South Africa are not readily available, but in the UK, the incidence of non-arrival at surgical and medical clinics (no data available for ENT oncology clinics) ranges between 10% and 30% with a mean of 12%2 Some of the reasons include: forgetfulness , fear of treatment, clerical errors and improved health. Murdock et al suggest that patient apathy plays a large role in the current burden of missed appointments. Most investigations into the factors influencing missed appointments are limited by the poor response
Correspondance to: G van der Meer , Department of Otorhinolaryngology,
Tygerberg Hospital / University of Stellenbosch Faculty of Health Sciences, Francie
van Zijl Dr Parow, 7505, South Africa, Email: [email protected] , Tel: +27
(0)21 – 9384154, Fax: +27 (0)21 – 9389470
Department of Otorhinolaryngology, Tygerberg Hospital / University of
Stellenbosch Faculty of Health Sciences
Cape Town, South Africa
rates, typically 30-40% (4), yet it was found that telephonic interviews achieved a response rate of 93% (2)
One of the cornerstones of cancer management is regular follow-up, not only to alleviate any side–effects of treatment, but also to screen for recurrence. The study aimed to evaluate the rate of, and factors leading to, missed appointments.
Ethical Approval
This study received ethical approval from the Committee for Human Research at Stellenbosch University / Tygerberg Hospital and conformed to the principles embodied in the Declaration of Helsinki.
Patients and Methods:
This study included all patients who missed their follow-up appointments at the Tygerberg Combined ENT Oncology Clinic over a period of 4 consecutive months from June to September 2006. A list of patients who attended and missed their follow-up appointment was obtained after every clinic. The files of those patients who missed the clinic were reviewed and all the available contact details were noted as well as the patients' demographic information. Patients were interviewed telephonically or, failing that, personally when they returned after being contacted through reminder letters sent by the clinic. The study subjects, after giving informed consent, completed an anonymous form which included: general demographics, diagnosis, treatment type, duration of treatment, experience of treatment, follow-up time, reasons for missing the appointment and open-ended questions about ways to improve service delivery. Patients could supply more than one reason. New dates for follow-up visits were also arranged at the interview.
A control group of 31 consecutive patients who attended the same clinic in September 2006 was recruited to the study and completed a similar questionnaire. Demographic breakdown of the patients who could not be

East African Journal of Public Health Volume 5 Number 3 December 2008
155
contacted was also undertaken.
Results:
Of the 305 patient bookings over the duration of the study, 254 (83%) of patients kept their appointments at the clinics, while 51 (17%) missed appointments. Of the 51 patients, 8 (3%) had died, 30 (10%) were interviewed and it was not possible to establish contact with the remaining 13 (4%).
A cohort of 30 patients who did attend was created and contrasted with the first group. The groups were found to be similar with regard to age (56.8 vs 58.9 years) and gender (88% vs 87% male). The group who attended the clinics had an average of 8.26 years of schooling, compared with the 7.2 years of the non-attenders, which was not statistically significant. (p=0.12) Although only 67% of non-attenders realized the importance of attending the clinics, compared with 84% of attenders, this was not statistically significant. No correlations were found between diagnosis, disease stage and missed appointments.
Analysis of the follow-up times showed a striking pattern: The non-attenders were most prone to do so between 6 and 12 months after treatment with 17 cases (57%). (Table 1) The commonest reasons cited for non-attendance were: transport (19 cases), health reasons (6 cases) and finances (5 cases). All the reasons are listed in Table 2.
Analysis of the subset who listed transport as a factor revealed that state transport was only available to 7 (37%) with an equal number having no available transport and the remaining 5 (26%) having been denied access to the transport due to space constraints.
Of the 13 unreachable patients, there were 11 males and 2 females with an average age of 52.8 years. Of these, 11 (85%) stayed in rural areas, 10 (77%) stayed more than 150km away from the follow up clinic. 7 patients (54%) lived on farms, and 6 patients (46%) lived on farms in excess of 150km away.
Discussion:
This study demonstrates a 1 in 6 incidence of non-attendance of the oncology follow-up clinics, which is similar to international findings for general clinics. This is where the similarity ends as South Africa is faced with unique challenges in the form of limited health care, long distances, poor education and limited methods of distance communication.
As a reflection on all clinics in the South African health system, it is probably an underestimation, as special care is taken with each cancer patient upon diagnosis to ensure correct contact details and adherence to follow-up. Each patient is counselled by a dedicated social worker, and this, coupled with the understood severity of their disease, may encourage better follow-up.
There was no statistically significant difference in education levels and while non-attenders demonstrated a trend to 1 year less schooling than those who attended the clinics, education level does not seem to play a prominent role in missing appointments.
A concern demonstrated by this study is that the majority of missed appointments occurred in the 6 to 12 month follow-up period, which is considered a critical time for the early recognition of oncological treatment failure, as the side-effects of radiotherapy resolve and may unmask recurrent or residual disease.
The main reason cited for missing the follow-up clinic is lack of transport, and the unavailability of state transport to 63% of those with transport constraints is a sad indictment on the current provisions of health care for all South Africans. Again, cancer survivors are given preference on the buses and have an easier path to securing state transport, but they remain dependent on space availability. It can be assumed that non-cancer patients who are not afforded transport preference are

East African Journal of Public Health Volume 5 Number 3 December 2008
156
more adversely affected. A decrease in both the hospital and transport tariffs
at the time of this study contributed to far fewer patients listing cost as a barrier to health care than was expected.
Contrary to international literature, patient apathy did not seem to play a significant role in missed appointments. The authors made an effort to counsel the study subjects to answer the anonymous questionnaires truthfully and without feeling the need to hide reasons, and the results are seen to be an accurate reflection of the underlying issues.
The authors sought to identify those patients who seemed to be most susceptible to missing appointments and these include:
1) Patients in the 6-12 month follow-up period. 2) Those living on farms especially more than 150km
away from the hospital. 3) Patients reliant on space-limited state transport
services. Furthermore, the authors suggest that interventions which could limit the prevalence of non-attendance include: 1) At the first visit: Identifying patients at risk by
discussing the potential for missed appointments and placing emphasis on obtaining patient contact details and systems of pursuit.
2) Providing hospital contact details and methods of contacting the clinic so that the patient can either reschedule a future appointment or get a new date after a missed appointment.
3) A booking notification system whereby all patients who miss an appointment get highlighted and contacted by the clinic.
4) Transport facility evaluation and improvement by the Health Department, specifically regarding increasing the amount of space available on buses and reaching more rural areas.
5) Provision of rural outreach follow-up oncology clinics.
6) Close liaison with rural health facilities would be beneficial for the monitoring of treatment outcomes and, if a patient dies, to rebook another patient in his or her place at the clinic.
Further studies in this field are envisaged and will
include an audit of the improvements made to the follow-up system.
What this study adds:
Missed appointments have been investigated in first
world countries, but these results have poor application to developing countries. No research has been published that investigates the plight of patients who miss health care appointments in South Africa.
Policy Implications:
This study identifies the main causative factor of missed appointments in South Africa, namely transport constraints, and highlights that patients are most likely to miss their appointments between 6 and 12 months after initial treatment. Based on these results, the authors suggest interventions and changes to the current policy for improved health care provision.
References:
1) Committee of Public Accounts. 42nd Report. National Health Service in
England and Wales. London; Stationery Office.
2) Murdock A et al. Why do patients not keep their appointments? J R Soc
Med, 2002;95:284-6
3) Andrews R, et al. Understanding non-attendance in pediatric outpatient
clinics. Arch Dis Child 1990; 65: 195
4) Jones RB, et al. Reducing non attendance in an outpatient clinic. Pub Health
1998;102:385-91

East African Journal of Public Health Volume 5 Number 3 December 2008
157
IRON DEFICIENCY IN FREQUENT AND FIRST TIME FEMALE BLOOD DONORS
M. Boulahriss1 and N. Benchemsi1,2
Abstract:
Back ground: Blood donation has a marked influence on the body iron stores especially in female blood donors . Iron deficiency
anaemia is an important limiting factor for the number of donations in female regular blood donors.
Aim of the study: This study was conducted to evaluate the frequency of iron deficiency and relevant factors in frequent and first time
female blood donors at Casablanca blood transfusion centre, Morocco.
Methods: Between November 2005 and April 2006, twenty-one female first time and twenty-one frequent female blood donors were
selected randomly. In frequent blood donors, only females with at least 10 donations were included. Haemoglobin concentration,
serum ferritin, serum iron and total transferrine binding capacity were measured and analysed.
Results: The results of haemoglobin concentration, serum ferritin, serum iron were significant lower in frequent female blood donors
when compared with the results of same parameters in first time female blood donors. The results show that the frequency of iron
deficiency in frequent female blood donors is 43% and in the first time female blood donors is 14%.
Conclusion: Iron deficiency is very common in regular female blood donors at Casablanca’s transfusion centre. Frequent blood
donation has marked influence on the body iron stores in frequent female blood donors. It is therefore recommended that blood
transfusion centres focused on maintaining iron balance by measuring serum ferritin and total transferrine binding capacity in
frequent female blood donors .They have also to educate the donors about iron supplementation and yearly ferritin checking.
Introduction
Casablanca blood transfusion centre is the major organization involved in blood banking in Morocco and it collects blood from non-paid volunteers, of whom a considerable proportion donate blood frequently. Blood donation can lead to depletion of iron stores in the body. At each blood donation, approximately 213 mg iron or 9% of the total iron stores in women are lost. With continuous loss of iron, the body adjusts to lower levels of iron storage or results in iron deficiency and anaemia (1).
About 28% of women in the reproductive age who donate just two times per year suffer from iron deficiency (2). If the lost iron stores in these donors are not replenished and they continue to donate blood, it results in iron deficiency anaemia and deferral of these donors in the future (3). Thus, a considerable number of regular donors who at present are the best source of safe blood are lost. In fact, iron deficiency anaemia is the main limiting factor in regular donors (1). At present, there is no confirmed or specific programme for prophylaxis of iron deficiency in blood donors. In order to have such a programme, an evaluation of the present situation and accurate statistics of iron deficiency in blood donors is needed. Though most of the researchers have concluded that the frequency of iron deficiency anaemia increases with the number of donations (1,4-7), Birgegard and co-workers have reported that increased number of donations in women does not necessarily result in iron deficiency anaemia (8). There are non accurate statistics of frequency of iron deficiency anaemia in Moroccan blood donors, and it is not possible to use the results of studies in other countries for blood donors in Morocco. Therefore, this study was performed to determine the frequency of iron deficiency and its related factors in blood donors at Casablanca Blood Transfusion Centre.
Correspondence to: M BoulahrissRegional blood transfusion centre, Tel: 00 212 22
20 45 88, Fax: 00 212 22 20 45 89 ,
E-mail: [email protected]
Materials and Methods
Between November 2005 and April 2006, we enrolled retrospectively a total of twenty one regular women blood donors who were selected according to the number of previous donations. Only female with at least 10 donations (3-4times per year) were included in frequent blood donors. The group of first time blood donors consisted of twenty-one women who were registered as new blood donors without any prior donation.
• All women were, healthy according to their history and fulfilled the criteria for suitability as blood donors.
• Data were collected by an interview and completion of a questionnaire.
After obtaining consent, personal information
including age, pregnancy status, previous episode of haemorrhage and previous anaemia was entered and recorded for all donors under study
Two tubes of five millilitres blood were drawn from each case for measuring haemoglobin, serum iron, serum ferritin and Total transferrin Binding Capacity (TtBC). Samples were immediately carried out to the laboratory of haematology in EDTA tube for haemoglobin concentrations which were measured by cyanomet
haemoglobin method using Coulter® GEN STM System 2
automated and Pasteur Institute of Casablanca for Serum iron, Serum Ferritin and TtBC Concentrations.
Serum iron and TtBC concentrations were measured using VITROS 250 system chemistry automated analyser and ortho-clinical diagnostics kit. Ferritin concentrations were measured by the Immuno–Radio-Metric technique (IRMA) using IRMA-mat ferritin of diasorin kit.
Haemoglobin and ferritin measurements
• In this study, reduction in iron stores was defined as serum ferritin concentrations < 20µg L-1;
• Lack of iron stores was defined as serum ferritin concentrations < 15 µg.L-1, and iron deficiency was

East African Journal of Public Health Volume 5 Number 3 December 2008
158
defined as serum ferritin concentrations < 15µg L-1, TtBC > 4mg L-1 while anaemia was defined as haemoglobin < 115g L-1.
• Iron deficiency anaemia was defined as serum ferritin concentrations < 15µg L-1, TtBC > 4mg L-1 and haemoglobin concentrations < 115g L-1.
Statistical analysis
Groups of first time and frequent blood, donors were compared with each other using Student's t-test.
Results :
The population under study was divided into two groups:
• Group I: twenty one female first time blood donors.
• Group II : twenty one female regular blood donors, they donated three or four times a year and only women with at least 10 donations are included in this group.
• The age range was between 20 and 56 years with a mean age of 36 ± 11 years in group I and between 22 and 62 years with a mean age of 40 ± 10 years in group II.
• The percentage of blood donors with reduced iron stores (ferritin concentration < 20µg L-1) showed an increase with increase in number of donations: about 19% of first time female blood donors had reduced iron stores and this increased significantly (p < 0.000) to 76% in regular donors (Table 1).
Table 1 : Distribution of donors according to iron stores
and ferritinemia. Iron stores
Normal
(Ferritin ≥ 20µgL-1)
Reduced (Ferritin < 20µgL-1)
Women % Women %
Group I
Group II
17
5
81
24
4
16
19
76
The percentage of iron-deficient women (serum
Ferritin concentrations < 15µgL-1 and TtBC > 4mgL-1) increased with increase in number of donations. The frequency of iron deficiency was significantly higher in female regular donors (62%) compared to first time donors (14%) (p < 0.001) (Table 2).
Table 2: Distribution of blood donors according to iron deficiency.
Iron deficiency
Absent
(Ferritin ≥ 15µgL-1
and TtBC ≤ 4mgL-1
Present
(Ferritin < 15µgL-1 and TtBC > 4mgL-1
Type of blood donors n % n %
First time donors
Regular donors
18
8
86
38
3
13
14
62
• Fourteen percent of first time blood donors suffered from iron deficiency anaemia while
43% of women regular donors had iron deficiency anaemia (Table 3).
Table 3: Frequency of iron deficiency anaemia.
Iron deficiency Iron deficiency anaemia
n % n %
Group I
Group II
3
13
14
62
3
9
14
43
• The frequency of iron deficiency anaemia increased significantly (p < 0,05) with increase in number of donations.
• Haemoglobin, serum iron and ferritin concentrations were significantly inversely related to the type of donations (Table 4).
Table 4: Haemoglobin and iron status.
First time
N = 21 Frequent N = 21
Haemoglobin (g.L-1)
Serum iron (g.L-1)
Ferritin (µg.L-1)
130 ± 8
0.70 ± 0.30
32 ± 20
100 ± 10**
0.45 ± 0.15**
10 ± 8***
(*** p < 0.001) (** p < 0.01)
• Serum ferritin concentrations showed the strongest relationship with the number of donations. The mean ferritin concentration in female first time blood donors was 32 ± 20µgL-1 while in regular donors it was 10 ± 8 µgL-1 (p < 0.001).
• Serum ferritin concentrations decreased with increase in number of donations.
• The frequency of reduced iron stores, iron deficiency and iron deficiency anaemia was higher in group II compared to group I. (p < 0.05) (Figure 1).
76%
19%
62%
14%
43%
14%
0
10
20
30
40
50
60
70
80
Reduced
iron
storage
Iron
deficiency
anaemia
Groupe II
Groupe I
Figure 1: Distribution of both groups according to their
iron storage.
Discussion
Serum ferritin concentrations had the strongest and
most significant relationship with the number of donations compared to other laboratory investigations including haemoglobin and serum iron.
%

East African Journal of Public Health Volume 5 Number 3 December 2008
159
Ferritin concentrations decreased significantly with an increase of the number of donations (P < 0.001). Other studies confirm our findings (1,5,7,9-13).
As haemoglobin alone do not determine the iron storage levels of iron deficiency and considering the present findings, serum ferritin concentrations can be used as an indicator of the iron stores in blood donors. In the Iranian study 12.5% and 77.8% of first time and regular women blood donors respectively had iron deficiency (2). Other studies reported the same results (13-14). The present study showed that 14% and 62% of first time and frequent blood donors respectively had iron deficiency (Fig 1), which is similar to the findings of Javadzadeh and co workers in Iran.
In the present study 76% of regular women blood donors had reduced iron stores (Table 1) with mean ferritin concentrations in frequent blood donors 10 ± 8 µgL-1 which was lower than the mean ferritin concentrations in first time blood donors 32 ± 20µgL-1 (Table 4). We demonstrated in agreement with others (15-17) an increase of gradual iron depletion corresponding to frequency of blood donation.
About 62% of women regular donors had iron deficiency and 43% had iron deficiency anaemia. Iron deficiency and iron deficiency anaemia were seen in 77.8% and 55.6% respectively of women regular donors (2). Alvarez et al reported that 30% and 26% of women regular blood donors had respectively iron deficiency and iron deficiency anaemia (15). Cancado and Co-workers showed that 41.5% of women who had donated on several occasions had iron deficiency (14).
In our study the frequency of iron deficiency and iron deficiency anaemia in regular women blood donors are higher than the other studies (14-15) but less than the findings of the Iranian study.
These results could be due to the higher prevalence of iron deficiency in Moroccan and Iranian women populations due to the nutrition poor in iron.
Conclusion
Iron deficiency is very common in regular female blood donors at Casablanca’s transfusion centre. Frequent blood donation has a marked influence on the body iron stores in regular women blood donors. It is therefore recommended that blood transfusion centers focused on maintaining iron balance by measuring serum ferritin in women frequent blood donors, they have also to educate the donors about iron supplementation and yearly ferritin checking, for that we propose a schedule to minimize iron deficiency and anaemic complications in women regular blood donors :
1. The routine measurement of ferritin for all first
time female donors should be recommended in order to detect possible iron deficiencies before regular donations begin.
2. A ferritin screening procedure for all donors after the first ten donations might help to identify Iron-deficient women.
3. Iron supplementation after donations for all regular women blood donors with ferritin values < 15µgL-1 should be considered.
As supplementation of iron not only increases the storage of iron in the donors but also leads the donor to donate blood in the future, it is suggested that research studies should be performed to determine the best method of iron supplementation with minimal complications. References:
1) Finch CA, Cook JD, Labble RF & Cuala M. Effect of blood donation on iron
stores as evaluated by serum ferritin. Blood 1977, 50: 441-447.
2) Javadzadeh SH, Attar M & Taher Y. A study of the prevalence of iron
deficiency and its related factors in blood donors of Yazd, Iran, 2003.
Transfusion Medicine 2005, 15: 287-293.
3) Simon TL. Iron, iron everywhere but not enough to date. Transfusion 2002,
42:664-665
4) Bianco C, Brittenham G & Gilcher RO. Maintaining iron balance in women
blood donors of child-bearing age: summary of a workshop. Transfusion
2002, 42:799-806.
5) Garry PJ, Vanderjagt DJ, Wayne SJ et al. A prospective study of blood
donations in healthy elderly persons. Transfusion 1991, 31:686-692.
6) Harthoorn-Lasthuizen EJ, Lindermans J & Langehuijsen MM. Zinc
protoporphyrin as screening test in female blood donors. Clinical Chemistry
1998, 44:800-804.
7) Simon T, Garry PJ & Hooper EM. Iron stores in blood donors. Journal of
the American Medical Association 1998, 245, 2038-2043.
8) Birgegard G, Hogman C, Killander A & Wide L. Serum ferritin levels in
male blood donors. Relation to number of phlebotomies and iron
supplementation. Vox Sanguins 1987, 34: 65-70.
9) Badar A, Ahmed A, Ayub M & Ansari AK. (2002) Effect of frequent blood
donation on iron stores of non anemic male blood donors. J Ayub Med Coll
Abdottabad 2002, 14:24-27.
10) Boulton F, Collins D, Inskip H, Paes H & Garlick M. Study of the iron and
HFE Status of blood donors, including a Group who failed the initial screen
for anaemia. British Journal of Haematology 2000, 108:434-439.
11) Milman N & Sondergaard M (1984) Iron stores in male blood donors
evaluated by serum ferritin. Transfusion 1984, 24:464-468.
12) Milman N & Kirchhoff M. Influence of blood donation on iron stores
assessed by ferritin and haemoglobin in a population survey of 1433
danishmales. European Journal of Haematology 1991, 47:134-139.
13) Nardrajan VS & Eow GI. Anemia and iron status among blood donors in a
blood transfusion unit in Malaysia. The Malaysian Journal of Pathology
2002, 2:99-102.
14) Canacado R, Chiattone C & Fausto F. Iron deficiency in blood donors. Sao
Paulo Medical Journal 2001, 119: 4.
15) Alvarez-Ossorin L, Kirchner H, Kloter H & Schlenke P. Low ferritin levels
indicate the need for iron supplementation strategy to minimize iron-
depletion in regular blood donors. Transfusion Medicine 2000, 10:112.
16) Garry PJ, Koehler KM & Simon T. Iron stores and iron absorption: effects
of repeated blood donation. The American Journal of Clinical Nutrition
1995, 62:611-620.
17) Ledue TB, Craig WY, Ritchie RF & Haddow JE. Influence of blood donation
and iron supplementation on indicators of iron status. Clinical Chemistry
1994, 40:1345-1346.

East African Journal of Public Health Volume 5 Number 3 December 2008
160
SHOULD PUBLIC HEALTH BE EXEMPT FROM ETHICAL REGULATIONS? INTRICACIES OF
RESEARCH VERSUS ACTIVITY.
D. Gitau-Mburu
Abstract
Objective: To assess the role of ethical regulations in public health practice, and to review the need to exempt any public health
activity from such ethical regulations.
Methods: Literature review of published papers regarding ethical regulations in public health practice.
Results: There is a current criticism of public health ethics as hindering rather than facilitating public health research. There is also
an existing dilemma as to which Public health activities constitute research and are therefore subject to ethical regulations and which
ones are exempt from such regulations.
Conclusion: Exempting some public health activities from ethical regulation may occasion an inherent risk of subjective
interpretation of the criteria guiding the distinction between Public health research and non-research. In order to avoid inadvertent
breach of ethical regulations, ethical regulations should be applied to all public health activities whether formally classified as
research or not.
Introduction
The judge in the land mark Nuremberg trial
recognized the void that is now filled by research ethics. Ethical regulations are necessary to safeguard the interests of participants in clinical, biomedical and even public health practice. However, it is worthwhile to note the current criticism of ‘excessive’ ethical regulation, particularly in public health practice. An increasingly large number of researchers argue that stringent ethical regulation sequesters public health research, is impractical (1) obstructive, (2) leads to unnecessary delays, (3) and may even suppress research altogether (4) not forgetting the difficulty of applying them in developing countries (5).
Additionally, there is widespread disquiet and controversy that excessive regulation is a particular threat to research confined to use of medical records (6) and that complying with some of those regulations may lead to erroneous research conclusions (7), thereby effectively invalidating research.
Inevitably, in a pluralistic society, such divergent opinions are bound to arise. In view of the prudence of creating a research-enabling environment, is this criticism of regulation justified? To what extent should public health practitioners restrict application of research regulations in order ‘not to hinder research’?
Methods
A literature review was carried to provide existing
evidence for the need to apply ethical regulations in public health as well as the criteria on which exemption of an activity from such ethical regulation may be based.
A database search of Pubmed was carried out between March and June 2008 using the following search terms: ("Public Health"[Mesh] OR public health research [tw] OR Public Health activity [tw] OR "Population Surveillance"[Mesh])) OR surveillance [tw] OR "Epidemiology"[Mesh]) OR ("Contact Tracing/legislation and jurisprudence"[Mesh] OR "Contact
Correspondence: Gitau-Mburu D, Population Services International, Kenya.
Fax: (+254) 4440899, Telephone: (+254) 020 4440125, Email address:
Tracing/utilization"[Mesh]) AND (("ethics "[Subheading] OR "Code$ of Ethics"[Mesh] OR "Ethics Committees, Research"[Mesh] OR "Ethics, Research"[Mesh] OR "Ethics, Clinical"[Mesh] OR "Ethics, Medical"[Mesh] OR Public health ethics [title]OR "Ethical Theory"[Mesh])) OR ("Ethical Review/legislation and jurisprudence"[Mesh] OR "Ethical Review/standards"[Mesh]) OR ("Practice Guidelines as Topic"[Mesh] OR "Guideline "[Publication Type] OR "Practice Guideline$ "[Publication Type]))). Similar articles were assessed using the related articles tool in PubMed. Results:
From the literature review, it appears that whereas there are established guidelines for clinical and biomedical research, there are no ethical guidelines specific to public health. Further it is unclear as to what activities constitute research and which ones do not.
Presently the distinction of an activity as either research or non research is based on criteria developed by CDC, which defines research as "a systematic
investigation, including research development, testing
and evaluation, designed to develop or contribute to
generalizable knowledge." Subsequently, ethical regulation is required for all
public health activities that qualify as research within the above definition. Yet, some public health activities may only fulfil the above definition partially. Consequently, and for some public health activities, there is often an existing dilemma on whether they constitute research or not. (8) Additionally, whereas most contemporary ethical codes address biomedical and research involving human subjects, public health research is usually non-medical, is often based on communities rather than individuals, and may occasionally be limited to review of disease registry data, vital statistics, outbreak investigation or similar surveillance activities.
Emphasis here is that public health bears a societal approach to health, since it improves the well being of communities through social rather than individual interventions. (9) Furthermore, research in public health follows an observational model in which the surveys do not attempt to influence medical interventions, and all they are concerned with is finding patterns in data that are

East African Journal of Public Health Volume 5 Number 3 December 2008
161
consistent and systematic, which in turn can be used to inform decision making whereby the researcher ‘does nothing’ to the subject.
Arguably therefore, many public health activities do not qualify as research with human subjects, (10) and consequently, owing to its population-based focus, public health faces dilemmas concerning whether its activities infringe on individual autonomy. (9) In any case, are all categories of public health activities research? If not, which activities should be excluded from this definition? Alternatively, should all activities in public health not be considered research, considering that the “society has regarded the benefits as greatly outweighing risks to individuals”? (10) This distinction is important as it determines which activities require ethical regulation such as ethical reviews.
Consider health services research, which is concerned with audit of health services. Should individual informed consent be obtained for such studies? (11) Does the collection and analysis of mortality and morbidity data for example, always constitute research? (12-13)
Mariner (10) argues that activities such as disease surveillance programs which are designed to collect anonymous data do not involve research subjects and pose no threat to patients. There is also an assumption that qualitative research is unlikely to cause significant harm to participants. (14) Does this therefore exempt such activities from ethical regulations?
Discussion
Based on the above issues, (which are by no means
exhaustive) in which the need for research ethics is not straightforward it is acknowledged that there may be cases in which exceptions may plausibly be justified. However, danger lurks in allowing such exceptions in the light of the uncertainty regarding distinction between surveillance, audit, outbreak response, research and so on, and therefore whether a specific activity qualifies for exemption eventually becomes a matter of subjective debate. Indeed, the distinction of research from non-research is based on criteria (15) which are themselves liable to different interpretations depending on the researcher’s ethical orientation.
It is likely that the reservations held against strict regulation of research emanates from the proponents’ ethical discourse, in regard to practical or applied ethics versus normative ethics, a disposition which prompts the critics to pick out a particular research issue and ethically analyze it singularly. With such an approach, there are bound to be activities for which arguments for ethical review may not withstand.
Generally, ethical regulation is required to arbitrate the inevitable tension between the rights of the individuals and those of the common good (13) which arise in the course of public health research.
In addition, even when ethical issues could not possibly have been envisioned by the nature of the research design, ethical issues may arise in the course of the activity itself, since ethical issues are encountered in the course of interaction with others. Therefore, even when the research has been carefully reviewed and no ethical issues are anticipated, a researcher may find
himself having to make an urgent ethical decision completely unprepared. Even qualitative research, which may be construed to be harmless exposes participants such risks as anxiety, exploitation, misrepresentation and identification in published papers (14).
Moral issues dominate public health (16), possibly more than is acknowledged, and these issues are bound to become even more prominent as the field of public health grows. Ethical issues may in fact arise with the very choice of public health topic that the researcher chooses to explore. Studies have shown that even research on unlinked anonymous data may also bear ethical dimensions (17). Ethical issues exist even outside the realms of conventional research.
In addition, whether or not the activities are research, it is essential that they be conducted ethically, emphasizing the need for ethical review (18). Indeed, the distinction between research and practice is occasionally illusory.
Furthermore, as Wedeen (19) asserts, “the argument that public research activities are not research because they are not ‘designed’ to develop ‘generalizable’ knowledge does not abrogate the obligation of the public health community to protect privacy”. This is particularly important because it safeguards against the scenario where an activity may be interpreted and justified using existing guidelines, as either research or non-research by different researchers, owing to their subjective ethical orientations.
Ethical review in any public health activity would ensure that it adheres to existing ethical guidelines. It would also serve as a means of avoiding inadvertent breaches in confidentiality (13). In addition, ethical reviews make public health more effective (from a utilitarian point of view) by raising its standards.
However, ethical regulation only complements other sanctions put in place to deter unethical research, all of which do not guarantee success. As Beecher (20) pointed out in his landmark paper, the ultimate safeguard is the researcher himself, by virtue of him being intelligent, conscientious, compassionate and responsible. In other words, the researcher should advocate what he himself believes to be ethical. (9) Whereas it is entirely proper for ethical codes and declarations to be formulated, they are only valuable if they are used as intended and not as a substitute for the researcher’s own conscience. Indeed, it is easy to shelter behind an ethical code to avoid thinking about the real issues. The researcher should not view ethical approval as a ‘rubber stamp’ to do that which in his own mind is unethical.
Conclusions
Attention to ethical issues is of paramount importance in all stages of public health programs whether planning, implementation or evaluation, and that doing so will facilitate growth of public health as a discipline. Ethics therefore should be a key consideration for every public health activity, regardless of whether such an activity is believed to be research or not. Additionally, research in public health must be conducted within the confines of internationally accepted as well as local ethical requirements, thus emphasizing on the need

East African Journal of Public Health Volume 5 Number 3 December 2008
162
for ethical overview. Further, in order to sidestep unnecessary ethical problems occasioned by the distinction between public health activity and research, ethical principles should be applied to both.
References:
1. Tu JV, Willison DJ, Silver FL, Fang J, Richards JA, Laupacis A, et al.
Impracticability of informed consent in the registry of Canadian stroke
network. N Engl J Med 2004 Apr 1;350(14):1414-21.
2. Haddow JE, Palomaki GE. Use of personal records for research purposes.
Restrictions unnecessary and obstructive. BMJ. 1995 Jan 28;310(6974):258.
3. Togerson DJ, Domville JC. Ethics review in research: Research governance
also delays research. BMJ. 2004 Mar 20;328(7441):710.
4. Hearnshaw H. Variations, across eleven European countries, in research
ethics requirements for non-invasive, interventional study. BMJ 2003;327:
140-1.
5. Bhutta ZA. Ethics in international health research: a perspective from the
developing world. Bull World Health Organ 2002;80(2):114-20.
6. Wald N, Law M, Meade T, Miller G, Alberman E, Dickinson J. Use of
personal medical records for research purposes. BMJ 1994 Nov
26;309(6966):1422-4.
7. Woolf SH, Rothemich SF, Johnson RE, Marsland DW. Selection bias from
requiring patients to give consent to examine data for health services
research. Arch Fam Med 2000 Nov-Dec;9(10):1111-8.
8. Hodge JG Jr. An enhanced approach to distinguishing public health practice
and human subjects research. J Law Med Ethics. 2005 Spring;33(1):125-41.
9. Kass NE. An ethics framework for public health. Am J Public Health 2001
Nov;91(11):1776-82.
10. Mariner WK. Public confidence in public health research ethics. Public
Health Rep. 1997 Jan-Feb;112(1):33-6.
11. Cassell J, Young A. Why we should not seek individual informed consent for
participation in health services research. J Med Ethics 2002 Oct;28(5):313-7.
12. Capron AM. Protection of research subjects: do special rules apply in
epidemiology? Law Med Health Care. 1991 Fall-Winter;19(3-4):184-90.
13. Fairchild AL, Bayer R. Public health. Ethics and the conduct of public health
surveillance. Science. 2004 Jan 30;303(5658):631-2.
14. Richards HM, Schwartz LJ. Ethics of qualitative research: are there special
issues for health services research? Fam Pract. 2002 Apr;19(2):135-9.
15. Centers for Disease Control and Prevention. Defining Public Health
Research and Public Health Non-Research. [Online].1999 October 4. [Cited
May 18 2008] Available at:
http://www.cdc.gov/od/science/regs/hrpp/researchDefinition.htm
16. Callahan D, Jennings B. Ethics and public health: forging a strong
relationship. Am J Public Health. 2002 Feb;92(2):169-76.
17. Nicoll A, Gill N, Goldberg D, Peckham C. The ethics of unlinked anonymous
testing. Surveys provide essential information.BMJ. 2000 May
6;320(7244):1275.
18. MacQueen KM, Buehler JW.Ethics, practice, and research in public
health.Am J Public Health. 2004 Jun;94(6):928-31.
19. Wedeen RP. Ethics in public health institutions. Am J Public Health. 2002
Dec;92(12):1884-5.
20. Beecher HK. Ethics and clinical research. N Engl J Med. 1966 Jun
16;274(24):1354-60.

East African Journal of Public Health Volume 5 Number 3 December 2008
163
THE ROLE OF CHANGING DIET AND ALTITUDE ON GOITRE PREVALENCE IN FIVE REGIONAL
STATES IN ETHIOPIA
Cherinet Abuye1, Yemane Berhane2, and Tessema.Ersumo3
Abstract:
Objective: Iodine Deficiency Disorders (IDD) as one of the leading nutritional problems has been increasing through time due to
iodine deficiency, aggravating factors and IDD knowledge in many parts of Ethiopia. The effect of changing diet and altitude on goitre
prevalence is assessed.
Methodology: Randomly selected five regional states (Amhara, Oromiya, Tigray, SNNP and Benshangul-Gumuz) were used to
conduct cross-sectional study on IDD. In each region cluster sampling method was applied to select study subjects. Low land and
adjacent high land were independently sampled to investigate the role of altitude on goiter prevalence. Totally 6960 children and the
same number of biological mothers of the children were included in the clinical examination for goiter and household interview. Urine
samples were collected from children for urinary iodine examination/analysis (UIE). Besides, in all clusters qualitative data were
collected on IDD knowledge and cassava introduction, cultivation and consumption.
Results: Cassava consumption and living in high altitude were found to be risk factors for IDD. In the two regions (SNNP and
Benshangul-Gumuz) among three where cassava is cultivated, those who consume cassava frequently were significantly (p<0.001)
affected by goitre than those consuming rarely or not. In the last thirty years cassava consumption has been increasing with the
concomitant increase in goitre rate and other associated health problems. Acute cyanide intoxication in children from cassava meal
was reported. In Amhara region, goitre rate was significantly (p<0.05) higher in high altitudes than in low both for children and
mothers. This was due to significantly (p<0.01) low level of iodine intake in high lands than in low as indicated by UIE. Due to stigma,
parents do not send goitrous children to schools and goitrous girls are not wanted for marriage.
Conclusion: Besides low level of iodine intake, cassava consumption and living in high altitude were responsible for the observed
variation and severity in goitre rates. IDD affects several dimensions of human life including school enrolment and marriage.
Addressing IDD in-terms of salt iodization and training communities on cassava processing techniques to remove cyanide, awareness
creation on IDD and soil conservation are highly recommended.
Key words: Altitude and IDD, cassava consumption and IDD, IDD aggravating factors, IDD knowledge, UIE
Introduction
Iodine deficiency disorders (IDD) affect millions
people in developing countries mainly due to iodine deficiency and aggravating factors that affect the bioavailability of iodine in the body (1-7).
Multiple nutritional and environmental factors influence the prevalence and severity of iodine deficiency disorders in iodine deficient areas (8). Generally protein energy malnutrition and vitamin A, iron, and selenium deficiency and, variety of goitrogenic factors from food sources can aggravate iodine deficiency (4,8-10). Cassava plant which plays dominant role in feeding many people in tropical developing countries (2,11) contain goitrogenic factor (cyanogenic glucosude) that inhibit iodine uptake by the thyroid gland thereby aggravate iodine deficiency when unprocessed cassava is consumed.
Cassava is a food crop of American origin introduced to Africa by the slave traders nearly three century ago. Today this crop is spreading to many parts of Africa including Ethiopia. Where cassava is consumed as staple food, endemic goitre and cretinism are common (3). Cassava (Minihot esculenta) is consumed as staple food in many parts of SNNP, Benishngul-Gumuz and some part of Western Oromiya region. Regional health bureaus authorities recognized the problem and have been seeking assistance to investigate the aetiology for the wide spread of IDD in SNNP and
Correspondence to: Cherinet Abuye, P.O.Box 34233, Addis Ababa, Ethiopia, Fax:
251-112-754744/757722, Tel: 251-1-112751522, E-mail,
1Ethiopian Health and Nutrition Research Institute (EHNRI),
2School of Public
Health, Faculty of Medicine, Addis Ababa University (AAU), Ethiopia,
3Department
of Surgery, Addis Ababa University, Ethiopia
some settlement areas of Western Oromiya, within the last five to ten years.
Areas with comparable iodine level from food sources in similar agro-ecological zone exhibit variation in the magnitude of goitre rates (12-15). This may suggest the existence of other co-factors besides iodine deficiency that may play role in aggravation or causing goitre.
These prompted us to investigate the possible cause of the disease parallel to the IDD national survey. Association between cassava introduction, consumption and altitude with goitre rate and IDD knowledge were focus of this study.
Methods
This study utilized a cross sectional epidemiological
design to determine risk factors of IDD other than iodine deficiency. Ethiopia has three different agro-ecological zones; high land with altitude over 2500 meters above sea level (masl), middle land between 1500 to 2500 masl, and low land below 1500 masl. Hills and mountain ranges dominate the northern part of the country while middle land is common in South.
Randomly selected regional sates, two from the North (Amhara and Tigray) and three from South and Southwest (Oromiya, Southern Nations Nationalities and peoples (SNNP) and Benishangul-Gumuz) where about 90% of the country’s population live (16) were used to conduct focus group discussion, key informants interview, field observation and quantitative data collection. Crops including cassava, cereals and legumes are widely cultivated in the South while in the North cereals and legumes are the dominant cultivations.
Cluster sampling methods was applied to select the study population. In each agro-ecological zone thirty clusters were selected using probability proportional to

East African Journal of Public Health Volume 5 Number 3 December 2008
164
the population size techniques (17). Thirty clusters in high land and thirty clusters in low land were selected in a given regional state except in Benishangul where only thirty clusters were selected because of inaccessibility of high lands. The total number of the study population divided by thirty (number of clusters) establishes the sampling interval. The first cluster was selected based on the number drawn using random number table. To select the other clusters the sampling interval was added sequentially to the random number till all thirty clusters were selected. Thirty elementary school age children and their biological mothers per cluster were included in the clinical examination for goitre and household interview. WHO/UNICEF/ICCIDD recommended method (18) was used to classify goitre grades.
Casual urine samples were collected in iodine free test tubes from all children included in the study. Urinary iodine analysis was performed in duplicate in iodine laboratory of the Ethiopian Health and Nutrition Research Institute (EHNRI) using wet digestion method (19). For quality control, samples of urine were analyzed in Stellenbosh University, Human Nutrition Research department South Africa following the same method used at EHNRI. The result of urinary iodine examination (UIE) was expressed as micrograms of iodine per 100ml of urine (µg iodine per dl urine). Iodine status of the children was classified using WHO/UNICEF/ICCIDD (18) recommended cut-off points for urinary iodine excretion.
Frequency of cassava consumption, household practice related to salt and knowledge on IDD were collected using structured household questionnaire. Study nurses administered the questionnaire to the mother. Cassava consumption greater than once in a week is considered as cassava consumers. Data were collected by house-to-house visit.
In each identified location, qualitative data were collected to verify data collected by quantitative method. Semi-structured open-ended questions were developed and used for key informants interview and focus group discussion (FGD). Thematic areas of the questions were cassava cultivation, history of cassava introduction to the region, health problems associated with cassava meal preparation and consumption, cassava promotion in relation to goitre development and knowledge about cassava toxicity. The number of participants (community elders and Kebele (smallest administrative unit in district) representatives) in FGD in each cluster varies from 6 to 12 depending on the availability of the community members. Government officials from office of agriculture, health and community elders used as key informants. Supervisors of the survey were responsible for FGD and key informants interview. Two assistants (data collectors) took part in note taking, which was
immediately expanded after completion of discussion or interview.
For quantitative data entry, processing and analysis, SPSS for windows version 10 was used. The chi-square and t-test tests were applied, for testing level of difference in goitre rate (proportions) and Urinary iodine concentration respectively among communities at different altitudes.
Interviews or focus group discussions were written in the word processing program and later imported and coded using open code program, developed in Sweden at Umea University (20). Data were organized, analyzed and used for interpretation.
Results
Total goitre rate of children and mothers by altitude, cassava consumption and region is presented in Tables 1 and Table 2. The total goitre in all regional states was greater than 20% both in children and mothers, an indication of severe to moderate iodine deficiency. The total goitre rate both in children & mothers is significantly (P<0.01) higher in all high altitudes than in low. Both children and mothers living in high lands of Amhara were significantly affected by IDD than those in low lands (P=0.002 and P=0.01 respectively). Similarly, children of high altitude of Oromiya and mothers in high land areas of SNNP were significantly exposed to IDD than their counter parts in low land p= 0.04 and P=0.008 respectively.
In SNNP and Benshangul-Gumuz regional states, cassava consumption was significantly associated with total goitre rates both in children and their biological mothers while in Oromiya region not.
It was also reported by key informants and focus group discussants that goitre was very rare or not well known before introduction of cassava to many parts in SNNP some 30 years ago. In-line with this, in areas where goitre is newly developed, local name for goitre is not known. This may also substantiate what has been reported by quantitative data about the role of cassava on goitre prevalence in South, that is, goitre is a problem developed due to introduction of cassava to the region.
According to them the problem of goitre has been increasing as cultivation and consumption of cassava increases. The magnitude of goitre has been increasing of alarming rate even in previously goitre non-endemic areas.
In Bonke and Gofa zuria districts in SNNP regional state where cassava is used as staple food, almost all school children are affected by goitre. Health professionals working at health post and health centre indicated that they have been appealing to zonal and regional health bureau for medical assistance.

East African Journal of Public Health Volume 5 Number 3 December 2008
165
Table 1 Goitre rate in children by cassava consumption, altitude and regions.
Total goitre rate Odds
ratio
95% CI P-value
Region Number of subjects
N (%)
Yes 86 42 (48.8) Oromiya No 1532 641 (41.4)
1.33 0.84<OR<2.09 NS
Yes 416 296 (71.2) SNNP No 1249 630 (50.4)
2.42 1.89<OR<3.10 <0.001
Yes 257 133 (51.8) Benishangul Gumuz No 478 198 (41.4)
1.52 1.11<OR<2.08 0.008
Yes 759 471(62.1)
Cassava consumption
Total No 3259 1469(45.1)
1.99 1.69<OR<2.35 <0.001
High 1026 326 (31.8) Amhara Low 611 150 (24.5)
1.43 1.13<OR<1.81 0.002
High 910 404 (44.4) Oromiya Low 906 359 (39.6)
1.22 1.00<OR<1.47 0.04
High 900 205 (22.8) Tigray Low 900 189 (21.0)
1.11 0.88<OR<1.40 NS
High 896 513 (57.3) SNNP Low 811 447 (55.1)
1.09 0.90<OR<1.33 NS
High 3732 1452 (39.1)
Altitude
Total Low 3228 1133 (35.1)
1.15 1.04<OR<1.27 <0.01
Table 2 Goitre rate in mothers by cassava consumption, altitude and regions.
Total goitre rate Region Number of
mothers
N (%) Odds
ratio
95% CI P-value
Yes 86 34 (39.5) Oromiya No 1532 464 (30.3)
1.50 0.94<OR<2.40 NS
Yes 414 317 (76.6) SNNP No 1146 684 (54.9)
2.69 2.07<OR<3.49 <0.001
Yes 257 126 (49.0) Benishangul Gumuz No 472 171 (36.2)
1.69 1.23<OR<2.33 0.001
Yes 757 477(63.0)
Cassava consumption
Total No 3150 1319(41.9)
2.36 2.00<OR<2.79 <0.001
High 1026 318 (31.0) Amhara
Low 611 153 (25.1)
1.34 1.07<OR<1.70 0.01
High 910 292 (32.1) Oromiya
Low 906 276 (30.5)
1.08 0.88<OR<1.32 NS
High 900 332 (36.9) Tigray
Low 900 309 (34.3)
1.12 0.92<OR<1.36 NS
High 896 572 (63.8) SNNP
Low 811 467 (57.6)
1.30 1.07<OR<1.59 0.008
High 3732 1530 (41.0)
Altitude
Total
Low 3228 1191 (36.9)
1.19 1.08<OR<1.31 <0.01
All these evidences may indicate that cassava
consumption exacerbated the iodine deficiency and associated health problems in SNNPR and neighbouring regional states. According to the focus group discussants and key informants, during drought, the fast spread of cassava to many parts of the regions has contributed a lot for the concomitant increase in magnitude of the goitre. The fast spread of the food crop (cassava), to the region is due to its drought resistant nature, highest yield even in poor soils, easy to grow and manage (once planted, it is almost ignored: it is not weeded or treated with pesticides) and as the result it is highly preferred by communities affected by recurrent drought. The leaves as well as the roots of cassava are used for animal feed. When cassava is used for livestock feed milk production increases said focus group discussants.
Cassava introduction, consumption and relation with
goitre:
White missionaries introduced cassava to Southern part of Ethiopia about 30 to 35 years ago, community
elders said. It is cropped at altitude ranging from 450 to 1,800 meters above sea level. In places where it was first introduced cassava is called “Yeferenge Boye” meaning white men yam. According to community elders and key informants this name was given because the cassava roots are similar to that of yam. Yam was found as root crop in the area before cassava was introduced. In the same region in some other places it is called "Yenchet Boye" meaning "tree yam". It is primarily used as a food security crop. In Southern Ethiopia it grows in Konso Special district, Amaro speciel district, Gedeo, Sidama, Wolayita and Gamo-Gofa zone while in south-western part of Ethiopia it grows in some pocket areas of Illubabor, Jimma, West Wollega zone and Benshangu-Gumuz/Assosa zone (Figure 1). It is also found in very few places in Central Ethiopia in Majete, North shoa where also goitre is endemic. In the last ten years to date cassava has been promoted to many part of the country including the northern Ethiopia where it hasn’t been known before. All meals in South include cassava during summer. It is consumed as boiled, bread and porridge. Occasionally used for preparation of local alcoholic
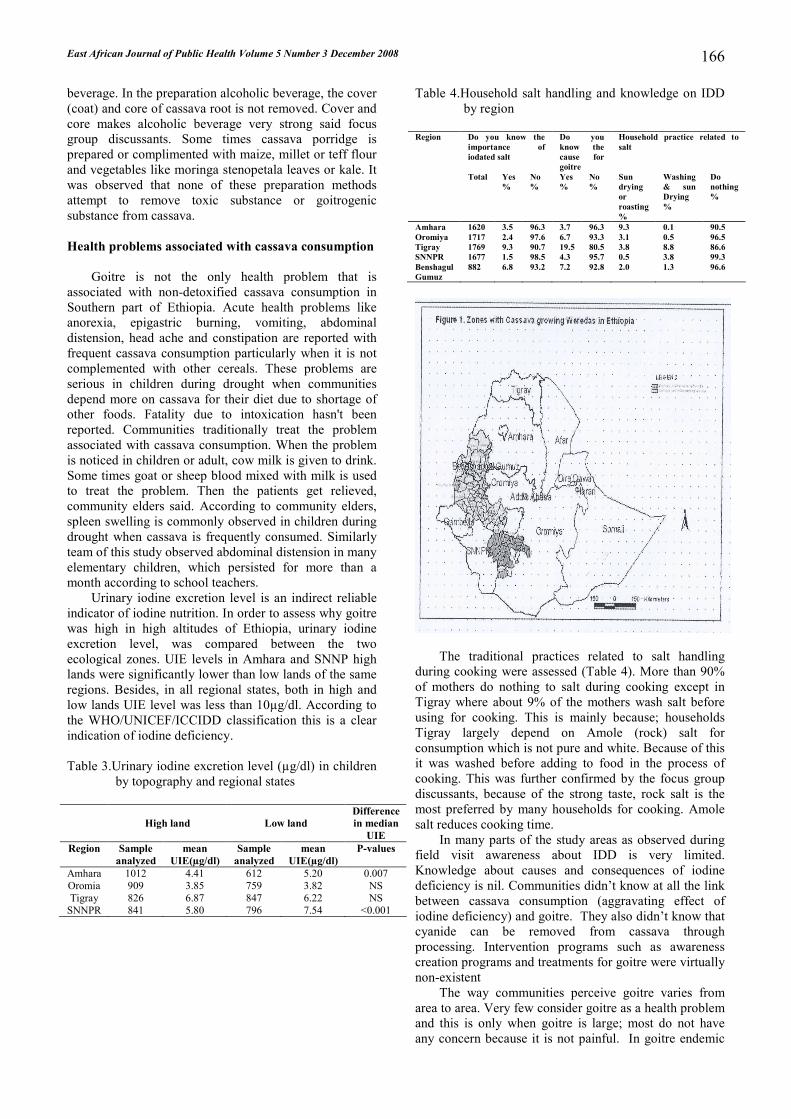
East African Journal of Public Health Volume 5 Number 3 December 2008
166
beverage. In the preparation alcoholic beverage, the cover (coat) and core of cassava root is not removed. Cover and core makes alcoholic beverage very strong said focus group discussants. Some times cassava porridge is prepared or complimented with maize, millet or teff flour and vegetables like moringa stenopetala leaves or kale. It was observed that none of these preparation methods attempt to remove toxic substance or goitrogenic substance from cassava.
Health problems associated with cassava consumption
Goitre is not the only health problem that is associated with non-detoxified cassava consumption in Southern part of Ethiopia. Acute health problems like anorexia, epigastric burning, vomiting, abdominal distension, head ache and constipation are reported with frequent cassava consumption particularly when it is not complemented with other cereals. These problems are serious in children during drought when communities depend more on cassava for their diet due to shortage of other foods. Fatality due to intoxication hasn't been reported. Communities traditionally treat the problem associated with cassava consumption. When the problem is noticed in children or adult, cow milk is given to drink. Some times goat or sheep blood mixed with milk is used to treat the problem. Then the patients get relieved, community elders said. According to community elders, spleen swelling is commonly observed in children during drought when cassava is frequently consumed. Similarly team of this study observed abdominal distension in many elementary children, which persisted for more than a month according to school teachers.
Urinary iodine excretion level is an indirect reliable indicator of iodine nutrition. In order to assess why goitre was high in high altitudes of Ethiopia, urinary iodine excretion level, was compared between the two ecological zones. UIE levels in Amhara and SNNP high lands were significantly lower than low lands of the same regions. Besides, in all regional states, both in high and low lands UIE level was less than 10µg/dl. According to the WHO/UNICEF/ICCIDD classification this is a clear indication of iodine deficiency.
Table 3.Urinary iodine excretion level (µg/dl) in children by topography and regional states
High land
Low land
Difference
in median
UIE
Region Sample
analyzed
mean
UIE(µg/dl)
Sample
analyzed
mean
UIE(µg/dl)
P-values
Amhara 1012 4.41 612 5.20 0.007 Oromia 909 3.85 759 3.82 NS Tigray 826 6.87 847 6.22 NS
SNNPR 841 5.80 796 7.54 <0.001
Table 4.Household salt handling and knowledge on IDD by region
Region Do you know the
importance of
iodated salt
Do you
know the
cause for
goitre
Household practice related to
salt
Total Yes
%
No
%
Yes
%
No
%
Sun
drying
or
roasting
%
Washing
& sun
Drying
%
Do
nothing
%
Amhara 1620 3.5 96.3 3.7 96.3 9.3 0.1 90.5
Oromiya 1717 2.4 97.6 6.7 93.3 3.1 0.5 96.5
Tigray 1769 9.3 90.7 19.5 80.5 3.8 8.8 86.6
SNNPR 1677 1.5 98.5 4.3 95.7 0.5 3.8 99.3
Benshagul
Gumuz
882 6.8 93.2 7.2 92.8 2.0 1.3 96.6
The traditional practices related to salt handling
during cooking were assessed (Table 4). More than 90% of mothers do nothing to salt during cooking except in Tigray where about 9% of the mothers wash salt before using for cooking. This is mainly because; households Tigray largely depend on Amole (rock) salt for consumption which is not pure and white. Because of this it was washed before adding to food in the process of cooking. This was further confirmed by the focus group discussants, because of the strong taste, rock salt is the most preferred by many households for cooking. Amole salt reduces cooking time.
In many parts of the study areas as observed during field visit awareness about IDD is very limited. Knowledge about causes and consequences of iodine deficiency is nil. Communities didn’t know at all the link between cassava consumption (aggravating effect of iodine deficiency) and goitre. They also didn’t know that cyanide can be removed from cassava through processing. Intervention programs such as awareness creation programs and treatments for goitre were virtually non-existent
The way communities perceive goitre varies from area to area. Very few consider goitre as a health problem and this is only when goitre is large; most do not have any concern because it is not painful. In goitre endemic

East African Journal of Public Health Volume 5 Number 3 December 2008
167
areas, due stigma, parents do not send goitrous children to schools and public gatherings especially when goitre is voluminous In many areas where goitre is endemic, girls with goitre especially when goitre is large in size are not wanted for marriage
In some areas traditional practitioners treat goitre by burning with fire produced by friction of two dry sticks or dry pieces of woods. Many people including children were seen with scar on neck (thyroid gland) during field visit. Goitre has different names in different communities. Although the teams of the survey haven’t been to the entire part of the country, goitre is not considered as beauty in the study areas.
Discussion
Iodine deficiency as indicated by UIE level is a major cause for goitre in many parts of the study areas. Cassava consumption and living in high altitudes were found to play role in aggravating iodine deficiency. Those with voluminous goitre particularly, children and adult girls are highly discriminated in the community. Where the problem is severe, IDD have adverse effect on school enrolment, marriage and social gatherings. Community knowledge on several aspects of IDD including link between cassava consumption and IDD is very poor in the study areas.
In SNNP and Benshangul-Gumuz regional states,
those who frequently consume (children & mothers) cassava are significantly (p<0.01) affected by goitre than those who do not or rarely consume. However, in Oromiya, the goitre rate was not significantly associated with cassava consumption perhaps cassava was not consumed widely and frequently as SNNP and Benishangul-Gumuz regional states. Besides, cassava was introduced to Oromiya region recently.
According to the focus group discussants and key informants information, about 30 years ago, cassava cultivation was limited to very few parts of Ethiopia. But today, as it can be seen in figure 1, cassava cultivation expanded to many parts of SNNP, Western Oromiya, and Benshangul-Gumuz. Very recently, ministry of agriculture is promoting cassava utilization and, its cultivation is expanding to drought affected areas in the Northern part of Ethiopia. Cassava cultivation and consumption further spread as the density in population and the preference of plant by the drought prone community increases. Cassava is drought resistant food crop. In areas where cassava is used as staple food, the goitre rate was severe (>30%) and relatively higher than the other regional states (21,22). Roots crops including cassava were widely consumed in the form of boiled and bread in SNNP, Western Oromiya and Benishangul-Gumuz while in the North (Tigray and Amhara) cereals are the major source of the staple diet. All regions included in the study areas depend on locally produced crops for consumption and iodated salt consumption is almost nil (21). UIE level was very low and comparable among regions. Besides iodine deficiency, the high rate of goitre in SNNP and Benishngul-Gumuz is attributed by frequent cassava consumption. Inline with the current
study, previously reported pocket studies (23) indicated that, goitre rate has increased after introduction of the cassava to the regions. Cassava contains cyanogenicglucosides that inhibits thyroid iodine transport and at higher doses, competes with iodide in organification process, upon conversion to thiocyanate in the body metabolism (2-4)). Studies (3) done in Zaire have also established that goitre and cretinism as the result of iodine deficiency considerably exacerbated by cyanide from insufficiently processed cassava consumption.
Goitre is not the only health problem that is
associated with unprocessed cassava consumption. During drought, communities in SNNP regional state in Ethiopia, depend more on cassava for their diet due to shortage of others foods. Community members and key informants reported that those who consumed cassava especially children in the form of boiled had stomach distension with burning pain, constipation, anorexia, dizziness, headache and anaemia. According to elders, the health problems are more pronounced during drought or dry season. Increase in cassava consumption due to shortage of other foods in the two conditions (drought and dry season) could be the possible explanation for the increase in health problems associated with cassava consumption. Most of these health problems may be characterized by cyanide found in unprocessed cassava meal. Cyanide is toxic chemical substance when ingested. The elders in the communities traditionally have treated cyanide intoxication from cassava consumption. When the problem is noticed, cow milk is given to drink. Some times goat or sheep blood mixed with milk is used to treat the problem. Then the patients get relieved, community elders said. This is perhaps because; milk or blood dilutes cyanide in the body. Another possible explanation for relieve could be cyanide from cassava is detoxified or converted to thiocyanate (non-toxic) by sulphur from blood or milk. If not treated and milk is not available suffering from persistent vomiting is common especially among children.
The problem is more pronounced in children may be because, children are less likely to tolerate the toxic effect of unprocessed cassava meal consumption compared with adults.
The goitre rate in the Northern Ethiopia Amhara and Tigray regional states was also found under the category of severe iodine deficiency, but the rate is lower than the areas where cassava is consumed. Although all ecological zones are not immune from endemic goitre, magnitude of the disease is significantly higher in high altitudes than in low. This means living in high altitude signify goitre rate in some regional states in Ethiopia. The effect of altitude was further confirmed by low levels of UIE in high lands of Amhara and SNNP regional states than in low lands of the same regions. Aggregated analysis for all regional states also indicated that high altitudes were significantly affected by goitre than low. Iodine, usually found in the top layer of the soil can easily be leached away by erosion mainly in high altitude and slant areas. If not conserved, the top soils in high altitudes are more likely to be exposed for erosion than low lands (24). The crops grown in iodine deficient soils are poor in iodine content.

East African Journal of Public Health Volume 5 Number 3 December 2008
168
Hence the leaching away of iodine in the top layer of the soil may have contributed for high prevalence of goitre in high altitudes than in low land areas.
The way communities perceive goitre varies from area to area. Very few consider goitre as a health problem and this is only when goitre is large; most do not have any concern because it is not painful. In some goitre endemic areas, due to social discriminations, parents do not send goitrous children to schools and public gatherings especially when goitre is voluminous and girls with voluminous goitre are not also wanted for marriage. Obviously these are a treat to the social and economic development of the country. Because illiteracy has negative impact on intellectual manpower production which in turn affects individual productivity.
Due to lack of nutrition education, IDD knowledge is poor in many study households in the study areas. Knowledge on cassava processing to remove goitrogenic substance is nil. Community didn’t know the exacerbating effect of cassava consumption. On IDD
Women in Tigray regional state, even if they had relatively better knowledge on IDD and importance of iodated salt, some of them wash salt before cooking. The salt washing practice is usually done when salt is dark and impure. Washing salt can easily remove iodine from iodated salt. These may have negative impact when the ongoing initiative to launch salt iodization is effected.
Generally, besides low iodine intake, several factors such as cassava consumption, living in high altitude, IDD knowledge and cessation of intervention program seem to play role in exacerbating and worsening IDD situation in the country. Salt iodization program was started in 1988 and interrupted after few period of operation. Termination of the salt iodization program in goitre endemic areas is reported to accelerate thyroid dysfunction (25).
Besides, effecting salt iodization to control iodine deficiency, nutrition education, and introducing cassava processing techniques to remove goitrogenic substance are highly recommended. Sustainability of the program needs to be considered if intervention program is started.
In addition to community training on cassava processing technique to removed cyanide, recent cassava promotion campaign to the other regions where iodine intake is already very low or marginal, should focus or consider introduction of new variety of cassava with low cyanide content. On top of this, coordination among different organizations such ministry of Agriculture (research institute of agriculture), health and nutrition research institute and nutrition universities is very important to address the gaps in cassava promotion, cultivation, and consumption.
Acknowledgement
This study was funded by UNICEF, Federal Ministry of Health and EHNRI, and undertaken in Ethiopian
Health and Nutrition Research Institute (EHNRI). We like to thank all community members' respondents who participated in this study. We are grateful to the EHNRI laboratory group who did the unitary iodine analysis and management group for facilitating laboratory as well as field work of this study. We would also like to thank Professor Demetre Labadarios and Dr I. M. Moodie who facilitated the analysis of urinary iodine analysis in Stellenbosh University, Human nutrition Department, Republic of South Africa.
Reference
1. John TD, Eduardo AP, Carlos HD, Fernando EV. Towards eradication of
Endemic goitre, Cretinism, and Iodine deficiency. PAHO, WHO. Scientific
Publication; No 502, 1986.
2. Delange F, Ahluwallu. Cassava toxicity and thyroid: research and public
health issues. Proceeding of a workshop held in Ottawa, Canada, 31 May – 2
June 1982.
3. Ermans AM., Mbulamoko NM., Delange F., and Ahluwalia R. Role of
cassava in the etiology of endemic goitre and cretinism. International
Development Research Centre IDRC-136e, Ottawa, Canada, 1980.
4. Bourdoux P, Delange F, Gerard M, Mafuta M, Hanson A, Ermans AM.
Evidences that cassava ingestion increases thiocyanate formation: a possible
ethiological factor in endemic goitre. J. Clin Endicronol Metab 1978; 46: 613-
21.
5. Hetzel, BS. Iodine deficiency disorders (IDD): a maternal and child health
issue. Advances in international maternal and child health. 1986; 6:79-120.
6. Hetzel BS, Pandav C. SOS for a billion. The conquest of Iodine Deficiency
Disorders, 2nd
Ed. New Delhi, Oxford University Press 1996.
7. Bleichrodt N, Born MA. Meta-analysis of research on iodine and its
relationship to cognitive development. In: Stambury JB, eds. The damaged
brain of iodine deficiency. New York, Cognizant Communication
Corporation, 1994: 195-200
8. Boygas SC. Iodine deficiency disorders. J clin Endocrinol Metab 1993;
77:561-91
9. Zimmermann MB, Wegmuller R, Zeder C, Chaouki N, Torresani T. The
effect of vitamin A deficiency and vitamin A supplementation on thyroid
function in goiterous children. J Clin Endocrinol Metab 2004; 89:5441-5447.
10. St Germain DI, Gaiton VA. The deiodinase family of selenoproteins. Thyroid
1997; 7:655-8.
11. Hans R. Cassava toxicity and food security. Uppsala Sweden, 1987.
12. Interdepartmental Committee on Nutrition for National Defense Addis
Ababa, Ethiopia; 1959.
13. Hovander, Y. Endemic goitre among children in Ethiopian Highlands. Eth.
Med. J. 1970; 8:179.
14. Wolde-Gebriel Z, Demeke T, West CE, Vad Der Haar F. Goitre in Ethiopia.
Brit J Nutr 1993; 69:257-268
15. Abuye C, Urga K. Determinants of iodine Deficiency in school children in
different regions of Ethiopia. East Afr Med J 2000; 77:133-137
16. Federal Democratic Republic of Ethiopia, Ministry of Health. Health and
Health Related indicators. 2003/04
17. Sullivan KM, May S, Maberly G. Urinary Iodine assessment: A manual on
survey and laboratory methods, 2nd
ed. UNICEF, PAMM, 2000.
18. ICCIDD/UNICEF/WHO. Assessment of Iodine Deficiency Disorders and
monitoring their Elimination. A guide for programme managers.
WHO/NHD/01.1. 2001
19. Dunn JT, Crutchfield HE, Gutekunst R, Dunn D. Methods for measuring
iodine in urine. A joint publication of WHO/UNICEF/ICCIDD. 1993: 18 – 23
20. Open code developed by UMDAC and Epidemiology Department of Public
Health and Clinical Medicine at Umea University, Sweden. Open code
Version 2.1 June, 2001
21. Abuye C, Behane Y, Akalu G, Getahun Z, Ersumo T. Prevalence of goitre in
children 6 to 12 years of age in Ethiopia. Food and Nutrition Bulletin. 2007;
28:391-398
22. Abuye C, Berhane Y. The goitre rate, its association with reproductive
failure, and the knowledge of iodine deficiency disorders (IDD) among
women in Ethiopia: Cross-sectional community based study. BMC Public
Health. 2007; 7:316.
23. Abuye C, Kelbessa U, Wolde-Gbriel Z. Health effect of cassava consumption
in South. East African Medical Journal. 1998;25:166-170
24. Hetzel BS. The story of Iodine Deficiency. An International Challenge in
Nutrition. Oxford Medical Publication, 1989
25. Zimmermann MB, Wegmuller R, Zeder C, Torresani T, Chaoouki N.. Rapid
relapse of thyroid dysfunction and goitre in school-age children after
discontinuation of salt iodization. Am J Clin Nutr 2004; 79: 642-5