earth sciences divisjon - iaea
TRANSCRIPT

JULY 1 9*{S2|-1*V* * J $ ^ Dr. 0?Z LBL-10696 UC-13-
EARTH SCIENCES DIVISJON
ANNUAL REPORT 1979
LAWRENCE BERKELEY LABORATORY UNIVERSITY OF CALIFORNIA BERKELEY, CALIFORNIA 94720
Prepared for the U.S. Department of Energy under Contract W-7405-ENG-48 EISTRiaUTlCi 2? This 331

LEOM. NOTICE
This book was prepared as an account of work sponsored by an agency of the Catted Slates Government Neither the United States Government nor any agency thereof, nor any of their employees, makes any warranty, express or implied, or assumes any let^habdtty or respomibawY fbr the accuracy, completeness, or osefnlaess of any information, apparatus. prooWt, or process disclosed, or represents that its trse would not infringe privately owned rights. Reference herein to any specific commercial product, process, or service by trade name, trademark, manufacturer, or otherwise, does not necessarily constitute or imply its endorsement, recomjaendatioo. or favoring by the United S* v e s Government or any agency thereof. The views and opiuons of authors expressed herein do not necessarily state or reflect those of the United States Government or any agency thereof.
Printed in the United States of A Available from
National Technical Information Service U.S. Departmei: of Commerce 5285 Port Royal Road Springfield, VA 22161 Price Code: A10

LBL-10686
EARTH SCIENCB DIVISION ANNUAL REPORT 1979
LAWRENCE BERKELEY LABORATORY UNIVERSITY OF CALIFORNIA BERKELEY, CALIFORNIA 94720
.MfCLUK*
Prepared for the U.S. Department of Energy under Contract W-7405-ENG-48
;2 UMIKlIia

CONTENTS
Introduction 1
GEOTHERMAL ENERGY DEVELOPMENT
Geothermal Exploration Technology 4
INTERPRETATION OF ELECTRICAL AND ELECTROMAGNETIC SURVEY DATA 4 H. F. Morrison, K. H. Lee, E. Mozley, and M. Hoversten
FIELD PROCESSING OF MAGNETOTELLURIC DATA S J. Clarke, T. D. Gamble, W. M. Goubau, R. Koch, and R. Miracky
AUTOMATED SEISMIC PROCESSOR 7 T. V. McEvilly, E. L. Majer, J. Bartschi, J. Heinsen, and R. O'Connell
CONTP.OLLED-SOURCE ELECTROMAGNETIC MEASUREMENTS AT GEOTKERMAL SITES IN NEVADA 11 M. J. Wilt, N. E. Goldstein, R. Haughl, and M. Stark
GEOPHYSICAL AND GEOCHEMICAL INVESTIGATIONS AT MT. HOOD, OREGON 15 N. E. Goldstein, H. A. Wollenberg, E. Mozley, and M. J. Wilt
KLAMATH BASIN GEOTHERMAL RESOURCE AND EXPLORATION TECHNIQUE EVALUATION 19 M. A. Stark, N. E. Goldstein, and H. A. Wollenberg
MAGNETOTELLURIC STUDIES IN THE HIGH CASCADE, OREGON 24 N. E. Goldstein, R. Miracky, W. M. Goubau, and T. D. Gamble
Geothermal Energy Conversion Technology 26 BINARY FLUID EXPERIMENT 26 B. W. Tleimat
ACTIVITIES IN DIRECT-CONTACT HEAT EXCHANGE 27 P. M. Rapier
Reservoir Engineering 31
MEXICAN-AMERICAN COOPERATIVE PROGRAM AT THE CERRO PRIETO GEOTHERMAL FIELD, BAJA CALIFORNIA, MEXICO 31 M. J. Lippmann, P. A. Witherspoon, and N. E. Goldstein
REGIONAL GEOLOGIC SETTING OF THE CERRO PRIETO GEOTHERMAL FIELD 36 S. P. Vonder Haar and J. H. Howard
i l l
lv
SUBSURFACE GEOLOGY OF THE CERRO PRIETO GEOTHERMAL FIELD 39 S. P. Vonder Haar, J. Noble, M. T. O'Brien, and J. H. Howard
NUMERICAL MODELING STUDIES OF THE CERRO PRIETO RESERVOIR 41 M. |. Lippmann and K. P. Goyal
SIMULATION OF RE1NJECTTON AT CERRO PRIETO USING AN IDEALIZED TWO RESERVOIR GEOLOGICAL MODEL 52 C. F. Tsang, D. C. Mangold, and M. J. Lippmann
RESISTIVITY STUDIES AT CERRO PRIETO 57 M. J. Wilt and N. E. Goldstein
MAGNETOTELLURIC STUDIES AT CERRO PRIETO 61 T. D. Gamble, W. M. Coubau, R. Miracky, J. Clarke, and N. E. Goldstein
PRECISION GRAVITY STUDIES AT THE CERRO PRIETO GEOTHERMAL FIELD 66 R. B. Grannell, D. W. Tarman, R. C. Clover, R. M. Leggewie, P. S. Aronstam, R. C. Kroll, and J. Eppink
GEOTHERMAL RESERVOIR ENGINEERING MANAGEMENT PROGRAM: DEVELOPMENTS IN FISCAL 1979 66 J. H. Howard and W. ). Schwarz
EVALUATION OF CITS' WELL 1, KLAMATH FALLS, OREGON 69 S. M. Benson, C. B. Gor->r>son. and R. C. ScSroeder
EVALUATION OF THE SUSANVILLE, CALIFORNIA, GEOTHERMAL RESOURCE, 1979 76 S. M. Benson, C. B. Goranson, J. P. Haney, and R. C. Schroeder
RECENT MODIFICATIONS OF THE NUMERICAL CODE CCC 87 G. S. Bodvarsson, M. J. Lippmann, and T. N. Narasimhan
DEVELOPMENT OF THE TWO-PHASE RESERVOIR SIMULATION PROGRAM, SHAFT79 91 K. Pruess, R. C. Schroeder, and P. A. Witherspoon
PROPERTIES OF H2O-CO2 MIXTURES FOR GEOTHERMAL RESERVOIR AND WELLBORE SIMULATORS 95 E. R. Iglesias and R. C. Schroeder
PRELIMINARY STUDIES OF THE RESERVOIR CAPACITY AND LONGEVITY OF THE BACA GEOTHERMAL FIELD, NEW MEXICO 98 G. S. Bodvarsson, S. P. Vonder Haar, M ). Wilt, and C. F. Tsang
MODELING TRANSIENT TWO-PHASE FLOW IN A WELLBORE 103 C. W. Miller
CORRECTION OF DOWNHOLE PRESSURE TRANSIENTS MEASURED WITH A FLUID-FILLED CAPILLARY TUBE 105 C. W. Miller and J. M. Zerzan

WELLBORE STORAGE EFFECTS IN GEOTHERMAL WELLS W7 C. W. Miller
HYDRAULICS OF A WELL INTERCEPTING A SINGLE HORIZONTAL FRACTURE G. S. Bodvarsson, T. N. Narasimhan, and C. F. Tsang 1*9
PRELIMINARY STUDY OF SUBSIDENCE AT WAIRAKEI, NEW ZEALAND, USING A NUMERICAL MODEL 112 T. N. Narasimhan and K. P. Goyal
USE OF PRESSURE TRANSIENT ANALYSIS IN MODELING THE HYDRAULIC FRACTURING PROCESS I IS W. A. Palen and T. N. Narasimhan
Geothermai Environmental Research 118
GEOTHERMAL SUBSIDENCE RESEARCH PROGRAM 11« J. E. Noble
INDUCED SEISMICITY STUDIES AT THE CERRO PRIETO, MEXICO, AND EAST MESA, CALIFORNIA, GEOTHERMAL FIELDS 123 E. L. Majer and T. V. McEvilly
REMOVAL OF SILICA FROM CERRO PRIETO BRINES 125 O. Weres and L. Tsao
THEORETICAL STUDIES OF CERRO PRIETO BRINES CHEMICAL EQUILIBRIA 127 E. R. Iglesias and O. Weres
GEOSCIENCES
Basic Sciences Studies 132
BUOYANCY FLOW AND THERMAL STRATIFICATION IN AQUIFER HOT-WATER STORAGE 132 G. Hellstrom, C. F. Tsang, and J. Claesson
DAILY SENSIBLE HEAT STORAGE IN AQUIFERS FOR SOLAR ENERGY SYSTEMS C. F. Tsang, P. Fong, C. W. Miller, and M. J. Lippmann 133
ONE-DIMENSIONAL CHEMICAL TRANSPORT IN AN ADVECTION-DOMINATED SYSTEM 136 T. N. Narasimhan
RESPONSE OF AQUIFERS TO EARTH TIDES 137 T. N. Narasimhan and B. Y. Kanehiro

PROBABILISTIC SIMULATION OF TRANSIENT SUBSURFACE FLOW USING A NUMERICAL SCHEME 141 T. N. Narasimhan and T. Buscheck
A NOTE ON VOLUME AVERAGING 143 T. N. Narasimhan
GROUNDWATER MODELING IN SUBSURFACE NUCLEAR WASTE DISPOSAL—AN OVERVIEW 144 T. N. Narasimhan
ROLE OF PORE PRESSURE ON DEFORMATION IN GEOLOGIC PROCESSES 145 T. N. Narasimhan
AN ANALYTIC STUDY OF GEOTHERMAL RESERVOIR PRESSURE RESPONSE TO COLD-WATER INJECTION 14» Y. W. Tsang and C. F. Tsang
THERMAL EFFECTS IN WELL TEST ANALYSIS 15t D. C. Mangold, C. F. Tsang, M. J. Lippmann, and P. A. Witherspoon
THERMODYNAMICS OF HIGH-TEMPERATURE BRINES 154 K. S. Pitzer, D. J. Bradley, P. Z. Rogers, and ). C. Peiper
BEHAVIOR OF ROCK-FLUID SYSTEMS AT ELEVATED PRESSURES AND TEMPERATURES 156 W. H. Somerton
SOLUBILITY OF LOW ALBITE IN NaCI SOLUTIONS AT 250°C 159 J. M. Neil and J. A. Apps
THERMODYNAMIC PROPERTIES OF SILICATE MATERIALS 165 I. S. E. Carmichael, M. S. Ghiorso, L. Moret, S. A. Nelson, M. Rivers, and J. Stebbins
CHEMICAL TRANSPORT IN NATURAL SYSTEMS 166 C. L. Carnahan
THERMAL CONDUCTIVITY OF AQUEOUS NaCI SOLUTIONS FROM 20°C TO 330°C 167 H. Ozbek and E. L. Phillips
AQUEOUS SOLUTIONS DATA BASE TO HIGH TEMPERATURES AND PRESSURES, SODIUM CHLORIDE SOLUTIONS 170 S. L. Phillips, R. J. Otto, N. Ozbek, and M. Tavana
Applied Research Studies 174
ENHANCED RECOVERY WITH MOBILITY AND REACTIVE TENSION AGENTS 174 C. J. Radke and W. H. Somerton
HIGH-PRECISION MASS SPECTROMETRY 177 M. C. Michel and W. R. Keyes

wii
STATE-OF-THE-ART TRACER TECHNIQUES 171 S. M. Klainer and J. A. Apps
CRYSTALLOGRAPHIC PROPERTIES USING THE NQR TECHNIQUE 119 S. M. Klainer and J. A. Apps
TRACE ANALYSIS OF GROUNDWATERS 1M 3. M. Klainer and ). A. Apps
SURVEY OF AQUIFER THERMAL ENERGY STORAGE PROJECTS I K C. F. Tsang, D. L. Hopkins, and G. Hellstrom
MULTIPLE-WELL VARIABLF-RATE WELL TEST ANALYSIS OF THE AUBURN UNIVERSITY AQUIFER THERMAL ENERGY STORAGE FIELD DATA 1M C. A. Doughty, D. G. McEdwa.ds, and C. F. Tsang
NUMERICAL SIMULATION OF AUBURN UNIVERSITY FIELD EXPERIMENTS « • C. F. Tsang, T. Buscheck, and C. A. Doughty
NUCLEAR WASTE ISOLATION
Swedish-American Cooperative Program 196
THERMOMECHANICAL EXPERIMENTS AT STRIPA 196 M. Hood, T. Chan, and P. Nelson
FRACTURE HYDROLOGY STUDIES AT STRIPA 201 J. E. Gale, C. R. Wilson, and P. A. Witherspoon
MACROPERMEABILITY STUDIES AT STR!PA 205 C. R. Wilson, J. C. S. Long, R. M. Galbraitli, A. O. PuBois, M. J. McPherson, and P. A. Witherspoon
A PROGRAM OF GEOLOGIC STUDIES AT STRiPA 2C7 H. A. Wollenberg, L. Anderssor and S. Flexser
Research and Development Investigations 209
REVIEW OF THE STATE-OF-THE-ART OF NUMERICAL MODELING OF Tt i tRMO-HYDROLOGIC FLOW IN FRACTURED ROCK MASSES 209 J. S. Y. Wang, R. A. Sterbentz, and C. F. Tsang
MIGRATION OF RADIONUCLIDES IN GEOLOGIC MEDIA 2TT T. H. Pigford
ULTRA-LARGE ROCK CORE EXPERIMENTS 212 D. }. Watkins, R. Thorpe, W. E. Ralph, R. Hsu, and S. Flexser
234U/J38U DISEQUILIBRIUM STUDIES ? S M. C. Michel and W. R. Keyes
vl i i
SEARCH FOR UNDERGROUND OPENINGS FOR IN-SITU TEST FACILITIES IN CRYSTALLINE ROCK 217 H. A. Wollenberg, B. Strisower, D. J. Corrigan, A. N. Graf, and M. T O'Brien
THERMOCHEMICAL MODELING OF MASS TRANSPORT PROCESSES IN THE NEAR-CANISTER REGION OF A BASALTIC NUCLEAR WASTE REPOSITORY 2 M L. V. Benson and P. C. Lichtner
THEORETICAL AND EXPERIMENTAL EVALUATION OF WASTE TRANSPORT IN SELECTED ROCKS 221 R. j . Siiva, L. V. Benson, A, W. Yee, and G. A. Parks
MARINE SCIENCES
Ocean Thermal Energy Conversion 226 ENVIRONMENTAL AND RESOURCE ASSESSMENT PROGRAM FOR OCEAN THERMAL ENERGY CONVERSION 226 P. Wilde
COMPILATION OF MARINE GEOLOGIC AND OCEANOGRAPHIC DATA OFF THE WEST COAST OF THE UNITED STATES 230 P. Wilde
APPENDIXES APPENDIX A: PUBLICATIONS 233 APPENDIX B: EARTH SCIENCES DIVISION STAFF 238
INTRODUCnON
The prop-Mi of the Earth Science Divieioa couotitntft a k o M and varied spectrum of research on topics importsat to the nation*a cneigy future. Trngi mmntirallj our funds-anneal and applied research activities include assessment, recovery* and «ee of underground resources; developing the knowledge and ttchniewen to eafely isolate nuclear vaate in geologic repositories; mitigating the environmental impact of energy exploitation developments; ami studying geologic storage of thermal energy. The individual projects ipao the potsibilitits frosi haaic scientific investigations of underlying geologic phenomena to mission-directed resolution of —dtrgrcuas' engineering problems. Linking all of these earth sciences stadias ia a comnom focea oa the earth"a deep crustal regis* and the development of increased knowledge ahont the regis*'a dynamic behavior. By ito complex multifaceted nature, the cruatal environment cannot ha fully scrutinized by the experimental researcher ir. a laboratory aor by the geologist on a field survey. A complete scientific understanding of the dynamic physical and chemical behavior of geologic systems renuiree a* earth ecieaces t«am approach with the support of sophisticated lahoratory and field facilities. The Earth Sciences Division is such a scientific team composed of about 20 University faculty membera, 140 professional researchers, and 35 graduate students, their reaearch nctivities can be eicher generic in nature, focusing on specific geology, geochemietry, geophysics, hydrology, rock mechanics, reservoir engineering and aiming engineering questions, or of a broader scope requiring all the talents and energiea of a multi-disciplinary professional team. Host enjoy the opportunity to do both by dividing their time between scientific problems topical to their discipline mad comprehensive projects of brosder national importance. All researchers make full use of LKL's excellent analytical facilities, reaearch laboratories, computational capabilities, and field experiment equipment.
The articles herein are indicative of our researchers* level of sophistication. treadth of interests, and variety of applications.
1

GEOTHERMAL ENERGY OCVHOrMBOT
The Sarth sciences Dlvisioa progtsa ia Caathet-• i l Energy Development tegea £a 1973 U r w > m i to the national goal of developing alternate ensrgy sources for e l ec t r i c and *oa-electr£c asa l icat iaaa . The program i n i t i a l l y consisted aff 4M esalcrat ioa assessment of s i t e s in northern Nevada for a are-poicd demonstration, p i n t ; develops**** of a Maaty-fluid conversion process for tfa^s-teaaeratvre, l e a -sa l in i ty brines; and varioas reocheaicsl atadiea rc lattd to brine chemistry* seal fag, mad correefea. An additional aupport project, the Karloaal Geattor-aal Inforaation Resource (CtH>) vao began to compi le a dsts bank on topic* related to gaothemal energy
Xany of these general prograae coat fame in modified or expanded form and others t u n began in recent yeara. Koat nave bean faeded by tha U.S. Department of Energy, Division of Ceotbemal Energy; the U.S. Bureau of Reclamation has eoa-traetcd with LflL for s i t e speci f ic s tudies . Within th i s section -*f the Annuel Report we preeeat oar current geothermal research a c t i v i t i e s subdivided into four principal areas: (1) Ceotbemal Exploration Technology. (2) Geotheraal tfacrgy Converaioa Technology. (3) l e a e w o i r Engineering, and (4) Geotheraal Environmental Research.
Exploration Technology projects deal with generic research to improve cur a b i l i t y to locate and define c geothermal reservoir using s u r f ^ e , mainly geophysical* techniques. His tor ica l ly , oar eaphasis has been on e lectr icr' . , electromagnetic, and seismic techniques because of to* expertise available to us at the University of California. Berkeley, and because of the recognised need to evaluate and develop these techniques to the point where they can be better used by industry. T>sts and demonstrations of research results are dut* ^y LBL at various geotberaal s i t ea as p/.rt of s i t e -specif ic resource assessments ( i >;., Nt. Bood and Klamath Fa l l s , Oregon, and northern Hevffia aitaa) or as s i t e - spec i f i c reservoir def ini t ion stodi*« ( e . g . , Cerro Prieto) . Tetbnolo<ry transfer to industry in th i s and other program, areas i s an ever-present concern; one that i s accomplished through workshops, conferences, and consultations tfith geotheraal developers and f ie ld demonstrations.
Geothermal Energy Conversion Technology project i develop basic data and analytical t ea l s in heat exchange and theraodynatiies needed for t^e development of moderate-temperature geotKermal resources. LBL has been studying the thermo'iynaaic properties
of iubstsas/isspsaraiis srfstaraa ia l*ara haw ta optimis* binary &mklM eyel« heat caavarslaa to electric psstr far vsrieea tease res tamfirmtmrat. •e ara a l t * aaaagisc «*• * ta<t* i fafcriefltfea amd ten iae * f a 30e hW pi lot plant malee. a dlreet-ceatact teat enthaaasr. Ta£a caergy tsanrsretea procass may mama pataatial iarertaacc fa lha ece-mmmlce of atcaad • gaaarstisa meacWrmal peacr pleats.
Eeeervalr BsffBeerlaf scad.ro caa ha sabdt-vidsd {a t * two maim araasi fwdameatel ra starch ami reservoir cam* s lad .as. Sader i s * f i r s t , tSL meaites a Ceetheraal Eeferwelr laftlaaariat Kaeaaamav^ rrs»na (CtWP) far the V.S. ••parlmast of Ka* -0 ftivfaica af CcetWrMl Batr&, far wMc& t i t mnmaraa aad fmpleante a rceearcm prep-ram iavolrlat sacloaa scad sale, £ndeetrw> aaJ (tear research groep*. Tied i a l * the overall plea ara the saparaxa ia-be eat raaaarch effacta caaalstlsg of <a; t W aisvalaaaaat aad taatlas af mew aad I apron d aaMaaraa! wall cast aaaitpaMt. f la ld taclmi»aaas, aad JatarsrataiI»* swlaadai Ck) tha d<-*afoaant of n a a n a i r almlat iac cadaa capable of Jtaliag with tan ahast cndlt laaa £a t\* raaar-voir wail-boraa aad arimtarcti af IJO-COJ aaaas; aad (c) aodeltng the b/draallc fiHasHtioa of rasar-voirs. la the ar/a of rasa;^ro8r caaa etadias, ISL directs fo. DOC * D.S./McsJcaai coaaaraclva otady of tha Carr* Praeto, Baja CaliiformJa. aaot&eraal f i a ld . The alaaaata of thla sitae > ar* aaaloar-hydrology, aaochaaiatry# aaoanvs ta„ aad raaarvoir tastiag aad aodallag. tte ham at w pnosidad adwica on raiajactioa. U L also assists tWC £a avaUaatisg rasarvoir data for tha f a l l s * €a\- t n , ffrsr t?asico, tha site of a SO-HM daaoastrat£>ia >lantt.
CeotharasIL EavirommaataTl trsaarch coas i s t s of subaidaacc, iadacad se i sa i c j cy , ssd hrGaa chaatistry. LIL aanages for 00C a Crothenmki Ss^sGdcsca Casaarch Prograsi (CSIMP) for which wa jrrpa.'* *toQ iavlaawat research ef forts ia to the causes, predict&oa, aoai* toring, and n i t iga t ioa of sa&sideaca. Sesesrcb contracts are given to srademiic, imdestry, and other laboratory groups. In addntiosi, IK. also aaintains sa t a - t m i e rescareb campocent wfaicb has been chief ly coacerned with scad hma scsccceded in developing s nuinrical code that provides oew insight iuto tibe possible pbysiesl aecbaaisxs of tbe coaplex sabsideace at Uairafeea, it>w Zeslsod.
Icdaced seisaticicy wenik, wfcicb t i e s i s c l o s e t / •rich subsidence asd the geeeral copse of reservoir dynamics caeder production coadit ioes . involves monitoring s t ESSE; Mesa sad Cerro Priam.
3
Geothcrmal Exploration Technology
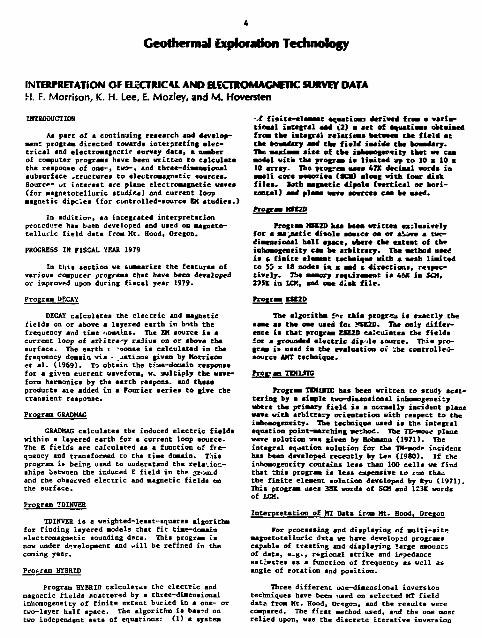
INTERPRETATION OF ELcCTRICAL AND aECTftOMAGNETtC SUtVEY DATA H. F. Morrison, K. H. Lee, E. Mozley, and M. Hoversten
INTRODUCTION
Ai part of • continuing research and develop-men* program directed towards interpreting electrical and electromagnetic survey data, a number of computer programs have been written to calculate the response of one-, two-, and three-dimensional subsurface structures to alectromsgnetic sources. Sourc**" ot interest are plane electroaagnetie waves (for siagnetotelluric studies) and current loop •agnetic dipcles (for coatroiled-source EM studies.)
In addition. an integrated interpretation procedure has baen developed and used on magneto-telluric field data from Ht. Hood. Oregon.
PROGRESS IN FISCAL YEAR 1979
In this section ve summarize the features of various computer progress that have been developed or inproved upon during fiscal year 1979.
Program DECAY
DECAY calculates the electric and magnetic fields on or above a layered earth in both the frequency and time domains. The EH source is a current loop of arhitre.-y raJius on or above the surface. The earth t -oonse is calculated in the frequency domain via • jations given by Morrison et al. (1969). to obtain the tuse-dooain response for a givtn current waveform, w«. aultiply the waveform harmonics by the earth re spoils, and these products ate added in a Fourier aeries to give the transient response.
Program GftADMAG
GRADKAG calculates the induced electric fields within a layered earth for a current loop source. The E fields are calculated as a function of frequency and transformed to the time domain. This program it- being used to understand the relationships between the induced E field in the ground and the observed electric and magnetic fields on the surface.
Program TDIHVER
TDINVER is a weighted-least-squares algorithm for finding layered models that fit time-domain electromagnetic sounding data. This program is now under development and will be refined in the coming year.
Program HYBRID
Program HYBRID calculates the electric and magnetic fields scattered by a three-dimensional inhomogeneity of finite extent buried in a one— or two-layer hslf space. The algorithm is ba«?d on two independent sets of equations: (1) a system
of finite-clamant aquation) derived frem a variational iatagral aa*J i2) a set of eauatioas obtained from tat iategrai relative* between the field at the aoaaaaxy and the field imaide the boandery. The nsximna six* of the ieaemcigireity that we cam model with the program ia limited up to 10 z 10 s 10 array- The program macs 47K decimal words ia smalt core esmorice (SGI) along with fowx disk. filaa. Soth magma tic aUaola (vertical or bori-xontal) aad plaaa wave sources caa he aacd.
Program KfE20
Program MSC2D has heea writ tea exclusively for a aav*ctic djnola aoarce oa or at^ve a tve-dimensional half apace, where the exteat of the inhomogeneity cam be arbitrary. The method used is a, finite clamant technique with a mesh limited co 55 x 18 nodes in a aad a directions, respectively. The memory reetdrement ia 46K in SOf, 235K ic LOl, and one disk file.
Proaraa ESE2D
The algorithm f**r thie progress is exactly the aame aa the one used fot *<SE2D. The only difference is that program ESC20 calculates the fields for a grounded electric dip fie source. Tbia program is uaed ia the evaluation ox ;be controlletj-source AHT technique.
frog? an TEMUTG
Program TEMXnTG has been written to study scattering by a simple two-dimensional inhomogeneity where the primary field ia a normally incident plane wave with arbitrary orientation with respect to the inhc<nogcneity. The technique uaed is the integral equation point-matching method. The T£-*oo«* pl*ne wave solution waa given by Hohmann (1971). The integral equation aolution for the TH-mode incident has been developed recently by Lee (1980). If the inhomogeneity contains leas than 100 cells we find that this program £a less expensive to run than the finite element solution developed by Ryu (1971). This program uses 38K words of SCH and 123K words of LCM.
Interpretation of MI Data irom Ht. Hood, Oregon
For processing and displaying of anlti-site magneto telluric <J»ta we have developsd programs capable of treating and displaying large amounts of data, e.g.. regional strike and impedance estiwstes as a function of frequency as well as angle of rotation and position.
Three different oae-dimensiooal inversion techniques have been ttsed on selected HT field date from Ht. Hood. Oregon, and the results were compared. The first •ethod used, and the one most relied upon, was the discrete iterative inversion

5
method developed by Jupp and Voeoff (1977). Second, the iterative-continuous method by Oldeabcrg (1979) was used in a limited omnaer. Thin; technique iteratively construct* a model minimizing the residual error and evaluates the model via Backus-Gilbert techniques. The third approach was a ,-cntiauous inversion based on non-uaifora transmission liae solutions via rational approximations developed by lecher and Sharp* (1969). Stability problem* were encountered which limited the use of this approach.
For tbe second stage of interpretation we concentrated on local areas where a two-diaeaaioaal conductivity structure dominate* the frequency response of the earth. Two approaches were used. First, we used forward modeling using programs by Lee (1978) and Lee and Pridmore (1979) to first approxiaste the observed responses. Then, where possible, an automatic inversion scheme by Jupp and Vozoff (1977) was used. This aethod is similar to their one-dimensional inversion, with the forward problem being calculated by che network methods developed by Midden (1972).
A study of effect of topography on MT data was begun. The initial studies were done using en integral equatiun method developed by Oppliger (1980). This provided the dc current distribution* in the region for plane wave sourceo.
FLANS FOR WORK IN FISCAL YEAR 19S0
One of the top priorities will be to document the computer progress developed in 1979, and to provide user's -'uRtrucr.ions.
Independent of the forward-modeling technique development, we will also give a high priority to the generalized direct inverse problem associated with \A waves. Initial studies have uncovered a new technique which may allow us to reconstruct the r**ape and location of a scatterer directly from the reflected tangential electric and magnetic fields measured on an arbitrary surface. This approach to EM interpretation will be evaluated for simple scattering bodies, such as circular cylinder.
INTRODUCTION
Recent advances in semiconductor technology have rearhed the point that battery-operated microcomputers can now analyze magnetoteliuric data in the field. In 1979 we completed the construction of a system based on a Digital Equipment Corporation LSI-11 microcomputer for in—field magneto-telluric analysis and used it for tht .-xecution of several eurveys.
PEOGRESS IN 1979
uroncts CITED
Becker, C. *., sad Surma, C. »., 19*9. A synthesis approach to aagactotallmric exploratioa. Radio Science, v. 4, mo. 11, a. 2019.
Bohmsan, C. W., 1971. Electraaagaetic scattering by two-dimensional inaamsaaasitiea in the earth. (Ph.D. dissertation) Berkeley, University of Callforala•
Jupp, D. L. B. v amd voanff, K., 1975. Stable iterative swtthoda for the inveraioa of geophysical data. Geophysical Journal I. aetr. Soe., v. 42, p. 957. i 1977. Two-aiaemsioaal aagaetotelluric inversion. Ceophys. Jovraal S. aatr. Soe., v. 50, p. 333.
Lee, K. H., 197B. Program TDt-two dimcmsiooal plane wave scattering colntioa by the finite element method for a Lwe-dimenaional conductivity distrihatiom. Berkeley, university of Califoraia.
t 19*0. A solution for TH-aode plane waves incident on • two-dimensional iabcerogeneity. To be submitted to Geophysics.
Haddeo, J. B.» 1972. Transmission system* and network analogies to geophysical forward and inverse problems. Cambridge, Maaa. t
Kassachuaetts Inatitute of Technology Technical Beport M00-14-67-A 0204-0045.
Morrison, B. P., Phillips, B. J., and O'Brien, D. P., 1969. Quantitative interpretation of transient electrossgnetic fields over a layered half apace. Geophysical Frospecticg, v. 17, no. 1, p. 02.
Oldenburg, D. V., 1979. One-diaensionsl inversion of natural source -uigncrtotellurie observations. Geophysics, v. 4*i, n?. 7, p. 1218.
Oppliger, G. L., 1980. Frogrsm KT0P0: Electric potential solution in the vicinity of a thrse-diaensional topographic feature (Ph.D. dissertation). Berkeley, University of California.
Ryu, J., 1971. Lou frequency electromagnetic scattering (JI'h.D. dissertation), Berkeley, University of California.
essentially identical to that formerly done on the CDC-7600 computer at LBL. Tbe system operates on approximately 200 W provided by 12-V golf-cart batteries. The limited capacity of the battery power supply, however, restricts the peripheral equipment that can be used in the field and this limits the quality and modes of results presentation. Therefore, our present analyse* are limited to those selected by the operator to evaluate the tmality and sufficiency of the data. Final data selection and graphic display are performed in the laboratory.
FIELD PROCESSING OF MAGNETOTEUURIC DATA J. Clarke, T. D. Gamble, W. M. Goubau, R. Koch, and R. Miracky
The LSI-11 has proven to be a very fieHworthy Figure 1 is a block diagram of the complete instrument, performing in real time a data analysis magneto telluric data collection system. Our mag-

^
SB T T
Figure 1. l lock dlagraa of the aagaatotel luric data co l lec t ion systea. OLBL 7910-130*4)
netote l lur ic aeasureaents ar« always aadc with the reaote reference technique {Gambit, 1978; Caable et • ! . , 1979a,b). The tquipaent at the reattte s i t e , shown at the l e f t of the figure, cons is ts of a dc SQUID magnetometer, preamplifier, aad FM fnalog telemetry equipment. Horizontal componenta of the magnetic f i e l d chaagt* *t the raaote a i t e are telemetered to the base s tat ion . At the base station the horizontal components of the e l ec t r i c f ie ld and three components of the •agnatic f i e ld are preanplified, the reaiote signals are received, and then two simultaneous operations, described belov, are performed on a l l seven channela.
All seven channels are d ig i t ized at a stapling rate of 1 Ht by the data logger so that the long-period d ig i ta l data can be stored for later analy
s i s , liaatltaaeotisly, the aigaale are baadsaia f i l tered, d ig i t i zed a t a se lectable rate by the LSX-11 aicrocoapmter, amd analysed £a real t iaa to determine the average autopover and crosspowers between a l l chsaw i l a . these average power* are written on cagactic tea* to he the piraaisat record of the high fraqaascy Mltwraatats . A second tape deck i s meed to load the prograaa into the computer.
l b * operation of the programs ia outlined ;n Figure 2 . The analysis i s s p l i t into two ta in ;ro-grssu. GCDT sad RESULTS, to atari a i r e the capacity of the hardware. OCUT ia written ent ire ly in MiCItO aasaably laagaage M maximize the speed of the r c a l - t i a c calculations and to a i c ' -die the s i ce of the program. OCDT controls the d ig i t i za t ion of the data, perforate the Fourier analysis and coapu-
FXguxe Z. In- f ie ld processing of mapie to t e l l u r i c data. OK- 7910-13065)

7
tation of average powers* and writes the* on the data tape. RESULTS it written in FOftTUN for aaae of modification and to proride more sophisticated input-output formats. It reads the average powers of selected blocks of data frost the data tape amd prints out the results desired by the operator on a thermal printer.
The analysis proceedc as follows. The digitizer sastples the channels under the coatrol of a programmable clock. This digitization rate is limited to about 6 kHz by the software and could be easily increased to the hardware limit of about 40 kHz. When a 1024-pomt data segment ha* been completed, the digitisation continues ro fil" a second input buffer while the Fourier analysis is performed on the first data segment. The average powers are computed within frequency windows equally spaced on a logarithmic scale and are added to the averse powers from previous data segments. This analysis requires 16 seconds for several channels of data. If the analysis is not completed by the time the second input buffer fills, tnen the sampling is simply discontinued until the analysis is complete and the first buffer is free again. When the operator feels that sufficient data have been collected he halts the collection and directs the LSI-II to write the average powers on the data tape. The RESULTS program then reads and averages selected blocks of average powers from the data tape, corrects these for electrode lengths, dipole orientations, filter response functions, and magnetometer sensitivities. The results are printed, as specified by the operator. These may include the signal-to-noise ratios of any measurement, the rotated apparent resistivities with their phases,
SYSTEM DESCRIPTION
As first conceived, the Automated Seisaic Processor (ASP) is a low-power (1 W/per channel), fast 16-bit, in-field seismic data processing computer (McEviily et al., 1979). The ASP is designed around the RCA 1802 COSHAC CMOS microprocessor. Its principle use is for microearthquake detection and analysis. In 1979 a 16-channel ASF was built. It has essentially met all specified requirements. ASP is a parallel processing device with 15 microcomputers (WORKERS) responsible for feeding pre-processed data to a central microcomputer (the BOSS} for final processing (Figure 1). Each WORKER as •jell as the BOSS is capable of addressing 32 K of memory, either PROM or RAM. Presently the WORKERS each contain 4 K of RATI and 12 K 'jf FROM. The BOSS contains 8 K of RAM and 24 K of .TtOH memory. The WORKER and BOSS programs are configured as .shown in Figure 2. The routines SYSTEM, MISC, and SINTP are service programs that t>*,ndle the intialization of the CPU, the basic interrupts and the calls &n£ returns between the BOSS and WORKER computers. These routines also handle the BOSS messages, printing of output, input processing and the manipulation of data. 'Worker' in the WORKER, and 'boss' in the BOSS are the main computer programs from t'hich all calls to the different subroutines are made.
rotatiom aaglea, akammcaaaa and tipster amga&tmwts, aad phases, all with their acehahl* errors, la-mmples of data collected aad analysed with this system are iacloaed ia another article ia this volume, ^Magactocellaric SCvatfca at Cerro Prieto."
p u n roc FISCAL TEAK 19M
The Lfl-ll microcomputer has proven to be a fieleworthy iastrosear powerful eaaugh for all the calcalatioas lavelved ia real-tivo cagaeto-ttlluric data asalyaia. Nora iamorcaatly, aa a research tool, the system can he rearogrammwd to perform almost may analysis of electromagnetic meaaurmmeats iavolviag wp to It chamnels of data. Thus it ia aa iategral tool for further studies iavolviag simvltameoms measurements at several sites. Such stmdies may iacludc invcatigatiag the cobcreuce length of the iacideat eleczreaugactie fluctuations, determining the noise spectra, and performing relative calibrations of various types of magnetometers in the field.
REFERENCES CITED
Gamble, T. D., 1978. laaote reference magneto-tellurica with SQ01D (Ph.D. dissertation). Berkeley, University of California, and Lawrence Berkeley Laboratory, LBL-8062.
Gamble, T. D., Couban, V. M-, and Clarke, J. 1979a. Hagnetotellurics with a --emote magnetic reference. Geophysics, v. 4ft, no. ], p. 49-68. , 1979b. Error analysis for remote reference magnetotellurics. Geophysics, v. 44, no. 1, p. 959-968.
ICALC in the WORKEB handles the ADC interrupt routines that sample the d*ra, remove the dc component, form the long-term-average (LTA), the short-term-average (STA), check for trigger, and time the arrival of the P-phase, if there is a trigger, all in real time between samples. At present, the maximum sample rate is 100 samples/sec with the crD clock rate at 2 MHz. By increasing the c'ccK. rate to 3 MHz ard cleaning up the program it is anticipated that a sample rate of 200 samples/sec can be achieved. Except for the FFT routines, all arithmetic in the UOKXER is done in fixed point format. Also, every effort is made to use multiplication and division by trios. FIX is the RCA fixed point arithuetic package. Figure 3 is an example of the worker operations. If x(tj) is the original time series (the mean is first removed by subtracting a 4096 point long-term average), then a new time series x'(t;) is formed asr
£ |«<ti)| ,.ltl, ._E»SJ
i.e., rectifying che time series and smoothing with an n-point boxcar. For microearthquake data
AUTOMATED SEISMIC PROCESSOR T. V. McEviily, E. L. Majer, J. Bartschi, J. Heinsen, and R. O'Connell

s
•n0tmttMfMi
RSKKim -mtis»m I * ^
u I i«—•> ;
p
RCI KMHS ifc-WuSf MUDS cry i/ft W i f l i i l i AttKSi UICH •nnniE* I I UN * • f r m 1/1 OIUDI m HU01CI tEimtiL giii •HlLE
in t t i tuTi i
1 Mamma - > • tAaatLMtt i I m n m i I U I S H S M ^ I c r ,
1 IMKKUtca 2 tmm 5
* •» i u 5 1 i t t « *
i M a n H i t f "! 4 i/iarnnn 1 1 Mumt t I IAKMK ; i i c r i i I M M U*» : | • • I f t M ™ '
I 4 i Ha
1 a • •*• > uaiMci BU mi mtumiT sain mats
1 niM—in r\ 1 MBt t lMt 5
t m miniu •) t n m t i 1 u t H m i J 1 c t i 2 1 UMCntMH : I 4« M M > 1 «i t u 5 I 41 Ml }
I t l
Stismie «efa tractate' sysleai FreMypa s f t tm kttcidief ran
12 chamels)
d 3 NSCEKU1H
<
unti ilr 1 Htt.
/ /
•Ml
WOOlf * < .. A A A / / - ^ WOOlf * < m m tn / / - ^ WOOlf *
t HU "SI1"
till "St" **«
GMaK^tf
HU
•TB-nwu i A A 7s -0 nwu i una m f < -0 nwu i
t 1 t 1 ka
U l«3„ HI* Ht l
caaaoiv
MODULE T _ A _ A
Htl
A MODULE T f imt i in f < 1 MODULE T
Seismic data processor system Prototype system Mock diagram
(128 channels)
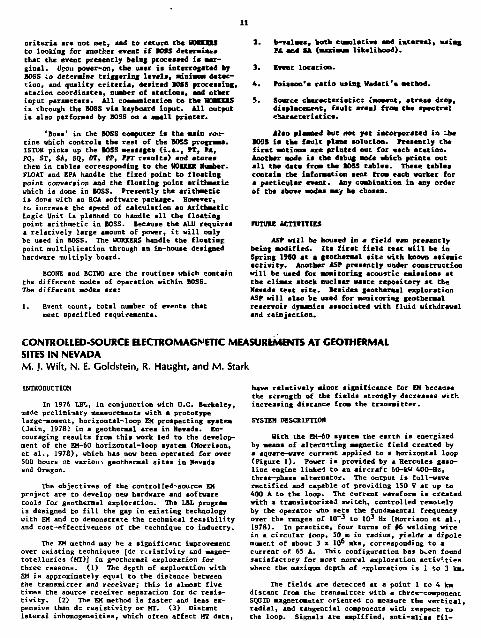
figure 1. Top: Block d i a g r u , two-channel prototype eeiearic data aquisition/processing system, showing card structures £or DOSS (auister) and HOBXER (channel) atodules. Bottoa: Generalizec block diagram of 128-channel st*«.tiie £ield syetem, i l lus tra t ing 16-channel modular architeccure.
(ML 7812-14137; XBL 7812-14138)

WORKER BOSS
IOOO
3000 -
4000 L
SYSTEM
MISC
SINTP
WORKER
ICALC
FIX
WCALC
FFT.FIT
SYSTEM
MISC
SINTP
BOSS
;STOR
FLOAT
FPA
BCONE, BCTWO
Figure 2. System program maps for WORKER &ad BOSS shoving prograa location and lengths. Numbers are In hexadecimal. (XBL 807-7257}
10
,A~~ i i i J H^
1 \ 1 \ i • '. i, : .
QMI>4 1 10 I0O
FaCOUENCV t H U
I 10 KM OJ > IO 100
mCOUCNCT IM2) FMOUCMCT (HZ1
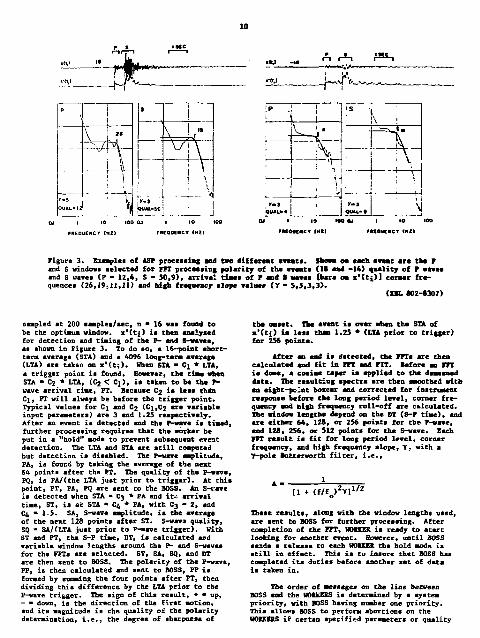
Figure 3. Example• of ASP proceaeing and two diffaraat treats. Shown oa each event arc the P and S vindovi aeltctad for FFT processing polarity of the cventa (It and -14) aeality of P wave* and S wave* (P - 12,4, S • 50,9), arrival time* of P aod t wavea (bara oa x'(tj.)] coraar frequence* {26,19*11,11) and high frequency alope value* (Y • 5,5,3,3).
( m . 802-8307)
oaapled at 200 samples/sec, n • 16 vaa found to be the optimum vindov. x'(tj) i* than analyzed for detection and timing of the P- and S-vaves, ai shown in Figure 3. To do so, a 16-point abort-tern average (STA) and a 4096 long-term average (LTA) are taken on x'(t;>. When STA • Ci * LTA, a trigger point ia found. However, the time vhen STA - C2 * LTA, (C 2 < C^), ia taken to be the P-wave arrival tiae, FT. Because C2 is let* then Ci, PT will alvaya be before the trigger point. Typical value* for C\ and Cj (Cj,C2 are variable input parameters) are 3 and 1.25 reapectively. After an event i> detected and the F-vave ia timed, further processing requires that the worker be put in a "hold" mode to prevent subsequent event detection. The LTA and STA are still computed but detection is disabled. The P-vave amplitude, FA, ia found by taking the average of the next 64 points after the PT. The quality of the F-vave, PQ, is PA/(the LTA just prior to trigger). At this point, FT, PA, PQ are sent to the BOSS. An S-nrave is detected when STA • 03 * PA and it*? arrival time, ST, ia at STA * C4 * PA, with C3 - 2, and C4 * 1 5 . SA, S-vave amplitude, ia the average of the next 128 points after ST. S-vave quality, SQ " SA/fLTA juat prior to P-»ave trigger). With ST and PT, the S-F time, DT, ia calculated end variable window lengths around the P- and S-vaves for the FFTs are selected. ST, 5A, SQ, and DT are then sent to BOSS. The polarity of the P-vave, PP, is then calculated and sent to BOSS, FP is formed by sucaaing the four points after FT, then dividing this difference by the LTA prior Co the P-wave trigger. The sign of this result, + • up, - - down, is the direction of the first motion, and its magnitude is the quality oi the polarity determination, i.e., the degree of sharpness of
the onset. The event ie over whan the STA of x'(ti> ie leaa than 1.25 * (LTA prior to trigger) for 256 points.
After an end is detected, the FFTc are then calculated and fit in FFT and FIT. Before en FFT is dome, * cosine taper is applied to the demeaned data. The resulting spectra are then smoothed with an eight-point boxcar and corrected for instrument response before the long period level, corner frequency and nigh frequency roll-off are calculated. The window length* depend on the DT (S-P time), and are either 64, 128, or 256 points for the F-vave, and 128, 256, or 512 point* for the S-wave. Bach PPT result ia fit for long period level, corner frequency, and high frequency slope, Y, with a Y-pole Sottervorth filter, i.e.,
[1 + < f / f o ) 2 Y l 1 / 2
These results, along with the vindov lengths used, are sent to BOSS for further processing. After completion of the FFT, H0KKE& is ready to start looking for another event. However, until BOSS •ends a release to each WOfXEJt the hold mode is still in effect. This is to insure that BOSS has completed its duties before another set of data is taken in.
The order of messages on the line between BOSS and the W01KERS is determined by a system priority, with BOSS having number one priority. This allot** BOSS to perform abortions on the WOBXERS if certan specified parameters or quality
11
criteria are not wet, and to return the WffTOS to looking for another event if Kf$S determines that the event presently being processed is Marginal, upon power-on, the user is interrogated by BOSS lo determine triggering levels, minimum detection, and quality criteria, desired 10SS processing, stacion coordinates, number of atationa, and other input parameters. All communication to the TOKHS is through the BOSS via keyboard input, all output is also perforated by BOSS on a eaell printer.
'Boas* in the BOSS computer is the main rotr* tine which controls the rest of the BOSS progress. ISTOR picks up the BOSS messages (i.e., FT, PA, PQ, ST, SA» SQ, DT, PP, PPT results) and stores then in tables corresponding to the WOKEK Number. FLOAT and EPA handle the fixed point to floating point conversion and the floating point arithmetic which is done in BOSS. Presently the arithmetic is done with an RCA software package. However, to increase the speed of calculation an Arithmetic Logic Unit is planned to handle all the floating point arithmetic in BOSS. Because the ALU requires a relatively large amount of power, it will only be used in BOSS. The WORKERS handIt the floating point multiplication through an in-house designed hardware multiply board.
BCONE and BCTWO are the routines which contain Che different modes of operation within BOSS. The different modes are:
1. Event count, total number of events that meet specified requirements.
INTRODUCTION
In 1976 LBT., in conjunction with U.C. Berkeley, made preliminary measurements with a prototype large-moment, horizontal-loop EH prospecting system (Jain, 1978} in a geothermal area in Nevada. Encouraging results from this work led to the development of the EM-60 horizontal-loop system (Morrison, et al., 1978}, which has now been operated for over 500 hours at various geothermal sites in Nevada and Oregon.
The objectives of the controlled-aource EH project are to develop new hardware and software tools for geothermal exploration. The LBL program is designed to fill the gap in existing technology with EH and to demonstrate the technical feasibility and cost-effectiveness of the technique co industry.
The EM method may be a significant improvement over existing techniques [dc resistivity and magne-totellurics (MT)j in g^othermal exploration for three reasons. (I) The depth of exploration with EH is approximately equal to the distance between the transmitter and receiver; this is almost five times the source receiver separation for dc resistivity. (2) The EM method is faster and less expensive than dc resistivity or HT. (3) Distant lateral inhomogeneities, which often affect HT data,
2. b-valmee, both cumulative mud interval, maims rX ar.d SA (maximum likelihood).
3. Cvent location.
4. Poisson'a ratio using Wadati'a method.
5. Source characteristics {moment, stress drop, displacement, fault area) from the spectral characteristics.
Al*o planned but not yet incorporated in the BOSS it the fault plane solution. Presently the first motiona are printed out for each station. Another mode is the debug mode which prints out all the data from the BOSS tables. These tables contain the information sent from each worker for a particular event. Any combination in any order of the above modes may be chosen.
POTUtE ACTIVITIES
ASP will be housed in a field van presently being modified. Ita first field test will be in Spring 1980 at a geothermal aire with known seismic activity. Another ASP presently under construction will be used for monitoring acoustic emissions at the climax stock nuclear waste repository at the Nevada teat aite. Besides geothermal exploration ASP will alao be used for monitoring geothermal reservoir dynaoica associated with fluid withdrawal and reinjection.
have relatively minor significance for EH because the strength of the fields strongly decreases with increasing distance from the transmitter.
SYSTEM DESCRIPTION
With the EH-60 system the earth is energized by means of alternating magnetic field created by a square-wave current applied to a horizontal loop (Figure 1). Power is provided by a Hercules gasoline engine linked to an aircraft 60-kW 400-Hz, three—phase alternator. The output is full-wave rectified and capable of providing ISO V at up to 400 A to the loop. The current waveform is created with a transistorized switch, controlled remotely by the operator who sets the fundamental frequency over the ranges of 10~ 3 to 10^ Hz (Morrison et al., 1978}. In practice, four turns of #6 welding wire in a circular loop, 50 n in radius, yield* a dipole moment of about 3 x 10 6 mks, corresponding to a current of 65 A. This configuration has been found satisfactory for most norcal exploration activities where the maximum depth of exploration is 1 to 3 km.
The fields are detected at a point 1 to 4 km distant from the transmitter with a three—component SQUID magnetometer oriented to measure the vertical, radial, and tangential components with respect to the loop. Signals are amplified, anti-alias fil-
CONTROLLED-SOURCE ELECTROMAGNEnC MEASUREMENTS AT GEOTHERMAL SITES IN NEVADA M. J. Wilt, N. E. Goldstein, R. Haught, and M. Stark

12
ftrimtf! k* . M>M*«ti ••••OTTO mp, »'•" B H MSaMT ~i
/CMtamrt liHWa*W
Mtl-ctaMl M l i l ffatria
M k | Mtl-ctaMl M l i l ffatria
MX««< M k |
• ^ l r Mtl-ctaMl M l i l ffatria Ml 1. Mtl-ctaMl M l i l ffatria Ml
•• 1
Mtl-ctaMl M l i l ffatria Ml
^
Figure 1. Schematic diagram of toe O H O fcoriaoaeaZ loop electromagnetic prospecting eyatea aa used in Nevada in 1979. ( 0 L 797-11400)
terad and input to * euc-ebaaatl, programmable, mclti-frequency phase-sensitive receiver. Through the receiver key-pad the operator aeta paraaetext controlling aignal processing: (a) fundamental period of the waveform to he processed; (h) •axio m number of harmonics to be analysed, up to 15} (c) number of cycles in increments of 2* to be stacked prior to Fourier decomposition; and (d) number of input cnannels of data to be processed. Processing results in n raw amplitude estimate for each component and a phase estimate relative to the phaae of the current in the loop. Phase referencing is maintained with a hard-wire link between a shunt on the loop and the receiver and this reference voltage is applied directly to channel 1 of the receiver for phase comparison, law amplitude estimates must be later corrected for dipole moment and distance between loop and magnetometer.
In practice the hard-wire link was found to be a source of noise, particularly above 50 Hi. This has required the elimination of the absolute phase reference a* high frequencies in favor of relative phaae measurements between vertical and radial components. With relative phaae measurements interpretation is baaed on the ellipticity and tilt angle of magnetic field rather than amplitude-phase of the vertical and radial fields.
Basic interpretation is accomplished by comparing field curves with calculated curves. Usually, amplitude-phase or ellipticity spectra are fit to one-dimensionel layer model curves by trial and error or direct inversion. Two-dimensioal modeling, although possible, ia currently cumbersome and prohibitively expensive (Lee, 1979).
ACTIVITIES IH 1979
am e f fec t ive sigmal-to-molee ra t io that aacrai as 1 / f 2 , aaHag noise camcftllatien iaaarativ* for recovery of lov-fxsmmamcy informatioa. Ia pract ice , tk* refer sort aaansfmaartr ia place* a t leaat 10 to 12 km from the tramamitter loop, so that the ob-servW f i e l d s w i l l csuaiet only of the gsnni agnatic flactmatioma (Finwxa 1 ) . Oace in s ta l l ed , Che rafer-ernca aagaa team tar can of tan raasia timed over the covra* of a enrvey. Tarn remote aigaala are transmitted to the mobile receiver etatiom frem the tramaaitter v i a Fat radio telemetry, l e f ere tan loop i a eaergiaad, the remote s ignals are inverted, adjeated in aamlitmaa, and than *tM4 t o the has* stat ion gsoaseratic signal to pcoamtn aasna+ially a an i l aignal . A good exaaal* of tfcia aimala noise cancellation scheme ia shown i a Figure 2 . The result ing s ignal- to-noise imecoveaant of romghly 20 d l haa allowed ma t o obtain re l iab le data to 0,05 I s , a gaia of three or fonr imp octant data poiata oa the sowadlng carve. Than* nolatn are invaluable for resolution of deeper horiaoaa.
NATURAL MAGNETIC FIELD CANCELLATION (a )
SAMPLE FIELD RECORD TRANSMITTER FREQUENCY =0.1 Hz Cb)
The aost significant change to field procedures in 1979 was the addition of a reference magnetometer to the system for geomagnetic "coiae" cancellation. At low frequencies (fO.l ha) natural geomagnetic *ignMl amplitude increases roughly aa 1/f while the signal sought decreases as 1/f. The net result is
Figure 2. Example of data improvement using the telluric noise cancellation scheme, (a) natural geomagnetic aignal and initial cancelling at the receiver site with transmitter off; (b) the seoe ayetea but with transmitter on.
(a) XBL 7911-13079} (b) XBE. 7911-13078
13
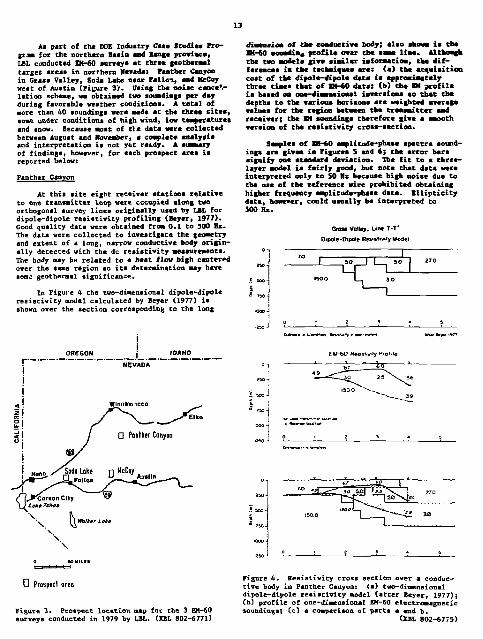
As part of the DOE Industry Case Stadia* Program for the northern Bavin and Kange province, LBL conducted EK-60 surveys at three geotherael target areas in northern Heveda: Panther Canyon in Grass Valley, Sods Lake near Fallen, and McCoy west of Austin (Figure 3 ) . Using the noise cancellation ficheae, we obtained two soundings per day during favorable weather conditions. A total of nore than 40 soundings were aide at the three sites, some under conditions of high wind, low temperatures and snow. Because most of the data were collected between August and November, a complete gnalytia and interpretation is not yet rei*dy. A summary of findings, however, for each prospect area ia reported below:
Panther Canyon
At this site eight receiver stations relative to one transmitter loop were occupied along two orthogonal survey lines originally used by LBL for dipole-dipole resistivity profiling (Beyer, 1977). Good quality data were obtained from 0.1 to 500 He. The data were collected to investigate the geometry and extent of a long, narrow conductive body originally detected with the dc resistivity measurements. The body nay be related to a beat flow bigb centered over the sane region so its determination may have soma geotheraal significance.
In Figure 4 the two-dimensional dipole-dipole resistivity model calculated by Beyer (1977) is shown over the section corresponding to the long
i OREGON j IDAHO
!"**"" "~ NEVADA
i i
u Prospect area
Figure 3. Prospect location map for the 3 EH-60 surveys conducted in 1979 by LBL. (XBL 802-6771)
dimension of the conductive body; also shown is the Ut-60 soundim* profile over the same line. Although the two models give similar information, the differences in the techniques are: (a) the acquisition cost of the dipoIe-eUpolc data ia approximately three times chat of m - 6 0 data; (b) the EH profile is baaed on one-dimensional inversions so that the depths to the various horizons are weighted average values for the region between the transmitter and receiver; the EM aoundinga therefore give • smooth version of the resistivity cross-section.
Samples of BM-60 amplitude-phase spectra soundings are givsm in Figures S and 6; the error bars signify one standard deviation. The fit to a three-layer model is fairly good, but note that data were interpreted only to 50 Bx because high noise due to the use of the reference wire prohibited obtaining higher frequency amplitude-phase data. Etlipticity data, however, could usually be interpreted to 500 Ha.
Gro» Volley. Lint T-T' Dipoie-Oipole Revst"*^ Uodei
EM-60 Rwst^-'r f'o'-ie
Figure 4. Resistivity cross section over a conductive body in Panther Canyon: (a) two-dimensional dipole-dipole resistivity model (after Beyer, 1977); (b) profile of one-dimensional EM-60 electromagnetic soundings; (c) a comparison of parts a and b.
(XBL 802-6775)

Sounding TT'hm4
H
- ^
A 4 OMan*
* M±05a» ISOJOIIiiM) » ™ x ' u " m
. • i i
Frtquency (Hi)
Figure 5. Normalised magnetic £ ic ld amplitude spectra normal and radial f i e lds Bounding TTS Panther Canyon. (ML 802-6816)
l i e s some 1 t o l k a below the surface and may form a confining layer for tht hot water some. The def in i t ion of t h i s Layer i s alsti important.
Preliminary analysia indicates that the conductive xone i s - t i l determined a t a l l s i t e s , but interpretation of the deeper horizons i s somewhat •ore d i f f i c u l t .
McCoy
The McCoy prospect located in a raao tainous area some 40 miles west of Austin was the scat difficult survey attempted because of the moun-tainous terrain and the two- ant three-dimensional geology (Olsen et al., 1979). Although 19 atations were occupied, about SO percent of the data cannot yet be interpreted with existing software. Modifications to the existing layered model inversion codes should help in interpreting data distortions doe to loop msorientatxon and topography, but two-dimensional modeling may be ncc»ss£ry to interpret other dat&.
ACTIVITIES mama rot i«ao
Sounding TT' km 4
Frequency I Hi)
Figure 6. Normalized magnetic field phase spectra normal and radial fields sounding ITS Panther Canyon. (XBL 832-6815)
Soda Lake
A one week survey of the Soda Lake geothermal anomaly was conducted in late Hummer of 1979. The study involved two transmitter loops and 13 receiver sites; data quality was good at all sites. Magneto telluric and seismic reflection data made available to the study by the Chevron Resource Company has aided somewhat in the interpretation of the EM data by allowing ua to better fix certain parameters (Hill et el., 1979).
From the EH data we hoped to determine the depth to and thickness of an extensive gently dipping conductive zone which may serve as the reservoir for hydrothermal fluids. A resistive volcanic horizon detected first from magnetotelluric data
All data obtained in 1979 will be interpreted to the fullest extent possible, leaults will be compiled and issued in short technical reports. Results will also be turned over to the Earth Science Laboratory, University of Utah Research Institute (ESL/CURI), who have the responsibility of preparing complete case histories for each of the study areas.
During the course of the field surveys ve found that the phase reference vire wsa introducing noise, resulting in lower accuracy at frequencies above SO Ex. This problem wss remedied by eliminating the reference wire and determining ellipticity at the higher frequencies. As « consequence, the one-dimensional inversion program will be modified to interpret a sounding curve coaposed of mixed amplitude-phase and ellipticity data points. We ttlmo plan to include a highly accurate quartz clxk in our system, thereby giving ua phase information without the need for a hard-wire link-
System software will be improved. There re mains a need for simplifying and accelerating the procedures for going from the printed tapes taken in the field to displaying the finished interpretations in the laboratory. This may be done by including a tape recorder in the aystem. In addition, we will address the problem of icterpreting data from an inlined loop; more precisely, the common case in rugged terrain where the point of measurement does not lie in the plane of the loop. Here the fields observed can be treated as the superposition of effects from both vertical and horizontal magnetic dipoles.
REFERENCES CITED
Beyer, J. H., 1977. Telluric and resistivity techniques applied to the geophysical investigation of Basin and Range geothermal systens, Fart III: The analysis of data from Grass Valley, Nevada (Ph.D. dissertation). Berkeley, University of CV- ~--niat Department of Engineering Geosciences, LBL-6325, 313 p.

IS
Hill, F. G-, Layman, E. B., Swift, C. H. v and Yungul, S. H., 1979. Soda Lake, Kevade thermal anomaly, in Expanding the geothermal frontier. Transitions, Geothermal Resources Council Annual Meeting, v. 3.
Jain, B., 1970. A low frequency electromagnetic prospecting system (Ph.D. dissertation). Berkeley, University of California, Department of Engineering Geosciences, LBL-7042.
Lee, Ri Ha, 1978. Electromagnetic scattering by a two-dimensional inhomogeneity due to an oscillating magnetic dipole (Ph.D. dissertation). Berkeley, University of California, Department of Engineering Geosciences, LBL-B275.
INTRODUCTION
Mt. Hood is a Holocene volcano located 80 km east of Portland, Oregon. It is one of many strato-cones in the High Cascade Range extending from northern California to southern British Columbia (Figure 1). In 1977, the U.S. Department of Energy, U.S. Geological Survey, U.S. Forest Service and Oregon Department of Geology and Hineral Industries (DOGAMI) began a program co evaluate the geothermal resource potential of this volcano. It was selected because of its proximity to a major city, the abundance of federally controlled land on which to work, evidence for a heat source, and growing interest of private developers in a source of hot water for the local area.
As yart of the program, LBL was assigned the responsibility of conducting and coordinating surveys dealing with rock, gas, and water geochemistry, and electrical resistivity.
Figure 1. Location map of Mt. Hood area. (XBL 784-644)
Morrison, H.F., Goldstein, >. E., moversten, H„, Oppli;*r, C-, and Kiveroa, C , 1978. Description, field test amd date analysis of * controlled-source EM system CM-60. Berkeley, Lawrence Berkeley Laboratory, LBL-70A6.
01 sea, H. J., DeHachaic, p., Pilkingtou, D., end Large, A. L., 1979. The HcCoy geotbermal prospect status report of • possible new discovery in Churchill and Lander counties, Nevada, MI Expanding the geotbermal frontier. Transactions, Ceothermal tesourcea Council Annual fleecing, v. 3.
ACTIVITIES I" FISCAL YEAS. 1979
Ceochemical Studies
Samples of warm- and cold-spring water, water from a geothermal test well in Old Maid Flat, fuma-rolic gases, and rocks were collected and analysed for major chemical constituents and trace elements. This project culminated in fiscal year 1979 with a report by Vollenberg et el. (1979), presenting and summarizing the analytical data and proposing an interpretation of the hydro-geochemical system of Ht. Hood.
The only warm-spring area on Ht. Hood is Swim Springs, located on the south flank. Orifices at Swim Springs were sampled repeatedly with little overall change noted in water chemistry between summer and winter. Oxygen and hydrogen isotope data and mixing calculations based on analyses of Swim Springs and numerous cold springs indicate that a large component of the warm water at Swim Springs is from near-surface runoff. Chemical geothermometry suggests that temperatures at depth in the Swim Springs system are within the range 104 to 170°C; the temperature of unmixed hot water may exceed 200°C. Higher-than-background chloride contents and specific conductances of cold springs on the south flank of the mountain (Figure 2) suggest that rhere is a small component of thermal water in these sources.
A geothermal model of Mt. Hood is proposed wherein snow- and glacier-melt water near the summit comes in close proximity to the hot central "neck" of the mountain, manifested by the summit-crater fumaroles (Figure 3). The hot water migrates dovaslope, mixing with cold water alor% its path; a small portion of the mixed warm water surfaces at Swim Springs.
Another possible explanation for the presence of warm water at Swim Springs is deep circulation along a fault zone. An east-west oriented fault zone in the vicinity of Swim Springs has been suggested from analyse* of earthquake epicentral data (R. Couch, 1977, personal communication). However, to date, other geological and geophysical investigations have not confirmed the fault zone. If a fault zone were present and it contained permeable
GEOPHYSICAL AND CrOCHEMICAL INVESIICATIONS AT MT. HOOD, OREGON N. E. Goldstein, H. A. Wollenberg, E. Mozley, and M. j . Wilt

16
SPEC CONO ounce ( ^ i r t M f b n ) (»*-J
O ttOO <3
e 100-900 WOO
• S0O-DO0 >KX>
S P L E S T O C a c BASALTS. A K K V T E S
Q E M I HOOD Atccamc noes. rtnoaAcncs
EjLATt PUDCOC VOLCAMCS
^ E W L V HJOCENE VOUUMCS
•JMCCOC VCVWKLiSTK flOOCS
• MOCOC BASALT
C B l C C E H T a U V X I A I . O 0 O M T S
d L A U K L HLL. STLL- OCEX MTftONCS
• *J0CO« TO HECS
Figure 2* Specific conductance and chloride content of waters, plotted on the geologic map of Mt. mood (after Wise, 1968). (7JL 802-8179)
t W t C M U serve as c s a l a U a fee deep circw-l a t i e a *£ meteoric water. I t £ • mac* l i k e l y that i f a faul t same i s preeeat, i c veala serve as ma Imsiimsailo barrier t o warm water mevimg dewealope, cameine. ftmaa iaaeamdmeac amd th* matmatiea a t Swim Spriaae. Keither tea famlt-seme mar the devmslspe moving warm mater asr l ia laas for Swim tarlaaa are mutually exclusive; bath could be operating.
Va vara surprised to detect the platieem-group element, iridium, i a warm- met celd-spriag waters m m i s a sample of altered aades i t s . Iriaima i s geaira l ly considered to Va associated with has l c to e l traeaaic igmeeea rocks; i t * aaaeeiatioa with am aaees i te voleaao i s believed t o ha withoat precedeat.
Ceopayffical Stadias
Field survey* consist ing of te l l er ic -aagacto-t e l l v r i c (MI) observatioes aad coatrollea-source electromagnetic (BO soamdisgs mare made U 197? aad 197«, respect ive ly . Field work doae in 1979 eoaaisted of occupying several widely spaced MT atetioaa i a coeeectioa with the U g h Cascade project . The major effort dariag f i s c a l year 1979 was to saxlyxa aad to interpret tea Urge amewat of data previomely obtained at the s tat ions shove in Figure 4 .
Of the mime coatrolled-source HI somadiaga performed with the aewly developed Br-aO system (Figaro 5) four were successful ly analysed in terms of layered-earth models, two were mot iaterpratsble because iaterveaiag terraia betweta transmitter and receiver gave resu l t s that badly distorted the sounding curves. Three aooadiaga from the loop i s Summit Headrv, a t the southern baae of the mountain, await interpretation based sn two-dimensional models.
Interpretations are based on either (a) a combined inversion using the four component* of amplitude aad phase of the normal ( i . e . , normal to plane of loop) and radial magnetic f i e l d s , or (b) e l l i p -t i c i t y of the magnetic f i e ld vector traced out by the normal and radial f i e l d components. Figures 6
Figure 3. North-south geologic cross section of Mt. Bood (after Vise 1968) showing, schematically, the hypothesized circulat ion paths of hot water (dark arrows) heated near the volcano's central neck, mixed warm water ( l ighter arrows), and cold water (unshaded arrows). The warm water emanating at Swim Springs i s strongly mixed, and cold water in springe on the south flank of the mountain may contain a small component of the deeper-flowing hot water. Myb * Yakima Basalt; Mr * Rhododendron Formation; Flv - Lower Pliocene basalt and andeslte; Qha - Mt, Hood andeslte flows.
(XBL 792-8469)

AMPLITUDE Sounding C O
! .cl
e o 3
Figure 4. MagnetoceJluric and coacrolled-aource electronagnetic acations around Hi. Hood.
(BBC 7911-15939)
o CoVcutalec* • (Mscnxd
» • » « « a
£}0n 5©03J-m
nauieilMfl
Figure 4 . Kagaeese f i e ld aa?St!Ciade spectre for Cloud Cap souadiot CC1. <XBL 794-7522)
HonEonlol loop, U> 10* iri i cfl <O0 Hi
*~^cL a LOtWlBtWI Ci*I1
3 C O ^ C K W ^
1 1 * v H j 1 * v H j C C I H M I ?
\ Stickli, I I 1 * v H j
1 S##rfrw A htil'iir 5
1 * v H j
\ c
! ' V
A tow frequency electromagnetic prospecting system
Figure 7. Haguetic field phase spectra for Clmid Cap sounding C O - (XBL 79*—.525)
Figure 5. Schematic of the EI-60 systea. (XBL 786-2575)
and 7 illustrate the amplitude-phase inversion at Cloud Cap Station and Figure 8 shows the corresponding ellipticity inversion (Wilt et al., 1979). Both analyses show a good conductor beneath a resistive surface layer 650 to 690 m thick. The thickness of the conductor could not be resolved, but its presence had previously hsen noted frc= the raagnetotelluric work (Goldstein and Mozley, 1978).
The tellyric-magnetotelluric data obtained by the contractor {Geonoraics, Inc.) were totally reprocessed u;)ing t oth remote electric and magnetic field references in an attempt to obtain more reliable HT sounding curves to interpret (Goubau, et al., 1978; Gamble et al., 1979a,b). It was found that electric and magnetic references gave improved
ELLJPTlCflTy ScuntJtftg C O
Figure 8. Magnetic field ellipticity spectrin for Cloud Cap sounding CC1. (XBL 796-7524)

results (i.e., saaller error bar*} but the aagaetic reference eeeae* to be better for aoiae cancellation.
Because the Cloud Cap HT data gave remit* that appeared reasonable to interpret by aeaaa of one-diaensional inversions end becauec of tbe conductor found at 600 • depth! considerable effort went Into a suitable interpretation of tbe station* in this cluster (Figure 9 ) . These stations are Oft a fairly young basalt-endeiite flow, one of M T B T « 1 that are associated with eruptive cer.csre (satelU-tic vents) on the north si4* of the volcano and dated at approximately 12,000 years I.P. rigure 10 shows a resistivity cross section along line 1-1* derived '.roa the one-dimensional inversion** lhi» profile is norael to the electrical strike determined froei the MT aeasureaauts, end we show only the results for the electric field parellei to s*rike. Here egein we sse cXesr evidence for a conductive cone, diainishing soaewhat vith distance from the suaait. This cone nay be due to hot water, he*ted either neer the suastit or near tbe Cloud Cap eruptive center, -nd cooling ss it uixti with coid neteoric weter vnslopc. This interpretation is consistent with t geochcaical interpretation discussed above. At a depth of 2* ka we also sea a discontinuity near station 2 that seeas to be the cause of the east-west strike. This hss been interpreted es s possible cauldron-feature: resistive basement relatively high northward and a chaotic zone of rocks closer to the •uaait.
The conductive second Isyer is also noted near Timberline Lodge on the south flank. There the MI data suggest a shallower and thinner tone, but the two-diaensionsl effects appear to have distorted the sounding curves. The EM-60 results show th.it the conductive sone lies at * depth of 500 a and has a resistivity of >10 oh*-* coapared with 2 to 3 ohm-m at Cloud Cap. The vara water eaanations at Swim Springs confirm that the conductive second lsyer may indeed signify a eone of heated water moving down the mountain.
ACTIVITIES PLANNED FOR FISCAL YEAR 1980
Geochemical Studies
The data on the chemistry of waters froa cold and wertn springs ana wells vaa presented in a report to the American Geophysical Onion's Pall 1979 meeting.
Geophysical Studies
During fiscal year 1930 the reaaining HT datr vill be snalyi.'-d to the fullest extent possible, and a final report will be issue giving, in detail, tue results of all EM and HT work. There are no plans to conduct additional EH or HT measurement* in 1980.
REFERENCES CITED
Gamble, T. D., Goubsu, W. M., and Cliirke, J., 1979a. Magnetotelluric with a remote magnetic reference. Geophysics, v. 44, p. 43-68. , 1979b. Error analysis for remote reference magnetotellurica. Geophysics, v. 44, p. 959-968.
Figure 9. Magnatot*lluric i HI stations at Cloud Cap.
1 eofttrolled-source ( I K 7911-13943)
One dimensional ir-ersior. of p^ (H*m) projected to section B-ff (TE mode)
& -1000
O IOOO 2000 3000 4OO0 Distance Cm)
Figure 10. Interpreted resistivity cross section at Cloud Cap. (BBC ;m-15937)

19
Goldstein. N. E., and Mozley, E.. 1978. A telluric-magnetotelluric survey at Ht. Hood, Oregon— a preliainary study. Berkeley. Lawrence Berkeley Laboratory. LBL-7050.
Coubau, W. M.a Gamble, T- 0., and Clarke, J., 1978. Mognetotelluric data analysis; removal of bias. Geophysics, v. 43, p. 1157-1166.
Wilt. K., Goldstein, H. E., Boverateo, M-, and Morrison, U. F., 1979. Controlled-source EM experiments at Mt. Hood, Oregon. Ceothermal Kisources Council, Transactions, v. 3, p. 789-792.
Wise, If. S.. i m a . Geology of Ht. Ssod, Orcgom. Oregon Dept. Geol. Mia. Imd., V . 6J t p. 11-98. , 1969. Geology aad petrology of the Mt. Hood arc*: A study or the ligh Cascade volcanise,. Ceol. inc. Am. lull., v. 80, p. 969-1006.
Wallenberg, I. A., Bowen, I. C , B o w i, •- »_, aad Stviaower, B., 197<l. Ceochemical crudiea of rockt, water, and gases at Kt- Bood, O****gout Berkeley, Lawrence Berkeley Laboratory, LBL-'C5Z.
KLAMATH BASIN GEOTHERMAL RESOURCE AND EXPLORATION TECHNIQUE EVALUATION M. A. Stark, N. £. Goldstein, and H. A. VVollenberg
INTRODUCTION
The Klamath Basin, located in south-central Otregon and northera California, has been a locos of geothermal exploration for several years, three Known Geothermal Resource Areas (KCRAs) liive been identified in the area; they are delineated in Figure 1. Hundreds of vara springs and wells. mostly in Klamath F F ' I S KGRA, are use*! in space heating and other direct applications. The waters range in temperature up to 145°C, and several companies and government agencies have searched for hotter water or steam suitable for electric power generation. Outside the main geothermal area in the city two exploratory deep holes have been drilled thud far in the basin but without finding hot water or steam. Interest in the region M s consequently waned over the last two or three ••ear*.
In an attempt to restimulate exploration activity, LBL, working with the State of Oregon's Department of Geology and Hineral Industries (DOGAHI) and the U.S. Geological Survey (USGS) has attempted to collect, integrate, and reinterpret all available exploration data from both public and private sources. Our primary goals were to develop a conceptual model for the hydrotheraal system, to suggest targets for further exploration, and to evaluate the exploration techniques on a site-Bpecific basis.
The Klamath graben can be traced frcm 80 km from the Medicine Lake volcanic field in northern California to Crater Lake, Oregon, attaining a width of 15 km. The local geologic structure is characterised by numerous nort-hwest-trending normal faults with occasional northeast-trending cross-faults. Important rock units are late Tertiary and Quaternary extrusive rocks and a late Tertiary lacustrine and volcanic unit known as the Yonna Formation.
The results from our fiscal year 1978 srudy are discussed ia Stark et al. (1979). In that report we examined geophysical data concentrated in the Swan Lake Valley and Klamath Hills areas (Figure 1). These included data from magnetotel-luric (MT), audio-magnetotelluric (AMT), roving dipole resistivity, aeromagnetic, and gravity surveys. Two-dimensional computer modeling was used to develop subsurface resistivity and density
models to satisfy the data. Both areas showed evidence for electrically conductive bodies associated with normal faoltir^ mad cross-faulting. In the Klamath BiAls area, the coadmctive zone coincides with a shallo* hot well area aloag the southwestern margin z£ the hills. In the Svaa Lake Valley ares, there are indications of a dike-shaped conouctive zone in Meadow Lake Valley, bat only minor evidence of surface hydrotbermal activity. We alao found geophysical evidence for a concealed cross fault between the CInatk Bills and Olene Cap.
ACCOHFLISmZXIS FOB 1979 In fiscal year 1979 we concentrated our
Efforts on data from the west and east shores of tfpper Klamath Lake. Figure 1 shows the survey areas covered. Since this wss the last year of the project, we also emphasized geological and g>ochemical considerations in an effort to understand the syEtest as a whole. Tbe work is reported in Stark et al. (1980).
Figure 2 s>ovs the locations of dipole-dipole, roving dipole, and Schlumberger resistivity surveys carried out on the west shore of the lake. By means of two-dimensional computer modeling we were able to find earth resistxvity models to satisfy these data. Our model for Line DOG, near Spence Mountain, is shown in Figure 3. This area was of interest because it was the site of a 2000-ft hole, which war designed, in part, to investigate a local resistivity-low inferred from the electrical surveys. Our model (Figure 3), which satisfies both the dipole-dipole (DDG, Figure 2) and tbe Schlumberger (KF3, Figure 2) data, indic^'es that low resistivities should not be expected les* than 4000 ft beneath the drill site.
Similar conductive anomalies were detected on other resistivity lines on the west shore of Gpper Klamath Lake. Our models indicate conductive horizons at depths from 1200 to 10,000 ft; the horizons are usually shallower beneath the valleys. Because these extensive conductive units effectively short-circuit the current, there is no evidence for a resistive basement in the soundings.
It is not known whether the conductive units represent anomalously high temperatures at shallow depth. We have suggested passible drill tests near

Known gtotbtrmai roMurcM aroa ooundary —— Oipolt-dipola and ScMumbtrgtr survey arao
(Harding - Lowson. 1974) Schlumberger soundinp and roving dipote survey orea
(Gsoterrex,<975) Schlumbargtr, timt domoin electromagnetic, and roving
dipole survey orta (Argc««m*, 1975) Gravity and magnetics (VonDtutan, I97S) cavers whole oraa
Scale
lOhm
Figure 1. Index wtp of geophysical survey t r c u . (ZBL 799-11451}

a
•> \-;cpy - N <-« •/C»A'> ~
----<T?-
^ i ^ o «v» T
*-t-*p":\v.
. < • > • • • - . ; i ^ T : , -
Figure 2. Location wap of electrical resistivity surveys, vest aLore of Klaaath Lake. (XJL 798-11149)

22
Satnc* Win «KM 2JDO0 Y *-°°°
I « — I
r Figure 3. Two-dimensicnal resistivity model for tine DDG: values in ohm-m. (XBL 798-11452)
lines DDL and DDA where the conductive horizons cone closest to the surface.
On the east shore of the lake (Figure 1) we examined roving dipole, Schlumberger, and electromagnetic survey data. We made no effort at quantitative reinterpretation of theae dati. Qualitatively, the data show decreasing resistivity with depth, especially in Pluat Valley (east of Naylox Mountain in Figure 1), and south of Vhiteline Reservoir. The latter anomaly is adjacent to Meadow Lake Valley, site of a strong MT apparent resistivity low discussed in Stark et al. (1979). Soundings should be undertaken to investigate the specific anomalies.
We also analyzed regional geochemical and geological information. Reservoir temperature estimates for the Klamath Basin hot water aquifer were made independently by Saaatel (1976) and by Koenig and Gardner (1972) based on silica and Ha:K geother-Tflocneters. Both workere estimated equilibration temperatures in the 120 to 130°C range, and they both invoked the possibility of a deeper steam reservoir to explain the high sulfate content of the waters. Since publication of these studies, higher temperatures have been measured in a new well in Klamath Falls city. The new well is 1200-ft deep with a reported bottom-hole temperature of 145°C.
Saumel (1976) also measured specific electrical conductivities of well and spring waters. He analyzed the relationship between conductivity and temperature in these waters. In the Klamath Falls/Olene Gap area, the expected trend prevails, i.e., the hotter waters are more conductive. South and west of Olene Gap, however, the opposite trend emerges, with the warmer waters associated with lower conductivity. This trend, though less clear-cut, is partly due to saline groundwater in the marsh environment. This hypothesis does not explain all the data; we have recommended additional geochemical work to investigate the history of these waters.
We also examined geologic maps and aerial infrared imagery, tying these into the geophysical
data ia a beeim-wide tactomic analyeis. Figure 4 aktwa am idealise* conception of am offaet in the grafcst axis. The northeast-treading fault between the Klamath Hills ami Olene Gap was iafcrrcd ia Stark et al. (1979) based oa audio-magnetotelluric, gravity, ami aeromaamatic data. The other northeast- tremalag famlt, located aorthweat of the Klamath liver, was inferred ia Stark et ml., (1910) based am remote aemaimg, giavitv, am* aeromagaetic data. Be believe that the graham has beea off act along these faults ia the right-lateral atrike-slip sense.
Theae croea-faulta aeem to he regional features; the one northwest of the river may extend through Flamath Fall* amd Swan Lake Valley. Intersections of these crote-feulte with the northwest-trending normal faults aeem to he favorable locations for near-surface geotbermal activity.
In this wcrk we have had a chance to evaluate the exploration techniques on a site-specific baiis. Our impressions follow:
1. Kmmote Sensing. Aerial infrared photographs proved moat useful in substantiating the presence of cross-faulting inferred from other methods.
2. Geochemistry. Available wells and springs should always be inventoried at an cart} stage of exploration. The new 145°C well in Klamath Falls has shown that the reservoir temperature estimates by Saamel (1976) and Ko^nig and Gardner (1972) abOLld be regarded ae minimum values. We found the specific conductivity measurements useful in interpretation resistivity anomalies.
3. Gravity and Hagnetica. These methods are hampered by the fundamental non—uniqueness problem of potential field data, particularly in the volcanic terrain of the Klamath Basin where rock magnetizations and densities can be ao variable. In conjunction with other information, however, the data can be extremely useful for tracing faults and for estimating depth to basement. In this area, direct associations of gravity and/or magnetic anomalies with geothermal targets are not recommended. Structural and lithologic changes can account for more variation than geothermal processes such aa hydrotbermal metamorphism and elevated Curie point isotherms.
4. Koving Dipole Resistivity. This is a useful reconnaissance tool, but the data are difficult to interpret quantitatively unless supplemented by data from other resistivity methods. Schlumberger and EH soundings were conducted at the Whiteline Reservoir for control, but ;i retrospect these soundings might have been more usefully employed at a later time f-o define targets outlined by the roving dipole survey. Similarly, the vest shore roving dipole survey should have been completed and analyzed before the dipole—dipole and Scb.lum-berger work began there. Computer modeling can help pinpoint the sources of the often-deceptive raving dipole anomalies.
5. Schlumberger and Dipole-Dipole Resistivity. Schlumberger and dipole—dicaie sounding can offe. detailed, quantitative earth resistivity information
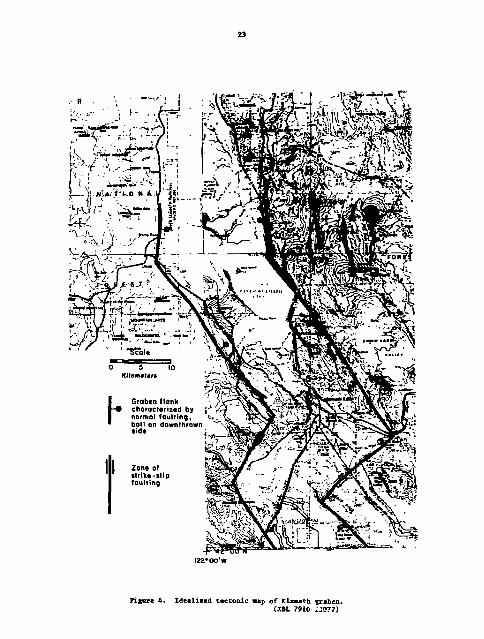
23
figure 4. Idealized tectonic map of Klamath gcaben. (XM. 7910 1J077)

24
if the survey* are properly implemented. If possible, lines should be laid out perpendicular to geologic strike, so that two-dimensional sodding can be used effectively to separate lateral resistivity changes froa changes with depth. We found that collinear, overlapping Schluabcrgcr and dipole-dipole soundings vere necessary to allow a well-constrained interpretation. Finally, joint computer modeling of the data sets should be undertaken. When f.ese conditions are satisfied, a quantitative subsurface resistivity picture emerges tbafc can be valuable in selecting a drill target.
6. Time Domain EM. The data we received are rather difficult to interpret. He certainly applaud efforts to develop and deploy field equipment to make these measurements, but at this time most interpreters are livited to very simple models. If more powerful sett is of analyais can be developed, the technique could become quite useful.
7. Temperature Gradient Surveys. These atea to be only marginally useful in the exploration efforts to which they pertained. In the Klamath Basin, there appear to be difficulties related to the complicated groundwater flow which reduce the effectiveness of these methods.
ted
FURS FOft FISCAL TEAK I960
The second of the two technical reports (Stark e t a l . , 19B0) w i l l be completed, reviewed by an industry ccsaaittee, and issued at midyear.
REFERENCES CITED
Koenig, J., and Gardner, H., 1972. Ceochemical interpretation of spring and well waters south-central Oregon and adjacent California. Berkeley, Ceothcrmix.
Sammel, E. A. ( 1976. Hydrologic recoanaiasance of the geothermal area near Klamath Falls, Oregon. U.S. Geological Survey Open File Report URI 76-127.
Stark, K., Co?dstein, H.E., Vollenberg. H., Strisower, 1., Beg*, H., and Wilt, M-, 1979. Ceothermal exploration assessment and interpretation, Klamath Basin, Oregon: Swan Lake and Klamath Hills areas. Berkeley, Lawrence Berkeley Laboratory, LU>81ft6.
Stark, H., Goldstein, K. E., and Wallenberg, H. A., I960. Geothermal exploration assessment and interpretation, Dpper Klamath Lake area, Klamath Basin, Oregon. Berkeley, Lawrence Berkeley Laboratory, LBL-1 O H O (draft).
MACNETOTELLURIC STUDIES IN THE HIGH CASCADE, OREGON N. E. Goldstein, R. Miracky, W. M. Goubau, and T. D. Gamble
INTRODUCTION Ii**OT
In 1979, the U.S. Geological Survey, as part of its Geothernal Research Program, began a number of long-term geologic, geophysical, geoehemical, and hydrologic studies of the Cascade Range on both regional and local scales. Upon completion, this work will provide basic information for an assessment of the geothermal potential of the Cascades, one of the major active volcanic belt* in the world. To help support these studies, the U.S. Department of Energy, Division of Geothermal Energy, has contributed financially to the geo-electric studies. In connection with this involvement, LBL has undertaken sagnetotelluric soundings in concert with similar work by the U.S. Geological Survey and a commercial contractor.
PROGRESS IN FISCAL YEAR 1979
During August and September 1979, LBL performed a reference' magnetic-magnetotelluric (HI) survey at widely peced prations along two east-west lines (Figure J . The northern liie, lat 45°30', extends from the Willamette Valley, southwest of Portland, across the Cascades at Ht. hood, and terminates between the Deschutes *nd John Say Rivers in the Deschutes-Umatilla plateau province. The southern line. 42°15% extends from Cive Junction in the Siskyou Mountains eastward through Klamath Falls, terminating in the Basin and Range provinces, at about long 121°W. These lines, referred to as the Mt. Rood and Klamsth lines, respectively, are two of six MT lines straddling the High Cascade Rsnge. The others were surveyed by a contractor to the U.S. Geological Survey (Geotronics, Inc.), but these are conventional MT stations without chc magnetic reference. LBL station separations vary between
• USL REFERENCE UAGHE IC-UAGMETOTELLLffllC STATIONS
Figure 1. Location of LBL magnetotelluric stations for the High Cascade Program. (XBL 803-6821)
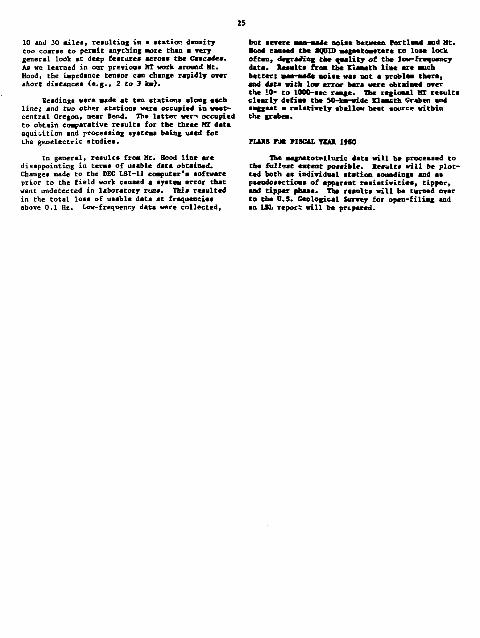
25
10 and 30 miles, resulting in a station density too coarse to permit anything sore than a very general look at deep features across the Cascade*. As we learned in our previous MI work around Ht. Hood, the impedance tensor can change rapidly over short distance* (e.g., 2 to 3 lest)*
Readings were made at ten stations along each line; and two other stations vera occupied in west-central Oregon* near Bend. The latter weri occupied to obtain comparative results for the three MT data aquHition and processing systeas being used for the geoelectric studies.
In general, results from Mt. Bood line are disappointing in terns of usable data obtained. Changes made to the DEC LSI-11 computer's software prior to the field work caused a system error that went undetected in laboratory runs. This resulted in the total loss of usable data at frequencies above 0.1 Hz. Low-frequency data were collected,
but severe man-made noise between Portland and Ht. Hood canted the 9Q01D magnetometers to lose lock often, degrading the emality of the low-frequency data, lesvlta from the Klamath line are much better; msn-mide noise was not a problnm there, and data with low error bars were obtained over the 10- to 1000-aec range. The regional HT results clearly define the 50-km-wide Klamcth Graben and suggest a relatively shallow heat source within the graben.
r U M S FDK PISCal. TEAK 1980
The magnctotelluric data will be processed to the fallist extent passible, lesults will be plotted both as individual station soundings and as paeudoaectiona of apparent resistivities, tipper, and tipper phase. The results will be turned over to the 0.5. Geological Survey for open-filing and an L»L report will be prepared.
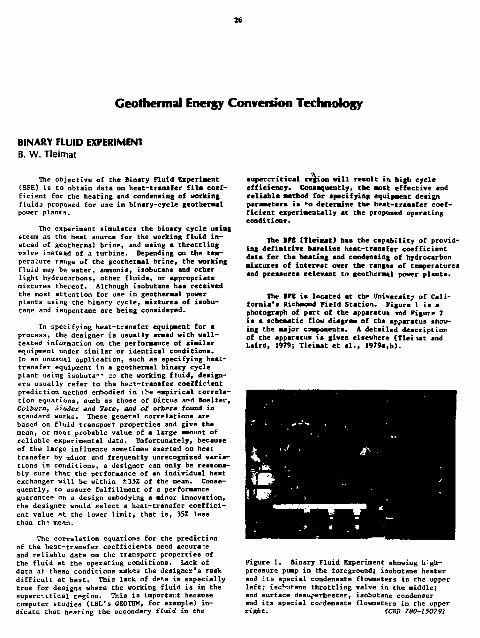
20
Geothermal Energy Conversion Technology
BINARY FLUID EXPERIMENT B. W. Tleimat
The objective of the Binary Fluid Experiment (BFE) is to obtain data on heat-transfer film coefficient for the heating and condensing of working fluids proposed for use in binary-cycle geothermal power plants.
The experiment simulates the binary cycle using steam as the. heat source for the working fluid instead of geothermal brine, and using a throttling valve instead of a turbine. Depending on the temperature range of the geothermal brine, the working fluid may be water, ammonia, isobutane and ether light hydrocarbons, other fluids, or appropriate mixtures thereof. Although isobutane has received the most attention for use in geothermal power plants using the binary cycle, mixtures of isobutane and isopentane are being considered.
In specifying heat-transfer equipment for a process, the designer is usually armed with well-tested information on the performance of similar equipment under similar or identical conditions. In an unusual application, such as specifying heat-transfer equipment in a goothermal binary cycle plant using isobuta-- £3 the working fluid, designers usually refer to the heit-transfer coefficient prediction method embodied in the empirical correlation equations, such as those of bi.ttus and Boelter, Colburn, bidder -and Tate, and of oKhsrs found in standard works. These general correlations are based on fluid transport properties and give the mean, or most probable value of a large amount of reliable experimental data. Unfortunately, becauae of the large influence sometimes exerted on heat transfer by minor and frequently unrecognized variations in conditions, a designer can only be reasonably sure that the performance of an individual heat exchanger will be within ±35Z of the mean. Consequently, to assure fulfillment of a performance guarantee on a design embodying a minor innovation, the designer would select a heat-tranufev coefficient value at the lower limit, that is, 352 less than th J mean.
The correlation equations for the prediction of the heat-transfer coefficients need accura :e and reliable data on the transport properties of the fluid at the operating conditions. Lack of data ar these conditions makes the designer's task difficult at best. This lack of dpr.a is especially true for designs where the working fluid is in the supercritical region. This is important because computer studies (LBL's GEOTHM, for example) indicate that heating the secondary fluid in the
supercritical region will result in high cycle efficiency. Conatqueutly, the most effective and reliable method for specifying equipment design parameters is ro determine the heat-transfer coefficient experimentally at the proposed operating conditions.
The BFE (Tleimat) has the capability of providing definitive bareline heat-transfer coefficient data for the beating and condensing of hydrocarbon mixtures of interest over the ranges of temperatures and pressures relevant to geothermal power plants.
The BFE is located at the University of California's Richmond Field Station. Figure 1 is a photograph of part of the apparatus ind Figure 2 is a schematic flow diagram of the apparatus showing the major components. A detailed description of the apparatus is given elsewhere (Tleisat and Laird, 1979; Tleimat et al., 1979a,b).
Figure 1. Binary Fluid Experiment showing h-'.gh-pressure pump in the foreground; isobutane heater and its special condensate flowmeters in the upper left; iacbcit-ane throttling valve in the middle; and surface desuperheater, isobutane condenser and its special condensate flowmeters in the upper right. (CBS 780-15079)

1 ..-. ' Baottet
Figure 2. Schematic flow diagram of the Binary Fluid Experiment. (XBL 783-7*93)
The system ««s abut * M in June to install thermocouples in Che vapor apace in the condenser. These tbemocouples will be usee to determiae tbe temperature profile in tbe vapor apace along tbe length of th» tube. Ssmplint valves vera also installed at tbe condensate outlet from each of the condensate asters. These samples will be analysed to dctcrsune tbe composition of the condensate aloes the length of the cube and the effect of coapositica on condensation film coeflicient.
FUTUSS FLANS
Data will be obtained on heat-transfer film coefficients for heating and condensing mixtures of different compositions in the loop. These data will be analysed to determine tbe effects of varying compositions on the performance of the heater and condenser and the need for further tests.
REFERENCES CITED
ACCOMPLISHMENTS DURING 1979
Data on the heating of isobutane at supercritical pressure (600 psia) and at various flow rates and temperatures were obtained. Simultaneously dsta on the condensation of iaobutane at various temperatures and condensation rates were obtained. These data were analyzed. The results of the analysis were published in two reports (Tleimat et al., 1979s,b).
The system wan charged with a mixture of 80/20 by sole of isotmtane-isopentane in April. Trial runs were made and preliminary data were obtained. These data were examined to determine the need for additional instruments to obtain heat-transfer data on mixtures.
Tleinat, B. V., Laird, A. 0. «... tie, B., and Hsu, I. C , 1978. Beat transfer coefficients for isobutane, in Earth Sciences Division Annual leport 1978. Berkeley, Lawrence Berkeley Laboratory, L1L-8648, p. 47-51.
Tleinat, B. U., and Laird, A. D. '., 1979. Investigation of heat transfer coefficients of binary cycle working fluids, in Earth Sciences Division Annual Report 1977. Berkeley* Lawrence Berkeley Laboratory, LBL-7028, p. 109-112.
Tleimat, B. W. f Laird, A. D. X., tie, H-, Hsu, I. C , and Seban, R. A., 1979a. Hydrocarbon heat transfer coefficients; prelininary isobutane results. Berkeley, Lawrence Berkeley tsioratory, LBL-8645, 45 p.
Tleimat, B. V., Laird, A. P. £., Hsu, I. C , and Rie, H., 1979b. Baseline dsta on film coefficient for heating isobutane inside a tube at 4.14 HPa (600 psia). ASHE publication 79-HT-14.
ACTIVITIES IN DIRECT-CONTACT HEAT EXCHANGE P. M. Rapier
INTRODUCTION
The U.S. Department of Energy's Division of Geothermal Energy has undertaken a program to delineate and demonstrate the economic advantage of the Direct Contact Heat Exchange (DCHX) process in generating power from liquid-dominated geothermal resources, following a proof-of-concept phase and pilot plant construction, the program elements will measure and demonstrate both subsystem and overall system performance. Development of technically and economically viable proceas designs will be followed by estimates of the cost of electric energy procuced by such optimized plants.
Data and operational notes were assembled for proof-of-concept and reduction to practice of an equilibrium-flash boiler section, which was to be used directly on top of the 500-kW pilot plant DCHX preheater section of the tower (Rapier, 1978). The notes show a volumetric heat transfer coefficient for this section of up to five times that theoretically obtainable with alternative liquid/liquid volumetric boilers (Urbanek, 1978).
Mathematical models were developed for:
1. Determining the setting d.:prh in a geo thermal well for a downhole pump (Rapier, 1979a).
1979 ACTIVITIES
During fiscal year 1979, LBL was engaged in both overall system and subsystem program elements related directly to the DCHX. These activities ir.cluded the following.
2. Performing s multistage flash evaporator of n stages for deg&ssing geothermal brine feeds to a DCHX power plant (Rapier, 1979b).
3. Modifying the GEOTHM binary fluid code for passive simulaion of the direct-contact process.
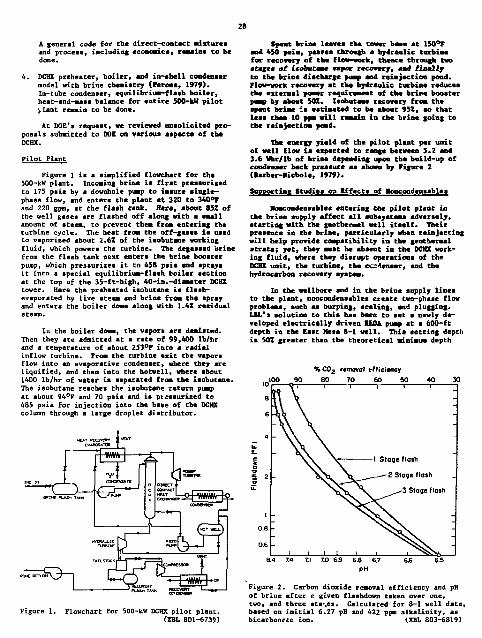
28
A general code for the direct-contact mixtures and process, including economics, remains to be done.
4. DCHX preheater, boiler, and in-shell condenser model with brine chemistry (rcroaa, 1979). In-tube condenser, equilibrium-flash boiler, heat-and-mass balance Eor entire 500-kW pilot j,i«nt remain to be done.
At DOE*s request, we reviewed unsolicited proposals submitted to DDE on verioua aspect* of the DCHX.
Pilot Plant
Figure 1 is a simplified flowchart for the 500-kW plant. Incoming brine is first pressurized to 175 psia by a downhole pump to insure single-phase flow, and enters the plant at 320 to 340°F and 220 gpm, at the flash tank. Here, about 851 of the well gases are flashed off along with a entail amount of steaa, to prevent them from entering the turbine cycle. The heat frost the off-gases is used to vaporized about 2.6Z of the isobutane working fluid, which powers the turbine. The degasetd brine from the flash tank next enters the brine booster pump, which pressurizes it to 458 psia and sprays it into a special equilibrium-flash boiler section at the top of the 35-ft-high, 40-in.-diameter DCHX tower. Here the preheated isobutane is flash-evaporated by live steam and brine from the spray and enters the boiler dome along with 1.4Z residual steaxu
In the boiler dome, the vapors are demisted. Then they are admitted at a rate of 99,400 lb/hr and a temperature of about 253°F into a radial inflow turbine. From the turbine exit the vapors flow into an evaporative condenser, where they are liquified, and then into the hotwell, where about 1400 lb/hr of water is separated from the isobutane. The isobutane reaches the isobutane return pump at about 94°F and 70 psia and is ptesaurixed to 485 psia for injection into the base of the DCHX column through a large droplet distributor.
Figure 1. Flowchart for 500-kW DCHX pilot plant. (XBL 801-6739)
Spent brine leaves the tower base at 150°F and 450 peia, pastea through a hydraulic turbine for recovery of the flow-work, thence through two stages of icobutame vapor recovery, and finally to the brine discharge pump and reiajectiou pond. Flow-work recovery at the hydraulic turbine reduces the external power requirement of the brine booster pump by about 50X. Isobutaoe recovery from the spent brim* is estimated to be about 95*, ao that leas than 10 pen will remain in the brine going to the reinjectiom pond.
The energy yield of tbc pilot plant per unit of well flow ia expected to range between 5.2 and 3.6 wfar/lb of brine depending upon the build-up of condenser back pressure as shown by Figure 2 (larber-Hichols, 1979).
Supporting Studies oa Effects off Moncondensables
Koncondensables entering the pilot plant in the brine supply affect all subsystems adversely, starting with the geothemal well itself. Their presence in the brine, particularly when reinjecting will help provide compatibility in the geothermal strata; yet, they must be absent in the DCHX working fluid, where they disrupt operations of the DCHX unit, the turbine, the c£=4cnser, and the hydrocarbon recovery system.
In the wcllbore and in the brine supply lines to the plant, noncondenaables create two-phase flow problems, such as burping, scaling, and plugging. LBL'a solution to this has been to set a newly developed electrically driven 1EDA. pump at a 600-ft depth in the East Mesa 8-1 well. This setting depth is 501 greater than the theoretical minimum depth
%CC*2 removal efficiency
Figure 2. Carbon dioxide removal efficiency and pH of brine after e. given flashdown taken over one, two, and three steles. Calculated for 8-1 well data, based on Initial 6.27 pH and 422 ppn alkalinity, as bicarbonate ion. (.XBL 803-6819}

of 402 ft after four yean flow at 220 gpm as determined by LBL's calculator code (lapier, 1979a). This SOX increase include• the manufacturer's recommended NPSH plus a reasonable safety factor. Mo evidence of two-phase flow ha* been observed since atartup, and so this firat-of-ita-kind downhole punp installation is now retarded as an adequate solution to this problem.
The single-stage flash tank of the pilot plant is expected to provide experimental data for the design of a fully commerieal multistage flash (HSF) degasser, capable of removing 962 of the gas, thus allowing a close approach to the ideal gas-free operation. Figure 3 shows the gas removal efficiency and pH of the flashed brine for a given flash-down taken over one, two, and three stages (lapier, 1979b). The hest-recovery efficiency of the HSF degaaser is expected to be close to unity, inasmuch as it possesses several features not fou >d on the experimental flash tank;
1. The steam condensate from each stage drips directly inLo the brine, so chat the total brine supplied enters the DCHX unit. This returns all of the enthalpy to the process.
2. The steam condenses within the stage at about the brine temperature instead of in a separate heat recovery vessel at a much lower teoperature and pressure. This provides a maximum temperature for boiling the isobutsne in the condenser tubes of the stage.
3. The noncondensables sre subcooled before being discharged, so that steam losses from the vent are inconsequential.
A. The back-pressure condensing principle employed from stage to stage insures an equilibrium flash in each stage and provides fly-wheel stability to the operation by coupling the heat and mass flows of the procsss and eliminating nonessential contr-»lj,
Honcondensables, remaining in the brine entering the DCHX, will build up an equilibrium concentration in the recirculating isobutane working
70 80 90 100 Condenser pressure (psia)
Figure 3. Influence of condenser pressure on system performance; brine flow - 26.5 lb/s; turbine efficiency - 0 . 8 . (XBL 8C3-6818)
fluid that dependa upon their entering rate. They recirculate through the turbine to form am much MM IX of the total mass flow* hot do mot contribute a corresponding enthalpy drop* thereby reducing the turbine efficiency, they also add their martial pressure to the working-fluid condensing pressure, reducing the available pressure ratio across the turbine. In an unvested condenser, the pressure builds up to an equilibrium point such that noncondensables can be transferred from the working fluid to the spent brine stream at the same rate •a they are entering the DCHt unit. The recycled noncoedensebles form * blanket through \ihich the isobutane must diffuse to reach the heac exchange surface, and thereby lower the heat transfer coefficient by as much as 50Z CUrbanek, 1979, p. 7-1). Consequently, for a given cooling system to perform its duty the condensing temperature end pressure of the isobutane will have to rise, additionally, because of the recycled noncondensable load, vapora from the turbine exit will reach the condenser more highly superheated than for a pure isobutane vapor. Consequently, desuperheating will he more of a problem.
In the isobutane vapor recovery section following the hydraulic turbine, noncoodensables can aid in stripping the 200 ppm soluble isobutane from the brine; however, the resulting gas mixture is more difficult and costly to condense and separate than pure isobutane. The most cost-effective procedure is to remove the noncondenssbles ahead of the DCHX unit.
Recommended for future investigation are the following problems: in the upper part of the DCHX preheater section, dissolution of the recycling concentrated noncondensable gases from the isobutsne droplets, prior to any active boiling, may stifle the expected liquid/liquid best transfer, blanket the droplets, buoy them to the surface prematurely, form metastsble cellular gas structures, snd otherwise disrupt the orderly counter-current heat exchange of the device. Preflashing the brine ahead of the DCHX unit and use of sieve treys beneath the equilibrium-fIssh boiler section are feasible solutions to these gas difficulties.
At the condenser, higher-than-expected backpressures may occur because of bypassing of superheated vapors snd subcooling of the condensate. Desuperheating at the turbine exit, together with the use of a vent compressor/condenser nay reduce these irreversibilities.
REFERENCES CITED
Barber-Nichols Engineering Company, 1978. 500 kW pilot plant design review, July 20, 1978. Barber-Nichols Engineering Company. , T979. Finsl report, direct contact heat exchanger 10 kW power loop test series no. 2. Berktley, Lawrence Berkeley Laboratory, LBL-7036, v. 2, p. 5.
Fulton, R. L,, 1979. Developments in direct-contact heat exchange, in_ Earth Science Division annual report 1978. Berkeley, Lawrence Berkeley Laboratory, LBL-8648, p. 55-57.
Perons, J., 1979- Peiiodic Reports for DGE on Analysis of Mass Transfer Processes in Geo-thermal Power Cycles Utilizing Direct Contact

30
Heat Exchanger. Knoxville, University of Tennessee.
Rapier, P. M., 1978, Propoaed deaign for direct contact iaobutane boiler. Berkeley, Lawrence Berkeley Laboratory, LBL Engineering Note* UCID-6029, GTlSOe, Serial H5194, May 23, 1978. , 1979a. Calculations for the proposed down-hole puaping of East Hesa 8-1 well at 220 gpn. Berkeley, Lawrence Berkeley Laboratory, LBL Engineering Mote, LBID-OOB, GT180B, Serial M5314, March 16. 1979. , 1979b. SR-59 program for vapor pressure of geotheraal brine at conatant alkalinity vs
P>, flashdova °C versus nnaoer of MSP stages, carkoaate cosaoaitioo and percent COj raaoval for each atage. Berkeley, Lawrence Berkeley Laboratory, LBL Engineering Mote, LB1D-096, GI1702, Serial MS391. May 16, 1979.
Orbanek, M* V. t 1978. Developncnt of direct-contact best exchangers for geotheraal brines, DOS Engineera, Final report, October 1977-Juoe 1978. Berkeley, Lawrence Berkeley Laboratory, LBL-S558. • 1979. Experincnlal testing of a direct* contact heat exchanger for geotheraal brine, Final report, Deceaber 1979. OBXL/SttB-79/ 135*4/1 and OWL/SUB-79/4S736/1 DSS-079.

Reservoir Engineering
MEXICAN-AMERICAN COOPERATIVE PROGRAM AT THE CERRO PRIETO GEOTHERMAL HELD, RAJA CAUFORNIA* MEXICO M. J. Lippmann, P. A. Witherspoon, and N. E. Goldstein
INTRODUCTION
The Cerro Prieto field is located in the Sal ton Trough just south of the California/ ftaja Calitornia border (Figure 1). The field ia the site of a cooperative effort between Mexico and the United States to understand the behavior of a geo-thermal system under full-scale fluid exploitation.
The Comision Federal de Electricidad of Mexico (CFE), which manages and operates the field, began generating electric power at Cerro Prieto in 1973. Last April, the original 75-KWe power out-^st was doub'ed to ISO KVe as the third and fourth 37.5MU higher-pressure ning> flash units were placed in operation.
At the present time, d ^ t 480 KVt contained in hot separated waters are re "S wasted. Tc recover some of the energy of these 169°C waters, now being disposed of into an evaporation pond at a rate of about 3000 tonnes/day; a 30-KWe lower-pressure double-flash unit is scheduled for coasaer-cial operation in 1982 (Hernandez, 1979).
The total generating capacity at the field is expected to reach 600 HWe by 1385. The probable total capacity of the Cerro Prieto field is estimated to be about 1000 HWe and that of the entire
Kexieali Vail ley is believed to be nuch larger (Hanoo and Goixa, 1979). Sawed oa CFE's reaounc estimates, the available geothermal power wi: exceed the ircal deal and f9* electricity, and CFE has tentatively agreed to s*' It large blocks of electrical power to S*a Diego Gas cad Electric Company, of southern California.
The intensive drilling program inttia*td in 1976 cootinoes- At the present tim*.* abojt 65 deep wells have been crapleted (Figures 2 cod 3 ) . The new veil* in the eastern aad southeastern parts of the field confirmed the existence of a very hot (>3£0°C) reservoir below 2<NM> • depth (Alonso et al., 1979).
Geotheraul studies aire now being performed as part of a cooperative project, which was established
Figure 1. Salton Trough {or Salton Sea/Sea of Cortez Ti >ugh) showing the location of the Icperial and Mexicall Valley and the Cerro Prieto field.
(XBL 801-6718)
Figure 2. Ore- of the wellhead i n s t a l l a t i o n s . Cerro P r i e t o Vol-ano and Sier ra Cucapa in the background.
(CBB 802-1912)

Figure 3. Cerro Prieco geothermal field—well locations. (XBL 7911-13432)
and operated through an agreement signed on July 21, 1977, between CFE and the U.S. Department of Energy (DOE). Lawrence Berkeley Laboratory (LBL) coordinates T'.S. technical activities carried out under this project. The Coordinadora Ejecutiva de Cerro Prieto Oi. CFE is organising all Mexican participation (Witherspoon et al., 1976).
The Gerro Prieto project inc< rporates studies of the geologic, hydrogeologic, geochemical, and geophysical settings oE the geothermal field, as well at investigations of its structural, reservoir engineering, and subsidence characteristics. The primary objective of the program is to develop an understanding of the geoiogic setting and hydro-thermal circulation of this geothermal syptem.
Cerro Prieto is considered an ideal system for studying the long-term response of a liquid-dominated geothermal field in continuous production. Much of the information obtained here will be applicable to the development of geothermal resources in similar geologic settings such *s the Kexicali Valley, Mexico, and the Imperii.. Valley, California. Thic information will be useful for geo thermal development in other parts of the world.
FISCAL YEAH 1979 ACTIVITIES
Most of the results obtained since :he beginning of this interiuiLional project in i977 have been published in the Proceedings of the First
Symposium on th* Cerro Fricto Field, San Diego* California, September 20-22, 1976 (Lawrence Berkeley Laboratory, 1978) or will be included in those of the Second Symposium, Hexicali, Ksja California, October 17-19, 1979, expected to be issued by CFE in the latter part of I960.
Further details of the activities and results described below are discussed elsewhere in this volune.
Geology
Dsta from surface geophysical surveys, well sauple descriptions and analysis, and geophysical well logs were used to obtain new insights into the stratigraphy, structure, hydrothemal alteration, reservoir properties, and geohydrology of the area.
Lyons and van de Kemp {1980) completed a com-preheosive geologic study using geophysical well logs and surface geophysical results, in addition to borehole lithology and aineralogy- They developed a new regional depositional model which indicates the reservoir rocks occupy a transition zoae front an upper delta plain environment to the east to a marine environment wear o-- the field. They recognised three principal types of faults: (I) alder faults offsetting oaly the deeper part of the geologic section, (2) reactived older faults with smaller offset or .evereed sense of offset above sone horizon, and (3) young faults offsetting the entire section. Soae of the faults previously identified by other workers were not recognized by thee. For examplA, the major feult previously assumed to run almost 4long the railroad track Otichoacan fault) seems not to coatiune farther south than about well H-I03.
The vertical transition from unconsolidated and semiconsolidated to consolidated sediments, the so-called A/S boundary, was found not to occur at one stratigrapbic horizon, but cuts across the sedimentary strata suggesting localized post-depositional alteration.
Vonder Haar and Howard (1979) hypothesize that where the important northwest-southeast Michoacan fault obliquely intersects shorter northeast-southwest trending faults (e.g., near H-103) there is greater permeability and increased natural convec-tive fluid flow. In addition, a shear zone near wells H-48, H-91, and H-101 seems to enhance the distribution of The geothermal fluids away fros the major northwest-southeast faults, thus increasing the recharge capacity of the field.
By cieans of petrological and geocheaical studies of well cuttings and cores, Elders et al. (1980) have confirmed the existence in the reservoir of a systematic sequence of temperature-dependent hydrothermal minerals (Figure 4 ) . These are formed by progressive dehydration, 'ccarbona-tion, and exchange reactions. Minor variations in mineral assemblages in different parts of the systems were observed. These are due to differences i-- permeability, pCC<2 and in soae cases to localized episodic temperature fluctuations.
The thermal tnetamorphism of organic particles (phytoclasts) found in Cerro Prieto sediaentary

MINERAL ZONATUN M CERRO PRETO SAWSTCNES
Figure ^. Mineral zoaatioo in Cerro Prieto sandstone• (from Elders et a l . , 1980). (UL 804-9162)
rocka indicate that the measured temperatures in the deeper portions of the geotherms I wells are equilibrium reservoir tenperatures (Elders et a l . , 1980).
Paleomagnetic studies of rocks froai the Cerro Prieto volcano suggested that it originated about 110,000 years B.P., and that voleanism continued intermittently until about 10,000 years ago (de Boer, 1979).
Geophysics
During 1979 CFE and LBL and their contractors ccntinued surface geophysical surveys throughout the area. LBL concentrated its efforts on improving the structural aodel of the field and using resistivity, gravity, and seisaicity to monitor changes due to fluid production. On the other haad, CFE extended exploration surveys to other potentially promising areas in the Hexicali Valley.
Based on independent dipole-dipole dc resistivity and magnetotelluric surveys performed and interpreted v-y LBL, the reservoir rocks currently exploited show up as more resistive (4 ohm-a) than the surrounding rock (*—1.5 ohm-ia). Although this is contrary to the widely held theory that hot reservoir rocks will appear as low resistivity zones, a correlation between surface resistivity data and borehole geologic data shows that the higher resistivities can be accounted for by hydro-thermal metamorphian that has reduced the porosity of the mud and shale units (Wilt et al., 1979; Goubau et al., 1979). Surface Measurements have also provided subsurface information that t iy help CFE in planning step-out drilling.
A repeat precision gravity survey at aonuaents over and around the field was aade in 1979 (Graonell et al., 1979). Two-thirds of the station observations have an estim«f.ed error less than 9 gal, sufficient to permit detection cf mass changes tatting place within 2 km of the surface. To within
the accuracy of the 1970 and 1979 seta of measurements no mmsm changes are evident. This suggests that over the 2-year period the circulation system remained in approximate dyr \alc equilibrium.
Ccocheai stry
Based GO chemical and isotopic studies of the Cerro Prieto brines, Trueadell et al. (1979) conclude that the fluids derive from * mixture of partially evaporated mca ttazer and Colorado River waters, which were extensively altered composition-ally by higb-tem-perature reactions involving the reservoir rocka (Figure 5). Their results also have shown tact exploitation of the field has greatly changed the pressure, temperature, state, and chemistry of the aquifer fluids.
A eeochemical study of the different surface manifestations in the Cerro Prieto field (Elders et al., 1980) suggest«; (1) there is a close relationship between the hot springs in the area and the deep geothermal reservoir, and (2) there has been a change in the spring's chemical characteristics strce 1968 in response to the large-scale fluid extraction from the field.
Subsidence
Last year the first-order leveling and precise horizontal-control networks established in 1976 were surveyed for the second rime. The comparison of the measurements from the first and second vertical surveys indicated localized vertical subsidence and uplifts in the area, ranging from -28.0 mm to +33.0 mm (Garcia and Hendez, 1979).
Trilateration surveys indicated that horizontal ground-surface movement was also occurring (Figure 6). The portion of the locz.1 net covering the geo-thermal production zone showed a northwest-southeast contraction chat may be as great as 31 JJ strain/yr. Movements in the area surrounding the production

CHLOftOE, mgJkg 50.000 100.000
-1 1 T - 1 | • • • > — ' • • " ! - i — • ' -
4 -/SURFACE EVAPORATWN /
2 " / / ~ 0 QOCEAN /
2 / 6.000 10.000
7
i -6
•6
•10
.18
1 D SHIFT /
— MAIN/AQUIFER / - 2g5*c
UPPER/AOUIFER /<260'C
8
9
•10
S.11.19A.-., 421A.25
n ' »3il . 8.14. «35
20.31A« 29
- " ' -26 12
'MIXTURES •11 -•14 •14
, , . 1 .
Figure 5. Isotopic composition an'i chloride content of Cerro Prieto reservoir, Colorado River and ocean waters, showing th« effect of surface evaporation, mixture, and high temperature reactions (from Truesdell et al., 1979). <XRL 804-9163)
zone are small and show a northeast-southwest extension of about 0.7 p strain/yr. The regional net resurvey showed a saall expansion on all axes with a naxinum of about 0.7 V strain/yr in a northeast-southwest direction (Massey, 1979).
leservor lavjjnoeriag
Duriag fiscal year 1979 LBL advised CFB ia their wall testis* program, performed * awaber of field casta, and assisted ia interpreting the data obtained. The rcealts froa two-rate flow sad interference tests confirmed that permeability of the reaer-roir is am the order of teas of adliidareiea.
Ill carried oat a two-rate flow test in one of the wells esiag a eowaholc tool modified by Sacdie Laboracoriet (Figure 7)- The test daeoeatrated that the modified high-temperature tools could operjte at temperatures of ap to 3*0°C for 12-hr periods. The aaTJaw dcwahole time aeaas to he determined by the failare of the O-rings, and not of the clocks (Aloaso et al., 1979).
Physical and —chaaical properties of cores continued to be determined under high temperature and pressure conditions (aeou-Saycd aad Schati) 1979). Simplified models of the field were used to determine its boundary condition and recharge rates and to simulate ita behavior during production and injection.
lainicetion
In August 1979 CF£ began reiajection of untreated 16S°C brines into well B > 9 . The test is being carefully moai cored*. Dowahole mwasurarents in H-9 are periodically carried out. Pressure and temperature of neighboring proaaciag wells are being monitored to detect any changes resulting from the test.
Figure 6. Electronic distance measurement equipment being used at a horizontal control station of the local network (USGS photograph). (BBC 784-4885)
Figure 7. Technician cbeekiof inttrtmentmtion during a well test. (SBC 782-2269)

35
Because • 30 MW low-pressure turbine will be on line in 1982, large aaounts of 100°C brines superssturated with silica will then be arailable for reinjection. to avoid aajor probleas in the pipes and reservoir* the excess silica will have to be eliminated before reinjection.
In support of these future reinjection operations under low temperature conditions, Veres et al. (I960) carried out laboratory experiments and theoretical calculations to evaluate different brine treatment processes. They found that part of the dissolved silics quickly polymerizes to form suspended colloidal silica. This colloidal silica will flocculate and settle rapidly by raising the pH and stirring the brine. The theoretical equilibrium calculations indicated that tbe increase of pH of the brine to remove silica might cause some prec pitation of csrbonstes. If this occurs the problem could be eliminated mt reasonable co*t*
Mexico has begun pilot plant-sesle tests to determine the isothermal (-~IO0DC) rate of ailicm polymerization for different pH values. Also, sedimentation tests with and without flocculants are being conducted.
Conferences
During this fiscal year no symposium ope u to the general public was held. However, a number of internal planning and technical meetings between Mexican and U.S. scientists end engineers were organized to diecuss the latest results snd future directions of the coorper&tive program.
The proceedings of thi- first symposium, in Spanish and English, were issued as an LBL report (Lawrence Berkeley Laboratory, 197B) and will be published in a special issue of tbe journal Geothennics.
PLANNED ACTIVITIES FOR FISCAL YEAR i980
LBL will continue to coordinate the U.S. activities at Cerro Prieto under che CFE/DOE cooperative program. Discussions w*ll be held between DOE/ LBL and CFE to extend the present agreement to one of the geothermal areas of central Mexico, possibly Los Azufres field in the state of Michoacan.
The geological model of the Cerro Prieto field will be updated in Light of new data from wells, field surveys, and laboratory work, which will be carried out during the next year. The interpretation of well logs, analysis of cores, and drill cuttings will continue.
The dipole-dipole and precision gravity networks will be resu.'veyed for the third time to maintain tha .monitoring activities within the production area. Additional magnetotelluric measurements will bi* carried out. The induced seismicity array will be refurbished by the installation of improved downhole geophones.
The geoch^mical model to explain the different processes occurring in the reservoir as well as to determine itn evolution and recharge will be developed further based on the analysis of reservoir rocks and fluids.
The regional and local horizontal networks will be resurveyed to monitor crustal deformations related to tectonic and man-made activities.
Improved high-temperature downhole tools will be used in wall testa to father additional data on tbe characteristics of individual wells and of the different geotbermal aquifers. The otaserieal simulation of field behavior will continue at an accelerated pace in view of tbe need to estimate the lone-term capacity of tbe field and to predict the effect* on tbe reservoir of large-scale reinjecttoo of waste brines.
Internal technical meetings with DOE and CFE will be held periodically to review results and plan future activities. On October 17-19, 1979, the Second Symposium oa the Cerro Prieto Ceothermal Field was held in Kexiceli. Preparations for the Third Symposium (San Francisco, March 1981) will begin during this fiscal year.
UFEKEBCE5 CITED
Abou-Sayed, A. t and Schatz, J. F., 1979. Physical and mechanical properties of cores from the Cerro Prieto geothermal field, n_ Abstracts, Second Symposium on the Cerro Prieto Ctithermal Field. Mexiealt, Comtsido Federal de Electricidad-
Alonso E., H., Dominguez A., B., Lippnacn, H. .«., Holinar C., K., Scbroeder, E. E. ( and Hitherspoon, P. A., 1979. Update of reservoir engineering activities at Cerro Prieto. Berkeley, Lawrence Berkeley Laboratory, LBL-10209-
de Boer, J., 1979. Peleomegoetic daring of the Cerro Prieto volcano, io_ Abstracts, Second Symposium on the Cerro Prieto Geothermal Field. Mexicali, Comision Federal de Electricidsd.
Elders, U. A., Hoagland, I. it., Vallette, J. N., Williams, A., Barker, C., snd Collier, P., 1980. A comprehensive study of samples from geothereal reservoirs: petrology and geochemistry of subsurface and surfsee samples from the Cerro Prieto geothensal field, Baja California, Mexico. University of California at Liverside (report in press).
Hernandez G., J. L., 1979. Algunas precisiones f„n torno a la Onidad 5. Boletin Instituto Investigaciooes Electricas, v. 3, no. 10, p. 7-10.
Hurtado, R., Diaz, R-, Mercado, S., Garibaldi F., Cortez, C , and Fausto, Z. J., 1979. B, ..ne treatment for reinjection and reinjection tests without treatment, n Abstracts, Second Symposium on t.te Cerro Prieto geothermal field. Mexicali, Cooision Federal de Electricitfad.
Garcia, J. R., and Hendez, V. P., 1979. First-order leveling surveys at Cerro Prieto, in Abstracts, Second Synposiua on the Cerro Prieto geotheraal field. Mexicali, Comision Federal de Electricidad.
Goubau, W. M-, Stark, M., Gaable, T. D., Goldstein, N. E., and Miracky, R., 1979, Magnetotelluric studies at Cerro Prieto, J£ Abstracts, Second Symposium on the Cerro Prieto Geothernial Field. Kexicali, Comision Federal de Electricidad.
Crannell, R. B-, Tainan, D. W-, Aronstaa, P., Clover, R. C , Leggewie, R. H., Eppink, J., and KrolJ, R., 1979. Precision gravity

36
measurements in the Ctrro Prieto geotbermal area, ii± Abstracts, Second Syaposiva on the Cerro Prieto Geotherasl Fie ld . Mexicali, Coaision Federal de Electricidad.
Lawrence Berkeley Laboratory, 1978. Proceedings, First Symposium on the Cerro Prieto Ceotbermal Field, Baja California, Mexico, September 20-22, 1978, San Diego, California, lerkeley, Lawrence Berkeley Laboratory, LBL-709S.
Lyons, D. J . , and van de Keep, P. C , 1980. Subsurface geological and geophysical study of the Cerro Prieto geothenul f i e l d . Berkeley, Lawrence Berkeley Laboratory, LSW0540.
Manon M.t A. and Guiza L. , J . , 1979. EL proyecto de cptiniz^cion del aprovechamiento de fluidoa geoter»i:-.-i en opimoc. de dos eapertos. Boletin Inst i tuto Icvestigaciones Eleccricas, v. 3 , no. 4, p. 22.
Massey, 6. L. , 1979. Measured crustal s tra in , Cerro Pr^to geothermal f i e l d , Baja California, Mexico, J£ Abstracts, Second Symposium on the Cerro Prieto Geotheraal Field. Kexicali , Cotnisidn Federal de Electricidad.
Txuesdell, A. h., Nehring, H. L. , Thompson, J . M., C^plen, T. R., DesHsrais, D. J . , Janik, C. J . ,
aad Meal, D. C , 1979. C l a s s i c a l studies of the Cerro Prieto reservoir ( l a i d , in Abstracts, Second Syaaosiiai est the Cerro Prieto Caotacraal Fie ld . Mexieali, Coaisioa F « 4 e » l de ETtctriciaae.
Voadcr Haar, S. a a Howard, J . a . , 1979. l a t e r -sect iag fault* and saadatoaa stratigraphy at the i^rro Prieto geotbermal f i e l d , in Abstracts, Second Syamoeivmi oa the Cerro Frieto Ceotacraal Fie ld . Mexieali, Coaiaioo Federal de Electricidad.
Veres, 0 . , Tsao, L . , and I g l e s i a s , E . t 1980. eh—is try of s i l i c a i o Cerro Prieto brines. Berkeley, Lawrence Berkeley Laboratory, LSL-19166.
H i l t , M. J . mad Goldstein, M. » . , 1979. Ses ia-t i v i t y aoaitoriag at Cerro Prieto, in Abstracts, Second Syaaosiiai on the Cerro Prieto Geotheraal Fie ld . Mexicali, Coaision Federal de Clectricidad.
Witherseooo, P. A. , alonso E . s • . , Lippaann, H. J.j Maaba H., A. , ead Wolleaber "_:. A., 197$. Hexicaa-aacricaa Cooperative Program at the Cerro Prieto geotheraal f i e l d , lerkeley , Lawrence Berkeley Laboratory, LBL-7095.
REGIONAL GEOLOGIC SETTING OF THE CERRO PRIETO GEOTHERMAL H R O S. P. Vender Hear and j . H. Howard
INTRODUCTION
A synthesis if geological information on the Salt-on Trough froa the Sal ton Sea region south to the Upper G u K of California v»;i completed during the past fiscal year-
Satellite photography and field research established important relationships between n probable deep heat source, fluid migration, and aagnitude of the geothenaal fields (yonder Hear and Puente C , 1979a; Meidav and Howard, 19/9). Our understanding of regional vclcanism and subsurface stratigraphy was enhanced by palecaagnetic and micronaleontology studies. Merging of concepts on San Andreas type wrench faulting with oceanic transform fault theory (Vonder Hear and Puente C , 1979b) provided insight into tiie apparently significant role of northeast-southwest trending cross-faults in geotheraal fields in the Scltoo Trough, including Cerro Prieto.
THE YEAR'S ACTIVITIES
The wedge-shaped region termed the Salton Trough extends from the Salton Sea to the uppermost Gulf of California (Figure 1) and is noted for recent volcaniro, strike-slip faulting and geother-mal fields. This region is bounded on the east by the poorly defined Craton Margin Lineament (see Figure 2) and the Sierra Pinacate voUanics. On the west, the San Felipe basin-bounding fault rone and the combined Elsinore/San Jacinto fsult zones form e. sharp boundary. Slicing through tba trough are the Cerro Prieto fault, the Imperial fault and still other faults. Faults in the trough are best conceived of as hybrid types having features of both San Andreas style wrench faults and oceanic
transform faults. Earlier idea* of passive pull-apart *ins or transform faults that leak aagaa (Elde. et el., 1972) have bren refined.
?eult blocks between the Cerro Prieto and Imperial faults appear to be I to 4 km on a tide. Oblique intersections of northeast-southwest trend-in» fault shear zones with these two major faults
Figure 1. Regional geology cf the Cerro Frieto geo-thermal field showing major faults and sites of paleomagnetic studies (see Vender Baar, HoMe, and Puente C., 1979). (XBL 801-6718)

SALTON TROUGH FAULTING
> ^ . ^ *$L~z- : * ^ _ - * C - .35^ -^v^
Figure 2. Compilation of faults in the Salton Tough showing the Ccrro Prieto Lineaaent as a major hybrlu transform faul t zone. Note the prevalent and long northwest-southeast trending faul ts with such shorter i n t e r s e c t i n g f au l t s of northeast-southwest trends. Faults indicated by l i n e s , dashed where discontinuous or subsurface; ? ind ica tes uncertain location. Cri t ica l data evaluation frca published work; S.S. ind ica tes Salton Sea: C.P. i s the Cerro Prieto Roothermal flrea (from Yonder Haar and Puente C , 1979a).
(XBL 797-7515A)
indicate sites for the moat productive wells. In addition, these cross-cutting northeast-southwest faults help move the convective fluid flow away from the deep penetrating hybrid transforsi faults. Thus the areal extent of the rapid recharge zone is increased.
Of major importance to the regional stratigraphy was the discovery of a aid-Tertiary (approximately 15 m.y. old) foraainifer Cassigerinella chipolensis (Figure 3 ) . This plank tonic urine
Figure 3. Cassigerinella chipolenais; a mid-Tertiary planktonic nicrofossil found in Cerro Prieto geothermal well cuttings (see Cotton and Vonder Haar, 1979). Souming electron miciCp>»o-tograph provided by J. L. Lamb, Exxon Production Research; actual diameter of the nicrofossil is 0.7 mm. (XEB 790-13447)
microfossil was found in well cuttings fro* the Ccrro Prieto geotheraal field. These specinens are net laboratory contaminates and nave not been found in the drilling mud (Cotton and Vonder Haar, 1980). If the presence of Cassigerinella chipolensis is confirmed, the current conceptualization of the opening cf the Culf of California after mid-Tertiary, only 11 million years ago, and "he California Pacific roast aid-Tertiary history vn.ll need L O be revised.
Timing of geologic events in the region and the variation in volcanisa were clarified by paleo-magnetic studies. Figure 4 illustrates polar excursion paths and data for "" e Salton Buttes, Crater Elegante, and Cerro Prieto. Deviating ther-momagnetic directions in volcanism representing the second and fifth or sixth pulse of volcanisra suggest that Cerro Prieto originated approximately 110,000 years B.P. and continued to be active intermittently ontil about 10,000 years ago (de Boer and Vonder Haar, 1980). The Crater Elegante, Salton Buttes, and Cerro Prieto poles differ enough to support the conclusion chat volcanic activity throughout che trough was noc contemporaneous.
Analogs to the Cerro Prieto region were investigated in relation to both early rifting phases (see Vonder Haar and Howard, 1978) and to transform faulting. In addition to the Culf of California basin studies (Lonsdale and Lawver, 1979), the in-situ structural observations along Transform fault "A" in the >AM0US area of the Mid-Atlantic ridge provided clear insights into tectonism (see Figure 5). Geophysical studies and well drilling in the Cerro Prieto region furnished a model that compared favorably with these analogs if the increased deltaic sedimentation rate and thickening continental basement near Cerro Prieto are considered.
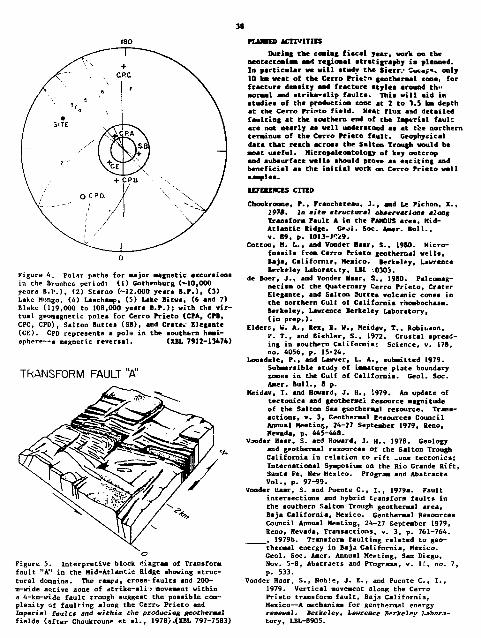
38
(80 PLalKD ACTIVITIES
Figure 6. Polar paths for major magnetic excursion* in the Brunhes period: (I) Gothenburg (—10,OCX) years B.p.), (2) Starno (-12.000 years B.P.), (3) Lake Mungo, (4) Laschamp, (5) Lake Bitwa, (6 and 7) Blake (119,000 to 108,000 yeara B.P.); with the virtual geomagnetic poles for Cerro Prieto (CPA, CPB, CPC, CPD), Salton Buttes (SB), and Crate* Elegante (CE). CPD represents a poll* in the southern hem-sphere—a magnetic reverssl. (XBL 7912-13474)
TRANSFORM FAULT "A"
\ o
Figure 5. Interpretive block diagram of Transform fault "A" in the Mid-Atlantic Ridge showing structural domains. The rampa, cross-faults and 200-m-wide active zone of *trike-sli\» movement within a 4-km-wide fault trough suggest the possible complexity of faulting along the Cerro Prieto and ZnperiaZ rattle* aad within the producing geothermal fields (after Choukroune et al., 1978) .(XBL 797-7583)
During the coming fiscal year, work on the neotectonis* and regional stratigraphy is planned. Zn particular we will study the Sierra Cucaf«* only 10 km weat of the Cerro Priero geothermal xone, for fracture density and fracture atyles around this normal and strike-slip faults. This will aid in atudiea of the production xone at 2 to 3.5 km depth at the Cerro Prieto field. Heat flux and detailed faulting at the southern end of the Imperial fault are not nearly as well understood as at the northern terminus of the Cerro Prieto fault. Geophysical data that reach across the Salton Trough would be •oat useful. Hicropaleomtology of key outcrop and subsurface wells should prove as exciting and beneficial as the initial work on Cerro Prieto well saaples.
REFERENCES CITED
Choukroune, P., Francheteau, J.v and Le Pichon, X., 1978. la mitu structural observation* along Transform Fault A in the PAH0US area, Mid-Atlantic Ridge. O o i . Soc. Amer. Bull., v. 89, p. 10I3-IT29.
Cotton, H. L.. and Vonder Haar, S., 1980. Micro-fossils from Cerro Prieto geotheraal welts, Baja, California, Mexico. Berkeley, Lawrence Berkeley Laboratory, LBL .0303.
de Boer, J., and Vonder Hear, S., 1980. Palearnsg-netism of the Quaternary Cerro Prieto, Crater Elegante, and Salton Suttes volcanic cones in the northern Gulf of California rhombochasm. Berkeley, Lawrence Berkeley Laboratory, (in prep.).
Elders, W. A., Rex, R. U., Meidav, T., Robiuson, P. T. p and Biehler, S., 1972. Crustal spread-ing in southern California: Science, v. 178, no. 4056, p. 15-24.
Lonsdale, P., and Lawver, L. A., submitted 1979. Submersible study of immature plate boundary zones in the Gulf of California. Geol. Soc. Amer. Bull., 8 p.
Meidav, T. and Howard, J. H., '.979. An update of tectonics and geotbermsl resource magnitude of the Salton Sea geothermal resource. Transactions, v. 3, Geothermal Resources Council Annual Meeting, 24-27 September 1979, Reno, Hevada, p. 445-448.
Vonder Haar, S. acd Howard, J. H., 1978. Geology and geothermal resources of the Salton Trough California in relation to rift -one tectonics; International Symposium an the Rio Grande Rift, Santa Fe, Hew Mexico. Program and Abstracts Vol., p. 97-99.
Vonder Ilasr, S. and Puente C , I., 1979a. Fault intersections and hybrid transform faults in the southern Salton Trough geothermal area, Baja California, Mexico. Geothermal Resources Council Annual Meeting, 24-27 September 1979, Reno, Nevada, Transactions, v. 3, p. 761-764. , 1979b. Transform faulting related to geothermal energy in Baja California, Mexico. Geol. Soc. Amer. Annual Meeting, San Diego, Nov. 5-8, Abstracts and Programs, v. II, no. 7, p. 533.
Vonder Haar, S., Nob'-;, J. E., and Puente C , I., 1979. Vertical novement along the Cerro Prieto transform fault, Baja California, Mexico—A nechanism for geothernal energy renewal. Berkeley, Lawrence Berkeley 'Laboratory, LBL-8905.

39
SUtSURFACE GEOLOGY OF THE CBMO PMETO CfOTHBtMAl HUD 5. P. Vonder Haar, J. Noble, M. T. O'Brien, and J. H. Howard
INTRODUCTION
A subsurface evaluation of the Cerro Frieto geotheraal field was undertaken Co f'irnitb information for uae in reaervoir simulation models. Structure, stratigraphy, hydrothermal alteration and reiervoir properties were studied. Data used included well logs, well cuttings and cores, and surface geophysical surveys. Detailed information ?r<«5 reports by Ciders et al. (1979), and Lyou* »*nd van de Kamp (1980), were integrated into ongoing Cerro Prieto geothermal research at LSL, The approsch taken in this summary and the concepts developed for Cerro Frieto are applicable to geotheraal exploration and reservoir development in other regions.
THIS YEAR'S ACTIVITIES
Structural features at Cerru r.ieto are dominated by a major northeast-southwest serine
•lip fault zone termed cms Cerro Prieto fault (Vom*er laar and Fneata, C , -9«0) emd cross-cutting north-northeast to south-sou tfM*at faults. Figure 1 illustrates these faults bases! on revised interpretations of well log correlation*, linear surface features, thermal spring location*, teismic reflection and refraction profiles, and gravity and magnetic maps. Faulting ia complex in term* of the history of episodic fault movement*. Only dip-slip displacement can be recognised, whereas there may alao be a significant lateral component.
A variety of aubsurface cress section* have bern compiled. One useful style ia baaed on litho-f«.:iee analysis (Figure 2) of mechanical well logs in conjunction with cutting and core (Figure 3) descriptions. Based on litbofaciea analysis and geochemical data it was possible to delineate den-sificatic^i and hydrothermally altered cones and temperature-sensitive hydrothermal mineral horizons
/ i ffi hv >\ n iA*y/ tit. , '*S
Figure 1. Index nap for the Cerro Prieto geothemal field showing wells, faulting, seisuic reflection lines and geologic cross sections. (XBX 801-6753)

•5000 S
L-9000 M t t m F«tl
Figure 2. Lithofaciea cross-sect ion IV-lV spanning the aouthern portion of the gaothanul f i i l d . Correlat ion markers in thae de l t a ic un i t s are sparse. Class I contain* approximately 902 sandstone grading down to CLass V, which i s predominantly s i l ta tones and shales (see Lyons and van d« Kaap, 1979). (XBL 801-6731A)

41
M-21 l (SM9ln 14% fttcovtry
M-15 704-70* «> 73% feewtrr 35% I
M-20 t l l - I W a i 9C% RKffMfj
IH I IOW-lKMn
I
T ll
M-5 S00 -506 m 21% Rtcovtry
It M-5 70t-709m
76%Rieowy
Tr
1 72%Rtcm>y
M-9 Sl«-824m 62% Rtcovtry
T
M-ll 700-705m 73% Rtcovtry
T ±1
±
l U M-5 909-9 l9n 20%»covwx
J. IH5K>90-IO*Sn 75%IHeovtry
I X
+ -Ui
fF I I
M-B * l %
T
1 U M-2C WO-anm
23% «
l l U-5HOO-nOSm 5»% B l e w
4> = 1*38 1369-137 Sm 27% ftscowsry
a U-38 !?I3-Cl7m 44% fttcovarj
a grttniih grty sand
|g:;j|j CoffM colored plottic ctay
fijjjl Grawl and cong(om«nl«
^ ^ Gr«y attt l«
11 I | Grey cloy
Quartz Mndatono
Figure 3. TT11 —— n JI of rock types recovered by coring froai Cerro Frieto geotherul veils. Vote the abundance of deltaic sandstone and the tranaicion near 700 m depth froa sediment co hydrothenaally altered rock. Muabera next to the cores, such as 0.62, indicate the length in meters of core pieces recovered. (XBL 7910-13058)

(Figure 4) in order to estimate reservoir tai ture and flow characteriatiea. Coatowr aape of reacrvoir propertica auch aa reeietivity (Figure 5) are available for ua* i* docmmemtimg somewhat subtle ahifta in sediment type, porosity and thua fluid flow within the reacrvoir area.
Studies of the corea and cuttings confined the pretence of aicrofoaaila in portiona of the field, aa shown in Table 1 (Cotton end Yonder laar, 1979). In addition to being uacful paltoenviron-•ental indicators, theae carbonate and silica fos-sili substantiate our alteration hypothesis of localized and selective reaoval of *edimeate within the densified reaervoir unite. Secondary poroeity is commonplace, Poroaity ahifta are also apparent in density and porcaity veraua depth plota aa ehown in Figure 6. Dramatic viaual confiraation of poroaity end peraeability clogging, uaing scanning electron microscopy, (Figure 7) baa been related to both the x-ray diffraction work and the downhole aechanical properties.
Mean af A/a sad Tea ef MatemersMc 2mm
Figure 5. Three-dimensional computer presentation of a capping type doaal aurface in the Cerro Prieto geotheraal field. Thia aurface represents the mean depth of the unconsolidated sediment to rock contact (Puente C. and de la Pena L., 1980); and the top of the metamorphic zone baaed on hydro thermal mineral alterations (data from Elders et al., 1979).
( M L 803-6851)
Figure 4. Map of the depth below which ahale resia* tivitiea exceed 5 obar-m (top of hign-reaiativity •halea). Contours are in feet. ( O L 801-672?;
Ml 27 Porosity (%}
SO 40 30 20 10 0 i i — i 1 —
1
\ "
• : « • "
e rK t , • -
o 2 *¥f :%• V • ,s -1. • • . • • •: •• •
• _ • • • •*• • . -
^ — • Sond
-
• ' • Shale
1.9 2.65 2.15 2A Density (am/cc)
F'gure 6. Plot of porosity and density versus •iepth for well H-127, determined from well logs. Some sandstone porosities in the altered zone at depth are even higher than those above the A/B boundary. These higher porosity sandstones inter-bedded with metamorphosed, low density shales imply secondary porosity that contributes to the reservoir *one. (XBL 802-6769)

«
Figure 7. Scanning electron aicrophotograph of • core chip from veil M-38 at 1372 m below the surface; field oi view actotm the photograph is 100 urn (=0.1 mra). This sample lies within the zone of the first occurrence of prehnite (280°C) defined by Elders et a], (1979). Note the variety of claylike minera s, leached crystal faces and new crystal faces. (XBB 797-9451)
PLANNED ACTIVITIES
In fiscal year 1980, we will clarify geological reservoir features of the Cerro Prieto geo-therraal field by comparing them with geophysical data ind regional groundwater flow concepts. In particular we will relate the role of secondary porosity and deeper fracture flow in metamorphosed deltaic rocks to tranBmissivity and sto'-^ivity. A geologic model will be confirmed and tested for prediction of reservoir behavior and production characteristics.
SECONDARY POROSITY STUDIES
Secondary sandstone porosity extends the depth range for effective sandstone porosity far below the depth limit for effective primary porosity. Generation and primary nigration of geofluids occurs mainly below the range of effective primary porosity. The path of primary migration and the site of accumulation of geofluids are, therefore, commonly controlled by the distribution of secondary porosity.
The reservoir aspects of fields producing from secondary sandstone porosity more closely resemble carbonate reservoirs than fields with primary sandstone porosity. The distribution of secondary porosity in a sandstone formation may
aot show a direct relationship with depositional lithofacies or burial history and can be difficult to predict with coavsatioaal subsurface methods. However, details* geologic and petrologic analysis of the factors that control the occurrence of secondary porosity often greatly enhance the understanding and prediction of its distribution. Sandstone reservoirs with secondary porosity have special problem* but they also offer special opportunities fur both the exploretionist and the exploitationist. It is necessary, firstly, to recognise the secondary nature of the porosity of these reservoirs; secondly! to interpret controls and tiaing of the origin of their porosity; thirdly, to evaluate any factors that nay have played a role in preserving this porosity; and fourthly, to survey the existing pore geometry in order to optiaize the methods and economics of finding and recovering geofluids.
Ths detailed analyses of the penological attributes of secondary porosity will require the use of advanced analytical techniques, auch as cathode luminescence petrography, scanning electron microscopy, pore csst examination, aicroprobe analysis, and •table isotope analysis. In aany sandstones, an aaount of important information will be obtained siaply by careful and methodical use of conventional petrographic microscopy.
The results of these detailed analyses will be integrated into the geologic model of the Cerro Prieto geothermal field.
k TERENCES
Cotton, M. L., and Vonder Haar, S., 1979. Micro-fossils from Cerro Prieto geothermal wells, Baja California, Mexico. Berkeley, Lawrence Berkeley Laboratory, LBL-10303.
Elders, W. A., Hoagland, J. R., Wiliians, A., Barker, C., Vatette, J. K-, and Collier, P., 1979. A study of Cerro Prieta geotherraal well samples. University of Califorr*2 Riverside Publication (final report ii preparation).
Lyons, D. J., and van de Kanp, P. C , 1980. Subsurface geological and geophysical study of the Cerro Prieto geothermal field. Berkeley, Lawrence Berkeley Laboratory, LBL-10540.
Vonder Haar, S. P., and Puente, C , I., 1980. Fault intersection and hybrid transform faults in the Southern Sal ton Though geotheroal area, Baja Cal if ornia, tiexico. Trans. Geothermal Resources Council, Annual Meeting, v. 3, 24-27 September, 1979, Reno, Nevada, p. 761-764.
Puente C. t I. and de la Pena L., 1979. Geological model of the Cerro Pri«'to geothermal field, in Proceedings of che Second Symposium on the Cerro Prieto geothenaal field. Mexicali, Comision Federal de Electricidad.

44
NUMERICAL MODELING STUDIES OF THE CBtftO PMETO K 3 A V 1 M M. J. Lippmann and K. P. Coyal
INTK0DUCT10M
The Cerro Frieto geotbemal field is presently producing 150 Htf of electric power. In ^ * i l 1979 the capacity of the power plant wee doubled (from 75 to 150 HW) as two new units case into operation. Consequently,; the fluid production rate has increased froa. about 2800 to 4200 tonnes p*r hour. Bernejo et al. (1979) estimate that about 1.7 -. 10 s
tonnes of steam-brine nixture has been estr -cted from the field ss of late 1978.
Improved estimates c'. the total capacity vf the field will be essential in studying the feasibility of further developnents of the are.'.
A realistic geohyurological model is of fundamental importance in estimating the capacity and longevity of the Cerro Frieto field. A ounce* of papers presented at the 'Jeeocd Svmposiiaa of the Cerro Prieto Held (October 17-19, 1979, Mexicali, Daja California, Mexico) discussed the various efforts under way to establish the dimensions, structure and stratigraphy of the field, the properties and interconnection between the various aquifers, and the circulation of fluid snd heat within the geothermal system and across its boundaries.
ACTIVITIES IN FISCAL YEAR 1979
During this yesr the ;:im of the nodding studies on the Cerro Priffto field were to determine its preproduction recharge and discharge conditions. As a first step, a simplified geological nodel of the system wae developed on the basis of the available data. Then, the heat and mass flow through this model were calculated numerically using a computer program. The location, temperature and strength of tne reservoir recharge and dii barge areas, the thermal and hydraulic boundaries of the model,, and the properties of the different material were varied in an attempt to reproduce the preproduction temperatures given by Mercado (1976), and ~*dera et al. (1978). No efforts were rude to Batch early reservoir pressures since pre-1973 pressure data are only available for few wells in the -etil --l part of the field.
The sources an'', sinks identified by this study could also be usei? for simulating the behavior of the field after 19.'>. However, their characteristics would ch;-"*e due to large-scale production. The mass inflow from the sources into the reservoir is expected to increas? significantly in this open system and a decrease is anticipat-1 at the sinks due to "^cploitstion. In addition, areas surrounding the producing reservoir are also expected to dxain (cold or hot) Fluids in response to the changes in the pressure distribution in the field.
Relevant Work
Knowledge about the recharge and discharge characteristics of the field is essentisl to predict its future behavior. Based on O t a from recent
and earlier etu-Hes, somas of recharge and directions of flow of the recharged flmid may fen inferred. Oafortwev.tely mot nil th* data point to exactly the save xones and directioaa.
On the other hand, no precis* location* at depth ax* available f«r the comes where some of the fluid and he*'., transported across the geothermal reacrvoir find tlteir war/ to the surface. It ia aafe to say that heat fa eondnctnd through the caprock, and that riwids, and heat carried by convection, arc discharged to the aurface along the main fault xoata in the area.
Uaing well temperatures, preesuree, enthalpy, flow data and a^otharaocheadcal correlations of the fluida discharged by the vella, Mercado (1974) developed a hydrogeological model of the Cerre itiefto area. «e postulated that: (I) hot fluida rtcending in the eastern and central zones of the k'ieid flow toward the west, (2) the heat source ia Zv>:ated in the eastern and deeper part of the field, (3) toe reservoir is recharged mainly from the west (in the area of alluvial fans of the Sierra Cucapa) and also to some extent from the east by the underflow of the Colorado liver water. Figures 1 and 2 show the preproduction temperature distributions in the field along two different cross-sections (Hercado, 1976).
i I 3
^0 =3 -$s^\~P'{ -*
,_—--'" ' - J*3 1 i j 1 / '- '"--.__
Figure 1. Preproduction temperature distribution in the reservoir along a southeast-northwest cross-section (adapted from Hercado, 1976).
(XBL 804-7028)
a s s . a s x
Figure 2. Preproduction temperature distribution in the reservoir along a southwest-northeast cross-section (sdapted froa Mercado, 1976).
(XBL 804-7027)

45
According to Truesdell ec al. (1979) the comparison of Measured deuterium content* of the Cerro Prieto geotbermal waters and the interpolated competition of cold Hexicali Valley ground waters suggest that the recharge to the system cooAd have occurred along a narrow cone running from Mckkcali on the north, passing just west of the field and curving northeast to the f . Arenosa on the e^st. This rechsrge frost the vest agreea with part of Mercado's (1976) Model.
Corwin et al. (1979) correlated the dipolar self-potential anomaly detected in the Cerro Prieto area wi th geotheraal activity. They concluded that the surface anomaly could be the result of a vertical fault or fracture zone along which a vertical coatponent of fluid or heat £low exists. Based on these data the hot water upflcv xooe i* distributed along an approximately north-south area passing near well H-48.
Elders et al. (1978) recognised a number of regularly distributed mineral zones in the field by examining cores and drill cuttings. They developed maps indicating depths to the first occurrence of some temperature diagnostic minerals. The mineral distributions suggest that the hottest fluids rose along a north-south trending zone passing near well M-105. This erne is displaced toward the west with respect to the one inferred from the self-potential study (Corwin *t al., 1979).
The isotopic and mineralogic data represent the preproduction condition of th> system, that is before 1973 when large scale exploitation of the field began.
Numerical Computer Program and Methodology
The numerical computer code CCC developed at Lawrence Berkeley Laboratory wa s used in these studies. The program solves the heat and mass flow equations for liquid saturated media. Details on the Integrated Finite Difference Hethod, and on the explicit-implicit iterative procedure used in this program, are given elsewhere (Edwards, 1972; Narasiahan and Witherspoon, 1976; Lippmann et al., 1977).
In all cases the numerical computations were run until a steady-state pressure and temperature distribution was obtained in the simulated system. The compi.ed temperatures were then compared with Mercado's (1976) temperature distributions (Figures ] and 2).
Using these comparisons as a guide, the characteristics of the sources, sinks, and boundary conditions were modified to improve the match. The changes were not arbitrarily made but were based on available geological and reservoir engineering information.
A number of different models were used to reproduce Mercado's preprocjetion temperature distributions. Only the results of two of the cases studied will be discussed here. As will be shown, it was not possible to reach good agreements. We suspect that the simplified geological model and boundary conditions used in the simulations were responsible for some of the poor matches obtained.
Becent studies (Lyons and Tan de stamp, 1960) indicate that the lithology of the field is quite complex, with lithofacies changes controlling largely the fluid flow within the system.
Geological Model
Using the information available in mid-1979, a simplified geological model of Cerro Prieto was developed for use In simulations. The faults believed to be bounding and intersecting the area initially developed by CPE (Cerro Prieto I) are shown on figure 3. Based on these data, the region modeled to reproduce the preproduction conditions of the field was restricted to the area indicated on Figure 4.
Basically, the lithologic column introduced by Abril and Roble (1979) was incorporated in the model (Figure S ) . According to them in tbi* area the column may be subdivided into three units. The upper one (Unit A) consists ot unconsolidated sediments, the middle oae (ffnit B) if consolidated materials, and the lower one (Unit I') of grancdio-ritic and metamorphic rocks. Unit /. acta aa .he leaky caprock of the geothermal system, while Unit C constitute• its impermeable cedrock. Unit Bi overlying the basenent formed by alternating sandstone and shale layers, caf< be divided into five major subunits.
Figure 3. Fault map for the area initially developed at Cerro Prieto (from Vonder r.aar and Howard, 1980). (XBL 804-7025)

46
Figure 4. Plan view oE the area Modeled and aeah used. Contrasting hatchings correspond to different thicknesses of Unit A (unconsolidated sediaents).
(XBL 799-11561)
The top layer Lj coaaiata of sandstone lanaee and shale*. Below Layer Lj ia Layer Lj, which ia characterised by rock* with high coataat of carbonate eaatet. The waeerlyi**; aaaey errata, eaparated hy a ahaly layer; arc the ania geotharaal reaervoira A *nd * at"Cerro Priato.
The total taickaae* of the ssdiaaarery colwaa varies within the Cerro Frieto field. The death to the Mock-f**lt*4 has—eat increase* algaificantlv toward* the east (Foaaeca and taso, 1990). For aiaMlatioa pnrpoaea the top of the bedrock ewa ass w e d to be at a constant depth of 2500 a throughout the aoeeled area.
An iaopach anp of Oait A, baaed oe data provided by CFF., ia give* ia Figwre 6. For the aiaelatioaa the variable tbickaee* of thia anit waa aoeeled aa above ia Figure 4. By aeswaiag constant thickneeeea for the different ewhaaita of Oait B, three baeic litholoaic colaaaa ware used ia the aodel (Figvre 5 ) . It ia believed (A. anion, peraoaal coaaaaicati-vi) that ia the central part of the Cerro Frieto Z an* there is prefereaticl iltdd •ovaawat ia a aortheast-•owthweat directioa da* to pr*a*ace of aorc pemeablt facia* or highly fractared rocka. Thia featare waa iacorporatad ia the aodel a* discussed below.
Mesh Paed ia the Siaalationa
The thrae-diaaaaioaal region etudied waa subdivided into 560 aoeca for elaaeat*). The vertical colwan, 2500 a thick* waa subdivided into
,t
soo Layer L,
1100 Lojer/.g
1300 Rertntoir A
1300 Sftotjf fo/er
I TOO
llOO
1300
1300
1700
| l90O
Figure 5. Basic l i tho log ic colusms used in the model for the areas with different Unit A thicknesses (see Figure 4 ) . (XBL 7910-13037)
^
. . • . J ™ - z I | tiff j , f r
Figure 6. Unit A i&cpach aap. (XBL 804-7026)

47
6 horizontal levels (each having 70 aoaes). A t lowest level (100 level) ii 600 m thick, above it the 200 to 700 levels each 200 • thick, sad the upper level (800 level) is 700 a thick, lhc different thicknesses were needed to account for the different lithologie columns used in the aodel (Figure 5 ) .
Figure 7 depicts the ouaberiag used for the nodes in the 400 level, a siailar nuabering scheae was used in the other levels. In this three-digit systea, the first digit represents the level, while the number of the node ia represented by the other two. Thus, node 81S lies in the 800-level layer and is vertically above nodes 118* 218, 318, 418, 518, 618, and 718. In the horixontal plane, its shape is exactly the isae as that of node 611. Figure 7 shows the northeast-southwest trending high permeability area, representing a coarser facies or a fractured cone in the field. The higher permeable material was restricted to the 400 level only.
Boundary and Initial Conditions
Boundary conditions chat have to be specified in the model are: (1) tyfe of boundaries whether open or closed to heat and sta£« flow, (2) tempera—
Figure 7. Flan view of the mesh used in the computations. Hatched area indicates an area of higher permeability in the 400 level (1400 • depth). Node numbering for the 400 level, and the location of the A-A' and B-B' cross-sectiona are alao ahown.
(XBL 799-11558A)
tares aad eceiewca* at the soaaJariae,, (3) lecatiea aad strsagth of semrces aad siaks, aad (4) taaaera-tarc of flmid aatcriag ta* systaa.
Ia ta* varioa* aodela developed for ta* Carte Fricto I arm* aost of thes* coaditioa* were varied to stady their effect oa the preproaaction tssssara-tare distribution*, aowever, ia both casao discussed here we made the followiag aawsaptioas-. (1) The inflow and oatflow of fluids into sad froa the regioa were aadelad by placiag sources aad siaks ia soa* nodes located at the boaadariee (i.e., aear geologic fsalts). (2) All vertical bouaisrie* war* closed to bast flow. (3) The tow and eottoa husadairies war* held at eaastaat teaoers-tutes. Tar. to* aarfac* wc« assaaed to be at 25°C; the bottom at 150°C. (4) The total aass flow rate across the aodel (froa the soarces towards the siaks) was arbitrarily assaaed to be 2.95 a 10 7
kg/day. This rate is aboat 2.15 tiass the prepro-ductioa discharge of the surface saaufastatioas in the area as resorted by Mercedo (1968). We considered that before 1973 a sigaificaat fraction of the heat aad aass iaf low iato the gaotberaal field rose to the swrface asialy throagh the fault zones.
Hydrostatic pressure sad linaar taaaerature* depth distribution were used mm initial conditions for the systssu
Fluid and Kock Froaertie*
We asauaed that (1) the fluid in the systea was liquid sad had constant properties, and (2) the properties of the solid matrix are inotropic and constant.
For the fluid, we used pure water properties at 250°C. The solid matrix properties are given in Table 1 and are representative of the different lithologies included in the model.
Ho temperature or pressure dependency of the properties was used to reduce Che coat of computations, because we felt that this simplification would not significantly affect the computed steady state temperature distributions. We planned to include temperature and pressure dependencies once an acceptable match between computed and Kercsdo (1976) temperatures waa obtained.
Model 1
In model 1 and in the one discussed later, we considered that the recharge in.' diicharge areas were closely associated with the bonding fault*. We assumed the inflow of fluids into "he system tn be distributed as follows (Table 2).
1. 22Z of the total mass recharge is at 350°C. The »uarces are located in the love: part of Reservoir B (100 level), oesr the intersection of the Hichoacan and Fatzcuaro faults (Figure 3 ) .
2. 612 of the recharge comes from colder water sources located in the upper part of Reservoir B (levels 200 snd 300, at 208°C and 18B°C, respectively), near the southwest region of the system, along the Cerro Prieto fault zone.

•;•»
Tabic 1. Proecrtica us*« for the solid utri*.
Denaity laat Theraal eoaa. latriaaic Material (kf/a?) capacity <J/e>>»ay*C) paiaaakility Poroeity
<J/kx-°C) (••>
Onir. A 2S0C »3S l.f2 x 1 0 S 1 0 - 3 0.30
layer Lj 2650 §25 2.1 x 10* 20 0.10
Layer L 2 2/00 SCO l.»5 x 10 5 S 0.10
Reaarwoir A 2650 82S 2.8 x 10* SO 0.10
Shaly layer 2700 060 1.8S x 10* S 0.10
leserYoir I 2650 82S 2.8 x 10 5 SO 0.10
Highly permeable 26S0 825 2.8 x 10 100 0.10
Table 2. Model 1, location* and charaeterieriea of •Ourcea and ainlts.
SOimCES
Node Maaa flow rate Teaperct'jre (kg/day) C°C)
101 2.5 x 10* 350 110 2.5 x 10* 350 119 1.5 x 10 s 350 264 2.5 x 10 6 208 265 2.5 x 1 0 5 208 266 1.5 x 10⁶ 208 267 1.5 x 10 6 208 268 1.0 x 10 6 201 364 2.5 x 10 6 188 365 2.5 x 10 6 188 366 1.5 x 10 6 188 367 1.5 x 10 6 188 368 1.0 x 10 6 188 608 5.0 x 10 6 250
SINKS
Node Maaa flow rate Node Haas flow rate (kg/day) (kg/day)
527 1.00 x 10 6 727 1.00 x 10 6
536 1.00 x 10 6 736 1.00 x 10⁶ 545 1.00 x 10 6 745 1.00 x 10 6
554 1.00 x 10 6 754 1.00 x 10 6
562 2.00 x 10 6 762 2.00 x 10 6
563 0.50 x 10 6 763 0.50 x 10 6
564 3.50 x 10 6 764 3.50 x 10 6
565 2.75 x 10° 765 2.75 x 10* 566 2.00 x 10 L 766 2.00 x 10 6
3. 172 of inflow of fluid ia concentrated at tb« interaeetion of the Micboaca* feelt and a •ortbaaat-aoutfavtat trending taalt (Figure 3 ) . Tha 250°C aourca (node 6 M > i« located in Layer Lj.
Tba sink* where the flnida leave the system ware distributed around its northwest and southwest cornere. near the iatereection of the Cerro Priato fault and •ortheaat-aootbiMat trending faulti. The diecharge occura through Layer* Lj aad Lj. at lcvela 700 aad 500 respectively* The ainka ware arranged in a aaaner approximately similar to the surface distribution of the geotbemal manifestations in the arsm given by tfercsdo (196B),
The bottoai of the model (2500-m depth) vaa eonaidered to be a constant temperature boondary at 150°C. Thia low value vas uaed to duplicate the temperatures of the regions ev*y froai the hot recharge cooes. .troond the inflow zones the temperatures near the bottom of th« model will be reflecting those of the recharge fluids and not that of the boundary.
The computed steady-state temperatures are described by various temperature distribution naps. The effect of sources and lover perneability layers on the fluid flow can be established by analyzing the isotherms at different depths. The hotter waters entering the system at the deeper levels move in response to the pressure distribution resulting from the sources and sinks located in the model; it tends to move around the less permeable layers.
The isotherms at 1000 m (600 level) and 1400 m (400 level) are given in Figures 8 and 9, respectively. In Figuri. the 251°C isotherm in the nortbeast part reflects the effect of the source in node 608. The high temperatures in the south-central part of the system are caused by the hot

Distance (m)
Figure 8. Model 1. I io themi at the 600-level <1000-a depth). <XBL 804-7033)
Distance (m)
Figure 9. Model 1. Isotherms at the 400-level (1400-m depth). (XBL 804-7034)
water rising; fcroa baaeata. la Fifvrc 9, the iao-tbarae im the eoatheast corner indicate the novaaaat Bad cooliag of the waiter as it flows away froa the 350°C eovrcea. lb* 1*0°C ieothera toward the waat show* the iaflveace of ltS°C sources located ia the 300 level; the 2£0°C ieothera towards the northeast shove that of 250*C aoureea ia the 600 level.
Tbc calculated teaaeratures aloe* the aectioaa A-A* aad a-1" arc shown ia Figures 10 aad 11. Tbeae slots, whea coasared with the teasieratnrea givea ia Fiffarea 1 aad 2, iadicate that ia the soutbaast-aorthwest aectioa, the coaarated taaaers-turea arc higher everywhere except in the area near the ceater of Figure 10. Ia thia region the teaaeraturea aeaa to be dominated by the strength and teaneraturee of tbc aoarcea located at the southeast cor=*i sf the field. A comparison of Figures 2 and 11 indicates that the temperature* aatch favorably near veil M-9 aad in the central part of the field. Generally the calculated teaperaturee are higher than those of Kcrcacto.
Mod-1 2
To obtain a better natch, the sources in the 100-level were displaced toward the southwest corner of the aystea, the 200-level sources were taken out, and their flow rates were added to those at the 100 level. The tcapcrature of the sources at the 300 and 600 levels were changed to 200°C (Table 3 ) . The sinks Ji thia aodel were assumed to he equal to those in Model 1 (Table 2 ) . The temperature of the lover boundary was again fixed at 150°C.
Isotheraa at 1000- and 1400-m depths (&• and 400 levels) nre given in Figures 12 and i3. Teaperaturee have changed with respect to those of Figures 8 and 9 in response to the change of source characteristics.
SE NW
Distance 1m)
Figure 10. Model 1. Temperature distribution along the A-A' cross-section. (XBL 804-7037)
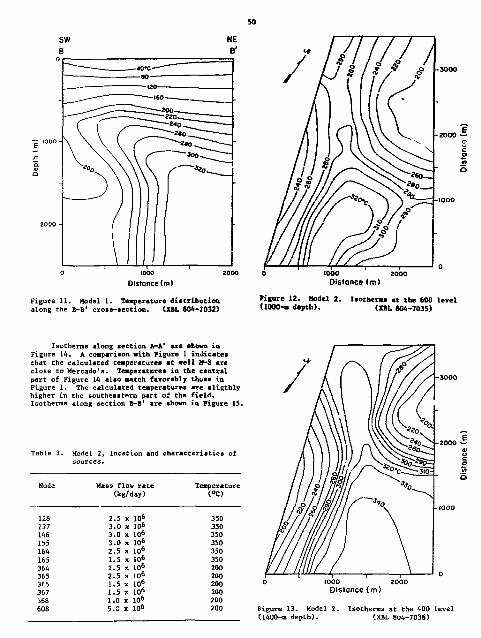
1000 ! Distance (m)
Figure 11. Model 1. Temperature distribution along the B-B' cross-section. (XBL 804*7032)
1000 2000 Distance (m)
Figure 12. Model 2. Isotherms at the 600 level (1000-m depth). {XBL 804-7035)
IsothernB along section A-A* are shown in Figure 14. A comparison with Figure 1 indicates that the calculated temperatures at well H-3 are close to Mercado's. Temperatures in the central part of Figure 14 also match favorably these in Figure 1. The calculated temperatures are sligthly higher in the southeastern part of the field. Isotherms along section B-B' are shown in Figure IS.
Table 3. Model 2 sources
location and characteristics of
Node Mass flow rate Temperature (kg/day) (°C)
128 2.5 x 10 6 350 137 3.0 x 10 6 350 146 3.0 x 10° 350 155 3.0 x 10° 350 164 2.5 x 10° 350 165 1.5 x 10° 350 364 2.5 X 10° 200 365 2.5 x 10° 200 3f5 1.5 x 10° 200 367 1.5 x 10° 200 368 1.0 x 10° 200 608 5.0 x 10° 200
1000 2000 Distance (m)
Figure 13. Model 2. Isotherms at the 4D0 level U400-m depth). (XBL 8U4-7036)

NW »'
—40»C——
20 . . 0^ 20 . . 0^
zzr~ — zoo 20 . . 0^
zzr~ — zoo
E I O O O -
zzr~ — zoo
o
2000-
zzr~ — zoo
/ 3 0 0
IQGO 200Q D.stonce (m)
Figure 14. Model 2. Temperature distribution along the A-A1 cross section. (XBL 804-7030)
A comparison of these temperatures with those in Figure 2 shows that the calculated temperatures are, in general, higher than the preproduction temperatures given by Mercado (1976).
S W B
NE B'
40'C
120
\ \ ( _ 1000 -E
Q.
a
J//
500 „
*°^ 5§i=
2000 -
1000 Distonce(m)
Figure 15. Model 2. Temperature distribution along the B-B' cross section. (XBL 804-7029)
PLANNED ACTIVITIES FOB FISCAL TEAR 1980
Is order to establish the preproduction recharge and flow characteriatica of the Cerro Prieto field* more temperature and early preaaure data vill be obtained. The geological model of the field to be uaed in the computation* vill be modified baaed on new information expected to become available during tiacal year 1980.
A three-etafe program in reaervoir modeling of the field reaponae to large-scale fluid production (started in 1973) will be initiated. It vill begin with the simulation of the initial production area, working up to a simulation of the entire known Cerro Prieto geothermal field.
REFERENCES CITED
Abril C „ A., and Hoble. J. E., 1979, Geophysical well-log correlations along various cross-sections of the Cerro Prieto geothermal field, in Proceedings, First Symposium az. the Cerro Prieto geothermal field, Baja California, Mexico, September 1978. Berkeley, Lawrence Berkeley Laboratory, LBL-7098, p. 41-48.
Berne jo M., F., Cortex A., C , and Arsgon A., A., 1979. Physical and thermodynamic changes observed in the Cerro Prieto geothermal reservoir, i£ Proceedings, First Symposium on the Cerro Prieto geothermal field, Baja California, Mexico, September 1978. Berkeley, Lawrence Berkeley Laboratory, LBL-7098, p. 300-332.
Corwin, S. F., Morrison, H. F., Dies, C. S. , and Rodriguez B-, J., 1979. Self-potential itudias at the Cerro Prieto geothermal field, jin_ Proceedings, First Symposium on the Cerro Prieto geoch "ire*1 field, Baja California, Mexico, September 1978. Berkeley, Lawrence Berkeley Laboratory, LBL-7098, p. 204-210.
Edwards, A. L., 1972. TRUMP; A computer program for transient and steady state temperature distribution in multidimensional systems. Livermoret Lawrence Livercore Laboratory, UCRL-14754, Rev. 3.
Elders, W. A., Hoagland, J. R.t Olson, E. R., McDowell, S. D. and Collier, P., 1978. A comprehensive study of samples from geothermal reservoirs: Petrology and light stable isotope geochemistry of twenty-three wells in the Cerro Prieto geothernial field, Baja California, Mexico. Riverside, University of California, UCR/ICPP-78/26.
Fonssca L., H., and Razo M-, A., I960. Gravimetric magnetometrie am* seismic reflection studies at the Cerro Prieto geothermal field, in Proceedings, Second Symposium on the Cerro Prieto Geothermal Field, Baja California, Mexico, October 1979. Mexicali, Coraision Federal de Electricidad (in preparation).
Lippmann, M. J., Tsang, C. F., and Witherspoon, P. A., 1977. Analysis of the response cf geothermal reservoirs under injection and production procedures: Dallas, Society of Petroleum Engineers, SPE-6537.
Lyons, D. J., and van de Kamp, P. C , 1980. Subsurface geological and geophysical study of the Cerro Prieto geotherraal field: Berkeley, Lawrence Berkeley Laboratory, LBL-10540.
Mercado G., S., 1968. Localization de zonas de maxima actividad hidrotermal por medio de

52
proporclones qufmicaa, caapo geotermico de Cerro Prieto B. C : Presented at the til Congreso Mexicano de quIWra pur* y apllcada March 21-23, 1968. Guadalajara, Mexico. , 1976. Movement of geothermal fluids and temperature distribution in the Cerro Prieto geothermal field, Baja California, Mexico, in Proceeding*, Second United Nations Symposium on the Development and Use of Geothermal Resources, Hay 1975: Washington. D.C., U.S. Government Printing Office, v. 1, p. 487-494.
Narasimi •- , T. N., and Wit her spoon, P. A., 1976. An integrated finite difference method far tialyzing fluid flow in porous media: Water
INTRODUCTION
HoBt of the papers published on the hydrody-natnic and thermal effects of reinjection in geo-thermal fijldB assume a single reservoir with uniform transmissivity and storativity. However, there is evidence that the Cerro Prieto geothermal field is a two-reservoir system and that each reservoir has different hydraulic properties (Abril and Noble, 1979). Since the case of rvo-reserzoir fields has not been adequately studied, the present research attempts to analyze the thermohydrological response of this kind of geothermal system to various alternative schemes of reinjection. Parameters relevant to the Cerro Prieto system are used so that the results will be useful in the planning of future reinjection operations at this field.
ACTIVITIES IN FISCAL YEAR 1979
In the present analysis LBL computer program CCC (Lippmann et al., 1977) is used, which is capable of modeling the complex geological and boundary conditions of a geothermal system. CCC also simulates the major physical factors involved in the movement of the injected waters: (1) forced con-vective flow between the production and injection areas; (2) heat exchange among injected water, rock matrix, and native waters; (3) density-buoyancy effects, and (4) influence of temperature-dependent viscosity on fluid flow. But the problems associated with the chemistry of the fluids and the porous media, such as injectibility of the wells, injected/native groundwater compatibility, and water-rock interactions, will not be covered here. These matters are addressed in a number of other papers at the second Cerro Prieto symposium.
Reinjection Modeling
In any type of modeling study we may distinguish two broad categories: special studies and detailed simulations. In the case of reinjection, special studies investigate particular topics of interest, such as optimal injection well patterns and the effects of temperature-dependent properties
Resources Research, v. 12, no. 1, p. 57-64. Trueidell, A. H., Rye, R. O., Pearson, F. J., Jr.
Olson, E. £., Vf-hring, H. L., Rucbner, M. A., and Coplen, T. S., 1979. Preliminary isotopic studies of fluids from the Cerro Prieto geo-thermal field, i£ Proceedings, First Symposium on the Cerro Pricto ceothermal field, Raja California* Mexico, September 1978; Berkeley, Lawrence Berkeley Laboratory* LBL-7098, p. 95-99.
Vonder Haar, S., and Howard, J. H., 1980. Intersecting faulta and sandstone stratigraphy at the Cerro Prieto geothermal field. Berkeley, Lawrence Berkeley Laboratory, LRL-9546.
(e.g. Tsang et al., 1979). On the other hand, detailed simulation studies are appropriate only after a realistic geologic model of the system (i.e. its geometry, physical properties, boundary and initial conditions) is developed. In this general framework, we address a special study of reinjection operations in a geothermal field. The study is concerned witi. the peculiarities of carrying out this type of operation in a system consisting of two separate reservoirs. One particular purpose for employing in this research a simpler idealized model is to begin to determine the best strategies for reinjection so that they can be tested later in more realistic simulations.
Two-Reservoir Systems
1. Single Well Model. The simplified radially symmetric two-reservoir model used for this case with its initial temperature distribution is shown in Figure I. The reservoir hydraulic and thermal properties are displayed in Table 1. These dsta are all taken from an earlier simulation study of Cerro Prieto (Lippme:*n et al. ? 1979). Note from the table that the permeability in the lower aquifer is 80 md whereas in the upper aquifer it is 50 md. The intervening layer has a permeability of 0.5 md, which is two orders of magnitude smaller, but still not negligible. For simplicity, the aquifers are assumed to be uniformly 100 m thick and the intervening layer is 50 m thick.
a. Pressure effects (production only). In this series of simulations a constant production rate of 1000 nrVhr is assumed (approximately 402 of the 1978 production rate at Cerro Prieto). The injection rate is at 500 ra-Vhr, one-half of the production rate. Three different boundary conditions were employed to study pressure effects during production.
The open boundary case corresponds to an aquifer of large radial extent, with a constant potential boundary simulating "full" recharge conditions 2.3 km away from the well. The semi-open boundary case had a leaky flow barrier at the same distance
SIMULATION OF REINFECTION AT CERRO PRIETO USING AN IDEAUZED TWO-RESERVOIR GEOLOGICAL MODEL C. F. Tsang, D. C. Mangold, and M. J. Lippmann
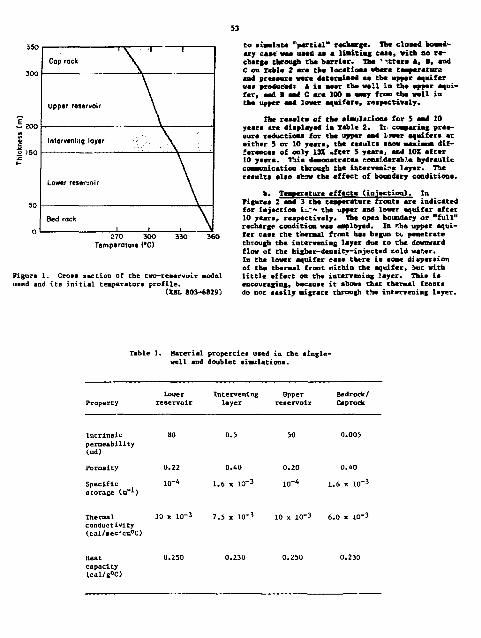
53
i y i i Cop rock \
300 \ 300 \
Upper reservoir \
— 200 v> V c o (50 .e » -
\ — 200 v> V c o (50 .e » -
Intervening loyer : - ; . - . \
— 200 v> V c o (50 .e » - \
Lower reservoir \
50 \ 50
Bed rock \ i t . \
Figure 1 used and
270 300 Temperature (*C)
Cross aection of the two-reservoir Model i t s i n i t i a l temperature prof i le .
(XBL 803-6829}
to limuUte "partial" recharge. The closed boundary c u * v u uses a* a linitiag case, with no recharge through the barrier. The '••ttere A, •, and C on Table 2 are the locations where temperature and pressure were determined as the upper aquifer was produced: A is near the well in the upper aquifer, and 1 and C are 100 • e«ny fron the well in the upper and lover aquifer*, respectively.
The reanlta of the simulations for S and 10 yeers are displayed in Table 2. I* compering pressure reductions for the upper and l-wer aquifers at either 5 or 10 years, the results show •arinmi difference! of only 131 «ft*r 5 years t and 10Z after 10 years. This danonstrates considerable hydraulic communication through the iaterveni?e: layer. The results also ahov the effect of boundary conditions.
b. Temperature effects (injection). In Figures 2 and 3 the teaperature fronts are indicated for injection i-r*» the upper and lower aquifer after 10 years, respectively. The open boundary or "full" recharge condition was aavloycd. In the upper aquifer case the theraal front has begun tt, penetrate through the intervening layer due to the downward flow of the higher-density-injected cold var.er. In the lower aquifer case there is B O B * dispersion of the thermal front within the aquifer, but with little effect on the intervening layer. This is encouraging, because it shows that theraal fronts do not easily migrate through the intervening layer.
Table 1. Material properties used in the single-well and doublet siaulations.
Lower Intervening Upper Bedrock/ Property reservoir layer reservoir Caprock
lucrinslc permeability (md)
80 0.5
Porosity 0.22 0.40
Specific storage ( Q - 1 )
io-4 1.6 x 10'
Thermal 10 x 10~ 3 7.5 x 1 0 - 3 10 x 1 0 - 3 6.0 x K T 3
conductivity (cal/»ec-cQ°C)
Heat capacity (cal/gOC)

54
Injection into tower aqui fer after NO years
production simulations.
Pressure drawdowns (pel) 1 to 5 yre 1 *-,o 10 yrs
At Point A 36 38 39
open Seal-open Closed
36 38 39
40 61 6*
At Point B Open Semi-open Closed
36 36 39
40 61 64
At Point C Open Sen!-open Closed
32 33 35
36 SB 61
MO
"S ISO
|
11 ~ i 1
-MO
"S ISO
| '// %%B, i- -\ -- ^ ^ 32(WS
• J 2 0
*> ' 200 300
Radiol dislenca (m)
PrtuureincreoM (psi)metnuredat Aquifer 500m lOOOm
upper Lowtr
•6 9 54 28
The box below the thermal front diagram in Figures 2 and 3 records pressure changes in the upper and lower aquifers, respectively, at radial distanceB of 500 m and 1000 m. These pressures agree with the results of the production tests men-tioned above. Despite the such lower permeability of the intervening layer, pressures are readily transmitted through it from the injected reservoir to the other reservoir. This indicates that reinject ion may be useful to maintain overall reservoir pressures even through an intervening layer which inhibits or slows down thermal fronts, thereby prolonging the useful life of a geotbermal field.
Injection into upper aqui fer after 10 yean
B I S 0
- ^ ^ - -
^-^200 /
• • . - . • 7 • - • / " / ,
'•?%&, . . ..-///A
i i ' 200
Radiol distance (m)
Pressure increase (psi) measured at
Figure 2. Isotherms and pressure changes simulated for 10 years of tingle-well injection into the upper reservoir. (XBL 803-6833)
Figure 3. Isotherms and pressure changes simulated for 10 years of single-well injection into the lover reservoir. (XBL 803-6835?
2. Doublet Model. As a further development in sjodeling reinjection, the slightly more realistic case of a simultaneous system of production and injection was simulated. Figure 4 illustrates the scab for a two-layer doublet system which is produced from the upper reservoir at the rate of 2000 sP/hr and is injected with 150°C water at the rate of 1000 srVbr into either the upper or lower reservoir. The three-dimensional mesh makes use of symmetry along the line connecting the production and injection wells, but otherwise it is similar to
Cross section view
Figure 4. Flan and cross section views of the doublet mesh. (XBL 803-6844)
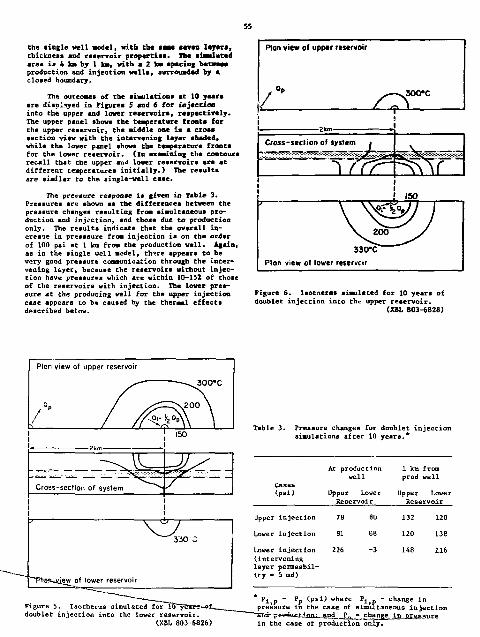
55
the tingle well model, with the imae •even layers, tbickneas and reservoir properties. The aiamlMted area if 4 k» by 1 1CM, with a 2 fcai spacing betwemn production and injection veils, aurroumdad by * closed boundary.
The outcomes of the simulations at 10 years are displayed in Figures 5 and 6 for injection into the upper and lower reservoirs, respectively. The upper panel shows the teaperature fronts for the upper reservoir, the saddle one is a cross section view with the intervening layer shaded, while the lower panel showa the temperature fronts for the lower reservoir, (in examining the contours recall that the upper aud lower reservoirs are at different temperatures initially.) The reaulta are similar to the single-well case.
The pressure response is given in Table 3. Pressures are shown as the differences between the pressure changes resulting froai simultaneous production and injection, and those due to production only. The results indicate that the overall increase in presssure from injection is on the order of 100 psi at 1 lea from the production well. Again, as in the single well model, ttwre appears to be very good pressure communication through the intervening l&yer, because the reservoirs without injection have pressures which are within 10-15X of thoae of Che reservoirs with injection. The lower pressure at the producing well for the upper injection case appears to be caused by the thermal effecta described below.
U Ekm *
Cross-section of system • ^r > ISO
} \ V ^ f J >v 200 y 330-C
Pton view of lower reservcir
Figure 6. Iaotaerms simulated for 10 years of doublet injection into the upper reservoir.
(XBL 803-6828)
1 1
330 C
~~PfS«L, j/jew of lower reservoir
Figure 5. Isotherms simulated for TtJ doublet injection into the lower reservoir.
(XBL 803-6826)
Table 3. Pressure changes for doublet injection simulations after 10 years.*
Cases (ps i )
At production well
Upper Lower Reservoir
1 km from prod well
Upper Lower Reservoir
Upper In ject ion 78 80 132 120
Lower Inject ion 81 88 120 13e
Lower in jec t ion ( intervening layer permeabili t y - 5 md)
226 - 3 U S 116
pi,p ~ p p (P s i^ "here Pj - change in pressure in the case of simultaneous injection sas- product*on; and• _P^_• change in pressure in the case of production only.

56
The pressure response for the upper iajectioa case over the 10-year period is above ia Figure 7. The pressure profile between the protectioa area and the injection veil displays a traaaitiom regie* between the injected 150°C water aad the aurroeadiag 302°C water. In this reason, the Tiacoaity carnages significantly due to fluid temperature differeacae (a ratio of nearly 2:1), producing • awring thermal barrier which can be reapoaeible for larger team usual pressure declines in well teat aaalyais (Mangold ee el., 1979). The accosatanyiag grape ia Figure 8 suggests the influence of this effect oa pressure response in a comparison betweea the cases of upper and lower injection. After 10 yeara of injection into the upper reservoir, the proeectioa well area actually has a lower pressure thaa the lower injection case, probably due to the thermally produced viscosity barrier in the upper aquifer. For injection into the lower reservoir, the pressures in the upper aquifer are not aa affected fay such a barrier since it ia restricted to the lower aquifer. Such results indicate that a combination of viscosity and buoyancy effects are needed in order to adequately describe the physical processes of reinjection, especially in a two-reservoir system. These matters will be the subject of a further investigation.
- Cerro Prieto Reinjection Doublet injection inlo upper aquifer
—o— 10 y*o*s —A™ 5 years - - °— 1 ysor
Tronsifion regions from I50*C fo—270*C %-s*
Thea the doublet model farther coefirme that ia a acre r e a l i s t i c model of * two-reaervoir syetea, reiajectiea) w i l l be auwfvl to suiata ia reservoir ereeeera while raatr ic t iag the theraal froat to the aeigheorhood of the i n fec t ion area.
Cerro Prieto Reinjection Doublet 19.50 i
16.50
Product. *n .We i l
Lower Injection
2 3 4 5 6 7 8 9 1 0 T i m e ( y e a r s )
Figure 7. Radial pressure distribution simulated for 1, 5, and 10 years of doublet injection into the upper reservoir, showing the transition region between hot and cold waters. (XBL 803-6832)
Figure S. Pressure changes near the production area simulated for 1, 5, and 10 years of doublet injection into the upper and lower reservon^.
(XBL 803-68H6)

COHCLUSION
In thii paper we have introduced an idealized two-reservoir model to explore some of the effect* of reinjection in a geothermal field* For both the single-well model and the doublet model the reaulta indicate that reservoir preaaucea will be adequately maintained even when an intervening layer of low permeability is present. The same intervening layer may nevertheless be an effective barrier to the movement of cold fronts, due to the action of gravity and viscosity on the flow of denser colder waters. This shows promise for developing reinjection strategies which can be tested on more detailed simulation models for specific sites such as the Cerro Prieto field.
PLANS FOR FISCAL YEAS 1980
Xn further research we hope to conduct a sensitivity analysis on come of the main parameters used in thia study, especially perneibility. Clearly, there is also a need to ccudy th* flow of the colder water toward the production veil for a longer period of time than 10 years. Such matters es simulation of permeabilitj anisotropy and optimum well spacing for injection may have to wait until detailed geological models become available. Idealized codels like the ones employed in this study, however, are useful for suggesting practical reinjection opera-tion strategies for optimizing the development of geothennal energy resources.
REFERENCES CITED
Abril C , A, and Noble, J. E-, 1979. Geophysical veil-log correlations along various cross
sections of the Cerro Prieto Geotherael field, in Proceedings, First Symposium on the Cerro Prieto Geothermal Field, Raja California, Mexico, September, 1978. Berkeley, Lawrence Berkeley Laboratory, LBL-7098, p. 41-48.
Lippmann, K. J., vodvarason, G. S., Vitherapoots, P. A., and Rivera ft., J., 1979. Preliminary simulation studies related to the Cerro Prieto Field, in Proceedings, First Symposium on the Cerro Frieto Geothermal Field, Baja California, Mexico, September, 1978. Berkeley, Lawrence Berkeley Laboratory, L B W 0 9 8 , p. 375-357.
Lippmann, H. J.t Teang, C. P., and Witherspoon, ?. A., 1977. Analysis of the response of geothermal reservoirs under injection and production procedures. SFE 6537, presented at the 47th Annual California Regional Meeting SPE-AIME, Bakersfield, California, April 1977.
Mangold, D. C , Taang, C. F., Lippmann, M. J-, and Witherspoon, P. A., 1979. A study of thermal effecta in well test analysis. SPE-8232, presented at the 54th Annual Fall Technical Conference SPE-AIME, Laa Vegas, Nevada, September 1979. Berkeley, Lawrence Berkeley Laboratory, LBL-9769.
Tsang, C. F., ^udvarsson, C. S., Lippmann, H. J., and Rivera R., J., 1979. Some aspect* of the response of geothermal reservoirs to t<rine reinjeetion with application to the Cerro Prieto Field, ^n Proceedings, First Symposium on the Cerro Prieto Geothermal Field, Baja California, Mexico, September, 1978. Berkeley, Lawrence Berkeley Laboratory, LBL-7098, p. 396-403.
RESISTIVITY STUDIES AT CERRO PRIETO M. I Witt and N. E. Goldstein
IHTRODUCTION
In 1978 Lawrence Berkeley Laboratory, in cooperation with Condaion Federal de Electricidad, began a program of dipole-dipole resistivity studies at the Cerro Prieto geothermal field (Hilt et al., 1979). Dipole-dipole resistivity measurements were conducted in 1978 and 1979 along two long east-west survey lines; one (E-E 1) crossing the central part o£ the production area near the power plant, and the other (D-D 1) passing about 4 km north of the plant and immediately south of
the Cerro Prieto volcano (Figure 1). The utmost care was taken to achieve the best accuracy obtainable with the available instrumentation.
The goals of this project are to determine how well the boundaries of the geothermal field can be defined with surface resistivity measurements, and Co determine if changes in reservoir conditi •«» due to production (e.g. formation of a vapor zone, changes in porosity at the periphery of the reservoir) may be monitored by means of accurate surface resistivity neasureoents.

58
Figure 1. Project location map, LBL resistivity project. (XBL 7M-1632)
PROGRESS IV FISCAL YEAR 1979
In fiscal year 1979, line E-E* vat vemeesured with 1-km dipoles but at significantly greater accuracy than in 1978 to provide better modeling constraint? and to establish s reliable baseline for future observations of resistivity changes (Wilt et al., 1980). The LBL 25-kV siotor generator was used as the power source both years, but greater accuracy was achieved in 1979 because of superior receiver instrumentation, mechanical improvements to the -»ower source, and the experience gained from the previous year.
Measurements on line E-E' were extended 4 km farther eastward and the maximum transmitter receiver separations were increased from N • 6 to N • 8, thereby yielding a greater depth of exploration. In addition, telluric profile measurements were made along line E-E' to test the applicability of this relatively fast and inexpensive method for resolving subsurface structure.
the expanded and more accurate results were used to develop an improved two-dimensional resistivity cross-section for line E-E* (Figures 2 and 3). New model perturbation studies were performed
co identify points of maximum likely interest; i.e., those measurement, points where reservoir changes might be most easily recognixed, red to examine the magnitude of resistivity change for several possible reservoir changes. An analysis of measurement errors was dome with the 197ft and 1979 data and the two sets were compared to see (1) if new measurn-oentn (1979) fall within the predicted errors and (2) if data accuracy ia sufficient to isolate any changes in reservoir conditions.
Telluric data taken in 1979 were analyzed, and errors were evaluated to determine if it ia possible to use this method for resistivity monicoring.
Results of Oipole-Diaole Studies
The following is a summary of some of our findings:
1. The dipole-dipole data gathering technique was improved in 1979 to where estimated meaturz-meot errors are less than 32 for most points. This is sufficient accuracy to observe changes in resistivity that toay occur over a short time interval due to reservoir dynamics associated with production.
2. Further resistivity mode, 'ng has better defined the resistivity structure of the eastern part of the field. The model suggests that the resistive body associated with the producing zone (Figure 3) dips eastward at 30 to 50 degrees ro a depth of greater than 2.0 km. A narrow, steeply dipping conductive zone lies immediately east of the resistive body and may correspond to a zone of recharge or faulting (Lyons et al., 1980).
3. The resistivity modeling suggests a deep source of fluid beyond the- eastern part of the field. This is shown as the 4.0 ohm-m layer at 2.5 to 3.0 km depth. There is also some evidence that this deep zone is in hydrologic communication with existing shallower production (Elders et al., 1979).
4. Model perturbation studies show that apparent resistivity changes due to model variations normally occur aa banded or g~ouped points of anomalous apparent resistivities. The signature of such models (Figure 4) may allow detection and identification of changes in the presence of noise. The study also helped define an "area of interest" of 60 measurement points particularly associated with changes in the reservoir formation.
5. Interpretation of telluric profile measurements done over line E-E' yields a significant amount of reconnaissance information about the field. Because of inherent measurement uncertainty, however, the method seems unsuitable for monitoring purposes.

o ' z ' o ' < " Q_ s "> • 2 ' ~
z
2 D RESISTIVITY MODEL
Figure 2. Dipole-dipole r e s i s t i v i t y p r o f i l e , l i ne E-E' , 1979: observed da ta , calculated data , and two-dimensional r e s i s t i v i t y model, CXBL 791O-13040A)

60
Seclkxi E-E Resistivity FLUI TOK FISCAL T U t 19M
- t IS*'1 - t
t-2 /
2.0
300.0 L
Top of r^)omo«p*iie loot (Vord«rH3»,l960) Firtt occurrence «I WdefC ( £ W M t l Ol. <979)
Figure 3. Expanded two-dimensional resistivity nodal showing well locations and plots of the con-solidated-unconsolldated sediment interface, the top of the metanorphic zone, and the firat occurrence of the netamorphic mineral epidote.
(XBL 601-6761)
In fiscal year 1960 line E-E* will be remeas-ured to aa accuracy of 31 or better for all points. In addition, a detailed analysis will be performed on observed chances in apparent resistivity with emphasis on chose *0 points moat closely associated with the reservoir. Further model perturbation studies will be performed end some three-dimensional computer models will be calculated that account for the rapid changes in resistivity near the edges of the field that were observed with magnetotelluric measurements (Gamble et al., 1979). These three-dimensional models will be of use in constructing more realistic perturbation models.
In the hope of futher improving the accuracy of our measurements two changes will be made to the recording system: (1} a telluric monitor will be added for direct telluric noise cancellation, and (2) a multichannel signal processor will be used for improved signal averaging and filtering. For larger trarsadtter-receiver separations telluric noiss is often greater than the signal and this noise must be effectively cancelled to achieve the
Model Perturbation Case I -Cold Water Influx
M6 M9M5 MI0M53
3 5 10 20 20 10 5 3
Percent variation
Figure 4. Model perturbation study to simulate the effect of cold water influx into the upper portion of Che reservoir (coopare nodel with Figure 3) . Percent variations are differences between the calculated data from Figure 2 and the calculated data fron the perturbed model. (XBL 801-6/59}

61
required accuracy. Thi* can be done either by eub-cracting it directly from recordings or by averaging •any cycle* of data, assuming that the telluric noise will average to zero; we intend to do both.
For noiae removal a telluric nonitor will he placed 10-15 miles away from the tupole-dipole line so that no transmitted signal ia contained in raw signals. The monitor will consist of an electric dipole, amplifiers and filters, and a radio transmitter to telemeter data to the recording van. The remote signal is then adjusted in amplitude, inverted, and added to the local telluric*, to reach a null signal. The transmitter ia then switched on and data is taken in a normal
>te
Automatic signal averaging for noise reduction will be done with the new multichannel, microprocessor-controlled wave analyzer originally designed for use with an electromagnetic system. Its flexible design permits its use as a general geophysical receiver (Morrison et al., 1978). The addition of this instrument will allow superior filtering of noise, adjustable cycle averaging to a maximum of over 2000 cycles, and harmonic analysis of transmitted square waves. Since this receiver baa six channels it will allow us to increase survey speed by making several measurements simultaneously.
REFERENCES CITFD
Elders, W. A., and Hoagland, J. R., 1979. Studiea of water/rock interaction in the Cerro Prieto geothermal field, Baja California, Mexico, it±
lhatracts^ Second Syamoaium on the Cerro Prieto exothermal Field, Baja California! Mexico: Hexicali, Coauaioa Federal de Electricidad.
Gamble, T. D., Cowbau, M. M., Goldstein, IT. E., Miracky, B., Stark, M., and Clark, J., I960* Kagaetotelluric atndiea at Cerro Prieto, in Procjedings, Second Symposium on the Cerro Prieto Ceotberoal Field, Baj* California, Mexico, October 1979. Mexi.cali, Coaiaion Federal de Elretricidad.
Lyoae, D. J., van de Kamp, P., Vonder ftaar, S. f
Vohle, J., and Bowerd, J. H., 1960. Subsurface atratigrapby at the Cerro Prieto geothermal field, in Proceedinge, Second Symposium on the Cerro Prieto Geotbermal Field, Baja California, Mexico, October 1979. Mexicali, Comiaion Federal de Electricidad.
Morrison, I. F., Goldstein, H. E., Boreraten, M. t
Oppliger, C , and ftiveros, C , 1979. Description field test and data analyeie of a controlled source EM system (EM-60). Berkeley, Lawrence Berkeley Laboratory, LCL-7088.
Wilt, M., Coldateir, H. E., and Bazo, H. A., 1979. LBL resistivity studies at Cerro Preito, in Proceedinga, First Sympoaiom on the Cerro Pr'.eto Geothermal Field, Baja California, Mexico, September 1976. Berkeley, Lawrence Berkeley Laboratory, LBL-7098, p. 179-18B.
Wilt, H., and Coldatein, M. E., I960. Resistivity monitoring at Cerro Prieto, in Proceedings, Second Symposium on the Cerro Prieto Geothermal Field, Baja California, Mexico, October 1979. Mexicali, Comision Federal de Electricidad.
MACNETOTELLURIC STUDIES AT CERRO FRIETO f. O. Gamble, W. M. Goubau, R, Miracky, J. Clarke, and N. E. Goldstein
INTRODUCTION
Seventeen magnetotelluric soundings have been performed near the current geothermal production zone at Cerro Prieto, Mexico. These measurements indicate, among other things, a zone of relatively high resistivity enclosing the region of current brine producion. This narrow zone plunges at a shallow angle to the south-southeast. The three-dimensional nature of this resistive body, combined with the long range influence of the high resistivity Cucapa Mountain Range and other regional features, makes a rigorous quantitative evaluation impractical. Nonetheless, the qualitative picture is clear; and a rough model drawn from crude quantitative considerations has been shown to be in good agreement with dipole-dipole resistivity measurements and well leg data from the area. The relatively high resistivity is apparently due to hydro-thermal metamorphism of the sediments by geother&al activity, with an attendant loss of porosity, in a zone of faulting parallel to the regional strike, about 15° west of north.
PROGRESS IN FISCAL YEAR 1979
Figure 1 is a map of the sites of the nagneto-teiluric soundings performed in 1978 and 1979.
They form three lines: D to the north of the plant, E parallel to D through the present production
^ y C*r«T) PrittO *\/
U/ - •* Uslcano Ja S
£ Surveyed 1978
32 ,2tf+ D5-20-
9Cf "^TT^esteg'crf S
v Figure 1. Location of magnetctelluric stations at Cerro Prieto, Baja California. (XBL 791-12866)

62
field, and F also through the present field W t perpendicular to the others smd parallel to the geologic strike. All the measurements were aeea using the remote reference technique (Gamble 197S| Gamble et al. 1979e,b,c,d; Gamble, 1 9 M ) . The Sierra Cucapa range is about 10 km to the vest of Cerro Prieto; and the southern extension of the Imperial Valley fault lies about 12 ha to the east, both sub-parallel to line F.
Magnetotelluric messursments cam determine two response functions of the earth. One is the tipper, T, which relates the vertical to the horizontal components of the magnetic field by lg • T * fi. The second is the impedance tensor £, which relates the horisontsl components of the electric field to the horizontal components of the magnetic field by E - £H. Z is usually described by tht apparent resistivity, which is the resistivity of a homogeneous earth that would give the seme ratio of electric to magnetic field powers as is observed at a given frequency. This spparent resistivity is proportions! to the squared magnitude of the wi.f-diegonal components of £. For the real, inbomogene-ous earth, resistivity is a function of frequency. Apparent resistivity and tipper information are often conveniently represented in pseudosection form, where the lateral axis specifies the position along a survey line and the vertical acale is the logarithm of the period. The depth of penetration of the electromagnetic waves is roughly proportional to the aquare root of the period, so the vertical axis corresponds very roughly to logarithmic depth.
We present a small sample of the pseudoacctione of the data from these soundings. Figure 2 is a pseudosection of the tipper tisgnitude for current going across the strike, for line F. There is a very large maximum at station 3, just north of the power plant, at periods of about 1 second. The tipper indicates lateral changes in resistivity, so this paeudosection indicatca a large nortb-aouth gradient of resistivity juat north of the plant. The phase of the tipper (not ahown) indicates that the more resistive material is to the south. Figure 3 is s paeudoseetion of the apparent resistivity for the same line, F, and current direction, acroaa the regional strike. Here we see more directly a region of higher reaistivity to the south indicated by an area of high apparent reaistivity, greater than 3 ohm-m, south of station 3. The contour of 3 ohm-m apparent resistivity closes at longer periods, but this does not mean that the actual reaiativity decreases at the greatest deptha. Rather, we are seeing the influence of the resistive barrier of the Gucapa granites to the west. This barrier blocka off the current at great depths, causing a lover apparent resistivity for the longer periods.
Becsuse of lateral reiistivity changes in geologically complex trees, we rarely encounter data that can be quantitatively interpreted in terms of a simple one-dimensional (i.e., horizontally layered) earth. The only station for which th» meaa-ursments appear consistent with a one-dimensional model over most of the frequency range is station 6 on line E, the station farthest from the Cucapas. We used a progra* developed by Oldenburg (1979) to invert the data from this sounding. The resulta are ahown in Figure 4. The crosses indicate the
F-F' TX MAGNITUDE
Figure 2 . Observed tipper magnitude for l ine F-F', current perpendicular to regional geologic tr ike .
(ZBL 799-11504)
, * - * »
F-F" YX APPARENT A E S I S T l V l T r
LU a- 2
©D-D' C
Figure 3. Apparent resistivity pseudoaection along line F-F r, current perpendicular to regional geologic strike. (XBL 799-11507)

63
o
? s ° >-
\ s A US IS
• \.f UJ
o o \7 " V -~ i i
10 1000 OEPTH CM}
IQOOO
Figure 4. One-diMnsional inversion results for station 5, line E-E'; electric field parallel to regional strike (crosses explained in text).
(XBL 7910-12330A)
resolution of the sounding. The vertical bars indicate a rsnge of depths over which the resistivity was average, whereas the horizontal bars indicate the standard deviation of this average resistivity due to the uncertainty of the measurements. Between depthfi of 200 and 2000 m, resistivities tend to decreise, a consequence of water salinity changing from nearly fresh st the surface (Colorado River water) to fossil see water trapped in the deeper sediments. The low resistivity snoualy (I ohm-a) between 1.9 and 2.5 b depth, could be caused by a combination of high temperature and high salinity. Results from well Neuvo Leoue I in the general are* confirm this condition.
The soundings along line D are relatively consistent with a two-dimensional earth; i.e., there is no indication of a large lateral change in resistivity in the strike direction. Therefore, we have attempted to match the observed pseudosec-tions to those for a two-dimensional model. A preliminary model, which waa included in the 1978 annual report, roughly matched the long period data from this line (Gamble et al., 1979b). This model has been refined to obtain a much better match to all the measurements. This subsurface resistivity along line D is presented in Figure 5. To illustrate how well the model satisfies the data, Figurr 6 shows a comparison of calculated and observed apparent resistivity pseudosectlons. Although Figure 6 po' trays only the case for current perpendicular to strike (the TE mode), the model also satisfied current perpendicular to strike (the TM mode). For this particular line, agreement between model and observed results i« particularly good. The values of resistivity were round for the blocks shown in Figure 5.
The 41 ohm-m block at the western end of line D is included to sccount for the conduction paths within the Cucapa mountains above the level of the plain. Also, relatively resistive rocks were required east of station 6 to help fit the data. Thus we had to introduce a rather artificial 25 ohm-m block of undetermined depth extent beyond the
sicmu ClICAM
mrra
12
M •
13
a
...
1 1
1 !
12
M •
13
a
...
1 1
1 !
10 12 SO 13
a
...
1 1
1 !
4 0 ss
13
a
...
1 1
1 !
900
13
a
...
1 1
1 !
4 0 900
a
...
1 1
1 !
Figure 5. Tvo-dimeaaional interpretation of resistivity fitting the magaetotelluric results at stations along line D-D 1. (JOT. 796-753**).
eastern end of the line* the low resistivity surface aone in tb* saddle of the line is veil resolved, and ia coincident with the geotbcrmal surface manifestations near the Cerro Prieto volcano. The measurements are consistent with 1.7 or 1.8 ohm-m resistivity from 0.5 ?o 3.0 km depth below stations 3, 5, and 6, alt!Ko jh a slightly better match ia obtained with the values of 3.0 and 3.6 ohsr-m below station 3, as shown. This more resistive cone, bounded approximately by the Cerro Frieto fault on the west and the Kichoacan fault on the east, is better defined by means of dipole-dipole resistivity than by at. The rone corresponds to a region of hydrcthermal metamorphiam and reduced Doroeity as determined from a study of well cuttings (Elmers et al., 1979).
Because of the large lateral changes of resistivity in the r»fricnal strike direction over Che field, indicated earlier by Figures 2 and 3, we have not attempted to match these soundings to a two-dimensional model. Instead, we havi conceptualized a rough three-dimensional mcjel baaed on a qualitative consideration of all relevant pseudo-sections. Sections of this model along lines E and F, plotted to a logarithmic depth scale, sre shown in figure* 7 and 8f respectively. The resistive body in the viciniLy of the power plant presents a large cross section along line F but only a relatively small one along line E. It is not connected to the resistive zone nesr the surface to the eaat on line E and dees not extend any farther south than the southernmost ststion on line F. It comes within 500 m of the surface in the region of the power plant and plunges at a shallow angle to the south. We have no stations distributed across strike near the middle of this resistive zone, so we cannot determine its width, although it appears narrow. It could be a single vertical dike-like body of resistive material, a number of such narrow bodies, or a zone of anisotropic conductivity, more conductive along strike.
Dipole-dipole resistivity measurements have bee. performed along lines D and E. The models developed from these measurements are in close agreement along those lines with rough model from

64
COMO MtlETO UHE D-D' OMERVED agEUDOSCCTIOH xr AmuKMT neatsnviTY
- -sw ctsMmcw^N. at « —
CALCULATED PtOTOatCTIOH xv amucNT KssnviTv
Q l I 3 « ftte
Figure 6, Obierved and calculated apparent raiiativity peeudoaectiona, line D-D', current parallel to geologic etrike. (XBL 796-7532)
(MUCH VCOCL E-E' SECTION
Figure 7. Sean-quantitative eatiaatc of subsurface r e s i s t i v i t y distribution along l ine E-E', vert ica l scale logarithedc. (ZBL 799-1150A)
J t C CI 0 * I fOLOIIt l J - I*
Figure 8. Approximate relationship between the dipping resistive zone •ad subsurfece geology. (XBL 7910-12260}

the magnetotelluric measurements (Hilt ansl Goldstein, 1979). In face the match IwtiMtt the »***-uted and calculated responses for the dc resistivity mode has been signficsntly improved by the inclusion of features frost the "rough*1 magnetoteiluric model into the dipolar-dipole Model.
Except where the resistive sone is shallowest, north of the power plant, the top of the some corresponds veil to the first occurrence of significant hydrothemal alteration as determined fro* vail samples. Very little ad.neralof.ical data ar'. available froat wells to the north, but what is available does not show any sharp increase in the depth to the altered zone. We are reminded that tfc* bulk resistivity properties ae Measured from the surface ere determined by many factors, auch as the train »f fracturing in fault zones. They all suet be included to explain the .esistivity structure; and we do not have any really satisfactory explanation of the lateral chance of resistivity to the north.
It is likely that the history of geothermal activity at Cerro Frieto has included phases of induration of the sediments by hydrothermal solutions interrupted by faulting and fracturing that opened new paths for hydrothermal solutions aad provided connective pathways for dissolution and resulting secondary porosity of the sandstones (Lyons, 1979t personal communication.). However, the gross features of the structure in the current production zone can be explained most simply in terms of hydrothermal alteration of the sediments by geothermal fluids emanating from a source at depth ahcut 4 km to the south-southeast of the pres-sent plant and flowing along the general regional strike in s zone of faulting to the north-northwest. A well of great capacity has been recently completed rbout 3 km to the southeast of the plant, supporting this picture.
The conductive layer at 2 km depth to the east may indicate that the circulation system now extends to this region and that recharge to the production zone may also be coming from reservoir rocks underlying the central portion of the Hexicali Valley.
PLANKED ACTIVITIES FOR 1980
He plan to add another Line of stations parallel to lines D and E, about 4 km south of the plant, c«er the apparent root oE the resistive zone. We hope this line will yield significant information about the hydrothermal flow around the source of the heat.
A more fundas-antal objective is to improve interpretation of magnetotelluric measurements.
65
At present there i s mo program that cam ealenlnte the responses that wemW ha observes" for onr rough anee l . Ksanetotellncic smsssi—mals cast he perforata to almost arbitrary accuracy with the mse of a remote reference) net the promise of negneto-tellmrica w i l l mot he f u l f i l l e d wati l some enant i -ta t ive aeeme i s eevelopee' for direct approximate inversion of the —ass ram sets t o determine the connectivity acme tare of the g-owno1 i n complex s i c i t a t i o n s .
UpniHcxs CHID Elders, W. *., noanland, J. *., McDowell, S. E.,
and Cobo, ft. J., 1979. lyerotnermal mineral zones in the geothermal reservoir of Cerro Prieto, in Proceedings, First Symposium on the Cerro Prieto Ceothemai Field, Baja California, Mexico, September 197*. Berkeley, Lawrence serkeley Laborttory, LSL-7098, p. 68-75.
Gamble, T. 0., 1978. demote reference magnatotel-lurica with SQUID (Ph.D. diesertation). Berkeley, Lawrence Berkeley Laboratory, LBL-8062.
Gamble, T. D., Goubau, W. H. Goldstein, H. E., and Clarke, J., 1979a. Referenced magneto-tallurica at Cerro Frieto, ^n Proceedings of the Pirat Symposium on the Cerro Frieto Geothermal Field, Baja California, Mexico: Berkeley, Lawrence Berktley Laboratory, LBL-7098. , 1979b. Magnetotelluric survey at Cerro Prieto, in Earth Sciences Division Annual leport 1978. Berkeley, Lawrence Berkeley Laboratory, LBL-8*4B, p. 41-42.
Gamble, T. D., Goubau, W. M., and Clarke, J., 1979c. Hagneeotellurica with a remote magnetic referenda. Geophysics, v. 44, no. 1, p. 53-68. , 1979d. Error analysis for remote reference magnetotellurics. Geophysics, v. 44, no. 5, p. 959-968.
Gamble, T. D. Gonbau, ft*. H., Goldstein, K. E., Miracky, R., Stark, M. and Clarke, J., October 1980. Magnetotelluric studies at Cerro Prieto, In Proceedings, Second Symposium on the Cerro Prieto Geothermal Field, Baja California, Mexico, October 1979. Hexicali, Comisio-Federal de Electricidad.
Oldenburg, D. V., 1979. One dimensions! inversion of natural source magnetotelluric observations. Geophysics, v. 44, no. 7, p. 1218-1244.
Wilt, M., and Goldstein, H. E., 1979. Resistivity monitoring at Cerro Frietot La Proceedings, Second Symposium on the Cerro Prieto Geothermal Field, Baja California, Mexico, October 1979. Mexicali, Collision Federal de Electricidad.

66
PRECISION GRAVITY STUDIES AT THE CERRO PRIETO GEOTHBtMAL H O D R. B. Grannell,* D. W. Tarman,t R. C. Clover,* R. M. Leggewie,* P. S. Aronstarn,* R. C. Kroll,*and J. Eppinkt
From January to March 1979, 60 permanent gravity acationi in the Cerro Prieto gaothermel field were reoccupied for the collection of data, a i car alter their initial occupation in early 1978 (Ch'jse et al., 1973; Grannell et al., 1979). For the collection of both data acta, each station was occupied four times and vaa replicated four times at an individual occupation, for a total of 16 reading*. Two LaCoate and Romberg G-model gravity meter* were used. In a looping technique, individual stations were surveyed between two base station occupations, taken up to five hour* apart. This procedure allowed identification of tares and partial removal of instrumental drift.
The data were reduced to observed gravity values using meter calibration* and the appropriate corrections for both earth tides and instrumental drift. The station values were then referred to a bedrock base, presumed stable and non-subsiding over short time intervals, (several years). This base is located on granitic rock* in the Sierra Cucupa, weat of the gcothermal field.
A comparison of reduced data from the two periods shows no significant gravity change* in that interval. This result is consistent with the results of first- and second-order level inc. carried
California State University, Lang Beach •^California State Polytechnic University, San Luis Obispo
INTRODUCTION
Fiscal year 1979 was the third year of LBL's responsibility for the Geothermal Reservoir Engineering Management Program (GREMP) on behalf of the U. S. Department of Energy, Division of Geothermal Energy. The concept behind this program is explained in Lawrence Berkeley Laboratory report LBL-7000. Its history since 1977 is summarized in Earth Science Division Annual Reports of 1977 and 1978.
Fiscal 1979 was marked by the conclusion of a number of contracts supported by the program and by relative decline in the number of new contracts when compared with 1978. Overall, the GREMP program has shown typical signs of growth and maturity: fiscal 1977 was devoted largely to planning and getting the program initiated; fiscal year 197B was characterized by an appreciable amount of new contracting; and fiscal year 1979 was devoted to the conclusion of many contracts and a call for serious review and possible redirection and
out by CFE within and adjacent to the Cerro Prieto geothermal field. The possible reasons for lack of gravity change* are fourfold: (1) insufficient time at the current rate of production to produce measurable changes; (2) local recharge to offset maas losses; (3) drawdown in an area not covered by the gravity survey (possible to the weat); and (4) changes too small to be detected at the current level of precision (10 to l?ugals).
1EFEBENCCS CITED
Chase, D. 5., Clover, K. C , Grannel, K. B., Leggewie, K. M., Eppink, J., Tanun, D. w., and Goldstein, M. E., 1979. Precision gravity studies at Cerro Prieto, in Proceedings, First Symposium on the Cerro Prieto Geothcrmal Field, Baja California, Mexico, September 1970. ierkcley, Lawrence Berkeley Laboratory, L1L-709S, p. 249-256.
Granaell, K. B., Tarman, D. V., Aroastam, ?., Clover, 1. C , Leggewie, K. M., Eppink, J., and troll, K., 1979. Precision gravity measurement* in the Cerro Prieto gcothermal arc*, in Abstract*, Second Symposium on the Cerro P^ieto Geothermal Field, Baja California, Mexico. Kexiceli, Comiaion Federal de Electricidad, p. 37-39.
reorganization of the effort.
ACTIVITIES IN FISCAL YEAR 1979
Administrative Highlights
New contracts were let iu fiscal year 1979 for work on tracers in geothermal reservoirs (with Vetter Research) and for work on declines of geothermal well production (with E. Zais and Associates). Contracts with Princeton University, University of California at Riverside, and Stanford University, which started under the NSF-RANN program, were continued.
From its start at LBL through this fiscal year, 23 distinguishable research projects have been addressed through the effortB of 14 institutions. This work is summarized in Figure 1, which shows the relationship of these various projects to the overall GRSMP plan. Table 1 gives a brief statement of explanation of each of these projects.
GEOTHERMAL RESERVOIR ENGINEERING MANAGEMENT PROGRAM: DEVELOPMENTS IN FISCAL 1979 I. H. Howard and W. J. Schwarz
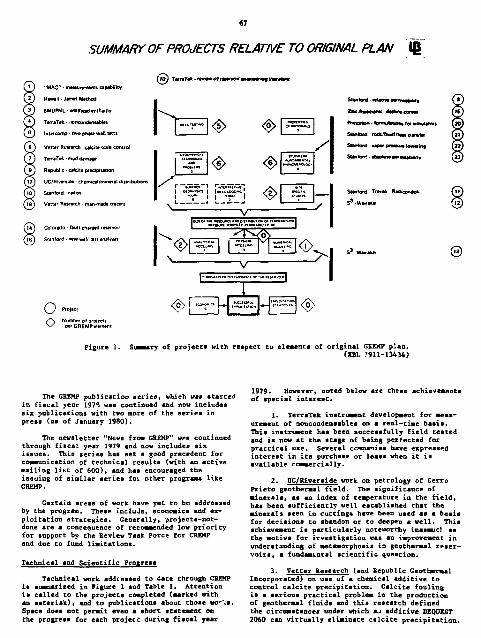
SUMMARY OF PROJECTS RELATIVE TO ORIGINAL PLAN l g
"MAC" - nMHuniMnif capability
Hawaii • Jamet Mtthod
BMI/FNL -wellhead enthalpy
TerraTek • wncondemable*
Inteicomp - two-phetewell leni
Vetter Roe arch calcite Kale control
TerreTek • mud <U magr
Republic • calciie ptadpitatKin
UC'Rivertida - chrmml/mBietil diitribubont
Sun lend - radon
Veitar Retei'Cn . mtn-mtOl t rawl
Co'oiedo - fauli charged i t * f w «
Stanlo«J new well teii arulytei
©' c " - t — ' - * - — r r - n M S ' i i i i
yr-a
<s>
•~ i
/ Stanford! rodtmudt^M t> a n Irr
Stanford T»a»afc
S 3-Mf a - * * *
S 3 W*r***- ©
O o
Figure 1. Su iary of projects with respect to elements of original GEEHP plan. (XBL .'911-1343A)
The GREMP publication series, which was started in fiscal year 197*J was continued and now includes six publications with two more of the series in press (as of January 1980).
The newsletter "Newt from GREMP" w*s continued through fiscal year 1979 and now includes six issues. This series has set s good precedent for coraaunication of technical results (with an active nailing list of 600), and has encouraged the issuing of similar series foi other programs like GREMP.
Certain areas of work, have yet to be addressed by the program. These incluJe, economics and exploitation strategies. Generally, projects-not-done are a consequence of recommended low priority for support by the Review Task Force for GREMP and due to fund limitations.
Technical and Scientific Progress
Technical work addressed to date through GREMP is sumciarized in Figure 1 and Table 1. Attention is called to the projects completed (marked with an asterisk), and to publications about those wo-'is. Space does not permit even a short statement on the progress for each project during fiscal year
1979. However, noted below are three achievements of special interest.
1. TerraTek instrument development for meas-uremeut of noneondensablea on a real-time basis. This instrument has been successfully field tested and is now at the stage of being perfected for praccicsl use. Several ccro»»ies have expressed interest in its purchase or lease when it is available commercially.
2. DC/Riverside work on petrology of Cerro Prieto geothermal field. The significance of minerals, as an index of temperature in the field, has been sufficiently well established that the minerals seen in cuttings have been used as a basis for decisions to abandon or to deepen a well. This achievement is particularly noteworthy inasmuch as the motive for irrestigation was an improvement in understanding of metamorphosis in geothermal reservoirs, a fundamental scientific question.
3. Vetter Research (and Republic Geothermal Incorporated) on use of a chemical additive to control calcite precipitation. Calcite fouling is a serious practical problem in the production of geothermal fluids and this research defined the circumstances under which a-i additive VEQUZST 2060 can virtually eliminate cslcite precipitation.

Swswry of Geothermal Reservoir Engineering pro jects supported by USOOC/DGE through Lawrence Berkeley Laboratory.
r t e f pro ject n w e Brief l tary o f work
status of reservoi r Measurement r e l a t e d measurements* Analysts
Corp.
Tneoretical oasis U n i v e r s i t y for j«nes method of Hawaii measurement of Battel1e enthalpy at Pacific wellnead* Northwest
Laboratory
Measurements of TerraTek noncondensiole ^ases at wellnead Lontrol of calcite Vetter p r e c i p i t a t i o n by Research ado i t ives* Analysis of wel l I n t e r c o m tes ts of two-phasfl reservoir
Formation damage TerraTefc of or i11 ing mud
f . i l a t iwe permeabi l i ty Stanford uf steam and water Un ivers i ty L a l c i t e formation Hepublie ay inappropriate l ieothermal. trroauction Inc . pract ices
L i te ra tu re review TerraTek of reservoi r e x p l o i t a t i o n * study of the Stanford Traualt Kadicondoli Un ivers i ty yeotnermal areas In I t a l y
uata c o l l e c t i o n for the na i rekei f i e l d , new Zealand* simulation of past ana fu ture per for mance at w a i r a k e i , Prototype of a f a u l t -cnaryed geothermal reservo i r * Keview of decl ine curves appropriate to yentnermal reservo i rs new ana ly t ica l well t e s t metnoOS for oeotnermal reservoirs Studies of mineral fac ies and stable isotopes and t h e i r r e l a tions to geothermal reservo i rs
understanding the s i g n i f icance of radon in yeotHernial reservo i rs . Studies of the use of t racers in geothermal reservo i rs btudy of basic formul a t i o n of simulat ion of yeothermal reser v o i r s .
studies of neat t r a n s - Stanford fe r from rock to f l u i d Univers i ty Vapor pressure lower- Stanford ing pnenomena of geo-tnennal f l u i d s *uisolute permeabi l i ty of geotnermal f l u i d s
Systems, Science and Software Systems, Science and Software Univers i ty of Colorado
E. Zais a/id Associates
Stanford Univers i ty
Univers i ty of C a l l f o r n t i Riverside
Stanford Un ivers i ty
Princeton Univers i ty
Univers i ty
Stanford Univers i ty
A coaprehenslve appra isa l of measurement needs and Instrumentat ion for geothermal appl icat ions has been completed, ind ica t ing tha t comrerc ia l l y a v a i l ab le technology and Instrumentat ion e x i s t s in p r i n c i p l e f o r a l l wellhead and process plcnt measurement requirements, except two-phase f low (Lamers, 1979) .
The purpose of t h i s p ro jec t i s to understand the theoret ic / * I bas is o f James' empir ica l method f o r es t imat ing mass f low and enthalpy (Cheng, 1979) .
Several ca lor lmetry methods f o r measuring geotheraal we l l tead eivthalples were reviewed, it mixing t e e condenser was recommended f o r use when cool ing water i s a v a i l a b l e , when n o t > a multiphase tank was recommended, work en engineering drawings of a sampling system and a mixing r.ee condenser ( C l i f f e t a l . , 1979*) have been prepared [ C l i f f e t a ! . , 1979b) .
Engineering design construct ion and t e s t i n g o f a device w i t h the c a p a b i l i t y t o monitor noncondensfbte gas concentrat ions continuously 1n geothemat d i s charges nas been compteted (Harr ison e t a l . , 1979 ) .
Scale i n h i b i t o r t e s t s performed a t Republic Geothermal I n c . , East Mesa w e l l s have shown tha t Dequest can econoeir.asly e l i m i n a t e c a l c i t e p r e c i p i t a t i o n in the discharge f low stream ( V e t t e r , 1 9 / 9 ) .
Favorable comparison o f Intercomp's p r o p r i e t a r y geotheraal wel lbore and reser voi r simulators w i th the experimental and numerical r e s u l t s from three other models has been completed. Oata on two-phase we l l t e s t s have been assembled for analys is (Aydelot te and T j y i o r , 1979} and the Hawaiian we l l HCP-4 has been s tud ied .
Laboratory s imulat ion of d r i l l i n g mud damage to geothermal reservo i r rocks has been i n i t i a t e d . Parameters t o be considered are pressure, temperature, reservo i r f l u i d chemistry, mud composit ion, and t ime [ B u t t e r s , 1979) .
Re la t ive permeabf l f ty data have been c o l l e c t e d by Counsfl ( 1 9 7 6 ) .
Carbonate-r ich geothermal brir.? is being passed through containers of granular mater ia ls in order to eva luate the oechanfsn ami r a t e of c a l c i t e p r e c i p i t a t i o n w i t h i n the pore space. Iho u l t i m a t e p r a c t i c a l purpose of the a c t i v i t y is to plan be t te r remedial "acid Jobs" on c a l c i t e - f o u l e d geothennal wel ls (Michaels , 1979) .
An annotated bibl iography covering reservo i r modeling, e x p l o i t a t i o n s t r a t e g i e s , and i n t e r p r e t a t i o n of production trends has been prepared (Harr ison and Randal l , 1979) .
Geology and pressure-production h i s t o r y of Serrazzanc -eservot r have been reviewed. Bottomhole temperatures and pressures have been ca lcu la ted from wellhead measurements. Areal d i s t r i b u t i o n of pressure has been napped for seven d i f f e r e n t t i n e s spanning the l a s t IS y e a r s . A conceptual model of T rava i l Radicondoli geothermal H e l d was developed on the basis of the a v a i l able f i e l d data {Hi H e r e t * l . 1978 ) .
A l l geo log ica l , geocheaical , geophysical , and we11bore data from January, 1953 to December, 1976 has been eo l tected and synthesized ( P r i t e h e t t et a l . , 1978) .
wi th the data co l lec ted a-id synthesized (#12 above), an attempt is under way to match the pressure, enthalpy and subsidence History during past production of the Wa ' rake i , New Zealand, f i e l d ( P r i t c h e t t et a l . , 1979) .
A phys ica l , v i a b l e , mathematical model c f an unexplolted geothemal system has been constructed in terns of a f a u l t lone cont ro l led charging of a reservoi r (Kassoy and Goyal . 1979 ) .
The purpose of t h i s pro ject is to review decline- curve procedures used tn the petroleum indust ry , determine which procedures are appl icable to geothermal systems, and es tab l ish a t h e o r e t i c * ' basis fo r a p p l i c a b i l i t y . The u t i l i t y of para l le lep iped modeli has r=en invest igated (Ramey et a l . . 1978) .
Cuttings and core samples, obtained from the si* wells drilled during the year i, 1977 were studied and interpreted to define the current temperatures in the
fle'd (Elders et al., 197B).
The variation of radon associated with geothermal reservoir production has been analyzed and interpreted for several reservoirs throughout the world (Kruger et al,, 1978).
A program of literature review and laboratory evaluation of tracers suitacle for use in geothermal reservoirs has been Initiated.
Multiphase flow equations have been derived for a deformable porous medium. Equations for heat and mass transfer in a fractured reservoir have also been formulated. A computer code BIFFPS (Slock Interactive Finite Element Processed Scheme) has been developed to solve nonlinear t.ansient problems with one or two governing equation:, (n two or three dimensions.(Pinder et al.. 1978). Ksat flow from rock to water has been studied as a function of a number of parameters including the size of rock fragments (Kruger et al., 1979),
Th'. project demonstrated that vapor pressure may be lowered as a consequence of a number of chemical and petrophysical parameters (Miller et al., 1979). parameters (Miller et al., 1979).
The effects of temperature and chemical composition of the rock types on relative permeability has been investigated (Miller et al., 1978).
' Project completed.

69
It «hould also be noted that, the Fifth Annual Stanford Geo thermal Reservoir Engineering Workshop was held, This workshop is of special significance to GREMP. To some extent, it Measures the existence and viability uf a geothermal reservoir engineering professional working community and also reveals Che extent to which students (tomorrow's geothermal reservoir engineers) are entering the community. These concerns sre a part of the GREHP program, and judging from the workshop, i t would be fair to say that the community is alive and well, and that an adequate number of students are entering the comninity.
Activities Planned for Fiscal Year 1980
Several changes are planned for the GXEMF program in fiscal year 1980. It is anticipated that primary responsibility for administering the program will begin a transfer to DOE/SAN. A major revision of the plans for GREMP is ecpested to take place. Prom a technical point of view the following activities are expected to receive em-phasis, as budgets allow:
I. Evaluating the basic validity of c.nputerized reservoir simulators and the effectiveness with which they can be applied to specific reservoirs (to be handled by DOE/SAN)
2, Evaluating techniques of measurement of two-phase mass flow
3. Relating well cuttings and core to porosity and permeability.
In addition, of course, projectB under contract should continue in force to their successful conclusion.
KEFItmCES CITED
Cliff. W. C , Apley, H. J., and Crcer, J. H., 1979. Evaluation of potential geothermal wellhead flow sampling and calorimetry Methods. Berkeley* Lawrence Berkeley Laboratory, LBL-9248. CUMP-7.
Elders, U. A.. Hoagland, J. R., Olson, E. R., McDowell, S. D., and Collier, P., 1978. A comprehensive study of samples froa seothermal reservoirs. Riverside, University of California, UCR/IGFP-7S/26 (also UL-90S8, GMMF-4).
Harrison, Roger, and Randall, Georgia, 1979. Annotated research bibliography for geotheraal reservoir engineering. Berkeley, Lawrence Berkeley Laboratory, LBL-8664, G1EMF-1.
Kaasoy, D. £., snJ Goyal, E. P., 1979. Modeling heat and mass transfer at the Mesa anomaly, Imperial Valley, California. Berkeley, Lawrence Berkeley Laboratory, LBL-87S4, GREHF-3.
Lasers. Michael D., 1979. An appraisal of measurement methods for geothermal well system parameters, Berkeley, Lawrence Berkeley Laboratory, LBL-90S0, GREMF-6.
Lawrence Berkeley Laboratory, Earth Sciences Division. 1977. Geothermal reservoir engineering management program plan (GREMP plan). Berkeley, Lawrence Berkeley Laboratory. LBL-7000, 135 p.
Lawrence Berkeley Laboratory. 1978. Earth Science! Division annual report 19/B. Berkeley, Lawrence Berkeley Laboratory, LBL-8648, 251 p.
Pritchett, J. M., Rice, L. P., ana Garg, S. K., 1978. Sisimary of reservoir engineering data: Wairakei geothermal field. Berkeley, Lawrence Berkeley Laboratory, LBL-8669, GREMP-2.
Vetter, 0. J., 1979. Scale inhibitor teace at East Hesa. Berkeley, Lawrence Berkeley Laboratory, LBL-90B9, GREMP-5.
EVALUATION OF CITY WELL 1, KLAMATH FALLS, OREGON S. M. Benson, C. B. Goranson, and R. C. Schroeder
ABSTRACT
A city-wide geothermal apace heating project is currently under development at Klamath Falls, Oregon. The first phase of the project will require two production wells. Geothermally heated water will be used t~ heat 14 city, county, state, and federal buildings. At peak load the heating system will require approximately 750 gpm of 200°F (or greater) geothermal brine.
Three observation wells were monitored to determine the impact of producing large quantities of brine on the many private geothermal wells already in use for space heating. Preliminary indications are that the water level decline in the area will be small (2 to 3 ft). However, further testing is recommended to determine the effects of reservoir heterogeneity on the water level decline.
INTRODUCTION
The first production well was spudded on August 29, 1979. During drilling a najor lost circulation zone was encountered between 340 and 360 ft depth. AL :hin time the well was cleaned, reamed, caBed to 300 ft, and then pump tested. The well was pumped for a total of 15-1/2 hr. A maximum flow rate of 680 gpm, with 77 ft of drawdown, was held constant for 7-1/2 hr. Discharge temperature was approximately 218°F.
A city-wide geothernial space heating project is currently under development at Klamath Falls, Oregon. Phase I of the project involves drilling two production wells, constructing a pipeline to transport the geothermal brine, designing a heat-exchanger system, and retrofitting 14 city, county, state, and federal buildings to use geothermally heated water. A flow rate of approximately 750 gpm of 200°F brine is required to meet the maximum heat load for Phase I of the project.

70
The first of two production veils was spudded on August 21, 1979. The selection of the drill site was based on several factors: proximity to the most active thermal region, availability of land, and distance frost the existing private geo-thermal wells already in use. As part of the overall resource delineation study, lithologic logs fro* roughly 40 veils have been collected and examined. Frost these, two likely production zones have been identified. The first is at a depth of 200 ft, and the second is at a depth of 750 ft. While drilling the first well, a lost circulation zone was encountered between 340 and 360 ft. At this time, the well was reamed to 17-1/2 in. A 12-in. casing was then set «t 300 ft. The well was pump tested for a total of 15-1/2 hr.
The purpose of the pump-test was twofold. First, the flow rate, well drawdown, snd the wellhead production temperature was measured to determine the feasibility of using this aquifier as the production sone for Phase I of the district heating project. It .. is also necessary to measure the impact of producing large quantities of fluid from this none on the many private geothermal wells in the area. If excessive drawdown of the surrounding wells took plsce, it would not be possible to use this aquifer as a producing zone for the project. A short term interference test (8 hr) was run in conjunction with s productivity test to determine inter-well communication and, if possible, to predict the effect of sustained production on the surrounding wells. The results of the tests will be discussed here.
WELL COMPLETION AND LITHOLOGY
A Summary of the drilling rate, lost circulation zones, snd lithology for City Well-1 is shown in Table 1. As is typical of the wells in this ares, a sequence of roughly 250 ft of lacustrine and volcanic sediments overlie larger units of black, grey and "red" basalts. Several substsntial lost circulation zones were encountered, one at about 195 ft and a second at 350 ft. The first occurred in a brown shale, and the second in an altered reddish basalt previously identified as a potential producing aquifer. When the second zone was encountered, the well was reamed to 17-1/2 in. and a 12-in. casing was cemented from ground level down to 300 ft. From 300 to 360 ft the well was left uncased.
WELL TEST DESIGN
The well test was designed with three primary objectives:
1. To determine if the shallow aquifier is suitable as a production zone for Phase I of the district heating program.
2. To obtain a aore comprehensive model of the hydrogeology of the Klamath Falls KGRA (Known Geothermsl Resource).
3. To assist in obtaining a data base to be used in Establishing a. resource management program.
io accomplish these objectives, a productivity test and a short term interference test were performed simultaneously. In thi» paper we will discuas the results of this test insofar as they pertain to the development of the district heating project-
Several factors must be taken into account in determining if the shallow aquifer is « suitable production zone for Phase I of the district heating program. First, flowing wellhead temperatures must be greater than 200°F to satisfy the heat-exchanger design specifications. A flow rate of 350 gpm with less than 250 ft of drawdown in the well must be obtained (one-hslf the required total flow rate baaed on peak load demands.) Finally, there must be a negligible impact (both thermal and hyilrologic) on the many private geo-thermal wells in use for space beating, domestic hot water, and industrial processing.
PfcOD TTI0H TEST RESULTS
For the production test, City Well-1 was pumped for a total of 15-1/2 hr. Table 2 summarises the pumping time, flow rate, flowing wellhead temperature, and drawdown. During the test, a maximum pumping rate of approximately 680 gpm with 77 ft of drawdown waa held constant for 7-1/2 hr. Discharge temperatures measured at this time varied between 217 and 219<>F. The small drawdown at this rate far exceeded estimates for the shallow aquifer production capacity.
The water level in the pumped well was measured using an electric probe. The primary flow rste measuring device used wss so orifice piste with a bourdon tube pressure gauge on the upstream side of the orifice. Because the brine flsshed downstream of the orifice, the accuracy of the measured flow rste is poor. However, other methods were slso used to estimate the flow rates, and those value* were in close agreement with those obtained from the orifice measurement. The estimated flow rates are probably not accurate to better than 15Z of the stated value. Higher flow rates could have been obtained with a deeper pump setting if the surface equipment (discharge pipe, pump platform, pump packing) had been more suitable (water well pumpi.ig equipment was used). Wellhead temperatures vera measured continuously upstream from the orifice using an RTD probe. These vslues sre believed to be accurate to ±0.2°F.
INTERFERENCE TESTING
Three observation wells were used to monitor the impact of pumping large volumes of fluid from City We»1-1. Figure 1 shows the location of these wells. Two of the wells, the Head Well snd the Adsmcheck Well, are in an ares where a large number of geothermal wells sre currently in use. The monitor wells are completed in a similar manner and to similar depths as the many existing wells in this area. These monitor wells will most likely reflect the behavior in other existing wells.
In Figure 2 the well completion and well lithology are shown for each wall. As shown in

TABLE 3 noni INC. A M P cnMPLETlnw H I S T O P V fir C I T Y M F..
KLAMATH FALLS CITY WELL I SPUD DATE AND TIME - AUGUST 21, 1979, 16*0 HOURS COMPLETION DATE - SEPTEMBEP 17, 1979 CASING RECORD - 300 FT OF 12 IN BLANK CAS NG
ORILL1NG RATE FT/HR
MUD TEMP MUD LOSSES/ WARM ENTR1
LITHOLOG1C COLUMN
SAMPLE DESCRIPTION—
0-2 FT - TO 0 SOIL
2-20 FT - DIATOHITE, WHITE. SILICA FILLED 20-47 FT - ^IATOMITE. WHITE VEINS
47-66 FT - OIAT0M1TE, SOME GREY SHALE
66-93 FT - GREY SHALE AND CLAY
90
100
110
120
130
140
150
160
170
180
190
195
200
210
220
230
240
250
260
265
270
280
285
290
300
310
320
330
340
3S0
360
MUD TEMP INCREASING
- WARM WATER
ENTRY 160-170=T
- WARM WATER
ENTRY 178-185 FT
- SUBSTANTIAL
MUD LOS5-195 FT
- LOSING MUD
J 95-245 FT
LOST CIRCULATION
AT 24B FT
CONTINUOUS
SLOW LOSS OF MUD
LOST CIRCULATION
292-29B FT
LOSING MUD
- LOSING MUD 3<tO - 360 FT
93-104 FT - BLACK SHALE
104-116 ^ T - GTEv SHALE
116-147 FT - BTOWN SHALE AND CLAY
147-152 FT - G7EV SHALE ANO CLAY
15Z-I60 FT - BTOWN SHALE 4ND GREY TUFF
160-170 FT - GREY TyFF AND SHALE
170-198 P T - BTOWN SHALE
198-243 *T - 8i_UG AND CRHV SHALE
243-253 FT - STREAV DEPOSIT OVERLYING BLACK BASALT, CONSIDERABLE 'ULUE' QUARTZ VEINING
253-276 FT - G EY EASALT-SOFT
276-279 FT - GREY BASALT-HARD
279-235 FT - REDDISH BROWN BASALT
285-341 FT - HARD GREY BASALT AND CLAY
341 FT - END OF HARD BASALT
341-360 FT - RED BASALT

TABLE 2 SUMMARY OF PRODUCTION TEST (CITY WELL 1)
T IME FLOMRATE TEMPERATURE PUMPING
LEVEL DRAWOMN
5 HRS 2 6 0 GPM 212° F 111 FT 35 FT
2 W S 1 8 0 GPH 215°F U5 FT 39 FT
1 HRS 5 5 0 GPM 217°F 125 FT 19 FT
7 .5 HRS 6 8 0 GPM 217-219°F 153 FT 77 FT
STATIC WATER LEVEL »ELL DEPTH CASING SIZE OPEN INTERVAL PUMP SETTING
•>- 76 FT
•'•MO FT
\Z IN
3 0 0 - 3 5 0 FT
ZOO FT ( S I N . COLUMN. S I N SOULS)
Figure 1. Locationi of monitor wella and City Well-1. (JBL 802-8113)
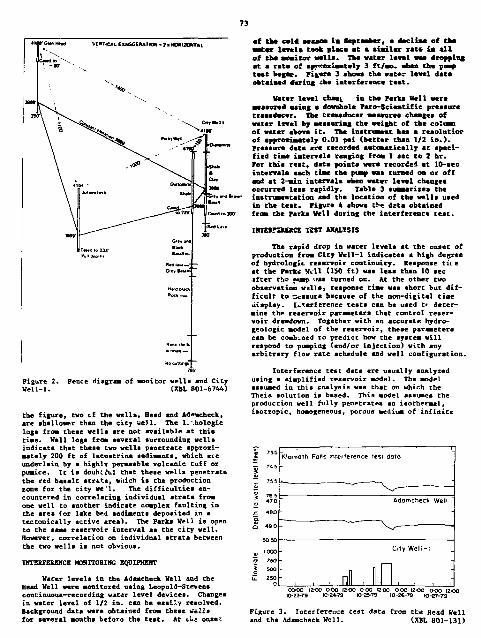
73
of aonitor wella and City (XM. 801-6744)
the figure, two if the well*, Head and Ad**scheck, •re ah* I lower than the city w U . The i: hologic loga fro* these wells are not available at this time. Well logs from several surrounding wells indicate that these two veils penetrate approximately 200 ft of lacustrine sediments, which are underlain by a highly permeable volcanic tuff or pumice. It is doubtful that these wells penetrate the red basalt strtta, wiiich is the production sone for the city well. The difficulties encountered in correlating individual strata froa one well to another indicate complex faulting in the area (or lake bed sediaents deposited in a tectonically active area). The Parks Well is open to the same reservoir interval as the city well. However, correlation on individual strata between the two wells is not obvious.
INTERFERENCE MONITORING EQUIPMENT
Water levels in the Adamcheck Well and the Head Well were monitored using Leopold-Stevens continuous-recording water level devices. Changes in water level of 1/2 in. can be easily resolved. Background data were obtained froa these W E I I S for several months before the teat. At it& onset
•f the c a U a*aaoa im September, a declis* of tarn water lamia took place at a aiailar rat* ia all of tb* awaitor walla. The watar level waa dropping at a rate of appKoxiawtclj 3 ft/ao. wham the puma teat begar. Figure 3 abowa the water level data obtained daring ihe interference teat.
Hater level chan^ in the Parka Well were •eaaorcd using a dowahole Faro-Scientific pressure traaadacer. The transducer acasures changes of water level by meaauriag the weight of the column of water above it. The inatnaaamt haa a resolutlor of approximately 0.01 pai (better than 1/2 in.). Pressure data are recorded automatically at specified time intervale ranging from 1 aec to 2 hr. For thia teat, data poicte were recorded at 10-aec intervale each tiae the pwsp was turned on or off and at 2-ain intervals when water level chengee occurred leas rapidly. Table 3 suamarixea the instrumentation and the location of the wells uaed in the test. Figure 4 shows £>« deca obtained from the Parks Well during the interference test.
iirrnrauscE TEST ANALYSIS
The rapid drop in water levels at the onset of production froa City Wei1-1 indicates a high degree of hydrologic reservoir continuity. Response tite at the Park* Will C1S0 ft) was less than 10 sec -lfter the pomp »»ae turned on. At the other two observation wills, response time was short but difficult to caaute because of the non-digital tiae iiiaplay. Interference tests can be used tt determine the reservoir parameters that control reservoir drawdown. Together with an accurate hydro-geologic aodel of the reservoir, these parameters can be combined to predict how the system will respond to pumping (and/or injection) with any arbitrary flow rate schedule and well configuration.
Interference test data are usually analysed using a simplified reservoir model. The aodel assumed in this en*lysis was chat on which the Theis solution is based. This model assumes the production well fully penetrates an isothermal, isotropic, homogeneous, porous medium of infinite
-«, 7 1 5
T> 74 5
7 5 5
i 7 6 5 i ° 4 BO
s s 4 9 0
50 50
1000
s u. 2 5 0
I Klamath Falls interference lest data lest data
Adomcheck Well
"
Adomcheck Well
"
: . , , nfl ,
City Well-!
m , . , • Figure 3. Interference test data from the Head Well and the Adamcheck Well. (XBL 801-131)

TABLE 3 SUMMARY OF INTERFERENCE TEST
HELL LOCATION DISTANCE TO CITY WELL 1
INSTRUMENTATION DRAWDOWN AFTER 7 Wt HRS * 610 GPM
PARKS OLD FORT RD. 1»0 FT DOWNHOLE PRESSURE TRANSDUCER
1.2 FT
ADAH-CHECK
HERBERT C LAGUNA ST.
1000 FT CONTINUOUS WATER LEVEL RECORDER
7 1H
HEAD NEWCASTLE 1*20 FT CONTINUOUS HATER LEVEL RECORDER
7 IN
areal extent and constant thickness. The data from the Adamcheck Well and the Head Hell are shown matched to the Theis curve in Figures 5 and 6 respectively. The match of the data is acceptable For these small measured drawdowns. The transmis-sivity values calculated ranee from 1.4 x 10' to 1.5 x 10? rad-ft/cp and the atorativity values range from 2.4 x 10" 3 to 7.8 x 10" 3 ft/psi. The data begin departing from the Theis curve toward the end of the test, indicating that some sort of hydrologic boundary or reservoir heterogeneity may be affecting the reservoir response. Another explanation for the departure from the Theis curve is that the reservoir water level trend recorded before the teat is affecting the drawdown.
A nonlinear least-squares matching program developed at LBL was then used to determine if an impermeable reservoir boundary vas affecting the drawdown at the observation wells. The program uses the method of images to locate reservoir boundaries. The matches obtained from the computer analysis are shown in Figures 7,9, and 9. Two of the wells, the Adamcheck Hell and the Parks Hell, suggest that an impermeable boundary may be affecting the data* The location of this boundary, however, is contmiquR. A longer test with a constant background pressure is necessary to determine both the existence and location, of a boundary. Table 4 stasmarizec the re alts obtained from the computer analysis.
Figure 4. Interference data from Parka Hell. (XBL 801-132)
Glenhead Nol interference lest dolo onalysis
Drawdown after-7.5 hours, 0.6 feet 17")
1000 KJpOO IOOJOOO 1000,000 - 2 years Flowing time (minuies)
Figure 5. Theia curve match of interference teat data from the Head Well. (X3L 801-134)

Adomchtcfc wtll inlcff«r«nct left data analysis
tooo lojooo raopoo Flowing time (minutes) Time (minutes)
Figure 6. Thei* curve outch of the Adsacheck well interference data. CXBL 801-133)
Figure 8 . Coaputer aatch of the Park* Well in ter ference teat data. (XBL 801-137)
Adamcheck Well * Observed values * Calculafed wlues
* •
s -* ° •
: 200 300 400
Time (minutes)
Glen Head Well • Ooservcd value * Calculattd voiue
too zoo soo «oo Time (minutes)
Figure 7. Computer natch of the Adaacheck Well in terference da ta . (XBL 801-135)
Figure 9 . Coaputer aatch of the Head Well i n t e r ference teac data. (XBL 801-136)
TABLE 4 COMPUTER MATCH OF HELL DATA
KELL DISTANCE TO KH/-U 9CH DISTANCE TO CITY WELL-1 ( H O - F T / C P ) ( F T / P S I 1 BOUNDARY
ADAKCHECK 1000 FT 2 .6 . 1 0 7 1 . 1 - 1 0 " 3 2280 FT
G L E N H E A D 1400 FT 1 . 7 - 1 0 7 1 . 4 - 1 0 - 3
PARKS 200 FT 3 . 3 - 1 0 7 - 4 9 . 1 - 1 0 4 3 0 0 FT

Figure 10 shows « log A3 va log t/r 2 plot for •11 of Che observation wells. If the reservoir model discussed asove was accurate, the date should plot as one curve. The discrepancy could be caused by any of aeveral factors: reservoir heterogeneity, fractures, reservoir boundaries, partial penetration, dual porosity and so on. To accurately discern the cause of the discrepancy, an interference test of longer duration would be necessary*
The values obtained froa the analysis indicate that the shallow reservoir peraeability is very high. Assuming an aquifer thickness of 40 ft. and a viscosity value of 0.3 cp (220°F water), the calculated peraeability value is approximately 100 darciea. The porosity value extracted froa the storativity value (4>cH) using a coapreasibility of 5 x 10"5 psi - 1 is approximately 0.5. This is anomalously bigb, indicating that the values used for the compressibility and reservoir thickness are uncertain.
Figure lo. Log As vs log (At/r ) plot of the Interference test data. (XBL 801-6747}
COttCLDSIOIS
The tests of the riaaath City Well #1 show that the shallow test aquifer is capable of sustained production of at lease 600 gpa at a taapera-ture of about 218°F. Sapid water level changes in the surrounding wells indicate a high degree of hydrodynaaic reservoir continuity through several distinct lighologic units. This would indicate that a fracture network aay be controlling fluid aoveaent in the reservoir. Calculated transais-sivity values froa the interference test indicate a peraeability of approximately 100 darcies. When the pressure behavior over the 8-hr interference test are extrapolated to several years, drawdowns of 2 to 3 ft are predicted at a. austaiaed production rate of 680 gpa. However, the data show s departure froa the Theis curve match near the end of the test interval. This departure could imply greater drawdowns than predicted by these tests. At present no unique explanation can be given to account for this departure. To accurately predict the effecta of sustained production over the lifetime of this project a longer test must be conducted to determine the effects of reservoir heterogeneity on the water level decline in aur-rounding wells. Present indications, froa reservoir testing st the Klamath Falls, are that this system hss s very promising potential for developaent of a large-scale district hesting project.
ACKNOWLEDGEMENTS
We would like to thank G. Park?, C. Head, C. Adaaseheck, and T. Fillmore for allowing us to use their wells in previous anil subsequent reservoir tests at Klamath Falls. Ve alto thank John Lund, Paul Lienau, and Gene Culver froa Oregon Institute of Technology Geo-Heat Utilization Center for their help in obtaining information cm the Klamath Falls resource. Finally, we would like to thank Harold Derrah, Assistsnt City Manager of Klamath Falls, for his patience and help.
EVALUATION OF THE SUSANVILLE, CALIFORNIA, GEOTHERMAL RESOURCE, 1979 S. M. Benson, C. B. Goranson. J. P. Haney, and R. C. Schroeder
INTRODUCTION
The Susanvilie geothermal anomaly is located in northeast California. The presence of aeveral shallow hot-water wells and a natural hot spring initially identified in this area aa a prospective candidate for the development of geothernal energy. Increased fossil fuel cost and the high price of transporting liquified natural gas to the area stimulated interest in developing the resource for a city-wide space-heating program. Since late 1979, the U.S. Bureau of Reclamation and Lawrence Berkeley Laboratory's Earth Sciences Division have collaborated on a geothermal resource evaluation project at Susanville, California. As part of this project, 12 exploratory temperature gradient holes
were drilled, subsurface geologic and geophysical data were analyzed, and a well test was conducted.
The town of Susanville lies at the intersection of three major geologic regimes, the Sierra Nevada Range to the southwest, the Modoc Plateau to the northwest, and the Basin and Range Province which extends into Nevada (Rudser, 1978; O.S. Bureau of Reclamation, 1976a,b,c). Subsurface geology is characterized by interbedded basalt flow, agglomerates, and alluvial conglomerates. Subsurface and surface geologic structure indicate extensive block faulting, with the dominant trend in a northwesterly direction. Subsurface temperature contours indicate the occurrence of the geotherm&l anomaly is fault related.

77
WILLS LM THE CITY 0? S01AJVILLE
Six geotheraal wclla bad b a n trill** in Sueanville before the 1970a. 7 i « wells bed baam uaed for heating a greenhouse, apace beating. aad heating a swiaadng pool, iecauae these veils (Beef well, U)S Church well, looicrilt Swiaaing Fool, aad DtviB well) were drilled long ago little detailed inforauition on well lithology, teaaerature. eoaple-tion. and total depth ia available.
The U.S. Bureau of taclaaation has drilled 12 exploratory wclla and five shallow taaperature gradient hole*. The locations of the twelve exploratory wells are shown in Figure 1. Well jiites were chosen in an etteapt to define the axeal extent of the geotheraal anoaaly. Depths of the well ranged from 135 to 640 a. Well diaaetera were 6 in. and were coapletcd with a 2-in. sealed casing. Two of the wells. Susy-4 and Suzy-6, were completed with 4-in. and 6-in. cuinf,». respectively. The
total depths, caeiag else, ead coapletioa eeheavLe are ebowa ia Pigwrea 2 aal 3.
Detailed, iaterpretatioa of the focaatioa lithology aad geopbyaical bora loga bar* beea ceaaletad. Several diatiact waits, probably offaat by faults, have beam identified. All of the well*, bovver, peaetrated a sequence of basalt,: aad-flov and ash-flow aggloaeratea. Several of tbe wmlls oa the southern portion of the saeasly penetrate alluvial ceagloaeratea. The coateet soaee between the basalt layers aad tbe coagloaaxatea have beea idantified ie the aajor e-sataeraal production soaee. The aggloaerate sad the eoagloaeretea aay alao contribute to the geotberaal production.
TIMFUaXUU DISTKISDTIOV
Teaacreture profiles obteincd froa the wells are shown in Figures 4, 5. and 6. Several of the wells in the southwest portion of the anoaaly dia-
i4oo y>oo
SUSANV1LLE GEOTHERMAl INVESTIGATIONS CfTY OF SUSANVILLE
Bureau Of Reclamation - Lawranc* BarktlCy Laboratory Suianvilta. California
Figure 1, Geothermal well locations in Susanville, California. (XBL 801-6767)

Suzfl S*tr2 S « r 3 Svty4 Ssty-V Swyt P N ) OWR* H H . Ovm U * * 2
1000
I too c o 5 wo _• UJ
700
I 1 J il HI I i
I 1
I
> Il ! Wii! ill *
iji
I ! ! 2. Completion record of the wells in Suaanville, California.
(ML 795-7442)
£ 900
Suzy7 Suiy8 Suzy9 Suzy9o SuzylO Suzy H
Stottd Z cailngt
Suyl StttvZ S*>3 &cy« s*«y5 S^,6 &ar7
"i \ \ " \ V \ \ 100 I \ 1 1 \ 200 1
/ / V IO«OfO »«OtO k>«0 TO 40*0 V * ) « 0 20*010 JO «
Figure 4. Temperature profiles ia wells Suzy-1 to Suzy-7. (XBL 795-7495)
SuiyS Suzy9 Davit
a 40 GO 20406O 204060 20 40 SO 20 40 CO
Figure 3. Well completions of Suzy-7 through Susy- Susy-9 and several older wells in Sursnville, 11 e i n . /i..i; « A« ni • (XBL 7912-13485) r« i-i f r.rni ». CTTIT. 7Q«;_7 11, Sussnville, Culifornia.
Figure 5. Temperature profiles for wells Suzy-8, Susy-9 and several older wells in Suncnville, California. (XBL 795-7496)

Figure 6. Suzy-tl.
20 40 60 80 20 40 60 80
Temperature prof.'-les for Suzy-9a through (XBL 7912-13486)
play temperature reversals with depth. The te»pera-ture reversals take place at depths between 100 and 150 m. The reversals nearly coincide with the contact zonea between the basalt and the conglomerate, which is further evidence that the producing aquifer(s) occur at the contact zones in those wells. Maximum temperatures range from 35°C to 70°C. The hottest wells are Suzy-9 and Suzy-9a. No temperature reversals take piece, indicating the possibility of higher temperatures with depth. However, the productivity of this section of the reservoir is unknown. Further testing in this area will indicate the productivity of these higher-temperature zones.
Temperature contours ut 50 m (1250-m elevation) and 100 m (1200-m elevation) are shown in Figures 7 and 8. The contours are asymmetrically shaped around a northwest-trending axis. The anomaly is
sharply bounded to the west, indicating a hydro-logic or geologic discontinuity (e.g., a fault or fracture zone). To the south, east, and north, the thermal anomaly gradually abates. Analysis of cores and geophysical data suggests cooler groundwater frost saturated strata are mixing with geo-thermal fluids in these sreas. The asymmetrically shaped thermal anmaaly and the noticeable temperature reversal* in he southern portion of the field suggest heated flu- a are upwslling along a northwest-trending fault. They are then dispersed into the reservoir along the most permeable strata. In the southern portion of the anomaly, the basalt-conglomerate interface eopears to be the most permeable.
Figure 7. level.
Temperature contours at 50 ra beli (XBL 806-
iw grourd 7212)

80
5-10 20°
Figure 8. Temperature profiles at 100 m below ground level (XBL 7912-13487)
RESERVOIR TESTING
A well test was conducted by LBL in December 197? and January 1979. During this teat two wells were pumped, the Davis well and the Roosevelt swimming pool well. Water level changes in eight observation wells and one production well were monitored. Table 1 summarizes the instrumentation and we11a used. The test consisted of four segments. The first segment consisted of obtaining background data before pumping the Davis well. However, due to the extremely cold weather the LDS Church well was produced for spr.ce heating. To avoid or minimize any transients associated with the church well flow, the rate was held constant at approximately 90 gpm throughout the background data collection period and the subsequent pumping of the Davis well. The second segment of the teat consisted of pumping the Davis well at a rate of 250 gpm for a period of 9 days. The well waB then shut in and the tuild-up was observed. Several days after the Davis well was BhuL in, the LDS Church well was shut in for 12 hr, then pumped again for several days; shut in for 12 hr and then pumped continuously for the duration of the test. During the last segment of the test the Roosevelt
swimming pool well was pumpbi at a rate of~275 (pa for ihree days and then shut in.
The magnitude of drawdowns at the observation well* in this teat were from 0.3 to l.S • (0.4 to 2.4 pai). The wells with 2-in. casing were instrumented with nitrogen-filled tubing CSuxy-1, Suzy-2, Suxy-3, and Suzy-5). Hell Susy-4 was instrumented with a downtaole Paro-scientific pressure transducer* LH-?. was instrumented with a Hewlett Packard eown-hole transducer. The Haef well was instrumented with a contiguously recording water-level gauge. Water-level data (and pressure data) obtained during the teat for tfc- Maef well, 3«vis well, Suiy-3, Suxy-4 and Lassen Lumber end Box are shown in Figures 9-13.
Several months of background data at the Naef well were obtained before the test by the U.S. Bureau of Reclamation. Figure 14 shows the daily fluctuations of ±0.2 ft superimposed on Isrger magnitude fluctuations throughout the summer montus. Particularly curious is the water lev*:] build-up that took place over several weeks in the esrly fall. At the present time the cause is unknown. However) several possible explanations exist. If rainfall were particularly heavy during this period, influx of this water from either overlying sediments or the river could cause this behavior. Or, the cessation of irrigation after the summer months could cause a pressure build-up in the reservoir. Both of these possibilities sre highly speculative, but pressure data do indicate that the reservoir is effected by external sources.
The sharp peaks and valleys In the data starting at the beginning of September are caused by production et the LDS Church well. An expanded aection of these data, shown in Figure 15, reveals three build-ups and drawdowns corresponding to the Church well being shut in for several hours and then pumped again. Analysis of these data returned a transmissivity value of 3.6 x 10° md-ft/cp and a atorativity value of 2.3 x 10 - i* ft/psi. The best match of the data obtained indicated the pressure response was influenced by an impermeable reservoir boundary. The location of this barrier cannot be established with one observation well. The best match obtained between calculated and observed pressures is shown in Figure 16.
Those wells instrumented with nitrogen-filled tubing (Suzy-1, Suzy-2, Suzy-3, and Suzy-5) were strongly affected by daily temperature and atmospheric pressure changes. Ttr.s noise obscured both the initial pressure and the drawdown (if any) caused by the production weil(s). These data are not considered to be suitable for analysis. The data obtained at Suzy-4 and at the Laewen Lumber and Box wells illustrate drawdowns of 2 psi and 0.5 psi, respectively. Both of these wells show two peculiar features as compared with other wells (see Figures 9, 12, and 13). First, they both show a gradual pressure decrease several days before the Davis well was shut in. Second, they both displayed a pressure build-up before shutting in the Davis well. For this reason, the data from these wells are not suitable for complete analysis.
Because both of these v:ells incurred a drawdown due to the Davis well rroduction it can be

Table 1. Summary of instrumentation and wells used in Susanville, California well tests.
Test Measurement Well Classification Parameter Instrumentation
Observation K inr Level
Davis Production- Pressure observation
Leupold-Stevens type 0.1 It A water level recorder, owned by USBR
40 ft of tubing in pipe-pump annulus, connected Paroscientific pressure transducer
0.01 psi
Clear evidence of communication between Dtvis well t church well and the Bvinming pool well. Accuracy of data uncertain between 12/16/78 to 12/20/79 due to sticking of water level recorder.
Aiter 12/19/79 probable nitrogen leak in tubing which caused subsequent pressures change. Clear evidence of coMunicatian with the Church well.
Wellhead temperature Platinum RTD 0.1°F
Flow Orifice and Pitot tube 201
Production Flow Flow measured using container and stopwatch
20*
Observation Pressure Hewlett-Packard pressure probe and
0.01 psi
Temperature Gearhart-Owen temperature tool set at 425 ft
0.1°F
Observation Pressure 50 ft tubing connected to o.oi psi
Suzy-3 Observation Pressure
Suzy-4 Observation Pressure
Suzy-5 Observation Pressure
Roosevelt Production Swimming P.M
Flow
Paroscientific pressure transducer
250 ft tubing and chamber 0.01 psi connected to Paroacien-tific pressure transducer
Downhole Paroscientific 0.01 psi transducer set 5000 ft
200 ft tubing and chamber 0.01 pai connected to Paroscientific presaure transducer
Pr„.,ate communication 20%
The perforation job was not successful. No presaure change d'je to flowing wells was recorded.
Did not respond to the reservoir pressure due to i> "ucceaaful perforation job.

W0>* l»**l 0Oi» UWAB llOOl typt dM>« «ntr> ' _ a coMmuov* 'KW««( **"'"
Swrwrima, pool lloa rot*
l -275oom
/ ' - • - 2 » t p m
Church <•••' flow ra i t
/ Church well flaw
/ ott*-90gpm
Figure 9. Ncef well interference data. (XBL 795-7441)
Preihiie data oDioinrd uling nitrogtn fi l led eapillory tub* to 35 ft
'V.
V r
Church wall now rote
/
ell (low rot* — 250gpm
Church well How roie~90gpm
J_ \
.Swimming pool flow rote - 275 gpm
Figure 10. Divia well production data. (XBL 795-7439)

Prewure do I D obtained using nitrogen filled COpillory luLe 10 50(1 •'. -
- - " / " • . ' . • ' ' * \
flow rat*
/
. Swimming pool 1 1l«* tOl# i - 2 T i g p . i *
flow rat*
/
,0o*'S wen flow rote — 250 9pm
flow rat*
/ Cfturcr. »*"
/ I D * r t )c~90 gpm
\ 1 W B 1 2 ' l l ' H ?'21*7 U ' J W i 1-10
Figure 11. Suzy-3 interference data. (XBL 795-7438)
Prtiture doto obtained unrig a Po«o Scient.l.e tfownhole prati iroMdueer oi 500 It
Church well flow role
/
_z : I flow rale - 250 gpr
Church we" 'low row — 90 gpm
_/ \ r
.Swimming r. I flow rate j~275qpm
XBL 7 9 5 - 7 3 3 6
Figure 12. Suzy-4 interference data. (XBL 795-7436)

, Dotii **tl <lo> rate - £50gpm
Cturch «*ii lion rata - 90 gi
.S.imrmng pt jflO- ratt | ~ 2 ? 5 g p m
Figure 13. LLB-2 in ter ference da ta . (XBL 79W440)
• < i jM
1 ! ' w f 1 ii V^VH ""¥1 ~-w^ wfi V%L I
' I f f ' Hf 1 ! i i \ 1 i
T I f E [DO^SI 1978
Figure 14. Naef well pre-test data. (XBL 795-7492)

85
WELL TEST DATA ANALYSIS
Pressure data obtained fro* MB observation well that is affected by the production of nore than one well or by variable flow rates requires ".oaputer-assisted analysis methods. A nonlinear least-squares computer-matching program developed at LBL was used to analyze observation water level data frosi the Naef well (McEdwards and Tsjng, 1977). The program employs the line source solution (Theis), which calculates pressure drawdowns assuming an isotropic, isothermal, homogeneous porous medium of constant thickness. The production well is modeled as a line source that fully penetrates Lhe reservoir. The program can also be used to search for vertical reservoir boundaries (impermeable or constant potential). Vertical boundaries are modeled using the method of images.
Figure 15. Expanded section of the Naef well pretest data snowing five build-up and drawdowns caused by the church well production.
(XBL 795-7493)
inferred that the pressure iB affected by the Davis well production and by an external source: e.g.(
atmospheric pressure, ambient temperature, or an influx of fluids to the reservoir from some unknown source(s) such as local precipitation or melting snow.
The interference data from the Naef well were first analyzed using the production data from all three producing wells (Church, Davis, and Roosevelt swimming pool wells). This analysis revealed that an acceptable match of the pressure data could not be obtained with cue set of reservoir parameters (kH/pi *cH, geometry). For this reason, the data were analyzed in two parts. The drawdown at the Naef well caused by the Davis well was analyzed assuming that th»? production of the Church well had no pressure transients associated with it during the Davis well production. An instrument malfunction pf the Naef well made only the first six days of data analyzable. Analysis yields a kh/p values of 2.3 x 10 6 md-ft/cp and $cH of 7.2 x 1 0 - 4 fr/psi. Figure 17 shows the best match obtained between the observed and calculated response. The best match of observed and calculated values indicate the pressure response was influenced by 4n impermeable boundary.
Match of calculalid and obMrvtd vabw (or pri-tiu drawdown at Noti du* lo production of the Church W
0 9 - <* Obmntd 1 ' .
0 8 . s Calculoitd _. (1 . kH/j* .36X10* md-ft/cp , j
• 0.6 4>CH • 23XI0"*(l/p»l , S • * • 0.6 Oiilanc* to an >maai wet' ~ 500011 » * " .
o = 0 « ^ • t ' -<] 0 3 OZ 01 -
Pressure and discharge temperature data at the Davis well were obtained for the duration of the test. However, d«.ie to instrumentation problems only data from the drawdown (12/10/78 to 12/19/78) is considered reliable. These data were analyzed by the Miller-Dyes-Hutchinson (semi-lag) technique (Earlougher, 1977). The data are shown plotted on semi-log paper in Figure 13. After the first several hundred minutes the data fall on a single straight line indicating that r<o boundary is influencing the pressure response. The calculated transmissivity is 7.3 x 1(P inid-fc/cp. The discharge temperature stabilized at 59°C.
Figure 16. Match of calculated and observed drawdowns at che Naef well due to the church well production. (XBL 796-7508)
Table 2 summarizes the reservoir parameters obtained from analysis of the well test data. The relatively high transmisaiv'.ty values and low storativity values are indie:, .ive of a fracture dominated producing aquifer.

86
- i 1 1 1 1 1 r-
. . » '
Oimtm M an tatt* Mil - TCODfl
' , ' I I I— . . 1 . 463 BBS 12*9 mi 20*5 24S9 2M6 3MB M 6 40SS 44*9 4MB
TiiM ImlfU
CORCUJ5I0H
The occurrence of the Susanville geothermal resource appears to be fault related. Temperature contours and temperature profiles suggeit that heated fluids are upwelliug on a northwest- trending fault. The heated fluids are then dispersed into the reservoir clone t o e highly permeable (fracture) agglomerate-basalt interface. The geotheimal anomaly is larger in lateral extent than was first estimated. However, studies ihow that the portion of the resource that is above 40°C is partially confined both laterally and vertically. The areal confinement is on three sides of the northwest-The vertical confinement Appears to be related to the presence of fractures at the agglomerate-(conglomerate-) basalt interface in the southwest portion of the anomaly.
Figure 17. Match of calculated and observed values for the drawdown at the Naef well due to production of the Davis well. (XBL 796-7507)
m*2t I-19.2 •1.9 pti/tog c/O* 0«25Oepm UH/fi)'73XI08md-ll/cp
Figure 18. Semi-log plot of the drawdown data from the Davis well. (XBL 796-7505)
Well testa show a high lateral permeability associated with the fractured baaalt-agglomerate interface. Porosity values are low, supporting evidence of a fracture-dominated producing aquifer. Drilling in the northwestern portion of the anomaly has encountered fluids of higher temperatures than found in the southern portion of the geothermal anomaly. Further well testing will be required to determine the productivity of the higher temperature fluids in this area of th?
ACKNOWLEDGMENT
We would like to thank Wea Davis and D. Naef for use of their wells during testing in the Susan-ville area. We are also thankful to Lyle Tom1in and Dick Richardson from the U.S. Tepartment of the Interior, Bureau of Reclamation, Mid-Pacific Region, for their help in obtaining reservoir information at Susanville. The information obtained from J. Jesky and C. Richardson of the City of Susanville is also acknowledged.
REFERENCES CITES
Earlougher, R. C., 1977. Advances in well test analysis. Dallas, Society ot Petroleum Engineers, monograph, v. 5.
McEdwards, D. G., and Tsang, C. F., 1977. Variable rate multiple well testing analysis, ^n Proceedings, Invitational Well Testing Symposium.
Table 2. Reservoir parameters obtained from analysis of well test data.
Observation Well
Pumped Well
kh/tJ (md-ft/cp)
<(>ch (ft/psi)
Indication of reservoir boundaries
Naef Church 3.6 x 10 6 2.3 x 10" 4 Barrier boundary
Naef Davis 2.3 x 10 6 7.2 x 10" 4 Barrier boundary
Naef l.ojsevelt St- iteming
Pool
3.h x 10 6 3.9 x 10~ 2 None
Davis 4.3 x 10 5 Not obtained None
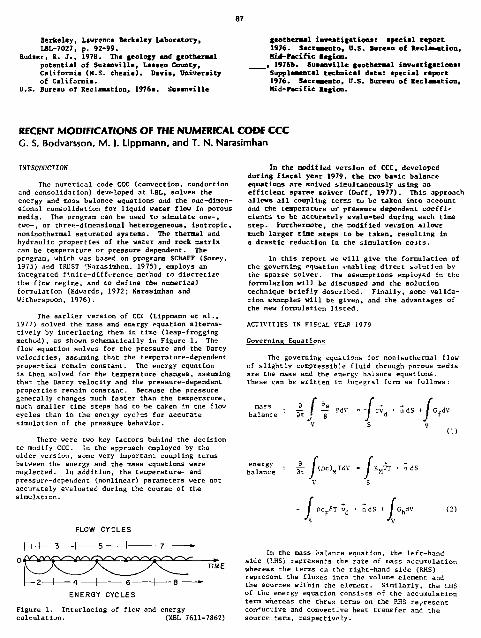
87
Berkeley, Lawrence Berkeley Laboratory, LBL-7027, p. 92-99.
Rudaer, R. J.. 1978. The geology and gcothermal potential of Smanville, Laaaen County,, California (M.S. thesis). Davia, University of California.
U.S. Bureau of Reclamation, 1976a. Suaanville
gcothermal investigations: special report 1976. Sacramento, U.S. Bureau of teclSMtion, Kid-Pacific Region.
> R 1976b. Susanville geothermal investigations: Supplemental technical data: special report 1976. Sacramento, t'.S. Bureau of Reclamation, Kid-Pacific Region.
RECENT MODIFICATIONS OF THE NUMERICAL CODE CCC G. S. Bodvarsson, M. J. Lippmann, and T. N. Narasimhan
INTRODUCTION
The numerical code CCC (convection, conduction and consolidation) developed at LBL, solves the energy and mass balance equations and the one-dimensional consolidation for liquid water flow £n porous media. The program can be used to simulate one-, two-, or three-dimensional heterogeneous, isotropic, nonisothermal saturated systems. The thermal and hydraulic properties of the water and rock matrix can be temperature or pressure dependent. The program, which was based on programs SCHAF? (Sorey, 1975) and TRUST 'Narasimhan. 1975), employs an integrated f^nitc-dtfftrence method to discretize the flow regime, and to define the numerical formulation (Edwards, 1972; Narasimhan and Witherspoon, 1976).
The earlier version of CCC (Lippmann et al., 1977) solved the mass and energy equation alternatively by interlacing them in time (leap-frogging method), as shown schemanically in Figure 1. Th-2 flow equation solves for the pressure and the Darcy velocities, assuming that the temperature-dependent properties remain constant. The energy equation is then solved for the temperature changes, assuming that the Darcy velocity and the pressure-dependent properties remain constant. Because the pressure ganerally changes much faster than the temperature, much smaller time steps had to be taken in the flow-cycles than in the eneigy cycJss for accurate simulation of the pressure behavior.
There were two key factors behind the decision to modify CCC, In the approach employed by the older version, some very important coupling terms between the energy and the mass equations were neglected. In addition, the temperature- and pressure-dependent (nonlinear) parameters were not accurately evaluated during the course of the simulation.
FLOW CYCLES
H-
I — 2 1 4 j 6 1 8 ENERGY CYCLES
Figure 1. Interlacing of flow and energy calculation. (XBL 7611-7862)
In the oodified version of CCC, developed during fiscal year 1979, the two basic balance equations are solved sioultaneously using an efficient sparse solver (Duff, 1977). This approach allows all coupling teres to be taken into account and the temperature or pressure dependent coefficients to be accurately evaluated during each time step. Furthermore, the nodifled version Allows much larger tine steps to be taken, resulting in a drastic reduction in the simulation cojts.
In this report we will give the formulation of the governing equation enabling direct solution by the sparse solver. The assumptions employed in the foraulation will be discussed and the solution technique briefly described. Finally, some validation examples will be given, and the advantages of the new formulation listed.
ACTIVITIES IS FISCAL YEAR 1979
Governing Equations
The governing equations for nonisothermal flow of slightly compressible fluid through porous media are the mass and the energy balance equations. These can be written in integral form as follows:
mass balance h} T PdV °"JC^ ' ""s+Jv
energy _ _3 balance 3
S- /(Dc)HTdV = j KM7T • ndS
V S
/OcFST v d • ndS + / GhdV
In the mass balance equation, Che lef t -hand side (LHS) represents the ra te of mass accumulation whereas the terms en the right-hand s ide (RHS) represent the fluxes into the volume element and the sources within the element. S imi lar ly , the LHS of the energy equation cons is t s of the accumulation term whereas the three terns on the RHS represent conductive and convective heat t r ans fe r and the source term, respec t ive ly .

Equatlow (1) and (2) M t fee • • » ! • • [ • < by *a equation of motion and a. Maker of c r w t l t a c l v e relat ions to f u l l y deaccibe the ykMMMi k c U | considered. For the eematloa of e o t l s a , the va l id i ty of Darcy** law I S i
~ t> - not) O)
Constitutive re lat ions moat be specif ied for each of the teaperature- or preeaare deaeadeat srsaartia* of toe f luid and the rock a a t r l x . I» the o c o y , ..oeae elation* have been Incorporated e i ther MM equat: \a or tabulated values.
Aasuaptlona
The formulation of the nodal ea described by equation* (1) end (2) was baaed on several >••—a t lona. The moat a lgal f leant onea are:
1. Fluid notion la governed by Darcy'a l av . 2 . The f luid and the rock nmcrlx are In loca l
thermal equilibrium. 3. Work due to the effect* of viscous d i ss ipat ion ,
acceleration, and compressibility I s re f l ec ted .
laaat laa (7) can be written 1 B amtrls form aa fo i l -"* :
(•>
l a t a m e »f tW e a t r l x aaaarlaa f*)[x) • ( k ) , the m f t l r m t t of tkc a* B 'a reercccat tkc dlaaoaal M l w of tkc a a a t r l x , a k i l e tkc coaff lc laate of tkc tfK'c ex* t k t Q f f - « l l , i i i 1 va laee . Ike MS of atact ica (•) ( l**e tkc v a l u e «t tkc keens vector b .
S l a l l a r l r , a f ter lacereoratiaa of Darcy'e l a v , the eeerej eeaecloa (2> eaa ba v r i t t e a e a l a , auacrlcal aotat loa am fol lewa:
(9) " tf V i"/kpA\ ( P » ~ P n * _ /kP*. . s \ "| In t n i d o o ( 9 ) , T n „ Tepreseats the interface
At Z , | \ H Z _ 1> + D_ - V V A _ I teaoeratwr* between node* n and • , and using •m ^ "»m n.m m,n *»•• J . . * . • • n upstream weighting, i t can be expressed aa:
Formulation
In thla sect ion, the governing equations (equation* 1 and 2) w i l l be written In natrljc form to be readily handled by the sparse so lver . Re-wrltlng equation (1) usiag nuaerleal notation for a node n and adjacent nodes a , the aquation becoaes:
<S„V)
* (G fV) n (4)
Adopting an iapllcit formulation to relax coostrainta In the time steps results la the following equations:
p„ - £ + «*„ «)
Here X Is a weighting factor that Is Halted to tbe range 0.5 to 1.0 for unconditionally stable solutions. Substituting (5) and (6) Into « ) yields.
aT + <!-»>*. <10)
t?-I[( ; J£^ p:+"^- is -MP n
+m g] + CGfV)„ i.m J
(7)
In aanstlon (10), a is tbe upstream weighting factor and it nay be varied between 0.5 and 1. Substitution of (10) Into (9) yields
v v 'n,a
' (D?*"/D -<**)]*<Vn OU
\ n,n m.n / J
Again ve Introduce the Implicit formulation:
T - T° + AAT

(12) p - P° + *4P n u r n
p_ - p° + Anp_
• (PV H , «-> « * ^ - < - J - ^ I (= to ) B _ • ^ I I B _ * B^V D
J _ • * • • « > • •» ! * /
p . + *A?_ - p; - *A?.
(13) If the generation t e n (QV)« represents aore
a sink (f luid produced), i t vanishes, but In the case of s source ( in jec t ion) , I t beecsws
Gfy t - i - « ° + W I n > ] < " ' , v f^'tc^
Bare cp represents the spec i f i c heat of the injected f lu id . Substitution of (14) into (13) y i e l d s :
«-2(^L*nkH: At>
»o.»o
o = . " " i " • •= )
- T n * W T n ) + (""T^T),, n ° - ) t T - + " T -
L n J n l g* L n.ffi a.n
« - > H H R P °+ P ° " <">
+ C f C p [Tj-CT^ + XATn)] (IS)
We now proceed and expand neglecting tens involving the products of Ap and AT; the equation bee ones
it can be noted that the unknowns In equation (17) are not oaly the temperature changes at the nodes but also tbe pressr-re changes. The latter were neglected during a tfae step in the older version of CCC.
0 „ &m~^v) \ r ° r a conplete coupling of the aass and the + C* B-T n) jj +ij + p +5 * A l m ~ A T n * energy equations., equations (6) end (13) can be
n,« a,n &,• a,n written in simplified foras as follows:
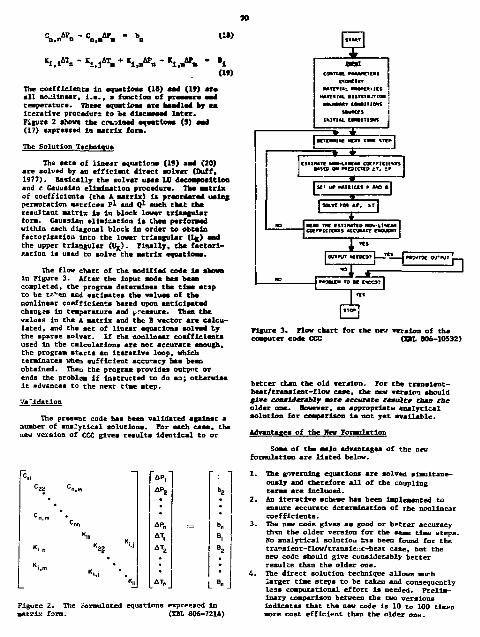
90
Kl,i A Tn - Ki,jW. + « i , A * K i . - t f .
CIS)
"I
The coefficients In aquations (IS) and (19) ar« all nonlinear, i.e., a function of araasaxa amd temperature. These aquations arc maadlsa1 ey aa iterative procedure to be dlacmsasa later. Figure 2 shows the coa>vlaad equations (3) amd (17) expressed in matrix form.
The Solution Technique
The eeta of linear aquations (19) aad (20) are solved by an efficient direct solver (Doff, 1977). Basically the solver uses US decomposition and c Gauuslan elimination procedure. Tat matrix of coefficients (the A matrix) la praoraerad using permutation matrlcea P l and Q 1 such that the resultant matrix ia in block lover triangular tora. Gaussian elimination is Chen performed within each diagonal block In order to obtain factorization into the lover triangular (I#>) sad the upper triangular (uy). Finally, the factorization la used to solve the matrix equations.
The flow chart of the modified coda is shown in Figure 3. After the input mode has bean completed, the program determines the time stsp to be t*>«i and estimates the values of the nonlinear coefficients bated upon anticipated chan&28 In temperature and pressure. Then the values in the A matrix and the B vector are calculated, and the set of linear equations solved ty the aparee solver. If the nonlinear coefficients used in the calculations are not accurate enough. the program sterta an iterative loop, which terminates when sufficient accuracy baa been obtained. Then the program provides output or ends the problem If Instructed to do B O ; otherwise it advances to the next time step.,
Ys'ldatlon
The present code baa been validated against a number of analytical solutions. For each case, the new version of CCC gives resulte identical to or
H COWKAL H U K I N S i
COVCl** ! nUrillL M**C*)ICS 1
mre*ru. •umajTiaH | M M U T m e n io%$ |
tewKts I 1K1TIM. CSWSI9K |
5 Z H Q ertcMiie teas T « *•!» I
=%-r I Sf * ur> Mt t t t t * * M O a I
| aatvc »ea ar>, sir I 1 i
I OUIFJT UHMST h"H t w i x oymr,
J M9BLCM TO K CWX31 I
H Figure 3 . Flow chart for the new version of the computer code CCC (DL 806-10532)
better than the old version. For the translent-beat / traas lent- f lov case, the new version should g ive considerably mora accurate raauXt* than the older one. However, an appropriate analyt ical solution for comparison i s not yet avai lable .
Advantages of the Hew Formulation
Some of the main advantages of the new formulation are l i s t e d below.
Figure 2. The formulated equations expressed in matrix form. (XBL 806-7214)
The governing equations are solved simultaneously and therefore a l l of the coupling terms are Induced. An I terat ive scheme has been Implemented to ensure accurate determination of the nonlinear coef f i c ients . The new code gives as good or better accuracy tbnn the older version for the same time s teps . No analyt ical solution b i s been found for the tra^slent-flow/translei'.c-heat case, but the new code should give considerably better resu l t s than the older one. The direct solution technique allows much larger time steps to be taken and consequently l s s s computational effort i s needed. Preliminary comparison between the two versions Indicates that the new code i s 10 to 100 timet, more cost e f f i c ient than the older one.

91
FLAMMED ACTIVITIES DUKIMG FISCAL TEA1 1980
During the next f i s c e l y « r , the new version w i l l be further improved. We intend t o :
1. Eitablish e better criterion for determining the next time s t e p , and streamline commutations when the flow f i e ld la under qu^sl-steady conditions.
2. Incorporate the Nevton-lapnson I terat ive gcheae for accurate determination of the nonlinear coe f f i c i ents .
3. Incorporate in the forsulation the thermal expansion of the so l id matrix.
REFERENCES CITED
Duff, I . S . , 1977. HA28--a se t ot FOtntAK subroutine* for sparse urnynaetrlc l inear equations. Harwell/Oxfordshire, Great Britain, Report AEKE-R8730.
INTRODUCTION
Over the last year, work on two-phase geother-mal reservoir simulation was focused on two areas. F irs t , we aade a major effort to increase the eff ic iency and accuracy of the simulator SHAFT78 through the use of more powerful mathematical and numerical methods. This work has resulted i t the completion of a new simulator, ca l led SHAFT71./. Second, we applied SHAFT79 to diverse geotbermal reservoir problems.
MATHEMATICAL AND NUMERICAL METHODS
A p p l i c a t i o n s o f SHAFT78 had shown t h a t , although i t was possible to obtain accurate so lutions to d i f f i c u l t problem, including phase trans i t ions , the Maximum permissible time steps were severely res tr i c ted . For example, in a simulation of the Serrazzano geothermal reservoir (see below) typical time steps were a few hours, and the simu-laton required typical ly 15 sec CPU-time on the CDC-7600 per day of physical time. Computations wer^ so cost ly and cumbersome thst SEAFT78 could only be applied to very simple ideal ized model problems. SRAFT79 solves the same equations as SHATT78, but in a much uore e f f i c i ent way. Typical time steps in the Serrazxano simulation with SHAFT79 are 10 to 50 deys, with computation tim*ss of typical ly 0.3 sec CPU-time on the CDC-7600 per day of physical time.
In this sect ion, we shal l brief ly review the methods used in SHAFT79 as they were developed through itep-by-step revisions of SHAFT78. More speci f ic deta i l s can be found in the papers by Pruess *t a l . (1979a,b).
The main shortcoming of SHAFT73 i s the once-through sequential method used for solving the
Edwards, A.L. , 1972. TKt»: A computer program for transient amd steady s t a t e temperature d is tr ibut ion In multidimensional system*. Lawrence Livmraorn Laboratory, DCaX-14754, l a v . 3 , 259 » .
Llppnuau, H .J . , Tarns*, C.F. , and Wither spoon, F.A. , 1977. Analysis of the response r f gaothermal reservoirs wader lajact ion amd production procadwxam. De l ias , Society of Petrolerm Engineers. SPE-6537, 15 p .
Ksraslmhan, T .» . , 1975. A unified numerical model for Mturated-uasaturated gToaadtater flow (Ph.D. d i s ser ta t ion , Berkeley, University of Cal i fora la) , 244 p .
Naraslahan. T.B. , and Ultbsrspooo, P.A. , 1976. An Integrated f in i te -di f ference method for analyzing, f luid flow la porous media. Water Icsources tssenrch, v . 12 , no. 1 , p.57-64.
Sorey, M.L.. 1975. rVas^lcal modeling of l iquid geotherstel systems (Ph.D. d i s ser ta t ion , Berkeley, University of Cal i fornia) , 65 p .
strongly coupled mass- and energy-transport equa-LiOLS. Our attempt to improve t h i s with an i t e r a t ive sequential method was unsuccessful. numerical t e s t s as wel l as a subsequent analyt ical derivation showed that the strength of the coupling i s such that convergence could only be obtained for small time s teps .
The next step war implementation of a comple te ly simultaneous, i t era t ive so lut ion. This in i t s e l f did not yet allow longer t in* s teps , because the i t era t ive matrix method used in SHAFT76 for solving the l inearized aquae ..ons requires a diagonal ly dominant matrix. The off-diagonal matrix e l e ments turn out to be proportional to the time step s i ze At, which r e s t r i c t s the permissible time steps to v ir tual ly the same maximum as i c t'je sequential i t era t ive method, above.
Subsequently, the i t era t ive matrix method was replaced with an e f f i c i ent direct solver es devel oped by Duff (1977). Duff's program package uses clever storage and ^re-ordering procedures combined with LU-decompositioo and Gaussian elimination. I t i s ideal ly sc i ted for solving non-symmetric matrix equations with random sparcity structure, such s s arise in the integrated f in i te-di f ference description of f luid and heat flow in porous rock.
The result ing simultaneous i t era t ive solut ion method with ful ly implic i t time differencing and direct solver permits large time s teps . A convenient measure of time-step s i z e i s in terms of "throughput," which i s defined as ra t io of the f luid mass flowing through the surface of an e l e ment in one time step to the f luid BUMS i n i t i a l l y in place in that element. Throughputs with SHaFT78 were typical ly on the order of 10~2 or smaller, whereas with SHAFT79 throughputs of 10-500 can often be obtained.
DEVELOPMENT OF THE TWO-PHASE RESERVOIR SIMULATION PROGRAM, SHAFT79 K. Pruess, R. C. Schroeder, and P. A. Witherspoon

92
There remains one flaw in the Methodology outlined go far. Namely, the nonlinear equations are replaced in an iterative way with a sequence of linear equations. Convergence occurs when, for a given cine step, a set of equivalent linear equations is obtained. This procedure works aa long at the nonlinearicies are not too severe* but it fails completely for phaae transitions. The final step in developing the algorithm of SIAFT79 t them, was to implement a tfevton/laphs n netbod for actually solving the nonlinear equations rather than replacing then lucratively wish linear ones. Hlth this methodology, SHA7T79 can accurately perform large tine steps whether or not passe transitions occur during the tine step.
Data inputting snd priuting of output were also rewritten to accommodate the new computational structure, and to improve usability of the program.
Accuracy of SHAFT/? wss verified by comparison with SHAFT78 and with calculations published in the literature.
APPLICATIONS
Table 1 gives sn overview of the types of systems and processes that have been modeled with SHAFT''9, Below are presented recults of selected SHAFT79 simulations, which illustrate the range of applications. (Parameters for the individual cases are given in the figure captions.) kelative permeabilities vere obtained from Corey's equations, with residusl irmtobile steam saturation S ^ equal to zero, and residusl immobile wster saturation Svc varying between 0.40 and 0.70.
DtTLsTIO" OF A UtUtVODt Hill S U B ? STUH/UATtt InTULFACE
when sttsm ia produced from above a liquid water cable, boiling commences near the top of the water xome. This gives rise to a drop in temperature and pressure, whereby a two-phase layer between water and steam cones is established. Water moves upward into the two-phase some, releasing pressure below tire boiling front and advancing it downward (Fruess, 1979b). Ia the examples studied (tee Figure 1), the top of the Mo-phase sone does not dry up until after the boiling front has reached the bottom of the reservoir. This occurs after 6.4 years for the "high permeability" case (A in Figure 1), and after 9.6 years for the "low permeability" case (• in Figure 1 ) . Vapor saturation at the top of the water table then reaches 46.71 for caae A and 7S.9Z for case B. Pressure at the stean/two-phaae interface, at a depth of 500 m, reclines very slowly during toe advancing of Che boiling front in case A. The reason for this is that the most rapid boiling occurs at the bottom of the two-phase sone. This provides a supply of hotter steam, which flows up from depth and .tends to maintain temperature and hence pressure at the top of the two-phase sane. In case • this mechanism for pressure maintenance ia much leas effective because of the power permeability.
DUgrciXOU OF COLD HATE*
Cold-vater injection into a ateam reservoir gives rise to a hydrodynamic front and, trailing behind it, a temperature front. In the finite-difference simulation of this process subsequent
Table 1. Simulation studies with 5HAFT79.
Type of problem Simulated processes
1-C, rectangular Depletion of two-phase geothermal reservoirs^
Various production and injection scheses for reservoirs with uniform initial conditions or with sharp stesm/vster interfaces
1-D, cylindrical Two-phase clow near wells
2-D, rectanRular
2-D, cylindrical
3-D, regular
3-D, irregular
Krefla geothernal reservoir (Iceland)*
High-level nuclear waste rftnnni torv^
Two-phase interference test in Cerro Prieto (Mexico)
Serrazzano geothermal reservoir (Italy)*
Production from two-phase zones; cold water injection into two—phase snd superheated steam zones, respectively
Different spsce and tine patterns of production snd injection
Long-term evolution of temperatures and pressures near a powerful heat source (in progress)
(in progress)
Detailed field production from 1960 to 1966
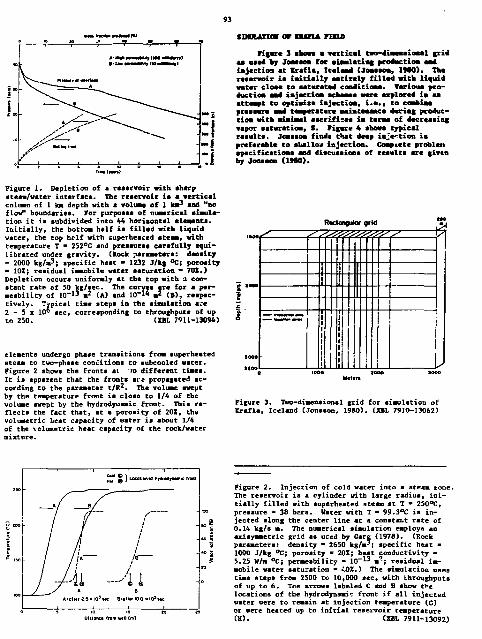
93
tmotAnoBT or KUFL*. FIELD
Figvre 3 ehowa a -vertical taft-etfaataaioBal grid aa used fcy Joaesoa for eiamlatimg production and injection at Xrafla, Iceland (Joaeeoa, 19#0). Tha raaarvoir ia initially entirely filled vita liquid water eloac to aatarated coaditioaa. Various pro-ductioa aad iajactioa achaaae w*r« explored ia aa atteajpt to optima* iajection, i.e. ( to combine prtaaure aad temperature aainteaaaca daring production with auaiaal sacrifi=ea in tcraa of decreasing vapor eatwration, S. Figure 4 above typical results. Jcaaaoa finds that deep injection ia preferable to ahalloi* injection. Complete probleu apecificatioaa and discuaaiona of reaulta are given by Jonaaon (1980).
Figure 1. Depletion of a reservoir with sharp stean/vater interface. The reservoir ia a vertical coluna of 1 km depth with a volua-e of 1 Ion3 and "no flow" boundaries. For purposes of numerical eimula-tion it ia subdivided into 44 horizontal elements. Initially, the bottom half is filled with liquid water, the top holf with superheated steam, with teaperature T * 252°C and pressures carefully equilibrated under gravity. (lock parametera: density - 2000 kg/a 3; specific heat - 1232 J/kg °C; porosity - 10Z; residual iaaiobile water saturation - 70%.) Depletion occurs uniformly at the top with a constant rate of SO kg/sec. The curves are for a permeability of 10" 1 3 a 2 (A) and 10 -1* 2 (g) s respectively. Typical tine steps in the simulation are 2 - 5 x 10* sec, corresponding to throughputs of up to 250. (XBL 7911-13094)
elements undergo phase transitions from superheated steam to two-phase conditions to subcooled water. Figure 2 shows the fronts at »o different times. It is apparent that the fronts are propagated according to the parameter t/R2. The volume swept by the temperature front ia close to 1/4 of the volume swept by the hydrodynamic front. This reflects the fact that, at a porosity of 20Z, the volMetric heat capacity of water is about 1/4 of the volumetric heat capacity of the rock/water mixture.
3000
atoo
Rectangular grid
^ ^ ^ z -&
Figure 3. Two-dimensional grid for simulation of Crsfia, Iceland (Jonsson, 1980). (XBL 7910-13062)
H M e ) — — -
„ * / „ s /
• / f /
/ ^ / -Ai - .,' u / */ * 8
*'cit«t a.sxto'wc H'« . . . M . ^ M .
Figure 2. Injection of cold water into a steam zone. The reservoir is a cylinder with large radius, initially filled with superheated steam at T * 250°C, pressure « 38 bars. Water with T - 99.3°C is injected along the center line at a constant rate of 0.14 kg/s m. The numerical simulation employs an axisymmetric grid as uced by Care (1978). (Rock parameters: density • 2650 kg/m*; specific heat • 1000 J/kg °C; porosity - 201; heat conductivity • 5.25 W/m °C; permeability ' 10" -13 m-; residual im-
Oltranct (mm well Im)
mobile water saturation - 4.0Z.) The simulation uses time steps from 2500 to 10,000 sec, with throughputs of up to 6. The arrows labeled C and H show t**e locations of the hydrodjoaadc front if all injected water were to remain at injection temperature (C) or were heated up to initial reservoir temperature (H). (XBL 7911-13092)

94 Injection of 120*C aofw. aoOnwMre m y foM Urn pntutHm tnjtciion «orf* l£ycofsaftar«ro*«ciion,iai«cH«i fra«tttban«a
N s ^ l y w o i i » ^ « " \ v ~ " \ v
\ ^ ^ * . . £ ' ^ ^>^~ 1 , J ~ n ^ .» ' ^
^ ^ - -——_. » » •0
I 3 * 9 * r • » « it • •• M -
; • : -
Figure 4. Simulated performance o£ Krafla reservoir. Temperature, pressure, and vapor saturation at the well block are given aa function of time with injection (dashed lines) and without injection (solid lines). Production rate ia 45 kf/aec and injection rate is 22.5 kg/sec. Typical tiae steps in the simulation are 1.25 x 10 6 sec, with throughputs of about 0.1 (Jonsson, I960). (ZBL 79B-1141SK)
SIMULATION OF SBRRAZZAHO FIELD
The most complex simulation effort undertaken with SHAFT79 to date is a case study (history match) of the Sc razzano reservoir. Serraxsano ia one of the distinct zones of the extensive geothermal area near Larderello in central Tuscany, Italy. Detailed production data gathered since 1939 and an extensive body of geologic and hydrologic work make Serrazzano an attractive example for developing geothermal reservoir simulation methodology (see Pruess, 1979b). Figure 5 gives c map of Che reservoir, and Figure 6 shows the geologically accurate mesh SB developed by Weres (1977). Conceptual model of the reservoir and parametrization of the problem are discussed in Pruess (1979b) and Weres (1977).
Many parameters are only partially known, and are determined in trial-and-error fashion by comparing simulated reservoir performance with field observations. A valuable criterion for determining absolute permeabilities is that well blocks must remain very close to steady flow conditions. Our most complete simulation so far covers the period from 1960 to 1966. With the permeability distribution as indicated in Figure 5, we achieve steady flow for all wells producing since 1961 or earlier to within 22 for the entire 6-yr period modeled (i.e., the difference between inflow and production for any well block never exceeds 21).
From mass balance conaiderations it can be shown that most of the fluid reserves in Serrazzano are in plac? in liquid form. Little is known, however, about the discribution of pore water in the reservoir. Making the tentative assumption that liquid water ia distributed throughout most of the reservoir, we compute a pressure decline (see Figure 7) which is slower than observed in the field by a factor of approximately 3.5. In the simulation, pressure declines slowly because
Figure S. Aerial map of Serrazzano geothermal reservoir. The thin contour liaea ebow elevations of the cap rock as determined from drill logs. The atraight linea labeled A to Z indicate the locations of geological cross sections used in constructing a three-dimensional finite difference grid (Wares, 1977). Locations o F elements (nodes) are also shown, A - D are regions of diff-rent permeability as determined in the simulation: A • 0.75 x 1 0 " 1 2 m 2; B - 0.25 x 10⁻¹² «2. c . 0.75 ,. 1 0-13 . 2 . D , 0 . 1 5 x l 0-l3 . 2 .
( M L 7910-12576)
boiling is spread out over a large volume. We conclude that in most of the reservoir volume no liquid water ia present, and we shall modify our initial conditions accordingly in subsequent simulations , We also need to correct some imbalances in initial conditions, which are apparent from the initial nonmonotonic behavior of pressure in Figure 7.
CONCLUSION
The simulator SHAFT79 uses efficient methods for computing maas- and energy-transport in geother-•al reservoirs, and allows for a flexible description of irregular geometric features. A broad range of applications, including idealized systems aa well as large field problems, demonstrates its

Figure 6. Serrazzano grid. The computer-generated geologically accurate grid of the Serrazzano reaer-voir aa developed by Werea (1977) ia ahown in two rotated perspective vieva. Thia three-dimensional grid repreaenta a reservoir that ia a curved thin sheet approximately 1 lea from top to bottom, with an aerial extension of about 25 km 2. It haa 234 polyhedral elements, with 679 polygonal interface* between them. There are up to 10 interfaces per element. (XBL 787-9570)
usefulness for geothermal reservoir studies. Further development work is presently under way to improve on some of the restrictive approximations Bade in the formulation of the phyaical model.
INTRODUCTION
Discharges from hydrothenal reservoirs often contain considerable amounts of nonconder-sible gases (White et «!., 1971; Burgsssi et «!.» 1975; Veres et al., 1977). By far the dominant species ia the weakly polar, slightly soluble carbon dioxide wole-
Figure 7- Average reservoir sterna pressure amd c a m r lativ* field proawctioe as calcwlaced ia Itrruiiao sianlatioaj. Typical tiaw step* in eh* aimmlation are 10 to SO days, with throwgaamts of up to 65.
C O L 7911-13093)
urnncss CITED Duff, I . S . , 1977. A set of fOBJBAB subroutinea
for aparae unsymmetric l inear sanations. larwell/Oxfordahire, Great Bri t iaa , Baport AKU-K S730.
Garg, S. K., 197B. Pressure transiaot analysis for two-phase l iquid water/ateem geothermal reservoirs . Dallaa, Society of Petroleum lagineera, paper SPI-7479.
Jonssom, * . t 1960. Two-dimensional model of i n j e c t ion into a liquid-dominated two-phase product ion reservoir . Berkeley, Lawrence Berkeley Laboratory, LBL-10003 ( in prep. ) .
Prueas, C , Zerxan, J . M., Schroeder, B. C , and Witherapoon, P. A., 1979a. Description of the three-dimensional two-phase simulator SHAFT78 for use i n geothermal reservoir s tud ies . Dal las , Society of Petroleum Engineers, paper SPE-7699.
Pruess, K. f Bodvarsson, G., Schroeder, K. C , tlitherapoon, 1'. A. , Marconcini, B . , Merit G** and K u f f i l l i , C , 1979b. Simulation of the depletion of two-phase geothermal reservoirs . Dallas, Society of Petroleum Engineers, paper SPE-8266.
cule ( E l l i s and Hahon, 1977; Waal, 1977,'. The to ta l pre-exploitation C0j content of these reaervoira ranges probably as high ss several percent by maaa ( e . g . , Sutton and HcBabb, 1977; Gislason e t a l . , 1978). These high gas contents re su l t i n hydrother-mal f luid thermodynamic properties s ign i f i cant ly different from those of pure water. Properties
PROPERTIES OF H^O-CO* MIXTURES FOR GEOTHERMAL RESERVOIR AND WELLBORE SIMULATORS E. R. Iglesias and R. C. Schroeder

affected include pressure, density, enthalpy, compressibility, vapor saturation, etc. (Straass and Schubert, 1979a,b; Grant, 1977).
The current LBL geotbermal reservoir and well-bore simulators assume pure water aa the only fluid component in the ays teat. We therefore felt that a wider and more realistic prediction capability required inclusion of CO2 aa a second component to these codes. Tvo-coaponent simulators would find immediate application in Modeling C02-rich hydro-theraal fields (e.g., the Serrazzeoo, Italy, and Krafla, Iceland, reservoirs).
Implementation of the envisioned multiphase, multicoaponent simulators requires formulation of the physical properties of the B2O-CO2 mixtures and development of appropriate coaputational techniques. We feel that the coaputational tools developed for pure water simulators can be adapted to handle this problem. In this report, we focus on the description of a simplified thermodynamic model of water-carbon dioxide mixtures that has been formulated. Unlike previous studies (e.g., Zyvoloski and O'Suilivan, 1980; Strauss and Schubert, 1979a,b; Grant, 1977; Sutton, 1976), which consider only two-piiase situations, this model applies to compressed solutions, two-phase mixtures, and superheated gas mixtures.
A SIMPLE MODEL
The basic assumption is that of thermodynamic equilibrium. Within the typical ranges spanned by the relevant thermodynamic variables in hydrothermal reservoirs, a water-carbon dioxide mixture may be in three different states: a compressed liquid solution, a liquid in equilibrium with e vapor phase, and a "superheated" gas.
In a two-phase situation, the liquid ph^se contains dissolved gas, and the gas phase la a ad. iture of steam and CO2. We assume that CO2 partitions between the two phases according to Henry's Lar. The total pressure is computed as the sum of tie saturation pressure of pure water Pj* and the partial pressure of CO2, ?2> The gas phase denr^ty is taken to be equal to the Batuxated steam density pfc divided by the steam mass fraction in :he gas phEse yj. Furtheimore, the liquid densi'.y is estimated as the saturated water density p-^ divided by the water mass fraction in the solution xi. The gaseous COj specific enthalpy hjg i? computed from an analytical fit to experimental data due to Sweigert et al. (1946); by addition of h2G with the heat of solution we obtain the specific enthalpy of the dissolved CO2, h2G> The enthalpies for the liquid and gaseous phases are computed from:
X l "lL * *2 h2L (1)
y i h lG * "2 h2G ' (2)
la the compressed lieaid region the COj partial preaamrc is collated from aenry'e Law, and the water partial presamrc Pj by the differeace (F-rj). **• water daaaity P x L (P.T) is takes from steam tabUs, amd the liaeid density is estimated *m Pj. * P R / X I * The lieuid specific eathalpy ia cemewted from expression (1), replacing hft, by hn, *aieh accounta for the affects of pressors in the water eathalpy.
Th* partial pressures of ateam and COj in the superheated gas region arc estimated as t \ • y| *, *2 * 72 * (aatton, 1976). The gaa density is taken as P© • Plc(*l»T)/yi* I** specific gaa enthalpy ia computed from expression (2), replacing h*g by h l c .
Approximate analytical expressions for the boundaries of the two-phase region, bo i l ing and dew
have been derived as fol lows!
• B U f T > • *j(T) • 18 K D A M A ) - 26]
PD(A,T) - f*(T)/( l -Aj , (3>
where I (T) i s Henry's Law con»^ont and A the total CO2 mass fraction.
I l lus tra t ive resu l t s are preseutcd in Figures 1 through 4 . Clearly, two-phase s i tuations develop
300 -
where the asterisks refer to saturated water properties. Other thermodynamic variables of interest, such as total density, vapor and liquid satuiation, and internal energy are derived from the formulation just described.
Figure 1. Boiling curves for H2O-CO, mixtures. Total CO2 mass fractions are indicated on the curves. (XBL 795-853)

*7
300
250
~ 200
150
100 -
100 200 Temperature (*C)
300
Figure 2. Vapor saturation curves (values of Sy indicated on the curves) for an H2O-CO2 mixture. The total CO2 iiass fraction i s X • 0 . 1 .
(XBL 801-6762)
for pressures and temperatures at which pure wLter exists aa a compressed liquid, even for relatively small CO2 total mass fractions. This may have significant implications in fluid reserve assessment and well test interpretation. Figure 1 "indicates the interesting possibility of inverse isobaric condensation and evaporation taking place at high (£51) carbon dioxide contents; thia may introduce peculiar effects in hydrothermal fluid flow patterns. Our results also indicate that CO2 may significantly contribute to the fluid enthalpy, particularly in reservoir gas caps where the carbon dioxide mass fraction is high.
This simple model is also currently being implemented in a steady-state we11bore code (Miller, 1979, personal communication).
•.0 -1
1 T-KX>«C ' T
- r ^'"' Soe • • | _ °. a. / 0 r* y\ £0.6 - • V ' -£ * /
« • • / -0 / So.« - / _ T, /' a £: / -i«. /
/ i
-
-j _ i i
.J -0 - ,
1 ' — L..
1 0 100 ZOO 300
Pressure (bars) Figure 3. CO2 • • » fraction in the vapor phaae ae • function of preaaure and temperature, the total C 0 2 aaaa fraction ia 0.1. ( M L 801-6763)
^ 1
/ / of
1 l si / / o * •
1 1 1
/ / of
1 l si / / o * •
/ 'X *•
/ /~ - / -
r i
-
[ i '
S 10-3
io-«
0 '00 200 300 Pressure (bars)
Figure 4. CO? mass fraction in the liquid phase as a function of pressure and temperature. The total CO2 mass fraction is 0.1. (XBL 801-6764)
9ft SUMMARY
The umin advantage of the model just described is its simplicity. Only the thermodynamic proper-ties of the pure components plus Hecry'a Lew ere used to estiaate the properties of the mixture. In this economical way a qualitative tinders tending of compressed CO2-H2O solutions, two-phase end superheated gas mixtures is achieved. The eccnrecy of the radel, however, is culy fair, degrading rapidly with increasing temperatures; pressures sad concentrations. This is of course beeouse the simple assumptions adopted become inadequate outside a fairly restricted range of values of P, T, and X. To overcome these difficulties a new, more accurate model is currently under development. The new sndel treats the fixture nonidealities on a rigorous thermodynamic baris, including correction* for pressure, temperature, and composition affects.
REFERENCES CITED
Burgassi, P., Stefani, G. C., Cataldi, R. , Rossi, A., Squarei, P., and Taffi, L., 1976. Recent developments of geotheraal exploration in the Trsvale-Radicondoli area, ip_ Proceedings, Second United N*tions Symposium on the Development end Use of Geothermal Resources, San Francisco, Hay 1975. Washington, D.C., U.S. Government Printing Office, v. 3, p. 1571-
Gllia, A. J.* and Hahon, M. A. J., 1977. Chemistry and geothermal systems. Hew York, Academic Press.
Gislason, G.» Araannason, A., and Hauksaon, T,, 1978. Thermal behavior and dissolved gases in the Krsfla geothermal system, Iceland.
INTRODUCTION
The Baca geothermal field is located in the Valles Caldera, Hew Mexico, about 55 miles north of Albuquerque. The field is being developed by the Uu'^n Oil Company of California and the Public Service Company of New Mexico (FWf). To date, 18 geothenaal wells have been drilled in the Valles Caldera, varying in depth from 2000 to 9000 ft (Union and FNM, 1978). Six of the wells have been drilled in the Sulfur Creek area, the remainder ilong Redondo Creek (Figure 1).
The wells in the Sulfur Creek area have penetrated a high-temperature but low-productivity formation. In the Redondo Creek area, the wells have encountered a high-temperature (>550°F) liquid-dominated reaervoir.
It is extremely important to make reliable estimates of the mass of hot water in place (reservoir capacity) and the length of time the reservoir can supply steam for a 50^4W power plant (reservoir longevity). Reservoir longevity depends both on
Icelamdic Rational Eaexgy Authority, report, OSJAC-7S4*.
Craot, K. »., 1977. mroadlames; a gas dominated geothermel field. Geotmaraica, w. 6, ato. 9, p. 9-29.
Straass, J. n.f ami Schubert, T., 1979a. Effect oE COj on tbe Vmoyaacy of geotheraml fluids. Geophysics Research Letters, v. 6. no. 1, p. 5-ft. , 1979b. Thermodynamic properties for the coevectiom of steaa-water-COj aixtures. le-prUt smbmitted to the Aaericar Journal of Scicace, Harch 1979.
Sutton, F. H., 1976. Fressure-teaaereture curves for a two-plus* mixture of water and carbon dioxide. Vev Zealand Journal of Science, v. 20, p. 297.
frittoa, P. M., amd HeBabb, A., 1977. Soiling curves at Sroadlaad* geotbermal field, mew Zealand. Few Zeclsad Journal of Science, v. 20, p. 333.
Sweigert, t. L., Hater, P., amd Allen, R. L., 1946. Thermodynamic properties of gases: carbon dioxide. Znd. Engi*. Cham., v. 30, . 185.
Vahl, E. F-, 1977. Ceotbaraal energy utilisation. Hew York, wiley-Interscf.emce.
We res, O., Taao, K., and Hood, 1., 1977. Resource, technology, and enviroeatent at Ifae Ceyaer*. Berkeley, Lawrence terkeley Laboratory, LBL-5231.
Unite, D. E., Huffier, L. J. P., sad Truesdell, A. I., 1971. Vapor-dominated nydrotheraal system* coapsxed with hot-water systems. Economic Geology* v. 66, p. 75-9'.
Zyvoloski, G. A., aud O'Sulliran, M. J., 19SO. Simulation of a l«* dominated, two-phase geotbermal reservior. SPE Journal, v. 20, p. 52-58.
the reservoir capacity and on the overall develop-nent plan for the field (flow rates, injection, etc.). Our paper (Bodvarsson et aJ., 1979) represents the first in a series of studies of the reservoir capacity and longevity of the Baca field.
THE YEAR'S ACTIVITIES
In this first study, the reservoir capacity was estimated by volumetric aeans tfting existing geological, well, and geophysical datfc. An initial study of reservoir longevity was also made using the two-phase numerical simulator SHAFT79 (Preuss et al., 1979) developed at LBL. Because of the lack of available data, ve made a number of assumptions daring toe cour»c of the study. Therefore, the rusults presented are preliminary estimates only.
Figure 1 is a base map of the Valles Caldera showing temperature contours, resistivity survey lines, tad major faults. Geologic cross sections <f the Palles Caldera region are shown in Figure 2 (see also Dondanville, 1971; Slodowski, 1977; Bailey
PRELIMINARY STUDIES OF THE RESERVOIR CAPACITY AND LONGEVITY OF THE BACA GEOTHERMAL FIELD, NEW MFXICO G. S. Bodvarsson, S. P. Vonder Haar, M J. Wilt, and C. F. Tsang

99
1 «**i* muwn
Figure 1 . Baae «ap of t M T a l l c a C a l l e r * •be# iag ehalSov t a a a t r a t o r e g rad ien t • ( ° F ) , geophysical aurvty l i n a a ( * . ( . » * - * * ) , a p c c i H c f a o l t a , and the est imated t o t rcaer-roir booadary. COL 7412-133*9)
C D 01 LenMldK • Qol Alluvium C D Qv VMM* Rhrdm C D OH t_t*a 5*dtoMnl C D QdCoid«roFIII
E D i t • I Tp RHiM Garqvi W i D ^ S a n t a F * SeaMw E£3 Tub Ab^afe T " »
E 3 Ob S0MMi*r Tut I
Figure 2. Geologic croaa section* of the Vallea Caldera legion. (XfiL 799-11548A)

100
and Smith, 1978). The Baodelier cuff, the prodwc-ir.g formation at Baca, is composed of several aaa-ben of closely welded to noovtldt^ rhyolitic tvff and tuff breccia. Up to 6300 ft of tbia rock has been penetrated by the well* io ledoodo Creek, but the bulk of the produced fluid coses fro* thj deeper, aore peraeable layers. From ttaperatnre logs of the wtlls io the ledondo Creek area, aa average reservoir thickness of 20CO ft *rt» estimated. An average reservoir porosity of 51 was estimated from well resistivity logs and core data (Core Laboratories, 1975).
Geophysical data (Union Oil Co., 1972; economics, 1976) shallow temperature contours sod deep temperature data (Unior Oil Co. and Flat, 1978) were m e d :n estiaaticg the areal extent of the reservoir. The reservoir temperature cootears (Figure. 3) are not very reliable due to the liaited amount of data, but they do indicate a sharp tem-perature gradient southeast of the main temperature anorsaly. This boundary coincides with s major northeast-southwest fault (Figure I) thst nay act aa an impermeable barrier, figure 4 shows the shallow temperature gradients and the telluric profiles along line B-B', which is directed along the length of Redondo Cai.v-n. An estimation of the
Voiles Calderj t S&H JWTWlO MOUNTAIN
0 0 5 I M-
0 I Km
\ \
\ \ BGN01 \ \
V .'61 i
hoc reservoir so—dsrie* im the Forth-south 4iz<c-t i oa i e awfe frea these data. The resu l t s are *sdic*t«4 by the dotted l i s * ia Figvxe 4 .
The data preseatly available are t?»o l i a i t e d to al low the western ha—dary of the hot reservoir to fee established. To allow an opt ia ia t i c c s t i aa -t ioa , the hot reservoir ia t h i s direct ioa was assmasd to extead to the ring fracture some. Some meophyaical data, aad the fact that the Sulfur Creek well* are dry, at— t o iadicate a aore reasomahle a o - l a r y c lose to the Bead-1 we l l .
Osieg the abov* c r i t e r i a , the areal eateat of the hot reaervoir mac est iaated t o he 40 h a 2 aad the porosity-thickaess product to he 100 f t . These vetoes correspond to a reaervoir capacity of 2.2 * 1 0 1 2 lb of hot ' l a i d i a place.
The longevity of the laca f i e ld has been studied using the n—eri'ial simulator HUFT79 (Freuss et a l . , 1979). The reaervoir was simulated using one basic rectangular mean, with diaemsiocs corresponding to those estimated i o the previous sec t ioa . In a few ca-.e s tudies , elements were added to obtain the required boundary eoaditioaa. Owe to symmetry, only half of the system was modeled (Figure 5 ) . Wells were not simulated individually, but rather the fluid was produced uniformly over one node representing half of the well f i e ld (assaned to be 1 km*).
The paxaaetera used in the simulation are given in Table 1. Moat of these were taken direct ly from data reports released to the public by t*nion Oil Company. The re lat ive permeability curves used vert the Corey curves (Faust and Mercer, 1979)-with residual l iquid and steam saturations of 0.30 and 0.05 respect ively .
Five cases were studied ustog a constant arss flow rate . The value used was based upon the amount o . steam theoret ical ly required for a 50-Mtf power
Figure 3 . Deep reservoir teapernture contours (3000 f t above sea l e v e l ) , in degrees.
(2BL 794-7414B)
Strion
Figure 4 . Shallow temperature gradients and t e l l u r i c prof i les along l ine b-B'. (XBL 7917-13350)

1 0 1
The Mesh used tn The &n*rWon
1 2 * r 3
s 9 0 3 3
I * » B £
Figure 5. The neah u«ed in the longevity study for "closed" reservoir case*. ( D L 7912-13354)
plant and a constant value of the aass fraction of steaa in the separators (Union Oil Co. and M l , 1978). The five cases studied were a bounded reservoir, an infinite reservoir, and three injection cases. Each case was run until the pressure in the production node dropped below the designated veil-head pressure of 10 bars (Union Oil Co. and 7JM, 1978). The longevity of the field in each case waa defined as the tisw it took to reach this point. In Figure 6, the pressure, tesjperature, and vapor saturation Mt the production node are plotted versus tiae for three of these cases.
The siaulation of the closed reservoir was terminated after 7.4 years due to the lov pressure in the production node. As Figure 6 shoes, the pressure fslls very rapidly at first until the production node goes tvo—phase. Under two-phs.se conditions, the pressure is related not to the
Figure a. The teaaterature, pressure, *ad va^or aataratioa behavior ia the production node for three of the constant flow rata cases. ( U L 7912-13352)
density bat to the teeaeratare. The pressure first stabilizes after the node becoaws two-phase because of the large baas capacity of the node and the low initial soiling rataa. Later, the pressor* declines gradually with the taaawratarc. when saturation reaches 1.0, the pressure again becoaws dependent on density, aad the low inflow of fluid fro* adjacent nodea (due to the low absolute peraeability and the effect of the relative peraeability curves) causes the pressor* to drop vary rapidly.
For the infinite ease* the oressere in the production region dropped below 10 bars after aboat 10 years, again doe to tbs iiaited flow of the fluids into the production node (low-par—ability effects). It therefore appears that the controlling
Trfble 1. Parameters used in siaulation.
Constant flow rate
Rt--t heat capacity
Permeability thickness
Thercal conductivity
Porosity thickness
Initial pressure
Initial tenperature
Enthalpy of saturated steaa in flash tank
Enthalpy of saturated liquid in flash tank
Steaa requirement for a 50-MW plant
Enthalpy of the fluid entering the well
Steam quality in ilash tank
Total flov rate
Q, - 33C ig/s
C, - 950 J/kg°C
kh - 6.wio ad ft
>. - 2 . 0 J / S * M * ° C
*H - 100
Pi - 110 b a r s
Ti - 300°C
H s v " 2 , 7 7 2 , 0 0 0 J / k g
H B 1 - 7 3 4 , 3 8 0 J / k g
Q.v - 8 9 2 , 0 0 0 l b s / h r
Hwv
s q v
Qt
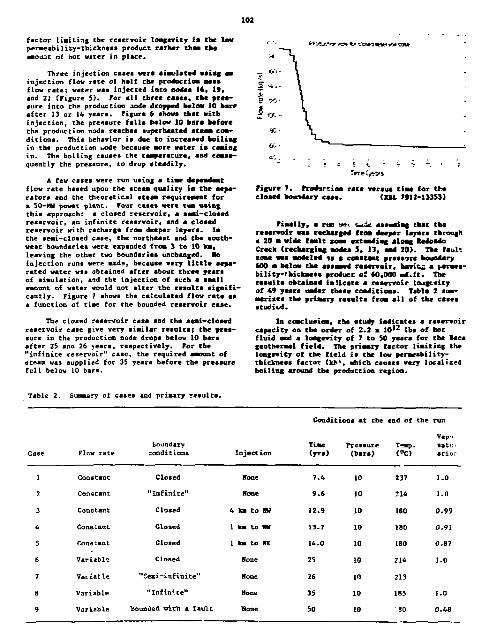
102
factor liaitiag the reservoir longevity is the low peraeability-tniclcness product rarher thee the aaou.it of hot water in place.
Three injection ceaea were siaulated usiag as injection flow rate of half the production M S * flow rate; water waa injected into nodes It, 19. and 21 (Figure 5). For all three cases, the pressure into the production jode dropped below 10 bare after 13 or 14 years. Figure 6 ehowa that with injection, the pressure fells below JO bore before the production node reaches superheated steaai conditions. This behavior is due to increased boiltag in the production i.ode because aore water i* coaiag in. The boiling causes the teaperature, and cease-quently the pressure, to drop steadily.
A few cases were run using a tiae descendant flov rate based upon the steaai quality in the ecpa-rstors and the theoretical steaat reouireaent for a 50-WH power plant. Four c u e s were rue. using this approach: a closed reservoir, a sesu.—closed reservoir, an infinite reservoir, and a closed reservoir with recharge fro* deeper layers. In the seat-closed case, the northeast and the southwest boundaries were expanded from 3 to 10 ka, leaving the other two boundaries unchanged. Ho injection runs were mad*, because very little separated water wis obtained after about three years of simulation, snd the injection of such a saall amount of water would not alter the results significantly. Figure 7 shows the calculated flov rate aa a function of time for the bounded reservoir case.
The closed reservoir case and the seai-closed reservoir case give very similar results; the pressure in the production node drops below 10 bars after 25 and 26 years, respectively. For the "infinite reservoir" case, the required aaount of steam was supplied for 35 years before the pressure fell below 10 bars.
Table 2. Summary of cases and primary results.
Conditions at the end of the run
VaP-> Boundary Tiae Pressure T-ap. Mtu;
Case Flow rate conditions Injection (yrs) (bars) (°C) atior
1 Constanc Cloaed If one 7.4 10 237 1.0
2 Constant "Infinite" Hone 9.6 10 214 1.0
3 Constant Closed 4 km Co RV 12.9 10 180 0.99
4 Constant Closed 1 km to IN 13.7 10 lao 0.91
5 Constant Cloaed 1 km to HI 14.0 10 180 0.87
6 Variable Closed None 25 10 214 1.0
7 Variatle "Seaii-infinite" Hone 26 10 213
8 Variable "Inf in'-te" Hone 35 10 185 1.0
9 Variable Sounded with a fault alone 50 10 SO 0.48
Figure 7. FroaVtioa rate veraue t iae for tfce closed boundary c u e . (ML 7912-13353}
F iaa l ly , « rtss m t u & assasrimg that the reservoir waa recharged froa deeper layera through a 20 a wide faa l t xoae extsadiac aloag Redoamo Creek (recharging modes 5 , 13, aad 20) . The fault son* was aodeled ?• a coastent pressure boundary •00 m below the assaaad reaenroir, havit^ a {*raea-bility-taickmcae product of 60,000 ud . f t . The resu l t s obtained inUcate a reservoir lougcvity of 49 years umder these eoadit ioas. Table 2 sum-aarisea the primary resul ts froa a l l of the cases studied.
In conclnaion, the study indicates a reservoir capacity oa the order of 2.2 x 10* 2 lbs of hot fluid end a longevity of 7 to 50 yeara for the Baca geotberael f i e l d . The priaary factor l imiting the longevity of the f ie ld i s the low permeability-thickness factor ( k h \ which eauaes very localized boi l ing around the production region.

103
PLANKED ACTIVITIES FOR 1980
During the next fiscal year, additional studies of the longevity of the Baca field will be carried out. The effects of relative permeabilities sad the size of the production area vill be studied, and construction of a geological model of the field will be initiated.
REFERENCES CITED
Bailey, R. A., and Smith, R. L. t 1976. Volcanic geology of the Hemes Mountains* Mew Mexico, in, J. W. Howley, ed., Circular 163. Hew Mexico Hin. Mines, p. 184-196.
Bodvarsson, G. S., Vonder Haar, S., Wilt, H. J., and Tsang, C. P., 1979. Preliminary etudi" of the reservoir capacity and the longevity of the Baca geothermal field. New Mexico. Berkeley, Lawrence Berkeley Laboratory, LBL-10227, 18 p.
Core Laboratories, Inc., 1975. Special core analysis study of Baca no. 13 well. Onion Oil Company.
Dondanville, R. F., 1971. Hydrological geology of the Valles Caldera, New Mexico. Union Baca Project Report, 36 p.
Faust, C. «.. « • Mercer, J. H., 1979. Ceotbermal reservoir aiamlatiom; mmmerical eolvxiom tech-miames for liemid: amd vapor dominated hydro-thermal ay*team, litter Resources Research, v. IS, ao. 1, p. 31-46.
Ceoaomica, Inc., 1976. Kagmetotcllaric-tellmric profi*e sarvey of the Valles Caldera prospect. VaitM G5.1 Company.
Crane, M., 19*9. Interpretation of downhole measurements at Baca. Froc. *tb Workshop oo Ceotberael Reservoir Engineeriag, Stanford University.
Pruess, K., Zerxam, J. •., Schroeder, 1. C , and Witherspoon, p. A . , 1979. Description of the tliree-rfinmmciomel cno-mmas* simulator SUFX74 far use i* xeotbvrmal reservoir stadieo. Paper presented at Peer. tag. Meeting in Denver, Colorado, Pebrmer) 1-2, !9J9-
Slodowski, T. K., 1977. Geological reseme of the Valles Caldera. Oaron Baca Project Report, 11 p.
Union Oil Company of California, 1972. Additional electrical geophysical surveys of the Vallcs Caldera area. Onion Oil Company.
Union Oil Company of California and Public Service Company of New Mexico, 1978. Ceotheraal Demonstration Plant—Technical and Management Proposal to DOE, 120 p.
MODELING TRANSIENT TWO-PHASE FLOW IN A WBXIORE C. W. Miller
INTRODUCTIOR ACTIVITIES IS 1979
For a conplete analysis of a geothermal system, it is necessary to model flow in the wellbore and in the reservoir. Several numerical codes to simulate the two-phase flow in the wellbore have been reported in the geothermal literature including those of Gould (1974), Juprasert and Sanyal (1977), and Sigiura and Farouq (1979). However, they all assume steady state flow. Such types of models can be used to approximate downhole conditions from wellhead measurements or vice versa but only after the well has been flowing at a constant rate for a while. They are not useful in describing the well-bore flow during a veil test. At early times, after a flow rate change has been made at wellhead, the mass flow rate into the well (m.£Q) does not equal the mass flow rate out of the well ( m 0 u C ) (
because wellbore storage is important. Under such circumstances, a steady-state model, which naturally aasuaes m £ n = *out> is not appropriate. Wellhead data taken during this early time cannot be related accurately to downhole pressures using a steady-state model, and a transient model is needed* Besides relating wellhead and downhcle pressures during a well test, one can use such a code to understand the initial pressure changes with time in the well after a flow rate change. Because of heat transfer in the wellbore and the relatively large value of permeability-thickness found in a geothermal field, the drawdown or buildup curve does not necessarily coincide with what is predicted by well test analysis developed by t>e petroleum industry (Hiller, 1979a).
A transient two-phase numerical code that solves one-dim*nsiooal flow including heat and mass transfer has been developed. The wellbore model has been coupled to s rei-ervoir model of simple, one-phase radial flow in a porous medium. The program WSUORE solves the equations of mass, momentun, and energy and uses an equation of state to relate the density to pressure and energy. The Navier Stokes equation is used for the momentum equation in contrast to assuming Darcy flow as for flow in a porous medium. Thermodynamic equilibrium is assumed ao the Equation of atate is gives by so analytical representation of the the steam tables. For the initial development of the model, the velocities of the two-phases were assumed equal. The four unknowns that must be determined are pressure, energy, density, and velocity.
The basic approach Is to solve the four equations using a finite—difference approximation with a partially implicit method. Terms that would impose very restrictive time steps because of the fluid compressibility were solved implicitly while the other terms were evaluated explicitly for ease end computational efficiency. The solution procedure is: (1) to write the change in density, dp, in terms of the change in pressure, dP, and the change in enegy, de; (2) to solve the energy equation for the quantity de; and (3) to combine the continuity and momentum equation to give an expression for the new pressure in terms of known values. Combining the equations results in an
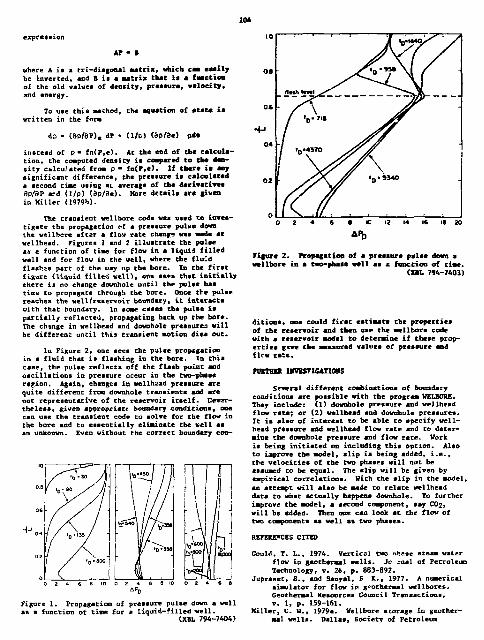
10ft
expression
AP - 1
where A i t a tri-diagonal matrix, which can eaai ly he inver ted , and ft i s a matrix that ia a fnaction of the old value" of dens i ty , preesura, ve loc i ty , and energy.
To uae t h i s method, the aquation of s ta te i s wr i t t en in the foraj
dp - (3p/8P) e dp • U/p} (dp/de) pic
instead of P- fn(P,e). At the end of the calculation, the computed density is compared to the density ctlcuJated from P - fnCF,e). If thare ia any significant difference, the preasure ia calculated a second tine using at average of the derivatives ap/ap ard Cl/p) <9D/Be). More details are given in Miller <1979>>>.
The transient wellbore code was used to investigate the propagation of a pressure pulue dovn the wellbcre after a flow rate chant* waa made at wellhead. Figures 1 and 2 illustrate the pulse a« e function of time for flow in a liquid filled well and for flow in the well, where the fluid flashes pare of the way up the bore. In the first figure (liquid filled vell>, one »e*i that initially there is no change downhole uatil the pulse has tine to propagate through the bore. Once the pulse reaches the well/reservoir boundary, it interacta with that boundary. In sone cases the pulse is partially reflected, propagating back up rbe bore. The cbsnge in wellhead and downhole pressureo will be different until this transient motion dies out.
In Pigure 2, one sees the pulse propagation in a fluid that is flashing in the bore. In tbia case, the pulse reflects off the flash point and oscillations in pressure occur in the two-pbaee region. Again, changes in wellhead pressure are quite different from downhole transients and are not representative of the reservoir itself, nevertheless, given appropriate boundary conditions, one can use the transient code to solve for the flow in the bore and to essentially eliminate the veil as an unlconwn. Even without the correct boundary con-
Figure 1. Propagation of pressure pulse down a well as a function of time for a liquid-filled well.
(XBL 794-7404}
Figure 2. Propagation of a preaaure pulse down a wellbore in a two-phase well ae a function of time.
CXftL 794-7403)
ditiona, one could firet estimate the properties of ehe reservoir and then uae the wellbore code with a reservoir model to determine if these properties g*ve Che measured values of pressure and flew rate.
FQ1THDI UVESTIGATIOHS
Several different combinations of boundary conditions are possible with the program WELBORE. They include; (1) downbole pressure and wellhead flow rate; or (2) wellhead and downhole pressures. It is also of interest to be able to specify wellhead pressure and wellhead flow rate and to determine the downhole pressure and flow rate. Work ia being initiated on including tbia option. Also to improve the model, slip is being added, i.e., the velocities of the two phases will not be assumed to be equal. The slip will be given by empirical correlations. With the slip in the model, an attempt will also be made to relate wellhead data co what actually happens downhole. To further improve the model, a second component, say W>2, will be added. Then one can look at the flow of two components a» well as two phases.
REFERENCES CITED
Goulif<, T. L., 1974. Vertical two ^>ha«e steam water flow in geothermal wells. Jc m a l of Petrolew Technology, v. 26, p. 883-892.
Jupraset, S., and Sanyal, S K., 1977. A numerical simulator for flow in exothermal wellbores. Geothermal Resources Council Transactions, v. 1, p. 159-161.
Miller, C. H., 1979a. Wellbore storage in geothermal wells. Dallas, Society of Petroleum

Engineers, SPE-3203. , 1979b. Numerical model of transient tvo ' phase flow in a wellbore. Berkeley, Lawrence Berkeley Laboratory, LBL-9056.
Sugiars, T., and Feroaq, eive wellbore ateai
S. H., 1979. A ca v u i r flev motel for i t u i
injection sm4 geoth*ra*l application*. Dallas, Society of Fet-oleam Iagiaeera, SFC-7966.
CORRECTION OF DOWNHOU PRESSURE TRANSW^TS MEASURH> WITH A FLUID-FIUED CAPILLARY TUIE C W. Miller and J. M. Zerzan
INTRODUCTION
One of the limiting factors in Che well teatins of a geothermal reservoir is the ability to Mature downhole pressure transients. Many existing pressure tools, developed for the petroleum industry, ct not withstand the high temperature and high salinity of the geotheraal brine. The main probleai is the pressure transducer itself* One Method that has been used to alleviate the problea ia to keep the pressure transducer at wellhead and to transadt downhole pressure changes to wellhead through e fluid-filled capillary tube. The fluid used in the tube should not flash or condense at the temperatures and pressures of interest. Also, the diameter of the tubing oust be small enough ao that the tubing can be handled at wellhead and lowered into the well. Such a system is marketed for use by the petroleum and geotheraal field by the Sperry Sun Company and has been used at Lawrence Berkeley Laboratory for a number of well tests. However, an analysis was done on the system in the previoua year (Miller and Haney, 1978), and it was shown that the fluid transmission line delayed and distorted the pressure signal significantly. The time delay of the system was on the same order of magnitude or longer than the response time of the reservoir in many cases. The effect of tubing diameter, fluid type, temperature changes, and temperature and pressure levels were investigated. Nevertheless, because of the desirability of being able to continuously monitor the downhole pressure during a test, and the unavailability of alternate methods at the moment, the system is still being used or being considered for atany well tests. The main effort then in 1979 was to investigate whether one could determine an accurate method of correcting for the effect of the measuring instrument, the fluid transmission line in this case.
ACTIVITIES IN 1979
In the previous work, the fluid transmission system was modeled for the fluid being either a gas or a liquid. Given the pressure disturbance generated downhole, one could calculate, then, what would arrive at the wellhead. For uht liquid-filled tube, the propagation of the pressure diaturbance was controlled by a diffusion-like equation because of the large friction effects. For a gas-filled tube, the pressure disturbance had to be modeled by a wavelike equation that had a damping tern to account for the frictional losses. However, to correct for the effects of the fluid transmission line on the signal, one must be able to solve the inverse problem. That is, given the measured pressure signal, it is necessary to determine the downhole pressure that caused the signal. The problem is not
straightforward because the specification of the cause of the diaturbaace (the measured pressure) dees not result in e well-poaed problem. A unique solution may mot exist, meaning that different disturbances could result in the same signal arriving at the pressure transducer. At present, it has been poaaible to obtain reasonable eolations tc this inversion proelea for the ease of the liquid-filled tube* because :he equation governing the signal propagation was linear in moat cases, and when it was nonlinear, the coefficients were a function of the position only and not a function of position and time. For the gas-filled tubing, the equation governing the signal propat*tioo ia highly nonlinear, and it ia not clear that a unique solution exists for the measured data. An invereion technique was applied to the liquid case and excellent results were obtained.
As stated above, the liquid-filled tubing was modeled by a diffusion-like equation. This came type of equation is important in heat conduction problems, and the solution to this inverse problem has been considered previously. Exact solutions are available for the linear eaje (Burggraf, 1964). However, the exact solution requires a continuous pressure measurement in time, because the inverse solution is a convergent scries dependent on derivatives of pressure with time. The more distorted the signal, the more higher-order derivatives are needed. Accurate measurements of these derivatives may not be rcaliatic.
Another method of inverting data is the nonlinear estimation technique usee by Beck (1970). The method is to ainiaize the difference between the calculated response of the system for a guessed value of pressure or the derivative of the pressure at the bottom of the well and the measured response over sore time interval. Because Cher2 is a delay in time before the changes downhole can be aeasured at the wellhead, the ainiaization is done over a number of "future times," with the nuaber of future times depending on just how long the delay is. If a signal takes 10 sec to produce s "measurable" value at wel'head, then the ainioization is done over the time t*- t t* + 10 sec. For a longer delay, the ainiaizjrion is done over a ]soger tiae A aea3urable value depends on the accuracy of the pressure transducer used. Hore details of the method ire given by Miller and Zerzan (1979).
The aethod was used to invert the aeasured data. Results of the inversion are given in Figures 1 through 3. For the first two cases, the aeasured data were obtained by using a simulation drawdown curve and then finding out what would be measured at wellhead for that curve. Then these
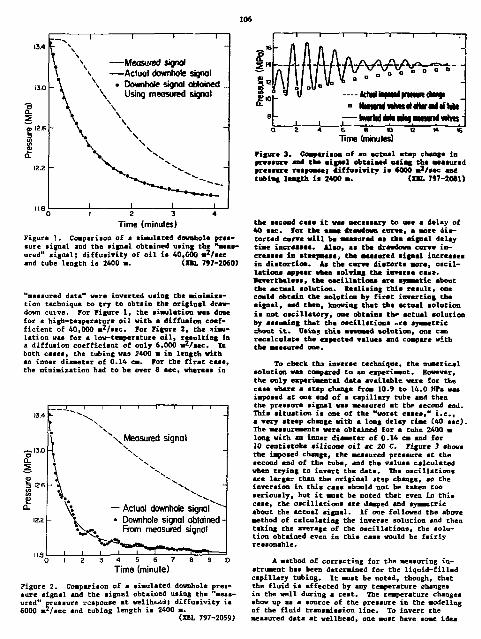
106
a. 5
r\' - i i i
—Measured signol
\ \ — Actua l downhole signal
_\ \ • Downhole signal obtained _
^ \ Using measured signal
\ \ \ \ - \
\ \ \ v \ S
i i i i 0 1 2 3 4
Time (minutes) Figure 1. Comparison of a sinulated dovnhola pressure signal and the signal obtained using the "measured" signal; dif fuaivity of o i l i s 40,GOO m 2 /sec and tube length i s 2400 a. (ML 797-2060)
"measured data" were inverted using the minimiEa-tion technique to try to obtain the original drawdown curve. For Figure 1, the simulation vaa done for a high-temperature o i l with a diffusion coeff ic ient of 40,000 m 2 / sec . For Figure 2 , the simulat ion was for a low-temperature o i l , result ing in a diffusion coeff ic ient of only 6,000 mVsec. In both cases, the tubing was ?400 m in length with an inner diameter of 0.14 cm. For the f i r s t case, the minimisation had to be over 8 sec , whereas in
13.4 .. " X 1 1 — 1 1 - 1 1 1 — l •
: V
\ N x Measured signol
— 13.0 \ N.
n° \ X N 5 \
\ 3 12.6 h \ \ j , V ^ Q_ \ j — Actual downhole signal -12.2 \ • Downhole signal obtained-
^ J H " . From measured signal
^ • N a * * ^ - ^ ... 0 1 2 3 4 5 6 7 8 9 1 0
Time (minute)
Figure 2. Comparison of a simulated downhole pressure signal and the signal obtained using the "measured" pressure response at wellhead? diffusivity is 6000 mVsec and tubing length is 2400 a.
(XBL 797-2059)
fctaaj nsfstsi aflMsTI Can*!
•mnaaaj ajnu H warn amj n ama
r"~~* MflfWB saw asaj HSnVn ntrts
Time (minutes) Figure 3. Comparison of an actual step change in pressure anal tba signal obtained using the measured pressure response; diffuaivity is C000 m 2/aec and tubing leagth ii 2400 m. ( H i 747-20*1)
the second case it was necessary to use a delay of 40 sec. Tor the same drawdown curve, a more distorted curve will be measured as the eignal delay time increases. Also, aa the drawdown curve increases in steepness, the measured signal increases in distortion. As tba curve distorts more, oscillations appear whan solving the inverse ca*e. nevertheless, the oscillations nra symmetic about the actual solution. Kealiaiag tola result, one could obtain the solution by firat inverting the signal, and then, knowing that the actual solution is not oscillatory, one obtains th* actual solution by assuming that the oscillations .-.re symmetric shout it. usin? this assumed solution, one can recalculate the expected values and compare with the measured one.
To check the inverse technique, the numerical solution was compared to an experiment. However, the only experimental data available were for the case where a step change from 10.9 to 14.0 MP* was imposed at one end of a capillary tube and then the pressure signal was measured at the second end. This situation is one of the "worst cases," i.e., a very steep change with a long delay time (40 sec). The measurements were obtained for a tube 2400 m long with an inner diameter of 0.14 en and for 10 centistoke silicone oil at 20 C. Figure 3 shows the imposed change, the measured pressure at the second end of the tube, and the values calculated when trying to invert the data. The oscillations are larger than the original Jtep change, so the inversion in this case should not be taken coo seriously, but it must be noted that even in this case, the oscillations are damped and symmetric about the actual signal. If one followed the above method of calculating the inverse solution and then taking the average of the oscillations, the solution obtained even in this caae would be fairly reasonable.
A method of correcting for the measuring instrument has been determined for the liquid-filled capillary tubing. It must be noted, though, that the fluid is affected by any temperature changes in the well during a test. The temperature changes show up as a source of the pressure in the modeling of the fluid transmission line. To invert the measured data at wellhead, one must have some idea
of the ehan|e* in temperature with time, which is a large limitation on the use of the instrument.
PUIMHED AClT-'ITIES
It is still of interest to consider the highly nonlinear problem of the inverse case for a gas-filled tube. One reason is that the gas is significantly less affected by temperature changes then the liquid-filled tube. Secondly, given a method of modeling the two-phase transient flow in the vellbore itself (Miller, 1979), another possible way of obtaining the downhole pressure transients is to use the wellhead data itself without having to resort to a fluid transmission line. Such a technique will be considered in the future.
REFERENCES CITED
Burggraf, 0. R., 1964. An exsct solution of the inverse problem in heat conduction theory
and applications. v. S6C, p. 373.
Journal of Meat Transfer,
leck t J. V., 1970. Sonlimear estimation applied to the nonlinear inverse heat conduction problem. Internatioaal Journal of Rest and Mass Transfer, V. 13, p. 703-716.
Miller, C. U., 1979. A numerical model of transient two phase flow in a wellbore. Berkeley, Lawrence Berkeley Laboratory, LBL-9056.
Miller, C. W., and flaney, J., 1979. •espouse of pressure changes in a fluid filled capillary tube, M I Proceedings, Second Invitational Well Testing Symposium. Berkeley, Lawrence Berkeley Laboratory, LBL-8S83.
Killer, C. V., and Zersan, J. K., 1979. Downhole pessure changes mecaured with a fluid filled capillary tube. Dallas, Society of Petroleum Engineers, SPE-8233.
WEUBORE STORAGE EFFECTS IN CEOTHERMAL WELLS C. W. Miller
The established techniques of well testing in the petroleum industry, which are used to assess the characteristics of oil and gas reservoirs, have been extended to the geothermal field. However, there are several important differences between a geothermal field and an oil or gas reservoir, and it is necessary to understand how these differences will influence the analysis of well test data. There ere two important differences. (1) The value of kh/y (permeability-thickness/viscosity) is usually much larger in a geothermal field than an oil or gas reservoir because of the large value of h and relatively small value of M. (2) Heat loss in the wellbore during a well test of a geothermal field can be important while it is ignored for a test of an oil or gas field. The increased value of kh/li neans that for the same storage capacity of the reservoir, the time for the reservoir to be able to supply the desired flow rate for a given pressure drop will decrease. The significance of this effect is that as the time for the reservoir to respond decreasest the nonuniform transients in the well itself can become important. The drawdown in a well test has been derived previously assuming that the fluid in the wellbore is well-mixed and responds uniformly in time to pressure changes, i.e. an infinite speed of propagation. As the reservoir responds faster the latter assumption is not valid and vastly different wellbore storage curves are obtained. The Becond problem of heat loss always exists in the testing of a geothermal field and is important even when the semilog straight-line region is expected.
ACTIVITIES IN 1979
Work was one on understanding and characterizing the expected drawdown pressure response during a well test of a geothermal field. The effort vas directed at understanding rhe arly time changes affected by the relatively large value of kh/M and also the longer time effect of heat transfer.
wellbore storage is the capacity for the well itself to absorb or supply any part of the mass flow rate out of the well/reservoir ayatern. When the mass flow rate at the surface is increased (or decreased), the change in pressure is felt initially only in the well. After a certain amount of time, depending on the properties of the reservoir and the conditions in the well, the reservoir will start to supply part of the flow. As transient changea in the well die out, the aandface flow rate increases and approaches the surface flow rate, and one can think of th* time for this to occur as the time constant of the reservoir.
If the pressure changes with tine in the well are not a function of position, then a graph of pressure versus time on a log—log plot will h*ve unit slope, implying that the well supplies the flow rate changes in a uniform manner. All wellbore storage curves generated in the petroleum industry have this unit slope. However, there is a finite time for changes made at the surface to arrive downhole, and it is not possible for the well to respond initially in a uniform manner. During that time, the wave generated when a change is made in flow rate at the surface is important and the measurement of pressure changes with time (dP/dt) at any one point in tne well cannot characterize the average of dP/dt. Before a well-mixed condition is valid, the wave nature of the original disturbance must be damped O U L . There are cases when the reservoir can supply fluid before dP/dt in the well is uniform. For these cases, a unit slope of log P vs log t is not measured and another nondimen-sional time has been derived to characterize the resultant curves.
For a given value of Cp (ratio of the storage capacity of the well to that of the reservoir), it has been possible to derive a quantity tgy, which is the ratio of the time for the reservoir to respond to that of the well. The quantity wes

108
determined to be
Ji. kh 1 ^\"K
where r v ia the radiua of the wall, P s f ia tha ... £* W*>' deniity of the fluid at the sandface, and C«P/»P), Z J--*-, ii the average isentropic compressibility of the fluid ia the veil. Using a treaeieat msacrical •wdel of the flow in the wellbore (Miller, 1979a), it baa bean possible to determine the expected) drawdown response for a homogeneous eingle-phase reaervoir with cither single-phase or two-phase flow in the wellbore for the adiabatic case.
Figure 1 illustrate* the result* of tbeae calculations for a Cn • 25, giving the noodinaneional pressure Fn, versus the nondimansiooeJ time, tn. Plotted in the figure ere: (1) the Cn - 0 Cftae for a finite well rudius; (2) the drawdown curvo gener-ated assuming the fluid in the wellbore responds uniformly; and (3) the actual drawdown curve* that result as the value of the tjgj decrease*. After a flow change has been made at wellhead* nothing is measured downhole until the disturbance arrives. However, once the wave reaches the wall/reservoir interface, the pressure change increases abruptly and approaches the wellbore storage curve bated on the uniform theory, tf the reservoir cannot supply thu surface flow rate for the pressure pulse that turives downhole, then the well must continue to supply the desired flow rate and ?n v* tn curve approaches the unit slope. Most oil and gas fielda are in this category. But ee fch/u increases for the sane value of Cn, the reservoir ia capable of supplying a much larger quantity of fluid in a shorter time and the measured *n ve tj> curve approaches the uniform theory curve at times later than the expected unit slope. Curves of thia steep nature have been observed in geothermal field testa (Narasimhan and Hitherapoon, 1977) and were not previously explained. As tpj} decreaaea, the reaervoir
Figure 1. homdimensioual pressure v* aondimensional time for different values of t w with Cn - 25. Calculations) arc dome Cor fluid that ia both flashed and uaflasbed. ( M L 794-7*02)
may be able to supply more fluid than the well could for the same pressure drop and oscillations would be measured. The quantity tyjf was shown tc describe this 'sarly time behavior in many case* and details are given in Mi'ler (1979b).
The effect of heat transfer on the veil teats we* also considered, heat transfer in especially important when a mew veil is tested because the rock surrounding the bore is still relatival* cool* However, heat transfer will always be important in a two-phase well because of the large temperature changes that occur when tht flash level rises or falls. Iveo after the early-time wellbore storage change* ere over, heat transfer can alter the alope of the semilog plot of T v* log t from qp/4rkh 'q ia the volume flow rate) requiring a different analyaie of the data than hns been developed in the petroleum industry.
Figure 2 is a plot of T v* t for a buildup and a subsequent drawdown teat. To simulate the beat
Buildup
1.5
I no heat loss
/ s f /
i / i I
1 • i •
heat lois
1.0 i / i I " ' / j / i / i /
-
0 . 5
if
-
0 ' . i i . i .
a • • , • • . [• |
0 5 11
l\
!\
-
- 1 0
i \
4\ 1 i \ T
| U s.: -
i \ 14 15 U 13 H i t a M i f f M M l M n l a )
-
•IS
« 0
- \ \ heat loss ^ \ / A-^-——
nohealloss _ > . i i — 10 20 30
timfi (minutes) 10 20
time (minutes)
Figure 2. Effect of heat transfer on the buildup and drawdown curve. (XBL 794-7412)

109
loaa from the well. a typical geotbermel temperature gradient was iniatd far fro* the M i l and a ••all temperature buildup was lieed near tlw bora. A nondimensional representative tammeratvre profile is given by the insert in tfe* figure* This is a typical temperature buildup. The effects shorn in the figure will increase for colder wells. la Figure 2, the graph on the left if a pl.t of the pressure buildup and then drawdown when the heat loss is ignored. The graph on tha right is a plot of thoie properties when neat trensfer ia allowed to take place. The figure shows that the neat transfer causes the pressure to initially change at a slower rate both for the buildup and the drawdown test. During a buildup test, the enthalpy of the exiting fluid decreases because of the increased tine that the fluid is in the well. As the enthalpy decreases, the fluid can condense or compress more for the same pressure ao more fluid flows into the well with a smaller preasure rise. Alio the time required until a semilog straight line is measured increases and the slope of this line chsnges from that predicted in the petroleum industry (see Millie 1979b).
INTRODOCTION
Since the 1960s, considerable work has focused on the problem of isothermal flow to l well intercepting a single fracture. The primary emphasis has been placed upon understanding the flow .characteristics of s system with a vertical fracture; the horizontal fracture case has received relatively less attention. The interest in vertical fracture stemi from the common belief that vertical fractures generally result from hydraulic fracturing experiments.
The orientation of fractures created by hydraulic fracturing techniques is controlled by the in-situ stress condition at each specific site. Because the fracture propagates perpendicular to the least principal stress, horizontal fractures are generally created at •hallow depths, and vertical ones at greater depths. Recent studies by Zoback et al. (1977) have indicated that horizontal fractures can be created at considerable depths in certain tectonically active regions.
Fractures are also commonly found naturally. For example, in volcanic regions, the primary fluid conduits may be the contact zone between adjacent lava beds (Thorsteinsson and Eliassan, 1970; Benson et al., 1979). The contacts will in general behave as horizontal fractures of large areal extent in well tests. An understanding of the flow characteristics to a well intercepting a horizontal fracture is very important in the analysis of well tests in groundwater and geothemal reservoirs.
This brief report focuses on the pressure response in a well intercepting a finite-capacity horizontal fracture. Tie model used is calibrated
noma *eru isus IK the future, i t would, be of internet to
invest igate the eYaveevn raapomae for a multi layer reservoir wham the time raapomaa of the raaarvoir ia r e l a t i v e l y faat . I t i a a l so of in teres t to invest igate the pressure response whan flashing occurs i n the raaarvoir i t s e l f instead of jnat in the wel l and; to comaieer the af facte of a l i o between the afcaeea of the v e i l teat r e e n l t s .
itsmtncts CUD K i l l e r , C. H., 1979a. •wntrical model of transient
two-phase flow in a wel l bora. Berkeley. Lawrence Berkeley Laboratory, LBL-9056.
. 1979b. wellsore atorage e f f ec t s in geothermal wal la . Del ias , Society of Petroleum Engineers, SPI-U03.
Karasimhaa, T. M. ( and Witherspoon, p. A. , 1977. kVeservoir evaluation t ea t s on UCB 1 and tICC 2 , l e f t l i v e r Ceothermel Project , Idaho. •erkeley, Lawrence Berkeley Laboratory, LBL-5958.
againat an analytical aolution for the uniform-flux horiiontal fracture case. Some examples of the effects of fracture permeability and radial extent on the pressure response are given.
FtEVIOUS WOVE
a. number of studies have focused on fracture network problems using a grid of equally spaced horizontal fractures (Kaxemi, 1979; Boul' -i and Streltsora, 1977; tfajurieta, 1979). Hartsock and Warren (1961) studied numerically the psuedo-steady-state behavior of horizontally fractured wells. They calculated skin factors for different geometric and material parameters, assuming radial flow four fracture radii away from the well- Warren (1962) later extended the study, developing an expression for the skin factor.
Gringarten (1971) studied che unsteady-state pressure response in a well intersecting a horizontal fracture. In the study be considered a confined aquifer with a single horizontal fracture (Figure 1 ) . All of the flow into the well was assumed to be via the fracture and the fluid entering the fracture was assumes to enter uniformly over the fracture area (uniform flux). The results of the study were presented in a set of type curves (Figure 2 ) . Gringarten found that the system under the assumed conditions could be characterized by two dimensionless parameters (dimensionless time and pressure) in addition to the parameter
s-fc
HYDRAULICS OF A WEIL INTERCEPTING A SINGLE HORIZONTAL FRACTURE G. S. Bodvarsson, T. N. Narasimhan, and C. F. Tsang

110
Figure 1. model.
• ' # / / / " / > / .
Croc* section of a horizontal fracture (IBL 804-7G03)
L ^ - r w c i f H * -
1 • ,. n i " ii i I 1 1 II 1 Jr-
" " I " 1 ^^J_ 1
<y 10W
vf,^W -
3 - 5 10'* 10"' 1 ttf .©*
Figure 3. studies.
The mesh used in the numerical simulation (XBL 804-7003)
Figure 2. Type curves for a uniform flux horizontal fracture system (Gringarten, 1971). (XBL 804-7009)
NUMERICAL STUDIES
For this study the numerical code TEXZAGI was used. The program solves the mass balance aquation for isothermal fluid flow. It employs the integrated finite-difference method (XFDK) to characterise the flow regime (Narasimhan and Hitherepoon, 1978) and solves the sets of nonlinear aquations using an efficient sparse solver (Duff, 1977).
An axisymmetric mesh was uaed in the study (Figure 3 ) . Gravity effects and tip flow were neglected. Due to symmetry, only half of the flow field needed to be. considered. The block sixe was increased logarithmically in the radial direction. Ten to twenty fracture elements were used* depending upon the permeability and radial extent of the fracture.
Comparison with Gringarten's Solution
The first problem solved using the numerical simulator was identical to the.one solved analytically by Gringarten (1971).
In the problem as defined by Gringarten there is actually no well; rather the fracture behaves as a source (sink). Thus for the purpose of comparison with Gringarten's solutions, in the numerical simulation the well element had to be removed and sources (sinks) of variable strength placed in the fracture elements. In this way, one of the moat
critical assumptions made by Gringarten, the uniform flux assumption, was satisfied. Two casta were simulated, i.e., hp • 1 and bn • *. Figure 4 shows the comparison between the nmmerical and the analytical solution! for one of these cases.
Finite Conductivity Morixomtal fracture
The horisontal fracture problem solved analytically by Cringerten wes based upon several important assumptions. The moat critical assumption is that the same mess of fluid enters the fracture everywhere (uniform flux conditions). This assumption should not be critical at early times when linear vertical flow from the reservoir to the fracture occurs. At later times, however, radial flow to the fracture region starts to dominate and the bulk of the fluid enters the fracture close to the tip of the fracture. The uniform flux assumption therefore creates an unrealistically large pressure drop in the fracture elements close to the well.
Figure 4. Schmidt equal-area pole plot for vertical E and M holes, H9Z occurrence. (XBL 801-6786A)

Ill
In our numerical study we allow mares trie ted flow .to the fracture and the well. Flail ia allowed to flow from both the fracture ami the rock aatrix to the well depending upon the preaawr* gradieate (Darcy'a law). The fracture baa * finite hut constant permeability and contains only slightly coat-presaibla fluid (water).
Typical curve* of diaeuaionleaa preesmre verauu diacnsionleaa time ex the well are ahova ia Figure 5- For all of the three curves the aaae kf/14. ratio !• used, but with different fracture radii (rf). All other parasMtera remain the same. At early times the curves coincide* as wellbore effect and fracture atorage affeeta dominate the pressure response. Later on, as the pressure pulse hits the fracture radial boundary aod fluid froai the formation starts to enter the fracture, the curves start to diverge front the anther curve. The less the radial extent of the fracture (rf>, Che sooner the curves start to divert. Theoretically, the early part of the curves can be used to determine the transaiasivity (lew) and the atorativity ((fflicf) *t the fracture. The time of departure frost the Bother curve can be used to determine the fracture radius rf. The later tin* data can be analyzed to obtain the parameters of the in-situ rock.
EMI
HOHIZOHTM. rnUTUM 1
* = = ^ ^ ft»Bs mttmtUMf r « • * • « • (C.-Q.4**) M
r t»K>a ^ ^ P 5
• • too • - tea • - woo 9 • loco • • woo 9 • loco • • woo I • 30000 t • •
fr . 0 ° 10"' KT' 10° «f H?
T • US.
Figure 6. The effects of kp on the preeauve reapoF.se at the well. (XML $04-6997)
The effects of wellbore atoreaa, chocked fracture, fracture akin and skin arouae] the wellborz have «leo beea atudied. The liaittd apace in thie report doea not allow elaboration upon the reaulta obtained.
The permeability ratio between the fracture and the residual rock, kn - kf/kj-, is an important parameter that can be used to characterize a finite conductivity horizontal fracture ayatea. Our studies have shoim that this parameter ia unique'at practical dimensionicss tiaes. That ia, if the kn is kept constant, the pressure response at the well will remain the same, regardless of individual values of the rock and the matrix permeabilities. Figure 6 ahovs PQ vs tn curves at the well for different values of the parameter kn. In these runs a rather large wellbore (8 in.) waa used, as reflected distinctly in the long duration of the unit slope (vellbore effects). The bottoa curves correspond to as i&fioite fracture permeability, whereas the top curve represents the Theis cu<.ve with wellborn storage (Cn - 0.466). The dotted line represents Gringarten's analytical solution for hn • 1, Vhich is the value used in the simulation. As the figure shows, the analytical curve compares fairly well with the curves representing very high fracture conductivity.
HORIZOMTAl FfUCTUKF h • IQm ^^*— V •»10*
• ^ -
/ ::£ -
Figure 5. typical pressure response at a well intercepting a finite conductivity horizontal fracture.
(XBL 804-7002)
The numerical studies have shown that the di-Bansioaleae parameter hn, aa defined by Criagarten (1971) ia not a unique parameter for the horizontal fracture model we uaed. The reason, for thi* ia probably that we do not employ the apparently unrealistic "uniform flux" assumption in our model. The use of the presently available type curves for horizontal fracture systems may, therefore, lead to serious errors in the determination of the fracture and formation parameters.
FISCAL TEAK 1960 ACTIVITIES
During the next fiscal year our studies will be continued. Emphasis will be placed upon identifying the important diaenafonleas parameters that can be used to characterise finite conductivity horizontal fracture systems.
REFERENCES CITED
Benson, S. f Goranson, C , and Schroeder, R., 1979. Evaluation of City Hell 1, Klamath Falls, in Annual Report Earth Sciences Division, 1979 (this volume).
Boulton, N. o., and Streltsova, T. D., 1977. Unsteady flow to a pumped veil in a fissured water-bearing format-sn. Journal of Hydrology, v. 35, p. 257-269.
Duff, 1. S., 1977. HA28: A set of FORTRAN tub-routines for sparse unaymmetric linear equations. Harwell/Oxfordshire, Great Britain. Report AERE-R8730.
Gringarten, A. C , 1971. Unsteady state pressure distribution created by a veil with a single horizontal fracture, partial penetration, or restricted entry (Ph.D. dissertation). Stanford University, 110 p.
Hartaock, J. H., and Warren, J. E. The effect of horizontal hydraulic fracturing on well performance. Journal Pe-roleum Technology, v. 1, p. 1050-1056.

112
Razeed, H. r 1969. Pressure transient analysis of naturally fractured reservoirs with aaifora fracture distribution. 5oc. P*tr. Int., •• 9, p. 451-462.
Najurieta, H. L., 1979* Interference aad pulse tea tint in unifomly fractured r«fervoire. Dallas Society of Petroleua Engineers. SPE-8263.
Narasiahan, T. N., and Hitherspoon, P. A. ( 197$. An integrated finite difference actbod for analyzing fluid flaw in porous a*dia. Hater Resources Research, v. 14» no. 2, a. 255-261.
Thorsteinsson, T,, and Eliasson, J., 1970. Ceo-
kydrology of the U « | i n u hvdmtheraal eyetea i* Iceland, in Precaeding*, O.K. Syapoeiwa on the ttvalOHMtt ead Otilixatioa of Ceotheraal Baaomce*, Ceotheraica, Special taewe 2, v. 1, part 2, *. 1191-1204.
Uarrea, J. ••» W S 2 . Siecaeaiofi oa a aatheaatical aodel for water aovaaamt afcoat bottoa-water drive reservoirs. Society Petrolewn Engineers Journal, v. H , p. 3C7-3tt.
Zobaek, H. D., lealy, J. I., aad toller, J. C.» 1977. Preliaiaarr strtia aeaiaraatnta in central California using tbft hydraulic fracturing technique. Pagcoeh. v. M 5 , p. 135-152.
PRELIMINARY STUDY OF SUKIDBvCE AT WAIRAKB, NEW ZEAtANO, USING A NUMERICAL MODEL T. N. Narastmhar. and K. P. Goyal
INTRODUCTKHf
Significant around subsidence (4.5 a aaxiaua) has been observed at tfsirakei, Kew Zealand, following geotheraal fluid extraction since the late 1950s (Sfcilwell et si., 1975). The observed subsidence presents two peculiar featurea. The first ia that the subsidence bovl ia offset froa the asin production area (Figure 1). Secondly, a plot of reservoir pressure drop versus subsidence at benchmark A97 (Figure 2) shows that the rata of subsidence with reference to pressure increases drastically after the pressure drop exceeds apprtneiaately 15 bars. While this combination of observed behavior should be explainable in aore than one way.
it appears that a coabinatioa of heterogeneity an precoaaolldatiom of the foraatiea aatarial could provide a logical fraaework for characterising Uairakei subsidence.
The purpose of the present atudy ia to investigate in a phenrssaaological fashion whether the observed feature* at Uairakei can he reasonably explained in tern* et heterogeneity and precoasolida-tica. This work ia not intended as a detailed aodel of the Wairakei lyacea; rather, it ia an-rnly a preliminary investigation aa to whether heterogeneity and preconsolidation can provide a practical basis for understanding in the tfairakci phenoaenon.
Figure 1. Total subsidence contours at tfairafcei, Hew Zealand, tigation ABC (from Stilwell et al., 1975).
and the ares of inves-(XBL 7911-13203)

- / f'
S ?„ • * *SU2S£2Z Tn i &*1&t
5 t y ^
r f •• / / i MtfMH. te EttlM
i M i rw ^f icmt •« ai.. its,] i M i 1H0
/ M S
V Ml**** It *
Figure *. ReservLir pressure drop versa* subsid-ei. ~ obeirved at the Wairakei geothemat field, He.- Zealand. ( H L 773-0173)
RESULTS
The geology of the W* lakei f i e ld has been discussed by Griadley (1965), Healy (1965), and Grange (1937); -eservoir engineering data have been conpii^a by ?r i tchet t e t a l . (197ft). I t can be noted froa Figure 1 that the subsidence bowl i« of fset from the aain production area. This sabsid-enee pattern i s possible i f the Huka Fall* Conation (assuaed to be re la t ive ly more compressible than the Wairalcei formation layer) ia thicker in that region. Or, a l ternat ive ly t the compressibility of the formation in the highly subsidised son* ia greater than in other areas* In our ideal ised model, we use the f i r s t approach with a reasonable compressibility value of the Huks Fal ls formation. I t can be noted from Figure 2 that the drop in the reservoir pressure ia l inearly proportional to subsidence during early production t iaea. However* in later periods, reservoir pressure «eems to s tab i l i z e while subsid ence continues. Such behavior could be explained i f one assumes that the deforming material passes from a s tate of preconsolidation to one of normal
coastliaatie*. Oar ecelueia-.ry sjoael, thea, ataalea the efface of barerogeasity aaJ plasticity oa t»t aabkisVaca aaaaoaaaoa.
For parpoaee of s i a a l e t i o a , v* caa i d e a l i s e the systea as ecaois t iag of weiora aaai fer , the lake Fa l l s f o t - s t i o a , and t a t cvexbaraea which exteaas to the giaasd eexfece. Thie iaeaUeea model i s shewn i a Figaro 3 . The thickness of the oeetbareaa (aoloceae Fnaica sad Vsirakei Breccia) i t asanas* to be 200 a (Tvitcaett e t a l . , 197*, Table 3 . 1 . a . 3 0 ) . The dsyth of t i n reservoir , iaclvdiag Vaka Fai ls formatioa, ia aaiiaji i t o be 400 a. Th* aaiisma thickness of the aafca Fa l l s foraation ia aasuned to be 200 si near the soae of K-aiaaa aaboiaeace (Fritchctt e t s i . , 197$, Figvrc 5 .21 , a. 52 ) .
To nodel aabeieeacc:, we bave aaad an ideal i sed graded tbickaess of the naka Fal ls formation of 40 , • 0 , 120, 160, sad 200 a (Figaro 4 ) . The maximum thiefcaeas of 200 • over the aodes 130, 145, asm 146 corrssaoads to the area of maxiaan subsidence (Figaro 1 ) . Bode 107 ia aodcled as a aroaactioa •one, indicat ive of the area of ~ r g ^ — discbarge in Figure 1 . To o f f se t the tehsideace bowl froa the aaia proeaction area, the thickness of the overbarecc ia increased to 360 • over the notes 207 to 216. The rest of the volane e leaeats represent the Waiora formation. Taper—able boondsry conditions are imposed on the s ides AB aad AC. An i n i t i a l potential of 600 a of water : • specif ied ewerywhere i a the eysteau Material prcperties used ia the aodel are as follows:
Hoka Fal ls Formation
Permeability - lO**** 2 (Mercer et a l . , 1975). Coefficient of compressibility for virgin
eorve ( a , ) - 5 x l O - V / K Coefficient of compressibility for swelling
curve ( a , , ) - 5 x M r V / B
Waiora Forma tiot.
Permeability - 8 .5 * 1 0 - 1 4 a 2
Coefficient of compressibility for v i t K i o »» well s s swelling curve (a^ • a , . )
- l O " 1 0 * 2 / " Relative density of the saturated so i l • 2.
{-Production ion*
Figure 3. An ideslized three-diaensionai subsidence model of the Wairakei geothermal system. (XBL 7911-13085)

x \ .
M? / W?
m I M
IP: I M « :** m MM
::»*; m m
/ \ ? wo«— "J**'§NP^ ' im1*] i: ;w: i n 1*2
/V' , w "-^ *t»t l * « ~m m **» n* Ml
'* nm~M T t *
40» y^J i t * 123 I M 1*4 », MS I M MS I T *
y \ i i s T i r t i * I t2 or U S MO 14* 1ST «» i n
/roTYoM 1 1 0!" 1 t
IIT I2 i I M 132 - I4T tsa I M m
2400
Z£00
2000
1*00
MOO
MOO
1200
WOO
• 0 0
coo
400
200
Figure 4. The thickness of the Huka Falls formation and the mode auabcra used in the model. (ZBL 7911-13063)
This model also aasuaas that the soil is pre— consolidated. The preconsolidation pressure over and above hydrostatic presaure is about 225 a of water. The properties used for the liquid are:
Viscosity "0.2 centipoise Density - 940 kg/* 3
Compressibility - 4.9 x 10~ 1 0a 2/"
Total mass production for the Wairakei/Tuahara system as of December 31, 1976, was 2329 x 10* lbs (Pritchett et si., 1978). This amounts to an average volumetric production rate of about 1.48 sP/sec. Since our triangular model (Figure 4) considers only 1/8 of the total area, the production rate is correspondingly reduced to about 0.185 a^/sec-It can be noted that this rste applies to both Wairakei and Tuahara fielda. To consider on?r the area of Maxima discharge (Figure 1), this aaount should be soaevhat reduced. In thi* study, ve have considered an average production rate of 0.1 or/sue. This —mint" is produced froa node 107 at the depth of 500 a.
Subsidence produced under aforementioned conditions is shown in Figure 5. A coapariaon with Pigure 1 shows thst the resulta are qualitatively
/%J«
2J> / « • U l
3.0 y f * a> eta u .
3 J X ,v V a.
*& « / \ \ v\ V > i .
*& y^n> VJ h a. u .
3. SJO
*B &* ^ f * * ^ ***i 0 .s. • i . 3.
SJO ij^rlg. <^ •aT „, i * s i .
3. SJO
UP 1 u> Ct> U=T .« u »
JC\ \*** u.| . i . i o | C, i . urn u . « • s i .
/ r fTW H-w o.| o. i n .:, e j i u s »
2400
22CO
zoco IBOO
Figure 5. Subsidence coato-xra in meter* after 21 Tears of production. (ZIL 7911-13091)

115
similar. Measured and calculated reservoir f***-sure drop vc aubsideace «t the biechmarfc 197 ami node 142 arc aboan i B Fiawrc 6 . A amalitet ively aimilar pattern ia eean for tht eracomcrlidated a o i l . Thia figure a l so above the behavior of the normally consolidated a o i l , which ia e e i t e different from that of the preconeolidated a o i l .
In summary, we developed emd teated • prel iminary model to explain aubaidence a t the Weirakai
02 0* ID 14 | « J J r * 1C » 4 3M *3
SuhiuU-ea (wt-ttrt)
Figure 6. Comparison of the measured subsidence with that calculated et node 142.
(XBL 791'-13408)
The flow of fluids in reservoirs containing large fracturef is vitally important in many get,-energy resource systems. The use of massive hydraulic fracturing (KHP) for the creation of large hydraulic fractures of up to 500 m in length is used extensively in the petroleum industry to stimulate tight gat formations whose very low per--seability (0.5 to 5 x 1 0 ~ 1 6 m 2 ) severely curtails production. The use of hydraulic fracturing ia also visualiaed in the geothermal area for the creation of circular vertical fractures used in the hot-dry-rock (HDft) concept. In HDR, the fracture is created at depth in a region exhibiting high geothermal temperatures. Water is swept over the fracture faces, «nd the heated fluid is pumped to the aurface utilisation facilities. Horizontal fracturei are used in some coal gasification processes to create coal bed channels for mixing of steam, oxygen, and sir necessary for gas production.
To evaluate the success and to predict the future performance of such systems, it is important
field amd ootaimod rmamlta which arm emmlitatively aimilar to thoee moaawxed at thai ait*, thai .effect of pracemeolidaciom etruaes e*em# to he .mmirr—r im evplaiaiae; the r hanging elope of the reeervmir wreaemra amhaidamre relatiemehip ahemm im Timmre 2*
uniiicis cns> Gramma, L. I . . 1937. The geology of the Botorma-
Tammo amMiviaiom, Botorma amd raimemawa Mvieioms. OSIB ami l e t i n 37 .
Crimdley, C. W., 1 H 5 . The geology, atmctmre, exploitatiom of the Hairmtei f i e l d ( Tammo, Bew Zaalsmd. B .2 . Ceol. amr*. Ba l l . 75 , 131.
Bealy, J . , IMS. Ce***ogy of the Beirakei geothermal f i e l d . Proceedings* l i s h t h r^aasemanalth Hiaiag wad Metallergical Comgreas, >Vs*.vrelia mod Hew Zealamd, Vew Zealamd t a c t i c * .
Mercer, J . H.. Pimdex, C.F.. aed DomaUaom, I . 0 . , 1975. A Calerkim-Fiaite eleastat ese lyaia o f the br*froth*TMl a/atam at Meiraks-i, aWv Zealrmd. Jomrmal of Geophysical Beaeareh, v . 80 , s o . 17, p . 2*08-2*21-
Pritchett , J. W. t Care, S. K., amd I t o a u l l , 0 . I . , 197*. mmmerical simulation of wroefcjerioa amd auhaidemce a t Ueirakai, Sew 2*slamd\ Stamford Geothermal Program, resort SCT-TB-20 Stamford, CaUformia, p . 310-323.
Pritchett, J. If., Bice, L.F. , amd Carg, g. K., 1978. Beearroir aegimeerini data: Umirakei geothermml field. Mow Zealamd. La Jolla, California, Syatema, Scieace amd Software, SSS-B-78-3597-1, w. 1.
Stilwell, If. B., Ball, If. E., and Tawhai, J.t 1975. Ground .wvmmente in lew Zealand exothermal fielde. Proceedings of the S-'-ood United Nations Symposium on the Devel --.saeat mud Oae of Ceotbermal Beaourcea, v. 2, p. 1427-U34.
to know the physical properties of the created fracture system. Such properties include the average width, v, and the characteristic half-length, xf, «r radios rf, of the fracture. Several methods published in the petroleum literature he»e resulted in type curves for the analysi* of pressure buildup data ip =7=**ms involving a well intercepting a single, vertical, rectangular fracture. These methods include analytical treatments assuming no pressure gradients {.infinite fracture conductivity) in the fracture (Gringartea et al., 1975); semi-analytical treatments correcting for a finite fracture conductivity (Cinco-Ley et el -, 1978); end numerical methods employing a finite difference scheme (Agsxwl et al., 1979).
Previous work has included another approach to analyzing the pressure behavior of a well intercepting a finite vertical fracture. Program TERZ&Sl vaa employed in calculating pressure buildup type curve data similar to that generated by the abeve-mentioned anthers.
USE OF PRESSURE TRANSIENT ANALYSIS IN MODEUNC THE HYDRAUUC FRACTURING PROCESS W. A. Paten and X. N. Narasimhan

114
THE TEAK'S ACTIVITIES
TEIZAGI ia a fully maacr^al proeraw developed by LBL to handle three-diaeasioaal, siaglo-phsso, isotherms! tra'aient flow. The eesuMitatieael algorithm is 6aacd on the intstrsted fiaitfc Jifferaaxtc method (Harasiahan n d Uithereeooa, l»7t) aad baddies arbitrarily oonlinaar variations ia psraas-bility id addition to ose-diaeasioaal coaeolidatioa. The proeraa was modified to handle Dercy flow ia fracture* and to handle peraeability variatiea ia the fracture in the eaae where a coastaat fraetara width* w, cannot be reasonably assumed. The fracture peraeabiLity Kf waa aadc a function of the pressure distribution in the fracture; i.e., the fracture waa allowed to "breathe.**
The work was summarized by Naraaiaftan aad Falsa (1979). The publication include* the tffecte of: weIIbore storage, skin factor aruuad the fracture (due to poor fluid cleanup), effects of tracer* storage; uneven wing length (asymmetrical fracture), choked flow (uneven proppant dispersal), and pressure dependent perueability on the type curves. Results indicated that in a sufficiently large fracture, fracture storage will dominate wellbore storage during early tiae data for a significant period and must be corrected for. The effect of choking the fracture was also found to be dramatic. A permeability reduction of 10 in the choked region increases the drawdown of the tystes. throughout the duration of the test for wells with i o r r > 7.6Z ca. The effect of reducing the choked area permeability by 100 was observed to produce 4 test result that could invalidate the conventional calculation of the physical properties of the systea.
An important conclusion of the work waa that a variety of conditions may occur in a realistic fracture situation that would aake type curve analysis extremely difficult, if not impossible. A similar study was carried out by LBL researchers for the case of a horizontal fracture (Bodvarsson and Narasimhan, 1980).
Consideration of this problem has led to the development of program HYDFR. Program HTDFB was designed to handle the problem of analyzing the pressure transient data recorded during the actual hydraulic fracturing process. It was hoped that a parameter analysis could provide insight not only into the dimensions of the fracture system but also into the in-situ rock stresses and formation strength.
CURRENT WORK
HYDFR is a program designed specifically to handle the highly nonlinear problem of a growing hydiaulic fracture. As such, it borrows heavily from its parent program, TERZAGI, and shares the comn>cr. "..j-DM formulae!in. The extra computations I efrort involved in solving the growing fracture was expedited by replying the iterative solver in the original program with a direct solve? that is many tines faster (Bodvarsson et al., 1980). The increased speed of the solution algorithm allowed the preliminary modeling to be done that otherwise would have been cost prohibitive.
The program is eased oa a aarface eaergy concept of fractur* emuaaiea. The f-tcture ayataa hefot* exteasioa ia modeled in Figure 1. luitiall) a&. «1 elaaaats exist zaaresrs.iinf; the surface punas aad taaiag, the pressurises' tahiag ia the wall! the packer cavity, aad aa iaitiel fracture surface. Oace the puaaiag ia initiate*, the program aoaitora the cavity pressure uati? the rupture pressure *b i* reached. Oae* this pressure ia rescued, flow I* alleaud into the first fracture elemat. The total available energy of the systea is defined as the FT work doae to inject fluid into the fracture less the work doae overcoaiag the earth stresses in the formatioa aad the eaergy lost ia creating the fracture aurfacc. If sufficient energy ia availaMe ia the systaa sad the pressure in the iaitial fracture claaaat exceeds the earth stress, the fracture grows outward as a alaae. The program geaaratea its own aeah, creatiag the additional fracture alaaaats and simple reserve-" r eleaents to allow for Cractwring flnid penetration <laak off). The two raoalraaants for extension are available excess eurface aaergy to extend the fracture and the sufficient pressure ia the aownatreau eleaents to open the fracture sgaiast earth stresses.
PRESSURE INDICATOR^ PUMP-. V
rSURFACE PIPING
4 l sts&wnm as
TUBING
WEf.BORE
B-
INITIAL FRACTURE ELEMENT
PACKER
Figure 1. •ash.
Initial representation of groving fracture <*Bt 806-9919)

117
Two basic geometries have been Modeled with HYDFK. A rectangular geometry is used to study vertical fracture development in layered anisotropic formations such as oil fields. A circular geometry is used tj model vertical fractures in an isotropic medium such as used in geophysics and HDft experiments (where gravity effects are neglected) or for a horizontal fracture.
The pressure profile generated by the model is depicts' in Figure 2. Shown here is the simulator's transient pressure profile vs actual field data gathered by Hark Zobak of the U.S. Geological Survey. Agreement is generally good over the first two pressure cycles. Adjusting the parameters of the model indicate that the *"«cture radius at the end of the second fracture c e was 9.5 • and that the maximum itable width was approximately 10""' m. Other parameters may be inferred from the study of these particular data, but while the range of variation of these pareneters of the earth stresses, formation strength, and surface energy requirements is small, it cannot be stated that the best fit data is unique due to the interrelationship of the parameters in the model.
PLANNED ACTIVITIES
The simulation will be used to examine the possibility of using the fluid viscosity and pumping rate to control the growth of the fracture system. This is hoped to aid in rot only optimizing the fracture penetration when desired, but also
to control the growth when working in sensitive formations.
UFEKEMCES CITED
Agarwal, K. C , Carter, K. 0., and Pollock, C. B.« 1979. Evaluation and performance prediction of low permeability ejas wells simulated by jas*ive hydraulic fracturing. Journal of Petroleum Technology, p. 362-372.
•odvarssoo, C. S., Lippmann, M. J., acd Harasimhan, T. »., 1960. lecent modifications of the numerical code CCC, in Zarth Science Division Annual tcport 1979 (this volume).
Bodvarsson, C. 5., and ffarasimuan, T. »., I960. Hydraulics of a well intercepting a single horizontal fracture* jLn Earth Sciences Divi-« » « annual leport 1979 (this volume).
Cinco-tey, H., Smaaniego, F-, and Daainguec, A., 197B. Transient pressure behavior for a well with a fracture-conductivity vertical fracture. Society of Petroleum Engineers Journal, v. 10, no. 4.
Gringarten, A. C., Ramey, B. J.» and ftaghavan, ft., 1975. Applied ptjisure analysis for fractured wells. Journal of Petroleum Technology, v. 15, p. 887-892.
Hsresimimn, T. "., and Palen, U. A., 1979. A purely numerical apprnach for analysing flow to a well -intercepting a vertical fracture. Dallas, Society of Petroleum Engineers, SPE-7983.
Narasimhan, T. K., and tfitherspoon, ?. A., 1976. An integrated finite difference method for analyzing fluid f l w in porous media. Water Resources Research, v. 12, no. 1, p. 57-66.
2000-
. i-rala-i". 'n .,. ',. **+*• *."• &'*•?!<']
1500- .;.,;=;••-.
1000-
500-
V f ^ KXJ- :
V f L 5SK8 8 TIME - SECONDS -
SURFACE PRESSURE VS TIME MONTICELLO CYCLES 2-41. 2-4-2. 2-4-3
Figure 2. Calculated vs observed pressure t r ans ien t of the Monticello da ta . (XBL 806-9931)

118
Ceothermal Environmental Research
CEOTHERMAL SUBSIDENCE RESEARCH PROGRAM I E. Nobie
INTRODUCTION
As with the development of say energy sowrce, problem* encountered may limit development, tor geothermal energy, one such problem may be lead deformation asaociated vith the removal or injection of geofluids in the reeervoir.
The objective of geothermal subsidence research is to control or mitigate, -within predictable limits, potential subsidence associated with geothermal development. This objective will be accomplished by understanding the compaction subsidence phenomena associated vith geotbermel energy development. The Geothermel Subsidence Bese&reh Program (GSRP) is designed to o*ve).op a comprehensive understsnding of the compaction-subsidence phenomena and provide:
1. The means for developers to build and operate geothermsl fscilitiet within prescribed limits of land subsidence and deformation.
2. The basis for policy-makers to regulate geo-thermsl facilities with respect to potential subsidence.
A workshop was held in October 1978 for the purpose of making a mid-course correction to the original subsidence research plan. The goals of the workshop were to:
• Review the results of the completed C S U research
e Advise on changes needed to the program's research plan
• Assess the adequacy of the plan, and e Make recommendations on revisions to the
original plan.
As a consequence of the workshop, the nine research categories of the original plan were grouped into three generel research areas. In turn, these major areas were divided into specific research topics;
1. Subsidence Research Monitoring and Measurement
• Direct surface subsidence monitoring e Indirect technique, both surface and sub-
surf see, to monitor and measure reservoir compaction
• We11bore measurements to directly monitor and measure reservoir compaction
2. Reservoir Compaction and Subsidence Prediction
• Understsnding the physicsl processes that cause compaction and subsidence
• Laboratory studies of the compaction and subsidence phenomena
• Assessment and development of compaction-subsidence models
Compaction and subsidence impact aseessmnmt
• Come action and ambaimemce C A M studies • AsMssmant of the economic costs and
swwii.0— tats 1 effect* of compaction sad subsidence.
» FISCAL TEaJt 1979
At the start of fiscal year 1979, several general contract objectives ware stated for the Ceotbermal Smbsi£=^e Research Program
1. Sopplemantal Case littery—Chocolate Bayou Objective! fapend the Chocolate Sayom c«ae study in order to make the stony- more comprehensive, an expended study could also be useful as a model to researchers at the truor. Gcoprcssure field located south of the Chocolate Bay?«* field.
2. Hostile Environment Tool Development Objective: The four suggestions made by Woodward-Clyde Consultents for improved well-bore exteosomcters will be component tested.
3. Assessment of Radioactive Bullets Objective: Additional review of radioactive bullet logging will be made to assess the applicability of this technique to monitoring subsurface compaction.
4. Assessment of Indirect Techniques Objective; Indirect measurement methods, i.e. gravity, resistivity and sdcroseiemicity, have promise as inexpensive, areal survey techniques. lesearch will be conducted to evaluate the ability of these methods to detect changes in the physical properties of a geothermal reservoir and to relate these changes to reservoir compaction and subsidence.
5. Assessment of Physical Subsidence Theories Objective; A step toward greater predictive capability is assessing existing subsidence theory end its applicability to geothermal reservoirs. Host subsidence theories were developed to describe the compaction of oil and gas reservoirs or of relatively shallow unconsolidated aquifers. The applicability of these theories to deep, thermodyn^mically complex geothermal systems will be examined.
G. Creep Phenomena and Inelasticity Objective: Related to the assessment of existing subsidence theory is an assessment of rock creep and inelasticity at high temperature and high preasure. The effects of these phenomena are little understood and limit accuracy in predicting subsidence. Research will be Ct-m-ducted to study their contribution to compaction and subsidence.

During fiscal year 1979, coatracta ware isamed to accomplish each of tbasc objectives. Some of these contracts will be continued in fiscal year 1980. The following is a review of the fiscal year 1979 accomplishments of the contracts issued:
1. Supplemental Case History—Chocolate Bayou
Principal Investigator: Barbara Turner (ESA Associates)
U K
Obi eicive. Expand the Chocolate Bayou Case Study to make it sore comprehensive. An expanded study will be useful us a model to researchers at the Brazoria Geopressure Field located south of the Chocolate Bayou Field.
Progress. The ESA data assessment availability and evaluation study is completed. The general, conclusions and recOBBendations are:
1. Sufficient data appear to be available for modeling the Chocolate Bayou field, although some data on material properties may have to be extrapolated from well testing and core analysis of the Pleasant Bayou wells.
2. The 1978 to 1979 releveling data afaow that subsidence of Chocolate Bayou is continuing but at a lower rate than previously. Maximum subsidence between 1943 and 1979 was 2 ft (0.61 m ) .
3. The telationahips among observed subsidence, gro':rdwater production, and hydrocarbon extraction were investigated in more detail for this report. The results of this analysis indicate that hydrocarbon production has contributed to the observed subsidence. In particular, a comparison of the 1959 to 1973 elevation changes at shallow benchmarks with changes at deep benchmarks set on abandoned oil and gas well casings shows a very close correspondence between the amounts and rates of subsidence. It is expected that collection and analysis of more site-specific fluid extraction data would make it possible to determine how much subsidence has been due to groundwater production and how much from producion of deep fluids.
2. Subsidence Instrumentation Development
Principal Investigator: A. Veneruso (Sandia Laboratories)
Objective. Provide LBL technical guidance and support in the development of hostile environment instrumentation for subsurface subsidence research.
Progress. With the successful testing of seven switches (all to 300°C), the reed switch testing was completed. The switches were all built by the Hamlin Company of Lake Mills, Wisconsin, and are all commercially available from component suppliers. The switches tested were:
HBH-2K-115 MMRR-2-1B5
DU-129-425
Description
Dry Reed (SPOT) Mercmry Vetted (all positiom) Himietmr* Dry Reed Mimietv'e Dry Reed Hieromxaiatvxe Dry Reed ttimiatmre Dry Reed Riga Cucremt (3.0 an**)
Recamae there are •amy different current, voltage, else and performance variations, selection of • particular switch is dependent on the specific application.
The development of high-temperature magnetic materials, refractory thin-film resistors, capaci-tatore, conductor interconnections, and the high-teamerature line driver hwa been accelerated. Some of the line driver circuite have been fabricated in tandem, rather than in sequence.
3. Asaeaament of Radioactive Formation Markers to Monitor Reservoir Connection
Principal Investigator: Dr. M. Dorfman (D. of Texas)
Objective. To assess the usefulness of radioactive bullet logging in measuring end monitoring differential compaction on a geothermal reservoir.
Progress. A comprehensive literature review has been carried out, followed by personal discussions with engineers of Atlantic—Richfield, Sehlum-bergcr. Dresser Atlas, and We lex. The first three companies have been involved in significant compaction measurement studies using radioactive bullets at Prudboe Bay, Alaska; Gronigen, Holland; and Long Beach, California, respectively. The last three companies are major well-logging businesses. Using the be^t tools and procedures, ''. * distance between radioactive bullets spaced about 40 ft apart can be determined with a standard deviation of 0.01 ft.
The temperature lim<t ie about 500°F for all components except the bullets, for which the limitation is approximately 350°F. Radioactive jet markers are available which have a limit of 500°F. The pressure limit is approximately 20,000 psi.
The uniaxial compaction coefficients measured on Frio cores from the Pleasant Bayou #2 v:ll (Brazoria County, Texas) range from about S x 10" 7
to 10""° psi, taking into account both short-term and long-term (creep) effects. For this well, the above precision of bullet location should permit meaningful compaction measurements when flowing pressure drawdown from the initial reservoir pressure is more than about 360 psi to 180 psi, respectively.
There is some evidence that laboratory measurements of compaction coefficients on core* are not always reliable in predicting compaction in the field. For example, at Groningen, Holland, predicted compaction based on laboratory data was three times greatsr than observed compaction ue'ng radioactive bullets. In other words, the above estimate of required pressure drawdown for meaning—

120
inl compaction measurements with radioactive bullets should be used with caution*
Also, the above estimate does not take into account any possible "strengthening** of the system near the wellbore due to the steel casing and cement. The radioactive bullet will probably aot penetrate more than 6 in. to 1 ft from the wellbore. This Is the region with the greatest pressure drawdown when the well is flowing and hence has the greatest potential for compaction. For wells with several thousand pounds drawdown, and with good bonds between casing and cement and between cement and formation, the compaction in the region occupied by the bullets would almost certainly not be as great as tnat measured in the absence of the relatively strong casing and cement. It is possible that this effect contributed to the discrepancy between observed and predicted compaction at Groningen.
For reservoirs in basement or metamorphic rocks, with relatively low porosity such as found at The Geysers, California, the observed compaction coefficients are _«tpected to be considerably smaller than calculated, and the required pressure drawdowns correspondingly larger for meaningful compaction measurements. Since these wells are usually completed without running casing through the producing interval, the "strengthening" effect discussed above would not occur here. Also, in hard rocks, use of radioactive jets as markers might be preferable to radioactive bullets, since bullet penetration might be ex trendy variable.
4. Indirect Methods: Seismic Assessment
Principal Investigator: Dr. T. V. HeEvilly (U.C. Berkeley)
Objective. To map lateral and vertical variations in velocity and attenuation (both P and S waves) throughout the production eone. Also studied are the source dynamics of the microearthquakes so that we might infer stress orientation, stress drops, and source dimensions relative to production activities (withdrawal, reinjection) and the reservoir boundaries. If subsidence occurs on a significant scale these data may be able to delineate regions of discrete movement or stress release.
Progress. During fiscal year 1979 the major effort was directed toward fabrication of the Automatic Seismic Processor (ASP) and an in-field vehicle to house the ASP.
Gravity Assessment
Principal Investigator: Dr. R. B. Grannell (Long Beach State University)
Objec Lve, To assess the applicability of surface g.avity measurements to monitoring the response of a geothermal reservoir to exploitation. If gravity surveys can be shown to be applicable, it could provide a cost-effective indirect method to indicate net mass changes in the subsurface due to extraction and/or injection of geotheraal fluids. Some causes of net nass changes could be alteration of the subsurface chemical/thennodynapir environment, changes in the volume of subsurface forma
tion*, or carnages in foraatioa void ratios. Bow thee* changes arc aubeiasace-related it: of paramount iatarast to the Ceothermal Suk-siaaftce teecarch Program.
Im fiscal year 1979 the following tasks war* accomfliehed:
TeskJLi Am assessment was made of the application*; of surface gravity neaaar assets to monitoring the various subsidence-related act-mass formation changes that coald at ceased fry exploitation of a geothcraal reservoir, lack application required a well-documented theoretical basis, a technical feasibility atataaaat radicating the accuracy by which the changes cowld be repeatahly aeasurad, and a review of the instruments and techniques currently available for such studies.
Teak 2s e> comprehensive plan was recommended for implementation of a gravity study to investigate and monitor subsidence-related formation changes. Of particular intereat were methods of repeatable date acquisition and analysis, and the use of corroborating surface geophysical technique* such as seismic velocity studies.
Task 3; A auitabi* site was identified where the recommended plan could be implemented, including sufficient corroborating geological, geophysical, sod geothermal resource data to support the aeleeted sites. Discussions with the field operators have begun to gain permission to conduct a field gravity survey in fiscal year .'.980.
5. assessment of Physical Theory
Principal Investigators: Dr. A. Carroll (U.C. Berkeley) and Dr. John Kudnicki (0. of Illinois)
Objective. To assess the adequacy of constitutive theory to define deforsution.
Progress. Dr. Carroll (OCB^: A report has been submitted on the study of analytical and numerical solutions for elastic deformation of weakened half-space under gravity. In the report, constitutive relations are developed for mechanical response of dry or fluid-saturated porous material beyond the linear range. The main emphasis is on hydrostatic loading and unloading response, sithough deviatoric effects are alao treated. The technique focuses on the manner in which localized shear stresses in the solid material are treated. A theoretica. derivation *£ an initial yield surface for porous material 's also described.
Dr. Rudnicki (University of Illinois): As part of the work on time-dependent behavior of brittle rock, Dr. Rudnicki has reviewed experimental work on the growth of cracks in brittle rock. This experimental work provides an indication of the kinetic relations that link the rate of axeroseale deformation mechanisms to applied stress. Rudnicki has '*,arted to evaluate the role of coupling between deformation and pore-fluid ai.tfur.ion in elastic fluid-infiltrated porous bodies. Thia coupling is often neglected in modeling studies, but has proven to be of importance in a variety of geophysical and geotechnical problems. Thft problem chosen for study is the simplest proclea for a finite

121
body exhibiting full coupling, that of a hollow sphere subjected to radial stress and pore fluid pr sure at its boundary.
6. Physical Properties of Kecks Associated with Subsidence
Principal Investigators: A. Abou-Sayed, John Schatz, and Ken Wolgcauth (Terra Tat, Inc.)
Objective. To study high temperature and pressure compressibility of cores from geotheraal reservoirs at East Mesa, California, and Cerro Prieto, Mexico.
Progress. All basic mechanical testing has been completed on both Cerro Prieto and Bast Mesa cores. Essentially completed are the elastic or short-term compaction studies of East Kesa cores, and these same studies are nearly completed on cores from Cerro Prieto. In addition to the elastic tests, Cerro Prieto core permeablitiea have been measured and presented in a paper at the Second Symposium on the Cerro Prieto Geotbermal Field, held in Mexicali, Mexico.
Long-term compaction (creep) studies of the Cerro Prieto cores have continued. Future work, after completion of all short-term tests, will emphasize a relatively small number of high-quality creep tests on both East Kesa and Cerro Prieto cores. Both fine-grain and coarse-grain material are being studied to evaluate the effect of grain size or rock comp^tion.
Of notable interest were the apparent chemical changes occu-ring in the cores during compaction tests, especially long-term tests. Long-term testing had a strong tendency to increase the ailiea content of the fluid. The final silica content of the fluid from several of these teats exceeded the total solubility of silica at teat conditions. It is hypothesised that pressure point dissolution of silica causes the formation fluid to be supersaturated.
BaBic conclusions at this time are as follows:
1. For short-term tests, the reservoir is stiffer for pore pressure reduction than it is for confining pressure increase.
2. Short-term compaction moduli are consistent with the behavior of sandstone at this porosity.
3. Creep compaction occurs and is a significant effect, leading to long-term compaction moduli that are several times smaller than short-term.
4. Rebound moduli are significantly larger than compaction moduli indicating the irreversibility of the behavior.
5. Silica concentration in fluids goes up with time during testing, hinting that pressure solution may be associated with the compaction.
6. Permeability decreases both with temperature increase and time. The precise magnitude of reductions or its importance is uncertain.
la addition to the above contracta, several contracts issued ia the laat quarter of fiscal year 1971 ware sasataatially coeclwdtd ia fiscal year 1979. The following; ia a review of the accomplishment* of those contracts:
1. Modeling of the- Physical Frocaaaaa of Subsidence
Principal Investigator; lam Miller (Colder Associates, Inc.)
Objective. To assess the individual attributes of particular mathematical models in their ova right and to detemiae, through studies of both real aad hypothetical subsidence case histories, the significance of different mathematical model attributes. The result of this research will be synthesized to give detailed assessments of the available models, recommendation* for the capabilities of desirable new models, and a general perspective on the limits of mathematical models.
Progress. Proficiency assessment has been completed on the following models:
a Hand calculation of one-dimensional compaction
• One-dimensional calculation stress-seepage model
a Nucleus of strain a Boundary integral equation method a Displacement discontinuity method • finite element model • CCC
Conclusions of their assessment are as follows:
Overall Approach; It appears that the development of highly sophisticated, coupled models for reservoir flow and deformation is not desirable at this time. Hot only is the use of overly sophisticated models not justified by available data, but, as was shown in the Austin Bayou case study, coupling of flow deformations increases cost more than it does accuracy. Conceptual models should be developed to m» great a level of sophistication as is permitted by available data. Mathematical models should be selected that are appropriate to the sophistication of the conceptual model. In some cases, where production can be assumed known, reservoir flow modeling may not be necessary. This was the case at Austin Bayou.
Reservoir Flow Models: Further theoretical development of reservoir flow models appears to be appropriate. At prevent, lack of adequate reservoir flow theory reiTeaen*^ a significant limitation to predicting t »e subsidence of geotbermal reservoirs. Current theories have not, in general, been adequately tested. In addition, further theoretical work might be appropriate in the fields of multiphase and fracture/porous media flow. We anticipate * rapid evolution in the state-of-the-art of heat/fluid flow over the next few years. Mathematical models should be developed not only using state-of-the-art theoretical developments, but also using simplifying assumptions such that the model could be implemented by the lay engineer. Possible simplifying assumptions include lower dimensionality, restricted physical processes, and

limitation of calculation to atatic equilibrium conditions.
obtain results which are qua! itativcly similar to thoae aeaamre* at tk« ait*.
Deformation Modal a: Currant theory appears to be adequate for all practical deformation aodcliag problems. Although assumptions of homogeneity, isotropy, and linear claaticity arc frequently gross, they often appear to be adequate considering the level of inaccuracy introduced by lack of data-There is no single model that ia superior to all others. Golder tested aia different models and found that each one vai valuable in eoae situation and that none of the* V J S good in all situations* The range of mathematical aodels now available ia sufficient for aost reservoir deforaatioa pxoblaaa. What ii« needed is not newer, sort sopmieticatad mathematical Models, but siore useable versions of current models. Some criteria for aodel* atat
a Available in the public doaain e Hell-documented with regard to both theory
and usage • Simplified input and automatic element
generation • Clear, comprehensive output, and where
appropriate, platting capabilities a Improved efficiency • Increased flexibility by development of
nodeIs that incorporate a variety of cur* rent techniques in a single aodel.
Availability in the public doaain might be facilitated by development of a public library of well-documented mathematical models.
In addition to the contracts* Lawrence Berkeley Laboratory conducted its own investigation into subsidence phenomena during fiscal year 1979. A study was made of the Wairekei subsidence problea using the LBL computer subsidence simulator TEK2AGI. The objective of this study was to develop a subsidence model of • geothermal field qualitatively similar to the Waitakei field.
Results of the study pertain solely to reservoir deformation according to the one-dimensional consolidation theory. It was assumed that the vertical displacements obtained at the interface of the reservoir and overburden are completely transmitted to the ground surface. This purpose of the present study was to make a preliminary study of the ground subaidence observed over the geotfaer-msl field at Wairakei, Mew Zealand, and to find whether the field observations can. be reasonably explained in terms of the well-known geotechnical principles of consolidation* Aa the study is preliminary in nature, the jeothermal system has been treated as an isothermal, liquid system.
Subsidence predicted by the TERZAGI code qualitatively matches the observed Wairakei subsidence feature. The study successfully demonstrated the development and testing of a preliminary model to explain subaidence in the Wairakei field and to
FLAW rt» FISCAL YIA* I960
The following projects have been plaamed for fiscal year 1900.
1. The L1L computer code TUZACI will he modified to aodel lateral reservoir deformation and be further validated. COG, « moaiaotheraal compaction Mw£al, will be modified to compute coupled reatrvoir—overburden deformation.
2. The creep atudy of geotheraal reservoir cores will continue and be expanded to investigate the role of pressure solution and adcrocrack progegation as a aftcbaaima for creep compaction.
3. Saadia and LSI will aakc aa aeseeeaent of service coapamy borehole toole that show promise for being upgraded to use under geotheraal conditions. They will be field tested, and recommendations for enhancement will be made.
4. The Geysers and Cerro Prieto geothermal fields will be evaluated using the Automatic Seismic Processor aystca. Data from these monitoring surveys will be used to analyse and model coapaction-related reservoir stress changes.
5. A high-precision surface gravity study will be conducted at the Cerro Prieto end Bcber geotharmal field*. The objective will be to establish a base line for detection of net-mas• changes related to withdrawal or injection of geofluids.
KEFEIENCES CITED
Zarth Sciences Division, Lawrence lerkeley Laboratory, 1979. Mews from subsidence. Berkeley, Lawrence Berkeley Laboratory, POT-286.
Grimaud, P., Turner, B. L., end Freaer, P. A* (Systems Control, Inc.), 197*. Areas of ground subsidence due to geofluid withdrawal. lerkeley, Lawrence Berkeley Laboratory, LBL-S618, GSBMP-4.
O'&ourke, J. K., and Ranson, B. B. (Woodward-Clyde Consultants), 1979. Instruments for subsurface monitoring of geothermel subsidence. Berkeley, Lawrence Berkeley Laboratory, LSL-8669, GSIHP-2.
Finder, G. P., 1979. State-of-the-art review of geothermal reservoi* modeling. Berkeley, Lawrence Berkeley Laboratory, LBL-9093, CSWff-5.
Van Til, C. J. (Woodward-Clyde Consultants), 1979. Guideline manual for surface monitoring of geothermal areas. Berkeley, Lawrence Berkeley Laboratory, LBL-8617, GSKKP-3.
Vaughan, C. K,, and Harding, K. C , 1979. Environmental economic effects of subsidence. Berkeley, Lawrence Berkeley Laboratory, LBL-8615, GSRMP-i.

123
INDUCED SEISMICITY STUDIES AT THE CERKO fWTO, MEXICO, AND EAST MESA, CALIFORNIA, GEOTHBtMAL FIELDS E. L. Majer and T. V. McEvilly
IHTRODDCTIOH
The utility of microearthquake stadias in geothermal rejionu ia not restricted to exploration applications* Information frost these studies may be important in delineating reservoir boumdaries and in monitoring envirnmmsntal effects such as subsidence and induced seismicity in producing geotaer-•al field** By utilising the variation in propagation characteristics of P and S waves as veil as the source characteristics of aicro*ertaquak«sf information relating to the stress field, temperature, and fluid state can, in principle, be obtained. Continuous monitoring of these properties in producing get? thermal fields may provide a means to detect dynamic reservoir boundaries, areas of recharge, and changing fluid state.
As a reservoir is produced there will undoubtedly be relatively large stress and/or thermal gradients produced by the withdrawal and reinjection of fluids. Stress gradients may affect the nature of seismicity, especially in a region as tectoai-cally active as the Salton Trough. Although the Cerro Prieto field and other geothermal regions in the Imperial Valley (such as Esst Mesa, Bravley, and Herber) ere fluid dominated, continued production may induce areas of steam dominstion. Recent laboratory wave-propagation studies (Kur and Winkler, 1979) indicate chat relative P and S wave attenuation studies may be particularly useful for delineating regions of partial saturation. Therefore, it is hoped that continuous microearthauake monitoring with occasional detailed wave propagation studies will be able to detect subtle changes in the static and dynamic properties of the reservoir.
CERRO PRIETO
In Februrary 1978 a velocity, attenuation, and preliminary microeartbquake study was carried out at Cerro Prieto (Majer et al., 1979). Based on the results of that study, a permanent five-station array was designed to monitor continuously the temporal and spacial variation in seismicity throughout the production zone. The five closely spaced stations were located to supplement the data from the CICESE stations surrounding the production region, as shown in Figure 1. Also shown in Figure 1 are the regions of high seismicity detected during t >. 1978 study.. As can be seen, none of the seissa^nlly active regions (shaded) lie within the production zone. Only several events with magnitude greater than 1 were detected in the reservoir region, these all occurring on one day. The permanent stations were located such that minimum ambiguity would occur in fault plane solutions for events within the reservoir. The 1978 Btudy indicated that the events within the field were on nofthwesL-southeast trending faullts with right lateral strike-slip motion. However, if the Cexro rrieto tiftln is in a Tegion of transverse faulting, (i.e. a spreading center) normal faulting would be expected.
> • - . .
X T*" '' •
•x
> • - . .
_ \ :
Figure I. Station locations of permanent array relative to 19 78 Cerro Frieto study. Seismic activity is indicated by the shaded regions. ( M L 789-10723)
Data are collected at each station with a three-component 4.5-Hr geophone package in a 100-m borehole. The holes were drilled and cased by the Comision Federsl de Electricidsd de Mexico. At the top cf esch hole an instrument box houses a Sprengnether DS-100 event recorder and five 2.5-V McGraw-Edison air-cell batteries (Figure 2 ) . Air-cell batteries were chosen for long life becauae of their high amp-hour rating (1200 A-hr), although their peak output is only between 1/2 and 1 A. The batteries should last one year with the Dft-100. The DR-100 is s triggered digital cassette recorder. The recorders are set at 200 samples/sec with triggering levels (short-term and long-term average) appropriate for microearthquake detection (Figure 3). Although the signal-to-noise ratio is improved by 20 dB by placing the geophonea at depth, other problems were encountered. In addition to the disadvantage of the permanence of the borehole sites, the near 100°C temperature of the water produced 0-ring deterioration in the sondes, thus causing the geophone packages to leak. Standard O-rings hid to be replaced with Viton or silicon rings. It was also necessary that the standard rubber cable be replaced with a PVC-shielded cable. For continuous monitoring above 100°C, Teflon-coated wire is recommended.
Each station is connected by a single-twisted pair of wires, forming a loop around the array (Figure 4 ) . Also in the loop is a central site housing a visual monitor and time~code clock. The triggering of the recorders is controlled by the recorder at a selected site. Except for this site
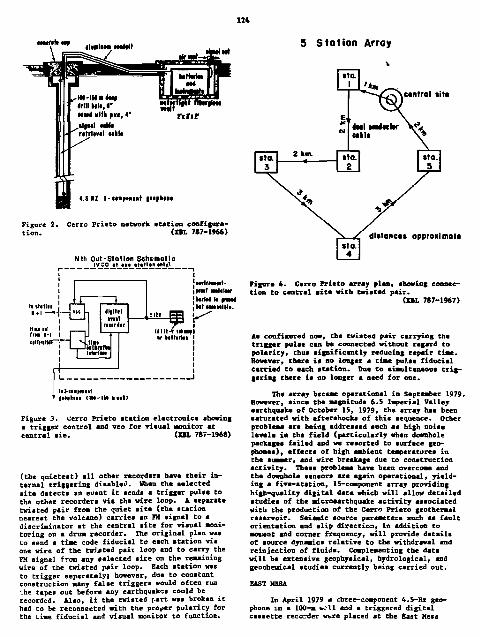
124
•MtfltlMp 5 Station Array
central sitt
4.5 HI 3-eiapMist | i i i l i »
Figure 2. Cerro Frieto network stat ion configurat ion . (ML 7S7-1966)
Nth Out-Stotlon Schematic IVCO al • * • •l«ll«n Mtlyl.
Il ttltlll l + l —•*- mini
mat miri tr "fM
[HVlfMSMt-
| k , - W h frmJ •*..—M ) M l_
1
tij-etapmil MM km (1H-IH ••IN)
Figure 3* Uerro Frieto station electronics showing a trigger control and vco for visual Monitor at central sie. (ZBL 767-1968)
(the quietest) all other recorders have their internal triggering disabled. When the selected site detects an event it sends a trigger pulse to the other recorders via the wire loop. A separate twisted pair from the quiet site (the station nearest the volcano) carries an FH signal to a discriminator at the central site for visual Monitoring on a drum recorder. The original plan was to send a time code fiducial to each atation via one wire of the twisted pair loop and to carry the FH signal from any selected site on the remaining wire of the twisted pair loop. Each station was to trigger separately; however, due to constant construction many false triggers would often run ~he tapes out before any earthquakes could be recorded. Also, if the twisted part was broken it had to be reconnected with the proper polarity for the time fiducial and visual monitor to function.
distances opproxlmota
Figure 4. Cerro Prieto array plant showing connection to central site with twisted pair.
(XBL 767-1967)
Aa configured now, the twisted pair carrying the trigger pulse can be connected without regard to polarity, thus significantly reducing repair time. Bovever, there is no longer a time pu7.se fiducial carried to each atation. Due to eimultentous triggering there is no longer a need for one.
The array became operational in September 1979. However, since the magnitude 6.5 Imperial Valley earthquake of October IS, 1979, the array has been saturated with aftershocks of this sequence. Other problems are being addressed such as high noise levels in the field (particularly when downhole packages failed and we resorted to surface geo-phones), effacta of high ambient temperatures in the summer, and wire breakage due to construction activity. These problems have been overcame and the downhole sensors are again operational, yielding a five-station, 15-component array providing high-quality digital data which will allow detailed studies of the microearthquake activity associated with the production of the Cerro Prieto geothermal reservoir. Seismic source parameters such as fault orientation and slip direction, in addition to movent and corner frequency, will provide details of source dynamics relative to the withdrawal and reinjection of fluids. Complementing the data will be extensive geophysical, hydrological, and geocheaical studies currently being carried out.
EAST MESA
In April 1979 a chree-component 4.5-Hz geo-phone in a 100-m »cll and a triggered digital cassette recorder wtre placed at the East Hess
125
geothermal test facility in the Imperial Valley, California. The hole is centered among tec geothenul leases of Kepublic Geothermal, Mamma Power, and the East Mesa test facilities. The purpose of the project is to collect background aeiamicity data (HL > 1.0) before and during commercial production. Magna Power intanded to place 13 MW of power on line in the summer of 1979, with Republic adding V HW soon after. However, as of February 1980, routine power generation had not begun.
Before this study, there had been several other seismicity studies at the East Mesa geotber-aal area. One study (Coabs and Hadly, 1977), claims a seisaicity rate in the region of 1 to 2 events a day, 1.5 < H < 2.98. (December 1974 to December 1975). However, subsequent monitoring by the U.S. Bureau of Reclamation (1976 to 197JO detected no locatable events in the seme area, M L >1.5 (Howard et el., 1978).
As of February 1980, the present instrument had not detected any evetits with S-P times of less than 2.S sec, i.e., within 15 to 20 km. However, since October 1979, the cassette recorder has been saturated with the aftershocks of the October 15 Imperial Valley earthquake (epicenter 20 km to the west). Within several months the number of aftershocks will have fallen off sufficiently co ~.ave continuous monitoring with a bi-monthly rate of tape change. It is interesting to note that the earthquake sequence associated with the main shock on October 15 had no detectable effect on seismicity
INTRODUCTION
The work reported here was conducted in support of the ongoing studies of brine reinjection at Cerro Prieto being conducted by the personnel of the Comision Federal de Electricidad (CFE) and the Instituto Inveatigaciones Ele'ctricas (IIE). It was part of the research project at the Lawrence Berkeley Laboratory (LBL) which is part of the CFE/ DOE Cooperative Program at Cerro Prieto.
The geothermal brine at the Cerro Prieto field in Baja California, Mexico, is among the hottest in the world, and contains a large amount of dissolved silica. When the brine is flashed down to atmospheric pressure, the dissolved silica rapidly polymerizes, and begins to precipitate out. In the past, this has not caused serious problems because the separated brine was .iisposed of by dumping it into a large evaporation j.ond. However., the capacity of the field has now been doubled, and brine reinjection is now considered esseatial to maintain productivity. Reinjection of untreated brine is not possible because the colloidal silica in it would rapidly plug the reinjection well. We were given the assignment of researching the chemistry of silica in the flashed brine at Cerrc> Prieto, and proposing a practical brine treatment process for field testing.
or well performance in the production tone at East Mesa end Cerro Prieto.
UFIUKES CITE)
Combs, J., emd Badley, D., 1977. Hicroeartbauska investigations of the Seat Htea geothermal anomaly, Imperial Valley, California. Geophysics, v. 42, p. 17.
Howard, J. I., Asps, J. A., Benson, S. H., Goldstein, R. E., Graf, A. B., Eaney, J. P., Jackson, D. D., Jupraaert, C , Hajer, E. L., He Edwards, D. G., Kc Evilly, T. V., Marasimhan, T. M., Schechter, B., Sehroeder, C £., Taylor, K. U., van de Earns, P. C.„ and Uolery, T. J., 1979. Geothermal resource and reservoir investigations off U. S. Bureau of Beelamation leaseholds at East Mesa, Imperial Valley, California. Berkeley, Lawrence Berkeley Laboratory, L B W 0 9 * .
Majer, E. L., He Evilly, T. W., albores, A. L., Diaz, S. C , 1974. Seieaologieal studies at Cerro Prieto, ±u Proceedings, First gymposiun on the Cerro Prieto Geotheraal Field, Baja California, Mexico, September 1978. Berkeley, Lawrence Berkeley Laboratory, LBL-7093, p. 239-249.
Nur, A., and Winkler, K., 1979. The relative effects of pore fluids on seismic attenuation and velocities. Presented at the 29th Meeting Society of Exploration Geophysicists, Mew Orleans, La.
EXPERIMENTAL METHODS
We worked in the laboratory with synthetic brines formulated to closely resemble the freshly flashed brine at Cerro Prieto. Two such synthetic brine formulations were used. They differed from real Cerro Prieto brines only in that they contained a buffering compound to control the pH during the experiment, and did not contain any bicarbonate. (We did not seek to experimentally study the precipitation of calcium carbonate.)
The experiments were run at near 100°C. Two solutions, one acid and one alkaline, were prepared and preheated. They were then mixed to actually constitute the synthetic brine and initiate the silica polymerization reaction. During the experiments, both dissolved and total silica (i.e., including the colloidal silica} were periodically determined. The dissolved silica concentration was directly determined by the molybdate yellow method. To determine tot-al silica, the sample was first reacted with sodium hydroxide solution to diesolve the colloidal silica, and then analyzed by the molybdate yellow method. The difference between the two values is the amount of colloidal silica present in the brine. The experimental methods and results of this work are discussed in detail by Veres and Tsao (1980) and Weres and Iglesias (1980).
REMOVAL OF SILICA FROM CERRO PRIETO BRINES O. Weres and L. Tsao

12*
RESULTS
The pH of the freshly Hashed briae at Cerro Prieto is typically about 7.35. At this >• amd 100°C, the dissolved ailica in the brine polymarisae rapidly, but the colloidal silica tlwa formed dots not aettle out well, mowever, it may be caused to settle oct ("flocculate**) batter by increasing the pH. This ia illustrated im Figure 1. This figure presents the results of two experiments, la O M of them the brine pi was not changed after the experiswat was started, while ia the other* tb* p* was increased by adding base after dissolved silica concentration had dropped to a steady value. Ia-creasing the pB quickly caused aost of the colloidal silica to flocculate and settle out.
In our laboratory work sodiusi hydroxide was used as a setter of convenience. In practice, lime (CaO) would be uaed because it is such cheaper. Theoretical calculations of the buffering capacity of the brine indicate that only about 30 g of lime would be needed per metric ton of brine to effect the treatment (aee Wares et al., 1980, and Igleaias and Weres, this volume). The coat of thia little lime would be negligible, even if the total brine flow at Cerro Prieto were treated. Because the needed pH increase is so small (about one-half unit) undesirable side effects, such as the precipitation of calcium carbonate should not arise. (Sea Weres et al., 1980, and Iglesias and Wares, this volume.)
We also tested a v-xiety of commercially available organic floct .ating agents. Of these, only compounds of the quaternary ammint type were found to be effective, and even these were effective with only one of the synthetic brine formulations but not with the other. Adding baae to increase the pH, on the other hand, was invariably effective with either synthetic brine.
95 #C,c i=tgf 1
* • Total SKV u-MoMxtate
a5gL~'CQ + 2
sho pH —7.8 | MingL"1
throughout I ( Find suspended SiC^
figure 1. brines.
10 20 30 40 SO GO 70 Time (mini
Results of two experiments on Cerro Prieto ( M L 799-2976)
These results mere confirmed in the field at Cerro Prieto uaing freshly flashed brine from the two walla H-14 and K-30. la both cases, increasing the *• caused the ailica to flocculate out. The quaternary amines were effective with brine from M-14, but not with that from M-30. All in all, increasing brine pi appears to be the cheap and reliable treatment of choice.
These rasulta led us to recommend the following brine treatment to our Mexican colleagues: age the fresh brine for a few minutes to allow the dissolved silica b « polymerixe, add lime slurry, stir the brine rapidly for a few minutes, and then separate the flocculated silica frcm the brine in a clarifier. A schematic of a pilot plant to teat this process as well aa closely related similar processes is shown in Figure 2.
,1 ,1 h*£J~
Figure 2. Schematic pilot plant to tost the recosmtended brine treatment process. (XBL 799-2849)

127
Thii pilot plant has actually beam built and operated by the H E chemists at Carro Prieto, and the result* confirm those of our laboratory work (R. Burtado J., report in preparation).
REFERENCES CITED
Veres. 0., and Tsao, L. v 1980. The chemistry of silica in Cerro Frizto brine, in Proceedings,
Second. Sysmosiva. oa the Cerro Prieto Ceotberaal Field, laja California, Mexico. October 1979* Hexicali, Comiaiom Federal da Blectricided (i» press).
Veres, 0-> Tsao, L., and Iglesias, I., 1910. The chemistry of silica in Cerro Prieto brine. Berkeley, Lawrence Berkeley Laboratory, LBL-101M.
THEORETICAL STUDIES OF CERRO PRIETO MINES CHEMICAL EQUtUtRIA E. R. Iglesias and O. Weres
INTRODUCTION
Surface equipment scaling and formation damage due to Mineral deposition are risks normally associated with the reinjection of geothermel brinea (Howard et al., 1978; Cuellar, 1976). Prereinjcc-tion treatment of the brines can provide a solution to these probleas (Quonf et al. t 1978; Veres et al., 1980), which are essentially eite-specif*c dae to the wide variation in chemical composition found in geothensal reservoirs (Ellis and Mahon. 1977; tfahl, 1977). Because of our involvement in the Mexican-American Cooperative Project we are interested in prcreinjection treatment of Cerro Prieto brines. A scheme for silica removal from e*oar**:ed brines, based on an increase of the natural pH, has been developed by Weres and Tsao (1979). In a related effort, which is the aubject of this report, we studied the potential for scaling induced by the silica removal treatment and found it significant. We then proposed and diacussed a way to avoid this potential problem which we found both technically and economically feasible.
The chemical equilibrium model used in these studies it described in the next section. The important mineral saturation ratios and the proposed treatment are discussed in the iast section.
THE CHEMICAL MODEL
The adopted model is described in detail elsewhere (Iglesias and Weres, 1980). This model has been implemented in a compact, fast FORTRAN package called HITEQ. The data base covers the range 0 to 300°C. Input parameters are confining pressure, total enthalpy, composition and (optional) pH. The output provides temperature, enthalpies of water, steam and noncondeosible gases, partial pressure of the gas phase components, steam and water masses, pH, ionic strength, the liquid concentrations of che dissolved specie^, and the saturation ratios of calcite (CaC03>, aragonite (C8CO3), witherite (BaCOj), strontianite (SrC03), anhydrite (CaS0&), gypsum (CaS04*2H2O), barite (BaSC-4), and celestite (SrSO^).
PREREINJECTION TREATMENT
Elsewhere (Quong et el., 1978; Weres and TS*K>, 1979), a scheme for silica removal from separated brines, based on increasing their pE, is discussed. This change of pH may induep unwanted supersatura-tion of the brines with respect to otner minerals such as calcite or witherite.
la c.-s r T O aaaesa the possible aide effects of thia eilica removal scbeate in Cairo Prieto brines, we used BTTIQ to commote the chemical equilibrium of a representative brtsc (Table I) and then varied the pi by addition of a^SQt and Ca(<M)2- The corresponding saturation rati01 are presented in Figure 1. These rca«.l«.a have been checked agair^t computations kindly undertaken by D. L. lessor « Battalia northwest Laboratories, in an at^nmnt 1.0 detect possible discrepancies, it was reassuring to find good agreement with the updated (September 1979 data base) version of Battelle'a code.
Increasing the brine pB brings about potential sealing problems as indicated by the high saturation rntios calculated for the carbonates. These proM'^ms .can be circumvented by reducing the bicarbonate content of the brine before the ailica removal treatment is applied. This can be sccome— liahed by -rirst decreasing the brine pH at intermediate pressures (FweUhead > P > 1 arm) thus inducing conversion of sizable amounts of solution bicarbonate into carbon dioxide, which then can be stripped from the solution by allowing the pressure to decrease and thereby causing further flashing. A possible implementation of this scheme is shown in Figure 2. The first separator pressure has been adopted according to current practice* * A.onto et al., 1979).
Average brine composition of Cerro Prieto geothenaal fluids.
Chemical ppn •olal
Na 6,610 0.288 K 1,436 0.037 Mg 1.2 0.00005 C» 128 0.008 Sr 1S.£ 0.00018 Ba 11.3 0.000082 B 11 0.001 CI 11,970 0.340 C0 2 44 0.001 SO4" 9.6 0.0001 S1O2 = 5tv (1000,* 0.008 (0.016)
pH (100°C) = 7.35
In solution after (before) precipitation.
orphous silica

128
Figure 1. Effect* of adjusting pH on saturation ratios of carbonate and sulfate Minerals for a typical separated Cerrc Prieto brine.
(XBL 7912-13481) Figure 3. Carbon dioxide partition in the first <*#;»arator ( ? ? 6 bars) as a function of pfl.
(JQL /912-13W3)
Sepqrotor
P Wellhead
Acid injtctfd
-y-Sr Separator
-iBor, -mere
Figure 2. Schematic of the proposed scheme of acid injection for inhibition of carbonate minerals deposition. (XBL 7912-13484)
Using HITEQ we find chat the reconstructed brine at 6 bars and 159°C (Si02 = 1000 ppm before silica precipitation) M s a pH - 7.02 and equilibrium ratios CO2:HCO3~:CO3"*:0.22:0.773:0.007. Figure 3 shows the computed equilibrium shift when H2SO4 is added. At pH - 5 we find CO2:HC0 3: :0.961: 0.03.1; 0.6 maoles/Vg of added H2SO4 were required to lower the pH to this value. We envision nc or minor corrosion proble*a at chis moderate pH value. Th» computed saturation ratios in this condition, depicted in Figure 4, indicate that barite may be a limiting factor for tfi» of inexpensive H2SO4.
Flashing the acidified brine to P ~ 1 bar we compute pH • 6.34 and the total aaount of carbon dioxide and bicarbonate remaining in the liquid phase is reduced.
.9 S .§ P
o CO
1 0 - ^
I
T=I59°C Borite
Figure 4 . Effects of adding sulfuric acid on the. saturation ratios of sulfate minerals (carbonate minerals out of scale) in the f i r s t separator-
(XBL 7912-13480)
Increasing the pH of the separated brine by addition ff C«(0U)2 ve find the satoxation ratios of Figure 5, which indicate that the proposed scheme can indeed control carbonate precipitation in treated Cerro Prieto brines. The amount of Ca(09)2 necessary to increase the pH of the separated brine to ~7.8, as required bv the silica removal treatment, was found to be about 0.3 mmole/kg. The
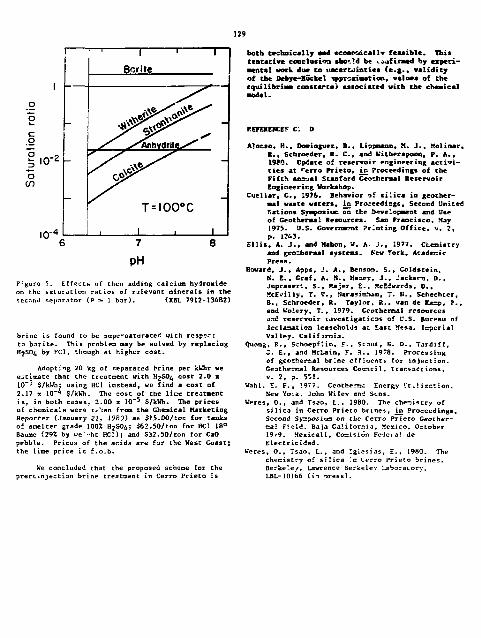
PH
Figure 5. Effects of Chen adding calcium hydroxide on the saturation ratios of relevant minerals in the secnnd separator (P =: 1 bar). <XBL 7912-13482)
brine ia found to be supe-saturated with respec: to barite. This problem nay be solved by replacing H2SO4 by PCl, though at higher cost.
Adopting 20 kg of separated brine per kUhr we estimate that the treatment with H2SO4 cost 2.0 x 10~5 S/kHh: using HC1 instead, we find a cost of 2.17 x 10~* $/kWh. The cost of the lice treatment is, in both coses, 2.00 x 10"^ $/ktfh. The prices of chemicals were tr'ten from the Cheaical Marketing Reporter {January 21, 1980) a& S15.00/tac for tanks of smelter grade 100Z H 2
S 0 4 i $62.50/ton for HC1 18° Bautae (292 by ve~ht HC1); and S32.50/ton for CaO pebble. Prices of the acids are for the West Coast; the lime price is f.o.b.
We concluded that the proposed scheme for the prercinjection brine treatment in Cerro Prieto is
both technically *ad ecowaacallv feasible. This tentative conclusioa should be i^afirmed hy experimental work due to uncertainties (e.g., validity of the Debye-Huckel ipprsximation, values of the equilibrium coos tar t«> asiociated with the cheaical •odeI.
REFEKENCEF C.
Alocso, H., Dowinguez, B., Lippmann, M. J., Kolinar, R., Senroeder, K. C , and Uitherspooo, p. A., 1900. Update of reservoir engineering activities at **erro Prieto, io Proceedings of the Fifth AnmaB Stanford Ceo thermal Reservoir Engineering Workshop.
Cuellar, C , 1976. Behavior of silica in geother-mal waste waters, ia Proceedings, Second United Katioos Symposiuc on the Development and Use of Ceothermal Resources. San Francisco, Hay 1975. U.S. Government Printing Office, v. 2, p. 1243.
Ellis, A. J., and Mahon, V. A. J., 1977. Chemistry and gcothermal systems. New York, Acadenic Press.
Howard, J., Apps, J. A., Benson. S., Goldstein, N. E.. Craf, A. N., Hancy. J., Jacksrn, D., Juprasert, S. t Kajer, £., KcEdwards, 0., McEvilly, T. V., Marasiolun, T. H., Sehechter, B., Schroeder, R. Taylor, R., van de Rasp, P., and GTolery, T., 1979. Geothercta! resources and reservoir investigations off U.S. Bureau off declaration leaseholds at £ast Xesa, Imperial Valley, California.
Quong, R., Schoepflin, F-, Stout, B. D., Tardiff, 2. £., and KcLain, F. 3., 1978. Processing of geother&al brine effluents for injection. Geotherraal Resources Council. Transactions, v. 2, p. 55!.
Wahl. E. F., 1977. Ceothems Energy ft.!ization. New Yo:k, John Vilcy and Sens,
Veres, O., and Tsao, L., I960. The chenistry of silica in Cerro Prieto brines, in Proceedings, Second Syzposius on the Cerro Prieto Geocher-rzal Field. Baja California, Mexico, October 19'9. Mexicali, Co=i«i6n Federal de Electricidad.
Weres, 0., Tsao, L., and Igiesias, E, , 1980. The checistry of silica ^n Cerro Prieto brines. Berkeley, Lawrence Berkeley Laboratory, LBL-10166 ( I T oress).

!3o
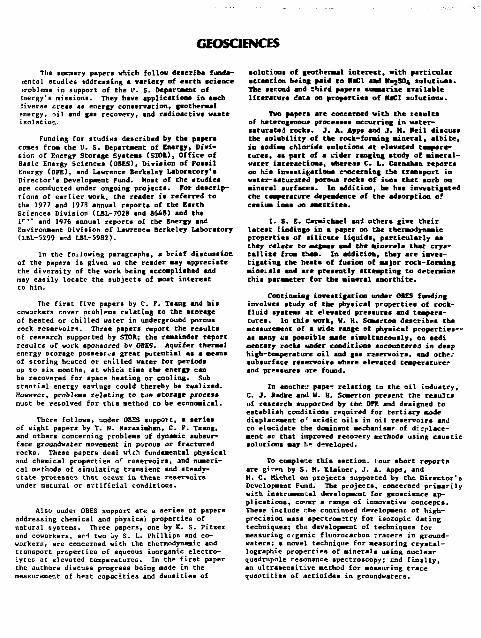
CEOSCIENCES
The suusary papers which follow describe funda-tental studies addressing a variety of earth science rroblems in support of the I1. S. Department of Energy's missions. They have applications in such iiverae areas as energy conservation, geotbermal snergy, oil and gas recovery, and radioactive waste isolation.
Funding for studies described by the papers comes frost the U. S. Department of Energy, Division of Energy Storage Systems (STOft); Office of Basic Energy Sciences (OSES), Division of Fosail Energy (DFE), and Lawrence Berkeley Laboratory's Director's Development Fund. Most of the studies are conducted under ongoing projects. For descriptions of earlier work, the reader is referred to the 1977 and 197B annual reports of the Earth Sciences Division (LBL-702B and 8648) and the K " and 1976 annual reports of the Energy and Environment Division of Laurence Berkeley Laboratory (LBL-5299 and LBL-5982).
In the following paragraphs, a brief discussion of the papers is given so the reader may appreciate the diversity of the work being accomplished and may easily locate the subjects of most interest to hin.
The first five papers by C. F. Tseng and his coworkers cover problems relating to the storage of heated or chilled water in underground porous rock reservoirs. Three papers report the results of research supported by STOR; the remainder report results of work sponsored bv OSES. Aquifer thermal energy storage possesFes great potential as a swans of storing heated or cnilled water for periods up to six months, at which time the energy can be recovered for space heating or cooling. Sub stantial energy savings could thereby be realized. However, problems relating to ti»e storage procesa must be resolved for this method to be economical.
There follows, under 0B5S support, a series of eight papers by T. N. Narasimhan, C. F. Tseng, and others concerning problems yf dynamic subsurface groundwater movement in porous or fractured rocks. These papers deal with fundamental physical and chemical properties of. reservoirs, and numerical methods of simulating transient and steady-state processes that occur in these reservoirs under natural or artificial conditions.
Also under OBES support are a series of papers addressing chemical and physical properties of natural systems. Three papers, one by K. S. Fitzer and coworkers, aiM two oy S. L. Phillips and coworkers, are concerned with the thermodynamic and transport properties of aqueous inorganic electrolytes at elevated temperatures. In the first paper the authors discuss progress being made in the measurement of heat capacities and densities of
solutions of geothermal interest, with particular attention being paid to HaCI and Ka^SO* solutions. The second and third papers summarize available literature data on properties of MaCl solutionu.
Two papers are concerned with the results of heterogenous processes occurring in water-•aturatetl rocks. J. A. Apps and J. H. Heil discuss the solubility of the rock-forming mineral, albite, in sodium chloride volutions at elevated temperatures, as part of a vider ranging study of mineral-water interactions} whereas C. L. Carnahan reports on his investigations concerning the transport in water-saturated porous rocks of ions that aorb on mineral surfaces. In addition, he has investigated the temperature dependence of the adsorption of cesium ions oo smectites.
I. S. E. Carmichael anj others give their latest findings in a paper oo the thermodynamic properties of silicate liquids, particularly as they relate to magmas and the minerals that crystallize from them. In addition, they are investigating the heats of fusion of major rock-forming mineials and are presently attempting to determine this parameter for the mineral anorthite.
Continuing investigation under OSES funding involves atudy of the physical properties of rock-fluid systems at elevated pressures and temperatures. In this work, U. H. Somerton describes the measurement of a wide range of physical properties— as many «s posnible made simultaneously, on sedi sencary rocks under conditions encountered in deep high-temperature oil and gas reservoirs, and othe.~ subsurface reservoir* where elevated temperatures and pressures are found.
In another paper relating to the oil industry, C. J. Kadke awl V. H. Somerton present the results of research supported by the DFE and designed to establish conditions required for tertiary mode displacement o f acidic oils in oil reservoirs and to elucidate the dominant mechanism? of d:'placement sc that ittproved recovery methods using caustic solutions may h* developed.
To complete this section, lour short reports are given by S. H. Kleiner, J. A. Apps, and H. C. Hichel on projects supported by the Director's Development Fund. The projects, concerned primarily with instrumental development for geoscience applications, cover a range of innovative concepts. These include i:he continued development of high-precision mass spectrometry for isotopic dating techniques; th.; development of techniques for measuring organic fluorocarbon tracers in groundwaters; a novel technique for measuring crystal-lographic properties of minerals using nuclear quadrupole resonance spectroscopy; end finally, an ultrasensitive method for measuring trace quantities of actinides in groundwaters.

Sask Sciences Studies
BUOYANCY FLOW AND THERMAL STRATIFICATION IN AQUIFER HOT-WATER STORAGE G. Hellstrom, C. F. Tsang, and J. Claesson
INTRODUCTION
In the research area of hot-water storage in aquifers, a number of key problems remain to be studied. Their solution would define beat-operation condition! and parameters and optimise the storage-recoverj ratio. Solution of these problems would not only yield a basic undcratanding of thermohydraulics in porous media, but may be crucial in the eventual success of this process.
One critical problesi is thermal buoyancy flow in which, because of the difference in density and viscosity of waters with different temperatures, hot water tends to flow to the top of cold water. This induces a mixing of hot and cold water, resulting in heat dissipation that decreases the energy recovery ratio. When hot water is injected iur.j an aquifer, the interface between hot and coi.d water is primarily vertical. This vertical interface is unstable and will tend to tilt outward from the injection well. The rate at which the system tends to equilibrium, i.e., with the ho*- water on top of the cold water, is a decisive factor in determining the feasibility of a system with vertical injection and production wells. A strong disturbance of the temperature field will lead to higher heat loss (larger aurface area of the hot region and increased heat dispersion). It will also require a more complicated extraction system in order to avoid excessive mixing of hot and cold water in the well.
CURRENT STOW
Our study aims to find an explicit order-of-magnitude expression for the influence of the buoyancy flow. It is then possible to estimate the rate *t which the thermal front "tilts," without resorting to numerical models. The analysis is based on a number of analytical solutions for a vertical thermal front in cylindrical and. two-dimensional Cartesian coordinates. The diffusiveness of the thermal front is also taken into account. Several assumptions about the thermal front's behavior must be made in order to modify the analytical solutions for nonvertical situations. Finally, the tilting rate for a given system is quantified by a characteristic tilting time-constant, which equals the time required for an initially vertical front to tilt 45°. Major conclusions include:
1. luoyaacy flow is proportional to the density difference between stored smd native waters, and to the samara root of the product of vertical smd hcrixontal permeabilities of the aquifers, and inversely proportional co aruifer thickness aud average viacoaity of the iujecttd and native waters. The dependence on aquifer thickness and ;*eraeabUitiea will suggest a criterion for selecting potential storage aquifers. The density and viscosity dependence will introduce a guideline for optimal storage temperatures.
2. With forced convection, the injected hot water (for the case of hot-water stores*) tends to flew more eaaily into regions of higher temperatures because of the lower viacoaity. Formulas are derived to quantitatively calculate this flow. ,„ some cases, this flow counteracts the buoyancy flow process.
3. Two key lumped parameters are derived which would make it possible to relate results of different cases by meanj of a similarity transformation.
The moat important parameter is the product <*f 'he vertical and horizontal permeabilities. Se ^il'-'-T time-constant is inversely proportional to t square root of this product. In order to verify the assumptions made when deriving the analytical solution, a number sf simulations have been made using the numerical swdel CCC (Conduction, Convection, and Compaction). These simulations confirm that the assaptions are reasonable.
As an illustration of the results, we give the following example. Consider a 20-m-thict' alluvial aquifer with a vertical permeability that is 1/10 of the horizontal one. The heat capacity of the aquifer is 2.7 MJ/m 3*. The temperature of the injected water is 85°C, and the ambient vn.cr is 15°C. Figure 1 shows the tilting angle (assuming a straight front) as a function of permeability Cm 2) and storage time (days). Let ua require that che thermal front should not tilt more than 60° during a storage period of 90 days. The corresponding maximum allowable permeability is then about 3 x 10"** m 2. This example does not include the effects of a superposed forced convection, which will cause a further increase in the tilting angle.
Permanent address: Department of Mathematical PhysicB, Lund University, P. 0. Box 725, S-22007 Lund 7, SWEDEN.

133
io-l0
15" 30" 45* 60*
12- CO"" \ \ . N > %
' 1 G
0>
X.-J
1
I Moiimum permeability ^v ^
' 1 G
0>
X.-J
1
I 5.8-I0-'1
e O o
1 1
\ \
1
I
Figure ability
I 10 100 100 Storage period (doys)
L. Ti l t ing angle as a function of perme-and storage t ine . (XBL 7910-13050)
Io the field tut* conducted eo far, water at rather tow temperatures (*»SS°C) has h e n injected iato aquifers of relatively high permeability. The length of the storage cycle is about three sweths. To avoid excessive influence of buoyancy flow during an anaual storage cycle with higher temperatures (~S5°C)t it is necessary to use less permeable aquifers.
FLAMS FOR K I T FISCAL YEAS
Work will continue on the a saw bssic subjects. Main emphasis will be on the derivation of key luaped parameters and calculation of the storage-recover retio as a function of these variables. The ret ..its will be of use in the selection of aquifer* and procedures for thermal energy storage.
DAILY SENSIBLE HEAT STORAGE IN AQUIFERS FOR SOLAR ENERGY SYSTEMS C. F. Tsang, P. Fong, C W. Miller, and M. J. Lippmann
INTRODUCTION
Recently much interest has been generated by the concept of long-term seasonal storage of hot water in aquifers. However, the possibility of daily storage-retrievsl cycles has not been explored in much detail. This note will describe the results of numerical simulation studies of hot-water storage in aquifers.
ACCOMPLISHMENTS DURING FISCAL YEAR 1979
At Lavrence Berkeley Laboraory, a powerful numerical model for three-dimensional liquid-saturated poroua systems has been developed, initially for geothermal applications. This model, called CCC (Conduction, Convection, and Compaction) computes heat and mass flow while simulating the vertical deformation of the aquifer system, by using the one-dimensional consolidation theory of Terzaghi. CCC has been validated against many analytical solutions and has been applied to the study of geothermal reservoir dynamics as well as the modeling of aquifer seasonal storage systems (Tsang et al., 1976, 1978a,b).
For the present work, this model is coupled with a wellbore conduction computer program. This we11bore program computes the heat loss away from the wellbore into the formation as hot water flows up or down the well. The coupled model is applied to the case of a "typical" aquifer 20 m thick and 200 m deep. A moderate flow rate of 2.0 x 10 5 kg/ day of 220°C water, is assumed for twr different hot water storage-retrieval schemes:
1. Twelve hours of injection into the aquifer followed by 12 hours of production;
2. Eight hr of injection in the daytime followed by 4 hr of production in the evening, then shut-in for 8 hr at night, and finally, a second 4-hr production period in the early morning.
The parameters used for these calculations are summarized in Table 1. As an illustration of the wellbore heat-loss effects, Figure 1 shows the temperature at the well bottom during the first 8-hr injection period (case B) when 220°C water is injected at the top of the well.
Three cycles were calculated for each case and the results are shown in Figures 2 and 3 for case A and Figures 4 and 5 for case B. These figures display the temperatures at the bottom of the well (Figures 2 and 4) and temperatures at the top of the well (Figures 3 and 5) during the production and shut-in periods. A difference in temperature of a few degrees is noticed between the top and bottom m e to heat losses or gains as water flaws along the well. The large heat loss near the top of the well during the shut-in period is apparent in Figure 5.
If we define the energy of the stored water as represented by its temperature above the ambient 20°C, the energy recovery, as a percentage of stored energy, is shown ir> Table 2. On the whole, a recovery ratio el over 70Z is computed.

13*
Table 1. Material and f luid parameters Ufle4.
• s i t Thermal Specif ic flaterial Dimensions Tvnrosity Density capacity condoctivity Permeability mtoraoe
3 K 9 _ 1 « c
Aquifer 200 deep 20 tn ick 20 2 .6 x 10* 9 7 X 1 0 2 2.894 1.0 x 1 0 " 1 3 2 .0 x 1 0 " 4
Aquitard 200 deep 20 th ick 15 2.5 X 10² 9 3 X 1 0 2 2 .20 1.0 X 1 0 " 1 ' 2 .0 X 10"*
F l u i d Parameter!
v i a c o a i t y (cp)
1.005 x 1 0 " 3
5.450 X 10~*
2.S0O x 10" 4
1.820 X 1 0 " 4
1.350 X 1 0 " 4
Taeperature (•C)
Haet capaci ty c ( j k g - ' ^ c - 1
T«a)p«r*tur* ( •C I
F l u i d Parameter!
v i a c o a i t y (cp)
1.005 x 1 0 " 3
5.450 X 10~*
2.S0O x 10" 4
1.820 X 1 0 " 4
1.350 X 1 0 " 4
2«
SO
100
150
200
4 .112 x 1 0 3
3 .8*4 X 1 0 3
3.6S2 X 1 0 3
3.341 X 1 0 3
20
75
125
200
Expansivity (•C"1J 3.17 x 10" i-lijur rate (kg day' 1 J 200448 Injection tetrnperature at surface (*C) 220
• I ' i t
2I6"C
200
O o r ~
£ 150 -Z3 O
Q. IO0 _ E
r -
50
0 1 2 3 4 5 6 7
Time (hours) Figure 1. Temperature at the well bottom with injection of 220°C water at top (case E ) .
(XBL 795-854)
Fisprre 2 . Temperature ac the bottom of the well •icricj production perioda, c*ie Af 12-hr injection asd 12-hr production. CXBL 7811-129*2)
220
200
M 16 IB 20 22
PROD. Tift Cnus)
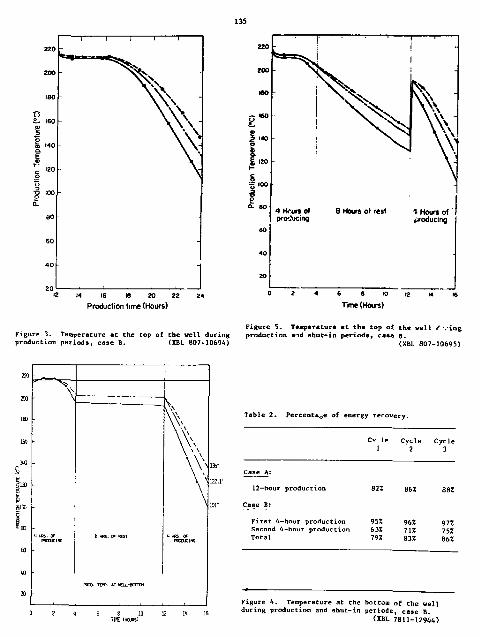
135
220
te*=*a^
P ' : ' 1 ' " !
200 ^ 5 s. HO
p«0
s» o
' Vj I 120 I-
- \
Loo % c t£ ao "4 Hem of
producing 8 Hours ol rest 1 Hours of
producing 60
«o -20 -
16 W 20 22 Production time (Hours) Time (Hours)
Figure 5. Temperature at the top of the veil t ving Figure 3. Temperature at the top of the veil during production «'id shut-in periods, case B. production periods, case B. (XBL 807-10694) (XBL 807-10695)
220
* ~ " ^ . V 230 * ~ " ^ . V
ISO •
IB) • \ \ \
~™ • V '•i
B 515D
-\
*80 4 w e . <*
mxuciNG 8 HBS. OF "EST 1 MRS. OF
paxucirc EO -10
PBCD. TB*>. *T KLL-BDTTOI
m
Table 2. Percenter of energy rerovery.
Cv l e 1
C y c l e 2
C y c l e 3
Case A:
1 2 - h o u r p r o d u c t i o n 82Z 862 88Z
Case B:
F i r s t 4 - h o u r p r o d u c t i o n Second 4 - h o u r p r o d u c t i o n T o t a l
95% 631 79Z
96Z 71Z 8 3 1
97Z 75Z 86Z
0 2 4 & 8 10 12 1H 16 Tilt 1KU5)
Figure 4. Temperature at the bottom of the well during production and shut-in periods, case B.
(XBL 7811-12944)

CONCLUSIONS
The results suggest that it stay be reasonable to store hot water in aquifers on a daily-cycle basis; this possibility should be further studied. Once a storage rate and temperature *re decided, based on a practical scenario- pars«*i-ttie studies of aquifer thickness, pcrunbiit>, and porosity should be aade to select an aquifer which will ma^e da'ly storage an economic venture.
REFERENCES CITED
Tfiang, C. F., Lippmann, I snd Witherspoon, p.
. , Gorans or., C. B. 1976. Numerical
•odelinc , j t cj :lic storage of hot water in aquifers. Presentation, Av? Fall Meeting, San Francisco, California, December 6-10, 1976, (also L1L-5929).
Tsang, C. F-, Lippaaun, M. J., and Witherspoon, F. A., 1978a. Underground aquifer storage of hot water froa solat energy collectors. Proc. Int. Solar Energy Cong., New Delhi, India, January 16-21, 1978, (also LBL-7034).
Tsang, C. F. ( Buscheck, T., Mangold, D., and Lippsuuw, M. J., 1978b. Mathematical modeling of thermal energy storage in aquifers, in Proceedings, Tbera. Energy Storage in Aquifers Workshop. Berkeley; J,awrence Berkeley Laboratory, LBL-BA31, p. 3 7 - K 5 .
ONE-DIMENSIONAI. CHEMICAL TRANSPORT IN AN ADVECTION-DOMINATED SYSTEM T. N. Narasimhan
INTU0WJCTI0N
The equation governinp, the one-diaensional advective-diffusion of a chemical species is written
This report discusses one atteapt to overcome the probleas of nuaerical dispersion in one-diaensional systeas.
DISCUSSION
I, (q - n d D c r + J D L Vc * ndf - \ |^- (1) To understand nuaerical dispersion- let us
consider the extreae case of pure adver.tion where D L - 0. In this case, equation (I) reduces to:
where q " n is Darcy velocity along the outer normal n to the 'urface segment dl", cp is the aean concentration at dT, D L is the longitudinal diffusion coefficient, assumed to be constant; v v is the pore volume within the elemental voluae bounded by the surface T; and dc/flt is the mean time derivative over the elemental volume. In (1), we assume that the fluid flow field is steady and that q is ' d e pendent of time. The more familiar differential form of (1) is
<2>
Both Cl) and (2) are condition.
ubject to initial and boundary
The numerical solution of the above equations is reasonably straightforward providing that the magnitude of diffusion is strong relative to advec-tion, as quantified by the Peclet Number,
It is widely known that when P e is larger than about 2, the numerical solution of the above equation is masked by a dispersion or a smearing out of the concentration front caused by the solution process itself. This is known as numerical dispersion.
X V ^ v 3t (4)
If we view (4) in an explicit ferhion, all the geometric quantities and the Darcy velocity are known, and the only unknown is CF, the concentration at the interface dT. In numerical models, c is specified (initially) and dc/dt computed at discrete node centers rather than at the interfaces between neighboring node centers. Hence, c r is to be evaluated on the basis of the known values of c at the node centers. This is usually achieved by a process of interpolation between known values of c en either side of the particular interface of interest. In achieving this interpolation, there are three possible sources of error. These are (1) variations of cp over the time interval At; (2) the spatial discretization errors inherent in the interpolation process; and (3) errors inherent in the discrete values used in the interpolation. Of the three, time-integration errors can be handled relatively easily from a computational point of view. Gf the other two, spatial discretization errors have perhaps received the widest attention as the source of numerical dispersion. Attempts have been made, for example, to minimize numerical dispersion by using upstream weighting in conjunction with finite difference approximations or by using higher order approximations in conjunction with the finite element method. However, not much attention has apparently been paid in the literature to exploring the third error source as a major source of error. We now consider this in detail.
137
Consider a volume element of width Lxt within which the concentration front i* residing. Cince we are considering pure edvection, the concentration at the node center of the voluae element haa to be either 1 or 0, depending on whether or not the front has crossed the location of the node center. However, since concentrations are treated aa averages over the voluae element, the concentration at the node center will gradually vary from 0 to 1 as the front migrates from the upstream to the downstream end of the volume element. As a result, a fundamental error is introduced into the interpolation process as long as on \ uses an average concentration for the volume elfaent in which the sharp front is residing. This basic error cannot generally be eliminated by improved interpolation schemes.
One possible way to eliminate the aforesaid error is to avoid using, in the interpolation process, the erroneous Average concentration of the volume element in whch the Front if residing. Instead, one simply uses a procedure of extrapolation, rather than interpolation. In ordt-r that this could be implemented, one should know, a priori, the node in which the front is residing. This information, nevertheless, is known as long aa the problem involves steady fluid flow field.
RESPONSE OF AQUIFERS TO EARTH TIDES T. N. Narasimhan and B. Y. Kanehiro
INTRODUCTION
Since Grablovitz's early observation in 1880, many field workers have reported the response of confined aquifers to earth tide fluctuations as evidenced by water level or fluid pressure fluctuations in wells. This response is basically governed by the relative compressibilities of water and the porous matrix of the aquifer. Attempts have therefore been made in the past (Bredehoeft, 1967; Bodvarsson, 1970; Arditty and Ramey, 1978) to estimate reservoir compressibility based on the aquifer pressure response relative to the changes in gravitational potentials induced by changes in earth tides. Whereas Bredehoeft considered a horizontal aquifer of finite thickness, Bodvarsson and Arditty idealized the system to use a spherical geometry. Bredehoeft's idealization, similar to what follows in the present work, leads to a direct estimation of specific storage as a ratio between observed dilation and the associated pressure response in the aquifer.
The .resent work deals with the analysis of aquifer response data from three field cases: Raft River Valley, Idaho; East Mesa, California; and Marysville, Montana. All the wells were deeper than 1 km. An example of a well record is shown in Figure 1. The work consisted of two parts. First, the data were processed using finite Fourier analysis to identify the primary tidal components from the pressure transient data. An example of the spectra resulting from finite Fourier analysis is shown in Figure 2. The second part of the task was to evaluate the aquifer Btorativity using the
This method of minimizing numerical dispersion was explored by implementing the extrapolation technique for evaluating the concentrations at the surfaces bounding the volume element in which the front resides and using the conventional interpolation scheme everywhere else. The method indeed gave excellent results for pure advection as well as advection-domirated problems with or without exponential decay of rhe solute. In addition, due to the extremely small diffusion, the voluae elements have relatively large time-constanta and hence enabling explicit evaluation of time-derivatives as losg as Cp'a are evaluated accurately. As long as the meenjd is implemented correctly, the solution process is not limited by AT.
The main limitation of the method is the need to store, in memory,, the fluid flux field in an appropriate fashion. Although this is not a serious problem for one-dimensional situations, extensions to two and three dimensions is cumbersome in practice although simple in principle. Yet, in its present state, the method offers attractive possibilities for studying a variety of advection-dominated problem* such as transport in a fissured, two-dimensional porous medium in which sll the flow occurs in the fissures while diffusion governs chemical transport in the porous rock.
relationship between the observed fluid press-ire change and the corresponding stress changes induced by the earth tides. In this respect, the present work differs somewhat from Bredehoeft's analysis in that we did not directly compute storativity as he did. Instead, we first calculated the bulk modulus of the porous medium before evaluating specific storage.
He also carried out a numerical investigation of the effect of weiibore storage on governing the phase-lag between the aqcifer response and the associated response in the well.
THEORY
Cc.-aider a horizontal, homogeneous, areally infinite aquifer, pierced ty a fully penetrating well. The well is non-pumping and is merely an observational device. In the first case, assume that the well is snail and reacts instantaneously to any changes in the fluid potential in the aquifer. We will consider the noninstantaneous well response later.
Because the motions of the earth, moon, and sun are well understood, it is possible to estimate the changing g-avitational potential at all point:: in the earth \s a function of time. On cursor-' examination, it might seem reasonable to assume that the changing acceleration due to gravity, implied by the changing gravitational potential, results in the fluctuation of the weight of the overburden of the reservoir and, hence, the fluctuating pore-fluid pressure as seen at the well.

13S
500 «XO 1500 2000 2500 Time (sec x
Figure 1. Hell record (TOP) and calculated earth tide* record (BOTTOM) for the s u e site. Keaponae of the aquifer nay be determined by comparing the two. (XBL 799-2889)
40 60 60 Harmonic number (K)
Figure 2. Spectrum of the well record (TOP) and the earth tide record (BOTTOM) for the same aite.
(XBL 799-2888)
Rough calculations, howevery show that this mechanists is not large enough to account for the aagnitude of the observed pore-fluid pressure fluctuation aeen in moderately deep reservoirs. The bulk of the change in pore-fluid pressure in the aquifer apparently results from some other mechanist.
This mechanism is related to the nonrigidity of the earth. The driving force may be viewed aa a bulging of the jarth resulting from the gravitational attraction of the moon or sun on the one side and centrifugal force on the other. Because of the motions of the sun, moon, and earth relative to one another, the deformation appears to be periodic.
In a gross sense, the aquifer may be considered to be a sealed defornable packet of saturated sand imbedded in the earth's crust. This packet deforms periodically in response to the deformation of the earth as a whole. The deformation implies that there is a change in the pressure of the pore fluid within the aquifer that can be measured at the well. If the section of the well exposed to the aquifer is sealed off (packed) with rubber packers, then the pressure measured in that section of the well should reflect the pressure of the pore fluid within the aquifer. If, on the other hand, the well is open to the atmosphere aud the water level in the well fluctuates in response to the changing pore-fluid pressure, there will be
both an attenuation and a lag between the pressure fluctuation of the pore fluid and the fluctuation as measured in the well. The attenuation and phase lag reflect wcllbore storcge and result from filling and emptying the well with each pressure fluctuation. The problem is then one of relating the known changing gravitational potential to the pressure fluctuation as seen at the well in terms of meaningful aquifer characteristics.
Although the nature of the changing gravational potential is reasonably well understood, the inhomc— geneous anisotropic nature of the earth complicates the stress-strain picture of the deforming aquifer. In general, however, reasonable assumptions and empirically determined coefficients can be invoked to estimate the stress imposed on the aquifier by the earth tides. In the case of the packed-off well, the relationship between this stress and the pressure fluctuation as seen at the well is a function of two aquifer characteristics—specific stor-?«e and porosity. In the case of an open well, the relationship also depends on the permeability of the aquifer.
It is well known that for the undrained problem (see Skempton, 1954; Domenico, 1972), the ratio of fluid pressure change to the total stress change induced by earth tides is governed by the porosity of the aquifer as well as the compressibilities of water and the aquifer matrix. Thus,

^1 - _ 1 (!) where Ap is pore pressure change, Ao^ is change in B mean principal (total) stress, n ia porosity, c w ia water compressibility, and my is coefficient of voluae change. Rence, by rearrangement of terms we may write,
nc Ap,
and S s, specific storage, is given by:
(2)
[-5] where Y w is unit weight of water. As seen frosi (3), S s can be estimated if n and Aa B are known, with Ap F denoting the measured earth tide response and AOQ, representing the total mean stress change induced by the earth tide. Thus, an important task is to estimate Ac m. It can be shown that A, the dilatation Lite to earth tides, can be approximated
(4)
where Wj is tidal potential, a is aean radius of the earth and g is acceleration due to gravity. In view of (4), if we can use a reasonable estimate for the bulk modulus for the region of the earth in which '.he aquifer is situated, then we can estimate •\am by the relation,
where K is the estimated bulk modulus.
Under these conditions.
•[••¥]• (5)
Dsing (5), field data collected from Harysville, Montana; East Mesa, California; and Raft liver, Idaho, were analyzed. The results obtained, using % • 5 x 10'0 Pa, are given in Tables 1, 2, and 3.
In arriving at the reaults in Tables 1, 2, and 3, it was assumed that the well responded instantaneously to changes in the aquifer potential. This is true in the case of a small-diameter well or a well that is packed off at Che top and bottom of the formation.
The second problem considered was that of pulse lag between the pressure transient as seen at the well and the stress imposed by the earth tides. This corresponds to the case of a relatively large open well, which is more difficult to deal with than the packed-off well. The easiest approach was to use numerical modeling. Because there were no data complete enough to verify any modeled real-world situation, we only considered hypothetical cases. The problem involved an axi-t metric well-aquifer system with a sinusoidally varying driving force. This sinusoidal term corresponds to a single component of the real-world tide that may be separated by Fourier analysis. A pressure-versus-time record of a simulation run is shown in Figure 3. Here the upper curve represents the tide and the lower curve represents the
Table 1. liesults of the aralysis of the record from the well at East Mesa, California (bulk modulus of 5 x lO^O Pa assumed for the region around the aqui fer).
Tidal Component
AW,
<x 1/gm)
iP f
(?a)
S /n s <l/o>
01 7.060 x 10~ 2 2.924 x 10 5.052 x 10" 6
PI, Kl 7.362 x 10~ 2 4.745 X 10 5.416 x 10" 6
N2 3.754 x 10" 2 1.102 x 10 4.881 x !0" 6
H2 1.704 x 10" 1 5.526 x 10 4.923 x 10" 6
S2 9.235 x 10~ 2 3.717 x 10 5.035 x I0" 6
Ss/n (mean) - 5.06 x 10~ 1/m

140
Table 2 . l eau l t s of the analysis of the record fron the well at Eaft River, Idaho (bulk sudulus of '- * 10*° Pa situated for the region around the aquifer) .
Peak » 2 a»f S /n
Identif ication f i ! / « • ) (t,.y (• /•>
1 3.900 x 10" 9.655 x 10 2 1.265 x 10" 5
2 5.300 x 10' 1.172 x 10 3 ! .u»: x 10" 5
3 6.000 -. 10" 1.172 x 10 3 9.165 x 10" 6
4 6.100 x 10" 1.517 x 10 3 1.276 x I0" 5
5.600 x 10" 1.310 x 10 3 1.151 x l l T 5
S /n (mean) - 1.13 x 10 3 l/«
Standard Deviation - 1.50 x 10
Table 3. Results of the analysis of the reccrd froa the well at Marysville, Montana (bulk modulus of 5 x 1 0 1 0 Pa assuaed for the region around the aquifer).
Tidal i « 2 a p f S /n
Component (x 1/*.) (Pa) <l/«)
01 PI, Kl
N2
8.126 x 10"?. 1.318 x 10 , 2.315 x 10
2.176 x wl 3.58i x 10 4.600 x 10
1.685 x I0"* 1.535 x lo" ' 9.351 x 10~"
H2 1.133 x 10"' 2.260 x 10 2 9.366 i l o " 6
S2 5.863 x 10" 2 9.782 i 10 7.962 x 10" 6
*• /n (mean) - 1.14 x 10 1/m s
~>r*ndard Deviation • 3.45 x 10 1/m
250 500 750 1000
Time (sec > 10 )
response of the aquifer. Nofe that in the case of the open well, there is a phase lag as well as an attenu, tion of the sif/ial. Application of this model to the real uorl becomes an inverse problem that, although str>ightforwavJ in principle, may be relatively tediou'. The possibility of systematizing the solution ot the inverse problem, perhaps through the use of type-curve generation, was investigated. Although some potential was
Figure 3. Pressure fluctuation in the well element (points) and an element distant from the well element (line) in the case of a veil open to the Atmosphere. The period of the sinusoidal generation term is 86,400 sec (24 hr). (XBL 799-2886)

141
shown, verification of such Methodology requires 1EFEUMCES CITED nore and better data than that what is presently available. Arditty, P. C , and Immey, R. J., Jr., 1978.
Response of a closed well-reservoir system to stress induced by earth tides. 53rd Ann.
PROBABILISTIC SIMULATION OF TRANSIENT SUBSURFACE H O W USING A NUMERICAL SCHEME ";'. N. Narasimhan and T. Buscheck
Fall Teen. Conf. and Exnib., SFE of AWE, Houston, TX, October 1-3, paper 7484.
Bodvarssov, C . 1970. Confined f luids as strain acter*. 1970. J . Ceophys. t e a . , * . 75, no. 4 , p. 2711-27 IB.
Bredeboeft, J . D. , 1967. Response of well-aquifer systems to earth t i d e s . J . Ceophys. Kes. v . 72, no. 12, p. 307S-30S7.
Domenieo, P. A. , 1972. Concepts and aodels in groundwater hydrology, Kew fork, McGraw-Hill.
Skempton, A. W., 1954. The pore pressure coe f f i c i ent s , A and B. Ceotechnique, v. 4 , p. 143-147.
UBSURFACE H O W USING A
llain^ the response of aquifers to earth tidt* as a neana of estimating aquifer characteristics has good potential, particular?, *n areas where pump tests cannot be run. Ideally, however, since the method does involve a number of assumptions (as do pusip test analyses), and since it provides information that is often complementary as well as overlapping with that obtained from the pump test, both types <. f tests should be run. Similar values from the two methods could give ue considerably more confidence in the results than either method alone, since the methods are independent of one Another.
INTRODUCTION
Long-term decision-making tasks in regard to the hydrogeologic environment have to rely heavily on outputs from mathematical models. However accurate the computational scheme may be, the model output has only limited reliability due to uncertainties inherent in the input data and parameters. It is now being increasingly well recognized that a quantitative appreciation of the output uncertainty is of great practical value in arriving at optimal decisions. As a result, several workers are turning their attention to incorporating parcmeter uncertainty into the computational model in such a manner as to obtain confidence limits on the model output.
OUTLINE OF STUDY
The purpose of this study is to develop a probabilistic model to simulate the flow of fluids through porous media. It is impoi*ant to clarify the distinction between stochastic \or probabilistic) and deterministic models. Clark (1973) made this distinction in terms of hydrologic modeling.
A system .in be defined as a set of physical processes which convert an input variable (or variables) to an output .ariable (or variables). A variable ie a characteristic of the system which can be measured and which assumes different numerical values at different times. A variable is differentiated from a parameter, which is a quality characterising the system that does not change wi;h time. In hydrologic modeling one must be able to mathematically model the relationships between hydrologic variables that describe the system's behavior.
A tnod^l is defined as stochastic or deterministic depending on whether or not it contains random variables. In the case where any of the input or output variables have a probability distribution, the model is stochastic. One possible source of a probabilistic structure for an output variable
could be a probabilistic distribution of one or more of the parameters.
The stochastic model developed in this study makes use of a well-defined probabilistic structure. The probabilistic distribution is nodeled by discrete values. Each of these values (or magnitudes) has associated wich it some probability of occurrence- For any given frequency distribution, the sum of the probabilities corresponding to each discrete value eust equal 1.0. Given a probabilistic distribution, one can generate any number of discrete values and thqir associated probabilities using a graphical technique. The accuracy of modeling a well-defined probabilistic structure will improve with the ntsaber of discrete values chosen. Each probabilistic distribution id therefore modeled by a determined number ox pairs of values, a discrete value for the magnitude and its associated probability. These probabilistic structures represent the inherent uncertainty of the variable or parameter in question.
As pointed out by Freeze (1977), the applied sciences of groundwater hydrology, soil physics, and soil mechanics make use of ma.themati<.«il solutions to deterministic nodels of flow through porous media. These models make the assumption that individual soil layers and geologic formations are uniformly homogeneous. Even when numerical mathematical models are used for complex heterogeneous systems, the heterop*>n?i* : Jescribe the differences in parameter values a=ong various layers, nor vithin an individual layer. At some scale, it is tacitly assumed a single number can be assigned to each hydrogeologic parameter wi-hin some spatial geologic unit.
It is generally accepted, however, that there is physically an such entity as a truly uniform and homogeneous geologic unit. Single-number representations or deterministic predictions involve uncertainties because of inherent nonuniformity of porous media as well as the uncertainty of measure-

142 ment. Thin study considers the effect of modeling such uncertainties with stochastic parameters. Stcihaat'-c node ling allows one to study the properties of statistical distributions of the output variables that rofilt when input parameter* are modeled with probabilistic distributions.
Three paracsters are usually associated with hydrologic modeling: hydraulic conductivity, porosity, and compressibility. For the analysis of one- 'Jiuensional, steady-state, saturated flow between two specified boundary heads, the equations of flow contains only one hydrogeolof;ic parameter, hydraulic conductivity. It is this parameter that is sr.ochas^ically modeled in this work.
Strong field evidence indicates that the probability density function for hydraulic conductivity is usually log normal. Using thia evidence, and given a mean value snd standard deviation for a typical rock or soil, the lognormal distribution for hydraulic conductivity is modeled a3 outlined above.
ACCOMPLISHMESTS
During fiscal year 1979, » theoretical basis was developed, based on axiomatic foundations of probability theory, to define the meaning of algebraic operations involving two-probability distributions. A computer algorithm w*3 then successfully developed to implement the algebra of distributions. Briefly stated, the algorithm works a* follows. Suppose we have two random variables, A and B, with distributions s-pecified as histograms with N discrete values and associated probabilities. That is, we are given A£, P C A ^ ) , B^ and P(Bi), i - 1,2,3,...N where A; and B^ denote the magnitudes of the i c " component of each variable while P(A£) and P(Bj) denote the associated probabilities. Obviously we have
S PU.> - 2 *<B.) - i • u> i-l l i-1 1
Suppose we now wish to add the two distributions to obtain their sum in the form of a third variable C£ with associated probabilities PtCj). .u find C, we will proceed as follows:
c". = A. + B., i » 1,2,3,...N U - J ( 2 )
j - 1,2,3,...N
where C£: is the outcome if events A£ and B; were to be realized simultaneously. According to the axiouatic foundations of probability theory,
the probability of events Aj and Bj occurring aiaultaneously i*s
P(c!.) - PCA-) P(B.) (3) ij i i
and If || L Z »w. . ) - i <*) i-l j-I J
Thus, the outcomes Cjj constitute %*• discrete values and associated magnitudes. In order that the computational effort* are reasonable, we would now like to have the variable c[j expressed as an equivalent variable Cj with N discrete values rather than the B* discrete valuea of the former. This we now achieve by dividing the range adn C;j to max Cj; into W equal interval*. The aeaa magnitude Cf of the i t h interval (i - 1,2,3,...H) denotes an appropriate average for that interval. Tor example, it can either simply be the aidpoinc of that interval, or, as we have done, it could be a weighted average of all the Cj; values falling ;**.thin that interval. The probability associated with that interval Cj is the sum oi the probabilities of all the Cjj'a falling within that interval. These procedures have been incorporated into a subroutine called FfODIST for implementing equation* (1) and (2) and a subroutine called COUPS to go from K 2 values of Cjj to !f values of Cj.
WORK PROPOSED FOR FISCAL YEAR 1980
The aforesaid routir• i» will be incorporated into computer program TERZAGI, which solves groundwater flow problem* in ratinated, multidimensional systems. Using TERZAGI in the explicit mode so that independence between poten.tal changes between adjoining subdomaics during a given time step is assured, we props*e to apply this model to some simple one— and two-dimensional probless. We will also verify our results against the Monte Carlo simulations by Freeze (1975).
REFERENCES CITED
Clarke, R. T., 1973. A review of some mathematical models used in hydrology, with observations on their calibration and use. J. of Hydrol., v. 19, pp. 1-20.
Freeze, R. A., 1975. A stochastic conceptual analysis of one-dimensional groundwater flow in nonuniform homogeneous media. Water Res. Res., v. 11, no. 5, pp. 225.
Freeze, R. A., probabilistic one-dimensional consolidation. Journal of Ceoteehnical Engineering Division, v. 103, no. GT7.

A NOTE ON VOLUME AVERAGING T. N. Narasimhan
INTRODUCTION
In characterizing fluid flow in subsurface systems through such devices as fluid potential, Darcy's Law and storativity, one implicitly assumes statistical uniformity on a macroscopic scale. In this context, the notion of "point" value, such as porosity, density, pressure and so on, actually implies an average evaluated over an appropriately small region to which the point of interest is interior. A fundamental appreciation of the power, as well as the limitations, of the equations governing subsurface fluid clow therefore requires a proper appreciation of the manner in which various physical quantities are related to volume-averaging.
EXTENSIVE AND INTENSIVE PROPERTIES
Fundamental to volume-averaging is the distinction between extensive and intensive properties. Extensive properties (e.g., mass, energy, snd volume) are such that their magnitudes are dependent on the size of the regions they occupy. Intensive; quantities, on the other hand are independent of the size of the region they occupy. Iney denote the concentration or the intensity of an extensive property and frequently constitute potentials. Intensive properties rosy either by volume-normalized (e.g., porosity, density, concentration) or D U B -normalized (e.g., temperature). A fundamental difference between the two is that the former possess the "additive" property while th,- latter does not. That is, the total mass or energy contained in two diBti.nct regions is equal to the sum of the mass or energy contained in the two regions. A corollary statement is that mass or energy can exist if and only if space is available for them to occupy.
The physical reality of the mathematics of integration stems from the additivity property of the extensive property. In the theory of integration, the mathematical equivalent of the extensive property is the "measure" which is a set function possessing the additive property. The magnitude of a measure is zero over a null set. Both mass and energy are defined over a set of spatial points and are measures.
VOLUME AVERAGING
Given the spatial distribution of an intensive quality over a subset of space, the aim of volume-averaging is to evaluate a macroscopic average value of the property over the given subset. This is to be achieved by integrating the property over the subset of interest in some meaningful fashion and normalizing the sum by the volume of the subset. That is,
If the above procedure is to be physically realistic, then, the integrand dV must be an extensive property or a measure. while many intensive properties such a* porosity and density satisfy the requirement that ipdV be additive, ther* exist several other intensive quantities which do not satisfy that requirement. In order to accomodate all intensive quantities within the folds of a single definition* we introduce the notion of a ''capacity" function and r.write (1) as.
. 1 U%
iX where £1 is an intensive quantity.
where c is the capacity function.
If equation (2) were to be used for defining average temperature, then c ia volumetric specific best. If p denotes fluid iressure in the porous medium, then c denotes the compressibility of the solid-fluid porous complex. For a given combination of extensive and intensive quantities (e.g., heat and temperature; fluid mass and fluid pressure) the corresponding capacity function denotes the rate of change of the former with reference to the latter.
As Si.tjwn in other papers (Karasiehan, 1978, 1980), equation (1) is strictly valid only in steady-t.tate systems or in homogeneous caterials with constant capacity. From a generalized perspective, indiscriminate extension of (1) to transient problems can lead to erroneous results or conclusions.
VOLUME-AVERAGING AHD MATHEMATICAL MODELING
The basic task of mathematical modeling in dealing with subsurface fluid flow is to simulate the observations sade in the real world through a computational mode. The success ot simulation depends very much on the manner in which physical observations and volume averages are placed in mutual correspondence with each other.
Within the computational model, the computed volume averages are associated with a discrtre point interior to the subset of integration. The potential gradients that exist between these discrete points provide the driving force for subsurface fluid movement. A very ioportant question that requires resolution concerns the conditions under which the volume-average assigned to the spatial point will match the physical obseration made at the real location corresponding to the spatial point of interest. Analysis (Ncrarimhan, 1980) seems to indicate that for homogeneous naterials with constant rropertics, the above match vill be obtained when tL intensive property of

interest varie* linearly over the subdomain of interred. Thil linearity requirement, coupled with the importance of the capacity function strongly suggest that there la a need to reassess some of our current notions in regard to numerically solving transient fluid flow in heterogeneous porous media.
uraoKEs cms Nsrasiahan, T. •., 1975. Perspective on numerical
analysis of the diffusion equation. Advances in Wster Kesources, v. 1, no. 3., pp. 147-155. i 1960- A note on volume averaging;. Advances in Vater lesources Cin press).
GROUNDWATER MODELING IN SUBSURFACE NUCLEAR WASTE DISPOSAL—AN OVERVIEW T. N. Narasimhan
INTRODUCTION
The role i f groundwater modeling In subsurface nuclear waste disposal technology consists of (1) analyzing regional groundwater flow in order to select a site with maximum path-length and r.ravel-time to the biosphere; (2) evaluating the perturbation caused to the regional flow by the repository; and (3) studying the transport of radioactive contaminants to the biosphere over tens or even hundreds of thousands of yearB. This paper attempts to assess the ability of existing models to simulate realistic problems of groundwater flow and ontarainant transport. Toward this end, the governing equations will first be glvea, followed by a brief description of the computational methods used to implement the governing equations. Finally, the various difficulties that challenge the credibility and effectiveness of the models will be examined.
GOVERNING EQUATIONS
For studying long-term effects, thermal phenomena can be ignored and two types of conservation equations, one for flow of water and one for each of the chemical soecies transported must be considered. For an appropriately small, arbitrarily shaped macroscopic volume element» the conservation equations are:
Fluid Flow
Solute Transport
C s(c.t) + / (-q-ndDEp + r
source advection
A-q-ndDcp
hydzodtfna=sic dispersion
v 5i v Dt
(2)
H m a)
where C s is mass of solute generated due to chemical changes; q is the average (Darcy) velocity; cp is mean concentration over di*; q and c are measures of the deviations from q and c over dl*; D<« is hydrolynacic dispersion tensor; D*J is the molecular diffusion tensor; and V w and c are volume of water contained In, and the average concentration over, the volume element. In (2) advection is hsadled in terms of the average quantity, q. Due to the variability of fluxes within pores along dl", convective mixing occurs at a microscopic level causing conentratlon profiles to spread. Numerous workers have treated such spreading effects as an equivalent macroscopic diffusion process through the hydrodynamlc dispersion coefficient D** which is a function of q. Equations (1> and (2) are subject to boundary and initial conditions. With suitable assumptions, the two equations can also be extended to fractured cedia-
MATHEHATICAL MODELS
where G w is the mass of -water generated, T is the closed surface bounding the element, py Is the water density, kjj is the permeability tensor, g is gravity, U is viscosity, z Is elevation, ¥ is pressure head, and M is fljid mass capacity (Narasimhan and Witherspoon, 1977).
For applying (1) and (2) in a most general fashion, numerical methods are preferable to analytical methods. The theme of numerical methods is to partition the flow domain into an appropriate number of subdomaics and apply the conservation equations to each subdoaain, subject

145
to coapatibility of fluxes and potentials between neighbors. The suDdomalns could be explicitly defined [Integrated finite difference method (Narasimhan and Witherspoon, 1976)] or implicitly defined [method of weighted residuals {Flnlayson, 1972; Narasimhan, 1978)]. Critical to the evaluation of the integrals in (1) and (2) are the mean concentrations c r and the gradients 3T/3x and 3c/3x at the interface dr. These could be evaluated using sliQple finite differences or using the more general finite element techniques (Cray and Pinder, 1976). Because pure advection does not involve mixing, the concept of averages used In (1) and (2) c« R lead to spurious "numerical dispersion" in advectlon-doftinated systems. While some workers (e.g.. Chaudhary, 1971; Gray and Pinder, 1976) have overcome this problem through correction factors, improved gradient approximations, and other artifices, others have used aii-.uaie approaches such as the method of characteristics (Pinder and Cooper, 1970) or random-walk techniques (Ahlstrom et al., 1977) to handle adv^ctive transport.
CHALLFHRRS TO MODELING
Despite active research, the credibility of groundwater models for long-duration predictions of natural systems Is yet to be firmly established. The challenges in this regard stem from (1) the gaps between the physical system and the conceptual model, (2) the gaps between the conceptual model and the computational model, and (3) the difficulties associated with the computational procedure itself. In regerd to (1), some workers have questioned the; validity of the dispersion coefficients to quantify the mixing phenomena observed on porous media. As for (2), flow and transport in geologic systems are approximately ordered phenomena in an essentially disordered geometry (Philip, 1973). All model parameters are therefore subject to uncertainties due to the size of the portion of flat? region sampled by the measuring device and the number of samples taken. As a result, one hps not only to specify beforehand the scale of monitoring but also to obtain sufficient population of field data to assure confidence in the model output. Computationally, problems exist with respect to minimizing integration errors.
ROLE OF PORE PRESSURE ON DEFORMATION T. N. Narasimhan
SUMMARY
Water is known to occur even at great depths in the earth's crust. Due to its slight compressibility as well as to capillary action, water exerts fluid pressure on the pores containing it, thereby modifying the existing state of stresses on the rock matrix. The contrast that exists between the deformation properties of the rock and the fluid, the modification of the stress field by rhe fluid pressure, and the continuous changes in fluid pressure induced by the dynamics of flowing groundwater contribute profoundly to the deformation behavior of the geologic systems.
handling discontinuities and so on. In addition, considerable difficulties exist in handling the interaction of statistical quantities that are mutually dependent or correlated.
It appears that many of the computational difficulties can be overcome by Improved solution strategies. However, the basic problems related to parameter uncertainties may continue veil into the future.
REFERENCES CITED
Ahlstroa, S.W., Foote, B.P., Arnett, R.C., Cole, C.R., Serne, R.J., 1977. Hultl-codponent mass transport model: theory and numerical Implementation (discrete-parcel-random walk version). Richland, Washington, Battelle Pacific Northwest Laboratory.
Chaudhary, M.H., 1971. An Improved numerical technique for solving multidimensional displacement equations. Society of Petroleum Engineers Journal, v. 11. p. 277-284.
Flnlayson, B.A., 1972. The method of weighted residuals and variational principles. New York, Academic Press.
Gray, W.G., and Pinder, C.F.. 1976. An analysis of the numerical solutions of the transport equation. Water Resources Research, v. 12(3), p. 547-555.
Naraslmhan, T.N., 197B. A perspective on numerical analysis of the diffusion equation. Advances in Water Resources, v. 1(3), p, 147-155.
Narasimhan, T.N., and Witherspoon, P.A., 1976. An integrated finite difference method for analyzing fluid flow in porous media. Water Resources Research, v. 12(1), p. 57-64. , 1977. numerical model for saturated-unsaturated flow in defomable porous media: Part I, Theorv. Water Resources Research, v. 13(3), p. 657- '-*4.
Philip, J.R., 1972. Flow in porous media, in Proceedings, 13ch latl. Cong, theor. and Appl. Mech., Moscow. Amsterdam Springer-Verlag.
Pinder, G.F., and Cooper, H.H.,Jr., 1970. A imer-ical technique for calculating the transient position of the salt water front. Water Resources Research, v. 6(3), p. 875-ftp8.
The importance of understanding the deformation behavior of fluid-permeated geologic systems IR readily apparent in more than one context: the development of oil, gas, water, and geothermal resources; the cause and the modification of earthquakes; the utilization of soil or rock masses to support engineering structures; the response f;f the earth's crust to electrical a nd mechanical wA-fes; the formation of hydrothennal ore deposits, and others.
Scientists and engineers in man^ disciplines are actively striving toward a better understanding of the physical mechaiisms that govern the
IN GEOLOGIC PROCESSES

146
deformation behavior of geological system* subjected to the ubiquitous influence of water. With a view to bringing together the current ideas and observations on this important natural phenomenon, a Penrose Conference, sponsored by The Geological Society of America, was convened by the author with W. N. Houston of the University of California, Berkeley! and Amos Nur of Stanford University as co-conveners, during November 9-13, 1979, at San Diego, California.
The conference was strongly interdisciplinary and drew participants from the following fields: structural geology and geophysics, hydrogeology, geotechnical engineering, geochemistry, rock mechanics, applied mechanics, and ocean engineering. In keeping with the Penrose ideals, the conference provided an excellent forum for a free exchange of ideas among the participants, and generated new research contacts.
This report is a brief summary of the conference highlights. During the conference, a collection of important reprints, textbooks, and reports on the conference subject matter was assembled for the participants' benefit. In response to participants' suggestions, a list of these references has been prepared for distribution. Those interested in obtaining a free copy may contact the first author. Although the conference was essentially self-supporting, partial financial support was provided by the Earth Sciences Division of the Lawrence Berkeley Laboratory.
The discussions of the conference concentrated on the following general areas: effective stress lawBj stress-strain relations; seismicity and pore pressure; hydraulic fracturing and geopreasured systems. Moat of the main points covered in the various sessions are discussed below.
Perhaps the most significant feature that aeta apart a fluid-filled porous medium from a dry one, insofar as deformation is concerned, is that fluid pressures acting outward from within counter the external atressea acting inward. Inasmuch as matrix deformation is governed strictly by the stresses borne by the matrix, and since the hydrodynamics of fluid flow ia governed by fluid pressure, a constitutive relation is a priori imperative if one ia co couple fluid flow and skeletal deformation in a general conceptual framework. The notion of an effective stress, originally proposed by Terzaghi more than 50 years ago, provides the basis for such a constitutive relation. Although there iii little dispute about the general concept of effective stress, there still appears to exist many a question about the specific, quantitative meaning of this quantity, as waB evident from the deliberations of the first two conference sessions.
It was pointed out that there is no unique effective stress law or relation satisfying all mechanical properties, and that an effective stress law may not be needed if a given property is known for any combination or total stress and pore pressures. Some of the questions raised relevant to the effective-stress concept included: What are the limits of the simple effective-stress relation proposed by Terzaghi, j* - a - P? How important are physical-chemical forces of interaction? Can
the state of a soil be uniauely defined my void ratio, effective stress, and overconsolidstion ratio? What happens to effective stress when temperature! changes or phase trass forma tioms occur? What is the correct relation when more than omc fluid phase is present?
Following the discussions on effective-stress relations, theoretical developments were presented for the elastic ss well sa nonelaatic response of fluid-saturated porous media. The possibility of applying the theory to euch problems ss flow in abnormally pressured systems, suddenly pressurised cavities, growing tensile cracks, and suddenly introduced dislocations were discussed. The derivations csrried out for isotropic linearly elastic materials included undrained as well sa drained responses and showed that the single Terzsghi relation is strictly valid onlj; 'or plastic deformation.
From a practical standpoint, one of the most intriguing questions of fundamental interest is the tarsal dspth to which interconnected pore spaces exist, facilitating deep circulation of groundwater. Indirect evidence, based on electrical resistivity measurements, seems to suggest that circulation may persist down to s depth of 20 km. Permeabilities of the order of a nanoDarcy or higher hsve been inferred to exist down to a depth of 10 kn through earthquake, isotope, snd heat flow studies.
A variety of experimental results were presented and discussed in relation to the streas-strsin behavior of fluid-saturated rocks. Some of these experimental reaulta suggested that in some rocks (e.g., Cosco Granite) the bulk modulus i» sensitive to saturation while in some ethers (e.g., Solenhofen limestone) it may not be; in clayey sandstones, permeability may be more sensitive to pore fluid pressure then effective stress; in certain fault-gouge materi ..'a, permeability ia related to strain rate, and this material may exhibit strain-hardening properties with incressing sand fraction. Pressure sol^ioi. effects may be important in cerfain joints subjected to nonhydrostatic stresses.
The phenomenon of earthquake instability is basically related to fractional sliding along a fault plane. A large number of laboratory experiments have indicated that the shear strength of fractures is related to the normal stress by the approximate relation, \ * 0.85a', o' > 2 kb, and T * 0.5 + 0.60", a' > 2 kb. If, because of pore pressure rise, a' is so diminished that falls below the shear stress in situ, the resulting sliding srould lead to seismicity. This appears to be an adequate model for seismicity, provided that we can reasonably predict the tine-dependent variation of pore pressures leading to s progressive decline in normal effective stresses. A principal concern is therefore the permeability of the in situ material and the factors that influence its change. Experimental evidence indicates that the presence of compressible clayey materials in fractures considerably influences the permeability versus effective stress relation. Thus, permeability is related generally to (T - cip) with a < 1 for clean fractures and o < 1 for fractures with clay. A knowledge of these

147
properties at hypoeentral depths ia essential to predict induced seismicity.
That fault movement occur* as the pore preaaure exceeds a critical value causing frictional sliding was demonstrated iu the case of the Kangely earthquakes through the use of mathematical simulation of the hydrogeologic system. In this case there was a definite correlation between the frequency and location of the earthquakes and the local fluid pressures.
Considerable research activity is currently in progress in studying reservoir induced seismicity. Among the carefully collected data at these sites are included: the measurement of in aitu stress, permeability and fracture characteristics, and the monitoring of earthquake loci and magitudes. Depending on the permeability of the in situ rocks, the time-lag between lake filling and seimaicity may vary iroro a few months to as many as several years. It is quite probable that the Migration of pore pressure transients is critical to induced seismicity. Is there a reasonable chance of modeling the phenomenon accurately enough to achieve reliable prediction? An outstanding problem still defying solution is that of predicting earthquake magnitudes.
While the factors that cause seismicity are important for earthquake prediction, it i* equally essential to study those factors which help mitigate earthquake hazards. Over the past decade, geotechnical engineers have established that abnormal pore pressure generation in shallow, co-hesionless soils leads to soil liquefaction. Indeed, the study of many earthen dams and foundations subjected to strong earth notions shows that abnormal pore-pressure generation commonly accompanies cyclic loading in alluvial soils and earth structures. Experimental study of pore pressure generation using shaking tables simulating cyclic loading is therefore a very active area of research. Theoretical studies as well as experimental results from shaking table experiments were presented and discussed*
It was noted that in situ stress measurements are of great importance in delineating areas of potential seismicity. The technique of measuring stress in situ using hydraulic fracturing is extensively employed. In addition, hydraulic fracturing is also beneficially employed to stimulate low-permeability reservoir rocks to augment production of oil* water and geothermal fluids.
The nature and disposition of hydraulic fractures depend on the orientation of the local principal stresses, the toughness of the rock, and the fluid pressure gradient within the fracture. Assuming elastic properties for the crack, theoretical relations have been developed to distinguish conditions of stable and unstable fracture growth. Theoretical analysis has also been performed to study the gro'/th of long, elliptic/-1, cracks, and the controlling parameters. Fielrf and laboratory ^•-idies indicate that the rate of fluid pres^ur-ization is important in controlling fracture disposition. Rapid pressurization favors vertical fractures while slow pressurization leads to hori
zontal fractures. The technique of hydraulic fracturing is under
going development in terms oc both hardware and interpretive techniques. The interpretation of pressure transient data fromt hydraulic fracturing tests is particularly involved due to the presence of well compliance effects, as well as the time-dependent variations in fracture geometry, aperture, and stiffness. The successful application of a numerical model towards interpreting an actual field test and the estimation of the minimum principal test was presented. Whether powerful mathematical models can help improve the design of hydraulic fracturing testa appears to be a fruitful area of inquiry. Perhaps the most important field problem in hydraulic fracturing at the present time is that of determining the maximum, principal etreas, since it ia the difference between the maxima and minimum stresses that governs frictiooal sliding.
In the foregoing discussions, Che main emphasis was placed on the mechanical aspect* of pore-pressure generation and the interaction between pore pressure and skeletal stresses. However, in certain geological environments, chemical effects can act in conjunction with me^nanical effects and contribute greatly to the creation of anomalously high pore pressures. The following mechanises are believed to contribute to abnormally high pressures: aquifer head due to natural recharge, "fossil" head due to exhumation and erosion, tectonic compression, rapid loading and compaction, influx of juvenile water, gas infiltration, mineral dissolution or precipitation, phase changes (gypsum** anhydrite, smectite** illite, heavy hydrocarbon to light hydrocarbon), expansivity to temperature changes, and osmotic (clay-membrane) phenomena. There were considerable discussions as to which of the aforesaid mechanisms was the most dominant in geopressured systems. The phenomenon, of uaaea.uilib.rium. compaction, that i* rapid deposition without adequate time for drainage, is perhaps t?*e rnst dominant of all the mechanisms. In this mechanism, the role of permeability is very important. If rapid burial is accompanied by reduction in permeability due co precipitation and related effects, abnormal pore pressures are augmented. Among the other mechanisms, mineral-phase transformations, aqua-thermal effects, and osmotic effects are probably the most significant, in general.
CONCLUSIONS
It became obvious from the lively discussions and the diversity of presentations, that the role of pore pressure in geological deformation processes is not only an important area of investigation, but i<5 emerging as a broad, all-encompassing one. Many of the vital or ciitical problems society laces today—resource exploration, evaluation recovery , earthquake hazards, and - ound stabi1ity, to name the more important ones—are linked to the role of pore pressure. Although our understanding of the intricate behavior of geological material and the interaction between physical and chemical processes in the presence of pore fluids is far from adequaLe, the conference did show that we are rapidly gaining understanding of what the

148
important problems are~a first step to solving them. He all agreed tbat a great deal of new active
Intr jduction
Many authors have studied various aspects of the reinjection of cooled geothermal water into a geothermal reservoir. One consideration f practical relevance Is the calculation of the pressures required for reinjection. These pressures determine tl pumping requirements that are important inputs to the technical and econoaical feasibilities of th* project. The pressures may also be used as baseline data. If, for example, the measured pressure becomes much greater with time than the calculated values, some kind of plugging may be occurrinp- and remedial action would have to be taken.
For isothermal cases where the injected water is at tht: same teiaperature as the reservoir water, the pressure change is simply given by the Theis solution in terms of an exponential integral. The solution shows that this pressure change is directly proportional to the viscosity, with viscosity a strong function of temperature. From 100°C to 250°C, the viscosity changes by a factor of 3 (whereas ••he density of water changes by about 20Z).
The injection of cold water into a hot reservoir is a moving boundary problem. On the inside of a boundary enclosing the injection well, the parameters correspond to that of the injected cold water; on the outside, the parameters correspond to those of the reservoir hot water. Due to heat conduction between the hot and cold water, the boundary is, of course, not sharp. The width of the boundary depends on the aquifer heat conductivity and capacity, and it increases with time as the boundary (or cold temperature front) moves outward from the injection well.
There exist numerical models to solve such a problem. In earlier work, we made a simple study using the numerical model CCC developed at Lawrence Berkeley Laboratory. A sample of calculated results is shown in Figure 1. The present work is an analytical calculation Ttf such a problem when several approximations are applied. Solutions are obtained in terms of well-known functions or in terms of one integral. These calculations are checked against numerical model results.
Mathematical Approach
Three equations—the equation of continuity, Darcy's equation, and the equation of state—are combined into one governing equation in radial symmetric coordinates, in which viscosity (u) and density (p) are assumed to be dependent variables. Applying the Boltzman transformation and the boundary condition of constant line-source flow rate Q at the injection well, one obtains, after
research in the area of pore preaaure ia to be expected and encouraged in the tearing decade.
Figure 1. Pressure change at well versus t/r 2 when water at 100°C Is injected into a reservoir of 300°C water. Results obtained by numerical model CCC are compared with isothermal Thels solutions.
(XBL 789-2077)
sone manipulation, the transient pressure P(z) as a function of z = r 2/t:
<= . z .
en where the parameters are h (reservoir thickness), c - B$ (compressibility times porosity), P (the initial pressure), and K = k/u (permeability divided by viscosity value). Here K is density-dependent and, since we assume that the Boltzman transformation is possible, it is a function only of z - r 2/t. For our current calculations, the reservoir temperature distribution during injection is represented by a Fermi-Dirac function
K(z = r 2/t) = , T ! n / g + K 7 • (2) 1 -t- e-{-z-^>'a l
The function takes on the values of Kj, K R, and (Kj + K R)/2 respectively at z*0, z=<=, and z=d (see Figure 2a). The function varies appreciably only in the neighborhood of z = d; the parameter a characterizes the range of z over which K(z) is appreciably different from Kj and K R. The derivative dK/dz Is a symmetrical function about z = d. The full-width half-maximum of dK/dz about this point may be shown to be 3.52a (see Figure 2b). This behavior of K(z) may be understood as follows: near the wellbore, the function takes on the value of K = k/u = Kj., equal to that of injected water;
AN ANALYTIC STUDY OF GEOTHBKMAL RESBtVOiR PRESSURE RESPONSE TO COLD-WATER INJECTION Y. W. Tsang and C. F. Tsanr;
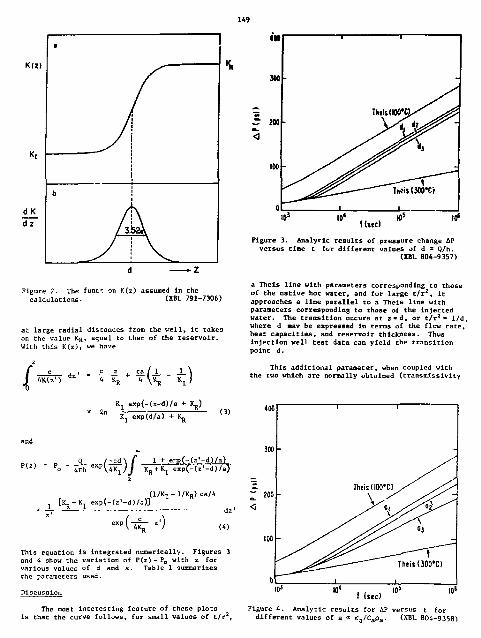
Km
dK dz
a
b !
A
•w 1 1
MO -
5 2H <
100 S ^ \ ^ ^ ^
• ^ ^ ^ TWUJOO'O
0 i i
t(«e) 10"
Figure 3. Analytic results of pressure change AP versus time t for different values of d " Q/h.
(XBL 804-9357)
Figure 2. The funcr on K(z) assumed in the calculations. (XBL 791-7306)
at large radial distances from the well, it takes on the value KR, equal to that of the reservoir. With this K(z), we have
z
/ MS.U">
a Theis line with parameters corresponding to those of the native hot water, and for large t/r 2, it approaches a line parallel to a Theis line with parameters corresponding to those of the injected water. The transition occurs az z-d, or t/r 2 - 1/d, where d mav be expressed in terms of the flow rate, heat capacities, and reservoir thickness. Thus injection veil test data can yield the transition point d.
This additional parameter, when coupled with the two which are normally obtained (transmissivity
_9_
Kj exp(-(z-d)/a + K,,) l n Kj expW/a) + Kj < 3 )
|--cd\ f 1 + e-p(-(z'-d)/a)
j [KJ + KJ exp(-(z'-d)/a)] (1/Kj - 1/KR) ca/4
^ ") - dz'
This equation is integrated numerically. Figures 3 and 4 show the variation of P(z) - P 0 with z for various values of d and a. Table 1 -summarizes the parameters used.
Discussion
The most interesting feature of these plo~s is that the curve follows, for small values of t/r2,
1 (sec) Figure 4. Analytic results for AP versus t for
different values of a " K a/C ap a. (XBL 804-9358)

150
TABLE 1. Parameters used in calculations.
Q - 80 kg/sec
h - 150 n
c = *6 - 1.2168 * 10"' ms r/kg
K(300°C) - (k/u)300*C - 5.4705* 10"" a V k g
K(100°C) - (k/p)100*C - 1.785'/ * 10~ 1 0 m ss/kg
( 3.2568 d - \ 4.2568 x io"" I / B
C 5.2566
°'1 -» , 1.0 x 10 • / •
kh and s tora t i r l ty « h ) afford* the p o s s i b i l i t y of determining the parameters h . •» and k separately, provided the heat capacit ies are known.
Io w e l l - t e s t analys i s . Figures 3 and 4 may be used d irec t ly . The early data f i r s t say be coapared with the curve for t / r • 1/d, yielding kh and #6h values. Matching later data w i l l give parameter d frosi which h may be estimated. Thus, k, +S, and h are evaluated. Of course, in actual f ield-data analys i s , other possible e f fec ts ( e . g . , boundaries) may enter, and great care has to be exercised.
Plans for Next Year
This work w i l l be extended to Include cases of s step function and a trapezoidal function to simulate the transit ion in temperature between the injected cold and native hot water zones. The applications of derived formulae to practical f i e ld cases w i l l be studied.
THERMAL EFFECTS IN WELL TEST ANALYSIS D. C. Mangold, C. F. Tsang, M. J. Lippmann, and P. A. Witherspoon
INTRODUCTION
The effect on the pressure response due to fluid and rock temperature-dependent properties is a challenge to our ability to interpret well test results from nonisothermal reservoirs. Zones of different temperatures in the reservoir may resemble permeability boundaries, so thst care in interpreting results is required (Tseng et al., 1978). in this study we examine these temperature effects on well test data in which the producing wel} is completed in the center of a hot sone surrounded by a concentric cooler water region. The investigation was done with a view toward comparing the results of such tests with the classical Theis solution, and discovering the ways in which temperature differences can be accounted for in well test data analysis.
ACCOMPLISHMENTS DURING FISCAL YEAR 1979
This study employed a numerical model (Lippaan et ill., 1977) developed at Lawrence Berkeley Laboratory called CCC (Conduction Convection, Compaction) to simulate a geothermal reservoir with a central hot cylindrical region surrounded by colder water. The progrSia has coupled energy and nass transport equations to simulate single-phase nonisothermal saturated porous systems. Viscosity, specific heat, and density of water are properly taken as temperature-dependent properties. The program also can consider pressure and temperature-dependent rock and fluid properties in general, but for this study only water properties were allowed to vary with temperature. In particular, intrinsic permes-bLlity was held constant throughout in order to Btudy variability due to viscosity and density alone (see Table 1 for the rock properties employed). Pure liquid water was aaarsaed; the effects of salt solution of a 3 wtX brinf. in our present problem
are negligible (see below). This model has been validated against s variety of analytical and semi-analytical solutions, as well a* field dst.t (Mangold et al., 1970; Tiang et al., 1977, 1980).
STUDY OF THEtHAL EFFECTS IN WELL TEST ANALYSIS: 100 m ANOMALY
In this case, the temperature within the cylindrical geothermal anomaly is 250°C; the remainder of the simulated region is at 100°C. When the usual semilog plot of AP versus log tine is aade, the slope, m, of the straight line will reflect the influence of the temperature on the water viscosity, ji, and the amss flow rate, q, due to changes in water density, P:
m - 0.183234 &M pkh
Table 1. Properties of the aquifer used in the simulations.
Thickness, h (m) 50
Porosity, <j> 0.1
Intrinsic Permeability, k (10~ u m 2) 29
Specific Storage Coefficient, S s (m - i) 3.9 x 10
Density, P a (kg/m 3) 2650
Heat Capacity, C a (j/kg'X) 970
Thermal Conductivity, K^ (W/ra-K) 2.8935

For early times, the elope should reflect the values of V *ad p for 250°C. However, after the influence of 100°C region is felt, the slope will change. Since the viscosity ratio of the water at these two temperatures ia 1:2.t, and the fl-.Id density ratio ia 1:0.S3, the combined affect frost the different teaperatures on the semilog slope is approximately 1:2. This ia the chamge in slope • that would be expected in the presence of a linear permeability barrier, if the common assumption of an isothermal reservoir is made. Figure 1 shows **e results from 39 days of production fro* the 100-m radius hot spot, and for the later times the semilog slope is evidently about twice th«t of the initial slope. Such a thermal effect could therefore cause a mistaken interpretation in the well test analyais.
The underlying pressure distribution for this case is seen in Figure 2, where the effect of the different temperature waters is evident. Even after a month of production, the boundary of the colder water still provides • significant change in the pressure decline curves. Furthermore, the thermal front has barely moved during these 39 days. In practice, the "moving boundary" of t^e thermal front would probably appear to be stationary during a well test, because the radius of an actual hot spot would likely be greater than 100 m, and the mass of fluid withdrawn would only slightly affect the position of the front. Thus, the thermal boundary would not be detectable aa a moving boundary, making interpretation of this change in semilog slope even more difficult to distinguish from a permeability barrier.
THE SO m AW0MALY: PRODUCTION FOR 120 DAYS
For the roaainder of thia study, a 50-n-radius hot spot was aMumed, in order to investigate effects when the production period is long enough to manifest the moving boundary of the thermal front. In Chi* case, production was continued for 120 days, that is, until all the 250°C water was extracted from the reservoir, which then was
ftadiw lawtan)
Figure 2. Radial preasure distribution for a 100-m hot spot (shaded region ia 100°C). (XBL 797-7574A)
at 100°C throughout. The progression in pressure change from the initial hot spot condition to the end ia shown in the semilog plot of figure 3, where tiiere are several discernible periods of different response. During the earliest times (up to neerly 0.5 day) the pressure follows the 250°C Theis behavior, as expected. There follow* a transition time (from 0.5 to 2 days) where the curve shifts to run parallel to the 100°C Theie curve, but still below it in magnitude (from 2 to 20 days). Then the curve again shifts upward (20 to 60 days) until the temperature front begirj to reach the observation well. At this point the pressure changes drastically, with the curve sloping steeply upward to join the 100°C Theis curve (for times greater than 60 days) as it should, tince by the end of the 120 days the entire reservoir is at
The practical application of this "second shift" is made by locating an observation well at some distance away froa the production well.
- 100*C T h e * / '
/ ccc .-*
-/ y"' ^ ^ - - ^ 5 0 * C Then
..-'J-' -"""^ QbM»vc"0" • • » ol I S m
Figure 1. 2.5 m ) .
Drawdown curve for 100-m hot spot (r • (XBL 797-7570)
Figure 3. Drawdown history of 120 days production from 50-m hot spot (r - 2.5 a ) . (XBL 798-11480)

152
At such an observation well, the effect of Che moving thermal front occurs much earlier, e.g., at approximately IS days when observed at a distance of 19.5 m from the production well. Thus the length of time for the moving boundary to be manifested can be minimized by data taken at a suitably distant observation well.
A usual type curve matching procedure was applied to the log-log plot of r - 2.5 • data to estimate transmissivity (t'i/u) and starativity (<$>ch). The results of the type curve analysis are given in Table 2. The match with the very early part of the curve yields a good estimate for tch/p, as expected. But under such a direct analysis, if Che analyst matched the later portion of the curve, he would be seriously mistaken. The estimated values for $ch reflect the sensitivity of type curve matching, even for the early time data. Again, matching with the latest portion of the curve would lead to serious errors by direct analysis.
The progress of the temperature front it interesting to follow. In Figure 4, a sequence of curves shows how the front moves slowly at first, and quite rapidly at the end, reflecting -ifferences in radial volume under a constant pumping rate. The diffusion of the front is very apparent. This diffusion of the temperature front cay also account for some of the shifting of the pressure change data curves over the period of production.
THE *0 m ANOMALY: BUILD-DP TESTS
The build-up testa performed in this series of simulations confirm the same general behavior observed in the production tests, but the effects occur at earlier times. Figure 5 shows a Horner plot of a build-up teat after 30 days of production frora the 50-ra. hot spot of the previous section. At the earliest tines the points are parallel to the 250°C analytical curve, but after less than one day the points shift toward the 100°C curve. By 5 days the pressure is already following characteristic 100°C build-up behavior.
• < v ~ \ *S " W
- ^ x \ ^ \ \
\ •
" *" * \ \TT«W» \ \ \r \ Y"\ \ \ \r •
" J0O«tw.
^ ^ \ v V\l •
i o M SO «G so «
Figure 4. Radial distribution of temperature for 120 days production from 50-m hot spot.
(Xlt 798-11488)
REINJECT10H AMD PRODUCTION OF COLO WATER
In their study of cold water reinjection, Tseng et al. (1976) employed numerical model CCC to inject 100°C water into a 309°C reservoir, obtaining results such is those displayed in Figure 6. The characteristic pressure behavior noted in the previous sections for drawdown and build-up teats is also apparent here. This pattern of behavior is confirmed by the analytical solution of Tsaog and Tseng (1978).
PARTIAL PENETRATION CASE
The previous sections have assumed a single layer model where there is necessarily full penetration, and gravity is not an influence. To study thermal effects in the common situation oi partial penetration, a multilayered cylindrical mesh was used. The ce.sul.te are displayed in Figure 1.
The same general pattern of the previous sections is apparent for partial penecra. !on. The analytical solutions are taken from Witherspoon et al. (1967), and are semilog straight lines for
T*ble 2. Theis curve matching.
50-m~radius, 250°C inside, 100°C outside
kh/u
do" • 8 m 3/Pa-s) (10 7 m/Pa)
Early tinea ( to 0.37 u) 1.21 4.33
Later tinea (fron 1.50 d) 0.66 18.«0
Actual value 1.36 2.50
ffiroiiei io 250*C
Pumping i ime30deyi ODKmulionMeriai 2 5m
L<>. ( ' " " a t ' ) I c l a : " 1
Figure 5. Buildup curves for 50-m hot spot, 250°C and 100°C Rafter 30 days pumping, r - 2.5 m ) .
(XBL 798-11486)

153
t/r*(Me/m*l Figure 6. Drawdown curve for t/r 2 for cold water injection into a hot reservoir (log-log plot).
(XBL 789-2077)
Partial penetfot>on d'O*0o«n curves
Figure 7. Drawdown curve for 402 partial penetration in 48-m hot spot. (XBL 798-11481)
the times plotted for the reservoir parameters used. This result confirms the effect of viscvity differences on the pressure response during a drawdown test, even when the well is partially penetrating.
THREE ADFIT10NAL FACTORS
Three factors have a possible influence on the above results: the effects of natural convection, brine solution and a diffuse front.
To study the effect of natural convection, a simulation W B B performed using the partial penetration mesh of five layers under the initial temperature and pressure conditions, but with no production at the well. After 27.5 days the mass flow cycle in simulation achieved a quasi-steady-state, and no further mass flow was computed. The results were compared with analytical formulas recently derived by Hellstrom et al. (1979) for buoyancy tilting of a thermal front in an aquifer, including the effect of a diffuse front. The numerically computed flow
velocity at the front was within 0.81 of the analytical solution at 27.5 days. The Maximal flow velocity due to natural convection from both the analytic and numerical calculations was found to be 1.455 x 10"^ a/iec, compared with the flow velocity from pumping, which was 4.285 x 10" 6 a/sec at 30 daya, a factor of nearly 30:1. These results confirm that the use of a single-Layer mesh for the major part of this investigation was acceptable, since natural convection should have negligible effect on reservoir pressure for the time periods considered (up to approximately 40 days).
The fcrfecv of a brine solution instead of pure water was examined using estimation formulas from Wahl (1977) for physical properties of geo-thermal brines. The difference in properties between a 3 wtZ brine and water is negligible for PC, and approximately 62 for u or (k/p). However, the error of 62 applies equally to the 250° and 100°C waters, so that the viscosity ratio remains the same. Thus, encountering a brine solution in place of pure water in a field test should not affect the results reported here.
Finally, the diffuseness of the thermal front will have an effect on the slope of the semilog plot, as shown in Tsang and Tsang (1978). According to their numerical results, the values used in this investigation should b<~ similar to their analytical calculations (see Figure 6 ) . Because the pressure behavior presented here does follow their reported pattern, the present set of simulations does confirm their analytical formulas for the ef fect of such a diffuse zone.
CONCLUSION
This paper has shown that the effects of viscosity from regions of different temperature water can appear in well test data in a way that may be mistaken as permeability barriers in some cases. This effect can be recognized by a pumping test of sufficient duration with observation wells located at a suitable distance from the production well. The questions of identifying tb^ moving thermal boundary, applications of the method to build-up tests, and partially penetrating wells have been discussed. The possible influences of gravity and buoyancy (i.e., natural convection), water salinity, and the size of tne diffuse zone have also be«n considered.
PLANS FOR FISCAL YEAR 1980
The present investigation can be extended to cover other cases, such as a Cerro Prieto reinjec-tion model (Tsang et al., 1980). Further work may be done to explore other possibilities for detecting thermal effects in well test analysis.
REFERENCES CITED
He 11strom, G., T?ang, C. F., and Claesson, J., 1979. Heat storage in aquifers: Buoyancy flow and thermal stratification problems. Lund, Sweden, I.und Institute of Technology, Department of Mathematical Physics.
Lippmann, H. J., Tsang, C. F., and Witherspoon, P. A., 1977. Analysis of the response of

154
geothermal reservoirs under injection and production procedures. 47th Ann. Calif. Keg. Meeting, SPE-AIHE, Bakersfield, CA. f April 13-15. Dallas Society of Petroleum Engineers, paper SPE-6537.
Mangold, D., Wolleaberg, H., and Tsang, C. F., 1978. Thermal effects on overlying .ledimentary rock from in-situ combustion of a coal seam. Berkeley, Lawrence Berkeley Laboratory, LBL-8172.
Tsang, C. F.. Lippmann, K. J., Goraoson, C. B., and Wicherspoon, P. A. f 11*77. Numerical modeling of cyclic storage of hot water in aquifers. Berkeley, Lawrence Berkeley Laboratory, LBL-5929. , 1978. Numerical modeling studies in well test analysis, J£ Proceedings, 2nd Invitational Well Testing Symposium. Berkeley, Lawrence Berkeley Laboratory, LBL-8883, n. 47-57.
Tsang, C. F., Buscheck, T., and Doughty, C., 1979. Aquifer thermal energy storage—a numerical simulation of Auburn University field experi-
ments. Berkeley, Lawrence Berkeley Laboratory, LBL-I0210.
Tsang, C. F., Mangold, D. C., and Lip^mwnn, H. J., I960. Simulation of reinjection at Cerro Prieto using an idealized two-reservoir Model, in Proceedings* Second Symposium, on the Cerro Prieto geothensal field, Baj« California, Kexico, October 1979: Mexicali, Comision Federal de Electricidad (in press).
Tsang, T. W., and Tsang, C. F., 1978. An analytic study of geothermal reservoir pressure response to cold water reinjection, in Proceedings, 4th Stanford Workshop on Geothenul Reservoir Engineering. Stanford, Stanford University, p. 322-331.
Vahl, E. F.» 1977. Ceotheraal energy utilization. Slew York, Wiley-Inter science, 302 p.
WitherspiMEi, P. A., Javandel, X., Neuman, S. P., and Freeze, k. A., 1967. Interpretation of aquifer gas storage conditions fro* water pumping tests. New York, American Gas Association, 273 p.
THERMODYNAMICS I»F HIGH-TEMPERATURE MINES K. S. Pitzer, D. J. Bradley, P. Z. Rogers, and J. C. Peiper
INTRODUCTION PROGRAM IN 1979
An understanding of brines is essential for the technical utilization of many geochenaal resources. Consequently, in 1975 we began a study of the solution thermodynamics of brine systems, both simple and complex, weak and strong, covering a wide temperature and pressure range, and combining both modeling and experimental work.
The initial work involved analysis of existing thermodynamic data on simple electrolyte systems using equations developed by Pitzer and co-workers (Pitzer, 1973; Pitzer and Hayorga, 1973, 1974; Pitzer and Kim, 1977). The goal of the modeling was to provide a compact set of equations capable of reprodui ng, at various temperatures and pressures, the existing data within experimental error up to practical concentrations (6M) in terras of parameters having physical significance.
The program to measure heat capacities and densities arose because of inadequate experimental data on electrolyte systems. The primary goal of the experimental program is to supply data on simple and complex electrolyte systems at high temperatures and pressures both along and away from the liquid-vapor saturation curve. In addition, these data will provide a base for checking and refining various models.
Experimental projects conducted during the past year have emphasized the high-temperature/ high-pressure properties of solutions of geothermal interest. Both a calorimeter and a densimeter, designed to operate at elevated temperatures and pressures, have been used to obtain data on aqueous electrolyte solutions common in geothermal and geo-chemical systems. Data acquisition ha- been coupled to a computational program designed to compile and evaluate existing thermodynamic data on geothermal solutions.
The densimeter has been designed to operate in the temperature range 25 to 400°C and at pressures to 800 bar. It is essentially a dilatometer, which directly measures the volume expansion of a solution due to a temperature increase. The volume change is then converted to a density determination. The densimeter has been used to obtain the volumetric properties of NaCl s 'utions at 20 bar and 25 to 200°C with a precision of 15 ppra. Experiments are now under way to obtain similar data at 100 bar and 25 to 300°C. These data are necessary to complete a computer fit of the volumetric properties of NaCl solutions to 300°C and I kbar. The volumetric data to 100 bar are also needed to correct existi g saturation heat capacity data to constant pressure values.
Although the modeling and experimental work relate directly to electrolyte systems common to geothermal brines, the results are applicable to such areas as biological fluids, battery electro lytes in aqueous and non-aqueous solvents, plating baths, waste effluents, materials corrosion from electrolyte systems, and marine chemistry.
The flow microcalorimirer has been designed for operation to 300 QC and bOO bar. It is a differential calorimeter, in which the heut capacity difference between water and an aqueous solution is determined directly. The calorimeter has been used to obtain heat capacity data for Na^SO^ solutions from 0.05 to 2.5 molal. The data extend

fro* 30 to 200°C at saturation pressure and at 200 bar. Work in progress will extend the temperature range of the data to 300°C. Precision of the data obtained 5* 3 x 10~* cal/deg g, and the agreement between the present data and that of other workers in a small region of overlap is excellent. The heat capacity data will be used to complete an evaluation and computer fit of all the thermodynamic data for JU^SO^.. A similar wtudy of MgSO^ solutions in also planned, aloog with an extension of the pressure range of th* (reasursaenta to 500 bar. The calorimeter will alac be rebuilt using a apecial corrosion resistant alloy, MO that heat capacity data can be obtained for other geotbermally important salts.
Modeling calculations during 1979 included a revision of the esrlier work of Silvester and Pitzer (1977) on aqueous "!aCl at saturation pressure to 300*fc. The new Debye-Huckel parameters (Bradley and Pitzer, 1979) w r e int'-ot'ueed as well as some experimental enthalpy data which had been published recently. Figures 1 and 2 show the osmotic coefficient and tbe heat capacity, respectively, and compare our calculated curves with experimental data shown as points. The agreement ia excellent except for the heat capacity at 300°C. Certain correction terms related to pressure derivatives of thermodynamic quantities were unavailable and were omitted; these are negligible at lower temperatures but not for the heat capacity at 300°C. Theae results were released as an LBL report (Pitzer et *1., 1979). Before general publication, however, the volumetric data *V»r aqueous NeCl, including our own measurements, will be modeled within the sane general system of equations. With pertinent thermodynamic relationships, this will generalize
09
0.8
m (molality)
Figure 1, The o(.aotic coefficient of aqueous NaCl; curveB are calculated, points ar*. experimental from sources cited by Pitzer et al., 1979.
(XBL 803-8837)
Figure 2. The total specific heat capacity ol" aqueous NaCl; details are the sane as for Figure 1.
(XBL 803-8336)
the treatment of v--ious properties to the above-saturation preidure daman. Also it will evaluate the correction terns aentioned above and allow a fully self-consistent treatment.
Reviews of the full system of modeling equations, including various applications, were prepared and presented (Pitzer, 1979a,b) to conferences on aqueous geochemistry and on the thermodynamics of aqueous systems with industrial application.
FUTURE WORK
Calorimetric and density measurements will continue for solutes of geochetaical interest as indicated above. Also, the modeling program is being extended to deal with above-saturation pressures. Since carbonic acid and bicarbonates are weak electrolytes, their dissociation equilibria must be considered in addition to the r-iual strong electrolyte effects. Our modelirg program will be extended in 1980 to include ca'Sanctes.

156
REFERENCES CITED
Bradley, D. J., and Pitzer, K. S.. 1979. Thermodynamics of electrolytes: 12, Dielectric properties of water and Debye-Huckel parameters to 350° and 1 kbar. J. Phy*. Cheat., v. 83, p. 1599.
Pitzer, K. S., 1973. Thermodynamics of electrolytes: I, Theoretical basis and general equations. J. Phys, Chen., v. 77, p. 268.
Pitzer, K. S-, 1979a, Characteriatics of very concentrated aqueous solutions. Berkeley, Lawrence Berkeley Laboratory, LBL-9660. , 1979b. Thermadynamit* of aqueour electrolytes at various temperatures, pressures, and compositions. Berkeley, Lawrence Berkeley Laboratory, LBL-9788.
Pitr.er, K. S., and Mayorga, G., 1973. Thermodynamics of electrolytes: II, Activity and
osmotic coefficient* for strong electrolytes with one or both ions univalent. J, fbya. Cham., T . 77, p. 2300. ,1974. Thermodynamic* of Electrolytes: III, Activity and osau>tic coefficients for 2-2 electreses. J. Sol. Chem., «. 3 t p. S39.
Pitzer, K. S. v and Kim, J. J., 1974. Thermodynamics of electrolytes: IV, Activity and osaotie coefficient* for nixed electrolytes. J. An. Chan. Soc., v. 96, p. 5701.
Pitzer, K* S., lradley, D. J., Roger*, P. 5. Z., and Peiper, J. C.» 1979* Thermodynamic* of high-temperature brine*. Berkeley, Lawrence Berkeley Laboratory, LBL-&973.
Silvester, L. F., and Pitzer, K. S., 1977. Tbermo-dynaaic* of electrolyte*: VIII, High temperature properties including enthalpy and beat capacity with application to sodium chloride. J. Phys. Chen., v. 81, p. 1622.
BEHAVIOR OF ROCK-FLUID SYSTEMS AT ELEVATED PRESSURES AND TEMPERATURES W. H. Somerton
INTRODUCTION
The objective of this project is to develop methods and apparatus for the measurement of rock-fluid properties at temperatures, pressures, and fluid-saturation conditions encountered in deep, high-temperature oil and gas reservoirs, geothermal reserveirs, and other subsurface reservoirs in which elevated temperatures are involved in the underground process. Properties being measured under simulated subsurface environmental conditions include porosity, permeability, and electrical resistivity factor; thermal properties, including thermal expansion, pore and bulk compressibilities; compressional and shear wave velocities, and the dynamic elastic constants derived from these properties.
Methods of measuring most of the above properties have be**n developed as reported in an earlier work (Soraerton, 1977). However, the presently available apparatuses permit measurement of, at the most, only two properties at a time '-.nd are limited to measuring temperatures of 200°C and stress of one kbar. It is difficult to correlate results of measurements of properties in different apparatuses, using different test specimens, and with the possibility of different temperature-stress histories. Therefore? a second objective of this work is to develop an apparatus in which all or most of the desired properties may be measured at the same tica on. the seme test specimen under identical test conditions. Basic design of this apparatus has been presented elsewhere (Somerton, 1979).
Measurements of physical properties and behavior of rock-fluid systems at elevated temptra-tures and pressures are difficult and time consuming. Therefore, a third objective of the present work is to develop models and correlations ttu-t will make possible the prediction of properties and behavior from more easily measured characteristics of the rock-fluid system. An example is
the progress made in modeling thermal properties. Having estimates of such characteriatic* as mineral composition, porosity, and grain size, models have been developed for predicting thermal conductivity under any fluid saturation condition at a base pressure and temperature. Correlations have also been developed to permit prediction of thermal behavior at other pressure and temperature condition*. Well log data may also be used to predict thermal properties.
RESEARCH ACTIVITIES FISCAL YEAR 1979
Much of the research accomplished during fiscal year 1979 has been reported by Chou (1979), Cruz (1979), Kuo (1979), Sahnine (1979), and Somerton (1979). Other work in progress by Ashqar, Chaffari, Greeowald, and Wong will be reviewed briefly in this report.
Rock Properties Apparatus
Design of the computer control for new oulti-properties measurement apparatus was completed and reported by Kuo (1979). This design is based on the assumption that a new LSI-11 microcomputer system will be employed since the existing PDP 11/34 computer would be inadequate for the purpose. The sequencing of measurements and the control of pressures and temperatures have been formulated, and the computer-interface components required for these operations have been designed.
The pressure vessel has been ordered and delivery is expected in early 1980. The vessel consists of a monolithic forging with closures at both ends. Working space within the interior of the vessel is 7 in. in diameter and 20 in. long. The vessel has a maximum allowable working pressure of 25,000 psi (1.7 kbars) and meets LLL safety rules for "manned area operation."
The confining pressure system will use a dia-phram compressor with argon as the pressuring fluid.
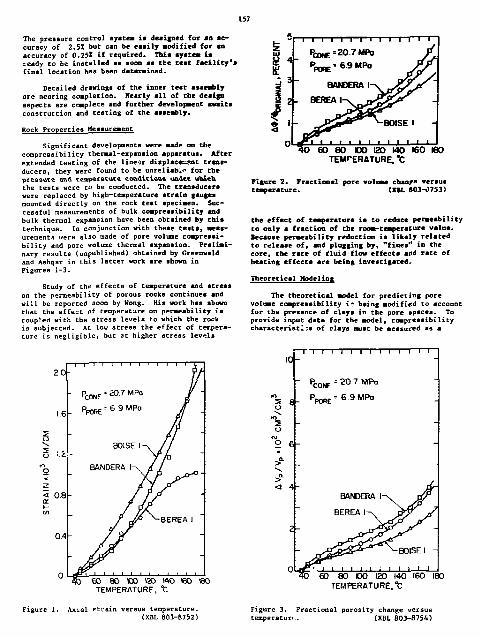
The pressure control system is designed for an accuracy of 2.5Z but can be easily modified for an accuracy of 0.252 if required. This system ia ready to be installed as soon as the test facility's final location has been determined.
Detailed drawings of the inner test assembly are nearing completion. Nearly all of the design aspects are complete and further development awaits construction and testing of the assembly. Rock Properties Measurement
Significant developments were swde on the compressibility thermal-expansion apparatus. After extended testing of the linear displacement transducers, they were found to be unreliable for the pressure wA temperature condition* uadtr vhich the tests were to be conducted. The transducers were replaced by high-temperature strain gauges mounted directly on the rock test specimen. Successful measurements of bulk compressibility and bulk thermal expansion have been obtained by this technique. In conjunction with these tests, measurements were also made of pore volume compressibility and pore volume thermal expansion. Preliminary results (unpublished) obtained by Greenwald and Ashqar in this latter work are shown in Figures 1-3.
Study of the effects of temperature and stress on the permeability of porous rocks continues and will be reported soon by Wong. His work has shown that the effect of temperature on permeability is coupled with the stress levels to which the rock is subjected. At low stress the effect of temperature is negligible, but at higher stress levels
BEREA I
4 0 60 8 0 100 120 MO 160 160 TEMPERATURE, *fc
Figure 2. Fractional pore vol use ehan** versus temperature. (XBL 003-3753)
the effect of temperature ia to reduce permeability to only a fraction of the room-temper*tore value. Because permeability reduction ia likely related to release of, and plugging by, "fines" in the core, the rate of fluid flow effects add rate of heating effects are being investigated*
Theoretical Modeling
The theoretical model for predicting pore volume compressibility i? being modified to account for the presence of clays in the pore Spaces. To provide input data for the model, compressibility characteristic of clays must be measured as a
loh
?. eh
2 eh
T I ! I I I I I I—I I I I
60 80 KB l» WO « ) « 0 TEMPERATURE, t
BOISE I
60 80 DO 120 140 160 180 TEMPERATURE, t
Axial Ftrain versUB temperature. (XBL 803-8752)
Figure 3. Fractional porosity change versus temperatun . (XBL 803-8754)

158
function of hydrostatistic stress and temperature. These measurements are in progress, and the data will be uaecJ by Greenwald in comparing model results with measured pore volume compressibilities.
Two of the completed reports provided information needed by Ghaffari for completion of the model for thermal conductivity of multi-fluid saturated porous media. The work of Crux (1979) showed rather conclusively that a grain size parameter needed to be included in the theoretical Model. The work of Sahnine (1979) on the other hand, demonstrated that there was only a slight correlation between thermal conductivity and sonic velocity in porous media. This is contrary to reports by other investigators and casts doubt on the use of sonic log data to predict in-situ thermal conductivities.
In other thermal work, Chou (1979) developed a one-dimensional fiaite-difterence model to test the importance of the VCC (vaporization—condensation-capillary) effect in causing heat transfer in porous media. His mode 1 results showed that the VCC effect is probably negligible in steam injection or production in subsurface formations. However, the effect may not be negligible in wellbore heat loss where heat-thief sands penetrated by the well-bote could extract large amounts of heat from injected or produced steam. One problem in using the model was the lsck of data on capillary and relative permeability for liquid-vapor systems. A possible application of this work is the extraction of these data by comparing model results with experimental data from an existing laboratory model. Su is conducting his own investigation of this subject and is developing a two-dimensional radial model for evaluating the importance of the VCC effect.
Wong has proposed an empirical equation to describe tha effect of temperature and stress on permeability. Be suggests the next steps should be to relate the effects of other properties of the roek-fluia system to the magnitude of permeability reduction. These properties being investigated include quartz and clay contents of the rock, velocity and salinity of the flowing fluid, and compressibility and thermal expansion coefficients of the rock-fluid system. Details of this work will be given in a later report.
PLANNED RESEARCH FISCAL YEAR 1980
Upon receipt of the pressure vessel, it will be installed and csated along with the compressor and pressure control system. The inner test assembly will bd constructed, and the several design elements will be tested and modified as required. Computer control equipment will be purchased and assembly and testing will be started. It should be possible to make initial tests on standard rock samples by the end of the year.
lock propertiea tests will continue* using the presently available apparatus, primarily to provide data for testing models and for testing new procedures to be used in the multiproperties apparatus. Measurements of bulk and pore compressibility and thermal expansions will be <sade over a wider range of test conditions and on several different rock types, rermesbility tests will also be continued to provide data for testing correlations &ud a theoretical model of the effects of temperature and stress on permeability.
Experimental techniques yet to be finalised include measurements of thermal conductivity by the probe method and electrical resistivity using * radial electrode system. The thermal conductivity probes have been designed and will be sent out for bids early this fi *al year. Testing Of the probes sad the method con be done in one of the present pressure vessels. Electrical resistivity will be measured using the outer sheathing of the thermal conductivity probes as the inner electrode. This method can also be tested in existing apparatus.
Two models are scheduled for completion during this fiscal year. The thermal conductivity model for multifluid saturated porous media will be completed by Ghaffari and the model for predicting the effect of stress on pore compressibility will be completed by Greenwald. Progress will be made on two other model. The permeability model developed by Vang will continue to be studied by Okeh. Asiiqar's wt-rk on bulk and pore thermal expansions will be continued by Janah, and he will begin development of * model of these properties.
REFERENCES CITED
Chou, C., 1979. Veporization-condecsatio-^-capillary (VCC) effects in oil recovery by steam injpotions. Berkeley, university of California, MS research report.
Cruz, J., 1979. The effect of grain size on thermal conductivity of fluid saturated media. Berkeley, University of California, MS research report.
Kuo, W., 1979. Computer control system for measurement of high temperature high pressure properties of rock-fluid systems. Berkeley, University of California, MS research report.
Sahnine, B., 1979. Relationship between sonic velocities and thermal conductivities of fluid saturated rocks. Berkeley, University of California, HS research report.
Somerton, V. H., 19.'7, Apparatus for measurement of properties and behavior of rock-fluid systems at high temperatures and pressures. Berkeley, University of California, Petroleum Engineering Laboratories report. , 1979. Status report on the design and construction of an apparatus for measuring the properties of TOCKS at elevated temper "ures and pressures. Berkeley, University or California, Petroleum Engineering Laboratories.

159
SOLUBILITY OF LOW ALBITE IN NaCl SOLUTIONS AT 25i°C J. M. Neil and J. A. Apps
INTRODUCTION
Understanding the solubility of the major rock-forming minerals in low temperature, hydrothermal environments is important for successful modeling of diagenetic or metasomatic processes; or for predicting the effects of injecting cooled, geothermal fluids into a geothermal reservoir; or for uaiog an aquifer for hot-water storage. Albite, one of the end-nembars of the feldspar uineral series, is an ideal candidate for the initial study because it is found in a wide variety of geological environments.
This is the third progress report on studies of the solubility of rock-forming Minerals in the aqueous phase. The initial report (Apps and Neil, 1978) dealt with the selection of low-albite starting material and its chemical and physical characterization. The second report (Neil and Apps, 1979) dealt with the initial experiments of albite solubility at 250 DC in 0.1 N IlaCl solutions. This report is a summary of the albite solubility measurements in varying NaCl concentrations at 250°C and in the presence of a water vapor phase.
EQUIPMENT
The equipment used for albite solubility measurements has been described previously (Neil and Apps, 1979). Several additions and modifications have been made to improve the raeasurenent of temperature and pressure within the autoclave and to increase the oystem's safety.
Initially the temperature was measured with a chrorael-alumel thermocouple and read from the Speedoraax H,- model S, strip chart recorder of the Leeds & Northrup Series 60 D.A.T. Control Unit. A second chromel-alumel thermocouple has been placed in the thermocouple well of the 1-liter autoclave and is connected to an Omega Model 2170 A-K digital thermometer which is accurate to ±1°C.
The pressure was initially measured on a 4-in.-diaraeter, 0 to 10,000 psi, Bourdon tube guage manufactured by Ashcroft and supplied by the autoclave manufacturer. The gauge was filled with water and isolated from the autoclave proper by a gauge isolator to prevent chemical attack of the Bourdon tube. A BLH model GP-HR, 0 to 10,000 psi, Kigh-Temperature Pressure Transducer with a BLH Model 450 Transducer Indicator has been added to the gauge side of the isolator to give greater precision pressure measurements. The transducer's sensitivity is rated at 3mV/V ±0.251, equivalent to a precision of ±10 pai.
The safety improvements made to the autoclave system include the addition of two more rupture disk assemblies to the high pressure line. One assembly °.s in the oil line between the pump and the oil-water separator; the other is in the water line between the oil-wattir separator and the valve that isolates the solution recharging reservoir from the rest of the system. This prevents any portion of the system from being isolated from a fail-safe pressure relief device, and these modi
fications put the entire system in compliance with the LBL safety requirements.
The thermocouple located in the furnace windings has been connected to an Omega Model 20 Limit Temperature Controller. This will shut off the furnace if it becomes hotter than the temperature set point of the controller or if the thermocouple fails.
EXPERIMENTAL PROCEDURES
The experiments! pruiudure followed in measuring the dissolution of albice has been described previously (Neil and Apps, 1979). However, several modifications have been made as a result of additional work and more refined data evaluation.
Each albite charge is sonicated in acetone to remove the very small (<1 \m) albite grains that adhere to the larger grains. This procedure is repeated until the acetane remains clear after 5 minutes of sonication. SEN images of the albite treated in this manner show very few fines adhering to the larger grains (Figure 1). Also, the residual solution id the autoclave at the end of an experiment is free of suspended fines.
By collecting and handling the aqueous samples as well as scssuring the pH under a COj-free nitrogen atmosphere, it has been possible to get stable measu-. ements for the pfl. The solution samples appear to be very efficient rcavengers of atmospheric COj. The nitrogen is passed rhrough a CO2 trapping agent (Ascorite) to remove any CJj contamination which might be present.
Two different techniques were investigated for sodium determinations in the aqueous phase. Neither specific ion poteic ".ometry (Orion Research, 1977a) nor atomic absorption spectrophotometry (AA) (Perkin-Eliner, 1976) have proven to be entirely acceptable. The electrode instability limits the accuracy to approximately 3S, while very large (on the order of 10*) dilutions cause an uncertainty of a similar magnitude for the higher NaCl (1.0 N to 0.01 N) concentrations with the AA technique. Because it is faster, the AA technique is preferred although the Na electrode is still used for solution? with very high Na concentrations.
Two different techniques were also evaluated for chloride determinations. Both methods use a chloride—specific ion electruae. In one method the potentials of the samples are compared with the potentials of standards with kn^ n chloride concentration, while in the other the electrode is used to detect the end-point of a silver nitrate tritration for chloride (Orion Research, 1977b). The methods gave similar results although there was a small systematic error. The potentiometric method was selected becasue it is more rapid.
Samples were analyzed for calcium in the first albite solubility run and for potassium in subsequent runs by atomic absorption spectroscopy. Both

Figure 1. (a) Starting material before sonication to remove adhering fines, (b) Starting material after soni-ation showing the degree to which adhering fines were removed.
U 3 B 804-5029, XBB 799-11265)
elements are normally present in insignificant concentrations. There were, however, several experiments where there was some potassium contamination that was due to the use of 1 M KOH between experiments to remove scale adhering to the autoclave. More stringent cleaning procedures have eliminated this problem.
The surface area of the 65" to 100 + mesh sized albite has not been determined. It is difficult to make accurate measurements on this size fraction using conventional techniques becasue of the small specific surface area.
Summary of Experiments
Table 1 lists all the albite solubility experiments which have beem completed to date, and it notes operating conditions and the observations made during each run.
Evaluation of Data
After the chemical analyses of each experimental trial are completed, the results are evaluated using a proprietary computer code, FASTPATH, developed by Kennecott Corporation. This code, which models aqueous solution-Mineral Interactions and reactions progress, is siailar in its function and was derived from an earlier code by Helgeson (1969a). The code calculates the concentration of the aqueous species present, their activities, and she activity quotients, log Q, of solid phases that can appear in the system. This information allows the evaluation of the approach to equilibrium between the albite and tbe aqueous phase and indicates the consistency of the data between runs.
The general procedure is to calculate the initial apeciation in solution at 25°C by specifying the pH and balancing the charge by adjusting the sodium concentration until electro-neutrality is achieved. Comparison can then be made between the measured and calculated concentrations of sodium as a measure of the quality of the analytical data. The new sodium value is then specified to calculate the distribution of species at 250°C, and the minor corrections to electro-neutrality taken up by adjusting the concentration of H*. Figure 2 illustrates the distribution of species as a function of time for albite equilibrated iu 0.1 N NaCI starting solution. The saturation concentration of H4S1O4 in equilibrium with quartz is also plotted on the figure for comparison.
^°S Q(albite) c a n D e calculated from the solubility reaction defined as:
NaAlSi30g + 4H* + 4H 20 = Ha* + A l + + + • SH^SiO^
_ [»a--i[Al+-M-nH4Si04]3
(albite) " [H +] 4lH 20] 4[NaAlSi 30 8]
Log Q, where the square-bracketed species denote activities of those species calculated from the FASTPATH species distribution, is plotted in Figure 3 for the run illustrated in Figure 2, to show the approach to apparent equilibrium. Because of the observed occurrence of analcime as a product in several of the runs, the analogous log Q(analcime)' where
[Ha-,-][Al-t"f+JfH4Si04]2
(analcime) [H +] 6[H 20] [NaAlSi^-^O]
is also included. Log K< aibi c e) and log X(analcimeJ, calculated from calorimetric data, are also plotted in Figure 3 and are enclosed by an uncertainty envelope expressing the estimated error in the calorimetric data of ±1.0 kcal. Agreement between the independently calculated log Qs and log Ks are quite good after steady-state conditions have been attained. This also reflects indirectly the overall precision }f the analytical ''.ata.
Comparison of log Q( aibite) from several runs with different initial concentrations of sodium chloride starting solutions and with plain water

161
Table 1. Albite dissolution experiments.
Solution Weight albite
<t>
Duration of run
(hr)
Temperature Run (Oc)
Compoaition Volume (H Nacl) ( .1 )
Weight albite
<t>
Duration of run
(hr)
•unbar of aaaplea taken
during run
250
205
0.1 700
0.1 700
17.77
25.00
72
102
13
12
Al-Si ppt. formed before aaaplea vere analysed.
20 ml aaaple added to 5 ail 0.01 H KOB to prevent M-Si ppt.
13 Hydrazine buffered the pH ( in sample bo t t l ea ) .
17 Saanlea centrifuged to remove any auapended •a ter ia l prior to adding 0.01 M EOH.
250
250
0.1
0.1
750
770
25.00
25.62
55
105
15
15 Starting aater ia l sonicated; pH aeasured under S 2 .
Al-Si ppt. while samples were centrifuged.
250
250
0.01 770 25.65 100 13
0.1 770 25.71 25 15 Sampled every hour from 10-20hr.
0.1 750 ~20 g material
recovered fron Run J
480 11 Anolcime scale recovered from side; cemented albi te in bottom of autoclave.
0.1 750 w 75 ppm
S1O2 spike
0.0 780
Sampled directly into bottle with KOH to avoid problem of Run H.
Analcime scale on the side; cemented mass of albite on the bottom of autoclave.
Effect of different sampling procedures tested.
Mass of cemented albite on the bottom.
^Starting material was the albite recovered from Run J. By allowing the system to operated for an extended period of time it was hoped that large crystals of the secondary phases could be recovered.
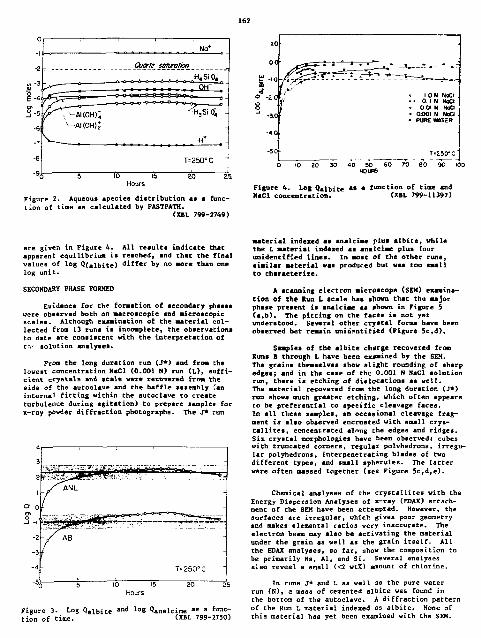
Figure 2. Aqueous species distribution as a function of tine as calculated by FASTPATH.
(XBL 799-2749)
Figure 4. Log Qalbite as a function of tine and HaCl concentration. (XBL 799-11397)
are given in Figure 4. All results indicate that apparent equilibrium is reached, and that the final values of log Q(aibite) differ by no sore than one log unit.
SECONDARY PHASE FORMED
Evidence for the formation of secondary phases were observed both on macroscopic and microscopic scales. Although examination of the material collected from 13 runs ii incomplete, the observations to date are consistent with the interpretation of tr,< solution analyses*
From the long duration run (J*) and from Che lowest concentration NaCl (0.001 H) run (L), sufficient crystals and scale veTe recovered from the side of the autoclave and the baffle assembly Can internal fitting within the autoclave to create turbulence during agitation) to prepare samples for x-ray powder diffraction photographs. The J* run
Figure 3- Log Q aibite a n d l o 8 Qanalcime a B a faction of time. (XBL 799-2750)
material indexed as analcime plus albite, while the L material indexed as analcime plus four unidentified lines. In most of the other runs, similar material was produced but was too small to characterize.
A scanning electron microscope (SEM) examination of the Run L scale has shown that tha major phase present is analcime m» shown in Figure 5 (a,b). The pitting on the faces is not yet understood. Several other crystal forms have been observed but remain unidentified (Figure 5c,d).
Samples of the albite charge recovered from Runs B through L have been examined by the SEM. The grains themselves show slight rounding of sharp edges; and in the case of the 0.001 N NaCl solution run, there is etching of dislocations as well. The material recovered from the long duration (J*) run shows much greater etching, which often appears to be preferential to specific cleavage faces. In all these samples, an occasional cleavage fragment is also observed encrusted with small crystallites, concentrated along the edges and ridges. Six crystal morphologies have been observed: cubes with truncated corners, regular polyhedrons, irregular polyhedrons, interpenetrating blades of two different types, and small spherules. The latter were often massed together (see Figure 5c,d,e).
Chemical analyses of the crystallites with the Energy Dispersion Analyses of x-ray (EDAX) attachment of the SEM have been attempted. However, the surfaces are irregular, which gives poor geometry and makes elemental ratios very inaccurate. The electron beam may also be activating the material under the grain as well as the grain itself. All the EDAX analyses, so far, show the composition to be primarily Na, Al, and Si. Several analyses also reveal a small (<2 wtt) amount of chlorine.
In runs J* and L as well as the pure water run (N), a mass of cemented albite was found in the bottom of the autoclave. A diffraction pattern of the Run L material indexed as albite. None of this material has yet been examined with the SEM.

2/i.m IOJUHI
[ i/im
£*? Fig. 5. SEH images of secondary phases formed during the dissolution of albite at 250°C: (a) analcine polyhedron, (b) massive analcime, (c) blades, type 1, (d) blades, type 2 on nassive analcime. (e) cubes with truncated corners, (f) irregular (hexagonal?) polyhedron.
[(a) XBB 804-5031. (b) 80^-5030, (c) 799-11277. (d) 804-503*. (e) SOi-5333, (f) 799-11270]
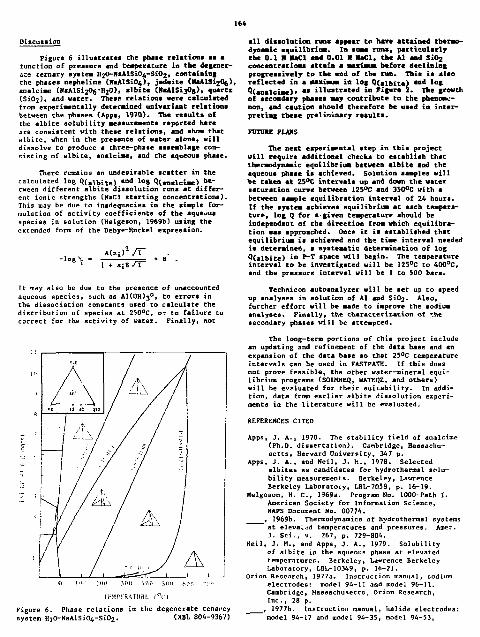
164
Discussion Figure 6 illustrates the phase relations as a
function of pressure and temperature in the degenerate ternary system l^O-HaAlSiOi-SiOj, containing the phsses nepheline (NaAlSiO^), jadeite (HaAlSijO^), analcime (NaAlSi20g'H20}, albite dfaAlSijOg), quarts {S1O2), end water. These relations were calculated from experimentally determined univariant relations between the phases (Apps, 1970). The results of the albite solubility measurements reported here are consistent with these relations, and show that albite, when in the presence of water alone, will dissolve to produce a three-phase assemblage consisting of albite, analcime, and the aqueous phase.
There remains an undesirable scatter in the calculated log Q{ aibite) * a d l o & QUnalcime}. 0* -
Cween different albite dissolution runs at different ionic strengths (NaCl starting concentrations). This may be due to inadequacies in the simple formulation of activity coefficients of the aqueous species in solution (Helgeson, 1969b) using the extended form of the Debye-Huckel expression.
A<*i)2/T -log-y. = i — * B . 1 1 + «iB ST
It may also be due to the presence of unaccounted aqueous species, such as A1(0H)3°, to errors in the dissociation constants used to calculate the distribution of species at 250°C, or to failure to correct for the activity of water. Finally, not
IPMPI-'RATIJRI. f°C! Figure 6. Phase relations in the degenerate tenancy system H 20-NaAlSi04-Si0 2. (XBL 804-9367)
all dissolution runs appear to nave attained thermodynamic equilibrium.. In some runs, particularly the 0.1 H KaCl and 0.01 M MaCl, the Al and Si0 2
concentrations attain a maximum before declining progressively to the end of the run. This ia also reflected in a maximum in log Q(albite) *n<* l o * Q(analcime)' •* illustrated in Figure 2. The growth of secondary phases may contribute to the phenomenon, and caution should therefore be used in interpreting these preliminary results.
FUTURE PLANS The next experimental step in this project
will require additional checks to establish that thermodynamic equilibria* between albite and the aqueous phase is achieved. Solution samples will be taken at 25°C intervals up and down the water saturation curve between 125°C and 350°C with a between sample equilibration interval of 24 hours. If the system achieves equilibrium at each temperature, log Q for a-given temperature should be independent of the direction fro* which equilibration was approached. Once it is established that equilibrium is achieved and ths time interval needed is determined, a systematic determination of log Q(albite) i-n P -? space will begin. The temperature interval to be investigated will be 125°C to 400°C, and the pressure interval will be 1 to 500 bars.
Technicon autoanalyzer wilt be set up to speed up analyses in solution of Al and Si0 2. Also, further effort will be made to improve the sodium analyses. Finally* the characterization of 'he secondary phases will be attempted.
The long-term portions of this project include an updating and refinement of the data base and an expansion of the data base so that 2S°C temperature intervals can be used in FASTPATH. If this does not prove feasible, the other water-mineral equilibrium programs (SOLMHEQ, HATEQZ, and others) will be evaluated for their suitability. In addition, data from earlier albite dissolution experiments in the literature will be evaluated.
REFERENCES CITED Apps, J. A., 1970. The stability field of analcime
(Ph.D. dissertation). Canbridge, Massachusetts, Harvard University, 347 p.
Apps, J. A., and Neil, J. h., 1978. Selected albites as candidates for hydrothermal solubility measurements. Berkeley, Lawrence Berkeley Laboratory, LBL-7058, p. 16-19.
Helgeson, H. C , 1969a. Program No. 1000-Path I. American Society for Information Science, NAPS Document No. 00774. , 1969b. Thermodynamics of hydrotheraal systems at elevalcd temperatures and pressures. Amer. J. Sci., v. 267, p. 729-804.
Neil, J. M., and Apps, J. A., 1979. Solubility of albite in the aqueous phase at elevated temperatures. Berkeley, Lawrence Berkeley Laboratory, LBL-10349, p. 16-21.
Orion Research, 1977a. Instruction manual, sodium electrodes: model 94-11 and model 96-11. Cambridge, Massachusetts, Orion Research, Inc., 28 p. , 1977b. Instruction manual, halide electrodes: model 94-17 and model 94-35, model 94-53,

165
and *iodel 96-17. Cambridge, Massachusetts, Analytical methods for atomic absorption spec-Orion Rsearch, Inc., 31 p. tra photometry. Norvalk, Connecticut, Perkin-
Perkin-Elnier, i976. Na standard conditions, in Elmer Corp.
THERMODYNAMIC PROPERTIES OF SILICATE MATERIALS I. S. E. Carmichael, fa. S. Ghiorso, L. Moret, S. A. Nelson, M. Rivers, and J. Stebbins
INTRODUCTION
The main emphasis of this research prograsi is to measure various properties of silicate liquids, especially as functions of composition and temperature. Thus one objective is to be able to describe the density of any natural silicate liquid as a function of pressure and temperature, which at the moment cannot be done. This program will also contribute significantly to the data on the molar heats of fusion of silicate materials, for few are known at the moment, and until they are, no crystallization paths of multicomponent silicate liquids can be calculated.
ACTIVITIES IN 1979
One of the goals of igneous petrology is to understand, on a quantitative level, the relationships among temperature, pressure and the compositions of coexisting solids crystallizing from magnetic (natural silicate) liquids. Enough thermodynamic data on silicate liquids are available over a sufficiently broad temperature and compositional range to allow certain generalizations to be made regarding the solution behavior of oxide components in these liquids. The observations of the absence of excess volume (Nelson and Carmichael, 1979) and of excess heat capacity CCarmichael et al., 1977) have been considered along with publisned experimental res-aits on the compositions of solids and liquids coexisting at elevated temperatures and pressures, and combined with thermodynamic data obtained from P-T fusion curves for the pure components, to yield a regular solution expression for the free energy of mixing of silicate liquids.
This niodel can be inverted and used to predict temperatures from the compositions of coexisting quenched mineral-glass pairs (volcanic rocks). It has proved reliable in predicting liquid phase immiscibility in lunar basalts and rocks of ande-sitic and fhyolitic composition and accurately yields silica activities which are independently corroborated by solid-liquid buffer assemblages.
Attempts are currently being mude to expand the compositional range of the experimental data base used t.o evaluate the thermodynamic excess properties (AH e x) necessary for construction of the free energy surface. Computer software is also under development to calculate, using the decived solution model, the cooling products of natural silicate liquids of variable composition.
Few systematic and careful measurements of the compressibility of silicate liquids have been made, and preliminary investigations of ultrasonic velocities in liquids Msing solid buffer rods demonstrated that multiple modes and echoes within the
rods masked the arrival of weak signals that had passed through the liquid. He have pursued, therefore, a design involving a liquid buffer medium. The silicate liquid cample float* on a column of liquid metal (65Z G«, 152 Sn, 20* In). The sample is within a furnace at T < 1500°C, while the base of the liquid metal column, which is supported by an ultrasonic transducer, is water cooled outside the bottom of the furnace. The base of the tungsten reflector rod is immersed in the silicate liquid, and is precisely moved by a micrometer assembly mounted on top of the furnace. The time delay between the echo from the Ca-silicste liquid interface and the silicate-tungsten interface is measured as a function of reflector position, using a modification of the pulse-echo overlap method. To date we have measured the velocity of standard materials at room temperatures to determine the sensitivity and accuracy of the technique. We obtain a value for the velocity of sound in deionized viler at 23.4°C of 1492.14 m/sac, which is within 0.011 of the value published by the Naval Research Laboratory, 1972. Accuracy is limited by our capability to control and measure the temperature of the water. We have tested a column filled with liquid metal (Kg) at 23-5°C, and obtained 1448.9 ra/sec within 0.1S of the accepted value. The apparatus to conduct high temperature measurements has recently been completed, and such experiments arc about to begin.
During 1979, a venerable high-temperature drop calorimeter was brought back into operation with several modifications to improve precision and accuracy. The instrument can measure the enthalpy difference between furnace temperatures as high as 1880 K and the calorimeter teoperature of 300 K, for a wide variety of materials. After a period of testing and calibration, a program was begun to determine enthalpies and heat capacities of glasses and liquids in the system NaAISi30g-CaAl2Si20g-CaHgSi2Cft. This system is a relatively simple model of many naturally occurring igneous rock compositions, and is therefore useful in understanding geologically important crystallization and melting phenomena. Deterninations of mixing heats will also help constrain models of solution chemistry, which may in turn be generalized to more complex silicate systems.
Measurements on five compositions along the NaAlSijOg-PaA^SijOg join have been completed. Of immediate iterest is a new determination of the heat of fusion of anorthite, whose melting, poio.t of L830 K makes experiment on the pure composition difficult, and has led to widely varying estimates of this fundamental property. The combination of our data with published solution calorimetric results gives a heat of fusion at the melting point

166
of 32.0 ± 0.3 kcal/mol, with a heat capacity of 102 ± I cal/mol/k.
Our study of the density of silicate liquids began in 1978, was completed in 1979* and valuei for the partial molar volumes of eight oxide component F as a function of temperature were derived. It was found that within the experimental limits of 1 to 2%, silicate liquids mix ideally with respect to volume over the composition-temperature range of the experiments; these results have been reported by Nelson and Carmichael (1979).
A Perkin-Elmer differential scanning calorimeter has been used in two studies to determine the heat capacity at constant pressure ( C p ) . Sixteen compositions in the system NaAlSi^Og-CaAl2Si20g-CaMgSi20g have been measured in the range 300 to 500 K with a view to establishing the mixing properties in the metastatic glassy state. The second study is designed to measure the effect of coordination changes in silicate liquids as a function of pressure. Under high pressure, the coordination change of aluminum with oxygen changes from fourfold to sixfold, c,early demonstrated in the stability of minerals at high pressure with respect to those at low pressure. Coordination changes in liquids at high pressures will markedly affect the physical properties of these liquids, such that the liquids may in fact be more dense than the aolids from which they were derived. Simply put, the bouyancy drive for liquids to reach the surface of the earth may disappear at high pressures. Presently missing is decisive evidence for the existence of this coordination change in silicate liquids and, of the techniques available to identify this change in coordination, the change in heat capacity should be one of the most effective.
Turning now to experiments at comparatively low temperatures, the utility of mineral solubility experiments lies in the potential for extracting thermodynamic data from measured hydrolysis con-
CHEMICAL TRANSPORT IN NATURAL SYSTEMS C. L. Carnahan
Problems involving the transport of chemical species in porous or fractured flow systems, accompanied by chemical reactions, arise frequently in geochemical investigations. Such investigations range from studies of ore deposition ir. past geological time to predictions about the fate of nuclear waste depositories thousands of years from now. On a more immediate time scale, consideration of chemical transport processes is an important part of evaluating environmental effects and possible biological hazards of, for example, subsurface disposal of toxic wastes, acid mine drainage, in-situ retorting of oil shale, and oth^r disturbances of nature caused by human activities.
Chemical transport processes in natural systems are, in general, very complex and very difficult, if not impossible, to simulate in extreme detail by mathematical and numerical models. A large body of WO:K has treated various isolated aspects of c^omical transport, yet much work remains
atants over a wide temperature range. Furthermore, whether dissolution be congruent or incongruent, useful kinetic data can always be obtained as the reactions tend towards equilibrium. We hav initiated a programs to measure solubility products of two common hydrothermal minerals, kaolinite [Al 2Si 20 5(OH)4) and a1unite lKAl 3(SO A) 2(OH) 6], in dilute solutions of hydrochloric and sulfuric acids, respectively, over the temperature range 30 to 90°C and 1 bar. These two minerals were chosen because of their common occurrence as hydro-thermal alteration products and the high uncertainties in existing thermodynamic data (AHf) for these phases at 25°C. Purified natural mineral samples are being used. The experiments are carried out in a thermally equilibrated shaker/water bath, end solutions (200 mis) are contained in Teflon bottles. Solubility is determined from chemical analyses of the fluids, by computation of the activity product of the appropriate mineral hydrolysis reaction. Preliminary data from unreversed alunite runs at 90°C indicate a AHf 25°C ™°re positive by 16.7 kJ (about 4 kcals) than that reported by Kelley et al. (1946).
REFERENCES CITED
Carmichael, I. S. E., Nicholls, J., Spera, F. J., Wood, B. J., and Nelson, S. A., 1977. High temperature properties of silicate liquids: applications to the equilibration and ascent of basic magma. Phil. Trans. R. Soc. Lond., A 286, p. 373-431.
Kelley, K. R., Schemate, C. H-, Young, F. E., Haylor, B. F., Salo, A. E. , and Juffman, E. H. r
1946. Thermodynamic properties of ammonium and potassium alums and related substances with reference to extraction of alumina from clay and alunite. U.S. Bur. Mines Tech. Paper #686, 104 p.
Nslson, S. A., and Carmichael, I. S. E., 1979. Partial molar volumes of oxide components in silicate liquids. Contrib. Mineral. Petrol., v. 71, p. 117-124.
to be done. This project -,".s an investigation of fundamental thermodynamic aspects of solute transport with chemical reactions, including explicit consideration of irreversible processes in derived models. Thus, the approach is strongly based on the thermodynamics of irreversible processes, and leads to mathematical descriptions of transport processes which sre different from classical descriptions in some important respects.
To establish a basis against which future results could be compared, analytical solutions were derived for the classical transport equation (in which gradients of mass concentration are the driving forces for diffusive transport) with chemical sorption obeying linear rate expressions. These solutions are inherently useful in the context of the classical theory. They are derived for point releases of solute into uniform, three-dimensional fields of groundwater flow velocities,

167
resulting in a distribution of solute in groundwater wh^ch is symmetrical about ar axis parallel to the direction of flow. The solutions for point releases can be used to develop solutions for releases from extended sources (lines, planes f volumes) by integration with regard to the appropriate spatial diaension(s). Other characteristics of the derived solutions are different coefficients of longitudinal and transverse hydrodynamic dispersion and radioactive decay of the transported solute. Solutions were obtained for time-dependent (nonequilibriua) sorption following three solute injection characteristics: instantaneous injection of a finite oass of solute, continuous injection of solute varying in time, and injection for a specified time followed by transport with no further injections. Solutions were obtained for solute concentrations in the fluid phase and on the solid phase as functions of location and time. The solutions obtained are not expressible directly in terms of known mathenatical functions. Instead, solutions have the form of single or double integrals* with regard to time, of products of known functions, e.g., products of exponential functiona and Bessel functions. Numerical results must be computed using numerical quadrature methods; computer codes co perform these calculations have been written.
When account was taken of changing populations of sorption sites on the solid phase, a nonlinear rate expression for nonequilibrium sorption and desorption was obtained; when this expression was
INTRODUCTION
An important aspect of the development and use of geothermal energy is our use of thermodynamic and transport data for hot brines, which transport heat, and for vapors, which drive turbines to produce electricity, although geothermal brines contain a large number of dissolved electrolytes and gases, the main constituent is NaCI. Consequently, modeling and other studies that require basic data on geothermal brines are generally based on those of aqueous NaCI solutions (Lyon and Kolstad, 1974; Silvester and Pitzer, 1977). Although data on many basic properties are needed, this report covers a survey of the available data on the thermal conductivity of aqueous NaCI solutions for regions of geothermal interesc: temperatures to 350°C, pressures to 500 bars (50 HPa), and concentrations up to saturation.
The published literature on the thermal conductivity of NaCI solutions to high temperatures is not extensive; this is especially true for studies of NaCl at temperatures exceeding 80°C. Only one series of measurements are available to 150°C: these are the data published by KOTOSi and Fabuss for application to seawater desalination (Fabuss and Korosi, 1968; Korosi and Fabuss, 1968). By far, the most extensive data are contained in graphical form in the publication by YuBufova et al. (1975) with over 50 data points between 100°C and 330°O.
coupled to the classical solute transport equation, the resulting nonlinear system was not solvable analytically. An algorithm for numerical simulation of this system was constructed.
Introduction of the formalism of the thermodynamics of irreversible processes produced a transport equation in which the driving force for diffusional transport is the transported solute's chemical potential gradient. The time-dependent form of the transport equation is then nonlinear because of the nonlinear relationship between mass concentration and chemical potential of a solute. However, the transport equation for the steady state is linear because temporal derivatives of mass concentrations do not appear. Also, chemical reaction rates are now expressed in terms of their thermodynamic affinity, a linear combination of chemical potentials of reactants and products. Because of these simplifying features, simple steady-state syste-as with chemical reactions were studied before proceeding to time-dependent systems. The initial studies of steady-state systeas pointed out the possibility of using a minimum property of such systems as a tool for analysis of complex reacting and diffusing systeas. This property is a nonzero, minimum value of the rate of entropy production by irreversible processes in the steady state of an open system. It is analogous to the minimum value of Cibba free energy reached by a closed system at equilibrium. Use of this property for analysis of steady-state systems is currently being investigated.
However, accurate values cannot be read from the graphs.
Unless otherwise noted, the data were compiled from the original publications. Numerical values were converted where necessary to units of °C, molal concentration, and W / Q * ° C . The density data needed to convert molar to molal concentrations were obtained from the paper by Rowe and Chou (1970). Data on the thermal conductivity of water and the corresponding correlation equation are contained in publications of the International Conference on the Properties of Steam (Haywood, 1966; Kestin and Whitelaw, 1966).
Additional information on the theory and instrumentation is obtained from Thermal Conductivity (Touloukian et •*!., 1970); theory and correlations from che publications by Kestin and Whitelaw (1966), Riedel (1951), Korosi and Fabuss (1168), Fabus*; and Korosi (1968), and Yusufova et al. (1975'. Tabulated data for sodium chloride solutions are given in Table 1. Of special interest are the survey by Jamieson et al. (1975), and the correlation developed for sea water by Jamieson and Tudhope (1970).
Scope of Compilation
The time span covered is mainly from 1929 to 1979; earlier data are found in the International Critical Tables (Washburn, 1929). Besides data on
THERMAL CONDUCTIVITY OF AQUEOUS NaCI SOLUTIONS FROM 20 iC TO 330°C H. Ozbek and S. L. Phillips
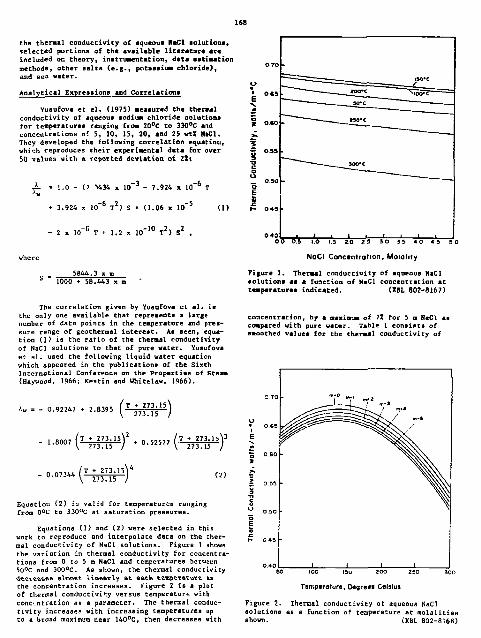
the thermal conductivity of aqueoua MaCl aolutions, selected portions of the available literature are included or. theory, instrumentation, data estimation methods, other salts (e.g., potassitmt chloride), and sea water.
Analytical Expressions and Correlations
yusufova et el. (1975) measured the thermal conductivity of aqueous sodiusi chloride solutions for temperatures ranging from 20°C to 330°C and concentrations of 5, 10, 15, 20, and 25 vtt HtCl. They developed the following correlation equation, which reproduces their experimental data for over 50 values with a reported deviation of 21;
JL * l.o - O <»434 i 10 - 7.924 x 10
-5
2 x 1 0 _ R T + 1.2 x 10" 1 0 T 2 ) S 2 ,
1000 + 58.443 x i
T\\e correlation given by Yusufova et al. is the only one available that represents a large number of data points in the temperature and pressure range of geothermal interest. As seen, equation (1) is the ratio of the thermal conductivity of NaCl solutions to that of pure water. Yusufova et al. used the following liquid water equation which Appeared in the publications of the Sixth International Conference on the Properties of Steam (Haywood, 1966; Kestin and Whitelaw, 1966).
X w . - 0.92247 + 2.8395 / T • 273.15\ \ 273.15 /
Equation (2) is valid for temperatures ranging from 0°C to 330°C at saturation pressures.
Equations (1) and (2) were selected in this work to reproduce and interpolate data on the thermal conductivity of NaCl solutions. Figure 1 shows the variation in thermal conductivity for concentrations from 0 to 5 m NaCl and temperatures between 50°C and 300°C. As shown, the thermal conductivity decreases aloGst linearly at each tMaperatutc fcs the concentration increases. Figure 2 is a plat of thermal conductivity versus temperature with concentration as a parameter. The thermal conductivity increases with increasing temperatures up to a broad maximum near 140°C, then decreases with
OTO
OC5
I , = = = ^ ^ = = - iSO'C
/ ; . ZOO'C NTSPc" = =
- ~~~~-- MO"C
•
SOO'C
-
* • • . 1 \ 1 1 0 0 0.5 1.0 1.3 2.0 2 3 3 0 3 5 «~0 « 5 5 0
NaCl Concentration, Molality
Figure 1. Thermal conductivity of aqueoua NaCl solution! as a function of NaCl concentration at temperatures indicated. (XBL 802-8167)
concentration, by a maximum of IX for 5 a NaCl as compared with pure water. Table 1 consists of smoothed values for the thermal conductivity of
C.T0 - m - o - . • 1 I m'2
1 m-3 / m-4
C.T0 -^Z- -g
m'2 1 m-3
/ m-4
^ <y -. o ^ <y -. • 1
0.65 W^ v^\ / E Vgr N. n
S 0.60 •
* >> •• — £ 0.35 - \Svv\ w 3 T» •C o U 0.50 x O E fe c K 0 45
0.40 " i I I
Tamparofure, Degress Celsius
Figure 2. Thermal conductivity of aqueous NaCl solutions aa a function of temperature at molalities shown. i'XBL 802-8168)

169
Table 1. Recoaawnded values for the thermal fro. Equation! (!) and (2), tt/«-°C
Teaperature ^ ^ ^ ^ ^ ^ ^ ^ ^ ^ ^ (°c) ~~o r
20 0.603 0.596 30 0.618 0.611 40 0.632 0.624 50 0.C43 0.636 60 0.653 0.646 70 0.662 0.655 80 0.670 0.663 90 0.676 0.669
100 0.681 0.674 110 l/.684 0.677 1:0 0.687 0.679 130 0.688 0.680 140 0.688 0.680 150 0.687 0.679 160 0.684 0.677 170 0.681 0.673 180 0.677 0.669 190 0.671 0.663 200 0.665 0.656 210 0.657 0.648 220 0.648 0.640 230 0.639 0.630 240 0.628 0.619 250 0.616 0.607 260 0.603 0.594 270 0.589 0.5B0 280 0.574 0.J65 290 0.558 0.548 300 0.541 0.531 310 0.523 0.512 320 0.503 0.493 330 0.482 0.472
aqueous NaCl solutions from 20°C to 330°C ove^- the concentration range 0 to 5 n.
Sunmary and Conclusions
The correlation in Equation (1) generally reproduces the experimental data to better than ±22 between 20°C and 80°C; an exception are r^>& data of Korosi and Fabuss where the deviation ranges from +5.3 to +13.81. Between i00°C and 150°C, the deviation between the calculated values and the data of Korosi and Fabuss increases to +31.62 at 150°C. However, we assume their values to be incorrect partly because they are consistently higher than the other values at temperatures below 80°C, and partly because Korosi and Fabuss felt their measurements should be considered tentative (Korosi and Fabuss, 1968; FabusB and Korosi. 1968; Jamieson and Tudhope, 1970). In addition, the values obtained for sea water concentrations to 150°C are consistently lower than those of Jamieson and Tudhope.
PLANNED ACTIVITIES IN FISCAL YEAR 1980
Fiscal year 1980 is expected to see a revia:?" of our previous work on the viscosity of NaCl selu-
ivity of aqueous NaCl solutions, calculated
Concentration (•> 2 3" I 5~
0.59G 0.585 0.580 0.577 0.605 0.600 0.595 0.592 0.618 0.6J3 0.609 0.605 0.630 0.625 0.621 0.617 3.640 0.635 0.631 0.627 0.649 0.644 0.640 0.636 0.657 0.652 0.647 0.643 0.663 0.653 0.653 0.649 0.668 0.662 0.6>S 0.654 0.671 0.666 0.661 0.658 0.673 0.668 0.664 0.660 0.674 0.669 0.664 0.661 0.674 0.669 0.664 0.660 0.673 0.667 0.663 0.659 0.670 0.665 0.660 0.656 0.667 0.661 0.656 0.652 0.662 0.656 0.651 0.647 0.656 0.650 0.645 0.641 0.649 0.643 0.638 0.633 0.641 0.635 t.630 0.625 0.632 0.626 0.62'J 0.616 0.622 0.616 O.olO 0.605 0.611 0.604 0.599 0.594 0 599 j.592 0.586 0.581 0.586 0.57? 0.573 0.567 0.171 0.564 0.558 0.553 0.556 0.549 0.543 0.537 0.540 0.532 0.526 0.520 0.522 0.515 0.508 0.503 0.504 0.496 0.489 0.484 0.484 0.476 0.470 0.404 0.463 0.455 0.449 0.443
tions to include recent data to 350°C. We also expect to expand our evaluation by surveying the basic properties of selected elements with relevance to nuclear waste isolation.
REFEF2NCES CITED
Fabuss, B. H., and Korosi, A., 1968. Properties of sea water and solutions containing sodium chloride, potassium chloridt, sodium sulfate and magnesium sulfate. Washington, D.C., U.S. Department of the Irrerior, Office of Saline Water Resource Development Program, report 384.
Haywood, R. W., 1966. 6th Intl. Conf. on Properties of Steam. Trans, ASME, Jourrn.' of Engineering and Power, v. 88, p, 63.
Jamieson, D. T., and Tudhope. J. S.. 1970. Physical Properties of Sea Water Solutions. Desalination, v. 6, p. 393.
Jam'eson, D. T-, Irving, J. B., and Tudhcpe, J. S. , 1975. Liquid thenaal condictivity: A data survey to 1973. Edinburgh, Her Majesty's Stationery Office.
Kestin, J., and Whitelaw, J. H., 1966. 6th Intl. Conf. on Properties of Steam. Trans. ASME,

170
Journal of Engineering and Power, v. 88, p. 82. Korosi, A., and Fabuss, B. M., 1968. Thermophysical
properties of saline water- Office of Saline Water Resource Development Program, report no. 363.
Lyon, R. N., and Kolstad, C. A., eds., 1974. A recommended research program in geothermal chemistry. U.S. Department of Energy, WASH-1344.
Riedel, L., 1951* Thermal Conductivity of Aqueous Solutions of Strong Electroiyutes- Cheaw Ing. Technik., v. 23, p. 59-
Roue, A. H., and Chou, J. C. S.. 1970. PVTC Relation of Aqueous NaCl Solutions. Journal of
INTRODUCTION
Lawrence Berkeley Laboratory is funded by the U.S. Department of Energy to provide a comprehensive data base on the b&sic properties of aqueous solutions involved in geothermal energy (Lyon and Kolstad, 1974). The compilation, which includes critical evaluation and correlation, constitutes a source of recommended values to be used in research and development of both electric power generation and direct use. In addition, the results of this work include identification of those areas where data are either 1'.eking or are inadequate, and recommendations for research designed to provide the needed data. Because data on the baaic properties of individual geotheraal brines vary frosi site to site and are virtually nonexistent, it is common practice to rely on those of aqueous aodiusi chloride solutions as a substitute. In this paper it is not possible to cover all data for each solution, of ittterefet- CHore, complete, information, im obtained from Haas, 1976; Potter et al. t 1977; Phillips et al. f 1979; Pitzer et al., 1979j Ozbek et al., 1977; Ozbek and Phillips, 1979; Marshall and Jones, 1974; Holmes et al., 1978; Smith-hagcwan and Goldberg, 1978; Silvester and Pitzer, 1977.)
This report is limited to a survey of the experimental data and correlations for NaCl solutions up to 350°C temperatures and 50 MPa pressures. The objectives of the work are mainly to: (1) obtain correlation equations that reproduce the available experimental data on the basic properties of aqueous NaCl solutions over a range of temperatures up to 350°C and pressure to 50 MPa; (2) to develop tables of smoothed data based on the correlation expressions and to provide reasonable estimates of these properties thrjugh extrapolation, where necessary, into the region of geothermal interest; and (3) to prepare a handbook containing evaluation procedures, equations, tables of smoothed data, and recommendations for future research in areas where the current data are either lacking or inadequate <Phillps et al., 1979).
ACCOMPLISHMENTS IN FISCAL YEAR 1979
The basic properties of NaCl solutions can be organized in several ways; it is convenient here
Chemical Engineering Data, v. 15, p- 61. Silvester, L. F., and Pitier, R. S., 1977. Ther
modynamics of Electrolytes. 8. Journal of Physical Chemistry, v. 81, p. 1822.
Touloufcian, T. S., Liley, P. E., and S*xeaa, S. C , 1970. Thermal conductivity. Hetf Torfc, IFlf Plenum Data Corporation, v. 3.
Yusufova, V. D., Pepinov, R. I., Bikolaev, V. A., and CuseinOY, C. H., 1975. T*iers»al Conductivity of Aqueous NeCl Solutions. Inzh. Fit. Zh., v. 29, p. 600.
Washburn, E. V., ed., 1929. International critical tables. Rev York, KcCrav-Hill, v. 5.
to separate the* as indicated in Table 1. The table lists these classes of basic enegy data for NaCl solutions and the measurement means commonly used to obtain thi data.
A review of the current status of data on selected properties of NaCl solutions in the temperature range 0° to 350°C and pressures up to 50 HP* shows that only limited data are available for providing tables of smoothed values. (See Table 2 for references to selected correlations for the data.) Experimental data are needed mainly for pressures different from vapor saturation, and at temperatures above about 150 to 200°C for viscosity, thermal conductivity, enthalpy, and heat capacity. All properties need to be correlated as new data are made available; this will result in both improved fits of the equations and in better extrapolation procedures.
Aftex ceviewio.% curveox dace iti terms of the geothermal energy program's needs, we found that the "ideal" data obtainable from published literature should include the following:
1. Experimental values in tabular ford showing concentration, temperature, pressure, and the measured value of the basic property. The data can then be used to develop correlation expressions and for calculations of mean values and deviations from the mean.
2. Measurements on the basic properties of site-specific geothennal brines under operating conditions, or from samples that ate preserved to the greatest extent possible. These measurements would permit a comparison between N .CI solutions and the various brines.
3. Use of a consistent set of units for the various data. Experimental values are currently published using c variety of units for temperatures, pressure, concentration, and property; these must then be converted to a standard form before evaluation. The International System of units should be used,
4. A description of any special instrumentation or materials used in obtaining the experimental
AQUEOUS SOLUTIONS DATA BASE TO HIGH TEMPERATURES AND PRESSURES, SODIUM CHLORIDE SOLUTIONS S. L. Phillips, R.). Otto, H. Ozbek, and M. Tavana

Table 1. Selected basic energy properties of soditaa chloride solutions and coaBonly used Methods of measurenent to high testperstures*
Basic property Tesiperature (°C)
Heat of solution
Heat of dilution
Heat of solution at in f in i te di lution
Heat capacity
Vapor pressure
0-100 100-200 300
10-100
184-712 (51; 100 MPs)
0-300
1-85
25-100 75-700
Thermal conductivity 25-50 25-150 25-330
Electrical conductivity 0-800
Density 0-200 20-75 25-350 150-500
Solubility 0-300 148-425
Caloriaeter (g lass ) Calorimeter (Ti) Calorimeter (Ti-Pd)
Caloriaeter Flow caloriaeter Calorimeter (Hastelloy)
Calorimeter; vapor pressure
Calorimeter ( s ta in l e s s s t e e l )
Flow caloriaeter Boob catoriaeter (gold-plated
beryl Hun copper)
Manometer Differential manors*ter (Pt cups) Isotensicope Boab (stellite)
Cannon glass capillary Ostwald and Ubbelohde Oscillating disk
Coaxial cylinders Continuous line source Flat plate
Conductance cell (Pt-Ir) Four-electrode cell (ceramic, Pt)
Sinker Pycnoaeter Hydrostatic weighing Autoclave, filling temperature
Sample analysis Pressure-temperature (Pt vessel)
values. Sodium chloride solutions are highly corrosive at high temperatures and pressures. This can cause undesirable side reactions and interfere with measurement of the property.
Data on the effects of other substances (e.g., KC1, CaCl2» CO2) on the properties of NaCl solution. Geotherraal bri'-js are complicated solutions that consist of a large number of substances besides NaCl; these are present
nts which may significantly change the properties of the HaCl solution as the temperature and pressure are changed.
6. Foreign language publications with an English language abstract, and English language headings for both tables of data s.id for graphs. There is much delay in evaluating data when there is a need for translations.

Table 2. Selected correlations far the basic energy properties of NaCl solutions and pure water '_« nigh temperatures.
IfaCl Solutions
Temperature Concentration Pressure r<l) (•) <HPa)
Accuracy
Thermal conductivity 20-3CO 0-5 saturation • 21 Ozbek and Phillips, 1979
Viacuaity 0-150 0.5-5 to 30 • 1.5Z Ozbek et al., 1977 0-30J 0-6 •aturation t l t Potter, 1978
Electrical conductivity 0-800 0.001-0.1 to 400 Quist and Marshall, 1968
Electrical reBlstivity 22-375 0.2-4 solar 30 • 21 Ucok et al.. 1979
Solubility 0-600 saturation Potter et al. , 1977 Specific volume 40-280 0.001-1.5 10 Gorbachev et al., 1979
0-175 0-25*u to 350 kg-cm-2 1.5 ppt Rove and Chou i, 1970 Denaity 20-150 0-6 to 35 Kestin et al. , 1978
80-325 0-i0 saturation * 0.002 g/c» 3 Haas, 1976 Ozbek and Phi Mips, 1979
Vapor preBSure 75-325 0-saturation 0.321 Haas, 1976 Heat of aolution 0 .01-300 0.25-25*w saturation <5 KJ/«ole Pitzer et al. , 1979 Heat of solution at
infinite dilution 0-300 saturation Pitzer et al. , 1979 neat of dilution Pitzer et al. , 1979 Heat capacity 0-300 0.25-25tw saturation 0.004-0.17
J/«ole-<>C Pitzer et al. , 1979
Total enthalpy 0-300 saturation Pitzer et al. , 1979 Specific heat
capacity 0-300 saturation Pitzer et al. , 1979
Hater
Energy property Temperature (°C) Pressure («P«) References
Thermal conductivity 0<T<800 0.1<P<100 Haywood, 1966 ViscoBity 0<T<800 0<P<100 IAPS, 1976 Specific -nthalpy 0.01<T<374 0.0006113<P<22.09 Keenan et al. , 1978 SDecific 'olume 0.01<T<374 0.0006113<T<22.09 Keenan et al.. , 1978 Vapor preasure Keenan et al. , 1978 Heat capacity Keenan et al. , 1978
EXPECTED RESULTS IN FISCAL YEAR 1980
In fiscal year 1980, we ex-psct to complete a survey of data on other electrolytes (e.g., KC1. CaCl2> and gases (e.g., H2S, COj). A revision to an earlier report on viBcosity is also expected.
REFERENCES CITED
Gorbachev, S. V., Kondratev, V. P., Androsov, V. I., and Rolupaev, V. G., 1974. Specific volumes of aqueous solutions of alkali-metal chlorides. Russian Journal of Physical Chemistry, v. 48, p. 2789-2791.
Haas, J. L., Jr., 1976. Physical properties of the coexisting phases and thermochemical properties of the H2O component in boiling HaCl solutions. U.S. Geological Survey Bulletin 1421-A.
Haywood, R. W., 1966. Sixth international conference on the properties of steam—supplement on transport properties. Journal of Engineering and Power, v. 88, p. 63-66.
Holmes, H. F., Baes, C. P., Jr., and Hesmer, R. E., 1978. Isopiestic studies of aqueous solutions at elevated temperatures. I. Journal of Chemical Thermodynamics, v. 10, p. 983.
International Association for the Properties of Steam, 1976. Release on dynamic viscosity of water substances. Mechanical Engineering, v. 98, p. 79.
Keeoan, J. H., Keyes, F. G., Hill, P. G., and Moore, J. G., 1978. Steam tables. New York, John Wiley and Sons.
Kestin, J., Abe, V., Grimes, C. F., Khalifa, H. E., Soc-fciaaian, H., and Wakenara. W. A., 1978. The effect of pressure on the viscosity of aqueous

173
N a d solutions in the temperature range 20-150°C. Journal of Chemical Engineering Data, v. 23, p- 328.
Lyon, R. N., and Koiatad, C. A., ed*., 1974. A recommended research program in geothermal chemistry* Springfield, Virginia* national Technical Information Service, report WASH-134A.
Marshall, W. t., and Jones, E. V., 1974. Liquid-vapor critical temperature* of aqueous electrolyte solutions. Journal of Inorganic Nuclear Chemistry, v. 36, p. 2312-2318.
Ozbek, H., Fair, J. A., and Phillip'; S. L., 1977. Viscosity of aqueous sodium c' .»ride solutions from 0-l$0°C Berkeley, Lawrence Berkeley Laboratory, LBL-5931.
Ozbek, H., and Phillips, S. L., 1979. Thermal conductivity of aqueous NaCl solutions Croat 20°C to 330°C. Berkeley, Lawrence Berkeley Laboratory, LBL-9086.
Phillips, 5. L.» Otto, R. J., Ozbek, H. t and Tavana, M., 1979. Aqueous solutions data base to high temperatures and pressures NaCl solutions. Berkeley, Lawrence Berkeley, Laboratory, LBL-9621.
Pitzer, K. S., Bradley, D. J., Rogers, P. S. Z., and Peiper. J. C , 1979. Thermodynamics of high temperature brines. Berkeley, Lawrence Berkeley Laboratory, LBL-8973.
Potter, R. W., II., 1978. Visc^si t / of geotheracl brines. Trans., Geothermal Resources Council,
v. 2, p. 543-544. Potter, K. V., II., Babcock, R. S., and Brown, D. L.,
1977. A new method for determining the solubility of salts in aqueous solutions at elevated temperatures. Journal of Research of U.S. Geological Survey, v. 5, no. 3, p. 389-395.
Quist, A., and Marshall, W. L., 1969. Electrical conductances of aqueous sodium chloride solutions from 0 to 800° and at pressures to 4000 bars. Journal of Physical Chemistry, v. 72, p. 684-703.
Rove, A. M., Jr., and Chou, J. C. S., 1970. Pressure-volume-temperature-cocicentration relation of aqueous NaCl solution. Journal of Chemical Engineering Data, v- 15, no. !, p. 61-66.
Silvester, L. F., and Pitzer, K. S-, 197?. Thermodynamics of electrolyte*. 8,, High temperature properties, including enthalpy and heat capacity; with application to sodiua chloride. Journal of Physical Chemistry, v. 81, no. 19, [.•- 1822-1828.
Smith-Hagovan, D., and Goldberg, R. N., 197c". A bibliography of sources of experimental data leading to thermal properties of binary aqueous electrolyte solutions. Washington, D. C , national Bureau of Standards.
Ucok, H., Ershaghi, I., and Olhoeft, C. R., 1979. Electrical resistivity of geothermal brines. Dallas, Society of Petroleum Engineers, paper SPE-7878.

Applied Research Studies
ENHANCED RECOVERY WITH MOMLITY AND REACTIVE TENSION AGENTS C. J. Radke and W. H. Somerton
INTRODUCTION
The objectives of the present study are (1) to establish the conditions requisite for tertiary-wode displacement of acidic oils witt- pH agents, and (2) to elucidate the dominant recovery mechanisms and hence permit development of an improved cauatic flooding package. The overall project includes studies on restored-stat~ core displacements of Ranger Zone Wilmington oil sands, chemical transport, emulsion flow and displacement, and iuter-facial tensions. Progress during 1979 is summarized.
CORE DISPLACEMENTS
During 1979, eight additional core tests were performed, aimed at recovering tertiary oil from resaturat£d Ranger Zone sand pack" at taservoir temperature U25°F) and rate (1.5 ft/day). The flooding procedure is identical to that described previously (Radke and Somerton, 1978), except that the coreB are no longer packed in the completely frozen sc-ate. The focus is on terti*-y oil recovery, and the brine flood is continued until water-to-oil ratios in excess of 10-* are attained. The brine contains no hardness ions (i.e., calcium or magnesium), so flooding results are not complicated by any ion-exchange phenomena. During flooding, the effluent production history and pH are monitored, and the core pressure drop is recorded so that dynamic relative permeabilities may be determined (JOVWIBOW «t al., 1959}.
Typical flooding results are shown in Figure 1. Waterflood performance shows very early breakthrough followed by oil production at high water-to-oil ratioB. This is the result of the high viscosity of the well B108 crude oil used in all our testing. Figure 2 shows that this oil's viscosity at reservoir temperature C'»'50oC) exceeds 100 cp giving an oil-to-water viscosity ratio of more than 200. Also shown in Figure 2 is the viscosity of well C331 crude oil, suggesting large variability in properties of the Wilmington Ranger zone crude.
Initial pH of the water flood was varied between 11 and 13 in three tests. The pH 11 tertiary flood was used to teBt the importance of interfacial tension, which is low under these conditions (Radke and Somerton, 1978.) A pH near 1Z is anticipated for the Wilmington field test (City of Long Beach, 1978), and the higher pH 13 tertiary flood is used to examine possible oil jroduction with earlier cauBtic breakthrough. All tertiary recoveries are almost independent »f the cauatic and salt concentration. Caustic Irtukthrough time, however, decreases dramatically with increasing pH.
To gain a basic understanding of the tertiary recovery performances, the simplified chemical
-r—T—i i i— 0225«V.NsCI
SaeOSTS K-250*0 1-037
C.OIItNtOH O 223^fc MCI
LmiaAftfe
T. PORE VOLUMES Figure 1. Production performance and pH history of BIOS oil by pfi 11 caustic. (XBL 797-6603)
40 TEMPERATURE,
Figure 2. The viscosity of Wilmiugton-Ranger zone crude oils as a function of temperature.
(XBL 797-6605)

175
flooding node! at Flyers and perrine (1959), Claridge and Bondor (i974), and Castor (1979) was applied. In the model, the saponified surfactants are assumed to alter the relative permeability to the oil phase. Further, since the in-situ hydro-lyzable acids exist as surfactants only in the alkali, they are presumed to chromatograph with the caustic. Caustic elution in turn is controlled by a reversible adsorption itotherm with a nominal breakthrough delay at pH 12 >f 5 pore volumes. The fractional flow curves t> wster and chemical are taken to be those of Crr.'g (1971).
To ascertain the possible benefits of Mobility control* the BIOS well cruue oil was diluted by a thinner. The viscosity jf this mixture is shown in Figure 2, and the flooding results are portrayed in Figure 3. Tertiary production is still poor, but does occur earlier, as predicted. Of course, this experiment is not definitive because dilution of the crude oil also dilute? the concentration of natural acids.
The conclusion at present is that in low-permeability cores of high sorptive capacity, caustic flooding of viscous crude oils recovers minimal additional oil when commenced at high water-to-oil ratios. The caustic process must be augmented; mobility control is a prime candidate.
CHEMICAL TRANSPORT
The chromatographic movement of chemical species in Wilmington oil sands is important to the caustic process because these unconsolidated sands have high sorptive capacities. The transport of hydroxyl ionB and the ion exchange between sodium and calcium are being studied, lite procedure used is frontal analysis chromatography in which the column effluent concentration is monitored after a step change in concentration is imposed at the column inlet (Radke and Somerton, 1978). Material balance ther determines the sorptive consumption (Radke and Somerton, 197S; Wang et al., 1978). Analysis of the shapes of such breakthrough curves
also permits identification of the kinetics of the sorption process (Eadke and Soaerton, 1978; Trogus et al., 1976; Ramirez et al., 1979), and hence, extrapolation to field conditions.
Caustic Loss
Caustic loss in a reservoir can be due to several cause* including surface adsorption, solid dissolution, solid reaction, insoluble salt formation (by hardness ions), and neutralizatin of acids in the crude oil. The first four factors are studied in this work. Caustic consumption by saponification of the crude oil is ainiaal for all but extremely high acic number oils.
Figure 4 shows the -austic consumption by Wilmington oil sand is a function of pH at various tenperatures and salt concentration. Reservoir temperature is approximately 50°C, and 1 wtZ salt corresponds to anticipated flooding conditions (City of Long Beach, 1978). Caustic consumption is approximately Langmuirian, and increases with increasing temperature, but decreases with increasing salt. Sodium orthosilicate (Si(>2/NJ20 • 0.5) consumption at pH -12 is equivalent to caustic, indicating no buffering action. Further, ortho-silicate requires a higher weight concentration to achieve the same pH as caustic soda.
Figure 4 siay be used in conjuction with equilibrium chromatographic theory (DeVault, 1943) to predict the elution behavior of caustic in the oil displacement tests. At pH 11, no elution is expected until after 10 poie volumes, which explains why caustic has not arrived at the core exit in Figure 1.
US 12.0 12.3 125
I 4 *A NoCT 30VA THINNER
, PORE VOLUMES
Figure 3 . Production performance and pH h is to ry of thinned B108 o i l by pH 12 caustic.(XBL 797-6602)
0.02 0.04 0.06 CONCENTRATION (moles/li ler)
Figure 4. Caustic adsorption on Ranger-Zone reservoi r sand as a function of hydroxyl concentrat ion. (XBL 788-5600)

Several investigation* of alkali flooding have suggested that caustic is consumed by dissolution of reservoir rock especially at higher temperatures (Ehrlich and Wygal, 1976; Cooke et al., 1974; Robinson et al., 1977). Ho evidence of Mineral dissolution in column testing has been seen. One explanation is that the effluent response fir caustic is a combination of linear reversible sorption kinetics and irreversible first-order rock dissolution. For laboratory studies with short cores and amenable superficial velocities, the caustic dissolution rste conb? a nt Is spparently too small to h^ve a noticeable influence on the cauatic effluent response curves. Nevertheless, one can establish an upper bound of 10" 7 S'tc~- for kn. (first-order dissolution rate constant) of Wilmington oil sand at 5C°C in 1 wtZ sodium chloride. It is critical to ascertain huw fmpo:tant this value will be under reservoir conditions.
Ion Exchange
Because hardness (i.e., calcium *J"J magnesium) is present in the Wilmin^'™1 -~ater flooded zones, it may impair caustic flooding performance by precipitation of divalent soaps which are generated *iy saponification of the acid oils. Hence, soft water preflushing is desirable. The cation exchange capacity (CEC) wf Wilmington oil sands at 50°C has been detprmined to be approximately 2.5 milliequiva-lencs per 100 g of veservoir sands. Frontal analysis chromatography at several sodium-to-calcium inlet concentration ratios and levels shows that the exchange isotherm is well represented as a mass action relationship. Figure 5 shows the ion-exchange isotherm for two salinities of 0.18 and 0.36 equivalents per liter, which corresponds to 1 and 2 wtX sodium chloride solutions, respectively. Figure 5 permits design of soft water preflush slugs by equilibrium chromatography theory.
10 i 1 —
o . i e N ^
I i i ^ - L - s i
, 2 o.a
/ a 3 6 N --
2 0 6 O -2
O
< 0 4 c s « i n-y) 2 z CEC = 1 {]-zfi
_ UJ CO (T o « 0.2
CEC - ° 0 5 6 N " '
-
i 1 . 1 . .
-
EMULSION FLOW
Filtration Model
As a prelude to investiS'(ting emulsions as mobility control agents, the f?ow of dilute stable emulsions in unconsolidated porous media is being studied. The contention is that emulsified oil drops transport according to filtration principles. The details of the filtration model are available elsewhere (Radke and Somerton, 1977, 1978; Soo and Radke, 1979). Here, the only salient features are reviewed.
Equations have been developed that characterize emulsion flow behavior by three parameters: (1) a filter coefficient, (2) an interpore diversion factor, and (3) a local flow restriction factor. These expressions show that the filter coefficient controls the sharpii-*s of the emulsion f'/ont, the diversion parameter dictates the steady'state retention, and the flow restriction parameter describes the effectiveness of retained drops in reducing permeability.
New transient permeability and effluent suspension concentration data are obtained for dilute oil in water emulsions of mean drop sice ranging From 2 to 10 ya flowing in cores of 0.06 and 1.2 Darcy permeabilities at superficial velocities of 0.42 and 1.9 cm/min. The low-viscosity oil drops cause permeability reductions up to 90Z with 4 to 5 ym sized drops and lower flow rates being most effective.
Emulsion Flooding
0 0.2 0.4 0.6 OB z, SOLVENT-FREE CALCIUM EQUIV. FRACTION
Figure 5. Sodium/calcium ion exchange isotherm at 52.5°c and at two s a l i n i t i e s .
(XBL 797-6592)
A najor problem with the caustic flooding process is the lack of mobility control. Polymers may be used but they must be effective in and withstand the alkaline, high clay-content environment at elevated temperatures. The cost of the process also rises dramatically with use of polymer additives. An alternative is to use dilute emulsions. Because the mechanism of mobility control is solely by permeability reduction, emulsion effectiveness is quite impervious to temperature and alkalinity. With acid California crude oil, emulsions are easily prepared in alkaline water with no synthetic surfactants. Hence, emulsions would be less expensive oobility-control agents than polymers. However, fundamental questions arise as to whether or not rmulsions can actually provide mobility control. Secondary emulsion displacement of viscous oils is, therefore, being studied experimentally and theoretically.
A standard oil-flooding apparatus Is under construction. A commercial HPLC pump (Alter Model 101) drives the oil, water, and emulsion vie .»rcury displacement. Presently, the HPLC pump is \. tble to handle mercury because of check balls whose densities are less than that of mercury. Also, in injecting emulsion, it is important to supply a uniform drop concentration over long time periods. This is difficult because of creaming. The emulsion is stirred in a displacement reservoir without using high-pressure seals. An external magnet reciprocates vertically in a concentric tube moving an internal magnet, which provides the stirring action. The magnets' poles are opposed so that

the internal magnet is pushed upward. It then settles by gravity. Raul*ion displacement both in homogeneous cores, and in hererogeceous systems will be studied to ascertain possible improvements in sweep efficiency.
In 1980, many of the research areas discussed herein will be investigated to improve the basic understanding of the factors that affect enhanced recovery with nobility and reactive tension agents and thus further establish the viability of this approach.
REFERENCES CITED
Castor, T. 1979. Enhanced rei.overy of acid oils by alkaline agents. (Ph.D. dissertation). Berkeley, University of California, Mechanical Eng. Department.
City of Long Beach, Department of Oil Properties and THUHS Long Beach Company, 1978. Caustic Waterflooding Demonstration Project, Ranger Zone, Long Beach unit, Wilmington field, California. City of Long Beach, 2nd Ann. Report.
Claridge, E. L., and Bondor, P. L-, 1974. A graphical method for calculating linear displacement with 'a£4s transfer and continuously changing nobil i'.xes. Society Petroleum Engineering Journal, D e c , pp. 609-618.
Cooke, C. E., Williams, "... E. and Kolodzie, P. A., 1974. Oil recovery by alkaline waterflooding. Journal of Petroleum Technology, v. 26 no. 12.
Craig, F. F., Jr., 1971. The reservoir engineering aspects of waterflooding. Dallas, Soc. of Pet. Eng. of AIME, monograph* v. 1, chap. 8.
DeVault, D. The theory of chromatography, 1943. Journal Aoerical Chemical Society, v. 65, p. 532.
Ehrich, R. and Wygal, R. J., 1976. Interrelation of crude oil and rock properties with the recovery of oil by caustic waterflooding.
Presented at the Improved Oil Recovery Symp. of the SPE, Tulsa, March 22-24.
Payers, F. J., and Perrine, R. L., 1959. Mathematical description of detergent flooding in oil reservoirs. Trans. AIHE, v. 216, pp. 277-2B3.
Johnson, E. F., Bossier, D. F-, and Naumann, V. 0., 1959. Calculation of relative permeability for displacement experiments. Trans. AIME v. 216, p. 370-372.
Radke, C. J., and Somerton, W. B., 1977. Enhanced recovery with mobility and reactive tension agents," in Proceedings, Third ERDA Symp. on Enhanced Oil and Gas Recovery and Improved Drilling Methods. U.S. Department of Energy, v. 1, p. B-5. , I97B. Enhanced recovery with mobility and reactive tenaiur. "gents, in Proceedings, Fourth DOE Symposium on Enhanced Oil and Gas Recovery and Improved Drilling Methods. U. S. Department of Energy, v. 1A, p. B-2.
Ramirez, W. F., Shuler, P. J., and Friedman, F., 1979. Mans transport of surfactants in porous media. Presented at the 1979 California Regional Meeting of the Society of Petroleum Engineers of AIME. SPE-7951.
Robinson, R. J., Bursell, C. C , and Restine, J. L., 1977. A caustic ateamflood pilot-Kern River field, preprint for 47th Ann. CA Reg. Meet, of SPE of AIME, Bakersfield, SPE-6523.
Soo, H., and Radke, C. J,, 1979. Stable emulsion flow in porous media. 86th Nat. Heet. of AICHE, Houston.
Trogus, F., Sophany, T., Shechter, R. S., and Wade, W. H., 1976. Static and dynamic absorption of anionic and nonionic surfactants. Presented at the 51st Ann. Fall Tech. Conf. and Exhib. of SPE AIME, New Orleans.
Wang, H. L. , Duda, J. L., and Radke, C. J., 1978. Solution adsorption from liquid chromatography. J. Colloid. Int. Sci., v. 66, no. 1, p. 153. SPS-6004.
HIGH-PRECISION MASS SPECTROMETRY M. C. Michel and W. R. Keyes
Previous research (Michel et al., 1978) has shown that the basic idea of simultaneous collection of ion beamB can be applied to high-precision isotope ratio measurements of relatively heavy elements (e.g., strontium and neodyroium). This year's work was directed at determining the factors limiting the precision of this system.
It had been found that the ion source used, which is necessitated by ion optical properties of the large mass spectrometer, caused considerably greacer fractionation of isotopes during the useful life of the sample than more conventional ion sources. Because the isoLope ratio of interest must be corrected for this fractionation by use of an internaL standard, it is clearly desirable to minimize this correction to reduce the added errors involved in this calculation. Preliminary data indicate that spreading the sample over a large surface area substrate (such as silica gel) teduced the total fractionation range. More work
needs to be done with controlled substrates to see if further reduction is possible.
With the development of sample handling techniques, measurements of isotope ratios on a NBS standard strontium sample were reproducible to about four parts in 100,000 even with the still large fractionation effects. This is comparable with the beat work done by conventional sequential measurement techniques. Analyses of four basalt samples for the strontium isotope ratio (^^Sr/^^Sr) are summarized in the Table 1. These results demonstrate that, for such chemically processed samples, residual rubidium contamination limits the precision to the same degree as conventional techniques. It must be again noted that because of the special properties of the ion source, the interference may be somewhat worse. This is so because chemical separation by volatility difference may be slower for the cavity source over an open configuration. In addition, the closed ion source may encourage

178
Table 1. Analyses of fcur basalt staples for 8 7 S r / 8 6 S r .
Sample 1 2 3 4
87/86 S r 0.70753 0.70759 0.70531 0.70509 +0.00004 +0.00002 +0.00002 +0.00003
early diffusion of rubidiuai into the source aetal surface to be re-eaiitted later during the staple measu.sment. This reduces the tiae during which the strontium ionizstion is free froa rubidiua.
It haa been concluded that the advantages of simultaneous collection outweigh the disadvantages.
STATE-OF-THE-ART TRACER TECHNIQUES S. M. Klainer and J. A. Apps
INTRODUCTION
During fiscal year, 1979 a research program was undertaken to evaluate whether improved tracers could be selected (or, if necessary, developed) to help define the characteristics of underground systems. In addition, techniques For detecting the chosen tracers have been considered. The tracer program was undertaken because auch additional information was needed in at least four in-situ systems:
1. Evaluation of hydrological properties. The addition of tracer(s) in groundwaters will provide information on permeability, flow rate, etc.
2. Integrity of groundwater chemistry. The addition of tracer(s) to drill)-.g fluids will provide the necessary marker(s, to assure that groundwater samples collected for analyses are representative and have not been contaminated during drilling.
3. Suitability of storage sites for nuclear waste. The addition of tracer(a) to a potential underground nuclear waste repository will aid in demonstrating the repository's integrity.
4. Measurement of chemical transport in natural systems. The addition of nonabsorbing tracers to dissolved radionuclides during injection provides a convenient means of measuring the retardation of radionuclide migration in groundwaters relative to the nonadsorbing tracer.
Presently employed tracer materials include the use of radioisotopes; S-F compounds; fluorescent dyes; and, moat recently, :>F materials or fluorocarbons (Davis et al., 1980). Of these, only the C-F compounds have the potential of meeting both immediate and future tracer needs. We have, therefore, chosen to pursue the fluorocarbons as tracers because of their intrinsic chemical and
Many possible avenues exist for improvement that have not been investigated. This work, has bean terminated for the present, but a relatively nodcst effort could yield precision levels that aay -ot be available by conventional techniques. This would not neceasarily be of general interest but the growing importance of Sm-Hd geochronology, where precision is even aore important, indicates there aay soon be a need for upgraded technology, a* discussed herein.
REFERENCE CITED
Hichel, H. C , Hosier, D. F., and Keyes, W. R., 1979. Four-Channel riaultaneous collection systea for high precision aass spectrometry, in Earth Sciences Division Annual Report. Lawrence Berkeley Laboratory, LBL-8648, D . 189-191.
physical properties and because of our ability to alter these with simple chemical procedures to meet specific needs. In addition, the presence of C-F compound! as natural backgrounds Is nonexistent, except in contemporary waters where contamination has occurred due to the use of aerosol aprsy cans and refri|T2iantt.
SELECTION OF TRACERS
The fluorocarbons that have tentatively Jeen chosen for tracers are of three basic classes:
1. The low molecular weight compounds, such as 1 2CF4 and 1 3CP4,
2. The heavier molecular weight materials in the C4 and C5 range, with initial emphasis on these compounds:
F F i 1
F - C - C - F
F - C - C - F
F F
3. Substituted C4 and C5 fluorocarbons. The higher molecular weight compounds are of particular interest because they are much more specifically identifiable, and because their vapor pressure is much higher than one would expect for compounds in the 200 to 400 molecular weight range.
To determine the suitability of C-F compounds as tracers, these tracers must be tested in the laboratory for their adsorptive properties using columns packed with crushed rock or minerals to represent approximately in-si'tu conditions. Known concentrations of the tracer candidates, dissolved in water, will be passed through these columns.
179
The rate o( elution, mats balance, and amount of fluorocvirbcn remaining on the column vill be determined using gas chromatography and Mass spectroscopy.
RECOVERY Of TRACER COMPOUNDS FROM KATURAL SYSTEMS
The physical state of the tracer at the point of detection and quantification will dictate, to a major extent, which analytical techniques are appropriate. In all cases the prerequisite for continuous measurements (as opposed to batch processes) on location will be adhered to as a primary requirement.
One concept is to filter the solids from the solution containing the tracer and then measure the dissolved fluorocarbons directly using optical spectrometry. Initial calculations indicated that sensitivities below the parts-per-million-range (sufficient for this program) should be theoretically obtainable. In natural systems, such as groundwaters, however, the indeterminate number of commonly present soluble constituents 4<id their variable concentrations may present a background signal which will degrade system performance. This possibility was investigated by Dr. Peter Griffiths of Ohio University, using FT/IR (Fourier transform infrared) spectroscopy, and a preliminary report on his results indicates potential success. Even if the optical detection of fluorocarbona in solutions proves to be sufficiently sensitive, however, it will not be possible to discern the isoLopic species, because of the width of the spectral bands, using mixtures of, for example 1^CF4 and ^CP/^ would not be possible.
A second approach ncv being seriously considered is to quantitatively .remove the fluoro-carbons froin the sciution, as a vapor, before analysis. This represents a realistic possibility as fluorocarbons, even in the C4 and C5 molecular weight range, are usually gases. The use of heating techniques to effect this separation do not appear feasible because of the amour.c of water which will be vaporized and because this method, of necessity* will reduce analyses response times so it may be no faster than batch techniques. The method being considered, therefore, is forced selective diffusion, which is akin to membrane separation. Albert Copeland, Jr., NASA, Johnson Spacecraft Center 1 Houston, Texas, has provided evidence that such separation techniques have been found feasible in mass spectrometry.
In this situation, tracer diffusion through the walls of fluorinated silicone tubing is the objective. The presence of the fluorine groups in the silicone matrix should make it possible to preferentially pass the fluorocarbon species. The inside of the silicone tubing will be at atmospheric pressure while its outside walls will be in a vacuum (MO"' torr). The solution containing the tracer is filtered, to remove the particulates and other materials which may coat the walls
, of the tibing- It is then passed through the silicone tubing, and the tracer material is permitted to diffuse through the walls into the low pressure side of the syBtem. Once it has been demonstrated
that this method of tracer separation is either complete, or accurately predictable, then subsequent detection and quantification becomes relatively easy.
DETECTIOH IHSTRUHEHTATIOH
At the present time, instrumentation for measurements on tracer materials, both iii the vapor and dissolved states, i» being pursued. Experts in the field of instrumental analyses have been visited, and arrangements are being made whereby some basic information, needed to evaluate the various methods, can be obtained cost-effectively. As previously mentioned, Dr. Griffiths has done •omfe FTflB. w u u T C M n t t . Raman ©f 4i©ole 1*»*T infrared measurements have not yet been nade. It is expected that the data supplied by Dc Griffiths combined with information available in the literature will permit an "order-of-magnitude" estimation of sensitivity to be calculated for these latter two approaches.
Finally, now that there is a potential, as a result of membrane separation or reduced-pressure vapor sampling of the fluorocarboH, the use of a mass spectrometer becomes an attractive choice as a detector. Miniature mass spectrometers, suitable for In-field use, have been built by Lawrence Liver-more Laboratory (LLL) and NASA. Discussions have been held with both organisations, and it appears that LLL will permit us to test our postulations on their unit.
SUMMARY
During fiscal year 1979, potential fluorocarbon tracer materials have been selected and undergone preliminary evaluation. These tracers offer great versatility because it should be possible to selectively change their chemical and physical behavior (especially absorptive properties) by proper substitution of other chemical groups at one or more of the fluorine sites.
At least two detection methods have iieen tentatively evaluated (infrared and mass spectrometry), and both systems appear to have the required sensitivity and specificity when presented with jjas (vapor) samples. In addition, either instrument can be engineered for in-field use- Th£ extraction of the tracer as a vapor from a liquid background matrix has been considered. In principle, selective membrane separation appears feasible. The practicality of this is yet to be achieved.
Continuation of this work will be done under funding from the Office of Nuclear Waste Isolation.
The authors wish to thank Dr. Maynard Michel of Lawrence Berkeley Laboratory for his inputs on mass spectrometry.
REFERENCE CITED
Davis, S. M., Thompson, G. M., Bently, H. W., and Stiles, G., 1980. Ground-water tracers: A short review. Groundwater, v. 18, p. 14-23,

180
CRYSTALLOCRAPHIC PROPERTIES USING THE NQR TECHNIQUE S. M. Klainer and J. A. Apps
INTRODUCTION
The research performed in fiscal year 1979 WHO to identify and evaluate the potential uie of Nuclear Quadrupole Resonance (HQJt) Spectroscopy in the geosciences and particularly for energy-related problems. At this early state of the evaluation, the possible uses of this method appear to be numerous and very important.
Many DOE mission areas such as nuclear waste isolation, contintental drilling, fossil fuel recovery, and geothermal energy require an in-depth understanding of earth sciences. Of particular interest is the development of new analytical techniques to develop a better understanding of mineralogy.
presently, available instrumental techniques for studying mineralogical problems such as x-ray, electron and neutron diffraction, nuclear magnetic resonance (NHR), electron microscopy, and transmission electron microcopy have inherent limitations. These techniques are unable to characterize mineral samples fully, especially if the samples are polycryst*•line.
Nuclear Quadrupole Resonance (NQR) spectroscopy offers the potential for obtaining accurate high-resolution spectra. These can then be interpreted to give structural information which can be related to local electronic structure, atomic arrangement, order/disorder phenomena, ind crystal phase transformation. In addition, molecular dynamics in the solid Btate can be studied. Furthermore, since NQR data are sensitive to changes in tenpera-ture and pressure, stress/ strain information may be obtained.
A selection of potential applications to various energy technologies is listed in Table 1. It should be emphasized that implementation of the applications described in this table may take many years of effort in the theoretical, experimental, and instrumental development fields. An initial research goal is to establish what this potential is and how much development is required before NQR spectroscopy becomes a fully viable technique for geoscience and related disciplines.
Each of the potential applications listed in Table 1 can be placed into one of three broad categories: (1) crystallographic information, (2) stress determination, and (3) the identification of a specific chemical compound or atomic arrangement. These are all congruous with the NQR method, which is known to give specific inforoation on chemical, physical, and crystaliographic properties of solids which contain any degree of crystal OTder.
The content of their discussions may be summarized as follows. Compounds may be studied which contain nuclei with a nuclear spin >I. This includes molecules which contain such probe nuclei as N ^ , O " , Ha23, Al*?, C l " , C l 3 7 , C u 6 3 , and Cu 6 5, as well as many of the rare earths and actinidea. The HQK method is used to study the electron denaity distribution.
The charged particles in the atomic nucleus precess around the direction of the nuclear s,>£n while the charged particles outside the nucleus remain virtually, stationary over the averaging, time. Thus, the charge distribution in the nucleus may be regarded aa axially symmetric. In a coordinate system with the c-exi* directed along the symmetry axia of the nucleus, the off-diagonal terms of the quadropole moment tensor Qj^ are zero while the diagonal terms are related by the equality eQxx " *Qyy " "1/2 e Q £ Z . As a result, the quadrupole moment tensor is determined by one component, which is designated as the nuclear quadrupole moment:
eQ . - Jp(3 *)dT
where P'is the charge density in */.«: nucleus, and dT is the volume element in the nucleus system, x, y, z. In the case of spheri:al symmetry, the righthand side of equation (1) vanishes, and the quadrupole moment is thus a measure of the deviation of the nuclear charge distribution from spherical symmetry.
The electric field gradient (EFG) around the nucleus is produced by charges situated outside the nucleus. The EFG tensor is diagonal in the principal axes. Th* Hamiltonian of the nuclear quadrupole interaction contains thfc three components of thiB tensor, which are related by
3E- 9E,. v - -=-^ >v - -=-*• > V zz d z yy 3 y ?-•
V + \j + vi - 0 . zz yy zz
Two of these components, v z z and V„„, are in general unequal. We ca.i thus define the EFG asymmetry parameter
HQR THEORY
The baeic m/cheiatics of NQR have been described by Lucken (1969) and Das and hahn (1958).
which varies within tV« tange 0 •£ ^ 1. ¥ C T the particular case of an axially symmetric EFG tensor < uxx * uy =» ~ ^ 2 yzz) n ~ °- T ^ HamilConian of the nuclear quadrupole interaction is

Table 1. Potential application* of NQR to energy related problems.
Potential application
Nuclear waste Identification of lactice sites of radionuclides in glasses, synthetic, and natural minerals.
In situ measurement of stress in salt. In situ measurement of stress in rock formations.
Continental Downhole sensing of elemental compositions and the drilling program crystal structures that contain them.
In situ measurement of stress at depth.
Fossil fuels Continuous measurement of the distribution of sulfur between organic and inorganic phases in coal.
Measurement of organic complexes of V, Cu, Ni, and S in crude oil.
Stability of mining excavations, i.e., by vail, room, and pillar mining methods in coal mines, block caving, and in situ retorting of oil shales.
Geo thermal, energy Use of compounds containing stable isotopes as tracer materials.
Uranium resources Downhole measurement of uranium ore grade ana type, both in and adjacent to the bore-hole wall.
Continuous monitoring of uranium in <"T*s and mill feed, and identification of the mineral phases containing uranium.
Monitoring of uranium by-produ.:t elements such as Cu, V.
Fundamental research in support of energy development
Characterizing phase transitions in common rocn-forming minerals, i.e., feldspars, pyroxenes, amphiboles, support of phyllosilicates, and zeolites
Interpreting ordering in minerals with respect to thermodynamic properties.
Evaluating localized stress in nonisotropic materials.
e2qQ r 3 1 2 _ I ( 1
(21 - 1) [ J Iz U I
I/2n(I* + if}]
where I is the nuclear spin operator with the components I z, I x, and I„, and 1+ = I x + il„. For the particular case n= 0, the energy eigenvalues of thp quadrupole interaction are given by
2 e g ? , , 2
41(21 - 1) ( 3 n l 1(1 + 1)]
If H 1* 0, the energy eigenvalues are found by solving the secular equation for (4).
The quadropole interaction energy is small, and the NQR frequencies, therefore, fall within the radio-frequency range between 0 and 1000 MHz. The nuclear quadropole moment is approximately constant and does not depend on the nature of the chemical bonds of the given atom. The electric field gradient, converaely, characterizes the
electron density distribution and is thus highly sensitive to the nature of the bonds in the given atom and in all other atoms in the molecule, whether or not they are directly bonded to the resonant nucleus. As a result, the position and the number of lines in a NQR spectrum will depend on the molecular and crystal structure of the compound being studied. Accordingly, \QR spectroscopy provides an indication of the state of the electron surrounding the resonant nucleus, and thus gives information on the electron density distribution in the molecule.
SELECTION OF PROBE NUCLEUS
The first requirement is selection of a probe nucleus. Given the areas or interest, aluminum-27 is a rational choice as the probe nucleus for initial studies because of its natural abundance. Among the elements of the lithosphere it ranks third, with 8 wtJ. Oxygen (47 wtZ) and silicon (28 wtZ) are the only two elements with greater abundance. Both of these more abundant elements are ruled out because they have no abundant isotopes which hjv ' I > 1, and, therefore, are not subject to th interaction. Aluminum-27, however, has a suffi int high nuclear spir. (I = 5/2), and

natural isotopic abundance (MOO wtZ) Co satisfy the basic experinental requirements. Ir« addition, irs relative abundance in the lithasphere leads to the expectation that it may be a generally useful probe nucleus, but still dilute enough so that signals from more than one crystal site can be unraveled. Unfortunately aluminum-27 represents a nucleus whose NQR spectral characteristics have not been measured and, therefore, obtaining this information is the first avenue of experimental research which must be pursued.
The oxygen-17 nucleus offers many advantages to the current problem (ubiquitous occurrence in rock forming minerals, favorable frequency region for the NQR frequencies) but suffers from a low natural abundance. This results in instrumentation which requires several orders of magnitude more sensitivity. If sensitivity ie improved, oxygen-1/ may become very attractive as a probe nucleus.
Less severe experimental problems would be expected in the detection of elements such as copper or chlorine covalently bonded in minerals. Here, NQR frequencies in the tens of HHz are ex-iected on the basis of extensive investigations carried out by NQR spectroscopists for many years. However, the usefulness of these nuclei is rather limited given rheir relatively low abundance in geologic materials.
The possibility of using NaCl as the test material is also presented because of the great interest in storing radioactive waste in salt domes. This, however, represents a sper-al NQR case. Normally, the cubic symmetry forces the quadropole interaction e^qQ to vanish. Two situations, however, can overcome this difficulty acting separately or concurrently. First, the presence of substitutional impurities in NaCl, e.g., Br"for Cl~, results in a distortion of the cubic symmetry of the chloride site which allows a measurable quadrupole interaction. Second, the presence of axial stress on the salt also changes the symmetry and yields a spectrum. In either or both even.8, it should be possible to obtain a aeasure of tie kind and magnitude f strains present. The extent interest in salt seems sufficiently higt. to justify its use.
RESEARCH AiEAS DEFINED
solutions of the three end-stemoer components, •icrocline (KAlSijOjj), albite (NaAlSi^Og), and anorthite (CaA^SijOg)* Thus, any model of chemical, structural, and deformation processes occurring in the earth must almost always include the properties of feldspars. They are present in many rocks t including those which may be suitable hosts for radioactive waste repositories; those foiling reservoirs associated with cbe production of geo-thermal energy; and in many sedimentary rocLs containing or associated with fossil fuels.
Aluminum In feldspars is tetranedrally coordinated. A104 and SlOi tetrahedra form a contin-ous three-dimensional framework. In feldspars formed at low temperature, Al and 51 are usually fully ordered. Yhe plagioclase feldspars form a solid solution series at elevated temperatures, from albite (NaAlSIjOg) to anorthite (CaAlSi20g). This has been found to contain different ordering schemes at lower temperatures, such as shown in Figure 1. In albite, there are & nonequivalent tetrahedral positions, (Figure ! • ) , while in anorthite there are 8 (Figure lc). In intermediate compositions, such as labradorite, partial disorder occurs (Figure lb). At high temperatures (close to the melting point), Al and Si are disordered. Ordered and disordered phases have significantly different free energies. Sucti rf!fff*renres arc important in calculations of stability relations in multicomponent geochemical systems, snd it is essential to determine their Al-Si distribution in order to correlate disorder with this and other important thermodynamic parameters.
Unfortunately, Al and Si have very similar atomic numbers and direct determination of site occupancies by x-ray diffraction measurements is, therefore, not possible- Neutron diffraction studies have been met with more success since scattering amplitudes for Al and Si show a greater difference, but this technique is very costly to implement and suitable equipment is available only in a few places with high-flux neutron reactors, such as the Oak Ridge National Laboratory.
It is common to assume a linear bond length occupancy relationship, and one might expect a linear change in bond length with Lhe chemical
The proposed program has a very broad technical scope and will have to be limited to mission-oriented research. The typical program as defined during fiscal year 1979 may be broken into two areas: (1) mineralogical problems and (2) strain measurement. A brief overview of these areas is included herein.
Mineralogical Considerations
There are several raineralogical problems that are of interest when considering energy related problems and these can be researched once the response of the NQH spectrometer vo alumin nr-containing compounds is fully understood,
Over 702 of the continental crust consists of aluraino-silicatea. The feldspars, predominant aluminosilicates, occur as solid discontinous
Figure 1. Si/Al arrangements in plagiolases. (XBL 793-8875)
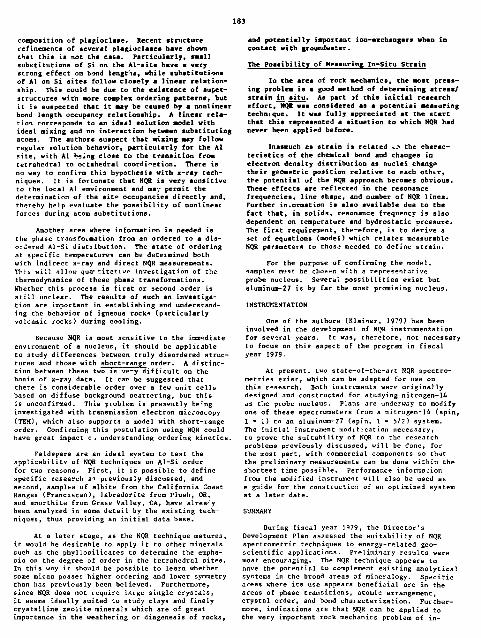
183
composition of plsgioclase. Recent structure refinements of several plagioclaaes have shown that this is not the case. Particularly, smal! substitutions of Si on the Al-aite have a very strong effect on bond lengths, while substitutions of Al on Si sites follow closely a linear relationship. This could be due to the existence of superstructures with more coatplex ordering patterns, but it is suspected that it say be caused by a nonlinear bond length occupancy relationship. A linear relation corresponds to an ideal solution aodel with ideal nixing and no interaction between substituting atoms. The authors suspect that mixing may follow regular solution behavior, particularly for the Al site, with Al being close to the transition fro* tetrahedral to octahedral coordination. There is no way to confirm thia hypothesis with x-ray techniques. It is fortunate that NQR is very sensitive to the local Al environment and as7 permit the determination of the sit** occupancies directly and, thereby help evaluate the possibility of nonlinear forces during atom substitutions.
Another area where information is needed is the phase transformation from an ordered to a disordered Al-Si distribution. The state of ordering at specific temperatures can be determined both with indirect x-ray and direct NQR measurements. Thia will .illow qua'titativn investigation of the thermodynamics of these phas£ transformations. Whether this process is first or second order is still unclear. The results of such an investigation are important in establishing and understanding the behavior of igneous rocks (particularly volcanic rocks) during cooling.
Because NQR is most sensitive to the immediate environment of a nucleus, it should be applicable to study differences between truly disordered structures and those with short-range order. A distinction between these two is ve-y difficult on the basis of x-ray data. It car be suggested that there Is considerable order over a few unit cells based on diffuse background scattering, but this is unconfirmed. This problem IB presently being investigated with transmission electron microscopy (TEM), which also supports a model with short-range order. Confirming this postulation using NQR could have great impact c • understanding ordering kinetics.
Feldspars are an ideal system to test the applicability of NQR techniques on Al-Si order for two reasons. First, it is possible to define specific research ai previously discussed, and second, samples of albite from the California Coast Ranges (Franciscan), labradorite from Plush, OR, and anorthite from Grass Valley, CA, have already been analyzed in some detail by the existing techniques, thus providing an initial data base.
At a later stage, as the NQR technique matures, it would be desirable to apply it to other minerals such as the phyllosilicates Lo determine the emphasis on the degree of order in the tetrahedral sites. In this way it should be possible to learn whether some micas passes higher ordering and lower symmetry than has previously been believed. Furthermore, since NQR does not require large single crystals, it seems ideally suited to study clays and finely crystalline zeolite minerals which are of great importance in the weathering or diagenesis of rocks,
and potentially important ion-exchangers when in contact with groundwater.
The Possibility of Measuring In-Situ Strain
In the area of rock mechanics, the most pressing problem is a good method of determining stress/ strain in situ. As part )f this initial research effort, NQR was considered as a potential measuring technique. It was fully appreciated at the start that this represented a situation to which MQR had never been applied before.
Inasmuch as strain is related v.- the characteristics of the chemical bond and changes in electron density distribution as nuclei changp their geometric position relative to each othtr, the potential uf the NQR approach becomes obvious. These effects are reflected in the resonance frequencies, line shape, and number of NQR lines. Further information is also available due to the fact that, in solids, resonance frequency is also dependent on temperature and hydrostatic pressure. The first requirement, the-efore, is to derive a set of equations (model) which relates measurable NQR parameters to those needed to define strain.
For the purpose of confirming the model, samples must be clio***n with a representative probe nucleus. Several possibilities exist but aluminum-27 is by far the most promising nucleus.
INSTRUMENTATION
One of the authors (Klainer, 1979) has been involved in the development of NQR instrumentation for several years. It was, therefore, not necessary to focus on this aspect of the program in fiscal year 1979.
At present, two state-of-the-art NQR spectrometries exist, which can be adapted for use on thia research. Both instruments were originally designed and constructed for studying nitrogen-14 as t'.ie probe nucleus. Plans are underway to modify one of these spectrometers from a nitrogen-14 (spin, I " I) to an aluminum-27 (spin, 1 = 5/2) system. The initial instrument modification necessary, to prove the suitability of NQR to the research problems previously discussed, will be done, for the most part, with commercial components so that the preliminary measurements can be done within the shortest time possible. Performance information from the modified instrument will also be used as e guide for the construction of an optimized system at a later date.
SUMMARY
During fiscal year 1979, the Director's Development Plan assessed the suitability of NQR spectrometric techniques to energy-related geo-scientific applications. Preliminary results were most encouraging. The NQR technique appears to nave the potential to complement existing analytical systems in the broad areas of mineralogy. Specific areas where its use appears beneficial are in the areas of phase transitions, atomic arrangement, crystal order, and bond characterization. Furthermore, indications are that NQR can be applied to the very important rock mechanics problem of in-

184
s i t u s tress measurement, f i n a l l y , an extended, detai led NQA researr program haa h«asi formalarad which w i l l permit t l confirmation of coaclaaioms drawn during thin i n i t i a l study.
ACKHOHLEDGHERTS
The authors wish to acknowledge the ceatriba-tions to this erograa by Dr. T. lirachfeld, Lawrseit Livermore iaboratoryj Professor K. Marino, neater College of the City university of Hew York; and Professor 3. Wank oC the University of California*
TRACE ANALYSIS OF GROUNDWATERS 5. M. Klainer and J. A. Apps
A sensitive monitor to aeaeurc the presence of trace quantities of ectinides in groundwaters ia essential for detecting minute leaks from nuclear waste repositories and for monitoring the periphery of a waste repository. When this program was initiated it was felt that present nuclear monitors are capeble of detecting major losses from a waste storage area, but that no suitable inatriBsentation existed for detecting and quantifying mishaps which are not readily obvious. In particular, monitoring had to be developed to detect the escape of very-snail quantities of actinides through "pin holes," i.e., hairline cracks in waste packages, or by diffusion through engineered barriers.
When discussing the monitoring problem with DOE and ONWI staff, it quickly became apparent that no definite answer could be obtained to the two essential questions: (a) what species must be •ensured, and (b) what concentration ranges must be covered7 The best advice we received was strive for bOuh maximum sample coverage and sensitivity. A program was thus devised which postulated that the best place to monitor for actiuide leaks ia in the groundwater surrounding the repoaitory, and that this effort should be directed at the detection of those radionuclides which have very long half lives (>10* years}.
For the purpose of program definition, plu-toniuu (Pu) was chosen as the element of interest and detectability *a low as 10~ 1 5 molar was hypothesized. The suggestion that the concentration may be so Low is based on two inputs: (a) Sy definition the proposed monitor is for detecting the smallest conceivable leakage, and (b) most actinides have a very low solubility In water (ia this case, the groundwacex;. In addition, groundwater samples no larger Chan 100 ml and analysis times not exceeding 2 hours were established ss criteria for making measurements.
To calibrate the program goals, nuclear detection techniques were first evaluated, and it was established that nuclear counting techniques (presently considered the most sensitive methods of analysis) would not meet the postulated requirements. Calculations indicate that, aa a aioimur, nuclear detection methods may reach 1 0 ~ 1 2 molar for Pu. A concentration of 1 0 ~ 1 0 molar appears more reasonable for routine measurements. Ir
Berkeley.
tcntncit CUD Das, '/. P . , amd Kama, 1 . L . , 195t. maelear eaadrr-
aole rasouamce ssactroecoey.. mew fork, Academic Preaa.
dardlag, J . C , mate, D. A. , Marino, » . A. , laac?, I . C . f aa* Kleiner, S. H., 1979. A fmluasi BYJA-BFT sasctramtter fee aitiagea-lA. Jaaraal Mat. **••» *- M» p . 2 1 .
Lactam, I . A. C , 19*9. Raclear aaaArapole coupling eeaeteats , mew Tort, Academic Preaa.
should a l so be noted that Pa repreeeate a "bast case** a i taat ioa , Vecaaae there ia ao aatnrel back-grommt of the material . By contrast , aramiaa detect ioa, where mremiwn w i l l normally ba present in gromiiaatera i a ^enadaaeea greater than the proposed detect ioa l i a U , w i l l be l e s s sens i t ive due to i t a aoraal backgroaad contribution.
The analyt ical approach that was «valaa£6d for th i s invest igation employs two special cases of resonance flaoreaceacc. The actanidea are unique i a that their flaoreaeeat apectra have vary narrow feeada amd are e a s i l y resolved. Tans the components of am actinidc mixture cam be identi f ied and quantified, without amy sample preparation, or instrumentation advaacea, resonance flaoresence (the most acaait iva of the l ight interaction tech-niqacs) already ha* a seaai t iTi ty to Pu of 1 0 " 1 1
molar.
The use of resonance fleorescenco was considered from two point* of view: (a) the development of the most sens i t ive and spec i f i c system possible to help define the nltimate requirements of a respoaitory monitor, and (b) the fluorescence epproech which may be most amenable to a long term i n - s i t u measurement system.
For establ ishing the monitorins requirements, much more fluorescence s e n s i t i v i t y i s to be geined by employing special coprecipiration techniques. The formation of the coprecipitate serves several functions: (a) t t concentrates the sample by removing the water, (b) i t performs an i n i t i a l separation of the actinides vhie>* greatly reduces the complexity of the fluorescence spectra, (c) i t removes many of the contaminating compounds which represent background interferences, and (d) i t provides a better matrix in which the actinide can resonate. Furthermore, i f the co-precipitated sample i s calcined before ans lys ia , the v o l a t i l e compounds, which represent the principal background, w i l l be removed. Thus, using a combination of coprecipitation and resonance f loo-resenc*, s e n s i t i v i t i e s to 1 0 ~ ! 5 molar should be readily attainable while several orders of magnitude improvement s t i l l appear pract ical . Thi* i s baasd on our calculations and the work of Gustafson and Wright (1979) and Johnston and Wright (1979) for le^hanides. I t predicts a 1 0 " 1 5 molar calcined sample of Pu w i l l give a aignal-co-noise rat io of

165
greater than 5:1 Cor a 1-sec. analysis tiaa maimg • 1 tf argon laser as the irradiating source.
To prove the potential of the tceaniqae, a. 10~* molar sample of W > 2 2 + was acsjursd, 1 1 M choice o£ 10" 8 aolsr concentration was based on the purity of available spactrographieally sore reagcata. Figure 1 is the speetrua obtained with the operating conditions listed in Table 1. Froa tae data given, that is a spec trust with a S/p" * 4xl0*rl, an instrument sensitivity which has bean deliberately reduced by a factor of 10*, and the iaordin-ately short analysis tiae of 0.3 eec, it can easily be seen thet a sensitivity of better than 1 0 ~ 1 5
aolar U C ^ * appears feasible for situations where there is no ursnium background. This value may be considerably less when groundwaters are analysed.
When it actually become* desirable to instrument a repository, the collection and treatment of samples amy become impractical. In this case, fiber optics could be strategically placed around the canister, in the backfill Material, in tie groundwater, and elsewhere. Fiber optics, 100 V in diameter, can be used so that their aass will be small compared with the aedia into which they are imbedded, and little or no perturbation of the diffusion process pill occur. Bundles of fiber optics of varying lengths can be used to correct for signal loss due to distance. To perform an analysis, pulsed laser radiation is transmitted through the fiber where it excites the fluoresence of th* sctinide. The aetinide then eaits light at a particular wavelength, and this travels back through the fiber optic (at the interval between laser pulses) to a spectral sorter, detector, and the necessary signs1-procesaing electronics. The intensity of the signal will be a measure of how much actinide is in the fiber's vicinity* By using
Table 1. potential sensitivity of fluorescence c?precipitation technique to actinide^.
Operating Available Technique conditions Available enhancement
Laser frequency 5145 A ? ?
Laser power 8 «v 8W 10* Time constant 0.3 sec 5 Bin 30 Background 1 •t
Slit width 100 y 400 U
Collector t/1.2 1
S/N >1000:1 5:1 4 x 10**
Minimum total enhancement available 5 x 10&
Pr >jeeted sensitivity to UOg** (no background condition* lOr^^tf
Frequency -• Figure 1* Fluorescence spectrua of 10"* N DOj +
coprecipiuted with Ca*2- U M E B D : laser frequency, 51'ifrA; laser power., 6 mW; time constant, 0.3 sec; resolution, 3 cm"*1; sl ;t width, 100 u> collector, f/1.2; peak count rate, >10* cps. (XBL S06-7206)

1M
several s trateg ica l ly placed fiber bwadlea, i t should be possible to obtaia a t • / •^dimensions I concentration plot for the actiniae:.
As e result of the i n i t i a l study performed in f i sca l year 1979* i t has been possible to define several questions that need to be investigated before a final •ystaai can be designed. For the: t e s t system these include:
1. Whet complexity of act inia* separation ia required for unman ignore ident i f icat ion of the contentr of groundwater samples?
2 . How many suitable copreeipiration materials ere available?
3 . Does the coprecipitant add to the fluorescent background?
U, Is i t possible to confirm the projected sens i t iv i ty to a l l of the actinidea of interest?
5. What technique should be used for obtaining groundwater samples?
6. Can containers and col lect ion media or both be obtained that assure the integr i ty of the groundwater samples at l tT 1 * aolar?
For the repository system the questionJ to be answered are different 1:
1. What effect does the u«* and se lect ion of fiber optica have on ultimate sens i t iv i ty?
INTRODUCTION
The disparity between energy production and demand h«s led to increased research into using aquifers for long-term, large-scale storage of thermal energy. Aquifers are well suited to thermal energy storage because of their low heat conductivit i e s , large volumetric capacit ies , and a b i l i t y to contain water under bigh pressures. At present, there are severe1 f ie ld experiments and f e a s i b i l i t y and modeling studies in which the technical, economic, and environmental aspects of aquifer atorage are being studied. A survey of aquifer project* throughout the world (Tseng e t a l . , 1980) was prepared for a conference, Recent Trends in Hydro-geology, held at Lawrence Berkeley Laboratory in Februrary 1979. The following summary describes some of the projects surveyed.
SUMMARY OF CURRENT PROJECTS
Field experiments have been conducted in Switzerland, France, the united States , Japan, and
*Visit ing s c i e n t i s t from University of Lund, Sweden
2 . Cam the t i t e r optica be coated to increase s ens i t i v i ty?
3 . what i t tan npfisnmi daeigm for the and of a f iber opt ic to aesnra mar imam aemaitivity, aelf-cleemine;, a te .?
4 . What a n the reemir-maeats of the spectral sorter wan* no mremmratiom of th* amenta ia n o u i b l e ?
5 . What £a the ultimate aemaitivity of th* resonance flaorescaacn cachaiawa mains f iner optica?
The** ami other anastions that may aria* w i l l ha answered dnring a thrae-yaar program bagiaaiag in a id f i s c a l year 1990, fended by the Office of Nuclear wait* Iso lat ion .
The anthoro wish to thank Dr. *c. • irecnfald of Lawrence Liwrmoco Laboratory for obtaining the aaactrmm (Fianra 1) oa hia l ea ir flmorimeter Dr. D. ferry of Lawraace Berkeley Laboratory prepared that ODj** aaaplea.
UFIUSCTJ CKJD
Cnstafaoa, P. J . , and Wright, J . C , 1979. Trace analysis of laathaaidea by laser exci tat ion of prec ip i tates , anal. Cham., v . 51 , p. 17*7.
Johnston, * . * . , and Wright, J . C . 1979. Tract aaalyaia of mon-flaoreeeaat ioaa by assoc iat i v e c luster in" -*ith a f Increscent probe. Anal. Cham., v . 51, p. 1774.
the ^j-ople's Republic of China. In 1974, at the University of acmchatel, Switzerland, 494 m 3 of hot (51°C) water was injected into a shallow, phreatic aquifer. After a storage period of 122 days, 16,370 m 3 i f water (more than 30 times the inject ion volume) was withdrawn. The small inject ion volume, together with the high permeability of the aquifer which caused the l ighter not water to r i s e , re sulted in a large heat loaa through the upper un-confined layer mad a beet recovery rat io of only 401.
Field work in France began in 1976 with the Bonnaud experiments. The f i r s t ser ies of experiments consisted af three successive inject ion and production cycles and was followed by a second ser ies consist ing of four cyc les . The Cempuget experiment (1977 to 1978) was a fu l l - sca le storage project intended to store enough heat to meet the needs of 100 housing uni t s . During a three-month injection period, 20,000 m 3 of warm (33.5°C) water, heated by simple solar col lectors and heat pumps, was injected into a shallow unconfined aquifer. The experiment consisted of two waiting and withdrawal periods during which 17,000 m 3 of water waa withdrawn. As in the case of the Swiss experiment, the water waa stored in a shallow, phreatic
SURVEY OF AQUIFER THERMAL ENERGY STORAGE PROJECTS C. F. Tsang, D. L. Hopkins, and C. Hellstrom

167
aquifer, resulting in a large heat loss through the unsaturated zone and a low energy recovery ratio (29Z). Contributing to the lota of efficiency V M a decrease in air temperature and a decrease in the thickness of the tmsc^ursted zone frosi 3 m to I m during the experiment.
At Auburn University in the United States, a series of hot water storage experiments are ia progress. Tor a preliminary experiment initiated in 1975, 7,685 a 3 of warm (36.4°C) vater vaa obtained from the effluent discharge canal of a power-plant and injected into a confined aeaifer. After a storage period of 44 days, 14,260 a 3 of water was withdrawn, yielding an enegy recovery ratio of 6BZ. ?or a second set of experiments, 54,784 m 3
of water was obtained from a shallow seeiconfined aquifer; the water was then heated and injected into the deeper confined aquifer* After 51 days ox storage, 55,345 a 3 of water waa withdrawn, yielding an energy recovery rate of 651. For a second cycle, just completed, an energy recovery rate of 743 was obtained. The improvement can largely be attributed to the aquifer atill being warm from the previous cycle in which production stopped at a temperature 13°C above ambient.
At Texas AIM University, the economic and technical feasibility of cold vater storage in aquifers is being studied. In the winter of 1978 to 1979, water was pumped from a shallow aquifer into a 5000 ft 2 cooling pond. When wet-bulb temperatures dropped below 50°F, vater waa pumped through a spray system and cooled to the air teaperature. A total of 31,800 m 3 of chilled (8.9°C) water was reinjected into the aquifer and stored until summer when it was withdrawn and used in a heat-exchange process for air conditioning.
A second cold water storage experiment is under way at Yamagata University in Japan. During summer, cold vater is withdrawn and used to air-condition a commercial building while warm waste water is passed through a spray system on the roof of the building for heat collection. After passing through a filtration tower, the water is further heated by a heat excuanger and recharged through a second well. The process is reversed during winter when warm water is withdrawn and used to melt snow. For the first experiment, a total of 8,843 w 3 of warn (23.7°C) water waa Injected into a confined, 19 « thick, sand-and-gravel aquifer. After a storage period of three months, 9,930 m 3
of water was withdrawa yielding an energy recovery ratio of approximately 40Z. Between January and March 1978, some 9,430 m 3 of cold (5.3°C) water from aelted snow was injected into the aquifer. Water withdrawn 4 months later had an average temperature of 14°C. Failure to get cooler water may be attributed to the small volume of injected watai and the short distance between injection and production wells, which resulted in che mixing of vai~i and cold water.
In China, use of aquifers for thermal energy storage largely developed out of reinjection experiments in Shanghai designed to reduce subsidence and raise groundwater levels that had dropped because of widespread use of groundwater by factories. Based an large-scale experiments conducted during the 1960s, hydroyeologists in Shanghai concluded
that by aaiag rciajactioa easy m e n able to affectively control embsidamce and grovadvater levele, and that it mm* possible to store cold water U winter for owaatr mat. in air coaditioeiag. These conclusions led to a city-wide rtinjection program ia which 70 factories meed 134 deep walls for simmltaeeooa recharge. Crowaewater sroeaced, euriag saaaer mad .a very lew taaperatnre, aad tawa hacama a mew somrc* of chilled water for iaaastrial use* The program •**«• ia ewteeeaeat years so Chat there are mow several aeadred walla ia uaa» and it has been axasaded to iaclsAe amamar injection of hot water for winter ate- Becaeae of the eecceaa at Shanghai, maay cities have adopted similar reinjec-tita aad thermal energy storage programs.
Generally, field projects ts izzs have been of relatively aaall scale and have used water of Moderate temperatures (not greater than 55°C or leas than 5°C). Moat of these experiaente focused on obtaining preasare and temperature date with the objectives of meicratending beet and fluid flow in the aquifer ecd validating numerical models. A need exists to both extend the temperature range of the foveaLigations and to exaaiaa the concept of energy storage on a larger scale.
Several numerical models to study energy storage in aquifers are under development although details for moat are yet to be reported. Among these are studies being condut d by Lund University, Sweden; Bureau de Kecher - Ceologiquea et Hini-erea, France; Institute de Production d'Energie de lT-eole rolytecbnieue Teeerale de Lausanne, Switzerland; and Lcwrence Berkeley Laboratory.
At Lund University, Sweden, a two-dimensional, finite-difference model has been developed to study hot-water storage in eakera (long and narrow glacial deposits of high permeability). Analytical studies have also been conducted to examine topics related to thermal storage, including buoyancy tilting of a vertical thermal front, entropy lnalysls of numerical dispersion, and eff*-. of teaperature—dependpnt viscosity in a two-well extraction-injection system.
Several models have been developed by the Bureau de Recherches Geolo&iques et Hinieres (EKGH), France, to study fluid and heat flow, dispersion, and the effect of varying physical parameters and operating conditions on the teaperature of water produced from a single veil s/ntew. Programs developed at BRGH have been used to model the Bonnaud experiments, described previously.
A three-dimensional finite*-*lement model for diffusion and convection has been developed by the Institut de Production d'Energie de l'Ecole Polytechnique Federale de Lausanne, Switzerland.. The model has been used to simulate an aquifer heat-storage system with vertical flow between two horizontal networks of drain pipes.
At Lawrence Berkeley Laboratory, we are using program CCC (conduction, convection, and compaction) to model the Auburn University field experiments (see Trang, et al., this report) and to perform parameter sensitivity studies. CCC employs the integrated finite-difference method and is a fully three-dimensional model incorporating the effects of complex geometry, temperature-dependent fluid

188
properties, gravity* and land subsidence or uplift. The code baa b«aa validated against a ammber of senianalytic aolutiona and baa been meed for several generic studies of aquifer thermal energy storage.
We have obtained some initial results from our parameter sensitivity study. In simulating the Auburn University field experiment, the vertical/ horizontal permeability ratio (K^/Kfa) ia the eeei-fer, and the permeability and atorativity in the aquitards, could not be determined diracLly and had to hi estimated. Our parameter stwdy indicates that the estimated recovery factor is very aensitive to permeability and the Ky/Kh ratio. In the Auburn simulation, using a value of Kv/Kfa equal to 0.1 is critical to obtaining good agreement with the field data. Increasing aquitard permeability by a factor of 10 had only a alight effect on energy recovery* The effect on energy recovery was also slight when thermal conductivity was increased by a factor of 2, but significant changes were observed when thermal conductivity was increased by a factor of 20.
To study the effect of partial well penetration on the results of the Auburn experiments, a simulation was run assuming full penetration of the well. Energy recovery was estimated to be 0.69, which differed only slightly from the value 0.68 obtained for the partial-penetration case.
INTRODUCTION
Reservoir engineers often consider well test analysis as an initial, short-term field test carried out before other reservoir activities can begin. When conventional type-curve analysis is employed, this is generally true because flow rates must be held constant or carefully controlled during the well test. Hovevecr LBL baa developed a computer-assisted well test analysia method, program ANALYZE (McEdwards, 1979), that allows arbitrarily varying flow rates of several production or injection wells. The Method can also treat simultaneous measurements from several observation wells. Hence, well keatm can be conducted concurrently with other reservoir activities, as long as flow rates and pressures are measured.
As an example o£ long-tsrm w*ll test analysis, ANALYZE has been used with data obtained from an aquifer thermal energy storage field experiment conducted by Auburn University in Mobile County, Alabama (Molz et al., 1977, 1979). Parts of two hot water injection/storage/recovery cycles, as well as a conventional 36-hr pumping te3t were analyzed. Results of the three testB are consistent and agree well with the results of the USGS (Papadopulos and Larson, 1976) obtained using conventional type-curve analysis of the 36-hr pjmiping test.
1m addition to field •nmcrimnmta mad modeling stmdiee, a mmmWr of feaaitility stadias of amargy storag« in aquifers arc also under way. Projects rare* from gamaral acomamic and systems analyses to evaluation and eeaiem oE pilot plants, the technical work being don* entails field and laboratory invnatigatioms of t W hydrogaological, chemical, and biological aapacta of aquifer storage. Several program call for regional geological surveys to locat* possible storage sites and many studies are aimed at specific amplications.
Ixperiaents to data illustrate tan need for further research and development to ensure aucceae-ful implementation of am aquifer storage system. Areas identified for further research iaclnd* shape and location of the aerodynamic and thermal fronts, optimal flow rata and formation permeability, thermal dispersion, natural regional flow, land subsidence or uplift t thermal pollution, water chemistry, wcllbore flagging and heat exchang* efficiency, and corroaion control.
JtEFEtEVCt CITED
Tsang, C. F. v and Hopkins, D. L., 1980. Aquifer thermal energy atcrage, a survey, in •araaimhaui T. R., ed., Recent trends in hydrogeology. Berkeley, Lawrence Berkeley Laboratory, UL-8977 (in prep.).
PROGRAM ANALYZE
The program ANALYZE treats well test data for the reservoir characteristics transmitsivity, kh/u., storativity, *ch, the location, and type (barrier or leaky) of a linear hydrologic boundary. The program rigorously handles variable production ratea from as many mt 20 production *ells, and can aimultaneously analyze pressure data from as many as 20 observation wells. The program models production wells as fully penetrating line sources or sinks and the reservoir as a constant thickness, laterally infinite, isotropic, porous medium.
The computation basis of ANALYZE is a least-squares minimization routine that u<*ee parameters kh/u, *ch, and the angle and distance to a hydro-lcgic boundary to calculate the pressure change mt locations and times corresponding to observed pressure data. The routine then adjusts the values of the parameters (collectively called X J ) so that the sum of the normalized squared difference between calculated pressure changes and observed pressure changes is a minimum. The set of parameters associated with the minimum is then accepted as representative of the reservoir and well system. Written mathematically,, we minimize
MULTIPLE-WELL VARIABLE-RATE WELL TEST ANALYSIS OF THE AUBURN UNIVERSITY AQUIFER THERMAL ENERGY STORAGE FIELD DATA C. A. Doughty, D. G. McEdwards, and C. F. Tsang
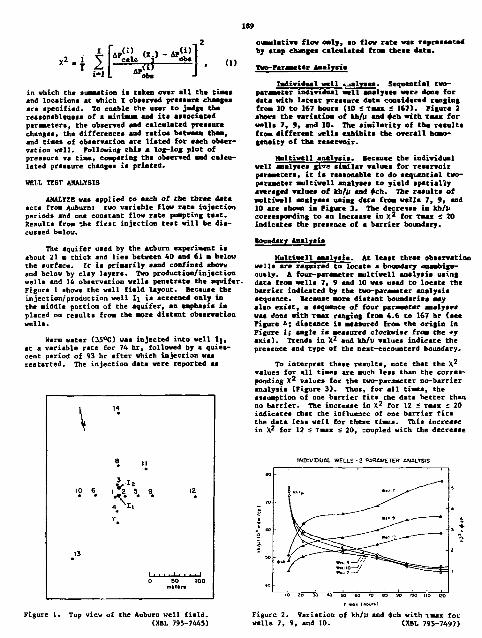
189
i~l L A Pob«
.«> <1)
in which the suaaation is taken over all the times and locations at which I observed pressure changes are specified. To enable the user to judge the reasonableness of a minimum and its associated parameters, the observed and calculated pressure changes, the differences and ratioa between than, and tiaes of observation are listed for each observation well, rollowing this a log-log plot of pressure vs tiae, coapsring the observed and calculated pressure changes is printed.
WELL TEST ANALYSIS
ANALYZE was applied to each of the three data sets froa Auburn: two variable flow rate injection periods and one constant flow rate puapting test. Results froa the first injection teat will be discussed below.
The aquifer used by the Auburn experiaent is about 21 a thick and lies between 40 and 61 a below the surface. It is primarily sand confined above and below by clay layers. Two production/injection wells and 14 observation wells penetrate the aquifer. Figure 1 shows the well field layout. Because the injection/production well 1} is screened only in the aiddle portion of the aquifer, an eaphaais is placed on results froa the aore distant observation wells.
Warn water (35°C) was injected into well lj, at a variable rate for 74 hr, followed by a quiescent period of 93 hr after which injection was restarted. The injection data were reported as
\ 1*
% .1
10 6 1 ~Z 5 9 •«• • •
7%
12
13
r - ' l - r * '
13
0 5 0 100 m t l a r t
cumulative flow only, so flow rate was represented by step changes calculated froa these data.
Two-Parameter Analysis
Individual well ^alvses. Sequential two-paraaeter individual well analyses were done for data with latest pressure data considered ranging frost 10 to 167 hours (10 £ Tsuuc < 167). Figure 2 shows the variation of kn/u and s)ch with Teuuc for wells 7, 9, and 10. The similarity of the results froa different ^ells exhibits the overall homogeneity of the reservoir.
Multiwell analysis, lecause the individual well analyses gi^e similar values for reservoir parameters, it ia reasonable to do sequential two-parameter multiwell analyses to yield spatially averaged valves of kh/p and pen. The results of multiwell analyses using data from wells 7, 9, and 10 are shown in Figure 3. The decrease in kh/p corresponding to an increase in X 2 for Taax < 20 indicates the presence of a barrier boundary.
Boundary Analysis
Multiwell analysis. At least three observation wells are required to locate a boundary unambiguously* A four-parameter multiwell analysis using data from wells 7. 9 and 10 was used to locate the barrier indicated by the two-parameter analysis sequence. Because more distant boundaries may also exist, a sequence of four parameter analyse* was done with Tmax ranging from 4.6 to 167 hr (see Figure £; distance is measured from the origin in Figure 1; angle is measured clockwise from the *y axis). Trends in X 2 and kh/li values indicate the presence and type of the next-eneounterd boundary.
To interpret these results, note that the X 2
values for all times are much less than the corresponding X 2 values for the two-parameter no-barrier analysis (Figure 3 ) . Thus, for all times, the assumption of one barrier fits the data better than no barrier. The increase in X 2 for 12 < Tmax < 20 indicates that the influence of one barrier fits the data less well for these tines. This increase in X 2 for 12 < Taax < 20, coupled with the decrease
INDIVIDUAL WELLS-2 PARAMETER ANflLrSfS
10 20 30 40 SO 60 TO 83 90 (00 I r£> CO
Figure 1. Top view of the Auburn well field. ( M L 795-7445)
Figure 2. Variation of kh/ii and $eh with Tmax for wells 7, 9, and 10. (XBL 795-749?)

190
UULTIWELL-2 PARAMETER ANALYSIS inu.TlW£U.-4PMUVCTER AKALYSG
o ao
• • NO
•m
•w>
-vof
- f •40
•40 -w
•y '• 1 1 1 • • NO
•m
•w>
-vof
- f •40
•40 -w
t**at,
* * * N
3 0 0 -
• • NO
•m
•w>
-vof
- f •40
•40 -w
t**at, fc •
• NO
•m
•w>
-vof
- f •40
•40 -w
t**at,
• * ' * • '
• • NO
•m
•w>
-vof
- f •40
•40 -w
t**at,
"* • « * —~_»-
• • NO
•m
•w>
-vof
- f •40
•40 -w
U " *' —~_»-S3 *= «C «o »a n K m in i x
Figure 3 . 7, 9, and
Figure 4. Four parameter analyeea: distance ia measured froa tba origin ia Figmre 1, aagla li aeas-
Multiwell analyses uaing data from valla ured clockwise from the *j axis. (XSL 795-7476) 10. (XBL 795-7471)
in kh/u for the same time period, euggeata that a second barrier influence* preaaure data for t > 12 hours. Thus, the shortest time data, 4.6 < Tmax £ 12, determines the reservoir parameters and the location of the firat harrier, while subsequent variation in kh/u and X 2 indicates the presence, but not the location, of a aura distant barrier. The scatter of data and unaccounted-for variations nay be due in part to the variable flow rata and manner in which it was modeled. Also, very few data points are available for email values of Tmax, so the results of small Tmax analyses may not be as meaningful as results of large Tmax analyses. Although the influence of a aecond barrier ia indicated after 12 hr, analysis of data for large values of Tmax may still he used to determine the location of the firat barrier, if it* affect ia dominant. Angle and distance values are leas scattered for this range of Tmax than for smaller values of Tmax, so the barrier location given by the analyses for which Tmax < 12 ia thought to be the most realistic result.
In view of the above discussion* the set of parameters chosen to represent the aquifer are: kh/u - 0.115 x 10 7 mdWcp; <frch » 0.464 x 1 0 - 3 ; angle - 315°; and distance - 330 at.
COttTTJlSIOM
The values of kh/u, fch and distance agree well with the DSGS results, which made use of the 36-hr constant flow rate ptamplng test. In addition, the use'of AKALYZE allows determination of the angle to the barrier, which ia not possible using type curve analyfia. These reeulta are substantiated by analysis of the soaping t u t and a later injection period uaing ABALYZE.
EEFEBERCES CITED
KcEdwarde, Donald, 1979. Multiwell variable rate welt teat asalyaia (Fh.D. dissertation). Berkeley, Lawrence Berkeley Laboratory, LBL-9459.
Hole, F. J., et al., 1977. Subsurface waste heat storage. Experimental atudy. , 1979. Thermal energy atorage in confined aquifera. fflttl preprint.
Fapadopuloa, S. S-, and Larson, S. P., 1978. Aquifer atorage of heated water; Part II, numerical eimulation of field results. Ground Water, v. 16, BO. 4, p. 242-248.
NUMERICAL SIMULATION OF AUBURN UNIVERSITY AQUIFHl THBtMAL ENERGY STORAGE HELD EXPERIMENTS C. F. Tsang, T. Buscheck, and C A. Doughty
INTRODUCTION
Earlier LBL work on seasonal thermal energy storage in aquifers has included comprehensive generic calculations based on a numerical model to calculate the coupled heat and fluid flows in a three-dimensional, complex-geometry aquifer system. Many of the results have been published in a series of papers (Tsang, Lippraann, and Witherapoon, 1976, 1978; Tsang et al., 1978). During fiscal year 1979, LBL work has included a numerical simulation of the
hot water storage field experiments recently completed by Auburn University in Mobile County, Alabama.
The purpose of such a study is twofold. First, in the Auburn field experiment will be obtained. This will not only give us knowledge of the relevant heat and flow behavior, but will fou..-* on t ie effects of unexpected factors that nay exist in a field experiment, such as injection well clogging. Secondly, a good simulation of the field data will

191
validate our numerical model and give us confidence in its use aa a design and prediction tool.
SIMULATION OF THE AffBOWf FIELD EXFERDCnT5
The experiments by Auburn University involved two injection-storage-recovery cycles. (Details nay be found in Hfllz et al., 1980). The first six-month injection-atorage-producticn cyele involved the »toraje of 55,000 a' of water at about 55°C. The injection took. 79.2 daya, the hot water was then stored for 52.5 days, after which it was produced at an average rate of 245.6 spa until the recovered water teaperature fell to 32*8°C. At that point 662 of the injected energy had been recovered. The second injection-storage-production cyele was carried out in essentially the sane manner, using 58,000 a 3 of water at an average teaperature of 55.4°C. When the produccion temperature had dropped to 33°C, a recovery of 761 of the injeeted energy had b e n realized.
first stage of the viaulacion involved the determination of the hydraulic parameters of the aquifer (the transmis&ivity and storativity), and the location of a linear hydrologic barrier through well test analysis. Conventional well teat type curve analysis techniques require a constant or carefully controlled flow rate. To gat around this limitation, LBL has developed a cuaputer-aasiated analysis aethod, program ANALYZE (Taang et al., 1977; McKdwards and Tseng, 1977) that can handle a system of several production and injection wells, each flowing »t an arbitrarily varying flow rate. This program was applied to the Auburn case, treating the injection period also as part of the well test data (Doughty et al., 1979).
With parameters thus obtained, the LBL three-dimensional, conplex geometry, single-phase model, CCC, was used to make detailed modeling studies. A radially symmetric mesh was assumed. There it one major hydrologic parameter that waa not determined by well test analysis. This parameter, the r«tio of vertical to horizontal permeability, has to ba inferred from field experience and parameter studies. AEter aaking a preliminary parameter study, we decided to uae the value of 0.10 for this ratio. The same i \o was suggeted by the USGS (Papadopulos and U -on, 1978).
Because neither the injection flow rate nor temperature was held constant, it was necessary to break up both the injection (and production) ^•eriods into segments having average flow rate and teaperature values, conserving inferred mass and energy (Figure 1). Results of :he simulation include the recovery factor, plots of ptoductinn temperatures versus time, and temperature contour plots and temperature profiles at various times during the injection, storage, and production periods. Both tha first and second cycles hav£ been successfully simulated.
For the first cycle, the simulated recovery factor of 0,68 agrees well with the observed value of 0.66. For the second cycle the simulated value is 0.78, and the observed value is 0.76. The details of the comparison between simulated and observed energy recovery can be studied in production
TIP* i«c^«S> aauni (KuecTJOM F U W M T E AND TBusownmc
FiasTctat Figure L. Injection flow rate and temperature versus time, and the average segments used in the simulation. (X1L 795-7460)
temperature versus tiae plots (Figures 2 and 3 ) . For both cycles, the initial simulated and observed temperature* agree (55°C). During the early part of the production period, the observed teamerature decreases slightly faster than the aiauletcd teaperature. During the latter part, the simulated teaperature decreases faster than the observed teaperature so that by the end of the production period the simulated and observed temperatures again agree (33°C). The discrepancy over the uhole range is, at most, 1 to 2 degrees.
Temperature contour maps of vertical cross-sections of the aquifer at given times (Figure 4) show the details of buoyancy flowt heat loss through the upper and lower confining layers, and the radial extent of the hot water in the aquifer. Buoyancy flow is important in thia rather permeable system. Comparison with temperatures recorded in observation wells throughout the aquifer show that the simulated temperature distribution agrees generally with observed temperatures. However, the
Figure 2. Observed and simulated production temperature as a function of time for the f*rst cycle.
(XBL 798-11428)

'S: ^
=- 50
Tine iMtwtsi U a U U moOUCTKM TtWCMTUK
SECOND CYCLE
End of injtclion 0spth4.6m
— Simuloltd aObttrvtd
Figure 3 . Observed and siaulated production i Cure a* a function of time for the second cycl«.
( » L 798-11426)
discrepancies are auch larger than the difference! between calculated and observed production teapera-turea. Apparently there are local variations in the aquifer which tind to average out. leapersturc versus radial distance at given depths and tiates are also plotted (Figures 5 and 6) and, frosi thaaa profiles, the effects of thermal conductivity and dispersion on the shape of the thermal front can be studied.
In order to prove the aesh-independence of these results, the first cycle haa been Modeled again, using first a coarser seen (double the radial step) and then a finer mesh (half the radial step). The coarse aeah recovery factor is 0.67, to be coopared with a value of 0.68 using our first each. Interestingly, the coarse acsh simulation yields
20 30 40 Radial distance (m)
Figure 5. Temperature versa* radial distance at the end of injection period for the first cycle. Shaded curve indicates aiaulated values, boxes show observed values. (X8L 795-7463)
a recovery factor slightly closer to the observed value than does tbe original simulation, so the increase! numerical dispersion aay be acre closely simulating theraal dispersion due Co local heterogeneities in the aquifer. Teaperature as a function of radial distance (Figure 7) and the production teaperature mm a function of eiae (Fi«t*r« 8) show tbe insensitivity of the results to the aesh chosen.
4UBRM02
i-t900»»*
s^
^ " ^ / l i j -U S M ^ " ^ /
Figure 4. Simulated teaperature contours in a vertical cross section of the aquifer at the end of the injection period of the first cycle, observed temperatures are also indicated. (XBL 795-7452)
I ••• r i i 1 i —
t ™***^Z?V
i: \ r End of second cycle injection ft %
Depth 4.8m ft, X _ — Simulated <\ ^ V
O Observed \ * ^ ^ " c
— — Fir*t cycle - e n d o l injection $ v ^ b ^ w
70 » c 10 20 30 < 0 50 SO 70 » Distance (mj
Figure 6. Teetperatare versus radial distance at the end of injection period for the second cycle. The broken curves shows the simulated values for the first cycle, for conparison. iKAL 798-11429B)

193
60
Depth'13 tn
Depth • 17m
0 10 20 30 40 50 60 70 80 Distance (m )
Figure 7. Simulated te .per.ture versus rad'al d i s tance a t the end of the in jec t ion period for the coarse , normal, and fine aeshes. (XBL 7911-13295A)
MESH VARIATION
i - 5 = =5
c ° * s ^ " " * * * • * » -
1
J l J iv i i . > i> •. » I «W
P L U S "Oft M E T TEAK
la the cosine r M r i further generic and paraa*-ter atadies will b* made, including calculations of effects of vtryimg the ratio of vertical and horizontal pemealulitiea, the atorativity parameter, the injection temperature and effects of the well partially or fully penetrating the aquifer.
REFOEKCES CITED
Mughty, C , KcEdvarda, D., and Taang, C. P.. 1979. Maltiple well variable rate well teat analysis of data fro* the Auburn University thermal energy storage experiment. Berkeley. Lawrence Berkeley Laboratory, LBL-10194.
McEdwarda, D.* and Tesne, C. P., 1977. Variable rate multiple will teating analysist in Proceediojta. Invitational Veil Teating Symposiua. Be'kcley, Lawrence Berkeley Laboratory. LBL-7027, p. 92-99.
Hols, P. J.» Parr. A. D- ; •*»• Andersen. P. P., 1900. Experimental study of the storage of thermal energy In confined aquifers. Water lesources Research Institute. Auburn. Alabama, 37 p.
Papadopulos, S. S., and Larson, S- P., 1978. Aquifer storage of heated water; part II* numerical aianlation of field results. Ground Water, v. 16. no. 4., p. 242-248.
Taang, C. P., Lippmenn, M. J., and Witherspoon, P. A., 1976. numerical modeling of cyclic atorage of hot water in aquifers. (Presented at Symposium on Uss of Aquifer Systems for Cyclic Storage of Water). Tulsa, Aaterican Geophysical Union. , 197S. Underground aquifer storage of hot water froai aolar energy collectors, in Proceedings, International Solar Energy Congress. Pergamon Press,
Tseng, C. F., HcEdwards, D. t and Xarasimhso, T. H-, and Witherspoon, P. A., 1977. Variable flow well test analysis by a computer assisted •etching procedure. Dalian Society of Petroleum Engineers, SPE-6547.
Tseng, C. P., Buscheck, T-, Mangold, D., snd Lippmann, M. J.< 1978. Mathematical modeling of thermal energy storage in aquifers, in Proceedings, Aquifer Thermal Energy Storage Workshop. Berkeley, Lawrence Berkeley Laboratory, LBL-8431.
Figure 8. Production teuperature versus time for the coarse and normal meshes. {XBL 7912-13756)

fp/

NUCLEAR WASTE ISOLATION
K number of different rock types are now being evaluated, both in the Doited Statea and eleewher*, as potential repository host rocks for nuclear waste. Properties such as Mechanical response to theraal loading, fluid f lov through fracturee, an* chemical eorptivity have not bean systematically investigated for fractursd rocks t yet they aud their interactions must be understood or their magnitude ascertained before confidence can b* had in predictions about disposing of wastes in repositories in fractured nedia. Thus fundamental investigationa on geological aspects of fractured media continue to be expanded as v e i l as experimental and Held research projects of store applied natures.
The Swedish-American cooperative prograaj( be* gun in July 1977, i s a f i r s t -o f - i ta -k ind experiment for fractured rocks. The fundamental qucetiona about how to characterise materials and properties and hov to measure them are being approached both experimentally and theoret ica l ly . Preliminary results from experiments in the mine at Stripa, Sweden, have already been obtained. The correspondence of these resul ts with predictioue promi»^« co lead to better predictions and to shape the jeat generation of experiments, which wi l l improve our understanding of the physical and cheaical phenooena chat control waste migration.
LBL i« 2i50 investigating a variety of other copies central co radioactive waste i so lat ion; these range froa theoretical to laboratory s tudies .
surveys of the 1 i terator* , mrd computational s tud ie s .
Trauport through backfi l l—the engineered barrier between waste cemleter and rock—along with transport through the reck i t a e l f i a •e lagcomalu-ered. Groundwater dating* v i a tk« * * c / l 3 * t l t a c V aiewe, to enable determination of the flow of water in aquifers , i s ante* dewelDaaamt for snai l sample a i t e a . Theoretical atmdiea of temperature-drivera c irculat ion ia fractmrta around a repository are being calculated,, and a study raa made to catalog exiatirig or recently abandoned imtnea in c r y s t a l l i n e rocks that rould presSbTy be wand for tn-sf tu t u t f a c i l i t i e s for rock mechanics, 'Hydrology, and geo-chemistry. Additional work i s En progress m understanding rock-water-vute interactions in basalt and on tkaoraticat and experimental evaluation of waatc transport in b e a n i e shale , and quarts aoaxoult*.
The projects are conducted under the Univtraity of California Contract M-7405-EJC-48 with she U.S. Pepat taunt of Energy. Funding for the {fuclear Vast* Isolat ion Program la administered by the Office of Wvclear Waste Iso lat ion at ba t t e l l e Memorial Ins t i tu te .
By i t e many itsterseSatad a c t i v i t i e s , the Earth Srfiencee Division i s ac t ive ly involved in developing the science and tecnnology that w i l l be necessary to i so la te wastes. Deta i l s of these act ivi t ies) are gnvea in the foiflowing section.
195

196
Swedish-American Cooperative Program
THERMOMECHANICAL EXPERIMENTS AT STRITA M. Hood, T. Chan, and P. Nelson
INTRODUCTION
One of the main areas of concern regarding the disposal of radioactive waste materials in subsurface geologic repositories is the response of the in-situ rock suss, comprising the respository and the surrounrfiogs, to the thermonechanicsl loading •.h**- '-ill be i.-duced by the heat generating vaste canisterst In order to assess quantitatively the response of a granitic rock suss to loading of this type, a series of experiments is being conducted at the Strips mine in Sveden. The layout and design of these experiments are described in previous annual reporta (1977 and 1978) of the Earth Science Division and by Hood (1979) and Cook and Witherspoon (1978). These experiments were begun in June 1978, and are continuing. During 1979 the heaters were turned off and the response of the rock during the cool-down period was observed. In a radioactive waste repository the rock mass will undergo both a heating and a cooling cycle. Therefore it is important that the behavior of the rock during both phases of the cycle be determined.
THIS YEAR'S ACTIVITIES—DATA AHALYSIS AND HUDEL DEVELOPMENT
A consistent, and puzzling, feature of the results from these heater tests is that although the temperature* measured through th rock mass accord well with predictions, the displa-eaents and stresses are less than those predicted by a factor of aore than 2. This result is difficult to explain eince if the rock is being heated then expansion should be taking place. Checks were made of the performance of the instruments and the calculation routine, but errors sufficient to explain this large discrepancy were not discovered. The: analysis investigating this discrepancy has concentrated on the displacement measurements since these are easier to make and much easier to interpret than caress measurements. Displacement readings by the extersometers demonstrate two distinct modes of behavior. First an initial phase is observed immediately after turn-on of the heaters when displacements ere completely unpredictable und are very much less than the calculated values. Trie second phase occurs when the r assured displacements are less than the predicted values by s constant amour L*. For many of these instruments the ratio of the measured to the pt^dicted displacements during this second phase is about 0.4- (Hood, 1979).
The initial nonlinear phase is difficult to explain and possibly may be caused by absorption of the early expansions of th*» rock into pre-existing discontinuities within the mass. This hypothesis is supported by evidence from an independent experiment where an increase in th--* velocity of ultrasonic waves through the rock in the vic'nity c*f the heater was observed (Hood et al., 1979). The sub
sequent phase indicates that th* rock ia respomdimg to the loading ia a predictable manner hut with a magnitude less than the calculation* forecast. Behavior of thie kind is comaistamt with a difference in values for the rock properties for am in-situ rock mass and for those need ia the calculations.
The original calculations for the temperature, displacement, and stress fields* mhich ware made before the start of the heater experiments, idealised the rock as a homogeneous, isotropic, perfectly elastic eontinoum with constant materiel properties. The sain reason for using these assumptions was that the thermal and thermomechamlcal properties for Stripe granite had been determined by laboratory testing using a very luited number of smell intact rock specimens st the time the calculations were canied out. Only therttel conductivity had been measured ss a function of temperature and thi*i had been found to decrease linearly with temperature at the rate of about 0.1 perce&t per degree Centigrade.
The thermal field waa obtained using a closed-form solution of the linear neat conduction equation for a finite-length line source (Chan et al., 1974). This temperature distribution Chen was applied as thermal loads to calculate tberaoelsstie displacement* and stresses using a modified version of the finite element rode SAP IV (lathe et al., 1974). The SAP IV code i.as been modified to achieve higher computational efficiency and to improve the accuracy of thermal strain and stress calculations. This Lawrence Berkeley Laboratory/Lawrence Livemore Laboratory version has been docissented by Sackect 0'*79). The constant material properties used in these calculations are given in Table 1.
The model used for prediction of displacements and stresses in the experiments described iv this paper was axisymmetric and used boundary conditions that took account of the mine excavations. Details of these thermoelastic calculations art given in a report by Chan and Coak (1978).
The effect of chancing c^e-e constant material properties an predicti-. 'to. te&perature, displacement, and stress was investigated. It waa found that the thermal conductivity has only a small effect on the parameters. From the classical theory of linear thermoelastT.c£ty it can be shown (Chan and Cook, 197B; Timoshenko and Goodier, 1951; Soley and Weiner, 1960) that, for an axially symmetric system, displacements and stresses are proportional, respectively, to the following combinations of thermcnechsnical properties
and ttE 1 - V

197
Table 1. Constant Material scopertie* used in the calculation*.
Material property Syaaol Value Unite
Theraal conductivi ty k 3.2 V/m*C
Thermal d i f fua iv i ty -k /OCp l .*7*lo"* -» / . Coefficient of l inear
thermal expansion a 11.1x10** /°C
Young'a modulus E 51.3 CPa
Poieaon's r a t i o V 0.23
Illustrative calculations, both analytical and using the finite-element method* have been performed to ahow the effect of changing one or sore of these parameters on predictions for rock displacement and stress. An example of these calculations is given in Tsble 2. This example shovs radial displacement* and stresses at a point in the rock mass a radial distance 1 m frost the axis of the 5-kU heater at the heater midplane. Three sample calculations are given in this table where one property at a time is varied aud the corresponding effects of this on displacement and stress can be seen. From this it is evident that, as expected, u and a scale proportionally with a; a lerge change in v results in a relatively small ihtige in either u oro ; and F. causes no change in u and a proportional change in
A lini ted number of laboratory tests of intact small eampt.es of Strips granite were conducted in parallel with the in-situ heater experiments. These tests were carried out to determine the properties of this rock as functions of temperature. and in ooare cases, confining seresM. The results of these tests for the rock properties of interest from the viewpoint of calculation of displacement and stress are illustrated in Figure 1.
Because the thermomechanical properties all exhibit significant variations with temperature.
aa shown in Figure l f numerical calculation* were carried out to investigate the influence of these tameerature-depcmdeat properties on predicted displacements and a t t u n e . To include temmerature-depeodent the*.sal conductivity a nonlinear finite-element code, DOT (Poliwka and Wila<*a. 1976) was used fur the thermal modeling, (Specific heat and density were found by Pratt et al. (1977) to vary insignificantly with temperature over the temperature range concerned. The DOT code has been modified at LBL to take advantage of large core memory of the CDC-7600 computer.) These thermal calculations also account for the nor-joiform initial temperature distribution in the rock and eonvective boundary conditions at the surfaces of the heater borehole and the drifts. The results of these thermal calculations have been summarized by Jsvandel and Chan (1979).
Thermally rnduced displacements and stresses were calculated using the finite-element code SAP IV. To delineate the effect of the temperature dependence of each individual rock property shown in Figure 1. several computer runs have been made in which one, two, three, or four temperature-dependent properties are included. Figure 2 illustrates the influence ol sach parameter in turn on calculated displacement, 3.-d compares these results with the observed relative displacement. These displacements are for a vertical extensometer located
Table 2. Semple calculations showing the effect of r variation of nontomperature-dependent material properties on displacements and stress predictions.
a U(f 6 / 0 c ) V GPn
u 0 5 property «)
6/c (Z>
Base Case 11.1 0.23 51.3 0.71 51.5
Case 1 3.0 0.23 51.3 0.51 37 . ' -28 -28 -28
Case 2 11.1 0.12 51.3 0.57 44.4 -48 -20 -13
Case 3 11.1 0.23 37.0 0.71 37.1 -28 0 -28

> 4
J 1 l l_
20 D » 2 0 S a 3 10 *
<P I ' * J? • C ° a o •^ o 5 25 A o *
.A O
» 10
».A fi 8
J i_ 100 200 300 0 100
Tempera Jure l"C) 200 300
Figure 1. Results fraa the Halted amount cf laboratory testing showing the temperature depei. -enee of material properties of Strlpa granite* Beaults given In Plot* A and B are after Swan (1978) and results given In Plot C are after Pratt et al. <1977). (XBL 801-4613)
at 2 m radial distance from the heater between anchor point* 2.24 m above and below the midplane of the 5-ktf heater.
From Figure 2A it can be seen that the weak temperature dependence of thermal conductivity of Strip* granite (Figure 1C) ha* only minor effects on the vertical displacements.
Figure 2B and 2C show 'har the temperature dependence of Young's modulus, E, sffects the displacements more than the temperature dependence of Poisson's ratio, v, although the latter property varies more rapidly with temperature. This is in contrast with the situation for constant rock properties where the magnitude of E does not affect the thermal displacements at all.
Finally, the very strong temperature dependence of the thermal expansion coefficient, a, of Strips granite is reflected in its dramatic effect on the displacement!, as depicted in Figure 2D. Note that the absolute values of the vertical displacements
predicted using all temperature dependent properties are now somewhat smaller than the measured values.
At present only a small portion of the displacement data has beeu examined. Tor this limited amount o£ vertical displacement data the same general trend seems to hold.
In the thermal expansion coefficient measurements aooe hysteresis was observed during the heating-cooling cycle. It is of interest to determine whether hysteresis of this type is ocserved in the measurements of displacement for th• in-sicu rock mass daring the cool-down phase of the heater experiments. This result is of importance in terms of the overall design of a repository because, as a result of the decay of thermal power from the waste canisters the rock surrounding the repository will undergo a thermal pulse (St. John, 1978). The rock temperatures will reach a maximum within one or two centuries and sfter this cooling will occur. The behavior of the rock during both the heating and the cooling phases will govern the stress field
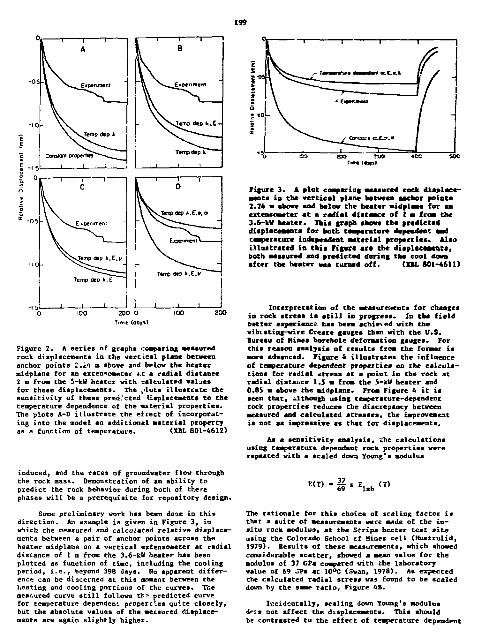
Time (days)
Figure 2. A series of graph* comparing «eaaured rock displacements iu the vert ical plane between anchor points 2.if a above and below the heater midplane for an extensometer t.t a radial distance 2 m from the 5-kW heater with calculated values for these displacements. The k>lots illustrate the sensitivity of these predicted -lisplaeementa to the temperature dependence of the materiel properties. The plots A-D illustrate the efctect of incorporating into the model an additional Material property as a function of temperature. ( M L 801-4612)
induced, and the rates of groundwater flow through the rock mass. Demonstration of an ability to predict the rock behavior during both of there phases will be a prerequisite for repository design.
Some preliminary work has been done in this direction. An example is given in Figure 3, in which the measured and calculated relative displacements between a pair of anchor points across the heater midplane on a vertical extensoneter at radial distance of I a from the 3.6-kW heater has been plotted as function of time, including the cooling period, i.e., beyond 39S days. Ho apparent difference can be discerned at this moment between the heating and cooling portions of the curves. The measured curve still follows tl"-5" predicted curve for temperature dependent properties quite closely, but the absolute values of the metsured displacements are again slightly higher.
199
0 CO 200 iVO *DO 30C r*r« (Says >
Figure 3. A plot compariog measured rock displacements in the vertical plan* between anchor point* 2.24 m above and below the heater midplane for an extenaometer at a radial distance of 1 • from the 3.6-ktf heater. Ibia graph snow* the predicted displacement* for both temperature dependent and temperature indepemdent material properties. Also illustrated in tail Figure are the diaplaceamaec, both measured and predicted during the eool down after the heater was turned off. (XkX 801-4611)
Interpretation of the measurements for changes in rock stress ia still in progress. In the field better experience has been achieved with the vibiating-vire Creare gauge* than with the U.S. Bureau of Mines borehole deformation gauge*. For this reason analysis of result* from the former is more advanced. Figure 4 illustrates the influence of temperature dependent properties on the calculations for radial stress at a point ia the rock at radial distance 1.5 m from the 5-ktf heater and 0.85 m above the midplane. From Figure 4 it is seen that, although using temperature-dependent rock properties reduce* the discrepancy between measured and calculated stresses, the improvement is not as impressive as that for displacements.
As a sensitivity analysis, the calculations using temperature dependent rock properties were repeated with a scaled down Young's modulus
m > - I ' «u» <T' The rationale for this choice of scaling factor is that a suite of measurements were made of the in-situ rock modulus, at the Stripa heeter test site using the Colorado School cf Mines cell (Hustrulid, 1979). Results of these measurements, which showed considerable scatter, showed a mean value for the modulus of 37 GPa compared with the laboratory value of 69 SPa at 10°C (Svan, 1978). As expected the calculated radial stress was found to be scaled down by the same ratio, Figure 4B.
Incidentally, scaling down Young's modulus dr;s not affect the displacement*. This should be contrasted to the effect of temperature dependent
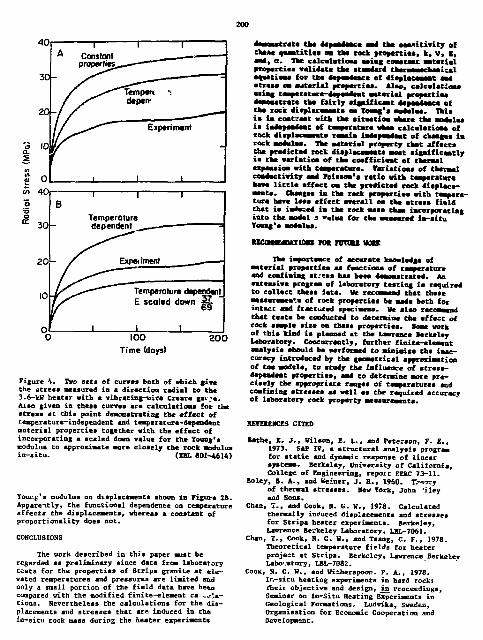
200
40
3 0 -
2 0 -
S 0 in 40
1 r A Constont
properties^
Temperature dependent
Temperature dependent E scaled down 69
100 Time (days)
ZOO
Figure '•. Two Beta of curvea both of which give the stresa measured in a direction radial to the 3.6-lcW heater with a vibrst ing-vire Crcare lat^e . Also given in theae curves are calculations far the s tress at th is point demottccreciag the e f f ec t of temperature-independent end tenperature*dep*ndent material properties together with the e f f ec t of incorporating a scaled down value for the Young's modulus to approximate wore c lose ly the rock, modulus i n - . i t u . (ML 801-4614)
Youug's modulus on displacementa shown in Figure 2B. Apparently, the functional dependence on temperature e f f ec t s the displacements, wheress a constant of proportionality does not.
CONCLUSIONS
The work described in this paper must be regarded as preliminary since data from laboratory tes t s for the properties of Strips granite at e l e vated temperatures and pressures ere limited and only a small portion of the f i e l d dats hsve been compared with the modified finite-element ca - o l s -t ions . Nevertheless the calculations for the d i s placements and s tresses that sre induced in the in-s i tu rock mass during the heater experiments
demonstrate the aeaaafaaca anal the eenni t iv i ty of these enee t i t i e* oa the rack properties , k, V, I , and, a . The calcmlstioms e*i*g eomatsmt material properties val idate the staadard tbermaaacaaaical equations for the aesamaeace of displsrimaat M • t r e s e am material propert ies , a l s o , calculat ions maims; taaperatare-dspeadrat materiel properties demonstrate the fa ir ly a igai f icaat aapemdaaca of the rock displacaaaeta om Yoame/* moemlaa. This i s im coatraat mith the •itaatiom mhara the moamlma ia iaaepeadeat of temperature wham calculation* of rock displeraeaats remain indapemdaat of chaaams i a rock modules. The material property that af fect* the predicted reek displacement* most s iga i f icaat ly i * the variation of the coef f ic ient of thermal expansion with temperature. Variations of thermal conductivity amd roiasoa'a ra t io with tamaeratitre have l i t t l e affact oa the predicted rock displacements. Changes im the rock properties with temperature hsve leas e f fec t overall oa the atreas f ie ld that i s iadaced im the rock mass than incorporating into the model n value for the measured in-a i tu Youag'e •oamlms.
uccr»e»jOMTicva roe rorosi voti The importance of accarata knowledge of
material properties a* reaction* of teameretare and coafiaUg st.-eaa ha* been aeaoastrated. An extensive program of laboratory testing is required to collect these lata. We recommend that these Masurameat* of rock properties be mad* both for intact aad fractured specimen*. Wa also racoamond that teace be conducted1 to determine the effect of rock •ample *iz* on the** propertiea. Some work of this kind is planned at the Lawrence Berkeley Laboratory. Concurrently, further finite-clement analysis should he aerformed to minimis* the inaccuracy introduced by th* geometrical approximation of toe mndsle, to atony- the influence of strcss-depeadeac properties, ami to determine more precisely the appropriate rang** of temperatures n d confining atrcsae* a* wall as the required accuracy of laboratory rock property aeasuremente.
1EFEIISCES CITED
bathe, K. J., Wilson, E. L., and Peterson, F. E., 1973. Sap IV, a structural analysis progrsa for static and dynamic response of linesr systems. Berkeley, university of Cslifornis, College of Engineering, report EEKC 73-11.
Boley, B. A., and Keiner, J. H., 1950. T:--ory of thermal stresses. Hew York, John 'iley and Sons.
Chen, I., and Cook, B. G. v., 1978. Calculated thermally induced displacements snd stresses for Strip* heater experiments. Berkeley, Lawrence Berkeley Laboratory, LBL-7061.
Chan, T., Cook, H. G. H., and Tssng, C. F., 1978. Theoreticsl tempersture fields for heater project at Strips. Berkeley, Lawrence Berkeley Laboratory, LBL-7082.
COOK, S. G. W., *nd Witherspoon. P. A., 1978. In-situ nesting experiments in hard rock: fheir objective snd design, in Proceedings, Seminsr on In-Situ Heating Experiments in Geological Formations. Ludvika, Sweden, Orgsnisation for Economic Cooperation and Development.

201
Hood, M., 1979. Some result* from a field investigation of thermomechanical loading of a rock maaa when heater canister* are emmlaced in the rock, in proceedings, 20th D.S. Symposium on Rock Mechanics. Austin, University of Texas.
Hood, M., Carlason, H., and Nelson, P. H., 1979. The application of field data front heater experiments conducted at Strips, Sweden, to parameters for repository design, in Proceedings, Internal. Symp. on the underground Disposal of Radioactive Wastes. Helsinki, Organisation for Economic Cooperation and Development, Nuclear Energy Agency.
Hustrulid, W. A., and Schrauf, T., 1979. Borehole modulus measurements with the CSM cell in Swedish granite, n Proceedings, 20th 0.5. Symp. on Rock Mechanics. Austin, University of Texas.
Javandel, I., and Chan, T., 1979. Detailed analysis of temperatures from underground heating experiments in granite. EOS, Transactions, American Geophysical Union, v. 60, no. 46, Abstract T96.
Polivke, 1. M„, and Wilson, B. L., 1976. rinite-elsjmeat analysis of aosilinear heat transfer problem*. Berkeley, university of California, Department of Civil Engineering, Report DC SESH 76-2.
Pratt, 1. K., et si., 1977* Thermal and mechanical properties of granite, Stripe, Sweden. Salt Lake City, Terra Tek, Report IK 77-92.
Sackett, S. J., 1979. Users* manual for SAP A on modified and extended version of the University of California Berkeley SAP IV code. Livermore, Lawrence Livermore Laboratory, UCXv-18226,
St. John, C. •., 197ft. Commuter models and the design of underground radioactive waste repositories, prepared for Current Developments in Bock Engineering. Cambridge, Kas-sschusetts Institute of Technology.
Swan, C , 1978. The mechanical properties of Stripa granite. Berkeley, t^rence Berkeley Laboratory, LBL-707&.
Timoshenko, S. P., and Cooe*ier, J. ••, 1951. Theory of elasticity, 3rd ed. Bern York, HcCrav Sill, Eagineerimg Society Monographs.
FRACTURE HYDROLOGY STUDIES AT STRIPA J. E. Gate, C P. Wilson, and P, A. Witherspoon
IHTR0DUCTI0N
The overall hydrology program at Stripa (Gale and Witherspoon, 1979) is sunmarized ia Figure 1. The five major areas of research are: (1) asseas-nent of directional permeabilities; (2) geochemical and isotope studies; (3) tracer studies; (4t) an underground macropermeability experiment to feature rock-mass seepage; and (5) pump tests. The geochemical and isotope studies and the macropermea-bility experiment are discussed elsewhere in this
SURFACE OUTCftOPS EXCAVATIONS
ORIENTED BOREHOLES ORIENTED CORES
BOREHOLE TV CAMERA
TIONJ iTS J
INJECTION] TESTS
FRACTURE GEOMETRY \*f\ FRACTURE APERTURE tell) |
Klj OF ROCK MASS
GEOCHEMICAL DATA |
TRACER TESTS
VENTILATION EXPERIMENT
PUMP TESTS
[MATHEMATICAL MOQELL'-IG
report. The tracer studies have not been initiated at this time. Thus, this paper deals primarily with the firsr part of t^e program, assessing directional permeabilities of the Stripa granite, which is the major activity of the fracture hydrology program.
Fracture hydrology tests have been performed in both surface and subsurface boreholes. The surface borehole* conaiat of six water-tjble wells, WT-1 through WT-6, a pump test well WT-7, and three long inclined boreholes, SBH-1, SBH-2, and SBH-3 (Figure 2 ) . SHB-1 is an open, 76 mm diameter, diamond-core hole, 385 m long, that angles downward at 45 degrees, passes over the top of the test excavations, and terminates at approximately the 290-m level. SBH-2, also diamond-cored, was drilled fro*, the west toward the test excavations. This borehole is 365 m long, angles downward at 52 degrees, and terminates In the position shown in Figure 2 at approximately the 290-a level. SHB-3, J15 n long, also diamond-cored, is drilled from the m>rth at an angle of approximately 50 degrees south toward the test excavations, terminating in the position shown. All three inclined surface boreholes were oriented to optimize their intersection with the major fracture sets.
The subsurface hydrology boreholes (Figure 3) are located at the north end of the test excavations. This group of boreholes are all dianond-core holes, 30 -n long and 76 mm in diameter, except R-l and R-6, which are 40 m long.
ACTIVITIES IK FISCAL YEAR 1979
Figure 1. Block diagram of fracture hydrology program at Stripa. (XBL 7811-2144}
The geological log of the drill core, distribution of major fracture zones, RQD values, and the bottom-hole porewater pressures for SBH-1 are pre-

1250y
Figure 2* General ecology and hydrology borehole locations. Square* are SO • on a aide.
(X1L 7811-1310!!)
BACK OF VENTILATION DRIFT
Figure 3. Location and orientation o£ subsurface hydrology boreholes. (XBL 7811-13108)

203
sented in Figure 4. The porevater pressures. ured in • bottom hole, 3 to 4 « long, cmwitf scaled off with an inflatable packer as the drilliag advanced, show that at 100 a or ao below toe surface, the vine ha* reduced the water pressures in the rock mass.
rhe borehole injection test program) was designed to provide infomation on the distribution of effective fracture apertures. The basic test equipment consists of a two-packer assembly with downhole pressure and temperature probes. During each test the fluid pressures were measured botb in the injection zone and above and belcs the injection zone. In all of the boreholes, packer tests were carried out using (1) a fixed packer spacing of 2 n along the entire length of the boreholes; (2) packer spacing* sufficient to isolate and test single fractures; and (3) packer spacing of approximately 6 to 10 it to teat the stain fracture-geophysical zones. This testing program enables one to develop fracture aperture distribution data for different parts of the rock aass froa a statistical analysis of the fluid pressure, flow rate and fracture frequency data.
The results of injection tests in 2-si intervals in two sections of SBH-1 are shewn in Figures 5 and 6. Flow rates for these 2-a packer spacings ranged from less then 0.01 al/ain to approximately
ittfaWnln) KfaBweac) ROD * r * JO-1 10° W xr"io*icr*io<»o' to 0 * 0 * 0 4
I W
; > 120- .'i
230 •
I i
I 240 • T 1
\ IP
J J
Figure 5. Injection ter.t and fracture data froa SBH-1, 210- to 2&0-B .action. (XBL 306-9416)
OO (cni/min) K (cm/aec) ROD ' m' 10° 10' io" iq'° io*io J io- T I J M J I M
I
Figure 4. General geology, fracture zones, RQD values, and bottom-hole fluid pressures, measured during drilling, for SBH-1. (XBL 7811-13104)
I S
n I.
Figure 6. Injection test and fracture data from SBH-1, 325 to 355 a section. (XBL 802-8225)

204
3 ml/min for both the 210- to 240-m aectioa end the 325- to 355-m section.
In the subsurface boreholes, the excess pore pressures in rhe rock mass at the depth of the excavations resulted in flow out of the boreholes. Typical outflow rates ranged from 0.001 to about 6 ml/min, and in-situ fluid pressures measured in 2-n packer intervals orer a 30~m lone borehole (RA) ranged from 0.4 to 9.8 1*?** This boreho!ep
R4 t is drilled vertically downward from the floor of the ventilation drift.
Dewatering of the instrument and heater bore* holes during the thermal experiments showed flow rates similar to those given for 14 and parti of SBH-L. Figure 7 shows the volumes of water pumped from two heater holes in the time-scaled heater
experiment room. These boreholes are about 11 m lone and the average rate of inflow, over several months, of 1 to 2 ml/min represents the flow oat of « fairly large volume of rock. Although injection rates up to 500 ml/min have been measured in some test cones, the fljw rates giv?n above are generally representative of most ol the granite rock mass at Strip*.
PIAMK0 ACTIVITIES
A detailed interpretation of the data presented herein in terms of tb* fracture hydrology of the Strips granite will be initiated in fiscal year 1980. As a form of preliminary interpretation, it is instructive to consider tha measured flow rates in the context of the data presented iv Table 1.
20 30 10 semma ocrmn
Figure 7. boreholes.
Dewatering data from time-scaled heater (XBL 7811-2143)
Table 1. Comparison of equivalent porous medium permeabilities and fracture permeabilities.
(cm/sec) (ml/s) (ml/min) (cm/sec)
2b
(M)
4.5 x 10 .-6
«-s 1
4.5 x 1 0 " 0.01
4.5 x 10~*° 0.000
60 1.9 x 10
0.6 8.8 i 10"
0.006 4.t i 10"
Radial Flow Conditions, r - 0.038 m,
r • 10 s, H. • 0. H • 1 0 B p * T> * w Fracture Spacing • 2 m

205
There, we have calculated porous media hydraulic conductivities for a ranee of flow rate*, subject to a given set of boundary conditions. If instead of a porous medium we have, as say very well be the situation, a single fracture intersecting the 2 • test interval} we can calculate the hydraulic conductivity of this single fracture. As shown in Table 1, there is a considerable difference in the impression created depending on whether we choose to express the results in terms of fracture or equivalent porous medium hydraulic conductivities. One important point to remember is that the volume
INTRODUCTION
The mscropermeability experiment is an attempt to improve permeability characterization techniques to analyze regional groundwater flow through low-permeaSility rock in the vicinity of a nuclear waste repository. This experiment consists of monitoring flow into, end pressure surrounding a 5 x 5 x 33 m long drift called the ventilation drift at the 335-m level of the Strips mine (Figure 1). This paper examines the theoretical problems associated with making such a measurement and describes the actual experiment now in progreas.
A major problem in regional hydrologic analysis is to determine the permeability of large volumes of low-permeability rock from in-situ tests. In high-permeability soils or rocks, standard well tests can be run such that large volumes of the flow system are perturbed by the teat in reasonable periods of time. However, in low-permeability rock, standard well teats may only affect the flow system within a few meters of the well. Determination of large-scale permeability valuea can there-
Figure 1. Perspective section through the ventilation drift showing air flow pattern and hydrology instrumentation boreholes. (XBL 7910-13004)
of fluid moving through » £ k mass is generally imdeptfscmt r** the model chosen to interpret the field data. erne rate of movement and the nature of the pat- followed ia mot.
UfnUOICE CITED
Gale, J. E., and P. a. Witherspoon, 1979. An approach to tte fracture hydrology at Stripe —preliminary results. Berkeley, Lawrence Berkeley Laboratory, LBL-7079.
fore be attempted in two trays. The first way it to synthesize large-scale values from a series o-small-scale tests done in boreholes. The second way is to create a large-seals sink (or source), which will perturb a lsrge volume of the flow system, i.e., a macroscopic permeability test.
Small-scale borehole tests will probably remain the mainstay of hydrologic investigations since boreholes are the only practical means of extensively exploring deeply buried rocks. There fore, reliable methods far predicting macroscopic permeability from borehole data are needed. In order to perfect such methods they will have to be checked by performing large scalp in-situ tests at the same place where the borehole data have beei. collected. The macroscopic permeability test at Strips represents a large-scale measurement that will be used to check the analysis of an extensive series of small-scale borehole tests (Csle and Witherspoon, 1979).
ACTIVITIES IH FISCAL TEAS 1979
Pressure Measurement
At Stripa, 15 boreholes 30 co 40 m long have been drilled from the ventilation drift into the surrounding rock (Figure 1). These boreholes are divided into three groups of five each. Two groups (the R-holes) are radial holes and one group (the HG holes) extend from the face of the drift. Esch of these holes has been instrumented to monitor pressure. A total of 94 packers have been installed at approximately 5~m intervals. This prevents the boreholes from acting as drains into the drift and creates a three-dimensional array of 94 zones, 90 of which are individually connected by tubing to pressure gages.
During the experiment air in the drift will be kept at constant temperature. Pressures in the boreholes and water flow into the drift will be monitored until they are steady. Then the air temperature in the drift will be raised and the experiment repeated.
Between constant temperature experiments two
MACROPERMEABILITV STUDIES AT STMPA C. R. Wilson, J. C. S. Long, R. 1.1. Galbraith, A. O. DuBois, f".. I. McPherson, and P. A. Witherspoon

further experiments will be conducted., The first will be small-scale permeability testa in which each zone in one or two borehole* will be drained. The flow rate Croat each zone will be monitored separately until approximately stead; conditions are reached. By repeating this teat after each constant-temperature experiment, it M y be possible to detect local chance* in permeability due to chances in temperature. These chances ess then be correlated to change* in permeability detected for the whole macroscopic teat.
At Stripe we will not be eble to examine average pressure parallel to the theoretical average ifopotentials. However, since the average gradient is not expected to be very large at the outer ends of the boreholes, we will be able to approximately examine the effect of zone length on pressure by hydraulically interconnecting adjacent zones through the pressure tubing and allowing the system to come to equilibrium. Head losses in the tubing will be known and the pressure in esch of the interconnected zones can be calculated. Because flow rates between zones are in most cases expected to be quite low, the pressures in the zones should be nearly equal. The average of tne pressures will be taken as an estimate of the pressure the zones would have if the packer between them were removed.
Flow Measurement
In most permeability testa, the water can be collected in a tube or pipe and the flow rate measured in a straightforward mjnner. However, in the low-permeability rock of this experiment, the flow rate into the drift is so low and the surface area is so great that a significant proportion of the inflow would be lost to evaporation and the remainder would collect on the floor of the drift too slowly to measure in a reasonable amount of time.
One of the purposes of this experiment is to examine the utility of Measuring low flcv rate* by evaporating all the water into the ventilation air while measuring the change in water vapor content between the incoming and exhaust air streams. To operste successfully, the ventilation aystea should provide an air flow rate and temperature capable of vaporizing and carrying away all of the influx water (McPherson, 1979). In addition, all parametera must be steady enough to allow identification of the equilibrium conditions. Also, the differential relative humidity between the air entering and leaving the experiment area must be great enough to provide acceptable water vapor measurement accuracy. As a point of reference, 1.0 m^/sec (2,100 cfm) of air flowing at normal atmospheric pressure, 20°C, and 1001 relative humidity will transport about 1 liter of water vapor per minute*
A sketch of the experimental setup was shown in Figure 1. An air- and vapor-tight bulkhead seals off a 33-m length of the ventilation drift. This wall consists of a structural wooden frame covered with a 0.15-mm-thick sheet of PVC, as *. vapor barrier, and fiberglass insulation to prevent condensation. The vapor barrier and the structure are keyed into a 20-mm-deep notch on all four sides, with foamed plastic sealing in the notch to prevent
the loss of water thromgh the blast damaged surface rock. 4 froeem-food-locker type door provides access through the bulkhead.
The gemeral mime ventilatiom system delivers about 1.4 srVsec of fresh air to * point just outside the bulkhead. The experimental ventilation syatesi admits a portion of this fresh air into the sealed room to tick urn the water (as vapor), which flows into the sealed room through t!ie surroumdimg. rock. This secondary ventilation system is driven by a fan located in the exhaust duct so that • slightly negative pressure will exist within the sealed room. Any air leaking through the bulkhead will be into the room and it will be the aame air as that entering through the inlet duct. In this way, the inlet wet and dry bulb measuramenta will be representative of both the intentionally admitted air and the leakage air. The flow meaauring statioa as well as the exhaust wet- and dry-bulb sensors are in the exhaust duct. These sensors sense the total air flow including leakage.
The air entering the sealed room passes through an electric duct neater. It is then distributed through an inaulated duct with multiple openings along the length of the room. The air issuing from these openings mill be directed preferentially onto any damp spots on the rock surface (most of the cater evrivet by seeping along discrate fractures). We expect to maintain the vails of the drift in an almoat dry condition, with fans used where necessary to provide a high air velocity over particularly damp spots.
The climatic condition* within the room will 1,- controlled by manually selecting a suitable axr *lov rate (by adjusting a damper on the fan exhaust) and then adjusting the heater power as required to maintain the desired sir tempersture in the room. The energy input from the heater i* used in three ways: (1) the sensible heat of the exhaust sir will be increased; (2) the hest of vaporization for the water will be provided; and (3) the rock will be heated. As equilibrium conditions are approached the third contribution would become negligible. The 45-kW heater is divided into six sections, which are separately controlled. Five section* sre under manual control and one ia under automatic on-off control with feedback from a room-temperature sensor. The heater voltage is regulated to isolate it from the large voltage fluctuations observed in the mine power system.
A 75-mm-deep trench has been cut scross the floor of the drift just inboard of the bulkhead. If the trench and floor of drift, remain dry, we shall conclude that all available water is being evaporated at its arrival rate.
PLANNED ACTIVITIES
The bulk permeability measurements are expected to be completed during fiscal year 1980. Data reduction will be initiated in fiscal year 1980 and completed in fiscal year 1981 when the results of the borehole hydrology test? will become available for comparison. In addition _o the bulk permeability measurements, a eerie* of borehole

207
permeability and tracer t e s t s using f lu id withdrawal methods are planned using ins ta l l ed i^uipaeae ffroa aacroperaeability teat*
REFERENCES CITED
Gale, J. E. , and P. A. Witherspoon, 1979. An
approach to the fracture hydrology at I tr tpa: Fr*liaimary r e s u l t s . Berkeley! Lawrence Berkeley Laboratory, LBL-7069, laC-15.
Hcftersom, H. J.» 1979* Psych roam try i The aweaure-aent and acwdj of aoisturc i n a i r . •ott inghaa University Mining Hegasiae. University of Hottinghaa, United sangdeau
A PROGRAM OF GEOLOGIC STLIOIES AT STRIP* H. A. Wollenberg, L. Andersson, and S. Flexser
INTRODUCTION
A number of geonechanical, hydrologic, and geochemical tests have been conducted since late fall 1977 in granitic rocU at the Stripe, Sweden, mine. Results have been the aubjecta of over 20 reports describing the hydrologic setting and the response of the rock to heating. The reaulta of these tests will be used (1) to establish technique* to measure the hydrologic, geoaechanical, and geochemical settings of proposed nuclear waste repositories, and (2) to determine the properties of a granitic rock mass which would be critical to the long-term isolation of radioactive waste.
To validate the transferability of these techniques and properties froa Stripe to the evaluation of potential repository rock Mates, it is necessary to know the geologic setting and petrology of the Stripe pluton. The experiments at Stripa are bei<r; conducted in a granitic rock mass within ~200 m of its contact with older aeta-raorphic rock called leptite (Olkiewicz and others, 1978). Yet, little is known of the size and configuration of the Stripa pluton. On the recently published geologic map of the Lindesb^rf SV quadrangle (Geological Survey of Sweden, 1979), the pluton i? .^hown exposed over a relatively st»i 1 area (—0.3 km radius). However, the extensive cover of glacial debris obscures the true size and shape of the pluton at the surface. The configuration with depth of the contact between the pluton and the metamorphic rock is well defined only to the south, afforded by the extensive workings of the old iron mine. Contacts to the north, west, and east are concealed at the surface and unexplored at depth. Thus, the questions of whether the granitic rock mass at Stripa is among other things a dike-like body, a stock, or the exposed portion uf a much larger pluton, are unanswered and as such the position of the experiments within the pluton also remain in question.
ACTIVITIES IN FISCAL 1979
To help answer these questions a program of geologic studies was started in the summer of 1979 to determine the size, configuration, and composition of the Stripa pluton. Efforts concentrated on collection of samples of granitic and metamorphic rocks from the surface and underground at Stripa and at other plutons within the Lindeaberg region. Samples of cores were also selected from the holes SBH 1 and 2, drilled diagonally from the surface
toward the experimental area, and froa the vertical hole drilled to a depth of 465 a froa the mine's 410 • level. Thia set of samples then covers a vertical extent froa the surface to a depth of nearly 900 a and encompasses saaples of pegmatite, various granitic compositions, diabase- and leptite* The aaaple set also contains representatives of the classes of fractures encountered in the Stripa piutoo: those predominately filled by chlorite, epidote and sericite, quartz, and carbonate minerals. At aany locations on the surface and underground, hand specimens were oriented at the time of collectian for atrike and dip, to perait subsequent petrofabric determinations.
Along with collection of surface and subsurface samples, field radioaetric measurements were made with a portable gaaaa-ray apeetroaeter to determine the uraniua, thorium, and potassium concentrations within the various rock units. These measurements give preliminary indications of the geocheaical homogeneity of the pluton and perait calculation of the radiogenic heat production, a useful parameter that, when combined with the conductive heat flow, may be used to estimate the size of the pluton.
The conductive heat flow through the Stripa pluton was calculated, based on the product of the temperature gradient (17.5 °C/kn) observed by the Swedish Geological Survey in the vertical hole drilled from the 410 level, and a mean conductivity of 3.4 W/m 2/°C (Pratt et al., 1979). The resulting value of 59.5 mW/m 2 compares closely with the regional conductive heat flow for the south-central portion of Sweden, as indicated by Cermak (private communication, 1979). Preliminary results of field gamma spectral measurements indicate thac the radiogenic heat production of the Stripa granii.?: is nearly four times that of the neighboring le^tite, and 1.6 times the average heat production ">£ the other plutons within the region. Therefore, the high radiogenic heat production of the Stripa granite, coupled with regionally "normal" heat flow measured within the pluton, suggest that the relatively radioactive granitic body is small; it appears to hive little if any effect on the regional heat flow.
PLANNED ACTIVITIES
Continuing activities in fiscal year 1980 will include petrographic descriptions of the classes of fractures, as well as descriptions of

^08
relatively unfractured Stripe granite en*' granitic rocks froai other plutons in Che region. Age date* will be obtained to determine the relative ages of the plutone aad the fracture filling Material. The location and abundance of uranium within the fractures and the relatively uafractured rock will be napped by the fiaaion-track method, permitting eitinatea of the source term for the high "*fcn contents observed in water from boreholea in the experimental area (Xelaon et al., in prep.).
A program of geophyaical meaaurameata and surface boreholea has been propoacd to penetrate the glacial debris covering the Strip* area to delimit the concealed contacts between the pluron and the surrounding leptite. Together with petro-logic studies of cores fross undergroend horizontal holes expected to be drilled in 19B0, «nd comparisons of the age and petrology of the Strips granite
and granitic hodiea in the aarromndimg region. these measurements ahould furnish * definition of the aine and configuration of the 3tripa plucon and the position of the experiment! within the plnton.
ttFOEMCES CITED
Geological Survey of Sweden, 1979. Bedrock map IIP, Undeaburg Sv, SCU Ser. Af-or, 126.
Olkiewics, A., lensacn, K.» AloWo, *VE, and Gidlmml, c , 197S. Ceologiak oeh hydrogtolo-giak grmnddoknmamtation ar Stripaforaoksstation, K.B.S. Tekaiak tapport no. b3.
Pratt, H. R., Schranf, T. V., tills, L. A., and hue'rutfd, w. A., 1977. Thermal and mechanieal properties of granite: Strlpa, Sweden. Salt Lake City, TerraTek Summary report Tt-77-92.

209
Research and Development Investigations
REVIEW OF THE STATE-OF-THE-ART OF NUMBMCAL MODELING OF THERMO-HYDROLOCIC FLOW IN FRACTURH> ROCK MASSES J. S. Y. Wang, R. A. Sterbentz, and C. F. Tsang
IHTKOUTCTIOH
This review is a rccule of the attention currently being given to the isolation of nuclear wastes by underground storage fn geological fora»-tiona. The wastes generate neat* which raises the temperature of the aurrovadiag fracture* rock masses, i-\ic inj buoyancy flow sod pressure chaagea in the griMmrfwster. These effecta introduce the potential hsxard of radionuclides being carried to the biosphere. A masher of atssericsl models are now available to investigate theae physical processes.
The objectives of this project are to develop • list of models and to study the governing equations, numerical methods, compute^ code, validation and applications of a selection of aodela relevant to the siuilation of thermohydrologic flow around a repository in fractured rock masses. The work plan consists of the following steps: (1) initial literature survey, (2) rieleetion of Models, (3) detailed evaluation, (4) workshop, sad (5) final report*
ACTIVITIES IN FISCAL YEAR 1979
Literature Survey
An initial lit-**»-«turr' survey was conducted of •jurnaN and data bases. An information request letter has been sent to over SO modelers in the United States and abroad. Additional preprints, reports, and information on model developments were received. Over 500 papers and reports were catalogued and Tiled.
Selection of Models
A number of models were selected for detailed survey. We preferred discrete fracture and double porosity models over porous medium models, and nonisothermal models over isothermal models. The relevant applications are in radioactive waste storage as well as in groundwater movement, geo-thermal reservoirs, aquifer thermal storage, and thermal recovery of petroleum.
The final sets of models can be divided into three groups. The first croup contains models used in handling the characterizing fractured rock masses. The model ROCHAS (PORFRC) of U.C. Berkeley solves the coupled flow and stress equations in discrete fractures and in poreus medium blocks. The applied stress can also be thermally induced. The models of Duguid of ONWI and O'Neill of Princeton are double porosity models for fluid flow and for heat transfer, respectively. In a double porosity model, each point in space is represented bv two values of pressure and two values
of temmerstwre, caw set representing the aacro-s topically averaged valves over the fractures, and the other c :t for the porous rock medium blocks. The model TlXZaCI of LSI. has been used for the study of fluid flow ia a deformsble fracture network amd demonstrates the flexibility of the integrate* finite difference method for modeling complex geometry. The nomisothermal model CCC amd th* two-phase modal SIAPT79 of LBX uia the same methoeology. CCC baa keen recently used for discrete fracture simulations.
The second group of models are nonisothermal saturated flow aodela currently being used in several repository studies. The model CVTHEKM of Dames and Noore has been used in generic studies of crystalline rocks. The model r m of Acres has been used in the Swedish CIS studies in granite. The model SHIFT of latere has been used in the MTPP and Muclcar legulatory Commission studies in salt. The model CFEST of 1sttelle Pscific Vortbweat Laboratory is developed for the Vests Isolation Safety Assessment Program studies. The modeling experience from these studies is valuable for the prediction of thermal effects of a repository. More realistic representation ;f the fractured rock mass will be modeled in the future.
The third group of models are oooisothermal, two—phase (steam and water) models developed recently for geotfaermsi reservoir engineering. The possibility of liquid water turning into steam near a waste canister indicates the need for simulating two-phase phenomena for waste storage studies. The model of Coats of latereomp has simulated the steer flashing within fractures. The model of Faust r~<a Mercer of Geotraas has been applied ro an areal simulation of the Wairaxei geothermal field in New Zealand. The model M'SHEM of Systems, Science, and Software has been used in a vertical simulation of 1'iirakei, and in Culf Coast geopressure simulation. The model SHAFT79 of LBL is a newly developed, efficient cede currently used ia geothermal simulations i.* Italy, Iceland, and Baca, New Mexico, and also in repository simulations in KTS stud-.es.
Detailed Evaluation
For eacn model, che following features have been studied.
!. Governing equations
2. K'jmerical net hods
3. Computer code
4. Validation

210
5. Application*
An outline of the subjects covered under each of the £ive features f^X'.iws:
Govern ir;; equations. This section will cover the equations to be solved by tie numerical Method for both fluid flow and heat tranrfer. Fluid movement depends on the porosity and permeability of a formation, the density and viscosity cf Lb* fluid;. and the fluid sources. The fyrmatiea-related properties are the main concern here, A rr-k mass can be modeled in thre* ways: (1) as a system with discrete fractures within a porous rock medium; (2) as a porous medium with two porosities, one representing the fractures and another the rock medium; or {3) %% a porous medium with a simple porosity. Additional terms or additional equations to handle the responses of porosity and permeability to changes in pressure, temperature, or stress will be discussed. The porosity and permeability, together with preasur end buoyancy driving forces, determine the fluid - -tide velocity. The velocity field is used in the elation of the migration of radioactive nuclidea through fractured rock masses.
Heat transfer depends on the conduction and dispersion through the rock, convection by the fluid, and characteristics of the heat sources. Heat generated by the waste affects the fluid flow directly through changes of fluid properties and indirectly through changes of rock stresses which aay alter the permeability and porosity of a formation. At high temperature, liquid water may turn into steam indicating that two-phase phenomena must be treated. The temperature field determined by a thermohydrologic model can be used to interface with a rock stress study and a geochemical reaction rate study.
Numerical methods. Different methods can be used to discretise the srace end to evaluate the gradients. The governing equations are usually solved by either finite -difference or finite-element methods. For the ?luid-flow equations, treatment of the fluid capacity and fluid flux terms are discussed. For the heat-transfer equation, treat-dent of the convective and dispersive term* are discussed. For nonisothermal models, the solutlou sequence and time step control for the two equations are discussed. Also the direct or iterative procedure used to sol' the nodal values of the variable on the grid mesh if described.
Computer code. The user's manual, code development, and other computers specific features are described. Versatility in 'j-ld mesh design for modeling is considered, especially discretization of the spatial domain which is applicable to fracture simulation. The required ii=put of material properties for the model is described, including the capability to treat heterogeneity and aniao-tropy. Input data and calculations for fluid properties are also described.
The availability of source end sink terms for running problems are noted and the input data at initial and program restart time* are described as well as the treatment, by the program, of various boundary conditions. Th_> prccedures used in the
modal for checking accuracy of eolations are discussed and, im addition, the printer amd graphic output of the remits arm m*mtioa*d.
valiaatioau Ome ax* -*f imp or tame* im the xcviaar of a swmerical model is the validatio* of the code. Jee cam have little comfidamce im a model iaar is not validated]* In omr reviser v* mill identify amd list the analytic eolation* amd field arverimeats *gaimst which tha code has heatm validated. Comparisons with raamlta from other numerical models will also he docemmmttd.
Amplication*. Major areas of spplicatiom are listed to ilima crate the variety of problems solved by the code, iac lading references to published studies. This will give am imdicetioa of their versatility amd rem** of applicahility. Procedures is msiag the cod* with other code* are also described.
ACTIVITIES F1JMKD FOB FISCAL TEA* 1940
Workshop
A workshop was held February 19-20, 19*0, on the subject of modelimg freetared rock masses. The developer* of the selected a*V-?- presented inform*] talks on the model or mas* other relevant comments on fracture flow modelieg or repository simulatioa. T*e workshop included selected technical experts im model development, and representatives from O W I .
Final Report
Following the workshop, the report on the evaluation and on the workshop will be finalized and distributed.
ACXBOWLEDGHEHT
This study is sponsored by the Office of Hucl*ar Waste Isolation, U.S. Department of £nergy.
lEFEtEMCES CITED
Ayatollahi, M. S., 1978. Stress and flow in fractured porous media, Fb.D* dissertation. Department of Material Science and Mineral Engineering, University of California, Berkeley, California, 154 p
Coats, K. H., 1977. Geotoermal reservoir modeling. SPE-6892. Presented at the 52nd Annual Fall Technical Conference and Exbibitiar* of the Society of Petroleum Engineers of AIHE, Denver, Colorado, 33 p.
Dillon, ft. T., Lantx, E. B., an£ pat'a, S. B., 1978. Risk methodology for geolcgic disposal of radioactive waate: the Sandia waste isolation flow and transport (SWIFT) model. SASD78-1267, KOMG/CE-fRW. Sandia Laboratories, Albur-querque, Hev Mexico.
Duguid, J. O., Jr., 1973. Flow in fractured porous media, Ph.D. dissertation. Department of Civil and Geologic*! Engineering, Princeton University, Princeton, Hew Jersey.
Faust, C. S., and Mercer, J. W., 1979. Ceothermal reservoir simulation: 2. numerical solution techniques for liquid- and vapor-aominated hydrotheratal systems. Water Besources

211
Research, v. 15, no. I, p. 31-46. Garg, S. K-, Pritchett, J. ff., IrowneU, D. X->
Jr., and Riney, T* D., 1979. Svopressured gtcthermal reservoir and wellbore simulation. System, Science and Software, report 5SS-K-78-3639. 1* Jolla, California.
Gupta, S. K., Cole, C. P., Xinceid, C. P., and Kaszeta, F., 1900. Thrae-diaenaioaal finite element model for -oupled solution of flow, energy and solute transport in porous median. Presented at the Fracture Hydrology Workshop, Lawrence Berkeley Laboratory, Berkeley, California,
KBS, 1977. Groundwater movement* around a repository. KBS teknisk rapport 54:01-06, uagconsult AE, Kambransleeakerhet, Stochhola, Sweden.
Lippnan, M. J., Taang, C. P., and Witherspoon, P. A., 1977. Analysis of the response of geotherasl reservoirs under injection and production procedures. SPE 65*~ Presented at the 47th Annual California Regional Meeting SPE-AIHE, Bakersfield, California.
During 1978-79 the research group in Nuclear Engineering has developed a sound mathematical foundation for predictive modeling of the adgration of radionuclides in geologic media. We hav provided a clear derivation of the differential equations of hydrogeological transport of radionuclides undergoing both radioactive decay and chemical/ physical interaction with the porous solid. The differential equations are foraulated t*» be applied both .to one-dimensional flow, which is the subject of the studies for 1979-80, and to multidimensional flow in nonisotropic aedia. The source term characterizing the rate of dissolution of radionuclides, in the event that water enters the waste repository, can be arbitrarily specified for each of the elemental species. The differential equations E H O V arbitrary specification of the character of the rate of sorption and desorption of dissolved radionuclides as they permeate through the porous solid.
During 1978-79 emphasis has been placed upon developing analytical solutions for the Migration of radionuclide chains in one-dimensional flow through isotropic porous media, with the assumption of local sorption equilibria. Solutions have been developed for band-release sources, resulting from dissolution of the waste matrix and its contained radionuclides at a constant rate, and also for preferential dissolution characterized by constant fractional rates of dissolution for individual radionuclides.
A superposition theorem has been developed that allows the solution for a band release to be
Marasinkan, T. 1., Vitberasooa, P. A., aad lawrda, A. L., 1»7». •—irical model for satarated-masaturated: flow ia dtefonaale morons aadia. 2. The algorithm). Hater Resources Research, v. 14, ao. 2, p. 255-2*1.
O'Weill, K., 197$. The transient thiv*-dinaeaion*! transport of liaaM aad heat ia fraetarad porcne nadia, Ph.D. diaeertatioa. Dent, of Civil Rasiaeeriau, Princeton Daiversity, Princeton, ace Jersey.
Fracas, C-, aad Schroeder, r.. C , 1979. Ceotteraal reservoir simulation with SUFT79. LBL-10066. Presented1 «t the 5th Ceotheraal Reservoir Engineering Vbrkahop, Stanford, California.
Eunchal, A., Treger, J., aad Segal, C , 1979. Prograa EP21 (CVX1EXM): Two-dimensional fluid flow, heat aad aaaa transport in porous aedia. Technical note TW-LA-34. Advanced Technology Group, Danes and Moore, Los Angeles, California. September.
synthesized froa relatively simple tiate-diaplaced solutions for a hypothetical step release occurring over an infinite tine.
Explicit solutions have also been developed for the space-tine-dependent concentrations for a plane source in a medium of finite thickness surrounded by another aediusi of infinite extent in the direction of flow.
These analytical solutions are exact within the assumptions of the differential equations and boundary cooditic=. ere easily programmed on a simple computer, and an. useful for predictive modeling of loT*£-cerm radionuclide releases from s geologic repository and as benchmark solutions to validate the aatheaatical accuracy of nuaerical solutions used in other national efforts on radioactive waste management.
Work in progress for fiscal year 1980 emphasizes the further generalization of these analytical solutions, demonstration of the important efrecr« of different parameters such as dissolution rates and hydrogeological and geocheaical properties, extension to nonequilibrium sorption, and extension to two-dimensional flow and propagation.
The research team consists of Professor Paul Chaabre, Hakoto Harada, and Thomas Pigford; Research Associates Fomio Iwcaoto, Susuau Muraoka, and Suaio Masuda; and graduate students Hare Albert, Hauro Fogtia, David Leung and Daniel Ting.
MIGRATION OF RADIONUCLIDES IN CHXOCIC MEDIA {. H. Pigford

212
ULTRA-URGE ROCK CORE EXTtRIMfiMTS D. J. Watkins, R. Thorpe, W. E Ralph, R. Hsu, an
DfTROWCTIW
The safe underground storage of radioactive waste requires accurate determinatioa of tto hydraulic properties of rock. Fracture systems in the rock play a dominant role in its hydramlie behavior. Because fractures arc rfefaxmaaic, cmemges in fluid pressure or applied stress will change the fracture apertures within a rock mass ami will have significant influence on fracture comemctivity and fluid pressure distribution (Witherspoon et al., 1977). Models of the movement of fluids in a fracture are generally basett on the eulogy of flow between parallel plates. For steady, lmaiaar, isothermal flow, the flux per unit head can be expressed as:
Q/Ah - C/f (2b) 3 (I)
where Q is flaw rate, Ah is difference in hydraulic head, C is constant depending upon flow geometry and fluid propertiesr f is a factor accounting for roughness and nonparallelism, and 2b is the fracture aperture. The equation expresses the "cubic law" for fracture flow. Its validity has been established for laminar flow through open fractures (Mitherspoon et al.» 1979b) but farther work is required to investigate its applicability to the wide range of fracture types and flow conditions that are encountered in nature. Laboratory research has traditionally been performed using rock specimens with distensions of several centimeters. However, there is evidence that the measured hydroiogical properties of rock are influenced jy the size of the ssjsple (Witherspoon et al. t 1979a). Thus it is important to obtain measurements on rock samples of dimensions closer to that cf practical concern, namely meters rather than centimeters. To meet these needs, a facility development and research program for laboratory investigations using samples on the order of 1 m diameter by 2 n high is in progress at the University of California, Richmond Field Station. This work ie part of the Nuclear Waste Isolation Group's overall research program on the hydraulic and theraomeehanical properties of fractured crystalline vock (Withei^poon et al., 1979c).
ACTIVITIES IN FISCAL YEAR 1979
Test Facility
The ultra-large triaxial testing machine at the Richmond Field Station was originally constructed in 1968 for testing rock-fill materials. The machine (Figure 1) has 5,2 MPa confining pressure and 17.8 MN axial loading capacities. During the fiscal year the machine and facility have been rehabilitated and modernized. A servo-control system, including a new hydraulic power supply, has been installed that provides automated control of axial load and displacement. This equipment together with new apparatus for supply and regulation of confining pressure, pore pressure and fluid injection pressure will enable the teat machine to he used for research on the hydraulic properties of ultra-large, frac-
S. Flexser
Figure 1. Large triaxial machine. (XBB 753-1977)
tured and intact specimens of crystalline rocks and other materials of importance to the design of underground nuclear waste isolation repositories.
Depending upon the complexity of the specimen under test, permeability experimentation on ultra-large cores of fractured rock can involve large instrument arrays that typically include Z.VDT'*, strain gauges, load cells, pressure transducers and thermocouples. The hydraulic and mechanical rock properties are highly stress-history dependent and efficient test control requires rapid reduction of data iato engineering format and the capability to simulate complex stress-paths. To meet this need an advanced data acquisition/control system (DAS) has been designed by LBL's Real time Sysceats Group. This installation will be based on a Hewlett-Pftckarl System 45 modular DAS. It will be installed at the test facility in 1980 with an initial 80-chanuel capability and provision for future expansion.
Dltra-Large Strips Core
In support of the Swedish-American Cooperative Program oa Radioactive Vaste Storage in Mined Caverns in Crystalline Rock (tfitherspoon and Degerman, 1978) a 0.95-m-diameter, 1.9-m-high core, weighing 3628.7 kg, has been obtained from the mine at Stripe, Sweden (Helen and Anderson, 1978).

213
Tests using the large triaxial machine will be performed on this core to investigate fracture conductivity, matrix permeability, and the nechsnical properties of the fractured rock under varying states of stress and stress history. The results will assist in understanding the hydrology of the Stripa sine, allow comparison of simple parallel plate models of fracture flow with data from a c<~iplex system of natural fractures, snd provide deformation moduli that will contribute to the analysis of the Ehermomechanical behavior of the rock in the simulated waste repository.
During fiscal year 1979 the large core was prepared for testing by construction of reinforced concrete end caps {Figure i) and drilling a 7.62-cm-diameter hole through the long axis, which serves for injection of water. The fractures contained within the core have been mapped and characterized. The rock is pervasively fractured down to the microscopic scale but fluid flow is dominated by two principal sets of fractures; one oriented approximately normal to the core axis and one at about 30 degrees to the axis. The major fractures are shown in Figure 3. A petrog-aphie study of the core has been made using thin section, x-ray diffraction, and microprobe and soit x-ray fluorescence techniques • The rock utrix is a quarts motizonite and the fracture filing is intimately related t» matrix alteration, with chlorite, sericite, and calcite minerals predominating. In preparation tor tests in the large triaxial machine, simple, falling-head permeability tests have been made to obtain preliminary estimates
Figure 2. Ultra-large Stripa core. (BBC 796-8237)
of the comdmetivitv sad interconnection of flow paths through the fractniea amd tutrix of the cor*. The reaulta .scow that, depending upon the injection interval, there are a multiplicity of primary amd complex secondary flow peck* through the cor* Chat cam accommodate flow* at high as S 1/aim under injection pressure *• low aa 0.01 Pa. tthen the injection interval ia not intersected by a major discontinuity the tents indicate a matrix permeability on the order of 10"* em/sec.
For the purpose of qualitative comparison of conductivity of different intervals within the cor* teat, reanlts have been presented in the form of Figure 4. The term kC is a combined "permeability-geometry coefficient** taken from the modified form of the Darcy equation:
1 - kCfc . (2)
whev.e Q is flow rate, t is the injection head, k is th* coefficient _f permeability, and G ia a geometry factory that depends upon the cross-sectional area and length of the flovpath.
The ultra-large core is scheduled to be installed in the triaxial vessel in January 1980 and will be instrumented to obtain measurements of changes in fracture aperture and radial deformation during injection snd withdrawal permeability testing under controlled cycles of increasing and decreasing axial load. To estimate the maximum load that can be safely applied to the core, a aeries of point-load tension rests, oirect tension tests, uniaxial compression tests, and triaxial compression tests were performed on naturally fissured and intact, 5.2-cm-diemeter cores obtained from core-holes in the Stripa mine. Lover-bound Hohr failure envelopes for the fractured and intact rock have cohesion intercepts of 7.3 and 24.0 K7a and tingles of friction of 55° and 65° respectively. From these results ve estimate that the ultra large core has a load- bearing capacity approximately twice the 17.8 HN maximum axial loading capability of the triaxial machine.
Sire-Effect Studies
To extend understanding of the fundamental laws governing flow through fractures in crystalline rock, particularly with respect to flow through natural fractures and the influence ti sample size on measured hydraulic properties, a research program using the ultra-large core test facility is planned to begin in 1980. This work will complement research on saaller cores currently under way at the University of Waterloo. During fiscal year 1979 a b Jtch for sources of suitable samples of naturally fractured rock was made jointly by LBL and the University of Waterloo. We identified several quarries containing suitable rock aid equipped with the large-scale rock dressing and handling equipment necessary for recovery of ultra-large cores, in tht Sierra Nevada foothills near Fresnc, California, in the vicinity of St. Cloud, Hznoesota, and at Lake Placid, New York (Gale, 1979). A massive block of granite at the Charcoal Black Quarry, Cold Spring, Minnesota, that contained a single well-defined natural fracture (see Figure 5) was selected to demonstrate the feasibility of sample recovery and prcp^rstion techniques. By the end
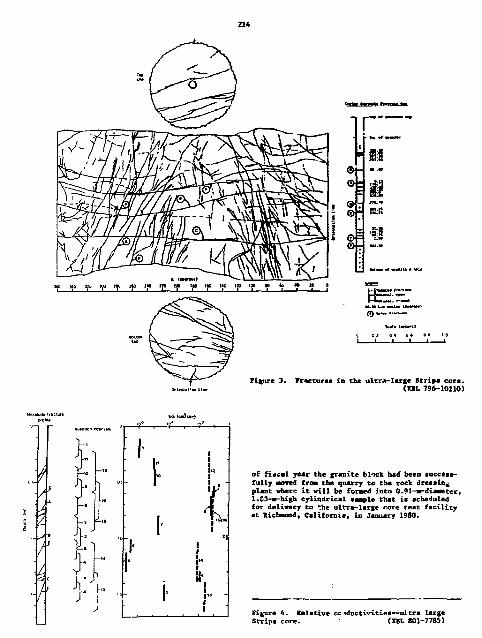
Figure 3. Fracture* in the ultra-large Stripa core. (X1L 796-10210)
J • > *
r •L
of fiscal year the granite blick half been successfully aored froa the quarry to the rock dressing plant where it will be foraed into 0.91-a-diaaeter, l.S3-a-high cylindrical Maple that is scheduled for delivery to the ultra-large core test facility at Richaond, California, in January 1980.
Figure 4. Relative cc ductilities—-ultra large Stripa core. ( M L 801-7785)

215
urancis cmD
Figure 5. Fractured block of Cnarcoal Black granite. {CCB 798-10084)
^IJ/=«U DISEQUILIBRIUM STUDIES M. C. Michel and W. R. Keyes
The disequilibrium between 234JJ ^nd 2 3 8 Q observed in most ground waters can, in principle, serve as a clock to enable dating of the ground water reservoir (tiae since recharge) or, more appropriately, to indicate the rate of flow of the aquifer (Cherdjrnatev et al., 1955; Isabaev et al., I960; Thorbcf, 1962; Cowart and Osmond, 197^•) This type of inforhttion is of interest in asaesaing the suitability of a particular site as a nuclear vaste repository baaed on the assumption that a slowly moving (old) aquifer represents a lower probability that mobilised wattes will return to tha environment. All this preBuppoaeB failure of all the other means to avoid such mobilisation. Because the time for 234j
to reach secular equilibrium is Lhe same order of magnitude (—250,000 years) as the criteria for waste isolation, the determination of 234n/238 n disequilibrium gives a measurement of the proper interval.
The secular equilibrium betK&en 234p/ ^ a 238»j established in uoat rocks and uranium deposits yields a mass ratio of 18,300. The ratio of alpha radioactivities is by definition equal to
Gala, J. I., 1979. TaatUg facilities for mltra-larg* rock coreet Task Is iaaatificatioa of aitca for asamle gataerimg. Vaiveraity of amtcrloo BKZ 904-02*
lalea, F. «. mi Aaaeraaon, 1., 1971. Kiaiag sjethoaa meed ia tarn aadargramB• taamela and taet rooms at Strip*. Berkeley, Tamisai • Berkeley Laboratory, UL-70fl, SAC-OB.
Witberepooa, F. A., Aadck, C. •., Gala, J. I. F
1977. Stress-flow behavior of a fault soae with timid iajectioa ami withdrawal. Berkeley, Uaiveraity oi California, Deeartaaal. of Materials Science aa4 Mineral lagimeerinj, teport *>. 77-1, 159 *.
Witberspooa, P. A., and Dagirmaa, 0. v 197». Swadiam-aamricaa Cooperative Proexaa on laaioaetiva waate Storage la Mined Caverns ia Cryetalliae Bode, Berkeley, Lawrence Berkeley Laboratory, LBL-7049, SaC-01.
tfitherapoon, T. A., Aaick, C. 1., Gala, J. I., and Ivai f K., 1979a. Ovaarvatioaa of a potential aiac-effect ia experimental determination of the hydraulic properties af fractures. Berkeley, Lavraaco Berkeley Laboratory, UL-9571, SAC-17.
witberapooc, F. A., Hang, J. S. T. f Iwai, K. t «nd Gale. J. E., 1979b. Validity of cubic lav for fluid flow in a defomable rock fractuic. Berkeley, Lawrence Berkeley Laboratory, LBL-9557.
Wither spoon, F. A., Watkins, D. J., Cook, K. G. IT., Hood, H. t and Gale, J. C , 1979c. Laboratory investigations on the hydraulic and tnerao-mechanicel properties of fractured crystalline rocks. Berkeley, Lawrence Berkeley Laboratory, LBL-9582.
1. Direct alpha particle counting is applicable to the atudy of the disequilibrium in uranium and almost all the work to date has been done in this way. Because deep groundwaters often have only a few parts per trillion of uranium, measurement* by thi« method often require several tens of litera of sample, an amount difficult to recover from deep wells or drill holes, especially without serious contamination by other waters. It was, therefore, proposed that direct mass spectroaetric measurement of this ratio be made. This is a technique that should allow measurements on samples of only a few tens of mililiters. This aire sample can easily be obtained by the use of remote samplers presently in use or currently being designed.
The work in 1979 was related to the ability to recover meaningful data from such azall samples of uranium without introducing either natural or other uranium contamination during "thi necessary chemical separation procedures. Sens tivity of the mass spectrometer itr.jlf is much jreater than can be used with present levels of ursnium background. lK)Eopic dilution analysis (using pure *33-_i) has been used to determine the "blank" levels

216
of the chemical separations and the uranitai content of various reagents and Materials. Since^ except far the 2 3 i U isotope, the samples are imdiscinguiah-able fro* natural uranium, it is accessary to reduce blank levels well below the sample aizaa to assure the Integrity of the result*. Fortunately, natural uranium contamination affects the 2 3*lf abundance less as the observed enrichment increases, and since a precisior of 1 or 2Z is sufficient for this work, amount* of natural uranium below IX of the sample size represents an acceptable level.
In dealing with very suit amounts of materials in chemical separations, where there it the possibility of introduction of the same material from the environment, it ia always desirable to minimixe the number of chemical operations and reagenta used. A very simple Scheie has been developed for separation of uranium from groundwater* This involves treating the groundwater with BC1 gas to produce about 4 M HC1 followed by near saturation with sulfur dioxide gas (to reduce Fe'* to Fe^*). This solution is then passed through an ion exchange column packed with the chloride form of a quAternery amine, a strong baae anion exchange resin. Under these conditions almost all of the major cations and non-ionic impurities pass through the column without holdup. Only urauiur. and a few other elements present in low abundance are sufficiently complexed in 4 H HCl to adsorb strongly. Washing with 4 M HCl fallowed by elution of the uranium (and a few other noninterfering trace elements) in 0.1 H HCl completes the separation. The sample is obtained in a small volume, which is further reduced by closed-system evaporation with flowing dry nitrogen. Thia sample is then transferred to the ion source and dried. At this point it is ready for mass analysis.
Mass analysis is performed in the 5-ft-radius mass spectrometer as the UO2* ion, and using single ion counting techniques. Because of the high vacuum, the high ion energy (40 keV) and the large radius of this instrument, gas scattering from 238u a t t n e 234 y position can be reduced to the order of 1 ppm and only ionization of organic impurities of the appropriate mass can create a significant ion background. Proper sample conditioning can reduce this background to levels below 0.01 c/sec. Since it is possible to allow total ion count rates of several thousand per second at mass 238, signal-to-background ratios of 100:1 can be attained at mass 234 with total sample sizes of the urder of 1 ng or leas. In such samples the counts of 234g a r e equal to or less than 0.05 p, (10^ atoms). During isotopic dilution analyses, quantities of individual isotopes have been identified at levels of 10"*^ grama (3 x 10* atoms) with a precision of at least 10X.
Early i<i development of the 23y«n;/238n technique, it wes discovered that small amounts of natural uranium are found in almost all reagents and this could easily be reduced to acceptable levels. The ion exchange resin, however, in addition to small amounts of natural uranium, was found to contain uranium in a different chemical form enriched in ^ U (and containing an almost constant fraction of 234n). This enrichment was not in constant proportion to the natural uranium but depends on the source o£ the resin. In addition, with the
same resin, the relative anomnte of the two cymes of uramivn contamination introduced into blank rams depemde om details of the operation of the column that arc not readily maeeratood. From the level of 23*0 and the observation of occasional ssmaVIes with unusmally high levels of 2 3 5 U , it aeama possible to conjecture emit the uranium containing the 2 3 ^ 0 is spproximstely of the composition of weapons grade mramimm, which is aeoumced in gaseous diffusion nlanta. This contamination may be introduced into the resin manufacturing process through recovery of slightly contaminate* reagents or (less likely} through generalised contamination of a plant or process. The amounts ere smell enough thxt they represent no conceivable health or ssfsty pron2emt and, therefore, cocld eaaily have escaped detection.
Further work demonstrated that the 2 3 5 U enriched uranium is released from the resin only when a concentration gradient is passed down the column es is necessary when going from the concentretion pb, se of the chemical separation to the elution pluse. Washing the column with a constant concentration of the conplexing anion (Cl~) removes a much amaller (and not significant) amount of 2 3 5 0 . tt is possible to deplete the uranium reservoir to some extent (with some batches of resin this may be a alow process) and eventually reach small enough background contamination ';o permit the 234ny238p anaiyjes to be performed. Because of the extremely simple chemical separation allowed by the ion exchange technique, alternative separation schemes have not been tested. This is because other approaches involve more .iteps, more sources of accidental contamination and.- therefore, a more laborious program of blank monitoring.
It should be pointed out that the enriched 235(j/234g fixture is particularly damaging because it not only increases the 234|j 5i, n^ D ut. also destroys the known 235^/238^ r a t £ 0 i n t n e B M p i e s . This removes a very valuable internal standard with which to assure proper operation of the entire mass spectrometer end data collection system. Of course, since the
2350/23*0 ratio is eaaily deter
mined for a particular colum, corrections to the data can be made, *>ut only with a loss in precision and this should be avoided.
We expect that further work will allow elimination of the source of non-natural background. If this can be accomplished, no other barrier to successful measurements of the uranium disequilibrium appears to remain. Because of the email sample size, 238n/234n ratios at very low total uranium concencrati ins can be measured, which is a necessary requi?'-itent for deep drill holes In addition, because of the ability to examine small samples, we anticipate that the disequilibrium in uranium deposited in secondary minerals, especially in fracture-type aquifers in basically solid rock, can be investigated. These secondary minerals may contain information on the history of the disequilibrium in the groundwater. A laboratory simulation of the alpha-particle recoil enrichment of
will also J»« attempted to determine the effect, on enrichment yield, of the chemical environment. This is a serious consideration since the decay proceeds by way of 2 3 4 ^ w£th a half life of almost

217
* aonth and with ent ire ly different chemistry than uranitm.
REFERENCES CITED
Cowart. J. B. , and Osmond, J . X,t 1974. 23*0 and " 8 U in the Carrizo Sandstone Aquifer of South Texas. IAEA-SH-102/35.
Cherdyntsev, V. V., Chalov, T. I . t and Khaidarov, G. Z., 1955. Transactions of the 3rd Session
of the Committee for Determination of Absolute Age* of Geological Formations, law. Akad. •auk. , USSt, Moscow, 175.
Isabaev, E. A. , Usatov, B. P . , and Cherdynbtaev, T. * . , 1960. taotopic composition of araniuai in matural samples. Soviet Radiochcmistry, v. 2 , p . 97.
Thorbcr, D. L . , 190*. Anoaaloua 23*rj/23»o i n
nature* Journal of Geophysical Research, v . $7, p . 451S.
SEARCH FOR UNDERGROUND OPENINGS FOR IN-SITU TEST FACILITIES IN CRYSTALLINE ROCK H. A. Wollenberg, B. Srrisower, D. I Corrigan, A. N. Graf, and M. T. O'Brien
The literature on underground sines and civil works in the United States was surveyed in the first phase of a search for sites for in-aitu teat facilities in crystalline rock. Such sites would he utilized for geomechanical, geochemical, and hydrogeologic tests pertinent to the isolation of radioactive wastes in crystalline rock. For the purposes of this study, crystalline rocks were limited to pl:itonic rocks and medium- to high-grade netamorphic rocks.
Literature searches were done, primarily using the Minerals Availability System data base of the U.S. Bureau of Mines; to a lesser extent, the Computerized Resources Information Bank compiled by the U.S. Geological Survey; and GEOREF. From these sources and from consultants, a list of approximately 6100 mines and civil works in known rock types was compiled.
Criteria used ho judge each site included workings:
• in crystalline rock • at depths below 600 ft • of adequate size to provide for a Strips-
sized facility • open within the past 10 years and not
flooded or caved • below the water table, and • with good rock support.
The selection process, diagrammed in the flow chart in Figure I, resulted in the identification of 26 mines and 4 civil works (designated Class 1 sites), which met all the criteria. Thirty mines that probably meet the criteria (but could not be verified based on information in the open literature) were listed as Clans 2 sites.
Potential underground workings range in size from a few thousand lineal feet, with the capacity to employ a few tens of miners, to jeveral hundred miles, employing hundreds of miners. Depths range from near the threshold lisit of 600 ft to over 8000 ft.
Names of all 60 of the Class 1 and Class 2 sites are listed in Table I and locations are shown ou the aceompanyiug map of the United States (Figure 2).
Claas 'I suoea or civil works in tectonically stable mid-continent or eastern regions of the United States include one in Maine, two in Minnesota, two in New Jersey, two in Mew York, and one \a South Carolina. The remaining Class 1 sites are in the Rocky Mountain region and westward. Of the civil works, pumped storage facilities incorporating underground and appurtenant galleries may offer the best prospects for in-aitu test facilities, because, even though they may be operating, access may still be available to test and support galleries.
Many of the workings in Class 1 mines are in hydrothermal vein deposits, at or near contacts between plutonic and older sedimentary, volcanic or atetamorphic rocks. Test facilities at these sites would therefore be located relatively near the margins of crystalline rock masses. Notable exceptions are the Climax, Ursd, and Henderson mines in Colorado, mines in the Butte district, Montana, the San Hanuel-Kalamasoo in Arizona, and mines in the Duluth Cabbro, Minnesota. All of these ore bodies are located well within plutons.
Mines within medium- to high-grade met amorphic rock masses include tht Homes Cake, South Dat:ota, the Schwartzwalder and Colorado School of Mines' experimental mine in the Colorado Front Range, the Mt. Hope/Scrub Oaks, New Jerse>. ar.d mines of the Lyon Mountain restrict, Vcr York.
Structural settings of mining districts are dominated by the aforementioned contact zones, by strong folding and faulting in the caae of mines in metamorphic rocks, jnd by zones of intersecting faults in mines in plutonic rocks. Because of their stability requirements, underground hydroelectric facilities in crystalline rocks are located in relatively stable tectonic settings, usually away from the contacts with other rock types. Accessible openings associated with hydroelectric facilities may offer rock property conditions moat similar to rock properties of potential waste isolation sites.
A program was recommended which would definitively evaluate the available and accessible underground workings. This program would result in the identification of one or more sites where a concordance exists between rock type and struc-
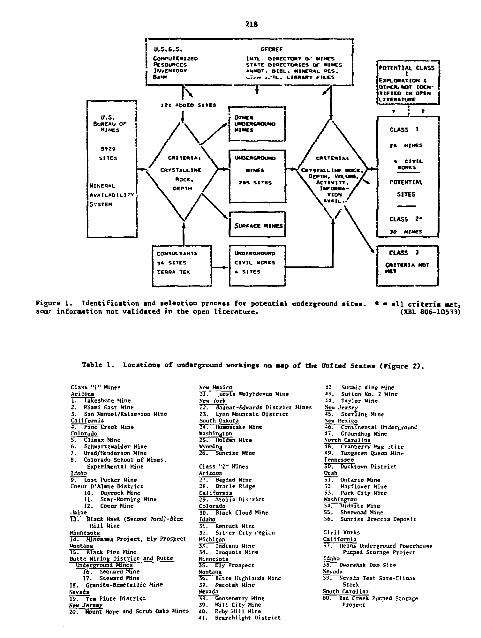
COMPUTERIZED Resources INVENTORY BANK
I N T L . DIRECTORY O.- Hires STATE DIRECTORIES OF NINES *KMOT. BIBL. MINERAL RES. ^7_rt .:•»!.. LIBRARY FILES
U.S. BUREAU OF
MINES
MINERAL AVAILABILITY
SrSTEM
POTENTIAL CLASS I
EXPLORATION 4 OTHER. NOT IOCN-T I F ICO I N OPtN LITERNTUKC
(CRYSTALLINE HOCK DEPTH. VOLUME.
ACTIVITY. INFORMA
TION I AVAIL.-
t SURFACE MIMES
1 CONSULTANTS 3* SITES TERRA TEK
UNDERGROUND CIVIL H O R K S * SITES
CONSULTANTS 3* SITES TERRA TEK
UNDERGROUND CIVIL H O R K S * SITES
Figure 1. Iden t i f i ca t i on and se lec t ion process for po ten t i a l underground s i t e s . * * a l l c r i t e r i a ne t , some information not va l ida ted in the open l i t e r a t u r e . (XBL 806-10533)
Table 1. Locations of underground workings on map of the United S ta t e s (Figure 2 ) .
Class "I" Mines Arizona T LaTeshore Mine 2. Hiaai East Mine 3. San Manuel/Kalaivzoo Mine California 4. Pine Creek Mine Colorado IT Climax Mine 6. Schwartinsider Mine 7. Urad/Htnderson Mine 5. Colorado School of Mines,
Experimental Mine Idaho 9. Lost Packer Mine Coeur D'Alcne Dis t r i c t
10. Dayrock Mine H . Star-Morning Mine 12. Coeur Mine
itaine 13. Black Hawk (Second PandJ-Blae
Hill Mine Minnesota 17! t&miaMtx Project , Ely Prospect Montana IS. Black Pine Mine Butte Mining Dis t r i c t and Butte
Underground Mines" 16. Leonard Mine 17. Steward Mine
IS. Granice-fiinetallie Mine Nevada 19. TBM Piute Dis t r i c t Hew Jersey 20. Mount Hope and Scrub Oaks Mines
New Mexico 21. "uesta Uolybdenua Mine New fork 22. Balcat-Edwards Dis t r ic t Mines 23. Lyon Mountain Dis t r ic t South Dakota 24. liosestafce Mine Washington 25. Hoiden Mine Wyoaing 26. Sunrise Wine
Class "Z" Mines Arizona 27. Bagdad Mine 28. Oracle Ridge Cal i fomia 29. Atoli* Di*:r ict Colorado 30. Black Cloud Mine fdaho 31. Kentuck Mine 32. S i l - e r City i*egiun Michigan 3?. Indiana Mine 3d. Iroquois Mine Minnesota 35. Ely Prospect Montana 36. Butte Highlands Mine 37. Dacotah Mine Nevada 36. Gooseberry Mine 39. Mill City Mine 40. Ruby Hill Mine 41. Searchlight Dis t r ic t
42. Submit tinj; Hinc -33. Sutton \a. 2 Mine -J4. Taylor Mine \ew Jersey 45. Ster l ing Mine \cw Metico 46. Continental Underground 47. Groundhog Mine Sorth Carolina 48. Cranberry Mag .-tite 49. Tungsten Queen Mine Tennessee 50. Ducktown Distr ic t Utah 51. Ontario Mine 52. Mayflower Mine 55. Park City Mine Washington ST; Hidnite Mine 55. 5herwood Hine 56. Sunrise Breccia Deposit
Civil Korks California 57. HelDs Underground Powerhouse
Pucped Storage Project Idaho 58. DworshaJt Dan Si te Nevada 59. Nevada Test Site-CIinax
Stock South Carolina 60. Bad Creek Pucped Storage
Project

Figure 2. Map ahouing tho locations of claas I minea, Claaa 2 minea, and civil work, identified in thia "• (XBL 802-7992) study.

220
tural setting and depth, company amenability, accessibility, facilities* and hydrogeologic setting.
The remits of this project, supported by the U.S. Department of Energy Office of Hucleer Watte Isolation, are reported by Wollembere, et el. (1980). The report includes detailed descriptions of the 26 mines and 4 civil works designated as Class 1. Information includes location and accessibility, geologic setting, and description of workings and facilities. Tables give known information and
indicate the missing data for Class 2 mines. A bibliography lists the 945 references consulted during the course of the study.
U F E U M C 1 CITED
tfollenberg, 1. A., Stritowcr, 1., Corrigan, D. J., Graf, A. H. f O'Brien, M. T., Pratt, H-, Board, H., and •mstrwlid, H., 1940. Search for underground openings for in-situ test fecilties in crystalline rock. Berkeley, Lawrence Berkeley Laboratory, LBID-077, 469 p.
THERMOCHEMICAL MODELING OF MASS TRANSPOItT PROCESSES IN THE NEAR-CANISTER REGION OF A IASALTIC NUCLEAR WASTE REPOSITORY L. V. Benson and P. C. Lichtner
INTRODUCTION
The emplacement of high-level nuclear wastes (HLW) in a basalt repository will alter the chemical physical properties of the underground environment. Changes in these properties will induce a variety of chemical reactions in both the near-canister and fer-field regions.
In order to understand the effect of these reactions on the redistribution of radiochemical species in the natural environment, we have initiated the development of a multicomponent chemical transport model that will be used to simulate near-canister thermochemical processes,
MODEL DEVELOPMENT
In its final form the chemical transport model will include complexation, dissolution, precipitation, and sorption (ion exchange) mechanisms. Its range of validity will include temperatures up to 100°C and aqueous solution concentrations up to e few molal. Heat and fluid transport properties will be simulated using SHAFT79 <K. Pruess et al., LBL) which will be coupled to the set of chemical reaction calculations.
The description of chemical processes in the model is baseu on the assumption that the rates of chemical reactions are "fast" compared with the advective or diffusive flew rates. This enables the use of chemical equilibrium theory to determine the local concentrations of tire various chemical species in terms of a conveniently chosen set of basis species.
According to this theory reaction product concentration* -re determined from the law of mass action as products of basis species concentrations raised to the power of their corresponding stoichiometric coefficients and multiplied by an effective equilibrium constant. The effective equilibrium constants depend in general on the local tempera- , turs, pressure, and concentrations of the constituent elements.
The transport equstions describing the time evolution of the basis component concentrations.
cjfr,t), then follow from mass balance relations lied to an elemental fluid volume and are of
^ form
{«•*} v ? (j - 1,...M) (1)
Here Fj(ci...cw) is the total fluid concentration of the j t n component composed of its free ion concentration cj(r,t) and that contained in fluid complexes; SJ( C I . . . C M ) is the total sorbed snd precipitated lopcentration of the j C n component, and the differential operator L describes diffusive/ dispersive and eonvective flow
L - V • DV - V • v 0 , (2)
where D is the diffusion/dispersion coefficient and v 0 is the bulk fluid velocity.
Because in generel the concentration of one basis component will depend on the concentrations of all the others, the sec of ttensport equations (1), are in general a coupled set of nonlinear partial differential equations.
To solve equations (1) appropriate boundary conditions are necessary specifying the initial concentrations of each component in the fluid and their source terms.
The total adsorbed and precipitated concentration of the 2 component, Sj, may be eliminated from equations (1) by noting that Sj is proportional to the total fluid concentration, F;
The quantity Kj, called t'ae distribution coefficient, is in general a •..-'•linear function of the fluid concentrations, cj.
Use of definition (3) for the distribution coefficient allows the transport equations (1),
CD be written in the for*
{L- ( 1 ,K . )£ } v ^ir .
From this result it follows that whenever the distribution coefficient may be approximated by a constant, there is no coupling between different components and each component moves independently frc* the others governed by the retarded flow operator, L j r e t . given by
ujret "jret v 31
jret 1 * K.
jret I * K.
This approximation is called the retarded flow approxin&t ion.
la gcmcral, however, neither will the distribution coefficient be constant nor will its tim» derivative appearing in equation (*>) be necessarily
(4) small. In this case, the retarded flow approximation will no longer be valid and the tie* evolution of the basis components may be significantly altered.
The aajor objectives of the initial part of the project were to derive to* cheaical transport equations including a sorption algorithm.
In addition a simplified two-* aa^oneat sorption model (TCSM) was studied to investigate the effects of competition for sorption sites. Finally the limiting form of the transport equations for trace
(5a) concentrations was investigated and waj shown to reduce to the retarded flow approximation with distribution coefficients whose forms are a function of the valence of the particular ion under consideration, fuljre work will concentrate on
(5b) developing a computer code Ko solve the transport equations under conditions appropriate to HtH storage in underground repositories. It is expected that a considerable effort will be devoted
(5c) to verification of the chemical transport model by comparing results with various laboratory experiments. Of special interest will be the modeling and design of engineered barrier systems that can be used to retard the migration of radior. elides species.
THEORETICAL AND EXPERIMENTAL EVALUATION OF WASTE TRANSPORT IN SELECTED ROCKS R. J. Silva, L. V. Benson, A. VV. Yee, and G. A. Parks
INTRODUCTION
The licensing procedure for the storage of nuclear waste in undergrounl geologic media will involve a safety assessment of the proposed site. Since the time scale being considered is 100,000 to 1,000,000, predictions based on realistic Modeling studies provide the main avenue of assessment. Modeling studies are only as reliable as the data on which they are based. For the prediction of radionuclide migration in geologic media, it is essential that the systems involved be well understood.
The objective of th»» program is to develop quantitative data and methods to describe the interactions that control the transport of radionuclides in geologic environments anticipated for terminal radioactive waste storage facilities. The program covers a theoretical and experimental evaluation of the physical and cheaical processes governing sorption phenomena, with the goal of establishing a basis on which distribution coefficients might be reliably predicted for any given radionuclide with a variety of geologic materials and groundwater types.
The first year of this program, fiscal 1977, was devoted to a review of the literature on the thermodynamic data for aqueous complexes and solid
Stanford University
phases of Pu, Np, Am, and Cm likely to form in the natural environment and on the transport mechanisms of radionuclides in water-saturated rocks- An assessment of factors influencing the radionuclide-rock interactions for conditions expected in a tensinal storage facility was made (Apps et al. r
1978).
During fiscal year 1978, a theoretical and experimental program was developed with the purpose of identifying the most important parameters governing the transport of five actinides (U, Np, Pu, Am, and Cm) in the three rock types: Umtanura basalt (Hanford), Eleana shale (NTS)) and Climax quartz aonzonite (NTS). The work demonstrated that the behavior of the actinides in groundwater and their sorptio:. on rocks was dependent on the oxidation state of the actinide and on the solubility of stable precipitates such as oxides, hydroxides, and carbonates. Furthermore, it was determined that secondary alteration phases such HS clays and zeolites appeared to scrb actinides preferentially over other rock-foroing minerals such as silica and feldspars (Silva et al., 1972).
THIS YEAR'S ACTIVITIES
In fiscal year 1979, experimental and theoretical efforts were concentrated on a study of the sorption of cesium on the substrates quartz (Hin-u-sil) and montraorillonite (Belie Fourche clay)—two representative geologic materials that

222
•re widely distributee* sad treemeatly eoat weathered surfaces. This stedy wae amoaTtafcem in order to begin to delineate the principle parameters in sorption processee. Ccsiwm was cboeea for these beginning studies because it exhibits rather simple chemical behavior under most solution conditions.
The experimental effort was aimed ati
1. A characterisation of the solid phases which included determinations of cheaical compositions, particle sixe distributions, surface sreas and catioa-exchaagt capacities!
2. A determination of the surface acid dissociation and electrolyte binding consteat• of the •olid phases from the results of acid/base titrations of their aqueous sols*
3. The measurement of Cs sorption isotherms on the two substrates at 26°C over a wide range of Cs concentrations, pa* and concentration of supporting electrolyte from batch-type experiments using finely crushed materials. Sodium chloride was selected as the supporting electrolyte because o£ the current interest in salt domes as a waste repository. In addition, one mixed electrolyte of a composition similar to the groundwater! from Col'jubie River basalts was selected to simulate s natural system. It had en ionic strength of about 0.003 m.
Cesium sorption isotherms using the sodium form of the Belle Fourche =1-7 snd Min-u-sil were obtained for initial Ca concentrations of 1 0 - 3 , 10" 5, 10" 7, and 10" 9 m for the clay and iO - 4, 1 0 - 5 , 1 0 - 6 , 10*7 y IQ=8, and 10" 9 m for the quarts; pH values were 5* 6, 7, 8, 9, and 10; electrolyte solutions were 0.002, 0.01, 0.1, and 1 m NaCl, and in the simulated basalt groundwater the starting Cs solu*ions were "spiked" with l 3 7 C s tracer and Cs concentrations in solution before and after sorption determined by Y-ray counting the solutions.
Because the concentration (and radioactivity) of the influent CB solutions had previously been measured, the determinations of the ^ 3 7Cs radioactivities (and thus total Cs concentrations) in the effluent solutions allowed the calculation of Kd's.
10* - • — I J T ' 1 — r — r — • 1 '
• Bene Fourche cloy pH>7.Q±0.l
* ' * • •
- • • • • •
-* * * * «
- 4 4 1 1 - t •
1 • 0 0 0 2 V HaCi • OOt* MaCl • O.IB MsO • I > * « C l • sew
1 ! 1 ' ' ' -8 -7 -6 -5 -4 -3 -2 -I
Log Cs loading 1 m moles /gm)
Figure 1. Distribution coefficients, Kj, for Cs measured at 26°C on the Ka form for the Belle Fourcbe eley es a function of Cs loading at pB 7 for several electrolyte compositions. SGV • simulated basslt groundwater. (XBL 799-11576)
the nolid substrate and electrolyte concentration at pH - 7.
The equation for the exchange of the monovalent cations cs* and Ma + between the solid surface, s, and thv aqueous solution, a, may be written as (Helfferich, 1962}
SOTIa* + Cs* I S0 -Cs* + He* s a s a
where S0~ represents rhe surface sorption sites. The mass action expression for the thermodynamic equilibria constant is
cl The
Concentration of Cs per gran of Solid Concentration of Cs per milliliter of Solution
f • fraction of influent Cs remaining in solution
v - volume of solution (ml) w • weight of clay or quartz (g).
AB examples, results for the Belle Fourche .ay and Hin-u-sil are presented in Figures 1 and 2. ie~ show the variation of X4 with Cs 1' jding of
Cs/Na r«rcs3sfra+]« [S0-Ha +],[Ca +] a
y C s + YS0Tre*
where the first term is expressed in concentrations of ions on the surface and in the solution phases and the second term contains the corresponding activity coefficients. The latter equation can te written as
Cs/Na [S0-Na+] B
where r is the quotient of the activity coefficients. If Co ia present on the absorber at trace

223
1 ' ' ' 1 i i i Min-u-sil pH= 7.0*0.1
t
-
• f •
* • •
4 t
• . * t ' t
• 0.002 M NeCl • 0.015 NoCI i, -r . -* O.lS NoCI i, • l * NoCI * SGW
i i i -9 -8 -7 -6 -5 -a -3
Log Cs loading (m moles/gm)
Figure 2. Distribution coefficient*, Kj, for Cs measured at 26°C on Min-u-sil mm a function of Cs loading at pH 7 for several electrolyte coaposi-tions. SGW - simulated basalt groundwater.
( M L 799-11584)
loadings , i . e . , a t only a few percent of the capacity , then [so~Na*]B remain* nearly constant and i s equal to the cat ion exchange capaci ty . Assuaing Kcs/Na/r c ° be a cons tan t , Kj should vary only with [ N a + ] a and not with pH or Cs loading.
For the Belle Fourche c lay , the measured Revalues showed only a small dependence on pH and Cs loading hut a larg-.j, inverse dependence on e l e c t r o l y t e concentrat ion «s expected froa the simple sasa-acfinz. expression of the exchange of Cs for Ha. However, for the Min-u-s i l , the Kj values showed a ' " a e dependence on a l l th ree parameters tha t could not be explained by the simples expression. For both s u b s t r a t e s , the va r i a t i on of Kj with pH .ndicated that the competition of H* for surface s i t e occupancy should a l so be included. The Kj I values for the synthe t ic groundwater were s imi la r to those of the NaCl solut ions of near ly the same ionic s t reng th , i . e . , L-.002 m NaCl, for the clay but were taore near ly l ike the values of the 0.01 m NaCl solut ions for the Min-u-s i l .
The t heo re t i c a l e f fo r t s were aimed a t developing and t e s t i ng an advanced sorption model (Yates, 1974; S i lva , 1978) to predic t kd va lues . This model i s reasonably complete in that physical and chemical in t e rac t ions are considered s imultaneously in the ca lcu la t ion of surface sorpt ion and
eolat ion ch—teal • •mi l iar ia for major e l e c t r o l y t e ions ami d i l a t e aolmtes. Use Model can a l s o i a -c leee the e f f e c t s of the develnpeiat of earface charge oa tee earface aorptioa react ions , i . e . , the e f f ec t s aac to tee JmlnmaiiT «E am e l e c t r i c a l doable layer (Crahaae, M 7 K ike «odel requires e knowledge of tea ttoraodyaamic cosstaate of the •erface reactiona ee wall « • those eoeemiag the e o l a b i l i t i e e and coaalexatioa of the eolat ion • s « c l e e . A coanwterixed version of the model, ca l led KDaYJI., awe btoaght t o operational statue e t U L . MIIBQL i e eeeieaed to accept • l i s t of consonants of a eo l e t i ca earn ac l id s h u t sad their t o ta l e a e l y t i c e l concerntretioaa, so lve t ee anaro-priete eet of aaae b&laace eM e e e i l i b r i a a expressions, sad ncoeuce e l i s t o i the i d e n t i t i e s •ad concentrations ot a l l species formed, by the interect ioa amoa[ the coaaonenEe ead between tbtei and/or water, e . g . , prec ip i ta tes , complexes and •orbed spec ies .
lepat parameters required by w,WQL w r e d e t ' r -ained and eorptioa isotherms for C» on the t e l l e Fourche clay were calculated over the aaae range of pereaeters a* the experimental aeastreseats . As aa example, the r e m i t s of the calculat ions are sbowa in Figure 3 (curves) al- % with the experimental values (points) for an . a i t i M Cs solution
Cs c= .OlxfCfy
5 6 7 8 9 10 PH
Figure 3 . Varia t ion of d i s t r i b u t i o n c o e f f i c i e n t s for Cs with pH for an -vaitial Ca so lu t ion concentrat ion of 1.01 x 10" 7 ^ tor several SaCl e l e c . r o l y t e concent ra t ions . £ / i i d points represent the e x p e r i mental data. S&iid and dashed curves r e s u l t froa calen1ations using MIKEQL without and with the inclusion of e l e c t r i c a l double layer e f f e c t s , r e spec t ive ly . (XBL 7911-113448A)
21k
concentration of 1.01 x 10" 7 •. Figure 3 abowa the variation of Kj with pH for the different ItaCl electrolyte concentration!. The aolid cervea were calculated without the inclusion of the electrical double l<*yer tffectaj the daahed curve* resulta when they are included. Where the aolid aatd daahrd curvea coincide, only the aolid curve ie shewn. Further comparison* of the calculation* with the .Telle Fourche clay experimental data deaoaatrated that MZNEQL was able to aiaulate the Ca sorption iaotheraii for the clay reasonably well over the range of parameters studied. The reaulta were quite encouraging and further testing of the model with other aubatratea and radionuclides is in progreaa.
REFERENCES CITED
Appa, J. A., Lucas, J , Kathur, A. K., and Taao, I.., 1978. Theoretical and experimental evaluation
of m u t e tramaport ia aelectc* rockai 7977 A—eal Report. Berkeley. Lawrence Berkeley Laboratory, LBL-7022.
Davie, J. A., Janes, B. O., and Leckle, J. 0. t
197t. Swrface ionization and conplexati&n of the oxide water interface. J. Colloidal Interface Sci., v. 3, p* 410-499.
Melffericb, 7., 19*1. Ica urbange. Hew Tork, KcCtaw-Bill.
CrahaM, D. C , 1947. lb* electrical doable layer *M£ the theory of electrocapillnrity* Cham. lev., v. 41, p. 4*1-501.
Silva, t. J., Beaaoa, I. T., w d Appa t J. A., 197*. Theoretical and experimental evaluation of waste traoaport ia selected rocka: 197B Aaaael leport. Berkeley! Lawreace Berkeley Laboratory, LBL-B094.
Yates. D. E., Leviae, S., aad Beely, T. *., 1974. Site binding model of the electrical double layer at the oxide/water interface. J. Cham. Soe. Faraday Trees. 1., v. 170, p. 1897-1818.

MARINE SCIENCES
The Marine Science Group is a multi-diaciplin-ary unit in the Earth Sciences Division responsible for research and development of programs whose basic sphere of reference i* the oceans. Poor iiriM-oriented diaciplines are represented in the training end experience of the staff:
Applied Oceanography (Ocean Engineering) Biological Oceanography Chemical Oceanography Geological Oceanography
The knowledge of the stsff is reinforced by a science advisory council of internationally recognised experts in the various oceanographic disciplines. Funding is provided by the Ocean Systeas branch, Division of Central Solar Technology,
U.S. Department of Energy.
The Marine Science Crow* waa formally incorporated into the larch Science Diviaioa in 1979 as an owtgrowth of U L ' s Ocean Thermal Energy Conversion (OTK) Program. The major research activity of the group is still related to the environmental aeseesment and antaaitreaHWt program for OTIC. Other activities include compiling marine geologic and other oeeanographic data for the west coast of the United States. The aeries consists of six map aheete each covering 3° of latitude with references} the northern five sheets have been printed. Thn Marine Science Croup also ia working on the potvtu-tial for petroleum accumulation in the deep aea off central California aa a cooperative effort with the U.S. Geological Survey.

Ocean Thermal Energy Conversion
ENVIRONMENTAL AND RESOURCE ASSESSMENT PROGRAM FOR OCEAN THERMAL ENERGY CONVERSION P. Wilde
INTRODUCTION
Ecologically sound operation! of projected Ocean Thermal Energy Conversion (OTIC) pleats can be insured by careful attention to the aariae environment during the design phase. Tbi-* require* quality information fro* regions of potential OTIC interest, coordinated with required aeacaasMmt studies to inaure legal compliance. Currently, preliai-nary or actual aurveya and laboratory studies are being conducted in the waters of Puerto lico, the Gulf of Mexico, Hawaii, and Cuaa for potential moored or seacoast OTEC plants and in the equatorial South Atlantic for proposed plant-ship operations to provide such bencbatark and baseline data. These data plus existing archival information can be used to model effects of OTEC operations based on projected design schemes. »oar cajor areas of concern are: (1) redistribution of oceanic properties, (2) chemical pollution* (3) structural effects, and (A) legal and socioeconomic effects. Elsven key issues associated with OTEC deployment have been identified. In general, mitigating strategies can be used to alleviate many deleterious envirooaantal effects of operational problems as biostimulatioo and outgassing. Various assessment research studies on toxicity, biocide releases, and other hazards are under way or planned to inveatigate areas where no clear mitigating strategy ia available. Data from the monitoring and assessment programs are being integrated into a series of environmental compliance documents including a comprehensive programmatic environmental impact assessment.
ENVIRONMENTAL CONCERNS
The four major classes of environmental concerns and the key issues in these classes associated with OTEC deployment and operations are:
1. Redistribution of oceanic properties (ocean water mixing, impingement/entrainaent, climatic/ thermal)
2. Chemical pollution (biocides, working fluid leaks r corrosion)
3. Structural effects (artifical reef, nesting/ migration)
4. Leg?.l and socioeconomic effects (worker safety, enviro-maritime law, secondary economic impacts)
PRESENT PROGRAM
Monitor xng The monitoring strategies are designed for
shipboard operations, manned platforms, and instrumented buoys. This program is to be integrated
with those proposed by OTEC groap* for bio-fouling and corroeioa, and by M A A for ayaoptic oceanograph-ic parameter*. An additional goal is to develop a packaged aonitoring program which caa be mobilised rapidly Co eld ia site selectioa for larger OTIC platform* (Figure 1 ) . Data collectioa aad aooicoring etrategiea will be done ia view of compliance with U F A aad EPA, Corps of Eegiaeers, aad Coast Guard regulations.
Specifically, the program initiated prr-operaticaal studies in four areas (Figure 2 ) :
1. Hawaii—one site off the Kona coaet (OTEC-1 site)
2. Puerto lie©—one site near Punta Tuna 3. Gulf of Mexico—regional survey using two
•tation locations: west of Tampa; and south of Biloxi
4. South Atlantic—regional survey, 5 to 10°S, 20 to 30°U, and affected cone
In the areas considered for the sea coast or moored OTEC option—Hawaii, Gulf of Mexico, and Puerto tico—a program has been initiated to take background data before placement of any operating OTEC system in these areas. This is required to insure chat baseline information is avail:.Die to evaluate the effects of OTEC on the ambient environment and to provide environmental data useful in the design of the operating system. At this time, only attractive thermal regions are known with any certainty. It is premature, therefore, to pick exact sites for potential OTEC plants until knowledge of other important environmental siting factors is obtained. Accordingly, for the initial studies each thermal region is divided into *ub-regions in which it is expected that the basic environmental conditions relating to OTEC are spatially homogeneous, although likely to vary seasonally.
To characterize each subregion, a reconnaissance benchmark is located. A benchmark is defined as a specific location, typical of a sub-region, where serial data are takes and to which historical data may be referred. Because of the lack of serial, long-term records ot any kind in attractive thermal regions, we believe that the benchmark approach is more valuable in the long term than initiating broad regional surveys where variations in measurements may be attributed to site as well as time variability, where substantial subregional variability is found, the benchmarks will be used as starting points for potential regional surveys.
The intent of taking measureaents at benchmarks is to provide data at a specific location, which will form the basis, in conjunction vith previously obtained data from th*s area, for defining longer

@ SATELLITE WITH THERMAL SENSORS
* &
FLY IV WITH AIRCRAFT INFRA RED PHOTOGRAPHY
CONVENTIONAL PHOTOGRAPHY THERMAL SCANNERS
FAR FIELO SURVEY SHIP CREW BOAT BETWEEN SURVEYS
NET TOW WINCH
METEOROLOGICAL TOWERWITH ~*^—r ROTATING TV OR MOVIE
CAMERA
' lIVOROCAST WINCH . j — * PFUHUI.
NET TOWS I PHYSICAL/CHEMICAL SAMPLING
{SCATTERING LAYER [
NEU5T0NT0W < < £ £ ?
SURFACE TOW < < g ^ P
VERTICAL SOHAR'
MIDWATEI *™k%£@>
-UL.
iX
-Jjfit-
EOUIPMENTWIRE ARTIFICIAL .'JBSTRATES-^
• IOFOULINO EXPERIMENTS
RAISED FOR PERI0OIC EXAMINATION
^) )•»"««
SHIP WARNINC AND FAR FIELD INSTRUMENTED IUOV
UP AND OOWN STREAM DATA 1ELEMETEREO TO PLATFORM
(( CENSUS \ . ' " i r
SIDE LOCKING SONAR
ARTIFICIAL SUBSTRATES
.BUOYANCY TORSION SUISUAFACt FLOAT
HYOROCASTWIRE: STD. TUAIIOOMETE*
VELOCIMETER WATER SAMPLES
CAMERA
|TEMPERATURE MOORED ARRAY
"THERMISTOR CHAIN ALONG FIPl A
MOVEABLE INSTRUMENT PACKAIE
ITD. TRANMHBMMCTER LOWERING tRAtSWI AT SEA
FREOUEWY
~f^ Mu,
Kin»rc I. Schomntto of OTB<* onviroiimcntn] noniCortnR a t a t i o n . (XBL 804-9189)

228
. HOTEC
•3*5—»W—dps—afer
Figure 2. Locution*, of preliminary OTIC surveys and laboratory studies in the Gulf of Mexico, South Atlantic, Puerto Rico, and Hawaii. (XBL 755-1393)
term and more craprehensive environmental surveys required for siting OTEC plants in the deaignatcd thermal region*. Station Optration" at the recon-naiaaance benchmark litea are given in Tablea 1 and
2. la edditioa to thia atatiom operation at each benchmark, a cmrreat profiler ran* emrin* atatioe operatioea, except ia lawaii ewe to the looa of the •olobolo ia December H 7 » . A cerreat eater array ia plsaaii at the Hawaii beachaatk hefore the ee|doy-aaat of OTlC-1. Satellite data, wheat available, will he weed to aaaiat ia the iaterpretatioa of data from the erreya-
•ecauee of coata aad reliability *actors, aeaauraweate for the iaicial aarveye will ha mainly froa eurvey abipa rather than froa iaatreaeated buoy a. The aervey ahip will occupy each beachaxrk aite bi-monthly for a aiaiaaat of three daya with augmented aaaeliag every foar aoatha. Sampling at each atatioa occupation ia deaigaad to give, at c minimae* day-night variationa ea well aa bi-aoathly variation* for the biologically aigaificatt paraae-tara. Parameter* aaapled bi-aoathly ere thaweh*: to have variation! which say be detected r.t .oat frequency* Paraaetera eaapled every four aoetha are thought: (1) to have leaa variation aaamally, or (2) to have potential but aareaolved aigaificaace to OThC* The ameaeated eammling every four aoatha alao ia doae to develop optiaal aeaauraaiat and aaapling techniques for paraaetera which becoae routine duriag future aite occupations.
Upon coapletioa of the initial atudy, (actually, durzi. tk* aurveya) the aaapling frequencies and cboi<~ of pjraaetirs will be rc-czauncd. le-aulta froa augrar \ eaaplinga, froa aerial aeapl-inga, and hiacori x data reviews will be uaed to deaign aubeequent aite data collection. Statu* of tbeaa aitea ia ahovn in Table 3.
Table 1. Benchmark program.
STATION OPERATION CLASS OF STATIPXS
Profiler
Hydrocast
Vertical profile* of horizontal current*
Discrete samples at depth ofs a. teaperature b. salinity c. dissolved oxygen d. phytoplankton
Vertical profiles of salinity, teaperature
PRIMARY Occupied in locations of priate OTEC interest -saapling frequency to ascertain diurnal changes
CURRENT PROFILES Occupied to determine spatial variability of current regime
3-DAY DURATION 2 deep hydrocas's 2 shallow hydrocaats 2 oblique net tows 4 current profilers 12 X6T U STD
2/1/2 HOUR DURATION 1 current profile
Net tows
XBT
Current meter arrays
Biological samples
Vertical profiles of temperatures to 750 m
Discrete measurements of horizontal water currents at depth
Transmissometer Vertical prof* ;» of light transiti ttance

Table 2. Ecological/chemical paraactera.
Station operatior Station frequency Saapling frequency
Temperature Temperature Salinity Salinity Water Currents
Light transaittance Dissolved oxygen Orthophoaphate Total phosphate Silicate Nitrate Aaaonia Urea
. Total nitrogen Alkalinity Trace petals C n1orophy11/phaeophyt in ATP \ Phytoplankton census 1 4 C uptake-PC^ DOC Zooplankton census
•ydrocaat STD, XBT Hydrocast STD Currant aeter Profiler Transai•soacter Hydrocast Hydrocast Hydrocast Hydrocast Hydrocast Hydrocast Hydrocast Hydrocast Bydrocast Hydrocast Hydrocaat Hydrocast Hydrocast Hydrocast Hydrocast Hydrocast Net tow
l i -aooth ly Bi-aonthly l i -aoathly Bi-aoathly &.. tinuoua Bi-aoothly Bi-monthly .vi-acnthly • i -aoatnly Every 4 aonths Bi-aonthly Bi-aoathly Every 4 aoaths Every 4 aontha Every 4 ajnths Yearly Yearly Bi-aoothly •very 4 aooths Bi-aonthly Every 4 aoaths Yearly Yearly Bi-aonthly
All hydrocaats 4 STD, 12 XBT all hydxocasta 2 STD One/30 ain 4 casta 2 tracea/cruise 2 casts 2 casta 2 casta 2 caats 2 casts 2 casts 2 caata 2 caata 2 caats 1 cast 2 shallow u t s 2 shallow casts 1 shallow cast 1 cast 1 cast 1 cast 6 tows
Table 3. OTEC number of visits/site (July 1977 January 1980).
Meaa ureaenta
Site/region Physical Chemical Biological
Mobile 8 Tampa S South Atlantic 3 Puerto Rico 6 Hawaii 6
5 5 3 3 6 6 6 6
studies ax« the l?gal compliance activities (Sands et al., 1979) and aoOel studies. Initial studies on toxicity co organisms of various OTEC operations are under way at the Gulf Coast Research Laboratory. The toxicities of eluainua (heat exchanger material), aaaonia (working fluid), and chlorine (biocide) are being investigated by bioassays of aullet (fish) and cope pods (zooplanktoa). Biotciaul*i.ion studies using " C uptake techniques investigating the potential for artificial upwelling effects due to redistribution of nutrients have been started in conjunction with nitrogen fixation studies. Studies of eatrainaent/iapingeaent, artificial upwelling effects due to redistribution of nutrients have been started in conjunction with nitrogen fixation studies. Entrainaent/iapingement, artificial reef, and chlorine studies are being dune through DOE's Office of Health jnd Environmental Research (OdER).
Assessment
Complementary to r'.e monitoring program are a series of studies to ascertain those effects of potential OTEC operations that are not site-dependent but are generic to OTEC. Also included !•• such
REFERENCE CITED
Sands, H. D., et al., 1979. Environmental assessment, Ocean Thermal Energy Conversion (OTEC) program preoperational test platform. Washington, D. C., U. S. Departcent of Energy, Division of Solar 'cchnologv, DOE/EA 0062.

2A0
COMPILATION OF MARINE GEOLOGIC AND OCEANOGRATHIC DATA OFF THE WEST COAST OF THE UNtTED STATES P. Wilde
A series of oceanographic compilation sheets for the area off the west coast of the United State* are being produced in cooperation with the 0.S. Geological Survey. The aii? of this study ia to provide a sheet of convenient alze that:
1. Sutaurize* the oceanogriphic data to date for a particular area.
2. Can be used as a base map for serine geologic investigations.
3. Can be a working chart during shipboard operations.
4. Can be easily revised as new information becomes available.
To date, five of the aix sheets, covering the area from the Canadian border (49°M) to the Mexican border (32°N) have been issued (Table 1). The format of the sheeta consist of a base batnymerric map at oceanographic plotting acale (approximately 1:750,000 at 45° latitude) with depth contoura at 100-m intervals (Figure 1). The base map ia aup-plemented with a series of aaall Maps where items of special interest are plotted, ihe content of the small maps varies somewhat with each sheet but topics have included geologic and geographic features, earthquake epicenters, bottom sampling stations, heat flow actions, magnetic contours, monthly surf*.'* current, ctonthly sea surface temperatures, gravitv-values, seismic stations including track lines with reflection profiling information, peasonal wave heights, and water mass data. Several typical reflection profiles »re shown for each sheet. Wh»re applicable, summary logs from deep-sea drilling aites are given.
For actual navigation, a table of available MOAA-flOS sailtag and general charra is shown. Finally, pertinent oceaaographic and particularly marine geologic references are listed. The mans, tab lea*, and diagram* n t useful aa indices to available data ia a mora detailed form. Each data source ia liated ao the reader/user cam contact the groups reasonable f~r the data for additional information.
REFERENCES
Chase, T. E., Hot-mark, W. K., j&d Wilde, P., 1975. Oceanographic data of t*** Monterey Deep Sea 7an. Dniveraity of California, San Diego, IHt Tech. Sept. Series Tt>58.
Wilde, r., lormark, U. A., »*d Chase, T. E., 19?b. Oceanographic data off Central "/.lifornia 37° to 40° north including the Delgada deep sea fan. Berkeley, Levrenee Berkeley Laboratory, Pub. 92.
Wilde, P., Chase, T. E., Kolmea, H. L., Wormsrk, W. I., and Thomas, J. A., 1977. Oceanographic data off Washington 46° to 49° north including the Hitinat deep aea fan. Berkeley, Lawrence Berkeley Laboratory, Pub. 223.
Wilde, P., Chase, T. E., Holmes, M. L., Normsrk, U. «., KcCullocb, D. S-, and Kulm, L. D., 1979. Oceanographic data off northern California-southern Oregon 40° to 43° rjrth including the Corda deep aea fan. Be' keley, Lawrence Berkeley Laboratory, Pub. 2-1.
Wilde, P., Chase, T. £., ttolmes, H. L,, Hormark, W. R., and othera, 1979. O:eanographic data off Oregon 43° to 46° norto including the **toria deep sea fan. Berkeley, Ltwren.ce Berkeley Laboratory, Pub. ;53.
Table 1. ChartB in the series.
Principal feature Publication Date of Issue
Nitinat Fan 40°-49°N Pub. 223 1977 Astoria Fan 43t,-46°N Pub. 253 1979 Gorda Fan 40°-4343°H Pub. 251 1978 Delgada Fan 37°-40°N Pub. 92 1976 Monterey Fan 24°-37°N IHR Tech. Rept. 56 1975 Southern California Borderland 32°-35°N in preparation —

231
$S
u J

JSo

APPENDIXES
APPENDIX A: PUBLICATIONS
Alonso, H. E . , Doolnguex, B. A. , Llppmann, M. J . , Manon, A. M., Schroeder, R. C , and Witherspoon, P. A. , 1978. Recent a c t i v i t i e s at the Cerro P r i e t o f i e ld (Mexican-American Cooperative Program at t i t Cerro Prieto Geothermal F i e l d ) , LBL-^36, C?-02, December 1978.
Apps, J . A., 1978. The simulation of reaction* between basalt and groundwater. OCID-8066, October 1978.
Apps, J . A. . Doe, T . , Doty. B. , Doty, S . , Calbralth, R., Kearns, A., Xohrt* B. , Long. J . C , S*, Monroe. A. P . . Nsraslmhan, T. N . , rfelson, P, H. , Wilson, C. R., and Witherspoon, P. A. , 1979. Geohydrological studies ft* nuclear waste i so lat ion at the Hanford Reservation* Volume I , Executive Summary; Voluue I I , Final Report. LBL-B764, August 1979.
Benson, S. H., Goranson, C. B . , Haney, J . P . , and Schroeder, R. C. , 1979. The status of the resource evaluat ion at Susanvll le , California (presented a t the 1979 annual oeet lng, Geothermal Resourcea Council , Reno, Nevada, September 24-27, 1979). LBL-9469, July 1979.
Ber l in , B. , 1979. S t a t i s t i c a l analysis of the cor re la t ion of earthquakes with radon concentration in water from shallow v e i l s near Orov l l l e , Ca l i forn ia . LBL-10139, April 1979.
Burleigh, R. H. , Bi imj l l , E. P . , DuBols, A. 0 . , Norgren, D. U. , and O r t i z , A. R., 1979. E l ec t r i ca l hea ters for therao-mechanlcal teats at the Str lpa Mine (Swedish-American Cooperative Program on Radioactive Waste Storage in Mined Caverns In Crys ta l l ine Rock). LBL-7063, SAC-13, January 1979.
Chan, T . , 1976. Modeling of heater experiments re la ted to radioact ive waste storage (presented a t the Geological Society of America Penrose Conference, V a i l , Colorado, November 13-17, 1978). LBL-8447 (ABS), November 1978.
Chan, T . , and Cook, N. G. W., 1979. Calculated thermally Induced displacements and s t r e s s e s for heater experiments at S t r i p a , Sweden, l i n e a r the rnoe las t l c models using constant mater ia l p roper t i e s (Swedish-American Cooperative Program on Radioactive Waste Storage in Mined Caverns in Crys t a l l i ne Rock!, LBL-7061, SAC-22, December 1979.
Chan, T . , and Remer, J . S . , 1978a. Preliminary thermal and thermomechanical modeling for the near surface t e s t f a c i l i t y heater experiments at Hanford. LBL-7069, December 1978. ,1978b. Semi-analytic thermal ca lcula t ions for arrays of nuclear waste can i s t e r s buried in rock (presented a t the Americal Geophysical Union 1978 f a l l meeting, San Francisco, December 4 - 8 , 1978). LBL-8433 (ABS), November 1978.
Clarke, J . , Gamble, T. D . , Goldstein, N- E . , Goubau, W. M-, Koch, R. , and Miracky, R. 7 . , 1979. Field analysis of magnetotel luric
data (presented at the 49th International Meeting, Society of Exploration Ceophysiclsts , Ktv Orleans, Louisiana, November 4 - 8 , 1979). LH.-926S (ASS), May 1979.
Cl i f f , W. C , Apley, V. J . , and Greer, J . M., 1979. Evaluation of potent ia l meocberaal well-he id flow sampling and calorimeter methods ( E a t t e l l e Pacif ic Northwest t ab , subcontractor 1. LmL-9248 , GUMP-7, June 1979.
Commlns, H. L.» and Horne, A. J . , 1979. Zooplanktoo from OTEC s i t e s In the Gulf of Mexico and the Caribbean (presented at the 6th Annual Ocean thermal Energy Conversion Conference* Washington, D. C», June 19-22, 1979). ML-9G53, June 1979.
Cook, N. G. V. , 1979. Field measurement techniques —status sod needs (presented s t the Workshop on the Theraochealcal Modeling for a Hard rock Waste Keposltory, sponsored by OHWI end Lawrence Llvemore Laboratory, Berkeley, California, June 25-27, 1979). LBL-9425, June 1979.
Cook, N. C. V. , Gale, J . E . , and Wltherapoon, P. A. , 1979. Wsste disposal In granite—preliminary resul ts from Str ips , Sweden (presented at the 19th Annual ASHE Symposium, Geological Disposal of Nuclear Waste, Albuquerque, New Mexico, March 15-16, 1979). LBL-9424, March 1979.
Cook, N.G.W., and Hood, H., 1978. Full-scale and time-scale heating experiments at Stripa, prelim'nary results (Swedish-American Cooperative Program on Radioactive Waste Storage In Mined Caverns in Crystall ine Rock). LBL-7072. SAC-11, December 1978.
Cook, N. G. W., and Wltherapoon, P . A., 1978. Mechanical and thermal design considerat ions for radioact ive .aste r epos i to r i e s In hard rock: Part I - An apprvtsal of har* rock for po ten t i a l underground r epos i to r i e s of radioac t ive wastes; Fart I I - I n - s l t u heat ing experiments In hard rock, t h e i r object ives and design (Swedish-American Cooperative Program on Radioacti"^ Waste Storage in Mined Caverns in Crys t a l l i ne Rock). LBL-7073, SAC-IO. October 1978.
DuBois, A. 0 . , Binnal l , E. P . , Chan, T. , McEvoy, M. B. , Nelson, P . H . , and Rener, J . S. , 1979. Heater t e s t planning for the near surface t e s t f a c i l i t y a t the Hanford Reservation. LBL-8730, March 1979.
Earth Sciences Divis ion, 1978a. Proceedings of the F i r s t Symposium on the Cerro p r i e t o Geothermal f i e l d , Baja Ca l i fo rn ia , Mexico, San Diego, Cal i forn ia , September 20-22, 1978. LBL-7098, Septeeber 1978. , l?78b. Earth Sciences Division annual report 197£ . LBL-8648. , 1978c. Geothermal explorat ion technology, annual report 1978. LBL-8603. ,1978d. Proceedings of the Second I n v i t a t i o n a l Well-Testing Symposium, Berkeley, Ca l i fo rn ia , October 25-27, 1978. LBL-8883. , 1978e. Ceosclencee Program annual r e p o r t , 1978. LBL-10349.
233

234
, 1978f. Aquifer Thermal Energy S t o n e * Newsletter (ATES). PUB-272, v . 1, no. 1 , October 1978. , 1979a. Earth Science* Division Newsletter. PUB-283, v. 2 , no. 1 (January 1979), v . 2 , no. 2 (September 1979). , 1979b. News from Ceothetmal Reservoir Engineering Management Program (GREHP). PUB-285, v. I I , no. 1 (February 1 , 1979), v . I I , no. 2 (May 1, 1979), v . I I , no. 3 (August 31, 1979). , 1979c. Newa from Geothemal Subsidence Research Management Program (GSRMP). ^DB-286, v. I , no. 1 (February 1, 1979), v . I , no. 2 , (June 1 , 1979). , 1979d. Aquifer Thermal Energy Storage Newsletter (ATES). POB-294, v. I , no. 2 (January 1979), v. I , no. 3 (May 1979), v . I , no. 4 (September 1979). , 1979e. News of Geothermal Energy Conversion Technology (GECT). PUB-308, T . I , no. . (July 1979), v. I , no. 2 (December 1979).
Fr i tz , P . , Barker, J. F . , and Gale, J . E . , 1979* Geochemistry and Isotope hydrology of groundwaters In the Strips granite , resu l t s and preliminary interpretation 1Swedish-American Cooperative Program on Radioactive Waste Storage in Mined Caverns in Crystalline Rock). LBL-8285, SAC 12, April .'.979.
Fulton, R. L . , 1979. Geothermal energy for industrial application (presented at the Association of Energy Engineers Conference, San Francisco, March 21-23, 1979). LBL-891S, March 1979.
Gale, J . E- , and Witherspoon, P. A. , 1979. m approach to the fracture hydrology at Str ips , preliminary resu l t s (Swedish-American Cooperative Program on Radioactive Haste Storage In Mined Caverns in Crystalline Bock). LBL-7079, SAC-15, May 1979.
Goldstein, N. E . , 1979. Geothermal energy development from the Salton Trough to the High Cascades (presented at the Third Nationsl Conference and Exhibition on Technology for Energy Conservation, Tucson, Arizona, January 23-25, 1979). L3L-8703, ijnuary 1979.
Goranson, C. B., and Schroeder, R. C., S i te speci f ic geothermal reservoir engineering a c t i v i t i e s at Lawrence Berkeley Laboratory (presented at the 1979 annual meeting, Geothermal Resources Council, F.eno, Nevada, September 24-27, 1979). LBL-9463, July 1979.
Goranson, C. B., Schroeder, R. C., and Haney, J . P . , 1979. Evaluation of Coso geothermal exploratory hole No. 1 (CGEH-1), Coso Hot Springs, known geothermal resource area, China Lake, California (presented at the Fourth Annual Workshop on Geothermal Reservoir Engineering, Stanford University, Palo Alto, California, December 13-15, 1978). LBX-8675, January 1979.
Goyal, K. P . , and Kassoy, D. R., 1978. Heat and mass transfer studies of the East Mesa anomaly (presented at the Fourth Workshop on Geothermal Reservoir Engineering, Stanford University, December 1978). LBL-9330, December 1978. , 1979a. Fault *one controlled charging of a liquid dominated geothermal reservoir (submitted to the Journal of Geophysical Research). LBL-9327, July 1979.
, 1979b. Beat end mass transfer 1m * saturated porovs wedge with imps ma able bonnmariee (submitted t o the Imtermatlomal Journal of Beat aod Haas Transfer). LBL-9328, J « « 1979. • 1979c. Fault some controlled charging of so anulfcr (presented at the l t t h ASW-AIOffi Katlonal Rent Transfer Conference, San Dingo, August 5 -8 , 1979). ML-09329 (AW), December 1979.
Grannell, ft. • . , Taxman, D. W., Aronstan, P . , Clover, ft. C.» Lef j tv lc , ft. M., Eppink, J . , and Kroll , ft., 1979. Precision gravity measurements In the Cerru Prleto neothemal are* (presented a t the Second Symposium on the Cerro Prleto Ceotbermal F ie ld , Mexicali, l lexlco, October 17-19, 1979). LM.-9551 (ASS), July 1*79-
Haney, J . P . , Coranson, C. I . , Solbau, ft., and Schroeder, ft. C. , 1979. A review of LBL geothemel wel l t e s t ing equipment (presented at the 1979 annual Mat ing , Ccothemal Resources Council, Reno, Hcvnda, September 24-27, 1979). UL-9462, July 1979.
Hood, M., 1979. Experimental results frcn Strips (presented at the Workshop on Themomechanlcal Modeling for a Bard Rock Waste Repository, Berkeley, June 25-27, 1979). LBL-9426, June 1979.
Howsrd, J . H. , Apps, J . A. , Benson, S. H., Goldstein, N. E . , Graf, A. N . , Hsney, J . P . , Jackson, D. D . , Juprssert, S . , Kajer, E. L . , McEdwards, D. G., HcEvllly, T. V. , Haraslnhan, T. N. , Schechtcr, B., Schroeder, R. C., Taylor, R. U., Van de Tamp, F. C , and Wolery, T. J . , 1976. Geothermal resources and reservoir Investigations of U. S. Bureau of Reclamation leaseholds at East Hesa, lope r ia l Valley, California. LBX-7094, October 1978.
Howard, J . H. , and Davey, J . V. , 1979. Geothemal resources and the U. S. pulp and paper Industry (submitted to Paper Trade Journal). LBL-8735.
Howard, J . H. , and Schwarz, W. J . , 1979. Status of geothermal reservoir engineering research projects supported by V. S. Department of Energy Division of Geotheimel Energy (presented at the 1979 annual meeting, Geothermal Resource Council, Reno, Hevada, September 24-27, 1979). LBL-9326, July 1979.
Javandsl, I . , and Witherspoon, P. A., 1979a. A study of partial penetration in a two-layered aquifer: I , Analytical so lut ion. LBL-9479, May 1979. , 1979b. A semi-analytical solution for partial penetration In two-layer aquifers (submitted to Water Resources Research). LBL-9427, June 1979.
Jeffry, J . A., Chin, T- , Cook, N. G. W., and Witherspoon, P. A., 1978. A least squares method for determining in s i tu thermal properties from temperatures caused by a f i n i t e length heater (presented at the American Geophysical Union 1978 Fall Meeting, San Francisco, December 4-8, 1978). LBL-8423 (ABS), November 1978. , 1979. Determination of in s i tu thermal properties of Stripa granite from temperature measurements In the fu l l - s ca l e heater experiments, method and preliminary results (Swedish-American Cooperative Program on

235
Radioactive Waste Storage in Mimed Caverns 1B Crys ta l l ine Rock). LBL-8423, SAC-24, May 1979.
Johnson, P. W., and Home, A. J . , 1979. Phytoplankton and bioaasa d i s t r i b u t i o n a t poten t i a l OTEC s i t e s , (presented at the 6th Annual Ocean Thermal Energy Conversion Conference* Washington, D. C , June 19-22, 1979). LBL'9054, June 1979.
Kassoy, D. R., «o4 Coyal, K. P . , 1979. Modeling heat and mass transfer at the Mesa gecthemal anomaly, Imperial Valley, California [Univert i t y of Colorado, subcontractor). LBL-87B4, GREHP-3, February 1979.
Lasers , M. D. , 1979. Measurement requirements and methods for geothensal reservoir aystssi parane te rs , an appraisal {Measurement Analysis Corp., subcont rac tor ) . LBL-9090, CREHP-6, August 1979*
Llppmann, M. J . , and Tssng, C. F . , 1979. Three-dimensional numerical simulation of s ing le -phase, non-isothermal , f lu id flow in porous reservoi rs (submitted for the seet ing of the Society of petroleum Engineers of AIHE, Denver, Colorado) . , LBL-7056 (ABS), January/Febr—ry 1979.
Mangold, D. C., Tseng, C. F . , Llppmarai, H. J . , and Witherspoon, P> A., 1979. A study of thermal ef fec ts In well tes t analysis (presented at the 54th Annual Fa l l Technical Conference and Exhibi t ion of the Society of Petroleua Engineers of AIME, Las Vegas, Nevada, September 23-26, 1979). LBL-9769, September 1979,
Marconcini, R. , Ne r i , G. , P ruess , K., R u f f l l l l , C . , Schroeder, R. C , and Witherapoon, P. A., 1979. Simulation of the deplet ion of two-phase geothermal rese rvo i r s (presented a t the 54th Annual Technical Conference and Exhibi t ion, Society of Petroleum Engineers of AIME, Las Vegas, Nevada, September 23-26, 1979). LBL-9310 (ABS), June 1979.
McEdwards, D. G., 1979. Hultiwell var iab le r a t e well t e s t analys is (presented a t the 54th Annual Fal l Technical Conference and Exhibition of the Society of Petroleua Engineers of AIME, Las Vegas, Nevada, September 23-26, 1979). LBL-9460, SPF-B392, September 1979.
McEdwards, D. G., and Benson, S• M., 1978. Inject ion t e s t r e s u l t s from >»ells 5 1 and 18 28 East Mesa known geothernal resource area (presented a t the Second I n v i t a t i o n a l Well Testing Symposium, Berkeley, October 24-27, 1978). LBL-8362 (ABS), October 1978.
McEvoy., M. B. , 1979. Data acqu i s i t ion , handling, and display for the heater experiae..;s a t Str ipa (Swedish-American Cooperative Program on Radioactive Waste Storage in Mined Caverns in Crys ta l l ine Rock). LBL-7062, SAC-14, February 1979.
Mi l l e r , C. W., 1979. Weilbore storage effects in geothermal -wells (presented a t the 5*»th annual Fa l l Technical Conference, Society of Petroleum Engineers of AIME, Las Vegss, Nevada, September 23-26, 1979). LBL-88M, July 1979.
Mi l l e r , C. W., and Haney, J . P . , 1978. Pressure t r ans ien t response of a fluid in a cap i l l a ry tube (presented a t the Second Inv i t a t i ona l Well Testing Symposium, Berkeley, October
24-27, 1978). UL-83C1 ( A K ) , Octotor 1978. Mil lar , C. V . t assl Zermra, J . H. , 1979. Do• mmula
praaamr* ranmgia meaMred v i t a a f ln id f i l l e d capi l lary take (prsseated a t the a—asl aaatlng of the Society of Fatrolaani Eaflaeers , Las Vegas, nevada, Septsmter 23-27 , 1979). Lsl-9303, October 1973.
Morrlsoa, H. F . , Coldstela, V. F - , Hovsrstem, M., Oppllger, C , ana Riveroe, C. A . , 1978. Description, f la id t a s t and data. analys is of a controlled-soarce EM system (Bf-mO)* 1JL-70M, October 1978.
Morrison, R. * . , Lee, E. H. , Oppllgcr, C . , and Day, A. , 1979. Mesne to t e l l uric s tudies In Grass Val ley, Nevada. UL-8646, January 1979*
Naraslmhan, T. H-, 1979. Groundwater modeling in subsurface nuclear vast* disposal—an overview (submitted t o Transactions of the American Huelear Soc ie ty) . LBL-8742, January 1979.
Naraelahan, T. N . , 1979. A note on volume averaging (submitted to Advanets In Water Kasourcas). LsL-8792, February 1979.
Naraslmhan, T. N . , and Falcn, W. A. , 1979. A purely numerical approach for analyzing flow to a well Intercepting a vert ica l fracture (presented a t the Society of Petroleua Engineers California Regional Meeting, Ventura, Cal i fo rn ia , Apri l 18-20, 1979). LKL-S8I6, March 1979.
Narasimhar* T. N . , and Witherapoon, P . A., 1978. Numerical model for saturated unsaturated flow I n defomable porous media. Water Resources Research, v . 14, no . 8 , p . 1017-1034, and LKL-7037, December 1978.
Naraslmhan, T. N . , and Kanehlro, B. Y . , 1979. A note on the meaning of storage coeff ic ient (submitted t o Water Resources Research). LBL-8295, January 1979.
Naraslmhan, T. N . , and Wltherspoon, P . A., 1979. Geothermal v e i l t e s t i n g (published in the Burke Maxey Volume of the Jcurnal of Hydrology, 1979). LBL-8290, January 1979.
Nelson, P . R . , Paulsson, B. N. P . , Rachlele , R. , Andersson, L . , Schrauf, T . , Hus t ru l ld , W., Duran, 0 . , and Hagmisson, K. A. , 1979. Preliminary report on geophysical and mechanical borehole measurements at S t r ipa (Swedish-American Cooperative Program on Radioactive Waste Storage In Minet' Caverns in Crys ta l l ine rock). LBL-8280, SAC-16. Ma> 1979.
Nelson, S. A., and Carnichael , I . S. E. , 1979. P a r t i a l molar volumes of oxide components in s i l i c a t e l iqu ids (submitted t o Contributions to Mineralogy and Pe t ro logy) . LBL-9210, Ju ly 1979.
Neretnieks, I . , 1979. Age dating of groundwater in f i ssured r^~ v —the Influence of water volume In micropores (submitted to Science) . LBL-9473, July 197?.
O'Brien, M. T. , Cohen, L. H. , Haraslahan, t - N. , Simkln, T. L . , Wollen>erg, H. A., Brace, W. F . , Green, S . , and P r a t t , H. P . , 1979. The very deep hole concept—evaluation of art a l t e r n a t i v e for nuclear waste d i sposa l . LBL-7089, Ju ly 1979.
Olkiewlcz, A. , Gale, J . E. , Thorpe, R. K., and Paulsson, B. N. P . , 1979. Geology and f rac ture system a t S t r ipa (Swedish-American

236
Cooperative Program on Radioactive Waate Storage In Mined Cavern* In Cryatell lne Rock). LBL-8907, SAC-21, February 1979.
O'Rourke, J . E . , and Raneoa, 1. 1 - , 1979. Instruments for aubaurface monitoring of geothermal subsidence [Woodward-Clyde Consultants, subcontractor]. LmL-0616, CSRMP-2, July 1979.
Payne, S. P . , 1979. The Marine mammal fauna of potential OTEC altca in the Gulf of Healco and Hawaii (presented at the 6th annual Thermal Energy Conversion Conference, Washington, D. C., June 19-22, 1979). LBL-9055, Hay 1979.
Plnder, »*. F. , 1979. State-of-the-art review of geothermal reservoir n o ^ i i n g [Colder Associates, subcontractorsI. LRL-9093, GSRMP-5, March 1979.
P i tzer , K. S . , 1979. Characterlstlca of vary concentrate aqueous solutions (preaented to the "-oel Symposium on Ctiealstry and Geochemistry of Solutions at High Temperature and Pressure, Bofora, Karlsh«"gs, Sweden, September 16-21, 1979, and published by the Royal SwedlBh Academy of Sciences) . LBL-°660, August 1979.
Pope, W. L. , Pines, H. S . , Fulton, R. L . , and Doyle, P. A. , 1978. Heat exchanger design: Why guess a design fouling factor when It can be optimised? (preaented at the Energy Technology Conference end Exhibition, Houston, Texas, November 5-9, 1978, and to appear in Bradley, W. B., ed . , Emerging Energy Technologies American Society of Mechanical Engineers). LBL-7067, June 1978.
Pri tchett , J. W., Rice, L. F. , and Carg, S. K., 1979. Sunmary of reservoir engineering data— Walrakei geolheraal f i e l d . Hew Zealand [Systems, Science, and Software, subcontractor]. LBL-8669, GREMP-2, January 1979.
Pruess, K., Bodvarsson, G. , Schroeder, S* C. , and Uitherspoon, P. A. , 1979. Simulation of the depletion of two-phase geothermal reservoirs (present .3 at the Society of Petroleum Engineers 54th Annual Technical Conference, Las Vegas, Nevada, Sept J.»er 23-:'6, 1979). LBL-9606, August 1979.
Pruess, K., Schroeder, R. C., and Zerzan, J . M., 1978. Studies of flow problems with the simulator SKAFT78 (presented at the Fourth Geotheraal Reservoir Lttsiueeriiig Workshop, Stanford University, December 13-15, 1978). LBL-8515, November 1978.
Pruess, K., tnd Schroede.-, R» C., 1979. Basic theory and eqy=";ions used in the two-phaBe multldimec^Z- iial geotheraal reservoir simulator, SHAFT79 (presented at the 1979 annual meeting, Geothermal Resource Council. Reno, Nevada, September 2***7, 1979). LBL-946A, July 1979.
Pruess, K.. Zerzan, J . >:., Schroeder, R. C., and Witherspoon, P. A. , 1979. Description of the three-dimensional two-phase simulator SHAFT78 foT use in geothernal reservoir studies (presented at the 1979 meeting, Society of Petroleum Engineers of AIHE, 5th Symposium on Reservoir Simulation, D«.r.ver, Colorado, February 1-2, 1979). LBL-8802, .'atuaxy 1979.
Qulnby-Hunt, M. S . , 1979. Comparison a? nutrient data from four potential OTEC s i t e s
(presented at the 6th annual Ocean Thermal Energy Conversion Conference, Washington, D. C , June 19-22, 1979). LM.-9052. June 1979.
Riveras, C. A., and Coldtteln, M. E . , 1979. Design and applif-etion of a mega-moment electromagnetic dlpole source (preaented at t t e 49th International Hcetlrg, Society of Exploration Ceopnyaldata, Wsv Orleans, Louisiana, Kovember 4 - 8 , 19?9). LE.-9273 (AJ6), Hay 1979.
Sands, H. D . , 1979. Pcogxammtlc environmental Impact assessment for operational OTEC platforms—A programs report (presantad at the HTS Oceana 1979 Conference, San Diego, September 1979). LH.-9183, Miy 1979.
S i lva , R. J . , Benson, L- V . , t e e , A. U. a and Parks, C. A., 1979- Vaate i so la t ion safety assessment program, teak *—collect ion and generation of transport data, theoretical and experimental evaluation of waate transport in selected rocks (annual progress report, October 1, 1978 - September 30, 19 9 ) . LRL- 99.5.
Sudol, C. .*., Harrison, R. F . , and Ramey, H. J . , J r . , 1979. Annotated research bibliography for geothermal reservoir engineering (Terra Tek, l a c , subcontractor 1. LBL-8664, CREHF-1, August 1979.
Stark, H., Goldstein, N. E . , Ubllenberg, H. A. , Strlsower, B. , Rcge, H. L . , and Wilt , H. J . , 1979. Ceothermal exploration asaeeement and interpretation, Klamath Basin, Oregon, Swan Lake and Klamath Hil ls area. LBL-8186, Hay 1979.
Thorpe, R. K., 1979. Characterization of discont inuit ies In the Strips granite time-scale beater experiment (Swedish-American Cooperative Program on Radioactive tfaste Storage in Mined Caverns In Crystalline Rock). LBL-7Q83, SAC-20, July 1979.
Tleimat, B. W., Laird, A. D. £ . , Hsu, I . C. W. and Rle, H., 1979. Baseline data on film coeff ic ient for heating laobutane inside a tube at 4.14 HPA (600 PS1A). (Presented at the joint ASME/AIHE 18th National Heat Transfer Conference, San Diego, August 6-8, 1979). LBL-9720, April 1979.
Tleimat, B. V., Laird, A. D. K., Rie, H., Hsu, I . C. tf., and Seban, R. A., 1979. Hydrocarbon heat transfer coeff ic ients— preliminary Jsobutane resu l t s . LBL- 8645, . jbruary 1979.
Tsang, C. F. , 1979- A review of f^rrent aquifer thermal energy storage probers (prriented at the ^International /*-«'_ibly on Energy Storage, Dubrovnik, Yugoslavia, May 27-June 1, 1979). LBL-9834, Hay 1979.
Tsang, C. F., Lippmann, H. J . , Schroeder, R. C. , Narasiohan, T. N. , Zerzan, J . M. , Pruess, K. , Bodvarsson, G-, and Mangold, D. C., 197B. Numerical modeling studies in well t e s t analysis (presented at the Second Invitational Well Testing Symposium, Berkeley, October 24-27, 1978). LBL-8363 (ABS), October 1978.
Tsang, Y. M., and Tsang. C. F . , 197P. An analytic study of geothermal reservoir pressure response to cold water reinject ion (presented at the Fourth Annual Workshop

237
on Geothermal Reservoir Engineering, Stanford U n i v e n i t y , December 13-15, 197B). LBL-9001, November 1978.
Van T i l , C. J . , 1979. Guidelines manual f o r surface monitoring of geothermal areas [Woodward-Clyde Consultants, aubcontractoil. LBL-8617, CSRMP-3, Kay ;79 .
Ve t t e r , 0 . J . , and Campbell, D. A. , 1979. Scale Inh ib i t ion In geothermal operations experiments with Dequest 2060 pbosponste In Republic 's East Hess f i e ld [Vetter research and Re ubi le Geothermal, I n c . , subcontractor!. L B L - 9 0 8 9 , GREMP-5, June 1979.
V ie t s , V. P . , Vaughan, C. K. , and Harding, R. C. , 1979. Environmental and economic e f f e c t s of subsidence (EDAW and ESA, subcontractor]. LBL-8615, CSRMP-1, May 1979.
Vonder Haar, S . , and Cor* l ine, D . , 1979. Flooding frequency and sedimentation unit correlation of t i d a l f l a t and coastal sal lna f a d e s aloog the upper Gulf of California, Hexlco, (presented a t the Geological Society of America Annual Conference, San Diego, November 7-9 , 1979). LHL-92CS (ABS), June 1979.
Vonder Haar, S . , and Howard, J . H. , 1978. Geology and geothermal resources o* the Salton Trough, California, i n relation to r i f t zone tec ton ics (presented a t the 1978 In te rna t iona l Syasposiua on the Rio Grande Rif t , Santa Fe, Nev Hexlco, October 8-17, 1978). LBL-9556, October 1978.
Vonder Haar, S . , and Puente Cruz 1 . , 1979. Transform fau l t ing related to geothermal energy in Baja Ca l i fo rn ia , Mexico, (presented a t the Geological Society of America Annual Conference, San Diego, November 5-8, 1979). LBL-9272 (ABS), June 1979.
Vonder Haar, S . , and Puente Cruz, I . , 1979. Fault i n t e r sec t ions and hybrid transform f a u l t s in the southern Salton Trough geothoraal area, Baja Cal i forn ia , Mexico. (Presented a t the annual meeting, Geothencal Resources Council , Reno, Nevada, September 24-27, 1979). LBL-9458, July 1979.
Vonder Haar, S . , Noble, J . E . , and Puente Cruz, I . , 1979. Ver t i ca l movement along the Cerro Pr ie to transform f a u l t , Baja Ca l i fo rn ia , Mexico—A mechanism for geothermal energy renewal. LBu-6905, March 1979.
Weres, 0 . , Yee, A. W., ai« Tsao, L . , 1979. The mechanisms of amorphous s i l i c a p rec ip i t a t i on from geothenaal br ines (presented a t the Geothermal Scaling and Corrosion Symposium at the American Chemical Society National Meeting, Honolulu, Hawaii, April 1-6, 1979). LBL-8326 (ABS), October 1978.
Wilde, P . , 1979. Environmental monitoring and assessment program a t po ten t i a l OTEC s i t e s (presented a t the 6th annual Ocean Thermal Energy Conversion Conference, Washington, D. C., June 19-22, 1979). LBL-9051, June 1979.
Vllde, P., Cham*, T. E>, Holmes, H. L-, Koraark, If. a . , Thomas, J. A.» hcCulloch, 0. S. , and Kmla, 1 . D., 1978. Oceanographle data off northern California/southern Oregon, 40 decrees to 43 degrees north Including the Coram Deep Sea Fan. PTO-251, Hap, let ed.. ft*****' l»7*.
Vl lde, P . , Cb*ae l T. C . , Holme*, M. L . , Normark, U. 1 . , Thomas, J . A. , HcCulloch, D. S . , Carlson, P. I . , Kulm, L. D- , and Toung, J- D . , 1979. Oceanographlc data off Oregon 43 degrees to 46 degrees north Including the Astoria Deep Sea Fan. PUa-153, Map, 1s t e d . , Ju ly 1979.
Vl lde, P . , Sandusky, J . , and Jassb*, A. , 1978. Assessment and control of OTEC ecological Impacts (presented at the D. S. DOE Environmental Control Symposium. Washington 0 . C , tfoveaber 28-30, 1978). UL-8967, December 1978.
Wilt, H. J . , and Goldstein, N. E . . 1979. Res i s t iv i ty monitoring at Cairo Prlcto (presented at the Second Symnoslia on the Cerro Prieto Geothermal F i e l d , Nexlcsl*, hexlco, October 17-19, 1979). LHL-9549 (AJS), July 1979.
Wilt , M. J . , Coldsteln, N. E. , Hoversten, H. , and Har r i son , H. F . , 1979. Contro l led-source EM experiment a t Ht Hood, Oregon (presented a t the Cco tbena l Resources Council annual Met ing , Reno, Nevada, September 24-27, 1979). LBL-9399, July 1979.
Uitherspoon, P . A . , Amick, C. H-, Gale, J . E . , and Iwai, K., 1979. Obse a t ions of a po t en t i a l s i z e - e f f e c t In eAperlnental determination of the hydraulic p roper t i e s of f rac tu res (Svcdlsh-Anerlcan Cooperative Prograa on Radioactive Uaste s torage in Mined Caverns 1c Crys t a l l i ne Pock). LBL-8571 SAC-17, Uy 1979.
Withsrspooa, p . A. , O l e , J . E- , and Cook, R. G. W-, 1979. Inves t iga t ions in g ran i t e a t S t r l p a , Sweden, for nuclear waste storage (presented at the 25th annual n e e t i c g , Aserican Nuclear Society Special Session on Geological Reposi tor ies for Nuclear Wastes, At l an ta , Georgia, June 3 -3 , 1979). LEL-9400, June !979.
Uitherspoon, P. A., Gale, J . E. , and Cook, N. G. W., 1979. inves t iga t ions in g ran i t e a t S t r l p a , Sweden, for nuclear waste storage (presented a t the 1979 annual meeting of the Aser: j n Nuclear Society , At l an ta , Georgia, June 3-9, 1979). LHL-880I. January 1979.
Witherspoon, P. A., Nelson, P. fi. , Doe, T. , Thorpe, R. K., Paulsson, B. N. P . , Gale, J . E. . and For s t e r , C. , 1979. Rock =ass cha rac t e r i za t ion for s torage of nuclear uas te in g ran i t e (Swedish—Acerlcan Cooperative Prograa on Radioactive Waste Storage in Mined Caverns *n Crys ta l l ine Rock.)- LBL-8570, SAC-18, February 1979.
Wollenberg, H. A., Bowen, R. E . , 3ow=aa, H. R., and Str isower, B. , 1979. Geochepical s tud ies of rocks, water , and gases at Mt Hood, Oregon. LBL-7092, February 1979.

238
APPENDIX B: EARTH SCIENCES DIVISiON STAFF
PAUL A. WITHERSP001T
Associate Direct*/?, Lawrence Berkeley Laboratory Division Head, Earth Scicncea Division
DIVISIOK ADMIHISTRATIOH
Kenneth f. Mirk, Deputy Division Head Karl Olson, Assistant Division Head Monique Adam, Division Office Administration
STAFF OF FISCAL YEAR 1979
Jack Angevine John Apps Lois ArseCta M .lammed Ayatollahi
Lawrence Beaulaurier Larry Benson Sally Benson Eugene Binnall Gudnundur Bodvarsson Mary Bodvarston Milford Bookman Harry bowman Daniel Bradley Wendy Brubaker Annette Bunge Thomas Buschet.;. Timofby Buscheck Patricia Butler
Hans Carlsson Ian Carmichael* Coen Carmiggelt Ghalon Carnahan Joseph Chan Tin Chan Mitchell Che Eric Cheney Jerry Chin Clement Chou Jeri Chu John Clarke* Marcie Contains Lewis Cohen* Neville Cook* Donald Corrigan Alain Curneir
James Dave^ Robert Davis E. F. De Zabale Thomas Doe Cathy Donnelly Christine Doughty Fadraic Doyle Allan Dubin Andrew DuBois Peter Duncan
Houshana Ebrahimi Laurel Egenberger
Paul Eliaa Janice Elliot Eugene Eno Daniel Estrella James Evans
James Ferguson Steve Flexser Conny Friscb Hauro Foglia Philip font Ted Fujita Robert Fulton
Robert Galhraith Thomas Gamble Anoushiravan Ghaffari Susan Gillctt Beverly Gimeno Orah Goldmen Norman Goldstein Colin Goranson Wolfgang Coubau ICeahav Goyal Alexander Graf Joyce Graves Thomas Green Roy Greenwald
Joseph Haney Leif Hansen Makoto Harada Rosemary Hart Niamh Harty Ramsey Baught Kunio Higashi Deborah Hopkins Alex Home John Howard Michael Hood* Richard Hsu
Eduardo Iglesias Jeffrey Irvine
Dennis Jamison Alan Jassby Abdul Rahim Jaouni Julie Jeffrey Anthony Jones Keith Jones
Randall Jones Sirisak Jnpraaert
Irian Knmhiro Alien Rearms William Kayea Tjiep Kho Stanley Kleiner Steven Kramer •rent Kohrt Pavel Kurfuret
Cbcng-Hsien tat Raymond Lee Wayne Lee David %euag. Donald Lippert Marcelo Lipmnann •icholaa Li t t les tooe Jane Long Steve Lundgren
Ernest Ksjer Donald Mangold Donald McCarthy Susan HcCornicfc Donald HcEdwarda Thomas He Evi l ly* Maurice KcEvoy Ellen McKecn Janet McQuillan Haynard Michel Constance Mil ler Susan Mil ler Jamea Mitchell Sofia Mitine Milton Hoebus Alison Monroe Leuren Moret S . Frank Morrison* Susumti Karaoke
T. H. Harasimhan John Neil Ph i l i p Helson Helen Nicholas John Koble Duane Horgren Yvonne Norpchen
Maura O'Brien
Faculty member, Universi ty of Ca i f o r a i a .

239
John OldROD Irngard Orzech
Walter Palen George Park* Pjotn Paulsson Susan Payne Chrigcopher Peiper Scott Peterson Ronald Philips Thoajf. Pigford* Howard Pine* Kenneth Pitzer* William Pope Karsten Pruess
Richard Rachiele Clayton Radke* William Ralph Pascal Rapier Ruthie Redic Janet Reaer Carlos Riveros Msrc Rivers Morris Rosch Gene Rochlin Pasiela Rogers Donald Rondeau jMiei Roth
Eliezer Cabin Thereaa Rniz Jacqueline lu—iells
Janes Sandusky Marie Schaner Bruce Scbechtcr Peter Scbein David Schmidt Dee Schmidt Ronald sehroeder Werner Scnwars Robert Silva Leoard Silvester Terranue Siskin Ray Solbau Wilbur Souerton* Hwaili Soo Barbara Srulovits Mitchell Stark Andrew Stromdafcl Rebecca SterbentA Robert Stolznan Beverly Strisotrez Ho-Jeen Su
Lisa Teague Jerome Thomas Richard Thorpe
Marc Trujillo Chin Fu Tseng Leon Tsao Bedavi Tleimat Richard Vallentine William fillet Jen Edgar-Togt Stephen Tender Hear
David Watkins Cheri Walker Oliver Warn Joseph Hang Cliriatopber Weaver Virginia Weaver Oleh Veres Jerry West Richard Ubitenan Pat Hilda Charles Wilson Michael Wilt Harold Wollenberg, Jr . Lester Wong Williasj Wong
Andrew Tee
John Zerzen
Faculty member, Universicy oi Ca l i forn ia .