earth science - elementary, intermediate tests and … · 2010-01-06 · 8 which map symbol is used...
TRANSCRIPT

The University of the State of New York
REGENTS HIGH SCHOOL EXAMINATION
EARTH SCIENCE
PROGRAM MODIFICATION EDITION
Thursday, June 15, 2000 — 9:15 a.m. to 12:15 p.m., only
The answer paper is stapled in the center of this examination booklet. Open the examination booklet,carefully remove the answer paper, and close the examination booklet. Then fill in the heading of youranswer paper.
All of your answers are to be recorded on the separate answer paper. For each question in Part I andPart II, decide which of the choices given is the best answer. Then on the answer paper, in the row of num-bers for that question, circle with pencil the number of the choice that you have selected. The sample belowis an example of the first step in recording your answers.
If you wish to change an answer, erase your first penciled circle and then circle with pencil the num-ber of the answer you want. After you have completed all three parts of the examination and you have decided that all of the circled answers represent your best judgment, signal a proctor and turn in all exam-ination material except your answer paper. Then and only then, place an X in ink in each penciled circle.Be sure to mark only one answer with an X in ink for each question. No credit will be given for any questionwith two or more X’s marked. The sample below indicates how your final choice should be marked with anX in ink.
For questions in Part III, record your answers in accordance with the directions given in the exami-nation booklet.
The Earth Science Reference Tables, which you may need to answer some questions in this examina-tion, are supplied separately. Be certain you have a copy of the 1994 edition of these reference tables beforeyou begin the examination.
When you have completed the examination, you must sign the statement printed at the end of theanswer paper, indicating that you had no unlawful knowledge of the questions or answers prior to theexamination and that you have neither given nor received assistance in answering any of the questions dur-ing the examination. Your answer paper cannot be accepted if you fail to sign this declaration.
DO NOT OPEN THIS EXAMINATION BOOKLET UNTIL THE SIGNAL IS GIVEN.
SAMPLE: 1 2 3 4
SAMPLE: 1 2 3 4

Pro. Mod. E. Sci.–June ’00 [2]
Part I
Answer all 40 questions in this part.
Directions (1–40): For each statement or question, select the word or expression that, of those given, bestcompletes the statement or answers the question. Record your answer on the separate answer paper in accor-dance with the directions on the front page of this booklet. Some questions may require the use of the EarthScience Reference Tables. [40]
1 Measurements of gravity are greater at the polesthan at the Equator. This evidence best supportsthe inference that Earth has a1 perfectly spherical shape2 slightly oblate shape3 very elliptical orbit4 slightly elliptical orbit
2 A contour map is shown below. Elevations areshown in feet.
Which side of Amethyst Hill has the steepestslope?1 north 3 east2 south 4 west
3 The diagram below represents a rock samplecontaining fossilized Coelophysis footprints.The sample was found in New York State.
According to current knowledge of New YorkState fossils, during which geologic time periodwere these footprints most probably made?1 Cambrian 3 Tertiary2 Devonian 4 Triassic
4 The diagram below represents a side view of theMilky Way Galaxy.
At approximately which position is Earth’s solarsystem located?(1) A (3) C(2) B (4) D

Pro. Mod. E. Sci.–June ’00 [3] [OVER]
6 What is the direct cause of most earthquakes?1 movement of bedrock along a fault line2 gravitational pull on bedrock by the Moon3 deposition of sediment in lakes and oceans4 heat exchange between the crust and the
atmosphere
7 Adding automobile exhaust gases to the atmo-sphere has had the greatest impact on landscapedevelopment by1 changing the position of crustal plates2 changing Earth’s prevailing wind patterns 3 increasing the rate of chemical weathering4 increasing the amount of ozone in ground
water
8 Which map symbol is used in the Earth ScienceReference Tables to represent an organicallyformed sedimentary rock composed mostly ofcarbon?
5 The geologic cross section below shows variations of mineral composition that can be observed in thePalisades Sill in southeastern New York State. The Palisades Sill is an intrusive igneous rock called diabase.
Which other igneous rock is closest to diabase in mineral composition?1 andesite 3 rhyolite2 granite 4 gabbro
Pro. Mod. E. Sci.–June ’00 [4]
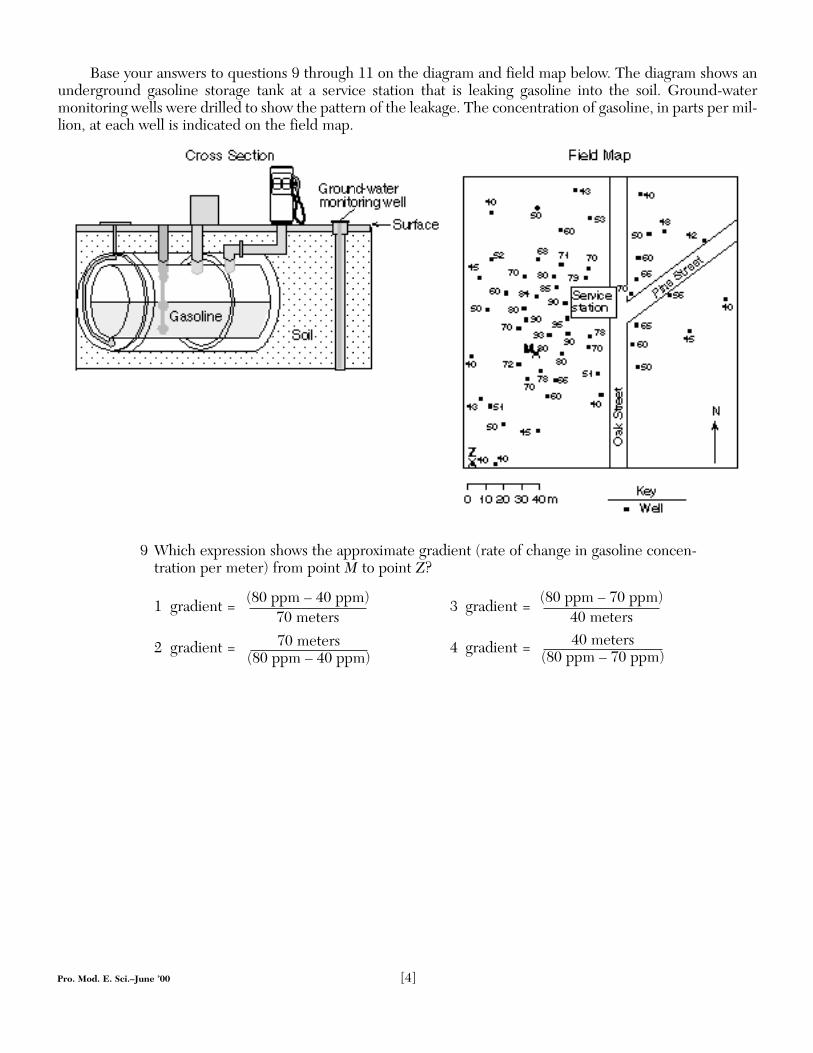
9 Which expression shows the approximate gradient (rate of change in gasoline concen-tration per meter) from point M to point Z?
1 gradient = 3 gradient =
2 gradient = 4 gradient =
Base your answers to questions 9 through 11 on the diagram and field map below. The diagram shows anunderground gasoline storage tank at a service station that is leaking gasoline into the soil. Ground-water monitoring wells were drilled to show the pattern of the leakage. The concentration of gasoline, in parts per mil-lion, at each well is indicated on the field map.
(80 ppm – 40 ppm)70 meters
(80 ppm – 70 ppm)40 meters
70 meters(80 ppm – 40 ppm)
40 meters(80 ppm – 70 ppm)

Pro. Mod. E. Sci.–June ’00 [5] [OVER]
10 Which isoline map best represents the pattern of gasoline concentration as measured in the wells?
11 Which statement best describes the pollution field’s size and concentration measurement if the gasolinecontinues to leak out of the tank?1 The size of the pollution field will decrease, and the concentration measurement will decrease.2 The size of the pollution field will decrease, and the concentration measurement will increase.3 The size of the pollution field will increase, and the concentration measurement will decrease.4 The size of the pollution field will increase, and the concentration measurement will increase.

13 Which diagram best shows the type of plateboundary found between the China Plate andthe Philippine Plate?
14 In a region that is being uplifted faster than it isbeing eroded, hills usually have1 steep slopes and slow-moving streams2 steep slopes and fast-moving streams3 gentle slopes and slow-moving streams4 gentle slopes and fast-moving streams
15 The four objects below are made of the samematerial and have the same mass. Which objectwill settle fastest in calm water?
Pro. Mod. E. Sci.–June ’00 [6]
12 Letters A through D shown on the map below are locations on Earth’s surface.
Which location is closest to a major zone of frequent earthquakes and volcanic activities?(1) A (3) C(2) B (4) D

17 The demonstration shown in the diagram belowindicates that powdered limestone reacts fasterthan a single large piece of limestone of equalmass when both are placed in acid.
The most likely reason powdered limestonereacts faster is that it has1 less total volume2 more chemical bonds3 more total surface area4 lower density
18 Which process could be indicated by the expres-sion below?
U238 Æ Pb206
1 crystallization of minerals in basalt2 chemical weathering of marble 3 radioactive decay in granite4 ozone depletion in the atmosphere
19 Which major mountain-building episode is mostrecent?1 Grenville orogeny 2 Taconian orogeny 3 Acadian orogeny4 Appalachian orogeny
Pro. Mod. E. Sci.–June ’00 [7] [OVER]
16 The diagram below shows two landscape regions with similar bedrock type and structure.
Which statement best explains why these two landscape regions are different inappearance?1 Landscape A formed in a dry region, and landscape B formed in a humid region.2 Landscape A formed in a dry region, and landscape B formed in a glaciated region.3 Landscape A formed in a humid region, and landscape B formed in a dry region.4 Landscape A formed in a humid region, and landscape B formed in a glaciated
region.
Pro. Mod. E. Sci.–June ’00 [8]
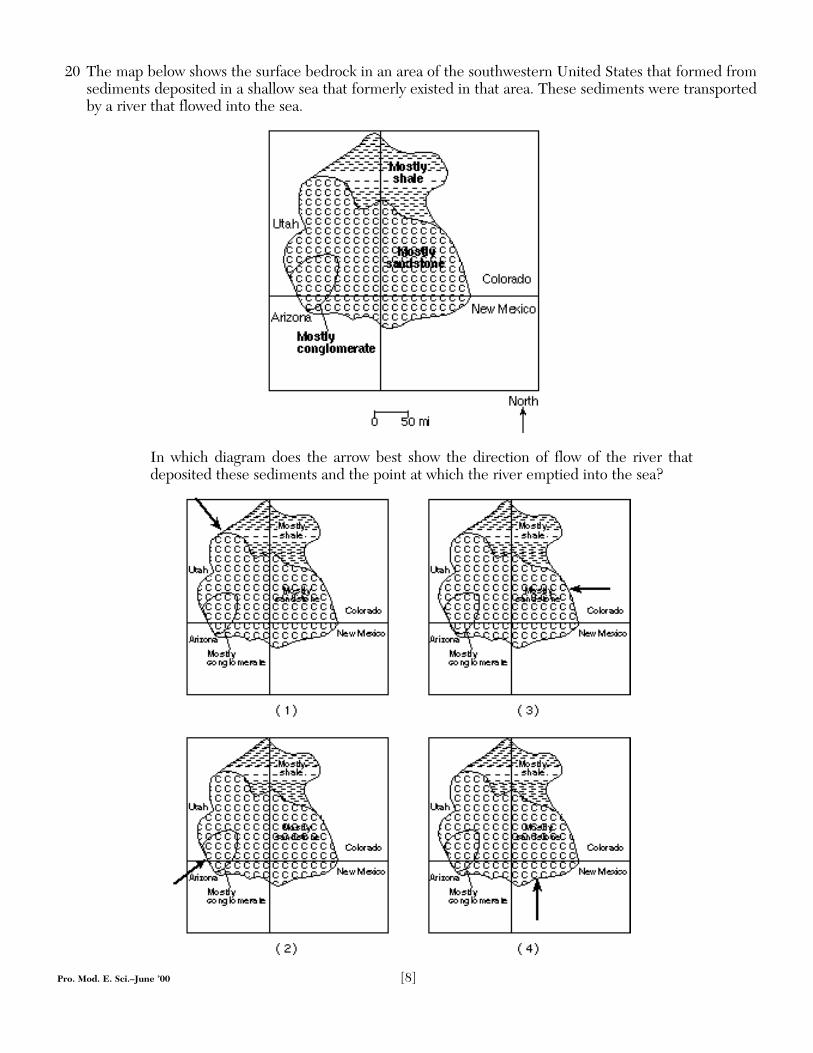
20 The map below shows the surface bedrock in an area of the southwestern United States that formed fromsediments deposited in a shallow sea that formerly existed in that area. These sediments were transportedby a river that flowed into the sea.
In which diagram does the arrow best show the direction of flow of the river thatdeposited these sediments and the point at which the river emptied into the sea?

Base your answers to questions 22 and 23 on thegraph below, which shows the average yearly tem-perature and average yearly precipitation for Earthlocations A through E.
22 The climate indicated at location E on the graphwould most likely be classified as1 cold and dry2 cold and humid3 warm and dry4 warm and humid
23 Which location has the climatic conditions nec-essary for the greatest amount of chemicalweathering to occur?(1) A (3) C(2) B (4) D
24 Which type of air mass would most likely havelow humidity and high air temperature?(1) cT (3) mT(2) cP (4) mP
25 In the diagram below, arrows represent airmovement near an ocean coastline on a summerafternoon.
Compared to the air over the ocean, the air overthe land has a1 lower temperature and lower barometric
pressure2 lower temperature and higher barometric
pressure3 higher temperature and lower barometric
pressure4 higher temperature and higher barometric
pressure
26 Which ocean current cools the climate of somelocations along the western coastline of NorthAmerica?1 Florida Current 3 Canaries Current2 California Current 4 Alaska Current
Pro. Mod. E. Sci.–June ’00 [9] [OVER]
21 The time line below represents the geologic history of Earth. Letters A, B, C, and D represent specifictimes in Earth’s history.
Which letter best indicates when trilobites became extinct?(1) A (3) C(2) B (4) D
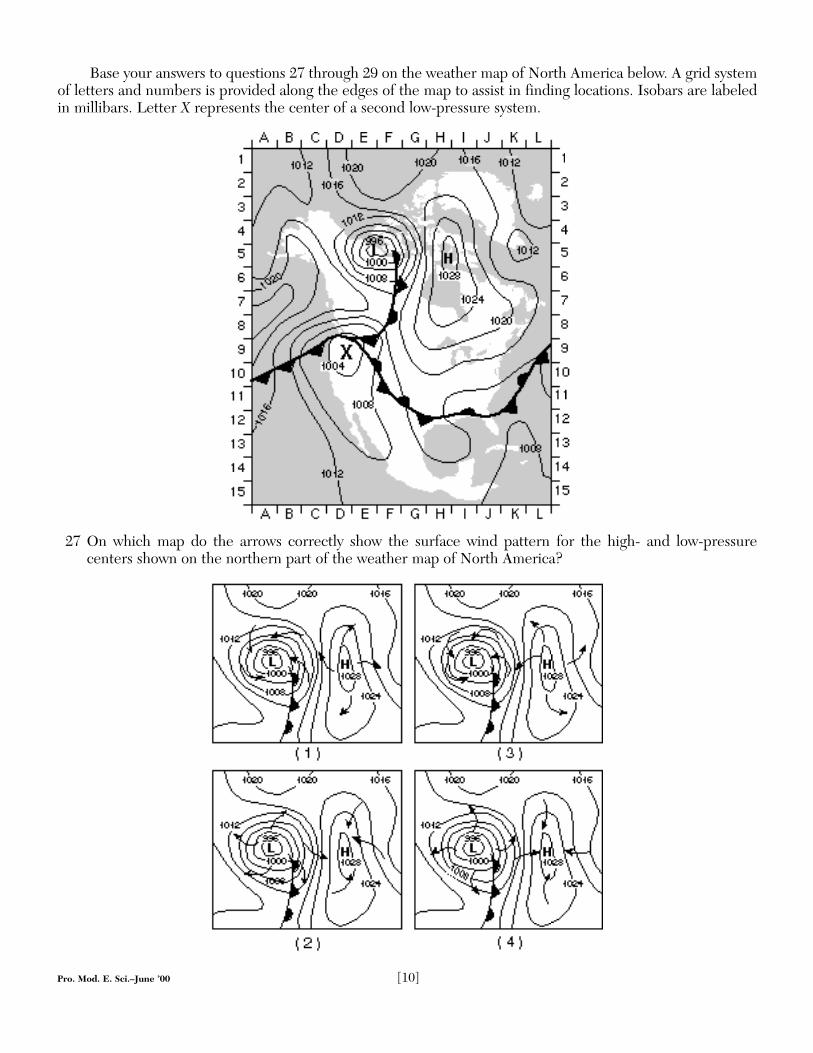
Base your answers to questions 27 through 29 on the weather map of North America below. A grid systemof letters and numbers is provided along the edges of the map to assist in finding locations. Isobars are labeledin millibars. Letter X represents the center of a second low-pressure system.
27 On which map do the arrows correctly show the surface wind pattern for the high- and low-pressure centers shown on the northern part of the weather map of North America?
Pro. Mod. E. Sci.–June ’00 [10]

Pro. Mod. E. Sci.–June ’00 [11] [OVER]
28 If the low-pressure center labeled X follows a typi-cal storm track from its present location, the low-pressure center will move generally toward the1 north 3 east2 south 4 west
29 Which type of front is shown at grid coordinatesA–10?1 occluded 3 cold2 stationary 4 warm
30 A student in New York State observed that thenoon Sun increased in altitude each day duringthe first part of a certain month and thendecreased in altitude each day later in themonth. During which month were these obser-vations made?1 February 3 September2 June 4 November
31 The data table below compares the percentageof sunlight reflected from various types of Earthsurfaces.
Surface Percent of Sunlight Reflected
Fresh snow 80–85
Old snow 50–60
Sand 20–30
Grass 20–25
Dry soil 15–25
Wet soil 10
Forest 5–10
Water (Sun at sunset) 50–80
Water (Sun overhead) 3–5
Thick cloud 70–80
Thin cloud 25–50
Which statement is best supported by the table?1 Light-colored surfaces reflect more sunlight
than dark-colored surfaces.2 Rough surfaces reflect more sunlight than
smooth surfaces.3 Soil surfaces reflect more sunlight than cloud
surfaces.4 Vegetative surfaces reflect more sunlight than
ice surfaces.
32 One reason Massena, New York, has a colder cli-mate than Binghamton, New York, is thatMassena1 absorbs more rays of incoming solar radiation2 is usually closer to the source of solar radia-
tion3 receives shorter wavelengths from the source
of solar radiation4 receives lower angle rays of incoming solar
radiation
33 The diagram below shows a model of the Moon’sorbit around Earth. Letters A, B, C, and D rep-resent four positions in the Moon’s orbit.
What is the approximate length of time theMoon takes to travel from position A to posi-tion C?(1) 1 day (3) 30 days(2) 15 days (4) 365 days

Pro. Mod. E. Sci.–June ’00 [12]
35 The graph below represents the average yearlyconcentration of carbon dioxide (CO2) in Earth’satmosphere from 1972 to 1993.
This change in CO2 concentration most likelycaused1 a decrease in the average wavelength of solar
radiation2 a decrease in the thickness of Earth’s atmo-
sphere3 an increase in the absorption of long-wave
heat radiation by Earth’s atmosphere4 an increase in the thickness of Earth’s glaciers
36 The diagram below shows a cross section of acold front.
The cloud formation and precipitation shown inthe cross section are caused by the1 rising of cold, moist air 2 sinking of cold, moist air 3 rising of warm, moist air 4 sinking of warm, moist air
34 The map below shows the average number of thunderstorms each year in the continental United States.
The average number of thunderstorms that occur each year in Albany, New York, isapproximately(1) 15 (3) 35(2) 25 (4) 45

Pro. Mod. E. Sci.–June ’00 [13] [OVER]
37 The diagram below shows the average yearly precipitation, in centimeters, at locations A through E acrossthe State of Washington. Arrows indicate the direction of prevailing winds.
Which statement best explains why location B and location E receive relatively lowaverage yearly precipitation?1 These locations are on the leeward side of mountain ranges.2 These locations are on the windward side of mountain ranges.3 These locations receive more insolation than the other locations.4 These locations receive less insolation than the other locations.
38 The diagram below shows a view of Earth as seen from space at a certain time of the year.
Compared to observers at 35° S latitude, observers at 35° N latitude are generallyexperiencing1 fewer hours of daylight and warmer temperatures2 fewer hours of daylight and cooler temperatures3 more hours of daylight and warmer temperatures4 more hours of daylight and cooler temperatures

39 Which photograph of star trails was taken by anobserver facing directly north in New YorkState?
40 The cartoon characters below are watching theSun set.
Toward which general direction are the charac-ters looking?1 north 3 east2 south 4 west
Pro. Mod. E. Sci.–June ’00 [14]
Pro. Mod. E. Sci.–June ’00 [15] [OVER]
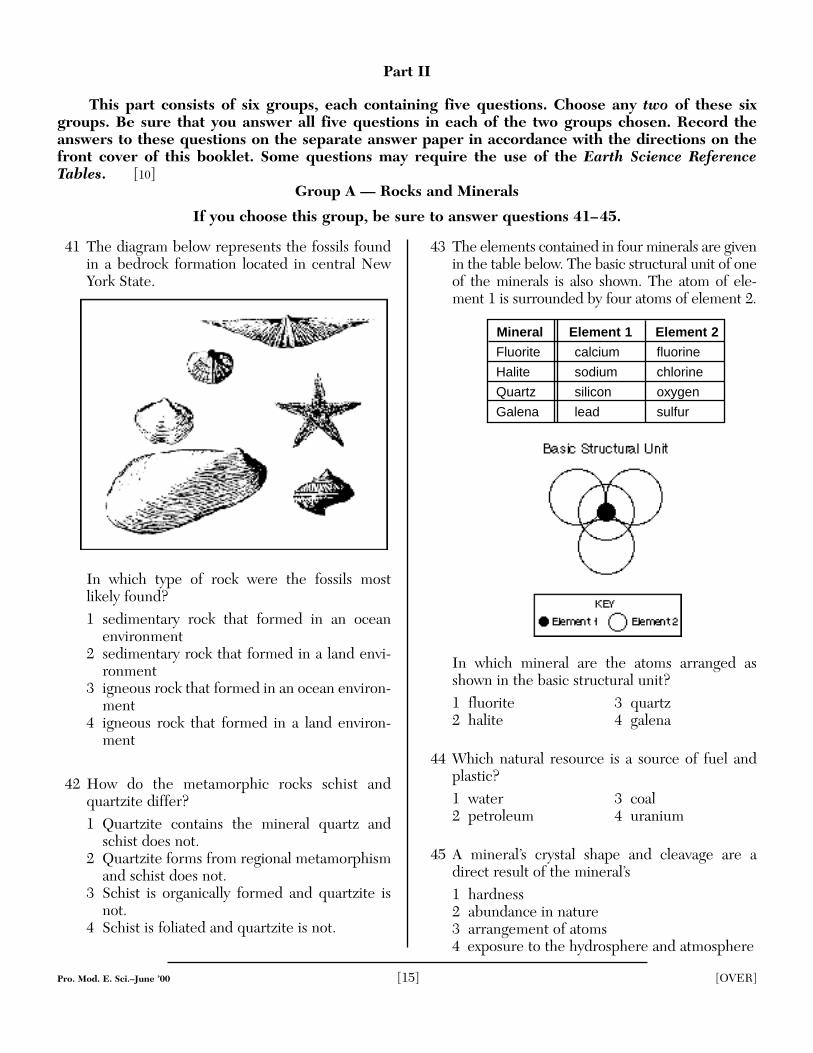
41 The diagram below represents the fossils foundin a bedrock formation located in central NewYork State.
In which type of rock were the fossils most likely found?1 sedimentary rock that formed in an ocean
environment2 sedimentary rock that formed in a land envi-
ronment3 igneous rock that formed in an ocean environ-
ment4 igneous rock that formed in a land environ-
ment
42 How do the metamorphic rocks schist andquartzite differ?1 Quartzite contains the mineral quartz and
schist does not.2 Quartzite forms from regional metamorphism
and schist does not.3 Schist is organically formed and quartzite is
not.4 Schist is foliated and quartzite is not.
43 The elements contained in four minerals are givenin the table below. The basic structural unit of oneof the minerals is also shown. The atom of ele-ment 1 is surrounded by four atoms of element 2.
Mineral Element 1 Element 2
Fluorite calcium fluorine
Halite sodium chlorine
Quartz silicon oxygen
Galena lead sulfur
In which mineral are the atoms arranged asshown in the basic structural unit?1 fluorite 3 quartz2 halite 4 galena
44 Which natural resource is a source of fuel andplastic?1 water 3 coal2 petroleum 4 uranium
45 A mineral’s crystal shape and cleavage are adirect result of the mineral’s1 hardness2 abundance in nature3 arrangement of atoms 4 exposure to the hydrosphere and atmosphere
Part II
This part consists of six groups, each containing five questions. Choose any two of these sixgroups. Be sure that you answer all five questions in each of the two groups chosen. Record theanswers to these questions on the separate answer paper in accordance with the directions on thefront cover of this booklet. Some questions may require the use of the Earth Science ReferenceTables. [10]
Group A — Rocks and Minerals
If you choose this group, be sure to answer questions 41–45.

46 Why is Earth’s outer core inferred to be a liquid?(1) P-waves can pass through the outer core.(2) P-waves cannot pass through the outer core.(3) S-waves can pass through the outer core.(4) S-waves cannot pass through the outer core.
47 The cross section below shows the location ofearthquakes near a plate boundary.
This distribution of earthquakes near the plateboundary is most likely caused by1 a transform fault2 a mantle hot spot3 subduction of a crustal plate4 divergence of crustal plates
48 Geologists have used information about thecomposition of meteorites to make inferencesabout Earth’s1 core properties2 atmospheric structure3 asthenosphere location4 continental-crust thickness
49 The epicenter of an earthquake is located 2,800 kilometers from a seismic station.Approximately how long did the S-wave take totravel from the epicenter to the station?(1) 11 min 15 sec (3) 5 min 20 sec(2) 9 min 35 sec (4) 4 min 20 sec
50 The same earthquake was recorded by seismicstations in Eureka, California; Elko, Nevada; andLas Vegas, Nevada. The distance to the earth-quake epicenter for each station is shown below.
Seismic Station Location Distance to Epicenter
Eureka, CA 485 km
Elko, NV 705 km
Las Vegas, NV 622 km
On which map do the circles correctly show theepicenter distance from each of the seismic sta-tions?
Pro. Mod. E. Sci.–June ’00 [16]
Group B — Plate Tectonics
If you choose this group, be sure to answer questions 46–50.

Pro. Mod. E. Sci.–June ’00 [17] [OVER]
51 What usually causes tsunamis?1 hurricanes2 high-pressure weather systems3 undersea earthquakes4 the collision of ocean currents
52 The diagrams below represent landscape fea-tures found along the seacoast. The arrows showocean-wave direction. Which shoreline has beenshaped more by deposition than by erosion?
53 Which evidence causes most scientists to believethat seafloor spreading occurs at the mid-Atlantic Ridge?1 Oceanic crust is oldest at the ridge.2 Large sedimentary folds exist in the mantle
near the ridge.3 Oceanic crust on both sides of the ridge is less
dense than continental crust.4 Oceanic crust on both sides of the ridge shows
matching patterns of reversed and normalmagnetic polarity.
54 The curvature to the right by major ocean cur-rents in the Northern Hemisphere is primarilydue to1 surface variations in ocean water salinity2 differences in ocean water temperatures3 the gravitational attraction of the Moon4 the rotation of Earth
55 Which graph best shows the relationshipbetween windspeed and the average height ofocean waves formed by the wind?
Group C — Oceanography
If you choose this group, be sure to answer questions 51–55.

57 What is the best evidence that a glacial erratichas been transported?1 It is located at a high elevation in a mountain-
ous area.2 It is less than 25 centimeters in diameter.3 Its composition is different from that of the
bedrock under it.4 It appears to have been intensely metamor-
phosed.
58 Which New York State resources are a directresult of the glaciers that once covered most ofthe State?1 sand and gravel2 halite and gypsum3 magnetite and calcite4 limestone and marble
59 Which condition causes glaciers to retreat?1 They encounter the ocean.2 The crust beneath them is uplifted.3 Earth’s average temperature decreases.4 Their rate of melting exceeds their rate of
advancing.
60 Which statement provides the best evidence thatNew York State’s Finger Lakes formed as a resultof continental glaciation?1 The lake surfaces are above sea level.2 The lakes fill long, narrow U-shaped valleys.3 The lakes are partially filled with sorted beds
of sediment.4 The lakes are surrounded by sharp, jagged
peaks and ridges.
Pro. Mod. E. Sci.–June ’00 [18]
Group D — Glacial Processes
If you choose this group, be sure to answer questions 56–60.
56 Shaded areas on the diagrams below show the part of New York State that was covered by glacial ice dur-ing the last ice age.
The best inference that can be made from these diagrams is that this glacial ice1 was about 1 mile thick at New York City2 advanced and retreated more than once3 moved more slowly than the glaciers of earlier ice ages4 changed the shape of Lake Ontario

63 What is the latent heat of vaporization of water?(1) 1.0 cal/g•C° (3) 80.0 cal/g(2) 0.5 cal/g•C° (4) 540.0 cal/g
64 Which weather instrument has most improvedthe accuracy of weather forecasts over the past40 years?1 thermometer 3 weather satellite2 sling psychrometer 4 weather balloon
65 Which form of electromagnetic radiation has awavelength of 10–7 meter?1 gamma rays 3 infrared2 ultraviolet 4 radio waves
61 At 4,000 meters above Earth’s surface, the tem-perature within the cloud is approximately(1) –12°C (3) 3°C(2) –3°C (4) 0°C
62 Which process slows the rate of cooling above3,000 meters and results in cloud formation?1 condensation 3 convection2 evaporation 4 radiation
Pro. Mod. E. Sci.–June ’00 [19] [OVER]
Base your answers to questions 61 and 62 on the diagram below, which shows temperature changes with-in a parcel of air on a summer day.
Group E — Atmospheric Energy
If you choose this group, be sure to answer questions 61–65.

Pro. Mod. E. Sci.–June ’00 [20]
Group F — Astronomy
If you choose this group, be sure to answer questions 66–70.
Base your answers to questions 66 and 67 on the four graphs below, which represent trends for four char-acteristics of the planets in Earth’s solar system. The planets are indicated in order of increasing distance fromthe Sun.
66 Which graph best illustrates the surface tempera-tures of the planets?(1) A (3) C(2) B (4) D
67 Which graph best represents the amount of timeit takes each planet to orbit the Sun once?(1) A (3) C(2) B (4) D
68 The diagram below shows one model of a portion of the universe.
What type of model does the diagram best demonstrate?1 a heliocentric model, in which celestial objects orbit Earth2 a heliocentric model, in which celestial objects orbit the Sun3 a geocentric model, in which celestial objects orbit Earth4 a geocentric model, in which celestial objects orbit the Sun

Pro. Mod. E. Sci.–June ’00 [21] [OVER]
69 The apparent change in direction of a Foucaultpendulum is caused by1 star motions2 Earth’s rotation3 the Moon’s gravitational attraction4 density differences within the mantle
70 Based on the red-shift data on galaxies, mostastronomers infer that the universe is currently1 expanding 3 moving randomly2 contracting 4 fixed and stationary

Pro. Mod. E. Sci.–June ’00 [22]
71 On the pie graph provided on your answer paper, complete the graph to show thepercent of each salt usage. (The percent of salt used in industry has been drawn andlabeled.) Label each section of the pie graph to indicate the salt usage. [2]
72 Shaded areas on the map below represent some counties in New York State wheresalt is mined.
State the name of one New York State landscape region in which all or part of thesecounties are located. [1]
Part III
This part consists of questions 71 through 88. Be sure that you answer all questions in this part.Record your answers in the spaces provided on the separate answer paper. You may use pen or pen-cil. Some questions may require the use of the Earth Science Reference Tables. [25]
Base your answers to questions 71 and 72 on the data table below, which shows the percent and uses ofdifferent types of salt in the United States.
Uses of Salt in the United States
Salt Usage Percent How Used
Water softening 9 Sodium ions from salt replace calcium andmagnesium ions in water.
Highways 69 Salt keeps highways free of ice in the winter.
Agriculture 6 Salt is provided for livestock and poultry to balance their diet.
Foods 5 Humans use salt in their diet.
Industry 11 Many industrial processes, such as paper-making, use salt.

Pro. Mod. E. Sci.–June ’00 [23] [OVER]
Base your answers to questions 73 through 75 on the information and data table below.
In August 1992, Hurricane Andrew, the most costly natural disaster in UnitedStates history, hit southern Florida. The data table below shows the location and clas-sification of Hurricane Andrew on 7 days in August 1992.
Data Table
Day Latitude Longitude Storm Classification
August 18 13° N 46° W Tropical storm
August 20 19° N 59° W Tropical storm
August 22 25° N 66° W Hurricane
August 24 25° N 78° W Hurricane
August 26 28° N 90° W Hurricane
August 27 32° N 91° W Tropical storm
August 28 34° N 86° W Tropical storm
73 On the hurricane tracking map provided on your answer paper, plot the locations ofHurricane Andrew given in the data table, following the directions below.a Use an X to mark each location on the grid. [1]b Label each X with the appropriate date. The data for August 18 has been plotted
on your answer paper as an example. [1]c Connect the X’s with a line to show the hurricane’s path. [1]
74 As Hurricane Andrew approached Miami, Florida, cloudiness and precipitationincreased dramatically. State how the air pressure at Miami was changing at thistime. [1]
75 By August 27, Hurricane Andrew was downgraded from a hurricane to a tropicalstorm because its windspeed decreased. State one reason why Hurricane Andrew’swindspeed decreased at this time. [1]

76 The chart below shows the different rock families and their subdivisions. The circled letters, A, B, and C,indicate parts of the chart that have not been completed.
Complete the chart by writing the missing terms in the spaces labeled A, B, and C onyour answer paper. [3]
Pro. Mod. E. Sci.–June ’00 [24]
Base your answers to questions 77 and 78 on theweather station model shown below.
77 State the condition represented by the symbolfor “present weather.” [1]
78 State the relative humidity. [1]
79 The group of stars known as the Big Dipper canbe used to locate the North Star (Polaris) in thenight sky. On the diagram of the Big Dipper pro-vided on your answer paper, draw a straightarrow passing through two stars to indicate thedirection to Polaris. [1]

Pro. Mod. E. Sci.–June ’00 [25] [OVER]
80 On the diagram provided on your answer paper,mark with a dot the position of Polaris as viewedby the observer. Label this dot “Polaris.” [1]
81 On the diagram provided on your answer paper,mark with a dot the position of the observer’szenith. Label this dot “Zenith.” [1]
82 The altitude of the Sun’s position at noon onMarch 21 is 40° at this location. On the diagramprovided on your answer paper, draw and labelthe approximate apparent path of the Sun onMarch 21. [1]
Base your answers to questions 80 through 82 on the diagram below. The diagram is a model of the sky(celestial sphere) for an observer at 50° N latitude. The Sun’s apparent path on June 21 is shown.
83 Below is a list of some mineral resources and the number of years that supplies are estimated to last (sup-ply time) if use continues at the current rate.
Mineral Resources’ Future
Mineral Resource Estimated Supply Time
Salt, magnesium metal . . . . . . . . . almost infiniteLime, silicon . . . . . . . . . . . . . thousands of yearsPotash, cobalt. . . . . . . . . . . . . . . . . . 200+ yearsManganese ore. . . . . . . . . . . . . . . . . 200+ yearsIron ore . . . . . . . . . . . . . . . . . . 100 to 200 yearsChromite, feldspar . . . . . . . . . . 100 to 200 yearsBauxite (aluminum ore) . . . . . . . 50 to 100 yearsPhosphate rock, nickel . . . . . . . . 50 to 100 yearsCopper, mercury . . . . . . . . . . less than 50 yearsZinc, lead. . . . . . . . . . . . . . . . less than 50 years
State one way humans could increase the estimated supply time for many of theseresources. [1]

Pro. Mod. E. Sci.–June ’00 [26]
84 Calculate the eccentricity of the ellipse, follow-ing the directions below.a Write the equation used to determine eccen-
tricity. [1]b Based on measurements of the diagram, sub-
stitute values into the equation. [1]c Calculate the eccentricity of the ellipse. [1]
85 State how the eccentricity of the given ellipsecompares to the eccentricity of Earth’s orbit. [1]
Base your answers to questions 84 and 85 on the diagram of an ellipse below.

Pro. Mod. E. Sci.–June ’00 [27]
86 State the letter of the oldest rock unit shown inthe cross sections. [1]
87 State the name of a metamorphic rock thatwould be found in the zone of contact metamor-phism surrounding rock unit J. [1]
88 A buried erosional surface (unconformity) exists incross section I. Identify the position of the mostapparent unconformity by drawing a thick wavyline at the correct position incross section I on your answer paper. [1]
Base your answers to questions 86 through 88 on cross sections I and II shown below. Letters A through Jrepresent rock units. Rock units B and I are the same age. Overturning has not occurred in either cross section.

Part II (35 credits)
Answer the questions in only seven of the ten groups in this part. Be sure to mark the answers to thegroups of questions you choose in accordance with the instructions on the front cover of the test booklet.Leave blank the three groups of questions you do not choose to answer.
Group 1
56 1 2 3 4
57 1 2 3 4
58 1 2 3 4
59 1 2 3 4
60 1 2 3 4
Group 2
61 1 2 3 4
62 1 2 3 4
63 1 2 3 4
64 1 2 3 4
65 1 2 3 4
Group 3
66 1 2 3 4
67 1 2 3 4
68 1 2 3 4
69 1 2 3 4
70 1 2 3
Group 4
71 1 2 3 4
72 1 2 3 4
73 1 2 3 4
74 1 2 3 4
75 1 2 3 4
Group 5
76 1 2 3 4
77 1 2 3 4
78 1 2 3 4
79 1 2 3 4
80 1 2 3 4
Group 6
81 1 2 3 4
82 1 2 3 4
83 1 2 3 4
84 1 2 3 4
85 1 2 3 4
Group 7
86 1 2 3 4
87 1 2 3 4
88 1 2 3 4
89 1 2 3 4
90 1 2 3 4
Group 8
91 1 2 3 4
92 1 2 3 4
93 1 2 3 4
94 1 2 3 4
95 1 2 3 4
Group 9
96 1 2 3 4
97 1 2 3 4
98 1 2 3 4
99 1 2 3 4
100 1 2 3 4
Group 10
101 1 2 3 4
102 1 2 3 4
103 1 2 3 4
104 1 2 3 4
105 1 2 3
I do hereby affirm, at the close of this examination, that I had no unlawful knowledge of the questions or answers prior to the examinationand that I have neither given nor received assistance in answering any of the questions during the examination.
Signature
E. Sci.–June ’96 [28]
Tear
Her
eTe
ar H
ere

The University of the State of New York
REGENTS HIGH SCHOOL EXAMINATION
EARTH SCIENCE
Thursday, June 15, 2000 – 9:15 a.m. to 12:15 p.m., only
ANSWER SHEET
Part I Credits . . . . . . . . . . . ...........
Part II Credits . . . . . . . . . . ...........
Performance Test Credits. . ...........
Total (Official Regents)Examination Mark . . . . . . ...........
Reviewer’s Initials: ________________
Student . . . . . . . . . . . . . . . . . . . . . . . . . . . . . . . . . . . . . . . . . . . . . . . . . . . . . . . . . . Sex: ■■ Male ■■ Female
Teacher . . . . . . . . . . . . . . . . . . . . . . . . . . . . . . . . . . . . . . . . . . . . School . . . . . . . . . . . . . . . . . . . . . . . . . . . . . . . .
Grade (circle one) 8 9 10 11 12
Record all of your answers on this answer sheet in accordance with the instructions on the front coverof the test booklet.
1 1 2 3 4
2 1 2 3 4
3 1 2 3 4
4 1 2 3 4
5 1 2 3 4
6 1 2 3 4
7 1 2 3 4
8 1 2 3 4
9 1 2 3 4
10 1 2 3 4
11 1 2 3 4
12 1 2 3 4
13 1 2 3 4
14 1 2 3 4
15 1 2 3 4
16 1 2 3 4
17 1 2 3 4
18 1 2 3 4
19 1 2 3 4
20 1 2 3 4
21 1 2 3 4
22 1 2 3 4
23 1 2 3 4
24 1 2 3 4
25 1 2 3 4
26 1 2 3 4
27 1 2 3 4
28 1 2 3 4
29 1 2 3 4
30 1 2 3 4
31 1 2 3 4
32 1 2 3 4
33 1 2 3 4
34 1 2 3 4
35 1 2 3 4
36 1 2 3 4
37 1 2 3 4
38 1 2 3 4
39 1 2 3 4
40 1 2 3 4
41 1 2 3 4
42 1 2 3 4
43 1 2 3 4
44 1 2 3 4
45 1 2 3 4
46 1 2 3 4
47 1 2 3 4
48 1 2 3 4
49 1 2 3 4
50 1 2 3 4
51 1 2 3 4
52 1 2 3 4
53 1 2 3 4
54 1 2 3 4
55 1 2 3
Part I (55 credits)
Tear Here
Tear Here