earnings presentation –q1-fy20 · 2019-11-15 · fy17. fy18. fy19. q1-fy20. revenue ebitda...
TRANSCRIPT

EARNINGS PRESENTATION – Q1-FY20

2
EXECUTIVE SUMMARYCompany Overview:
Other Services (12%)
Business Mix (FY19):
Enterprise Solutions (17%)Digital Transformation (71%)
Financial Highlights:
Operational Income
FY18 FY19
INR 7,835 Mn INR 8,141 Mn
EBITDA
FY18 FY19
INR 1,185 Mn INR 1,179 Mn
PAT
FY19 FY19
INR 684 Mn INR 769 Mn
• Kellton Tech Solutions Ltd. (Kellton) is a new age IT services company with globalfootprint in the US, United Kingdom, Ireland, Singapore, and India.
• The Company offers digital solutions, advisory services, along with serving as systemsintegrator to over 300 clients globally, ranging from start-ups to Fortune 1,000enterprises.
Leveraging on a potentmixture of digitaltechnologies forprofoundly disruptingbusiness activities andcompetencies throughDigital Transformation.
Kellton, as part of itsfounding philosophy,believes in developingcustomized solutionsfor large enterprises, asstraitjacket fit solutionsdon’t work for everybusiness.
Headed by a passionateteam of individuals,Kellton offers a largegamut of IT consultingservices to organizationsin a transparent andscalable manner.
Retail & E-commerce | Travel, Tourism & Hospitality | Media & Entertainment | Healthcare
Professional Services | Manufacturing | Food & Beverage | Oil & Gas | BFSI | IT
Servicing the following sectors:
3
COMPANY OVERVIEW
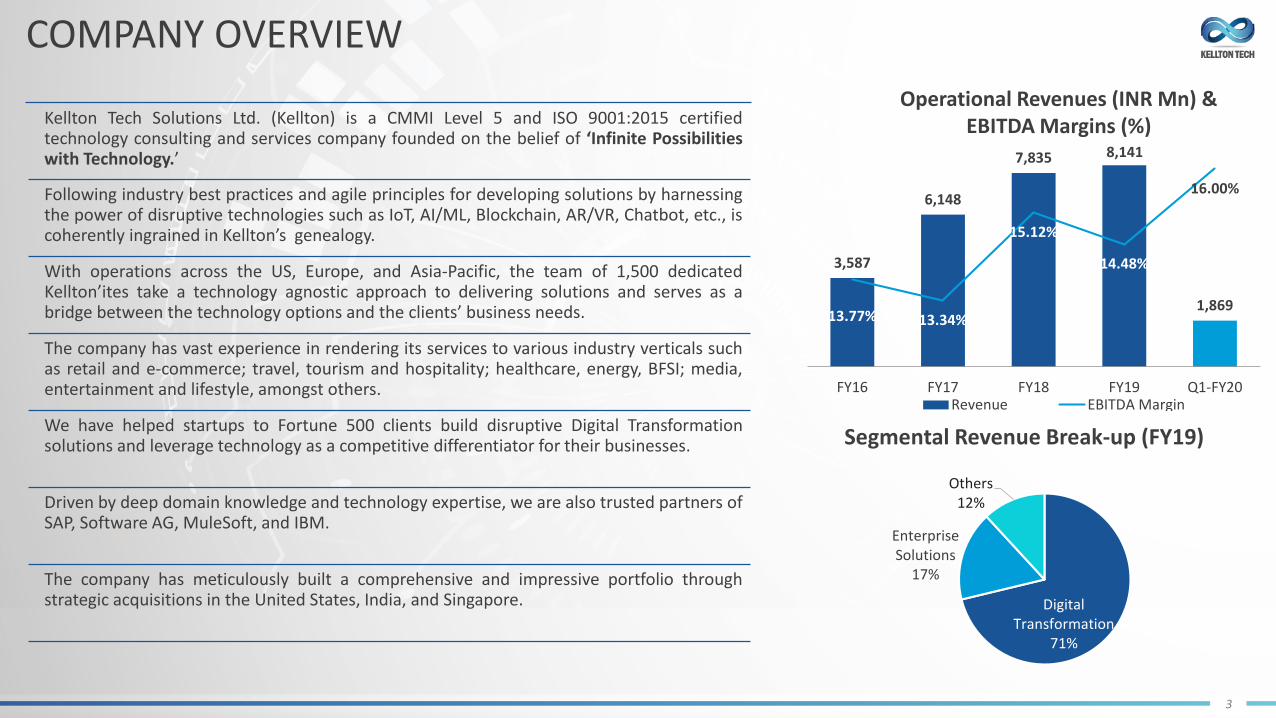
Kellton Tech Solutions Ltd. (Kellton) is a CMMI Level 5 and ISO 9001:2015 certifiedtechnology consulting and services company founded on the belief of ‘Infinite Possibilitieswith Technology.’
Following industry best practices and agile principles for developing solutions by harnessingthe power of disruptive technologies such as IoT, AI/ML, Blockchain, AR/VR, Chatbot, etc., iscoherently ingrained in Kellton’s genealogy.
With operations across the US, Europe, and Asia-Pacific, the team of 1,500 dedicatedKellton’ites take a technology agnostic approach to delivering solutions and serves as abridge between the technology options and the clients’ business needs.
The company has vast experience in rendering its services to various industry verticals suchas retail and e-commerce; travel, tourism and hospitality; healthcare, energy, BFSI; media,entertainment and lifestyle, amongst others.
We have helped startups to Fortune 500 clients build disruptive Digital Transformationsolutions and leverage technology as a competitive differentiator for their businesses.
Driven by deep domain knowledge and technology expertise, we are also trusted partners ofSAP, Software AG, MuleSoft, and IBM.
The company has meticulously built a comprehensive and impressive portfolio throughstrategic acquisitions in the United States, India, and Singapore. Digital
Transformation71%
Enterprise Solutions
17%
Others12%
Segmental Revenue Break-up (FY19)
Operational Revenues (INR Mn) & EBITDA Margins (%)
3,587
6,148
7,835 8,141
1,86913.77% 13.34%
15.12%
14.48%
16.00%
12.00%
12.50%
13.00%
13.50%
14.00%
14.50%
15.00%
15.50%
16.00%
16.50%
FY16 FY17 FY18 FY19 Q1-FY20Revenue EBITDA Margin
4
Q1-FY20 FINANCIAL OVERVIEW
5
Q1-FY20 FINANCIAL HIGHLIGHTS
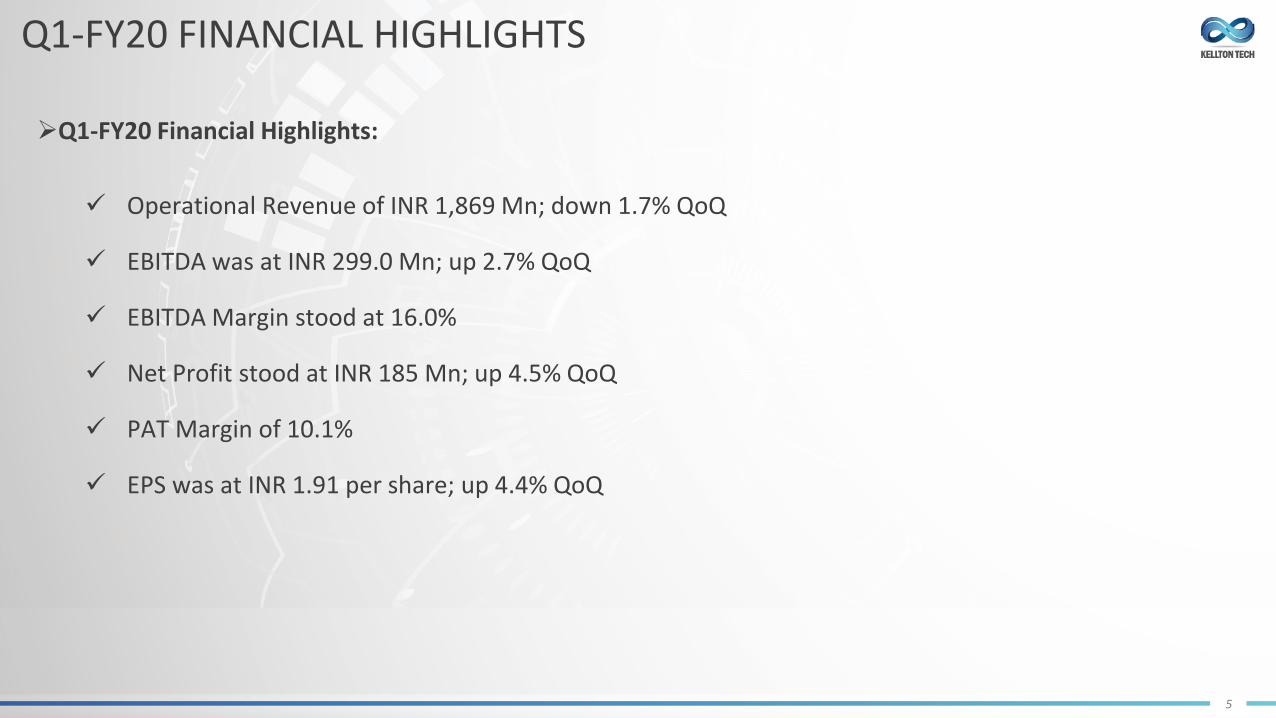
Q1-FY20 Financial Highlights:
Operational Revenue of INR 1,869 Mn; down 1.7% QoQ
EBITDA was at INR 299.0 Mn; up 2.7% QoQ
EBITDA Margin stood at 16.0%
Net Profit stood at INR 185 Mn; up 4.5% QoQ
PAT Margin of 10.1%
EPS was at INR 1.91 per share; up 4.4% QoQ
6
Q1-FY20 OPERATIONAL HIGHLIGHTS
• Kellton Tech is a select change-maker partner to Software AG’s North America Sales Kick-Off (SKO) event inLas Vegas. This has given us the opportunity to network with Software AG partners and their sales teamthrough leadership keynotes and interactive training sessions based on our playbooks—Cumulocity IoT,Hybrid Integration, and API Management.
• Kellton Tech is a proud participant at this year’s SAPPHIRE NOW and ASUG Annual Conference, the largestbusiness technology event happening in Orlando, Florida. In this event, we showcased our entire gamut ofsolutions, tools, and methodologies that have helped our clients drive extraordinary levels of innovationacross key business functions and drive intelligent outcomes.

7
Q1-FY20 NEW CLIENT WINSWon 19 new clients, some big wins are:
A Global Risk Utility Company
Kellton Tech is developing a holistic credit riskanalytics and management platform for a globalrisk-utility company to gauge associatedportfolio risks with ease and accuracy.
A Leading Insurance Company
Kellton Tech is selected as an agiletransformation partner for one theleading new-age insurance company inAsia.
A Large Media House
One of India’s largest Media Housesselected Kellton Tech to transform itsoperating model to digital media.
A Healthcare Provider
Kellton Tech is providing next-genapplication management services forleading providers of world-class healthcareservices.
A Real Estate Company
Kellton Tech is building a best-in-class VirtualReality based solution for the world’s leadingreal estate company.
A Leading Gaming Company
Kellton Tech is developing a AAA levelVFX graphics simulation game using theNintendo Switch platform for one of theprominent players in the Japanesegame development industry.
8
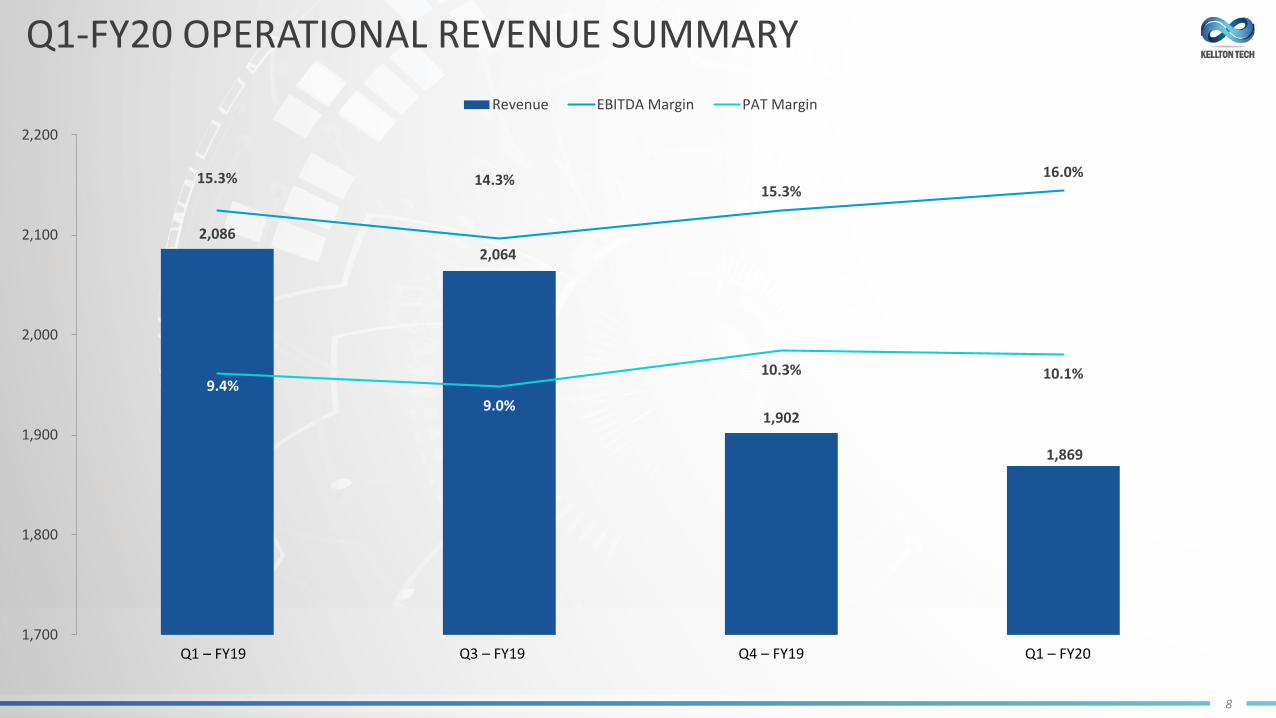
Q1-FY20 OPERATIONAL REVENUE SUMMARY
2,0862,064
1,902
1,869
15.3% 14.3%15.3%
16.0%
9.4%9.0%
10.3% 10.1%
1,700
1,800
1,900
2,000
2,100
2,200
0.0%
2.0%
4.0%
6.0%
8.0%
10.0%
12.0%
14.0%
16.0%
18.0%
Revenue EBITDA Margin PAT Margin
Q1 – FY19 Q3 – FY19 Q4 – FY19 Q1 – FY20

9
8.0% 8.0% 8.2%3.6% 4.4% 4.6%6.8% 6.6% 6.6%
13.5% 13.2% 13.3%
27.1% 26.9% 26.7%
3.8% 4.3% 4.4%5.9% 6.3% 6.5%3.6% 2.6% 2.4%
14.5% 14.5% 14.5%
13.2% 13.2% 13.3%
Q1-FY19 Q4-FY19 Q1-FY20
BFSI Education Energy & Utilities Healthcare & Life Sciences
Information Services & Technology Manufacturing Media & Entertainment Others, Aviation & NGO
Professional Services/Business Services Retail
Q1-FY20 REVENUE BY INDUSTRY

10
Q1-FY20 KEY METRICS
68.3%75.1% 77.0%
15.5% 18.5% 16.2%16.2%
6.4% 6.8%
Q1-FY19 Q4-FY19 Q1-FY20
By BusinessDigital Transformation Enterprise Solutions Consulting Income
82.4% 81.8% 81.1%
3.6% 8.4% 9.8%12.2% 9.8% 9.1%1.8% 0.0%
Q1-FY19 Q4-FY19 Q1-FY20
By Geography
USA Europe India & APAC Others
13.1% 13.8% 14.3%
23.1%21.4% 22.4%
Q1-FY19 Q4-FY19 Q1-FY20
By ClientsTop 5 clients Top 10 clients
90.4%86.2% 86.9%
4.9%
6.2% 6.0%
4.7%7.6% 7.1%
Q1-FY19 Q4-FY19 Q1-FY20
Revenue MixOnshore Offshore Domestic
11
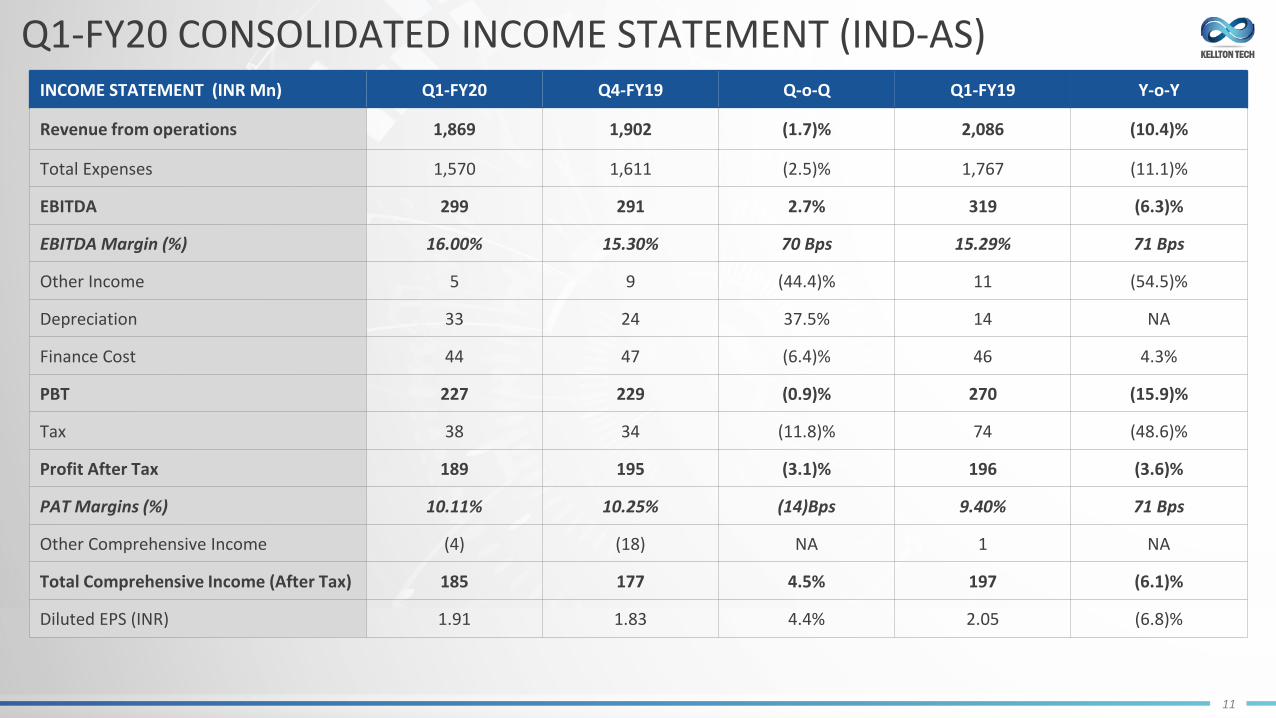
INCOME STATEMENT (INR Mn) Q1-FY20 Q4-FY19 Q-o-Q Q1-FY19 Y-o-Y
Revenue from operations 1,869 1,902 (1.7)% 2,086 (10.4)%
Total Expenses 1,570 1,611 (2.5)% 1,767 (11.1)%
EBITDA 299 291 2.7% 319 (6.3)%
EBITDA Margin (%) 16.00% 15.30% 70 Bps 15.29% 71 Bps
Other Income 5 9 (44.4)% 11 (54.5)%
Depreciation 33 24 37.5% 14 NA
Finance Cost 44 47 (6.4)% 46 4.3%
PBT 227 229 (0.9)% 270 (15.9)%
Tax 38 34 (11.8)% 74 (48.6)%
Profit After Tax 189 195 (3.1)% 196 (3.6)%
PAT Margins (%) 10.11% 10.25% (14)Bps 9.40% 71 Bps
Other Comprehensive Income (4) (18) NA 1 NA
Total Comprehensive Income (After Tax) 185 177 4.5% 197 (6.1)%
Diluted EPS (INR) 1.91 1.83 4.4% 2.05 (6.8)%
Q1-FY20 CONSOLIDATED INCOME STATEMENT (IND-AS)

12
HISTORICAL FINANCIAL OVERVIEW
13
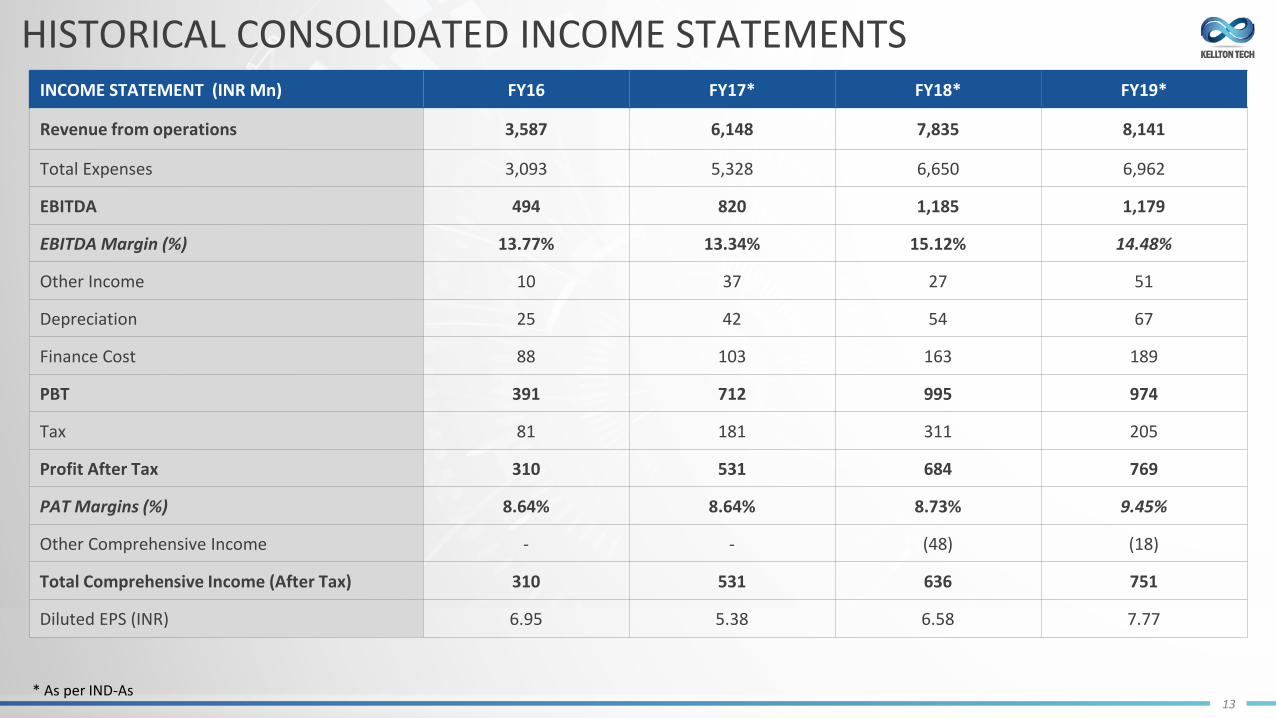
INCOME STATEMENT (INR Mn) FY16 FY17* FY18* FY19*
Revenue from operations 3,587 6,148 7,835 8,141
Total Expenses 3,093 5,328 6,650 6,962
EBITDA 494 820 1,185 1,179
EBITDA Margin (%) 13.77% 13.34% 15.12% 14.48%
Other Income 10 37 27 51
Depreciation 25 42 54 67
Finance Cost 88 103 163 189
PBT 391 712 995 974
Tax 81 181 311 205
Profit After Tax 310 531 684 769
PAT Margins (%) 8.64% 8.64% 8.73% 9.45%
Other Comprehensive Income - - (48) (18)
Total Comprehensive Income (After Tax) 310 531 636 751
Diluted EPS (INR) 6.95 5.38 6.58 7.77
HISTORICAL CONSOLIDATED INCOME STATEMENTS
* As per IND-As
14
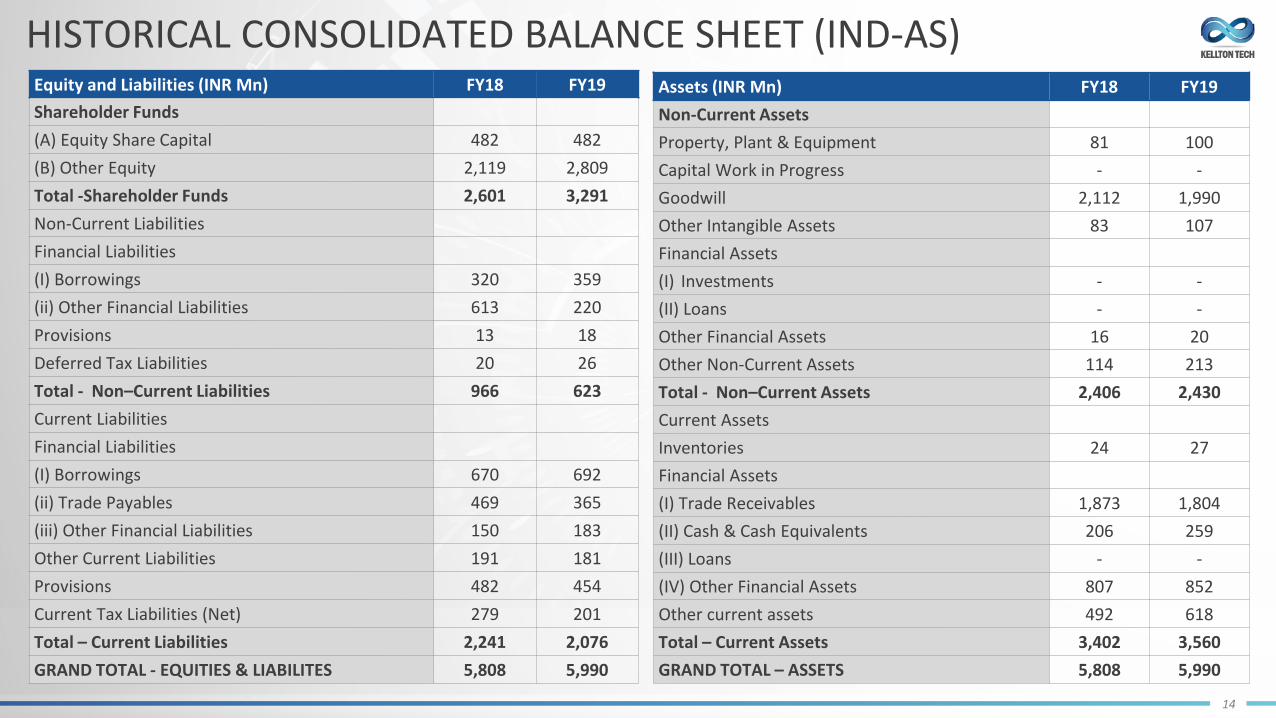
Equity and Liabilities (INR Mn) FY18 FY19Shareholder Funds(A) Equity Share Capital 482 482(B) Other Equity 2,119 2,809Total -Shareholder Funds 2,601 3,291Non-Current LiabilitiesFinancial Liabilities(I) Borrowings 320 359(ii) Other Financial Liabilities 613 220Provisions 13 18Deferred Tax Liabilities 20 26Total - Non–Current Liabilities 966 623Current LiabilitiesFinancial Liabilities(I) Borrowings 670 692(ii) Trade Payables 469 365(iii) Other Financial Liabilities 150 183Other Current Liabilities 191 181Provisions 482 454Current Tax Liabilities (Net) 279 201Total – Current Liabilities 2,241 2,076GRAND TOTAL - EQUITIES & LIABILITES 5,808 5,990
HISTORICAL CONSOLIDATED BALANCE SHEET (IND-AS)Assets (INR Mn) FY18 FY19Non-Current AssetsProperty, Plant & Equipment 81 100Capital Work in Progress - -Goodwill 2,112 1,990Other Intangible Assets 83 107Financial Assets(I) Investments - -(II) Loans - -Other Financial Assets 16 20Other Non-Current Assets 114 213Total - Non–Current Assets 2,406 2,430Current AssetsInventories 24 27Financial Assets(I) Trade Receivables 1,873 1,804(II) Cash & Cash Equivalents 206 259(III) Loans - -(IV) Other Financial Assets 807 852Other current assets 492 618Total – Current Assets 3,402 3,560GRAND TOTAL – ASSETS 5,808 5,990
15
DISCLAIMERKellton Tech Solutions Limited Disclaimer:The information contained in this presentation is only current as of its date. All actions and statements made herein or otherwise shall be subject to the applicable laws and regulationsas amended from time to time. There is no representation that all information relating to the context has been taken care off in the presentation and neither we undertake any obligationas to the regular updating of the information as a result of new information, future events or otherwise. We will accept no liability whatsoever for any loss arising directly or indirectlyfrom the use of, reliance of any information contained in this presentation or for any omission of the information. The information shall not be distributed or used by any person or entityin any jurisdiction or countries were such distribution or use would be contrary to the applicable laws or Regulations. It is advised that prior to acting upon this presentation independentconsultation / advise may be obtained and necessary due diligence, investigation etc may be done at your end. You may also contact us directly for any questions or clarifications at ourend. This presentation contain certain statements of future expectations and other forward-looking statements, including those relating to our general business plans and strategy, ourfuture financial condition and growth prospects, and future developments in our industry and our competitive and regulatory environment. In addition to statements which are forwardlooking by reason of context, the words ‘may, will, should, expects, plans, intends, anticipates, believes, estimates, predicts, potential or continue and similar expressions identify forwardlooking statements. Actual results, performances or events may differ materially from these forward-looking statements including the plans, objectives, expectations, estimates andintentions expressed in forward looking statements due to a number of factors, including without limitation future changes or developments in our business, our competitiveenvironment, telecommunications technology and application, and political, economic, legal and social conditions in India. It is cautioned that the foregoing list is not exhaustive Thispresentation is not being used in connection with any invitation of an offer or an offer of securities and should not be used as a basis for any investment decision
Valorem Advisors Disclaimer:Valorem Advisors is an Independent Investor Relations Management Service company. This Presentation has been prepared by Valorem Advisors based on information and data whichthe Company considers reliable, but Valorem Advisors and the Company makes no representation or warranty, express or implied, whatsoever, and no reliance shall be placed on, thetruth, accuracy, completeness, fairness and reasonableness of the contents of this Presentation. This Presentation may not be all inclusive and may not contain all of the information thatyou may consider material. Any liability in respect of the contents of, or any omission from, this Presentation is expressly excluded. Valorem Advisors also hereby certifies that thedirectors or employees of Valorem Advisors do not own any stock in personal or company capacity of the Company under review.
For further details, please feel free to contact our Investor Relations Representatives:
Mr. Anuj SonpalValorem AdvisorsTel: +91-22-4903 9500Email: [email protected]

16
THANK YOU