earnings management and audit quality: evidence from southeast … · · 2015-08-051 earnings...
TRANSCRIPT
1
Earnings Management and Audit Quality:
Evidence from Southeast Asia
Weerapong Kitiwong, University of York
Dr. Shraddha Verma, University of York
Dr. Keith Anderson, University of York
Abstract:
Whether a big firm is of higher audit quality than a non-big firm is one of the most contentious
research questions in empirical auditing studies. Empirical evidence however provides contradictory
findings. Our study then aims to revisit this issue and contributes to the literature on the association
between audit quality and earnings management in the context of Southeast Asia. We develop a new
probit model that helps predict the probability that auditors provide high audit quality. We are also
the first study that measures audit quality by using the joint association between type of audit report
and level of cross-sectional Jones discretionary accruals. The different levels of benchmark are used to
test how different types of audit firms and auditors in different countries can be tolerant of different
level of discretionary accruals. The final sample consists of 2,148 listed companies (20,757 firm-year
observations) from Indonesia, Malaysia, the Philippines Singapore and Thailand and covers the period
1993-2011. The evidence indicates that maintaining clients is the cause that auditors are more
tolerant of high level of discretionary accruals and a big firm is more conservative than a non-big firm.
National level factors have strong influence on audit quality. Our results also suggest that mandatory
audit firm rotation may help promote audit quality, since long audit firm tenure may be associated
with impaired audit quality.
1 Introduction
2
The series of accounting scandals in the US (Sunbeam, Cendant, Waste Management, Enron and
Worldcom) and in Europe (ComRoad in Germany) at the end of the 20th century and the beginning
of the 21st century has again turned researchers’ attention to the study of earnings management.
These high profile fraudulent accounting were generally attributed to earnings management and
caused mass media to ask why the auditors did not reveal these unusual accounting transactions.
These finally tarnished the auditors’ reputation, record and image.
In a capital market where financial reports are a key feature of communication with respect to
public firms’ performance and financial position, the auditor is perceived as an effective third party
who helps mitigate information asymmetry and conflict of interests between management and
investors. Mansi, Maxwell and Miller (2004) identify two roles of an auditor: the information role
and the insurance role. As an information intermediary, an auditor is a person who independently
and effectively verifies the correctness of company’s financial statements before they are published.
As an insurance provider, on the other hand, an auditor is a person who is legally accountable for
damages to financial statement users. Auditors therefore carry out primary responsibility for
promoting transparency in financial reporting processes that in turn generate high quality financial
statements. In other words, auditors are one of the key drivers that help promote the transparency
of the stock markets.
Empirical studies have tried to indicate the relation among auditors, earnings management and
audit quality. However the existing evidence still provides varying results. Our study then
contributes to the literature on audit quality and earnings management by broadening evidence to
Southeast Asia and providing a new measure of audit quality. We aim to test whether a big firm is of
higher quality than a non-big firm and whether national level factors have an influence on audit
quality. We also broaden the evidence to Southeast Asia which has cultural, ethnic and linguistic
3
diversity; differences in economic growth, government and regulatory systems; and different levels
of investor protection.
Empirical studies focus only on numerical discretionary accruals without being concerned with the
materiality concept. This possibly misleads researchers into audit quality between a big firm and a
non-big firm. In general, a high level of discretionary accruals indicates a defective audit. For
example, Becker, DeFond, Jiambalvo and Subramanyam’s (1998) US evidence shows that
discretionary accruals of clients audited by a non-big 6 auditor are, on average, 1.5-2.1% of lagged
total assets, higher than those audited by a big 6 auditor. This leads Becker et al. (1998) to conclude
that the reputable big firm has higher quality than other audit firms.
Our study also contributes to the new measure of audit quality. Unlike empirical studies which use
signed or unsigned value of discretionary accruals to measure audit quality, we evaluate audit
quality by using the joint association between level of discretionary accruals and type of audit
reports. We believe that reported earnings containing discretionary accruals do not always indicate
that audit quality is impaired. In case of immaterial discretionary accruals, an auditor can draw an
unqualified opinion even if those immaterial discretionary accruals are not removed. This still
maintains audit quality. In addition we use different level of audit-accepted discretionary accruals
as benchmark to consider audit quality. This helps us distinguish auditors who are more
conservative or flexible from others.
In short, our findings indicate that maintaining its reputation possibly drives a big firm to be more
conservative than a non-big firm and to be perceived as high quality auditor. National level factors
also have a profound influence on audit quality. Although listed companies in weak investor
protection countries are perceived to engage in more earnings management than those in strong

4
investor protection countries, our evidence shows that auditors in weak investor protection
countries are more conservative than those in strong investor protection countries. Our results also
suggest that mandatory audit firm rotation may help promote audit quality since long audit firm
tenure impairs audit quality.
The remainder of this paper is organised as follows. Section 2 provides a summary of previous
studies associated with earnings management and audit quality. Section 3 gives the detail of our
discretionary accruals estimation and probit model. Section 4 documents our sample selection and
data collection. Section 5 reports the results of univariate and multivariate tests. Section 6 provides
the conclusions and implications of our study.
2. Previous studies
2.1 Earnings management
The most widely used definitions of earnings management are Schipper’s (1989) and Healy and
Wahlen’s (1999) definitions. The definitions indicate that a management’s incentive to exercise
earnings management, its intent to influence reported earnings, and its use of judgement in the
financial reporting process are the main criteria for defining an activity as earnings management.
However, these two definitions do not indicate how earnings management is associated with
generally accepted accounting principles (hereafter GAAP), especially whether it is allowed by
GAAP. Therefore it is difficult to distinguish earnings management from a misstatement resulting
from error and/or fraud.
Dechow and Skinner (2000) opine that earnings management is the use of accounting choices
which are allowed by GAAP; conversely, fraudulent accounting is those which do not comply with
GAAP. Managed earnings are earnings which do not result from a neutral treatment but from the
use of aggressive accounting or conservative accounting. In doing so, a management has to alter
5
real events or to choose accounting choices. Adopting conservative or aggressive accounting
practices through purposely selecting accounting estimations and assumptions is far preferable to
through structuring real transactions because, as remarked by Goncharov (2005), operating
earnings management is more costly than accounting earnings management since it affects real
cash flows.
Earnings management techniques are also divided into real operating decisions and pure financial
reporting decisions (Schipper (1989), Peasnell, Pope and Young (2000), Ewert and Wagenhofer
(2005)). Schipper (1989) points out that real earnings management is designed to manage the
timing of decision-making on a company’s investments and production while accounting earnings
management is designed to select accounting techniques allowed by GAAP. Ewert and Wagenhofer
(2005) explain that the management’s interpretation of accounting standards with intent to make
existing standards apply to existing accounting events and transactions and/or with intent to shift
partial earnings between periods, is one form of earnings management. In terms of real earnings
management, manager is required to organise transactions or alter the timing of transactions to
help him/her transform bad news into good news.
The direction of earnings management can be in two directions, income-increasing earnings
management and income-decreasing earnings management. These depend on a management’s
purpose in managing earnings. Empirical studies document that management incentives to achieve
high rewards, to take advantage of specific circumstances and to report desirable numbers are the
major causes of earnings management. For example, in order to maximise bonuses, management’s
decision-making to manage reported earnings upwards or downwards depends on bonus
conditions and the level of pre-managed earnings (Healy (1985) and Guidry, Leone and Rock
(1999)). However he/she tends to reduce reported earnings in order to maximise compensation in

6
the future (McNichols and Wilson (1988)) or to boost future earnings (Nelson, Elliot and Tarpley
(2002)). A management is likely to use income-decreasing earnings management with the aim of
gaining a government assistance and protection (Jones (1991)), deferring earnings to the lower tax
rate period (Guenther (1994)), writing all accruals off before a management’s leaving (Pourciau
(1993)) and decreasing stock price before a management buyout (Perry and Williams (1994)).
He/she however attempts to report earnings upwards so as to increase stock prices before stock-
to-stock mergers (Erickson and Wang (1999) and Louis (2004)). Smoothing reported earnings is
one form of earnings management; it occurs when a management intentionally fights to smooth a
fluctuation of reported earnings (Copeland (1968), Beidleman (1973) and Moses (1987)). It leads a
management to use income-increasing and/or income-decreasing accruals. Avoiding reporting
losses or earnings drops (Burgstahler and Dichev (1997), Park and Shin (2004) and Peasnell et al.
(2005)) and achieving analysts’ forecasts (Burgstahler and Eames (2006)) are also key drivers that
induce a management to engage in income-increasing earnings management.
In sum, earnings management occurs when management intends to alter the neutral reporting
process in order to report what he/she wants, rather than to report neutral earnings. However,
neutral earnings (Dechow and Skinner (2000)) or un-managed earnings (Burgstahler and Dichev
(1997)) or real/true earnings (Copeland (1968)) are difficult to measure and define. This leads to
the problem of how managed earnings are distinguished from neutral earnings. In essence,
discretionary accruals, abnormal accruals or managed accruals are used to estimate managed
earnings.
2.2 Proxy of earnings management
In the accounting process, accruals are naturally generated under the accruals basis. Using this rule,
all transactions must be recorded when they occur although no cash or cash equivalent flows in or
out. This causes a delay between the point of time when transactions are initially recorded and the

7
point of time when cash or cash equivalents are paid or received. It also causes the differences
between the measurement of recognition and the measurement after recognition. A manager can
therefore use his/her judgement in accounting transactions through accruals in order to manage
reported earnings.
Accounting accruals comprise nondiscretionary accruals (unmanaged accruals) and discretionary
accruals (managed accruals). Empirical studies (e.g., Jones (1991), DeFond and Jiambalvo (1994),
McNichols and Wilson (1988), Kim, Chung and Firth (2003), Krishnan (2003), Butler, Leone and
Willenborg (2004) and Maijoor and Vanstraelen (2006)) use discretionary accruals as a proxy of
earnings management. Methodologies used to decompose total accruals into non-discretionary
accruals and discretionary accruals have developed continuously. First discretionary accruals were
predicted by using simple techniques, e.g. the difference between total accruals in a managed
earnings group and median of total accruals in an unmanaged earnings group (Healy (1985)) and
the difference between total accruals in the current period and the prior period (DeAngelo (1986)).
Later regression equations have developed and become the generally accepted methodology, in
particularly the Jones model and the modified Jones Model. The left-hand side variables
(regressands) and the right-hand side variables (regressors) of these two models were later
adjusted by many studies. For example, some studies (e.g., Hribar and Collins (2002), Dechow and
Dichev (2002) and Dechow, Hutton, Kim and Sloan (2010)) proposed new concepts of how to
estimate total accruals (a regressand or Y-variable). Meanwhile, other studies (Kang and
Sivaramakrishnan (1995), Defond, Raghunandan and Subramanyan (2002), Teoh, Welch and Wong
(1998a), Teoh, Welch and Wong (1998b), Dechow and Dichev (2002) and Kothari, Leone and
Wasley (2005) improved the regressors (X-variables) of the models or the econometric
methodologies in order to resolve econometric problems, for example autocorrelation, endogeneity
and omitted variables.

8
Selecting an accruals model that captures discretionary accruals well is still a contentious issue.
Studies that evaluate the performance of existing accruals models still indicate varying results.
Dechow, Sloan and Sweeney (1995) and Batov, Gul and Tsui (2001) believe that one model
(especially the Jones model and the modified Jones model) outperforms others; on the other hand,
McNichols (2000) undermines Dechow et al.’s (1995) findings that the study ignores the
correlation between discretionary accruals estimated by these two models and a long-run earnings
growth. Some studies emphasise the determinants that must be controlled owing to their
correlation with discretionary accruals, e.g., firm performance (Kothari et al. (2005)), cash flows
(Dechow and Dichev (2002)) and long-term growth (McNichols (2000)). Controlling for all these
determinants will lead to stronger findings in future studies of earnings management because it
helps mitigate the omitted variable problem.
2.3 Audit quality
The definition and explanation of audit quality remains open to question. Lu (2006), Gaver and
Paterson (2007), Gul, Fung and Jaggi (2009) and Yu (2011) define audit quality as the auditor’s
detection and correction of misstatements. Gul et al. (2009) believe that not only the auditor but
also management play a prominent role in promoting audit quality. Audit quality can be seen as a
collaboration between auditor and management to correct misstatement. Yu (2011) indicates that
audit quality occurs when an auditor issues a report, which is appropriate in circumstances.
Although empirical studies propose various definitions of audit quality, the Financial Reporting
Council (2006) comments that no perfect definition can be used as a guideline to evaluate real audit
quality. This may be because people close to auditors seem to have different perspectives on audit
quality. As pointed out by the International Auditing and Assurance Standard Board (2011), the

9
level of investors’ and audit committees’ participation in an audit and the criteria they used to
evaluate audit quality lead to different perceptions of audit quality. Consequently, investors
perceive audit quality as observable outcomes (e.g. reputation and auditor report); on the other
hand, audit committee members perceive it as an on-going process.
Audit quality is a subjective concept that is difficult to measure. It remains a central argument in
empirical studies. Discretionary accruals, a proxy of earnings management, are generally used to
measure audit quality (e.g., Jeong and Rho (2004), Carey and Simnett (2006), Maijoor and
Vanstraelen (2006), Piot and Janin (2007) and Reichelt and Wang (2010)). In general a defective
audit is reflected in a high level of discretionary accruals. Other alternative measures of audit
quality are also used, for example the incidence of issuing going-concern auditor reports (Carey and
Simnett (2006) and Reichelt and Wang (2010)), the audited client’s propensity to report earnings
that meet a benchmark (Carey and Simnett (2006)), the results of independent parties’ inspections
of audit firms (Hilary and Lennox (2005)) and the restatement of prior year financial statements
(Kinney, Palmrose and Scholz (2004)).
Empirical studies throw light on the roles of standard setters, regulators, audited entities, auditors
and audit firms in promoting audit quality. Standard setters and regulators take major
responsibility for setting effective regulations and standards and being the controlling and
monitoring parties. Guedhami and Pittman’s (2006) multinational evidence and Yu’s (2011) US
evidence indicate that a harsh penalty is necessary to improve audit quality. The theoretical
econometric-based studies of Chan and Wong (2002) and Patterson and Wright (2003) however
undermine the regulators’ demand for a heavy penalty for audit failure. A change in mechanism to
monitor auditors from professional self-regulation to independent institution-regulation is still a
controversial issue, for example the change in auditors’ controlling and monitoring institution from
10
AICPA to PCAOB in the US. Hilary and Lennox (2005) show that AICPA’s auditors’ inspection still
remains an effective function. Conversely Doogar, Sivadasan and Solomon (2010) point out that the
new standard announced by PCAOB helps improve audit quality.
The audited entity itself also has a profound influence on audit quality, especially the structure of
shareholdings and the characteristics of audit committees. A high concentration of shareholding
indicates that a firm may have low earnings quality (Larcker and Richardson (2004)) because the
dominant shareholders may not be willing to report the truth (Fan and Wong (2002)) and might
wield strong power over an auditor; consequently, investors in this firm requires high audit quality
(Fan and Wong (2005)). Members of audit committees who have experience in corporate
governance (Carcello and Neal (2003)) and are independent of the audited entity (Carcello and Neal
(2000) and Carcello and Neal (2003)) can protect an auditor from management pressure.
Many auditing studies focus on how audit fees, non-audit fees, the auditor-management
relationship, audit tenure, specific industry audit expertise and auditor reputation influence audit
quality. Since regulators are aware of auditor autonomy, auditors are not allowed to provide other
services to their audited clients. Recent evidence however contends that providing a non-audit
service to the same audit client at the same time does not undermine audit independence, but
brings benefits to auditors and/or their clients (Craswell, Stokes and Laughton (2002), DeFond et al.
(2002), Chung and Kallapur (2003), Whisenant, Sankaraguruswamy and Raghunandan (2003),
Kinney et al. (2004)). There is little evidence that supports the view of regulators (Francis and Ke
(2006)).
There is doubt whether long audit tenure leads an auditor to have a close relationship with his/her
client. A close relationship between an auditor and the audited company’s management may cause

11
an auditor to compromise with management and to over-rely on his/her client. This, in turn, can
impair auditor independence and auditor scepticism (Menon and Williams (2004) and Lennox
(2005)). Carcello and Neal (2000) provide US evidence that auditor scepticism is impaired when an
auditor provides an auditing service to one client over a long period of time. This supports the US
regulator’s requirement of periodic auditor rotation. On the contrary, some US evidence indicates
that long audit tenure increases auditors’ ability to detect earnings management (Myers, Myers and
Omer (2003)) and is a subjective indicator that other parties perceive as leading high credibility to
financial information (Mansi et al. (2004) and Ghosh and Moon (2005)).
Possessing specific industry audit knowledge leads audit firms to have a great advantage over
others, for example having a better internal source of client information (Bagnoli, Penno and Watts
(2001)), earning a higher audit fee (Krishnan (2003)) and being a preferable auditor choice
(Chaney, Jeter and Shirakumar (2004)). It also helps an audit firm perform well in the first year
audit when an auditor still lacks a specific knowledge of the new client (Gul, Fung and Jaggi (2009))
and also helps improve audit quality by reducing clients’ discretionary accruals (Reichelt and Wang
(2010)). Specific industry audit knowledge is beneficial not only for audit firms to make themselves
unique, but also for audited entities to promote the quality of disclosure (Dunn and Mayhew
(2004)) and for audit team members to perform a better review process (Owhoso, Messier and
Lynch (2002)).
Most auditing studies categorise audit firms as a big 4/5/6/8 firm or a non-big firm. A big firm is
perceived as a prestigious and reputable auditor. Third parties then give companies audited by a
reputable audit firm more credibility. This leads to a high reliability of loss reserve reported by
property-casualty listed companies that use a big name auditor and a big name actuary together
(Gaver and Paterson(2001)), high ratings for bonds issued by firms that are audited by a big audit
12
firm (Mansi et al. (2004)), and a low cost of capital for newly listed companies that employ a big
audit firm (Pittman and Fortin (2004)). They also have a deep-seated belief that a big firm is of
higher quality than a non-big firm. A big firm is therefore selected by large clients with high audit
fees (Chaney and Philipich (2002)) and by higher quality clients (Bar-Yosef and Sarath (2005)).
There is also evidence that a big firm provides a high quality auditor’s report. Weber and
Willenborg (2003) find that a going-concern audit report rendered by a big firm is a good sign of
high probability that the company will face impending delisting or have poor stock performance.
Weber and Willenborg (2003) also conclude that a big audit firm is more likely to draw a going-
concern opinion to distress clients. Larcker and Richardson (2004) indicate that companies audited
by a big firm report low levels of abnormal accruals because the big firm is aware of its reputation.
Some empirical studies however argue that the big firm does not outperform other firms. It
sometimes allows management to engage in income-decreasing earnings management (Kim et al.
(2003)). The employment of a big firm does not protect minor shareholders from seeing controlling
shareholders extract private benefits at their expense (Guedhami and Pittman (2006)). Audit firms
within a big firm group have varying level of audit quality (Johnson, Khurana and Raynolds (2002),
Krishnan (2003) and Maijoor and Vanstraelen (2006)).
Researchers are not usually allowed to observe audit fieldwork, with the result that they generally
use ex post data of an audit process (e.g., audit report, discretionary accruals) as their measure of
audit quality1. They then seek reasonable measures of these subjective characteristics (e.g. auditor
reputation, audit tenure, specific industry audit knowledge) and employ regression analyses or
theoretical econometric models to infer the causal relationship between these variables and audit
1 There are a small number of recent studies that conduct the experiment with auditors. Tan and Jamal (2001), Jamal and Tan (2001), Wilks (2002), Tan and Trotman (2003), Brazel, Agoglia and Hatfield (2004), Messier, Owhoso and Rakovski (2008) experiment on audit review process. Earley (2001) and Trotman, Wright and Wright (2005) conduct experiment in associated with audit training program. Hyatt and Prawitt (2001) explore the effect of audit firms’ structure on their individual staffs’ performances. Most of these studies’ focus groups are participants only from a big firm in the US.

13
quality. The validity and reliability of their findings depend on how these subjective characteristics
and audit quality are measured2.
2.4 Types of audit firm and earnings management
Recent studies investigate the association between audit quality and earnings management. Their
major aim is to test whether a big firm differs from a non-big firm in terms of audit quality. Audit
quality is measured by the level of discretionary accruals that are a proxy for earnings management.
Becker et al. ’s (1998) US evidence supports the general notion that a big firm is of higher audit
quality than a non-big firm.
Bauwhede et al. (2003), Jeong and Rho (2004) and Piot and Janin (2007) broaden the study to
Belgium, Korea, and France, respectively. Bauwhede et al. (2003) find that, in Belgium, reputable
auditors help mitigate only income-increasing earnings management. Jeong and Rho’s (2004)
Korean sample and Piot and Janin’s (2007) French sample indicate that there is no difference in
audit quality between a big and a non-big auditor. Bauwhede et al. (2003), Jeong and Rho (2004)
and Piot and Janin (2007) believe that their findings contradict the US studies because the
economic and auditing environment in Belgium, Korea and France significantly differ from the US.
The differences are, for instance, the legal systems, the accounting and auditing systems, low
demand for high audit quality, a low incidence of regulatory inspection, and a low risk of auditor
litigation. Maijoor and Vanstraelen (2006) provide comparative evidence for France, the UK and
2 A major drawbacks of quantitative analysis is how to measure testing variables, for example how to identify an audit firm that possesses specific industry audit knowledge. Krishnan (2003) labels an audit firm as a specialist in an industry if its portfolio of that industry is top-three or its market shares exceeds 15% of all firms. However, 20% of market share is the minimum percentage for identifying an industry expertise in the study of Dunn and Mayhew (2004). Gul et al. (2009) describe an audit industry expertise as an audit firm who has the greatest market shares of that industry. Reichelt and Wang (2010) use two definitions to label an audit firm as national (city) audit industry specialist. The first definition is an audit firm whose market share is at least 10% point higher than the second rank of national (city) market. The second definition is an audit firm whose market share is greater than 30% of the national market (50% of the city market). The different cut-off point leads these studies to have different findings.

14
Germany. They highlight that a strict audit environment, instead of audit firm type, can reduce the
magnitude of managed accruals.
Major drawbacks of these studies are that Becker et al.’s (1998) and Maijoor and Vanstraelen’s
(2006)) testing equations generate a low adjusted 𝑅2. Bauwhede et al. (2003) and Jeong and Rho
(2004) have small sample size. In addition, there is the difference in their methods to estimate
discretionary accruals and the importance of their decisions on whether to use signed or unsigned
discretionary accruals as a dependent variable. To compute total accruals, Becker et al. (1998) use
cash flow approach; meanwhile, the remainder uses balance sheet approach. To estimate
discretionary accruals, Becker et al. (1998) and Piot and Janin (2007) use the Jones model while
Jeong and Rho (2004) use the modified Jones model. Bauwhede et al. (2003) use the DeAngelo
model; meanwhile, Maijoor and Vanstraelen (2006) develop their own model. Becker et al. (1998)
and Bauwhede et al. (2003) test signed value of discretionary accruals. Piot and Janin (2007) test
both signed and unsigned value of discretionary accruals while Jeong and Rho (2004) test both
signed value of discretionary accruals and change in discretionary accruals.
The use of signed or unsigned discretionary accruals to indicate the difference in audit quality
between a big firm and a non-big firm is likely to be problematic. For example Becker et al. (1998)
find that discretionary accruals of clients audited by a non-big 6 auditor are, on average, 1.5-2.1%
of lagged total assets, higher than those audited by a big 6 auditor. This leads Becker et al. (1998) to
conclude that the reputable big firm has higher quality than other audit firms. Reported earnings
containing discretionary accruals do not always indicate that audit quality is impaired. In case of
immaterial discretionary accruals, the auditor can draw an unqualified opinion even if those
immaterial discretionary accruals are not removed. This still maintains audit quality.
15
3. Methodology
3.1 The estimation of discretionary accruals
Similar to empirical studies (e.g., Johnson et al. (2002), Kim et al. (2002), Myers et al. (2003),
Krishnan, (2003), Maijoor and Vanstraelen (2006), Poit and Janin (2007)), in our study,
discretionary accruals are a numeric measure of earnings management and audit quality. The
estimation is performed by the cross-sectional version of the Jones (1991) model which has
generally been used in earnings management studies (e.g., DeFond and Subramanyam (1998),
Becker et al. (1998), Krishnan (2003), Myers et al. (2003) and Piot and Janin (2007)). The
coefficients are separately estimated for each two digit SIC code and for each year. The fitted value
is non-discretionary accruals; on the other hand, the error term is discretionary accruals. The
cross-sectional version of the Jones (1991) model to estimate discretionary accruals is3:
𝑇𝐴𝑖𝑗𝑡𝐴𝑖𝑗𝑡−1
= 𝛼𝑗𝑡𝐴𝑖𝑗𝑡−1
+ 𝛽1𝑗𝑡∆𝑅𝐸𝑉𝑖𝑗𝑡𝐴𝑖𝑗𝑡−1
+ 𝛽2𝑗𝑡𝑃𝑃𝐸𝑖𝑗𝑡𝐴𝑖𝑗𝑡−1
+ 𝑒𝑖𝑗𝑡 , (1)
where:
𝑇𝐴𝑖𝑗𝑡 = total accruals for firm 𝑖 in industry 𝑗 in year 𝑡 which is defined as the
difference between net income and operating cash flows;
∆𝑅𝐸𝑉𝑖𝑗𝑡 = revenues in year 𝑡 less revenues in year 𝑡 − 1 for firm 𝑖 in industry 𝑗;
𝑃𝑃𝐸𝑖𝑗𝑡 = gross property, plant and equipment for firm 𝑖 in industry 𝑗 in year 𝑡;
𝐴𝑖𝑗𝑡−1 = total assets for firm 𝑖 in industry 𝑗 in year in year 𝑡 − 1;
𝑒𝑖𝑗𝑡 = error term for firm 𝑖 in industry 𝑗 in year 𝑡 which consists of 𝑢𝑖 and 𝜀𝑖𝑡, 𝑢𝑖is
3 The modified version of Jones model developed by Dechow, Sloan and Sweeney (1995) are also capture well discretionary accruals (Dechow et al. (1995) and Bartov et al. (2001)) and are used in many studies (e.g., Johnson et al. (2002), Chung and Kallapur (2003) , Larcker and Richardson (2004) and Reichelt and Wang (2010)). The model’s assumption is that a management manipulates revenue recognitions of credit sale in the event period. Change in accounts receivable (∆𝐴𝑅𝑡) is then included in the original Jones model only for the event period. We assume that earnings management is randomly occurred; therefore, the event period is not defined. The Jones (1991) model is preferable than its modified versions.

16
firm 𝑖’s time-invariant component and 𝜀𝑖𝑡 is firm 𝑖’s remainder component
in year 𝑡 ;
𝛽1𝑗𝑡,𝛽2𝑗𝑡 = estimators for industry 𝑗 in year 𝑡;
𝛼𝑗𝑡 = intercept for industry 𝑗 in year 𝑡;
𝑖 = 1,…,I firm index;
𝑡 = 1,…,𝑇𝑡,year index for which ranges from 1 to 19 years;
𝑗 = 1,…,J industry index (two-digit SIC code level).
The estimators are separately estimated for each two digit SIC code level in each year. In other
words, the cross-sectional model estimates discretionary accruals based on each industry’s
benchmark. The prediction of discretionary accruals is:
�̂�𝑖𝑗𝑡 = 𝑇𝐴𝑖𝑗𝑡𝐴𝑖𝑗𝑡−1
− � 𝛼�𝑗𝑡𝐴𝑖𝑗𝑡−1
+ �̂�1𝑗𝑡∆𝑅𝐸𝑉𝑖𝑗𝑡𝐴𝑖𝑗𝑡−1
+ �̂�2𝑗𝑡𝑃𝑃𝐸𝑖𝑗𝑡𝐴𝑖𝑗𝑡−1
�. (2)
3.2 Test procedures
Discretionary accruals predicted by equation (2) are then used to consider audit quality in equation
(3). Our study uses a probit model4 to test the association between audit quality and earnings
management. Focusing only on statistical tests without being concerned with the materiality
concept5 might lead to misleading findings, for example the study of Becker et al. (1998). We then
apply the materiality concept to our model. The probit model is:
4 The probit model and logit model have developed in auditing research as in other empirical areas. Kim et al. (2003) developed a probit model which predicted the probability that the client selects a big firm. Carey and Simnett (2006) and Reichelt and Wong (2010) use a logit model to predict the likelihood that an auditor issues a going-concern report. Butler et al. (2004) also use a logit regression to predict the probability of an auditor drawing a clean or unclean opinion. 5 The word “materiality” is one of the most important terms of the phase “present fairly, in all material respects” on the standard pattern of auditor report. As noted by Porter et al. (2008), it is one of the key concepts in the auditing process. ISA 320: “Materiality in Planning and Performing an Audit” defines materiality based on the definition that was provided by the IASB’S Conceptual Framework for Financial Reporting. In the context of an auditor, information is considered to be material if its incorrectness or omission, in itself or overall, is able to affect decisions made by using this information.

17
Pr (𝐴𝑢𝑑𝑄𝑢𝑎)𝑖𝑡 = 𝛼 + 𝛽1𝐴𝑢𝑑𝑅𝑎𝑛𝑘𝑖𝑡 + 𝛽2𝑇𝑒𝑛𝑢𝑟𝑒𝑖𝑡 + 𝛽3𝐶ℎ𝑎𝑛𝑔𝑒𝐴𝑢𝑑𝑖𝑡 + 𝛽4𝑅𝑂𝐴𝑖𝑡 + 𝛽5𝐷𝑡𝑜𝐸𝑖𝑡 +
𝛽6𝑛𝑎𝑡𝑇𝐴𝑖𝑡 + 𝛽7−10𝐼𝑛𝑣𝑅𝑎𝑛𝑘 + 𝑣𝑖𝑡, (3)
where:
𝐴𝑢𝑑𝑄𝑢𝑎𝑖𝑡 = audit quality for firm 𝑖 in year 𝑡; (see definition below)
𝐴𝑢𝑑𝑅𝑎𝑛𝑘𝑖𝑡 = the rank of audit firm type for firm 𝑖 in year 𝑡 which is equal to 1 if the
audit firm type is a big firm and 2 if the audit firm type is a non-big firm ;
𝐶ℎ𝑎𝑛𝑔𝑒𝐴𝑢𝑑𝑖𝑡 = a dummy variable which is equal to 1 if firm 𝑖 in year 𝑡 switches audit
firm type, 0 otherwise,
𝑇𝑒𝑛𝑢𝑟𝑒𝑖𝑡 = the number of consecutive years for which audit firms within the same
type were employed as the listed company’s auditor for firm 𝑖 at year 𝑡;
𝑅𝑂𝐴𝑖𝑡 = return on assets for firm 𝑖 in year 𝑡 which is the CRSP/Compustat item
𝑅𝑂𝐴 or is computed as [𝑛𝑒𝑡 𝑖𝑛𝑐𝑜𝑚𝑒𝑖𝑡 (𝐼𝐵) 𝑡𝑜𝑡𝑎𝑙 𝑎𝑠𝑠𝑒𝑡𝑠 𝑖𝑡(𝐴𝑇)]⁄ 𝑥100;
𝐷𝑡𝑜𝐸𝑖𝑡 = debt to equity ratio which is computed as [𝑙𝑜𝑛𝑔 − 𝑡𝑒𝑟𝑚 𝑑𝑒𝑏 𝑖𝑡(𝐷𝐿𝑇𝑇) +
𝑐𝑢𝑟𝑟𝑒𝑛𝑡 𝑝𝑜𝑟𝑡𝑖𝑜𝑛 𝑜𝑓 𝑙𝑜𝑛𝑔 − 𝑡𝑒𝑟𝑚 𝑑𝑒𝑏𝑡 𝑖𝑡(𝐷𝐷1)] /
𝑡𝑜𝑡𝑎𝑙 𝑠𝑡𝑜𝑐𝑘ℎ𝑜𝑙𝑑𝑒𝑟𝑠′𝑒𝑞𝑢𝑖𝑡𝑦𝑖𝑡 (𝑆𝐸𝑄);
𝑛𝑎𝑡𝑇𝐴𝑖𝑡 = a natural logarithm of total assets for firm 𝑖 in year 𝑡;
𝐼𝑛𝑣𝑅𝑎𝑛𝑘 = the rank of level investor protection;
𝑣𝑖𝑡 = unspecific random effects for firm 𝑖 in year 𝑡;
Judgements are the crucial factor in considering materiality in terms of its size, nature, and effects on the users of financial statements. ISA 320 also identifies two levels of materiality: materiality for the overall financial statements and materiality for specific classes of transactions, account balances or disclosure. In considering materiality for the overall financial statements, an auditor has to exercise professional judgement in setting a percentage of material level and in selecting benchmark. The benchmark is, for example, the component of the financial statements (e.g., assets, liabilities or equity); the items that are the focus of financial statement users (e.g., profit, revenue or net assets); and so on. The second level is for a specific area where an auditor is aware of its potential influence on the decision made by the users of financial statements.

18
𝑖 = 1,…,I firm index;
𝑡 = 1,…,𝑇𝐼 , year index which allows unbalanced panel data.
𝑨𝒖𝒅𝑸𝒖𝒂 is defined by the joint association between audit accepted level of discretionary accruals
and type of audit opinion. Audit accepted level of discretionary accruals (𝐴𝑐𝑐𝑒𝑝𝑡𝑒𝑑𝐷𝐴) is used to
test the extent to which auditors in different types of audit firm and in different countries can
tolerate discretionary accruals. We use 𝐴𝑐𝑐𝑒𝑝𝑡𝑒𝑑𝐷𝐴 as the benchmark to evaluate audit quality6. It
runs from 0.5% to 1%, 2.5%, 5%, 7.5%, 10%, 20% and 30%. A low level of the benchmark helps
indicate an auditor who is more conservative; a high-level one helps distinguish an auditor who is
more flexible.
Next, the comparison between absolute value of discretionary accruals ∣ 𝐷𝐴𝑖𝑡 ∣and 𝐴𝑐𝑐𝑒𝑝𝑡𝑒𝑑𝐷𝐴 is
performed. This is to indicate whether the difference is over (𝑂𝑣𝑒𝑟𝑖𝑡) or under (𝑈𝑛𝑑𝑒𝑟𝑖𝑡) the
𝐴𝑐𝑐𝑒𝑝𝑡𝑒𝑑𝐷𝐴 . 𝑂𝑣𝑒𝑟𝑖𝑡 is [∣ 𝐷𝐴𝑖𝑡 ∣ −𝐴𝑐𝑐𝑒𝑝𝑡𝑒𝑑𝐷𝐴] > 0 ,on the other hand, 𝑈𝑛𝑑𝑒𝑟𝑖𝑡 is [∣ 𝐷𝐴𝑖𝑡 ∣
−𝐴𝑐𝑐𝑒𝑝𝑡𝑒𝑑𝐷𝐴] < 0 .
𝐴𝑢𝑑𝑄𝑢𝑎𝑖𝑡 is finally coded by the joint relation between type of audit opinion and 𝑂𝑣𝑒𝑟𝑖𝑡/𝑈𝑛𝑑𝑒𝑟𝑖𝑡.
Similar to empirical studies (e.g., Butler et al. (2004) and Johl, Jubb and Houghton (2007)) an audit
opinion is classified as a clean or an unclean opinion. 𝐶𝑙𝑒𝑎𝑛𝑖𝑡 refers to clean opinion and
𝑈𝑛𝐶𝑙𝑒𝑎𝑛𝑖𝑡is for other opinions. 𝐴𝑢𝑑𝑄𝑢𝑎𝑖𝑡 is equal to 0 if 𝑂𝑣𝑒𝑟𝑖𝑡& 𝐶𝑙𝑒𝑎𝑛𝑖𝑡 or 𝑈𝑛𝑑𝑒𝑟𝑖𝑡&𝑈𝑛𝐶𝑙𝑒𝑎𝑛𝑖𝑡;
and 1 if 𝑈𝑛𝑑𝑒𝑟𝑖𝑡& 𝐶𝑙𝑒𝑎𝑛𝑖𝑡 or 𝑂𝑣𝑒𝑟𝑖𝑡&𝑈𝑛𝐶𝑙𝑒𝑎𝑛𝑖𝑡. Audit quality is impaired if discretionary accruals
6 Selecting the percentages and benchmarks for setting materiality is problematic in practice. Porter et al. (2008) conducted surveys of Big 4 and three middle-tier firms in New Zealand in 2007. 0.5%-3% of sales were normally used as level of materiality followed by 5%-10% of net profit before tax, 1%-10% of shareholders’ funds and 0.25%-2% of total assets. Nelson, Smith and Palmrose (2005) used the percentage of pre-tax net income as the level of materiality to conduct an experiment on auditors’ adjustment decisions in the US. The study in Australia conducted by Errol and Takiah (2000) used the percent effect of net profit as a level of materiality. We however use the percentage of lagged total assets as the benchmark of materiality. This is because the accrual model that is used to estimate discretionary accruals scales all variables by the beginning year total assets.

19
are over an acceptable level but audit opinion is clean or discretionary accruals are under a
benchmark but audit opinion is unclean.
𝑨𝒖𝒅𝑹𝒂𝒏𝒌 investigates the deep-seated belief that a reputable big firm has higher audit quality
than other audit firms. Becker et al.’s (1998) US evidence supports this generally accepted belief,
however, recent findings have questioned it. The non-US evidence of Bauwhede et al. (2003), Jeong
and Rho (2004), Piot and Janin (2007), and Maijoor and Vanstraelen (2006) indicates that there is
no difference in audit quality between a big firm and a non-big firm and that a big firm does not
help reduce earnings management.
Johnson et al. (2002) and Krishnan (2003) point out that there are different levels of audit quality
within a big audit firm. A big audit firm sometimes allows management to engage in income-
decreasing earnings management (Kim et al. 2003). These contradictory findings have raised
doubts about the association among audit firm type, audit quality and earnings management.
𝑪𝒉𝒂𝒏𝒈𝒆𝑨𝒖𝒅 tests the effect of switching audit firm type on audit quality. Becker et al. (1998) and
Kim et al. (2003) use two dummy variables to indicate whether it is the first or last year audit. Kim
et al. (2003) found that discretionary accruals are significantly negative before changing audit firm
type. Jeong and Rho (2004) however report an insignificant effect of switching from a big firm to a
non-big firm and vice versa on discretionary accruals in Korea. Switching audit firm can increase
the risk of new auditors misreporting because they lack specific knowledge of new clients.
𝑻𝒆𝒏𝒖𝒓𝒆 reflects the relation between auditor and audited entity. Audit tenure is one of the most
controversial issues in the study of discretionary accruals. Rather than causing damage to an
auditor’s independence, scepticism and even audit quality as regulators’ and standard setters’
believe, long audit firm tenure helps improve audit quality by increasing auditors’ ability to detect

20
earnings management (Myers et al. (2003)). It is a subjective indicator that other parties use to
label high credibility of financial information (Mansi et al. (2004) and Ghosh and Moon (2005)).
These positive findings were formed by testing US observations where investors have high
protection. We will provide evidence indicating the impact of audit firm tenure on earnings
management in the context of Southeast Asia where each country has a different level of investor
protection.
𝑹𝑶𝑨 is to control the effect of firm performance on discretionary accruals as found by Kothari et al.
(2005). Kothari el al. (2005) add Return On Assets into the original Jones model and the modified
Jones model. However, rather than using gross property, plant, and equipment, the models define
𝑃𝑃𝐸𝑖𝑡 as net property, plant, and equipment. This possibly leads to subtle results in the comparison
between the original models and the performance-matched accrual models. Similar to Reichelt and
Wang (2003), controlling firm performance by ROA helps gain more understanding of the
association between audit quality and earnings management. We also use ROA to indicate whether
the audited companies are facing a going-concern problem. A negative ROA resulting from a huge
loss may lead an auditor to issue an unclean opinion even if an audited company reports a low level
of discretionary accruals.
𝑫𝒕𝒐𝑬 helps control for the effect of leverage on discretionary accruals. Becker et al. (1998) and
Jeong and Rho (2004) conclude that financially distressed firms have an incentive to reduce
reported earnings in order to take advantage of renegotiating debt agreements. However,
Bauwhede et al. (2003) and Maijoor and Vanstraelen (2006) do not find the association between
leverage and the study’s indicator of earnings management. Krishnan (2003) and Poit and Janin
(2007) show mixed results. Bauwhede et al. (2003), Maijoor and Vanstraelen (2006) and Poit and

21
Janin (2007) use debt-to-equity ratio as the measure of leverage while Becker et al. (1998) and
Jeong and Rho (2004) use a dummy variable to distinguish high leverage firms from other firms.
The relation between leverage and discretionary accruals depends on the measurement of leverage,
Y-variable (signed value or absolute value) and accrual models that the studies use. We define
leverage as debt-to-equity ratio because the use of a dummy variable to distinguish high leverage
firms from other firms might suffer from an inappropriate cut-off point. We define the debt-to-
equity ratio as the sum of long-term debt and its current portion divided by stockholders’ equity. A
high debt-to-equity ratio or a negative debt-to-equity ratio may be a sign that an audited company
is suffering from going-concern problem.
𝒏𝒂𝒕𝑻𝑨 is the natural logarithm of total assets and is controlled for because empirical studies are
concerned with the effect of firm size on accrual choice (e.g., Johnson et al. (2002), Kim et al. (2002),
Myers et al. (2003), Krishnan (2003), Maijoor and Vanstraelen (2006), and Poit and Janin (2007)).
These studies however provide contradictory findings. Krishnan (2003), Maijoor and Vanstraelen
(2006) and Poit and Janin (2007) report a negative relationship between natural log of total assets
and their dependent variable. Maijoor and Vanstraelen (2006) conclude that large companies
engage less in earnings management.
Bauwhede et al. (2003) and Jeong and Rho (2004) find a positive correlation between natural log of
total assets and discretionary accruals. Jeong and Rho (2004) point out that large firms have a
higher propensity to engage in income-increasing earnings management than small firms. However,
the study of Becker et al. (1998) does not find a relation between natural logarithm of total assets
and a signed value of discretionary accruals.

22
These different results may be due to the use of different measures of earnings management
(signed value or absolute value of discretionary accruals), the different methods used to estimate
discretionary accruals and the different test procedures.
𝑰𝒏𝒗𝑹𝒂𝒏𝒌 indicates the extent to which investor protection has an impact on discretionary accruals.
Leuz, Nanda and Wysocki (2003) find that firms in high level investor protection countries (e.g.,
Singapore, Malaysia) have low level of earnings management, but, by contrast, those in low level
investor protection countries (e.g., Thailand, Indonesia, the Philippines) have high level of earnings
management. In order to compare the impacts of investor protection on discretionary accruals
between countries, we put the rank of investor protection in the model.
We however use the current rank of investor protection published by the project under the World
Bank organisation. The level of investor protection is considered by the regulations related to the
information disclosure, the director liability, and the shareholder lawsuit. In this region, Singapore
has the highest investor protection, followed, in order, by Malaysia, Thailand, Indonesia and the
Philippines (Doing Business (2012) 7.
4. Sample selection and data collection
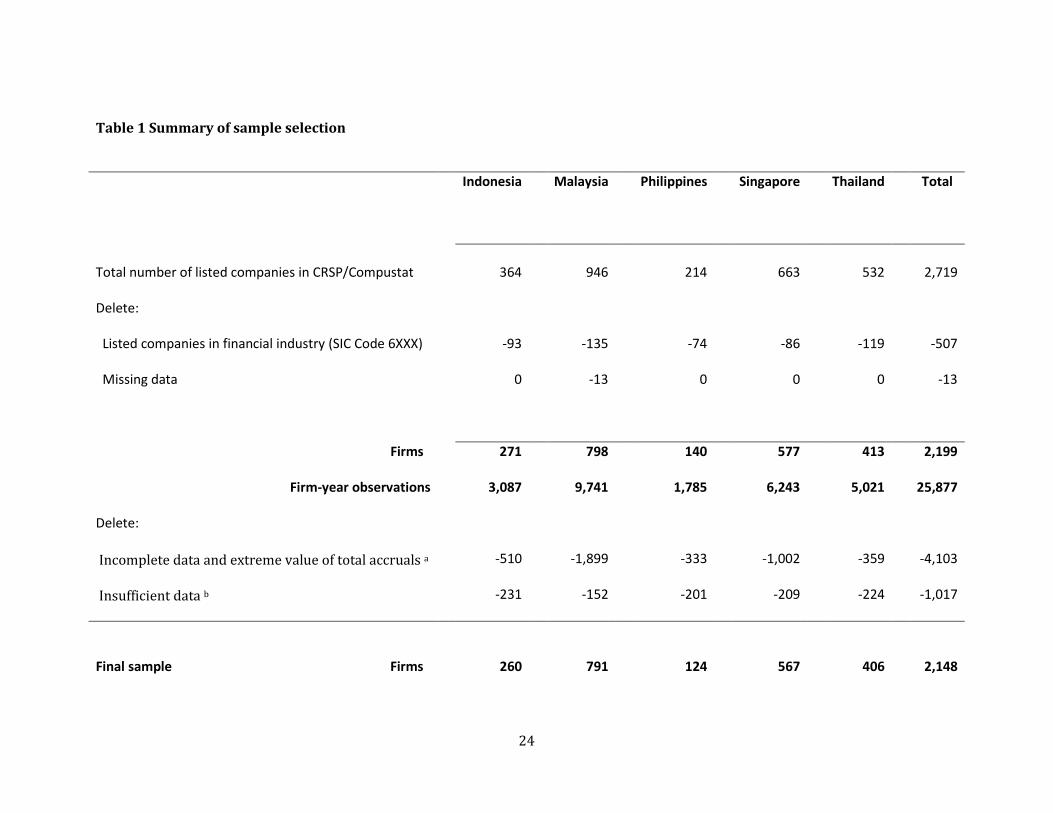
The initial sample is from the CRSP/Compustat database. As presented in table 1, the list includes
2,199 non-financial firms (25,889 firm-year observations) incorporated in Indonesia, Malaysia, the
Philippines, Singapore or Thailand. Companies in the financial industry are excluded in our study.
Being strictly controlled by regulations and governments causes these companies to have a
different environment for engaging in earnings management from other industries. In addition, as
7 The project is under the World Bank. The level of investment protection here is as of August 2012 and we assume that there is insignificant change of it over 1993-2011.

23
noted by Becker et al. (1998) and DeFond and Subramanyam (1998), the computation of
discretionary accruals for financial companies is still problematic.
Data on the companies’ auditors, data that is used to compute total accruals and predict
discretionary accruals, and data that is treated as control variables and testing variables is also
exported from the CRSP/Compustat database. The initial sample data covers the period from 1992
to 20118. The longest contiguous time-series for each firm is included in the analyses. Missing data
results in us dropping some firm-year observations. The number of final sample is 2,148 firms
(20,757 firm-year observations).
8 The data of Indonesia, Malaysia, the Philippines, Singapore and Thailand exists from 1992 onwards except for the item of cash flow from operations which have been provided since 1994.
24
Table 1 Summary of sample selection
Indonesia
Malaysia
Philippines
Singapore
Thailand
Total
Total number of listed companies in CRSP/Compustat
364
946
214
663
532
2,719
Delete:
Listed companies in financial industry (SIC Code 6XXX)
-93
-135
-74
-86
-119
-507
Missing data
0
-13
0
0
0
-13
Firms
271
798
140
577
413
2,199
Firm-year observations
3,087
9,741
1,785
6,243
5,021
25,877
Delete:
Incomplete data and extreme value of total accruals a
-510
-1,899
-333
-1,002
-359
-4,103
Insufficient data b
-231
-152
-201
-209
-224
-1,017
Final sample Firms
260
791
124
567
406
2,148

25
Firm-year observations 2,346 7,690 1,251 5,032 4,438 20,757
Note:
a Incomplete data refers to missing data in CRSP/Compustat and includes extreme values of total accruals. Extreme value of total accruals is observations with
absolute values of total accruals divided by lagged total assets, which are greater than five. We consider them as outliers and exclude them.9
b Insufficient data refers to observations that do not have sufficient data for computation of discretionary accruals and observations that create gaps in the data.
9 Empirical studies used different criteria for defining outliers, for example, the top and bottom of 1 % of the distribution of all variables (Johnson et al. (2002)), the top or bottom 0.5 % of the distribution of operating cash flows (Myers et al. (2003)), the absolute value of total accruals scaled by lagged total assets being greater than 1 (Kothari e al. (2005)), and the top and bottom 1 % of unexpected accruals (Maijoor and Vanstraelen (2006)). How to define outliers depends on the study’s data and objectives and the accrual outliers observed. By scanning for outliers, we found that change in audit type is sometimes followed by an extreme value of accruals.

26
5. Empirical results
5.1 Descriptive statistics
5.1.1 Audit firm selection
As shown in Figure 1, non-big firms are more selected by listed companies in Indonesia,
Malaysia, the Philippines, Singapore and Thailand. 70% of 25,714 firm-year observations
were audited by this type of auditor. A high number of observations audited by a non-big
firm in the Philippines (88%), Thailand (80%), and Indonesia (72%) indicate that non-big
firms are particularly preferred in these countries. However, the gap between the
proportion of observations audited by non-big firm and those audited by a big firm in
Malaysia (66%: 34%) and Singapore (62%: 38%) is smaller.
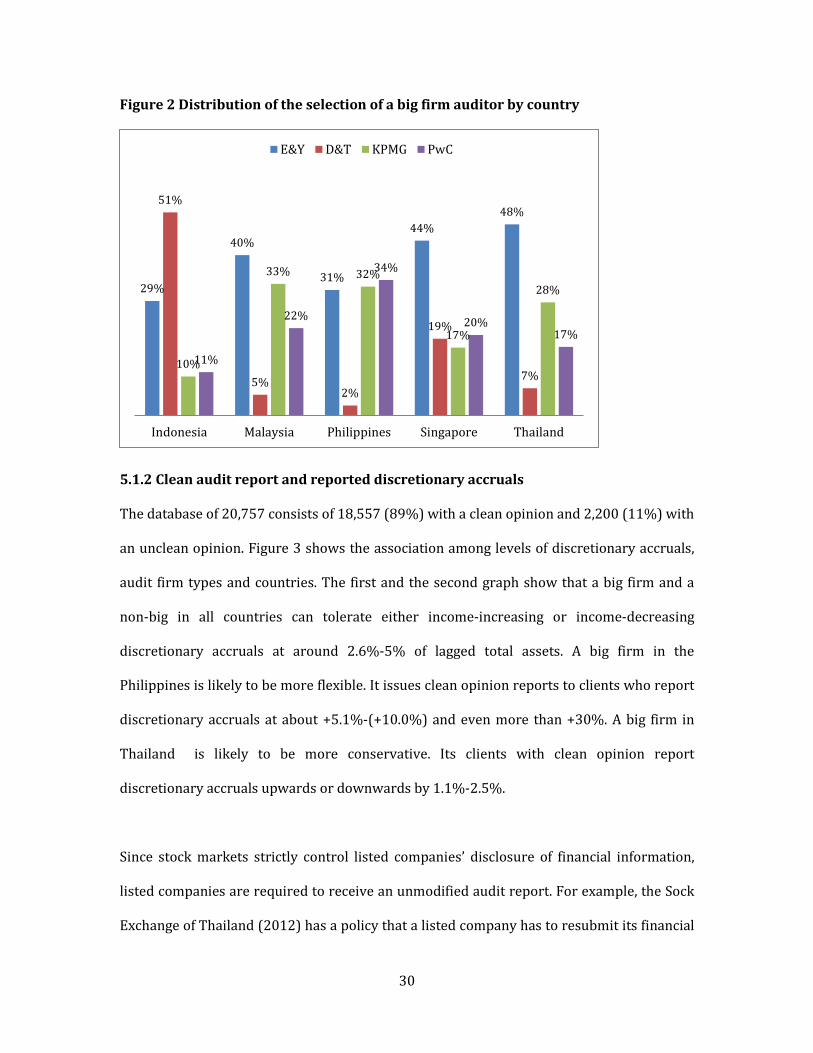
From Figure 2, the distribution of the usage big firm auditors by country points to the fact
that the selection of a big firm differs. E&Y are more selected in Malaysia, Singapore, the
Philippines and Thailand while D&T is the preferred choice in Indonesia. PwC and KPMG
are also more selected in the Philippines.
The large proportion of those selecting a non-big firm in the Philippines, Thailand, and
Indonesia implies that listed companies in low level investor protection countries are more
likely to employ a non-big firm as their auditor. On the other hand, those in high-level
protection countries are more willing to select a big firm. One should be however aware
that individual firm’s decision-making on auditor choice is also affected by other factors, for
example political concerns, the credibility of financial statements (Guedhamiand et al.
(2009)) and a small group of big shareholders (Fan and Wong (2005)).
A high concentration of listed companies’ choosing only one big firm raises doubt as to
whether the individual big firms in each country are really perceived to be different from

27
each other. This is similar to Maijoor and Vanstraelen’s (2006) findings that individual big
firms in the UK, France and Germany are different from one other and even the same big
firm but in different countries. This possibly undermines the assumption that big firms are
homogenous in term of audit quality in empirical studies.

28
Figure 1 Distribution of audit firms
28% 34%
12%
38%
20%
72% 66%
88%
62%
80%
Indonesia Malaysia Philippines Singapore Thailand
Big Firm Non-Big Firm
841
2,188
Indonesia Big Firm Non-Big Firm
3,298
6,389
Malaysia Big Firm Non-Big Firm
215
1,551
Philippines Big Firm Non-Big Firm

29
2,392
3,822
Singapore Big Firm Non-Big Firm
1,008
4,010
Thailand Big Firm Non-Big Firm
30
Figure 2 Distribution of the selection of a big firm auditor by country
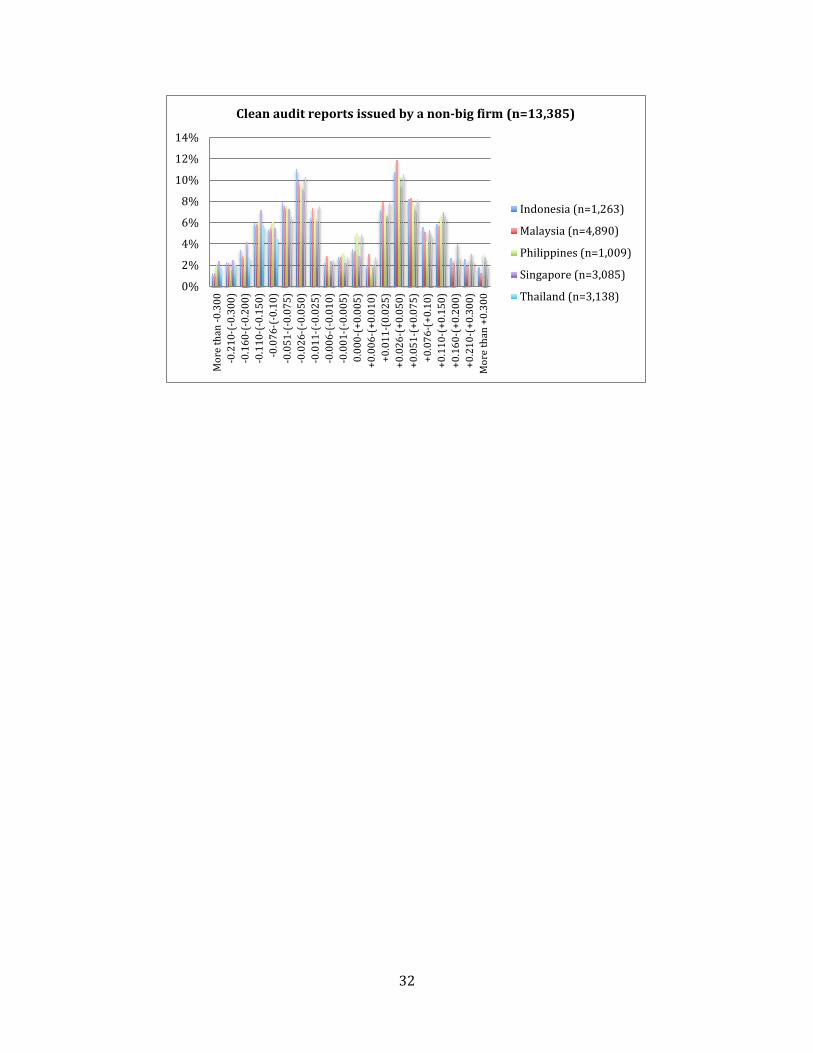
5.1.2 Clean audit report and reported discretionary accruals
The database of 20,757 consists of 18,557 (89%) with a clean opinion and 2,200 (11%) with
an unclean opinion. Figure 3 shows the association among levels of discretionary accruals,
audit firm types and countries. The first and the second graph show that a big firm and a
non-big in all countries can tolerate either income-increasing or income-decreasing
discretionary accruals at around 2.6%-5% of lagged total assets. A big firm in the
Philippines is likely to be more flexible. It issues clean opinion reports to clients who report
discretionary accruals at about +5.1%-(+10.0%) and even more than +30%. A big firm in
Thailand is likely to be more conservative. Its clients with clean opinion report
discretionary accruals upwards or downwards by 1.1%-2.5%.
Since stock markets strictly control listed companies’ disclosure of financial information,
listed companies are required to receive an unmodified audit report. For example, the Sock
Exchange of Thailand (2012) has a policy that a listed company has to resubmit its financial
29%
40%
31%
44% 48%
51%
5% 2%
19%
7% 10%
33% 32%
17%
28%
11%
22%
34%
20% 17%
Indonesia Malaysia Philippines Singapore Thailand
E&Y D&T KPMG PwC

31
statements within 180 days if its auditor draws a qualified opinion, an opinion indicating
that the scope of audit work is limited by management or an adverse opinion. If the
company does not comply it may be listed. The magnitude of discretionary accruals at about
2.5%-5% of lagged total assets for either increasing or decreasing earnings is likely to be
acceptable for a big firm and a non-big firm in all countries; however, there are other factors
that also alter audit opinion (e.g., the going concern problem, material uncertainty and
accounting change)10. Our findings here also provide evidence that a big firm and a non-big
firm in different countries have different reactions toward a different level of earnings
management.
Figure 3 Distribution of discretionary accruals reported by observations that
received clean audit report and is categorised by audit firm type and country
10 Butler, Jeone and Willenborg (2004) report that 47% of 7,079 US modified opinions during 1994-1999 were unqualified opinions with explanatory language about some accounting change and 41% were unqualified opinions with going-concern paragraphs. This indicates that the going-concern issue leads an auditor to consider drawing an unclean opinion. Although an audited company reports a small level of discretionary accruals, an auditor still issues an unqualified audit report if there is an indication that the company is facing a going-concern problem.
0%2%4%6%8%
10%12%14%
Mor
e th
an -0
.300
-0.2
10-(
-0.3
00)
-0.1
60-(
-0.2
00)
-0.1
10-(
-0.1
50)
-0.0
76-(
-0.1
0)-0
.051
-(-0
.075
)-0
.026
-(-0
.050
)-0
.011
-(-0
.025
)-0
.006
-(-0
.010
)-0
.001
-(-0
.005
)0.
000-
(+0.
005)
+0.0
06-(
+0.0
10)
+0.0
11-(
0.02
5)+0
.026
-(+0
.050
)+0
.051
-(+0
.075
)+0
.076
-(+0
.10)
+0.1
10-(
+0.1
50)
+0.1
60-(
+0.2
00)
+0.2
10-(
+0.3
00)
Mor
e th
an +
0.30
0
Clean audit reports issued by a big firm (n=5,172)
Indonesia (n=295)
Malaysia (n=2,425)
Philippines (n=90)
Singapore (n=1,733)
Thailand (n=629)
32
0%
2%
4%
6%
8%
10%
12%
14%
Mor
e th
an -0
.300
-0.2
10-(
-0.3
00)
-0.1
60-(
-0.2
00)
-0.1
10-(
-0.1
50)
-0.0
76-(
-0.1
0)-0
.051
-(-0
.075
)-0
.026
-(-0
.050
)-0
.011
-(-0
.025
)-0
.006
-(-0
.010
)-0
.001
-(-0
.005
)0.
000-
(+0.
005)
+0.0
06-(
+0.0
10)
+0.0
11-(
0.02
5)+0
.026
-(+0
.050
)+0
.051
-(+0
.075
)+0
.076
-(+0
.10)
+0.1
10-(
+0.1
50)
+0.1
60-(
+0.2
00)
+0.2
10-(
+0.3
00)
Mor
e th
an +
0.30
0
Clean audit reports issued by a non-big firm (n=13,385)
Indonesia (n=1,263)
Malaysia (n=4,890)
Philippines (n=1,009)
Singapore (n=3,085)
Thailand (n=3,138)

33
5.2 Univariate tests
5.2.1 Audited by a big firm or a non-big firm
The results of parametric t-statistics for test of differences in means and nonparametric
Wilcoxon z-test for test of differences in medians between groups of observations audited
by a big firm (6,221) and those audited by a non-big firm (14,536) are shown in Table 2.
There is evidence that observations audited by a big firm report discretionary accruals (DA
hereafter) less than those audited by a non-big firm. Mean DA (p-value 0.05) and mean |DA|
(p-value 0.01) of a non-big firm’s clients are greater than a big firm’s clients: and the
possibility that median |DA| of a non-big firm’s clients is greater than a big firm’s clients is
0.518. On average, a non-big firm’s clients report DA by +0.1% of lagged total assets while a
big firm’s clients report DA by -0.3%. Mean (median) |DA| is 8.7% (5.4%) for a non-big
firm’s clients and 8% (5%) for a big firm’s clients. This supports the empirical findings that
a big firm’s clients report discretionary accruals less than a non-big firm’s clients (e.g.,
Becker et al. (1998) and Larcker and Richardson (2004)).
Those of mean and median AudOpi, Tenure and natTA of a non-big firm’s clients are greater
than a big firm’s clients at p-value 0.01. This indicates that a non-big firm is more likely to
issue clean audit reports than a big firm and can maintain its clients. Its clients are also
larger in size measured by a natural logarithm of total assets. A non-big firm’s clients have
high dispersion and a wide range of performance measured by ROA and financial leverage
measured by debt-to-equity ratio. Mean and median InvPro of a big firm’s clients are
greater than a non-big firm’s clients at p-value 0.01. Big firms are therefore more selected in
high investor protection countries.
To summarise, the results of parametric t-statistics tests and nonparametric Wilcoxon z-
tests indicate that a big firm’s clients report discretionary accruals less than a non-big firm’s

34
clients. A non-big firm has a higher possibility of issuing a clean audit report than a big firm
and can maintain a long relationship with its clients. Large listed companies in Southeast
Asia tend to select non-big firms. By comparison to those in low-level investor protection
countries, listed companies in high-level investor protection countries are more likely to
select a big firm. Clients of a non-big firm have high dispersion and wide range of
performance and financial leverage.

35
Table 2 Differences in characteristics between observations audited by big firms and non-big firms (n=20,557)
Note: Variable definitions: DA is discretionary accruals scaled by lagged total assets;|DA| is absolute value of discretionary accruals; ChangeAud is a dummy variable and is equal
to 1 if the observations switch auditor type, 0 otherwise; AudOpi is a dummy variable and is equal to 1 if the audit opinion is an unqualified opinion, 0 otherwise; Tenure is the
number of consecutive years for which audit firms within the same group were employed as the company’s auditor; ROA is return-on-assets ratio; DtoE is debt-to-equity ratio; natTA
is natural logarithm of total assets; and InvPro is a dummy variable which is equal to 1 if that country is defined as a high investor protection country11, 0 otherwise.
Parametric t-statistics given here are from two-sample t-tests with equal variance if the assumption that observations audited by big firms (group a) and those audited by
non-big firms (group b) have a similar variance of each variable is satisfied. If not, two-sample t-test statistics with unequal variance are chosen. The tests are based on diff=mean (a)-
mean (b) and H0: diff=0. The acceptance of H0 (Ha: diff≠0) means that there is no difference of means between groups. The rejection of H0 (Ha: diff≠0) however indicates that there is
the difference of means between groups, and then Ha: diff>0 or Ha: Diff<0 are tested. Nonparametric Wilconxon z-statistics for test of differences in medians between groups are two-
sample Wilcoxon rank-sum (Mann-Whitney) tests. H0 is that there is no difference of median between groups. P [variable (a)>variable (b)] is the probability that the median of
variable for group a is greater than median of variable for group b.
*, **, and *** indicate significant level at 0.10, 0.05, and 0.01 for a two-tailed test, respectively.
11 Level of investor protection here is based on Leuz et al. (2003).

36
5.2.2 Correlation between DA, |DA| and other variables
Table 3 shows the correlation between variables. The upper half is Spearman correlation
coefficients (𝑟𝑠) and the lower half is Pearson correlation coefficient (𝑟𝑝). The analyses of
both 𝑟𝑠 and 𝑟𝑝 help reduce misspecification of correlation when only one method is selected.
Since 𝑟𝑃 and 𝑟𝑠 here provide almost identical results, the relationships among variables are
identified if both p-value of 𝑟𝑠 and 𝑟𝑝 are significant at the 0.01 level, except for 𝑟𝑝 of the
correlation between DA and Tenure and for 𝑟𝑠 of the correlation between InvPro and DtoE
which are significant at p-value 0.1 and 0.05, respectively.
The results in the first two rows and the first two columns indicate that the correlation
between DA and other variables and correlation between |DA| and other variables are
inconsistent. DA has positive correlation with AudOpi and ROA but negative correlation
with Tenure. On the other hand |DA| has negative association with AudFirm, AudOpi,
Tenure, ROA and natTA. This points out that the using DA or |DA| as the Y-variable is likely
to cause different results.
The correlations between variables also confirms that, in comparison to a non-big firm, a
big firm is less likely to issue a clean opinion and has shorter audit tenure. Large listed
companies tend to select a non-big firm. In high-level investor protection countries, listed
companies are more likely to choose a big firm but less likely to switch audit firm type. They
also have long audit tenure, less financial leverage, low performance and small size. Audit
firms in high-level investor protection countries are more likely to issue clean audit reports.

37
Table 3 Correlation matrix
Note: The upper half is Spearman correlation coefficients and the lower half is Pearson correlation coefficient. *, **, and *** indicate significant level at 0.10, 0.05, and
0.01 for one-tailed test, respectively.

38
5.3 Multivariate tests
Table 4 shows the results of the probit model by using different levels of audit accepted
discretionary accruals as the benchmarks for measuring audit quality. The auditor accepted
level of discretionary accruals could be reflected as the level of audit materiality in different
audit firm types and in different countries. Our findings are as follows.
5.3.1 A big firm is more conservative than a non-big firm
When the benchmark reduces from 5% of lagged total assets to 2.5%, 1% and 0.5%, in
comparison to a big firm, a non-big firm’s probability of getting a high quality audit report
also reduces from 45.81% (z score=-0.105)12 to 40.81% (-2.232), 34.71% (-0.393), and
29.89% (-0.527), respectively. This indicates that at small levels of benchmark a non-big
firm has a lower probability of getting a high quality audit report than a big firm. However
at the benchmark 7.5% there is no difference between a non-big firm and a big firm; and at
the benchmark 10% a non-big firm has higher probability of getting a high quality audit
reporting than a big firm: 53.82% (0.096). Increasing the benchmark to 15%, 20% and 30%
also increases the chance that a non-big firm has high quality audit reporting from 60.31%
(0.262) to 66.37% (0.423) then 66.37% (0.423), respectively. This shows that a non-big
firm is more tolerant of a high level of discretionary accruals and it can be evidence that a
big firm is more conservative than a non-big firm. 12 The panel probit model is run by assuming a normal distribution, (0,𝜎𝑉2), for the random effects 𝑣𝑖
Pr (𝑦𝑖1, … ,𝑦𝑖𝑛𝑖|𝑥𝑖1, … ,𝑥𝑖𝑛𝑖) = ∫ 𝑒−𝑣𝑖2/2𝜎𝑣2
�2𝜋𝜎𝑣
∞−∞ �∏ 𝐹(𝑦𝑖𝑡
𝑛𝑖𝑡=1 , 𝑥𝑖𝑡𝛽 + 𝑣𝑖)�𝑑𝑣𝑖
where
𝐹(𝑦, 𝑧) = � ∅(𝑧)𝑖𝑓 𝑦 ≠ 01 − ∅(𝑧) 𝑜𝑡ℎ𝑒𝑟𝑤𝑖𝑠𝑒
where ∅ is the cumulative normal distribution. The coefficients of probit model are Z-scores. In order to compute predicted probability, we then need to transform these coefficients.

39
Our results are consistent with Francis and Krishnan (1999) and Becker et al. (1998).
Francis and Krishnan (1999) find that only a big firm that has reporting conservatism for
high level accruals. This may be the reason why a big firm is perceived as higher audit
quality provider. Meanwhile Becker et al. (1998) report that clients audited by a big 6
auditor report discretionary accruals less than those audited by a non-big 6 auditor.
Low materiality can help a big firm mitigate audit risk and eventually reduces the likelihood
of audit failure. Audit risk and audit failure occur when the audit report is a clean opinion
but financial statements contain material misstatements. A big firm is therefore aware of
its reputation and cannot tolerate its clients’ abnormal accruals (Larcker and Richardson
(2004)). Loss of reputation significantly affects audit firms and their clients, especially in
the case of a big firm. When mass media have reported a big audit firm’s failure, the stock
price of its other audited clients often plunge sharply, for instance the case of Andersen’s
audit failure associated with Enron’s accounting manipulation in 2001-2002 (Chaney and
Philipic (2002))13 and the case KPMG’s failure to report ComROAD’s accounting scandal in
2002 in Germany (Weber et al. (2008)). Some existing audit clients left audit firms (Weber
et al. (2008)). Maintaining reputation and avoiding audit failure thus lead a big firm to be
more conservative.
5.3.2 National level factors have strong influence on audit quality
The probit model also provides a comparison between Singapore, which has the highest
level of investor protection, and Malaysia, Thailand, Indonesia and the Philippines which are
13 Nelson, Price and Rountree (2008) question Chaney and Philipich (2002). The study contends that the stock market’s negative reaction to other clients of Andersen was not only attributable to Andersen’s loss of reputation but also to a sharp decline in oil prices in the Energy sector. This had a mixed effect on Andersen’s client portfolios.

40
the second, the third, the fourth and the fifth, respectively. Malaysia has a higher chance that
audit firms provide high audit quality at all levels of benchmark. When the benchmark
increases, the probability that audit firms in Malaysia still outperform those in Singapore.
This indicates that Malaysian audit firms have a wide level of audit accepted discretionary
accruals. Additionally, it can be inferred that they are more flexible than Singaporean audit
firms.
At the low benchmarks, audit firms in Thailand, Indonesia and the Philippines have higher
probability for issuing high audit quality reports than those in Singapore. However, high
levels of benchmark lower the possibility for Thailand, Indonesia and the Philippines to be a
high quality auditor. This is evidence that audit firms in Thailand, Indonesia and the
Philippines are less tolerant of a high level of discretionary accruals and they are more
conservative than those in Singapore and Malaysia.
Although Leuz et al. (2003) report that companies in low level investor protection countries
(e.g., Thailand, Indonesia and the Philippines) engage in more earnings management than
those in high level investor protection countries (e.g. Singapore and Malaysia), we provide
additional evidence that a low level of materiality helps auditors in low-level investor
countries detect earnings management and that auditors in low-level investor protection
countries are more conservative than those in high level investor protection countries. The
study also supports Bauwhede et al.’s (2003), Jeong and Rho’s (2004), Piot and Janin’s
(2007), and Maijoor and Vanstraelen’s (2006) conclusions that national level factors have a
profound influence on audit quality.
41
5.3.3 Audit tenure and switching audit firm type also have significant impact on audit
quality
At the benchmarks 1% and 0.5%, one more year of audit experience with one client reduces
the possibility that audit opinion for that client matches with level of discretionary accruals.
The probability is 49.36% (z-score=-0.016) and 48.68% (-0.033), respectively. However, at
a benchmark greater than 2.5% it increases this possibility to 50.48% (0.012)- 66.39%
(0.423). The explanation for this is twofold. First, audited clients engage in earnings
management over a period of time and auditors cannot observe them. Discretionary
accruals then accumulate. Healy (1985) points out that managers use accruals to switch
reported earnings between periods and the sum of these discretionary accruals should be
zero during the period of a manager’s employment. Pourciau (1993) believes that before
leaving the company, management has to remove all accruals that he/she used to maximise
accounting-based compensations. Second, levels of audit materiality increase when audit
firms have a long relation with their clients: auditors then are more tolerant of a high level
of discretionary accruals. This supports Carey and Simnet’s (2006) findings that Australian
audit partners are less likely to issue going-concern opinions when they have long relation
with their clients. Long audit tenure leads auditors to over-trust their audited clients. This
finally impairs audit quality.
Switching audit firm significantly increases the likelihood that a new audit firm provides a
high quality audit report at benchmarks 0.5%, 1% and 2.5%. The possibility increases from
52.95% (0.074) to 54.18% (0.105) and then drops to 52.99% (0.075). It can be inferred that
auditors generally set a low level of materiality in their first year audits. In other words,
auditors are more conservative in the first year audit. Krishnan (1994) believes that
auditors use more conservative judgements for new clients. In addition Krishnan and

42
Stephens (1995) point out that switching auditor may not help a company succeed in
opinion shopping. It is because predecessor and successor auditors do not treat the
company differently or the regulators are successful in monitoring the opinion shopping.
5.3.4 Audited company’s performance and size also have significant impact on audit
quality
At benchmarks higher than 5%, increasing audited companies’ performances measured by
ROA increases the chance that auditors issue clean audit reports with high levels of
discretionary accruals. The possibility is around 50% (z-score = 0.000-0.003). This can be
interpreted in two ways. First, auditors are more tolerant of audited clients with high
performances. Second, audited companies with high performance are associated with high
levels of discretionary accruals.
High ROA can be a sign that audited companies are not faced with any going-concern
problems or any uncertainty about their business. As found by Reichelt and Wang (2010),
auditors are less likely to issue going-concern opinions for audited clients that have high
profitability. Listed companies are under the pressure to achieve analysts’ earnings forecast
(Burgstahler and Eames (2006)), therefore, they manage to reported earnings upwards. As
a consequence, they report high discretionary accruals. This leads high-performance firms
to have large discretionary accruals. In order to maintain audited clients, a non-big firm that
has a large market share in this region may increase their level of materiality because,
according to Fan and Wong (2005), high-performance firms in the US prefer a big firm. If
not, a non-big firm’s important clients may switch to a big firm.
43
Similar to ROA, at benchmarks higher than 1%, client size measured by natural logarithm of
total assets significantly increases the probability that auditor will issue a clean audit report
with a high level of discretionary accruals. The chance is approximately 52% (0.030-0.071).
This is evidence that large clients engage more in earnings management and/or that
auditors are more tolerant of high levels of discretionary accruals reported by large clients.
The former finding is consistent with Jeong and Rho (2004) but contradicts Krishnan
(2003), Maijoor and Vanstraelen (2006) and Poit and Janin (2007). Jeon and Rho (2004)
provide evidence from Korea while the other studies were conducted in Western countries.
Our results show that earnings management behaviour among listed companies may differ
between Eastern and Western countries. This sheds light on the influence of national level
factors on earnings management behavior. Empirical studies also provide evidence that
large firms may put pressure on auditors. Reichelt and Wang (2010) find that auditors are
less likely to issue large firms with a going-concern opinion. Although Carcello and Neal
(2003) conjecture that large firms are less likely to dismiss their auditors because they have
high bargaining power and avoid being closely investigated for their auditor dismissals,
their results do not report the association between firm size and auditor dismissals.
Carcello and Meal’s (2003) findings could imply that large and small firms have equal
possibilities of auditor dismissals.
To summarise, our probit model calculates the probability that auditors provide high audit
quality. Audit quality is measured by the joint association between type of audit report and
level of discretionary accruals. The different levels of benchmark are used to test how
different types of audit firms and auditors in different countries can tolerate different level
of discretionary accruals. The evidence from Indonesia, Malaysia, the Philippines, Singapore
and Thailand indicates that, owing to its reputation, a big firm is more conservative than a

44
non-big firm. National level factors have a strong influence on audit quality. Thailand, the
Philippines and Indonesia are more conservative. Malaysia is more flexible while Singapore
is in the middle of these two groups. Switching audit firm can promote audit quality if the
new auditors are more conservative and the monitoring of auditor change is effective. Long
audit tenure impairs audit quality because auditors tend to increase their audit materiality.
Auditors are more tolerant of high discretionary accruals reported by high performance
firms and/or large firms because of clients’ bargaining powers. Maintaining clients may be
the reason why auditors are more tolerant of high levels of discretionary accruals.

45
Table 4 Results of probit model
Note: The model is Pr (𝐴𝑢𝑑𝑄𝑢𝑎)𝑖𝑡 = 𝛼 + 𝛽1𝐴𝑢𝑑𝑅𝑎𝑛𝑘𝑖𝑡 + 𝛽2𝑇𝑒𝑛𝑢𝑟𝑒𝑖𝑡 + 𝛽3𝐶ℎ𝑎𝑛𝑔𝑒𝐴𝑢𝑑𝑖𝑡 + 𝛽4𝑅𝑂𝐴𝑖𝑡 + 𝛽5𝐷𝑡𝑜𝐸𝑖𝑡 + 𝛽6𝑛𝑎𝑡𝑇𝐴𝑖𝑡 + 𝛽7−10𝐼𝑛𝑣𝑅𝑎𝑛𝑘𝑝 + 𝑣𝑖𝑡; where 𝐴𝑢𝑑𝑄𝑢𝑎𝑖𝑡 = audit quality for firm 𝑖 in year 𝑡 and is equal to 0 if 𝑂𝑣𝑒𝑟𝑖𝑡& 𝐶𝑙𝑒𝑎𝑛𝑖𝑡 or 𝑈𝑛𝑑𝑒𝑟𝑖𝑡&𝑈𝑛𝐶𝑙𝑒𝑎𝑛𝑖𝑡; and 1 if
𝑈𝑛𝑑𝑒𝑟𝑖𝑡& 𝐶𝑙𝑒𝑎𝑛𝑖𝑡 or 𝑂𝑣𝑒𝑟𝑖𝑡&𝑈𝑛𝐶𝑙𝑒𝑎𝑛𝑖𝑡; 𝑂𝑣𝑒𝑟𝑖𝑡 = [∣ 𝐷𝐴𝑖𝑡 ∣ −𝐴𝑐𝑐𝑒𝑝𝑡𝑒𝑑𝐷𝐴] > 0; 𝑈𝑛𝑑𝑒𝑟𝑖𝑡 = [∣ 𝐷𝐴𝑖𝑡 ∣ −𝐴𝑐𝑐𝑒𝑝𝑡𝑒𝑑𝐷𝐴] < 0; 𝐶𝑙𝑒𝑎𝑛𝑖𝑡 = clean opinion; 𝑈𝑛𝐶𝑙𝑒𝑎𝑛𝑖𝑡 = other opinions; 𝐴𝑐𝑐𝑒𝑝𝑡𝑒𝑑𝐷𝐴 = an audit accepted level of discretionary accruals; ∣ DA𝑖𝑡 ∣ = an absolute value of discretionary accruals for firm 𝑖 in year 𝑡; 𝐴𝑢𝑑𝑅𝑎𝑛𝑘𝑖𝑡 = the rank of audit firm type for firm 𝑖 in 𝑖 which is equal to 1 if the audit firm type is a big firm and 2 if
the audit firm type is a non-big firm ; 𝑇𝑒𝑛𝑢𝑟𝑒𝑖𝑡 = the number of consecutive years for which audit firms within the same type were employed as the
listed company’s auditor for firm 𝑖 at year 𝑡; 𝐶ℎ𝑎𝑛𝑔𝑒𝐴𝑢𝑑𝑖𝑡 = dummy variables which is equal to 1 if firm 𝑖 in year 𝑡 switches audit firm type, 0 otherwise, 𝑅𝑂𝐴𝑖𝑡 = return on assets for firm 𝑖 in year 𝑡 which is the CRSP/Compustat item 𝑅𝑂𝐴 or is computed as
[𝑛𝑒𝑡 𝑖𝑛𝑐𝑜𝑚𝑒𝑖𝑡 (𝐼𝐵) 𝑡𝑜𝑡𝑎𝑙 𝑎𝑠𝑠𝑒𝑡𝑠 𝑖𝑡(𝐴𝑇)]⁄ 𝑥100; 𝐷𝑡𝑜𝐸𝑖𝑡 = debt to equity ratio which is computed as [𝑙𝑜𝑛𝑔 − 𝑡𝑒𝑟𝑚 𝑑𝑒𝑏 𝑖𝑡(𝐷𝐿𝑇𝑇) + 𝑐𝑢𝑟𝑟𝑒𝑛𝑡 𝑝𝑜𝑟𝑡𝑖𝑜𝑛 𝑜𝑓 𝑙𝑜𝑛𝑔 −
𝑡𝑒𝑟𝑚 𝑑𝑒𝑏𝑡 𝑖𝑡(𝐷𝐷1)] /𝑡𝑜𝑡𝑎𝑙 𝑠𝑡𝑜𝑐𝑘ℎ𝑜𝑙𝑑𝑒𝑟𝑠′𝑒𝑞𝑢𝑖𝑡𝑦𝑖𝑡 (𝑆𝐸𝑄); 𝑛𝑎𝑡𝑇𝐴𝑖𝑡 = a natural logarithm of total assets for firm 𝑖 in year 𝑡; 𝐼𝑛𝑣𝑅𝑎𝑛𝑘𝑝 = the rank of level investor protection for country 𝑝; 𝑣𝑖𝑡 = unspecific random effects for firm 𝑖 in year 𝑡; 𝑖 = 1,…,I firm index; 𝑡 = 1,…,𝑇𝑖, year index.
*, **, and *** indicate significant level at 0.10, 0.05, and 0.01 for one-tailed test, respectively.

46
6. Conclusions and Implications
Whether a big firm is of higher audit quality than a non-big firm is one of the most
contentious research questions in empirical auditing studies. Empirical evidence however
provides contradictory findings. Becker et al. ’s (1998) US evidence supports the general
notion that a big firm is of higher audit quality than a non-big firm. On the other hand the
non-US evidence of Bauwhede et al. (2003), Jeong and Rho (2004) and Piot and Janin
(2007) contends that a big firm and a non-big firm are of equal audit quality. They believe
that their findings contradict the US studies because of other national level factors.
Our study aims to revisit this issue and contributes to the literature on the association
between audit quality and earnings management in the context of Southeast Asia. We
develop a new probit model that helps predict the probability that auditors provide high
audit quality. Unlike empirical studies that use numeric discretionary accruals as measure
of audit quality, our study is the first to measure audit quality by using the joint association
between type of audit report and level of discretionary accruals. Focusing only on numerical
discretionary accruals without being concerned with the materiality concept possibly
misleads researchers over the different audit qualities between a big firm and a non-big
firm. Discretionary accruals are used as a proxy of earnings management and are computed
by the cross-sectional Jones model. The different levels of benchmark are used to test how
different types of audit firms and auditors in different countries can tolerate different level
of discretionary accruals. The final sample consists of 2,148 listed companies (20,757 firm-
year observations) from Indonesia, Malaysia, the Philippines, Singapore and Thailand and
covers the period 1993-2011. 70% of all observations are audited by a non-big firm and
89% receive a clean opinion. All data are sourced from the CRSP/Compustat database.

47
Our findings indicate that maintaining its reputation drives a big firm to be more
conservative than a non-big firm. Being audit-conservative leads a big firm to have a low
level of materiality and in turn to be unable to tolerate its clients’ high levels of
discretionary accruals. This audit-conservative behaviour can be one reason why a big firm
is perceived as a high quality auditor. Our findings also imply that a big-firm auditor helps
militate against earnings management.
Although listed companies in weak investor protection countries are perceived to engage in
more earnings management than those in strong investor protection countries, our
evidence shows that auditors in weak investor protection countries are more conservative
than those in strong investor protection countries. This highlights the role of auditors in
promoting transparency of financial information and disclosure in the stock markets in
weak investor protection countries. We also underscore that national level factors also have
a profound influence on audit quality. These factors may lead audit firms within the same
audit firm type but in different countries to have different reactions toward earnings
management and different levels of audit quality. For example, a big firm in Thailand may
differ from one in Singapore or Malaysia.
Our results also suggest that mandatory audit firm rotation may help promote audit quality,
since long audit firm tenure may be associated with impaired audit quality. Maintaining
clients is the cause that auditors are more tolerant of high level of discretionary accruals.
Switching audit firm may lead companies’ new auditors to be more conservative and other
parties to close monitor audit firm change.
48
The limitations of our study are threefold. First, we conjecture that a big firm (a non-big
firm) is homogenous in term of audit quality. Audit firms within the same group therefore
are of equal audit quality. Empirical studies however indicate that audit firms even within
a big firm group and even different national divisions of the same big firm have varying
audit quality. Second, we use the percentage of discretionary accruals divided by lagged
total assets as benchmark to evaluate audit quality. As we noted, setting audit materiality is
a subjective concept that requires auditors’ professional judgement. In practice, the
materiality level varies from individual auditor to individual auditor even though they may
be in the same audit firm. Third, we use the cross-sectional Jones model to predict
discretionary accruals. Our findings are impaired if the model can capture discretionary
accruals only at 2.5%-5% of lagged total assets.
In order to gain in-depth understanding of earnings management, researchers may need to
revisit the definition of earnings management and develop a model that can more precisely
estimate discretionary accruals. Future studies should focus on how individual auditor
characteristics influence the judgement on audit materiality and the reaction toward
earnings management. We also need to identify which national level factors have a
significant impact on audit quality. Study of the organisational culture within big firms and
non-big firms could help us explore why these two types of audit firms are perceived to be
significantly different.
(Tan and Jamal 2001) (Jamal and Tan 2001) (Wilks 2002) (Tan and Trotman 2003)
(Brazel et al. 2004, Messier_Jr et al. 2008, Earley 2001) (Trotman et al. 2005, Hyatt

49
and Prawitt 2001) (Nelson et al. 2008) (Nelson et al. 2005) (Iselin and Iskandar
2000)

50
References
Bagnoli, M., Penno, M. and Watts, S. G. 2001. Auditing in the Presence of Outside Sources of
Information. Journal of Accounting Research, 39(3), 435-447.
Bar-Yosef, S. and Sarath, B. 2005. Auditor Size, Market Sementation and Litigation Pattern: A
Theoretical Analysis. Review of Accounting Studies, 10, 59-92.
Bartov, E., Gul, F. A. and Tsui, J. S. L. 2001. Discretionary-accruals Models and Audit
Qualification. Journal of Accounting & Economics, 30, 421-452.
Bauwhede, H. V., Willekens, M. and Gaeremynck, A. 2003. Audit Firm Size, Public Ownership,
and Firms' Discretionary Accruals Management. The International Journal of
Accounting, 38, 1-22.
Becker, C. L., et al. 1998. The Effect of Audit Quality on Earnings Management. Contemporary
Accounting Research, 15(1), 1-24.
Beidleman, C. R. 1973. Income Smoothing: The Role Management. The Accounting Review,
48(4), 653-667.
Brazel, J. F., Agoglia, C. P. and Hatfield, R. C. 2004. Electronic versus Face-to-Face Review:
The Effects of Alternative Forms of Review on Auditor's Performance. The
Accounting Review, 79(4), 949-966.
Burgstahler, D. and Dichev, I. 1997. Earnings Management to Avoid Earnings Decrease and
Losses. Journal of Accounting and Economics, 24(1), 99-126.
Burgstahler, D. and Eames, M. 2006. Management of Earnings and Analysts’ Forecasts to
Achieve Zero and Small Positive Earnings Surprises Journal of Business Finance and
Accounting, 33(5/6), 633-652.
Burns, N. and Kedia, S. 2006. The Impact of Performance-Based Compensation on
Misreporting. Journal of Financial Economics 79, 35-67.

51
Bushman, R. M. and Piotroski, J. D. 2006. Financial Reporting Incentives for Conservative
Accounting: The Influence of Legal and Political Institutions Journal of Accounting
and Economics 42, 107-148.
Butler, M., Leone, A. J. and Willenborg, M. 2004. An Empirical Analysis of Auditor Reporting
and Its Association with Abnormal Accruals. Journal of Accounting & Economics, 37,
139-165.
Carcello, J. V. and Neal, T. L. 2000. Audit Committee Composition and Auditor Reporting. The
Accounting Review, 75(4), 453-467.
Carcello, J. V. and Neal, T. L. 2003. Audit Committee Characteristics and Auditor Dismissals
Following "New" Going-Concern Reports. The Accounting Review, 78(1), 95-117.
Carey, P. and Simnett, R. 2006. Audit Partner Tenure and Audit Quality. The Accounting
Review, 81(3).
Chan, D. k. and Wong, K. P. 2002. Scope of Auditors' Liability, Audit Quality, and Capital
Investment. Review of Accounting Studies, 7, 97-122.
Chaney, P. K., Jeter, D. C. and Shivakumar, L. 2004. Self-Selection of Auditor and Audit
Pricing in Private Firms. The Accounting Review, 79(1), 51-72.
Chaney, P. K. and Philipich, K. L. 2002. Shredded Reputation: The Cost of Audit Failure.
Journal of Accounting Research, 40(4), 1221-1245.
Chung, H. and Kallapur, S. 2003. Client Importance, Nonaudit Services, and Abnormal
Accruals. The Accounting Review, 78(4), 931-955.
Copeland, R. M. 1968. Income Smoothing. Journal of Accounting Research, 6, 101-116.
Craswell, A., Stokes, D. J. and Laughton, J. 2002. Auditor Independence and Fee Dependence.
Journal of Accounting and Economics, 33, 253-275.

52
DeAngelo, L. E. 1986. Accounting Numbers as Market Valuation Substitutes: A Study of
Management Buyouts of Public Stockholders. The Accounting Review, 61(3), 400-
420.
Dechow, P. M. and Dichev, I. D. 2002. The Quality of Accruals and Earnings: The Role of
Accrual Estimation Errors. The Accounting Review, 77, 35–59.
Dechow, P. M., et al., 2010. Detecting Earnings Management: A New Approach. Berkeley:
University of California.
Dechow, P. M. and Skinner, D. J. 2000. Earnings Management: Reconciling the Views of
Accounting Academics, Practitioners, and Regulators. Accounting Horizons, 14(2),
235-250.
Dechow, P. M., Sloan, R. G. and Sweeney, A. P. 1995. Detecting Earnings Management. The
Accounting Review, 70(2), 193-225.
DeFond, M. L. and Jiambalvo, J. 1994. Debt Covenant Violation and Manipulation of Accruals.
Journal of Accounting and Economics, 17(1-2), 145-176.
DeFond, M. L., Raghunandan, K. and Subramanyam, K. R. 2002. Do Non-Audit Service Fees
Impair Auditor Independence? Evidence from Going Concern Audit Opinions.
Journal of Accounting Research, 40(4), 1247-1274.
DeFond, M. L. and Subramanyam, K. R. 1998. Auditor Change and Discretionary Accruals.
Journal of Accounting and Economics, 25, 35-67.
Desai, H., Hogan, C. E. and Wilkins, M. S. 2006. The Reputational Penalty for Aggressive
Accounting: Earnings Restatements and Management Turnover The Accounting
Review, 81(1), 83-112.
Doing Business, 2012. Economic Rank [online]. Available from:
http://www.doingbusiness.org/rankings [Accessed 26 August 2012].

53
Doogar, R., Sivadasan, P. and Solomon, I. 2010. The regulation of Public Company Auditing:
Evidence from the Transition to AS5. Journal of Accounting Research, 48(4).
Dunn, K. A. and Mayhew, B. W. 2004. Audit Firm Industry Specialisation and Client
Disclosure Quality. Review of Accounting Studies, 9, 35-58.
Earley, C. E. 2001. Knowledge Acquisition in Auditing: Training Novice Auditors to
Recognise Cue Relationships in Real Estate Valuation. The Accounting Review, 76(1),
81-97.
Erickson, M. and Wang, S.-w. 1999. Earnings Management by Acquiring Firms in Stock for
Stock Mergers Journal of Accounting and Economics, 27, 149-176.
Ewert, R. and Wagenhofer, A. 2005. Economic Effects of Tightening Accounting Standards to
Restrict Earnings Management The Accounting Review 80(4), 1101-1124
Fan, J. P. H. and Wong, T. J. 2002. Corporate Ownership Structure and the Informativeness of
Accounting Earnings in East Asia. Journal of Accounting and Economics, 33, 401-425.
Fan, J. P. H. and Wong, T. J. 2005. Do External Auditors Perform a Corporate Governance
Role in Emerging Markets? Evidence from East Asia. Journal of Accounting Research,
43(1), 35-72.
Financial Reporting Council, 2006. Discussion Paper: Promoting Audit Quality.
Financial Reporting Council, 2008. The Audit Quality Framework.
Flint, D., 1988. Philosophy and Principles of Auditing. Hampshire: MacMillan Education Ltd.
Francis, J. R. and Ke, B. 2006. Disclusure of Fees Paid to Auditors and the Market Valuation
of Earnings Surprises. Review of Accounting Studies, 11, 495-523.
Francis, J. R. and Krishnan, J. 1999. Accounting Accruals and Auditor Reporting
Conservatism. Contemporary Accounting Research, 1(6), 135-165.

54
Gaver, J. J. and Paterson, J. S. 2001. The Association between External Monitoring and
Earnings Management in the Property-Casualty Insurance Industry. Journal of
Accounting Research, 39(2), 269-282.
Gaver, J. J. and Paterson, J. S. 2007. The Influence of Large Clients on Office-Level Auditor
Oversight: Evidence from the Property-Casualty Insurance Industry. Journal of
Accounting and Economics, 43, 299-320.
Ghosh, A. and Moon, D. 2005. Auditor Tenure and Perception of Audit Quality. The
Accounting Review, 80(2), 585-612.
Goncharov, I., 2005. Earnings Management and Its Determinans: Closing Gaps in Empirical
Accounting Research. Frankfurt: Peter Lang GmbH.
Guedhami, O. and Pittman, J. A. 2006. Ownership Concentration in Privatised Firms: The
Role of Disclosure Standards, Auditor Choice, and Audit Infrastructure. Journal of
Accounting Research, 44(5), 889-929.
Guedhami, O., Pittman, J. A. and Saffar, W. 2009. Auditor Choice in Privatised Firms:
Empirical Evidence on the Role of State and Foreign Owners. Journal of Accounting
and Economics, 48, 151-171.
Guenther, D. A. 1994. Earnings Management in Response to Corporate Tax Rate Changes:
Evidence from the 1986 Tax Reform Act. The Accounting Review 69(1), 230-243
Guidry, F., Leone, A. J. and Rock, S. 1999. Earnings-Based Bonus Plans and Earnings
Management by Business-Unit Managers Journal of Accounting and Economics,
26(113-142).
Gul, F. A., Fung, S. Y. K. and Jaggi, B. 2009. Earnings Quality: Some Evidence on the Role of
Auditor Tenure and Auditors' Industry Expertise. Journal of Accounting and
Economics, 47, 265-287.
55
Hackenbrack, K. and Nelson, M. W. 1996. Auditors' Incentives and Their Application of
Financial Accounting Standards The Accounting Review 70(1), 43-59.
Healy, P. M. 1985. The Effect of Bonus Schemes on Accounting Decisions. Journal of
Accounting and Economics, 7, 85-107.
Healy, P. M. and Wahlen, J. M. 1999. A Review of the Earnings Manement Literature and Its
Implications for Standard Setting. Accounting Horizons, 13(4), 365-383.
Hilary, G. and Lennox, C. 2005. The Credibility of Self-Regulation: Evidence from the
Accounting Profession's Peer Review Program. Journal of Accounting and Economics,
40, 221-229.
Hribar, P. and Collins, D. W. 2002. Errors in Estimating Accruals: Implications for Empirical
Research. Journal of Accounting Research, 40(1), 105-134.
Hyatt, T. A. and Prawitt, D. F. 2001. Does Congruence between Audit Structure and Auditors'
Locus of Control Affect Job Performance? The Accounting Review, 76(2), 263-274.
Iselin, E. R. and Iskandar, T. M. 2000. Auditor's Recognition and Disclosure Materiality
Thresholds: Their Magnitude and the Effects of Industry. British Accounting Review,
32, 289-309.
Jamal, K. and Tan, H.-T. 2001. Can Auditors Predict the Choices Made by Other Auditors?
Journal of Accounting Research, 39(3), 583-597.
Jeong, S. W. and Rho, J. 2004. Big Six Auditors and Audit Quality: The Korean Evidence. The
International Journal of Accounting, 39, 175-196.
Johl, S., Jubb, C. A. and Houghton, K. A. 2007. Earnings Management and the Audit Opinion:
Evidence from Malaysia. Managerial Auditing Journal, 22(7), 688-715.
Johnson, V. E., Khurana, I. K. and Reynolds, J. K. 2002. Audit-Firm Tenure and the Quality of
Financial Reports. Contemporary Accounting Research, 19(4), 637-660.

56
Jones, J. J. 1991. Earnings Management During Import Relief Investigations. Journal of
Accounting Research, 29(2), 193-228.
Kang, S.-H. and Sivaramakrishnan, K. 1995. Issues in Testing Earnings Management and an
Instrumental Variable Approach. Journal of Accounting Research, 33(2), 353-367.
Kim, J.-B., Chung, R. and Firth, M. 2003. Auditor Conservative, Asymetric Monitoring, and
Earnings Management. Contemporary Accounting Research, 20(2), 323-359.
Kinney_Jr, W. R., Palmrose, Z.-V. and Scholz, S. 2004. Auditor Independence, Non-Audit
Services, and Restatements: Was the U.S. Government Right? Journal of Accounting
Research, 42(3).
Kothari, S. P., Leone, A. J. and Wasley, C. E. 2005. Performance Matched Discretionary
Accrual Measures. Journal of Accounting and Economics, 39, 163-197.
Krishnan, G. V. 2003. Does Big 6 Auditor Industry Expertise Constrain Earnings
Management? Accounting Horizons, Supplement, 1-16.
Krishnan, J. 1994. Auditor Switching and Conservatism. The Accounting Review, 69(1), 200-
215.
Krishnan, J. and Stephens, R. G. 1995. Evidence on Opinion Shopping from Audit Opinion
Conservatism. Journal of Accounting and Public Policy, 14, 179-201.
Larcker, D. F. and Richardson, S. A. 2004. Fees Paid to Auditor Firms, Accrual Choices, and
Corporate Governance. Journal of Accounting Research, 2004(42), 3.
Lennox, C. 2005. Audit Quality and Executive Officers' Affiliations with CPA Firms. Journal of
Accounting and Economics, 39, 201-231.
Leuz, C., Nanda, D. and Wysocki, P. D. 2003. Earnings Management and Investor Protection:
an International Comparison. Journal of Accounting and Economics, 69, 505-527.
Louis, H. 2004. Earnings Management and the Market Performance of Acquiring
Firms Journal of Financial Economics 74, 121-148.

57
Lu, T. 2006. Does Opinion Shopping Impair Auditor Independence and Audit Quality. Journal
of Accounting Research, 44(3), 561-583.
Maijoor, S. J. and Vanstraelen, A. 2006. Earnings Management within Europe: The Effect of
Member State Audit Environment, Audit Firm Quality and International Capital
Markets. Accounting and Business Research, 36(1), 33-52.
Mansi, S. A., Maxwell, W. F. and Miller, D. P. 2004. Does Auditor Quality and Tenure Matter to
Investors? Evidence from the Bond Market. Journal of Accounting Research, 42(4),
755-793.
McNichols, M. and Wilson, G. P. 1988. Evidence of Earnings Management from the Provision
for Bad Debts. Journal of Accounting Research, 26, 1-31.
McNichols, M. F. 2000. Research Design Issues in Ernings Management Studies. Journal of
Accounting and Public Policy, 19, 313-345.
Menon, K. and Williams, D. D. 2004. Former Audit Partners and Abnormal Accruals. The
Accounting Review, 79(4), 1095-1118.
Messier_Jr, W. F., Owhoso, V. and Rakovski, C. 2008. Can Audit Partners Predict
Subordinates' Ability to Detect Errors? Journal of Accounting Research, 46(5), 1241-
1264.
Moses, O. D. 1987. Income Smoothing and Incentives: Empirical Tests Using Accounting
Changes The Accounting Review 62(2), 358-377
Myers, J. N., Myers, L. A. and Omer, T. C. 2003. Exploring the Term of the Audit-Client
Relationship and the Quality of Earnings: A Case for Mandatory Auditor Rotation?
The Accounting Review, 78(3), 779-799.
Nelson, K. K., Price, R. A. and Rountree, B. R. 2008. The Market Reaction to Arthur
Andersen's Role in the Enron Scandal: Loss of Reputation or Confounding Effects?
Journal of Accounting and Economics, 46, 279-293.

58
Nelson, M. W., Elliott, J. A. and Tarpley, R. L. 2002. Evidence from Auditors about Managers'
and Auditors' Earnings Management Decisions. The Accounting Review, 77, 175-202.
Nelson, M. W., Smith, S. D. and Palmrose, Z.-V. 2005. The Effect of Quantitative Materiality
Approach on Auditor's Adjustment Decisions. The Accounting Review, 80(3), 897-
920.
Owhoso, V. E., Messier_Jr, W. F. and Lynch_Jr, J. G. 2002. Error Detection by Industry-
Specialised Teams during Sequential Audit Review. Journal of Accounting Research,
40(3), 883-900.
Park, Y. W. and Shin, H.-H. 2004. Board Composition and Earnings Management in
Canada Journal of Corporate Finance 10, 431-457.
Patterson, E. and Wright, D. 2003. Evidence of Fraud, Audit Risk and Audit Liability Regimes.
Review of Accounting Studies, 8, 105-131.
Peasnell, K. V., Pope, P. F. and Young, S. 2000. Accrual Management to Meet Earnings
Targets: UK Evidence Pre-and Post- Cadbury. British Accounting Review 32, 415–
445
Peasnell, K. V., Pope, P. F. and Young, S. 2005. Board Monitoring and Earnings Management:
Do Outside Directors Influence Abnormal Accruals? . Journal of Business Finance and
Accounting, , 32(7/8), 1311-1346.
Perry, S. E. and Williams, T. H. 1994. Earnings Management Preceding Management Buyout
Offers Journal of Accounting and Economics(18), 157-179.
Piot, C. and Janin, R. 2007. External Auditors, Audit Committees and Earnings Management
in France. European Accounting Review, 16(2), 429-454.
Pittman, J. A. and Fortin, S. 2004. Auditor Choice and the Cost of Debt Capital for Newly
Public Firms. Journal of Accounting and Economics, 37, 113-136.
59
Porter, B., Simon, J. and Hatherly, D., 2008. Principles of External Auditing. West Sussex: Jonh
Wiley & Sons, Ltd.
Pourciau, S. 1993. Earnings Management and Nonroutine Executive Changes Journal of
Accounting and Economics, 16, 317-336.
Reichelt, K. J. and Wang, D. 2010. National and Office-Specific Measures of Auditor Industry
Expertise and Effects on Audit Quality. Journal of Accounting Research, 48(3), 647-
686.
Schipper, K. 1989. Commentary on Earnings Management. Accounting Horizons, 3(4), 91-
102.
Tan, H.-T. and Jamal, K. 2001. Do Auditors Objectively Evaluate Their Subordinates' Work?
The Accounting Review, 76(1), 99-110.
Tan, H.-T. and Trotman, K. T. 2003. Reviewers' Responses to Anticipated Stylisation
Attemps by Preparers of Audit Workpapers. The Accounting Review, 78(2), 581-604.
Teoh, S. H., Welch, I. and Wong, T. J. 1998a. Earnings Management and the Long-term
Market Performance of Initial Public Offerings. Journal of Finance, 6, 1935-1974.
Teoh, S. H., Welch, I. and Wong, T. J. 1998b. Earnings Management and the
Underperformance of Seasoned Equity Offerings. Journal of Financial Economics, 50,
63-99.
The International Auditing and Assurance Standard Board, 2011. Publications & Resources
[online]. New York. Available from:
http://www.ifac.org/sites/default/files/publications/files/audit-quality-an-iaasb-per.pdf
[Accessed November 17, 2011].
The Sock Exchange of Thailand 2012. The Stock Exchange of Thailand (SET)'s Policy [online].
Bangkok. Available from: http://www.set.or.th/dat/content/rule/en/Bor.Jor.-
Phor.12-00_EN_amendApr2007.pdf [Accessed 19 September 2012].
60
Trotman, K. T., Wright, A. M. and Wright, S. 2005. Auditor Negotiations: An Examination of
the Efficacy of Intervention Methods. The Accounting Review, 80(1), 349-367.
Weber, J. and Willenborg, M. 2003. Do Expert Information Intermediaries Add Value?
Evidence from Auditors in Microcap IPOs. Journal of Accounting Research, 41(4),
681-720.
Weber, J., Willenborg, M. and Zhang, J. 2008. Does Auditor Reputation Matter? The Case of
KPMG Germany and ComROAD AG. Journal of Accounting Research, 46(4), 941-972.
Whisenant, S., Sankaraguruswamy, S. and Raghunandan, K. 2003. Evidence on the Joint
Determination of Audit and Non-Audit Fees. Journal of Accounting Research, 41(4),
721-744.
Wilks, T. J. 2002. Predecisional Distortion of Evidence as a Consequence of Real-Time Audit
Review. The Accounting Review, 77(1), 51-71.
Yu, H.-C. 2011. Legal Systems and Auditor Independent. Review of Accounting Studies, 16,
377-411.