earnings disclosure q1’19 · • integrated with bkash for inward remittance with 4 exchange...
TRANSCRIPT

1
BRAC Bank Ltd.
Earnings Disclosure Q1’19

Forward Looking Statements
This presentation and accompanying oral remarks may contain or incorporate by reference “forward looking statements” regarding the belief or
current expectations of BRAC Bank Ltd., the Board of the Directors and other members of its Senior Management about the strategy, businesses
and performance of the Company and its subsidiaries and the other matters described in this document. Generally, words such as ‘‘may’’,
‘‘could’’, ‘‘will’’, ‘‘expect’’, ‘‘intend’’, ‘‘estimate’’, ‘‘anticipate’’, ‘‘believe’’, ‘‘plan’’, ‘‘seek’’, ‘‘continue’’ or similar expressions are intended to
identify forward looking statements.
Forward looking statements involve inherent risks and uncertainties. They are not guarantees of future performance and actual results could
differ materially from those contained in the forward looking statements. Recipients should not place reliance on, and are cautioned about relying
on, any forward looking statements. Forward looking statements are based on current views, estimates and assumptions and involve known and
unknown risks, uncertainties and other factors, many of which are outside the control of the Group and are difficult to predict. Such risks, factors
and uncertainties may cause actual results to differ materially from any future results or developments expressed or implied from the forward-
looking statements.
No statement in this document is intended to be a profit forecast or to imply that the earnings of BRAC Bank Ltd. and/or its subsidiaries for the
current year or future years will necessarily match or exceed the historical or published earnings of the Company and/or its subsidiaries. Each
forward looking statement speaks only as of the date of the particular statement. Except as required by any applicable law or regulations, the
BRAC Bank Ltd. expressly disclaims any obligation or undertaking to release publicly or make any updates or revisions to any forward looking
statement contained herein whether as a result of new information, future events or otherwise.
Important notice
Nothing in this document shall constitute, in any jurisdiction, an offer or solicitation to sell or purchase any securities or other financial
instruments, nor shall it constitute a recommendation or advice in respect of any securities or other financial instruments or any other matter.

Market Overview
• Environment
• Govt. borrowing through National Savings Certificates continuing
• Pressure on liquidity, upward pressure on interest rate
• Stress on banking sector
• Regulatory Changes
• New regulation for OBU
• ADR change implementation deferred to Sep’19 (from 85.0% to 83.5%)
• More flexibility in USD/BDT exchange rate
• Flexibility in Central Bank Repo

SOLO Performance– Q1’19 (BRAC Bank) 4
Total Revenue
Q1 2019 : 548
Q1 2018 : 449
22% PAT
FY’17 - BDT 550 Cr
FY’16 - BDT 408 Cr
FY’17 : BDT 21,693 Cr
FY’16 - BDT 18,148 Cr
20%
FY’17 : BDT 20,343 Cr
FY’16 : BDT 17,584 Cr
17% Deposit (EOP)
Q1 2019 : 23,130
Q1 2018 : 20,076
15% Loan (E0P)
Q1 2019 : 24,302
Q1 2018 : 20,321
20%
PAT
Q1 2019 : 127
Q1 2018 : 125
2%
EPS
Q1 2019 : 1.18
Q1 2018 : 1.16
ROA
Q1 2019 : 1.58%
Q1 2018 : 1.78%
ROE
Q1 2019 : 15.71%
Q1 2018 : 18.70%
CIR
Q1 2019 : 50%
Q1 2018 : 57%
CAR
Q1 2019 : 14.00%
Q1 2018 : 12.93%
NPL / Coverage*
Q1 2019 : 3.7% /104%
Q1 2018 : 3.9% /121%
BDT’ Cr (10 Mio.)
*NPL Coverage (Excl. GP) : 69% (Q1 2018: 83%)
NAV Q1 2019 : 30.68
Q1 2018 : 25.52
Spread Q1 2019 : 6.3%
Q1 2018 : 6.1%

Consolidated Performance– Q1’19 (BRAC Bank + All Subs) 5
Total Revenue
Q1 2019 : 740
Q1 2018 : 609
21% PAT
FY’17 - BDT 550 Cr
FY’16 - BDT 408 Cr
FY’17 : BDT 21,693 Cr
FY’16 - BDT 18,148 Cr
20%
FY’17 : BDT 20,343 Cr
FY’16 : BDT 17,584 Cr
17% Deposit (EOP)
Q1 2019 : 25,993
Q1 2018 : 22,236
17% Loan (E0P)
Q1 2019 : 24,338
Q1 2018 : 20,428
19%
PAT
Q1 2019 : 132
Q1 2018 : 149
-12%
EPS
Q1 2019 : 1.22
Q1 2018 : 1.28
ROA
Q1 2019 : 1.44%
Q1 2018 : 1.77%
ROE
Q1 2019 : 14.55%
Q1 2018 : 19.04%
CIR*
Q1 2019 : 61%
Q1 2018 : 62%
CAR
Q1 2019 : 15.90%
Q1 2018 : 12.20%
NAV
Q1 2019 : 34.09
Q1 2018 : 26.21
BDT’ Cr (10 Mio.)

Consolidated PAT – by Entity
Consolidated -12% and Solo 2%
6
BDT’ Cr (10 Mio.)
Subsidiary/Associate
Q1’19 Q1’18 ∆
PAT BBL’s Share
in PAT PAT
BBL’s Share
in PAT PAT
BBL’s Share
in PAT
BRAC EPL Investments Limited 1 1 (7) (7) 8 8
BRAC EPL Stock Brokerage Limited 5 4 3 3 2 1
BRAC SAAJAN Exchange Limited 0.3 0.2 1 1 (1) (1)
bKash Limited 2 1 21 10 (19) (9)
Sub-Total 8 6 18 6 (11) (0.2)
BRAC Bank Ltd 126 126 125 125 2 2
Share of profit/(loss) of associates (2) (2) (1) (1) (1) (1)
Gain/(loss) on disposal of associates 1 1 - - 1 1
Reversal of goodwill impairment - - 8 8 (8) (8)
Conso PAT 132 131 149 138 (17) (7)
Contribution from Subsidiary in CONSO PAT 6% 5% 12% 5%

Financial Results: Income Statement (SOLO)
7
BDT’ Cr (10 Mio.)
Particulars Q1 2019 Q1 2018 Δ Amount Δ %
Net Interest Income 385 310 75 24%
Other Operating Income 162 139 23 17%
Total Revenue 548 449 98 22%
Staff Cost 131 120 11 9%
Operating Cost 142 137 6 4%
Total Expenditure 274 257 17 6%
Operating Profit 274 192 82 43%
Net Debt Charge 64 -2 66 -2974%
Profit Before Tax 210 194 16 8%
Tax Charges 83 70 14 20%
Profit After Tax 127 125 2 2%
8
BDT’ Cr
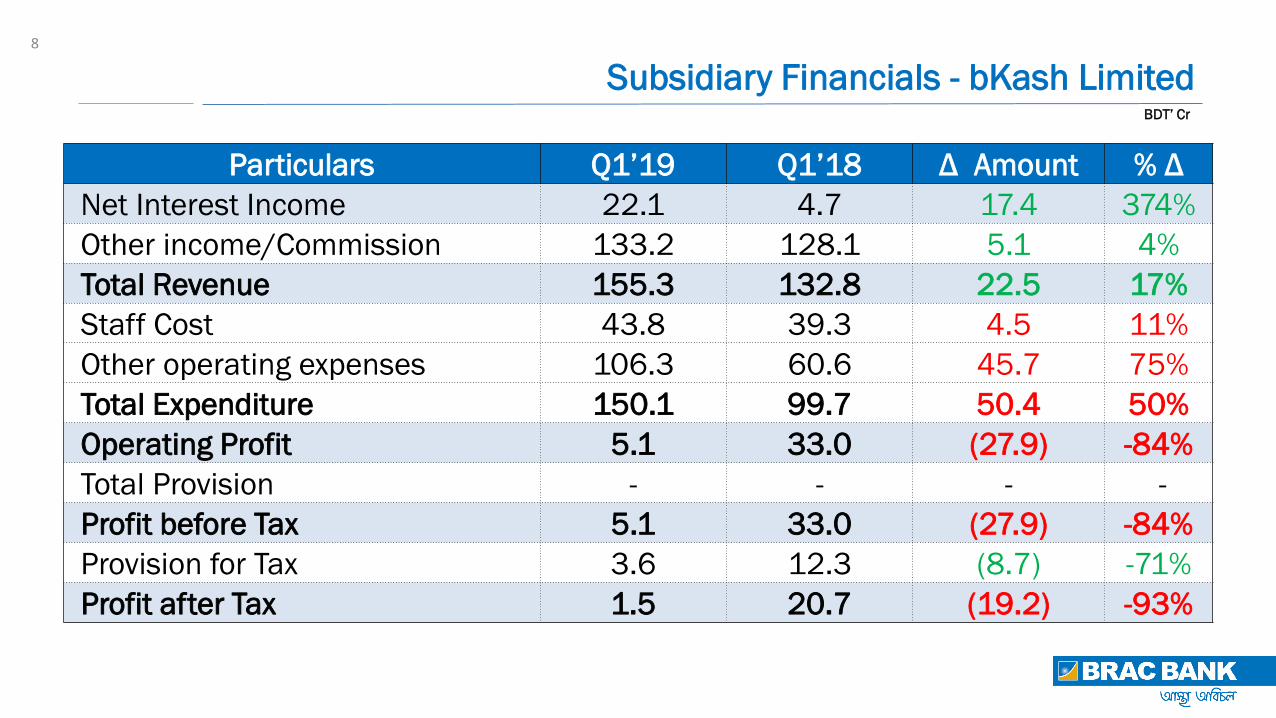
Subsidiary Financials - bKash Limited
Particulars Q1’19 Q1’18 Δ Amount % Δ
Net Interest Income 22.1 4.7 17.4 374%
Other income/Commission 133.2 128.1 5.1 4%
Total Revenue 155.3 132.8 22.5 17%
Staff Cost 43.8 39.3 4.5 11%
Other operating expenses 106.3 60.6 45.7 75%
Total Expenditure 150.1 99.7 50.4 50%
Operating Profit 5.1 33.0 (27.9) -84%
Total Provision - - - -
Profit before Tax 5.1 33.0 (27.9) -84%
Provision for Tax 3.6 12.3 (8.7) -71%
Profit after Tax 1.5 20.7 (19.2) -93%

Financial Results: Income Statement (CONSO)
9
BDT’ Cr (10 Mio.)
Particulars Q1 2019 Q1 2018 Δ Amount Δ %
Net Interest Income 405 355 50 14%
Other Operating Income 334 254 80 31%
Total Revenue 740 609 130 21%
Staff Cost 183 167 17 10%
Operating Cost 269 210 59 28%
Total Expenditure 453 377 76 20%
Operating Profit 287 232 55 24%
Profit/(loss) of associates -2 -1 (1) 59%
Net Debt Charge 64 -2 66 -2933%
Profit Before Tax 221 233 (12) -5%
Tax Charges 89 84 5 6%
Profit After Tax 132 149 (17) -12%
Attributable to BBL Shareholders 131 138 (7) -5%

18,772 19,231
23,130
Q1'17 Q1'18 Q1'19
2,63
4
2,718
3,135
Q1'17 Q1'18 Q1'19
8,468
9,913
11,92
2
Q1'17 Q1'18 Q1'19
7,670
6,600
7,120
Q1'17 Q1'18 Q1'19
+ 1
,44
5
-1,0
70
+ 2
,00
9
+ 8
4 + 4
59
+ 3
,89
9
Customer Deposits (EoP)
BBL SME Retail Corporate
20%
15%
20%
8% 2%
3%
17%
-14%
CAGR 11% 9% 19% -4%
BDT’ Cr (10 Mio.)
+ 5
20
+ 4
17
Q1’19 growth driven by Retail, SME deposit drive picking up

7,220
8,150
9,471
Q1'17 Q1'18 Q1'19
3,59
4
3,90
6
4,347
Q1'17 Q1'18 Q1'19
6,975
8,26
5
10,48
6
Q1'17 Q1'18 Q1'19
17,789
20,321
24,302
Q1'17 Q1'18 Q1'19
+ 2
,53
2
+ 1
08
+ 3
12
+ 8
92
+ 9
30
Loans & Advances (EoP)
BBL SME Retail Corporate
14% 13% 9% 18%
CAGR 17% 15% 10% 23%
BDT’ Cr (10 Mio.)
+ 3
,98
1
+ 1
,32
1
+ 4
41
+ 1
,29
0
20%
16% 11%
27%
+ 2
,23
1
Growth in SME and Corporate continued, Retail gaining momentum *MFI portfolio 1,031 Cr reclassified from SME to Corporate, Q1’17 & Q1’18 restated
*

Asset Quality
(30 day portfolio at risk)
BBL
12
SME Retail Corporate
Positive Trend
BDT’ Cr (10 Mio.)
390
629 662
Q1 2017 Q1 2018 Q1 2019
149 156 180
Q1 2017 Q1 2018 Q1 2019
963
1,217 1,218
Q1 2017 Q1 2018 Q1 2019
5.4% 6.0% 5.0%
5.9% 5.3% 4.0%
4.1% 4.0% 4.1% 5.6%
7.6% 6.3%
425 432 376
Q1 2017 Q1 2018 Q1 2019

Asset Quality
(Non performing loans)
BBL
13
SME Retail Corporate
BDT’ Cr (10 Mio.)
244
390 485
Q1 2017 Q1 2018 Q1 2019
97 88 108
Q1 2017 Q1 2018 Q1 2019
653
796 925
Q1 2017 Q1 2018 Q1 2019
312 318 332
Q1 2017 Q1 2018 Q1 2019
3.7% 3.9% 3.8%
4.3% 3.9% 3.5%
2.7% 2.2% 2.5% 3.5%
4.7% 4.6%
Focus on portfolio quality

Portfolio Distribution As Per BB (EoP)
14
BDT’ Cr
9,471
39%
4,347
18%
10,486
43%
Q1’19
SME Retail Corporate
Asset distribution aligned to strategy
*MFI portfolio reclassified from SME to Corporate, Q1‘17 & Q1’18 restated
*
[VALUE]
[PERCENT
AGE]
[VALUE][P
ERCENTAG
E]
[VALUE]
[PERCENT
AGE]
Q1’17
[VALUE]
[PERCE
NTAGE]
[VALUE]
[PERCE
NTAGE]
[VALUE]
[PERCE
NTAGE]
Q1’18
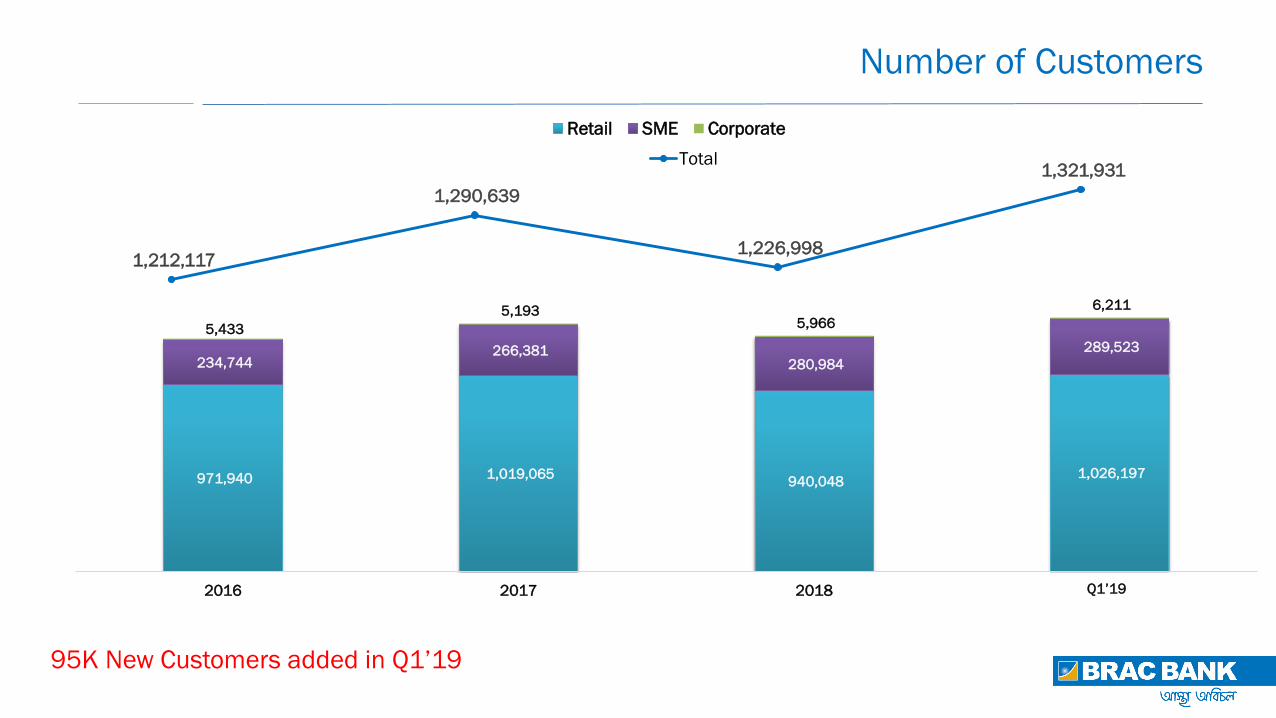
Number of Customers
95K New Customers added in Q1’19
971,940 1,019,065 940,048
1,026,197
234,744 266,381
280,984
289,523
5,433
5,193 5,966
6,211
2016 2017 2018 Mar'19
Retail SME Corporate
1,212,117
1,290,639
1,226,998
1,321,931 Total
Q1’19

Key Achievements – SME
• Asset Growth mainly driven by Small Business
• “Lender to Banker” mindset change of SME Sales Team started delivering results in deposit growth
• Cross Selling of other Financial Products by SME Sales Team has also begun
• Trade Finance capability rolled-out in new geographies which resulted in the Highest Non-Funded
Business
• New model of Special Asset Management has also started giving results
• Participated in all SME related re-finance schemes offered by Central Bank. Received the Highest
(75% of total allocation for all Banks) ADB SME Re-financing from Central Bank among all
Commercial Banks
• Agent Banking Expansion continues…

17 Cumulative figure as of May 5, 2019
Total AB Outlets 76
District Covered 35
Rural 68
Urban 8
Deposit
BDT 70 Million
1,168 Accounts
Remittance
BDT 0.35 Million
Total Txn.
BDT 2.61 Billion
76 AB
Outlets
Loan Repayment
BDT 2 Billion
Agent Banking - Reach
Distributor Collection
BDT 36.4 Million

Key Achievements – Retail
• New Savings Product portfolio (Happy Savers - Non Cheque & Golden Benefits Savings - Senior Citizens) is
contributing to Retail CASA growth
• Integrated with bKash for inward remittance with 4 Exchange Houses with Oman and Malaysia.
• Signed agreement with 2 Exchange Houses.
• Launched bKash and Rocket fund transfer from BBL Accounts.
• Made Strategic Alliances with Yamaha and Suzuki for newly launched Motor Bike Financing.
• Re-priced of Auto Loan and Personal Loan.
• Upgraded Credit Card and Call Centre Management Systems.

Key Achievements – Corporate
• Overall branch engagement in corporate deposit mobilization has improved significantly
• Cash Management Team has been revamped with fresh recruitment from the markets
• Asset RMs are now assigned with corresponding deposit management and are now all centric RM
• Customer engagement programs “Barbeque Nights” were arranged for corporate customers
• Longest tenor interest rate swap deal signed with ACE Alliance Power Ltd
• Agreement signed with Pathao for digital payment collections
• NFI income improved due to growing focus on trade business
• Overall import comprised of major portion of trade business which is gradually balancing in 2019. In Q1
2018, import: export ratio was 70:30 which has improved to 57:43 in Q1 2019

Key Achievements – Treasury & FI
20
• Successfully Launched first FX Trading Platform “BBL Electra”
• Significant reduction of dependency on Money Market
• First Interest Rate SWAP deal
• Handled Largest Guarantee Transaction
• Shifted Balance Sheet Profile to take advantage of the market

Key Achievements – Treasury & FI
21

Key Achievements – Technology
Technology Projects
• New call center solution upgraded
• Credit card mgt. system upgraded
Cyber Security Initiatives
• Vulnerability mgt.
• source code security analyzer

23
THANK YOU

Q&A

APPENDIX

SUBSIDIARY FINANCIALS
Q1’19
AS AT AND FOR THE QUARTER ENDED
31 MARCH 2019
26

27
BDT’ Cr
Subsidiary Financials – BRAC EPSL
Particulars Q1’19 Q1’18 Δ Amount % Δ
Net Interest Income 0.7 0.9 (0.1) -17%
Other income/Commission 15.7 13.6 2.0 15%
Total Revenue 16.4 14.5 1.9 13%
Staff Cost 3.6 3.4 0.1 4%
Other operating expenses 5.7 6.0 (0.3) -6%
Total Expenditure 9.3 9.5 (0.2) -2%
Operating Profit 7.1 5.0 2.1 42%
Total Provision - - - -
Profit before Tax 7.1 5.0 2.1 42%
Provision for Tax 2.3 1.8 0.5 26%
Profit after Tax 4.8 3.2 1.6 51%

28
BDT’ Cr
Subsidiary Financials - BRAC Saajan
Particulars Q1’19 Q1’18 Δ Amount % Δ
Net Interest Income (0.3) (0.3) 0.01 -5%
Other income/Commission 18.8 18.2 0.6 3%
Total Revenue 18.5 17.9 0.6 3%
Staff Cost 3.8 2.5 1.3 52%
Other operating expenses 14.2 14.0 0.2 1%
Total Expenditure 18.0 16.6 1.5 9%
Operating Profit 0.5 1.4 (0.9) -64%
Total Provision 0.1 - 0.1 -
Profit before Tax 0.4 1.4 (1.0) -71%
Provision for Tax 0.1 0.3 (0.18) -67%
Profit after Tax 0.3 1.1 (0.8) -72%

Subsidiary Financials – BRAC EPIL 29
BDT’ Cr
Particulars Q1’19 Q1’18 Δ Amount % Δ
Net Interest Income (2.8) 0.6 (3.4) -534%
Other income/Commission 5.3 (5.6) 10.9 194%
Total Revenue 2.5 (5.0) 7.6 151%
Staff Cost 0.7 0.9 (0.2) -26%
Other operating expenses 0.9 0.9 (0.02) -3%
Total Expenditure 1.6 1.8 (0.3) -15%
Operating Profit 1.0 (6.8) 7.8 114%
Total Provision - - - -
Profit before Tax 1.0 (6.8) 7.8 114%
Provision for Tax 0.03 0.1 (0.02) 40%
Profit after Tax 1.0 (6.9) 7.8 114%

Loans to Deposit ratio 30
82.7% 82.5% 81.9% 82.4%
80.9%
82.5% 82.8% 83.8%
82.8% 82.6% 83.9%
82.8% 83.2%
Mar-18 Apr-18 May-18 Jun-18 Jul-18 Aug-18 Sep-18 Oct-18 Nov-18 Dec-18 Jan-19 Feb-19 Mar-19

Cost of Deposit
31
4.7% 4.9% 4.9% 5.0%
5.2% 4.9% 4.9% 4.9% 4.9% 5.1%
4.9% 5.1% 5.2%
Mar-18 Apr-18 May-18 Jun-18 Jul-18 Aug-18 Sep-18 Oct-18 Nov-18 Dec-18 Jan-19 Feb-19 Mar-19

Spread
Spread Maintained
12.1%
11.0% 10.6%
10.9% 11.3%
4.7% 3.9% 3.8%
4.8% 5.0%
7.4% 7.1% 6.7%
6.1% 6.3%
2015 2016 2017 2018 Q1'19
YOA COD (Pan Bank) Spread