earnings 1q15 - s1.q4cdn.coms1.q4cdn.com/564376781/files/results 1t15/earnings-presentation... ·...
TRANSCRIPT

EARNINGS 1Q15
Conference Call May 8, 2015
2
We make forward-looking statements that are subject to risks and uncertainties. These statements
are based on the beliefs and assumptions of our management, and on information currently
available to us. Forward-looking statements include statements regarding our intent, belief or
current expectations of our directors or executive officers.
Forward-looking statements also include information concerning our possible or assumed future
results of operations, as well as statements preceded by, followed by, or that include the words
''believes,'' ''may,'' ''will,'' ''continues,'' ''expects,'‘ ''anticipates,'' ''intends,'' ''plans,'' ''estimates'' or
similar expressions. Forward-looking statements are not guarantees of performance. They involve
risks, uncertainties and assumptions because they relate to future events and therefore depend on
circumstances that may or may not occur. Our future results and shareholder values may differ
materially from those expressed in or suggested by these forward-looking statements. Many of the
factors that will determine these results and values are beyond our ability to control or predict.
SAFE-HARBOR STATEMENT
3
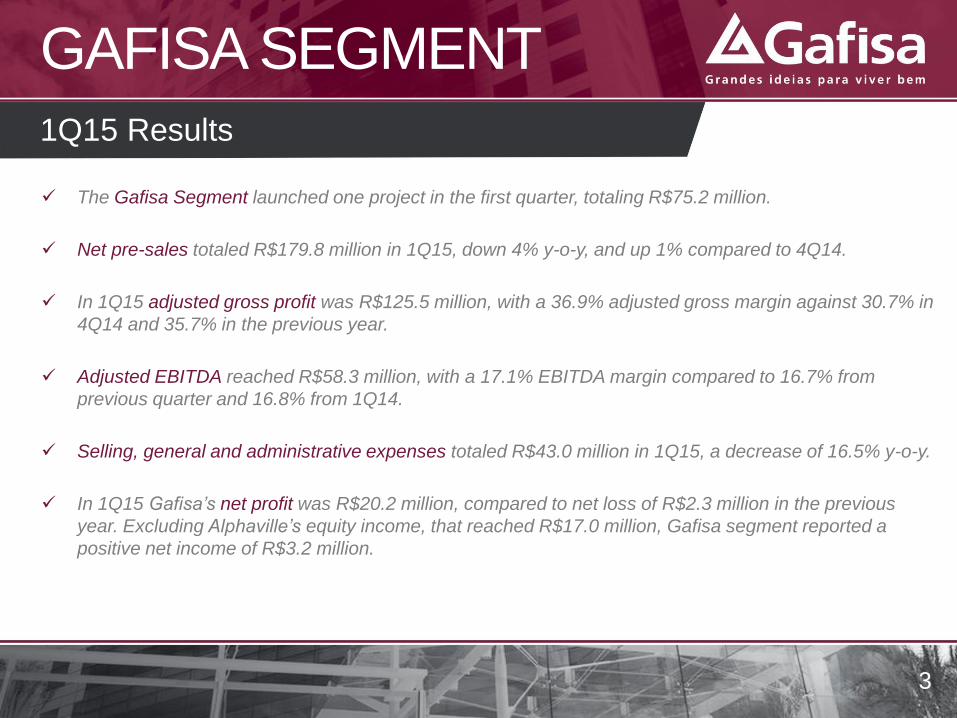
The Gafisa Segment launched one project in the first quarter, totaling R$75.2 million.
Net pre-sales totaled R$179.8 million in 1Q15, down 4% y-o-y, and up 1% compared to 4Q14.
In 1Q15 adjusted gross profit was R$125.5 million, with a 36.9% adjusted gross margin against 30.7% in
4Q14 and 35.7% in the previous year.
Adjusted EBITDA reached R$58.3 million, with a 17.1% EBITDA margin compared to 16.7% from
previous quarter and 16.8% from 1Q14.
Selling, general and administrative expenses totaled R$43.0 million in 1Q15, a decrease of 16.5% y-o-y.
In 1Q15 Gafisa’s net profit was R$20.2 million, compared to net loss of R$2.3 million in the previous
year. Excluding Alphaville’s equity income, that reached R$17.0 million, Gafisa segment reported a
positive net income of R$3.2 million.
GAFISA SEGMENT
1Q15 Results
4
GAFISA SEGMENT
Operational and Financial Highlights
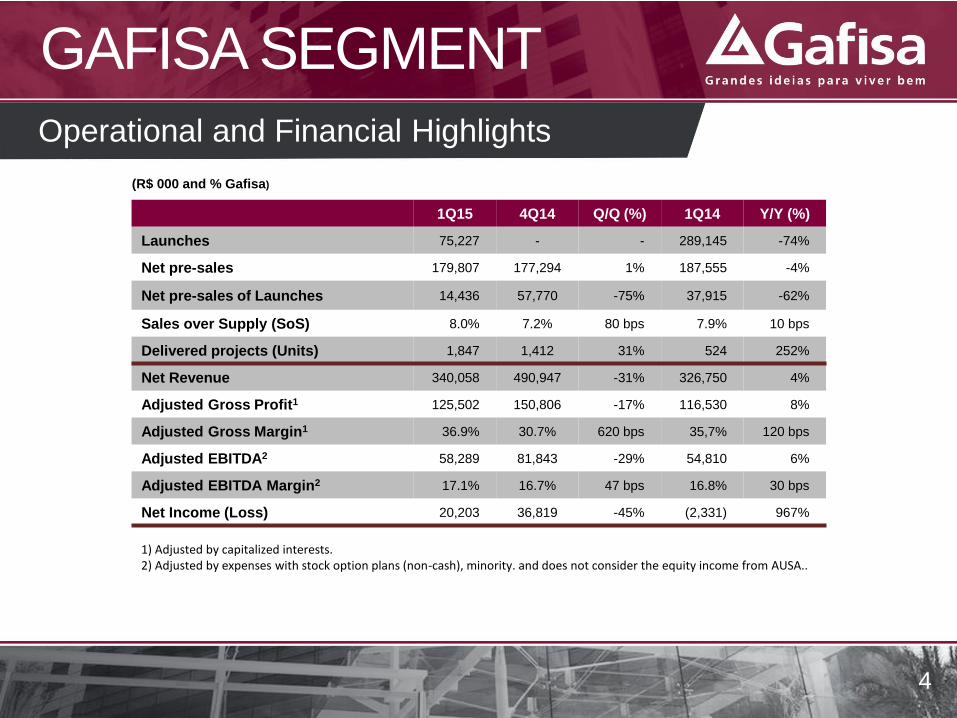
1) Adjusted by capitalized interests. 2) Adjusted by expenses with stock option plans (non-cash), minority. and does not consider the equity income from AUSA..
(R$ 000 and % Gafisa)
1Q15 4Q14 Q/Q (%) 1Q14 Y/Y (%)
Launches 75,227 - - 289,145 -74%
Net pre-sales 179,807 177,294 1% 187,555 -4%
Net pre-sales of Launches 14,436 57,770 -75% 37,915 -62%
Sales over Supply (SoS) 8.0% 7.2% 80 bps 7.9% 10 bps
Delivered projects (Units) 1,847 1,412 31% 524 252%
Net Revenue 340,058 490,947 -31% 326,750 4%
Adjusted Gross Profit1 125,502 150,806 -17% 116,530 8%
Adjusted Gross Margin1 36.9% 30.7% 620 bps 35,7% 120 bps
Adjusted EBITDA2 58,289 81,843 -29% 54,810 6%
Adjusted EBITDA Margin2 17.1% 16.7% 47 bps 16.8% 30 bps
Net Income (Loss) 20,203 36,819 -45% (2,331) 967%
5
SEGMENTO GAFISA Higher level of revenues and consistente gross margin
101
217
107
679
354 315
419
0 75
1Q13 2Q13 3Q13 4Q13 1Q14 2Q14 3Q14 4Q14 1Q15
Launches Gross Sales by Market
244
291
221
453
235
318 294
213
280
48 63 41 55
33 54 52 49
25
1Q13 2Q13 3Q13 4Q13 1Q14 2Q14 3Q14 4Q14 1Q15
SP + RJ Other Markets
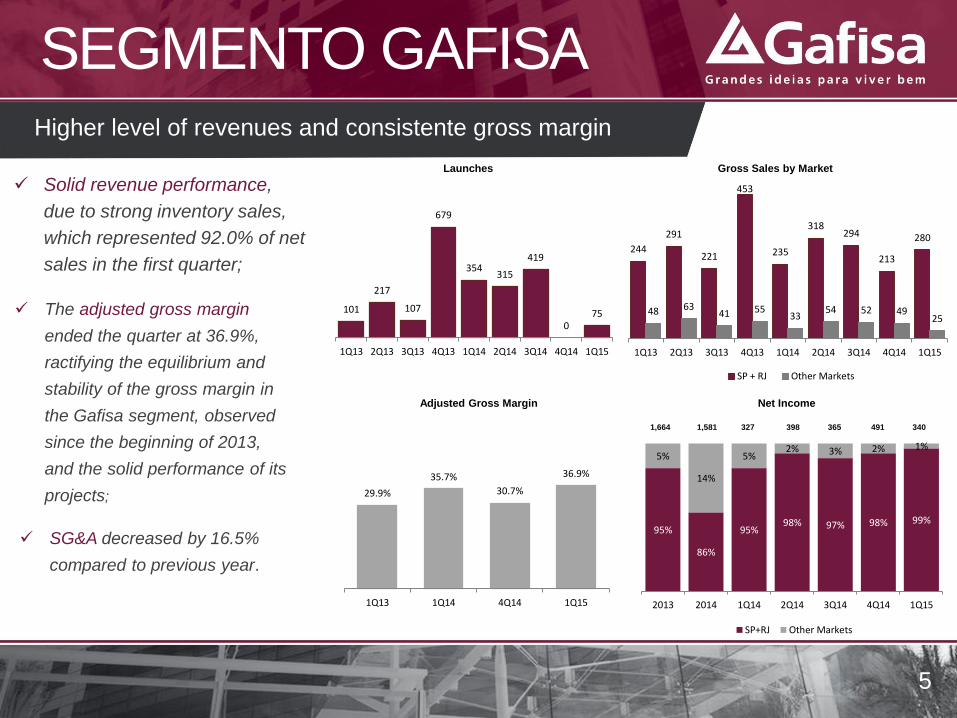
The adjusted gross margin
ended the quarter at 36.9%,
ractifying the equilibrium and
stability of the gross margin in
the Gafisa segment, observed
since the beginning of 2013,
and the solid performance of its
projects;
Solid revenue performance,
due to strong inventory sales,
which represented 92.0% of net
sales in the first quarter;
Net Income
SG&A decreased by 16.5%
compared to previous year.
29.9%
35.7%
30.7%
36.9%
1Q13 1Q14 4Q14 1Q15
95%
86%
95% 98% 97% 98% 99%
5%
14%
5% 2% 3% 2% 1%
2013 2014 1Q14 2Q14 3Q14 4Q14 1Q15
SP+RJ Other Markets
Adjusted Gross Margin
1,664 1,581 327 398 365 491 340
6
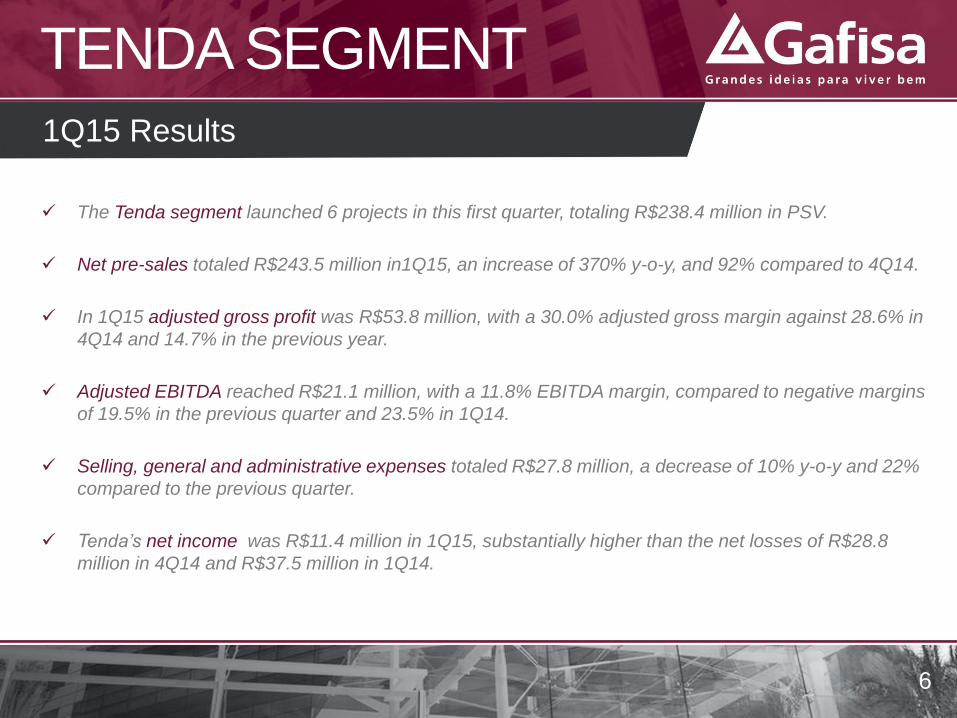
The Tenda segment launched 6 projects in this first quarter, totaling R$238.4 million in PSV.
Net pre-sales totaled R$243.5 million in1Q15, an increase of 370% y-o-y, and 92% compared to 4Q14.
In 1Q15 adjusted gross profit was R$53.8 million, with a 30.0% adjusted gross margin against 28.6% in
4Q14 and 14.7% in the previous year.
Adjusted EBITDA reached R$21.1 million, with a 11.8% EBITDA margin, compared to negative margins
of 19.5% in the previous quarter and 23.5% in 1Q14.
Selling, general and administrative expenses totaled R$27.8 million, a decrease of 10% y-o-y and 22%
compared to the previous quarter.
Tenda’s net income was R$11.4 million in 1Q15, substantially higher than the net losses of R$28.8
million in 4Q14 and R$37.5 million in 1Q14.
1Q15 Results
TENDA SEGMENT
7
TENDA SEGMENT
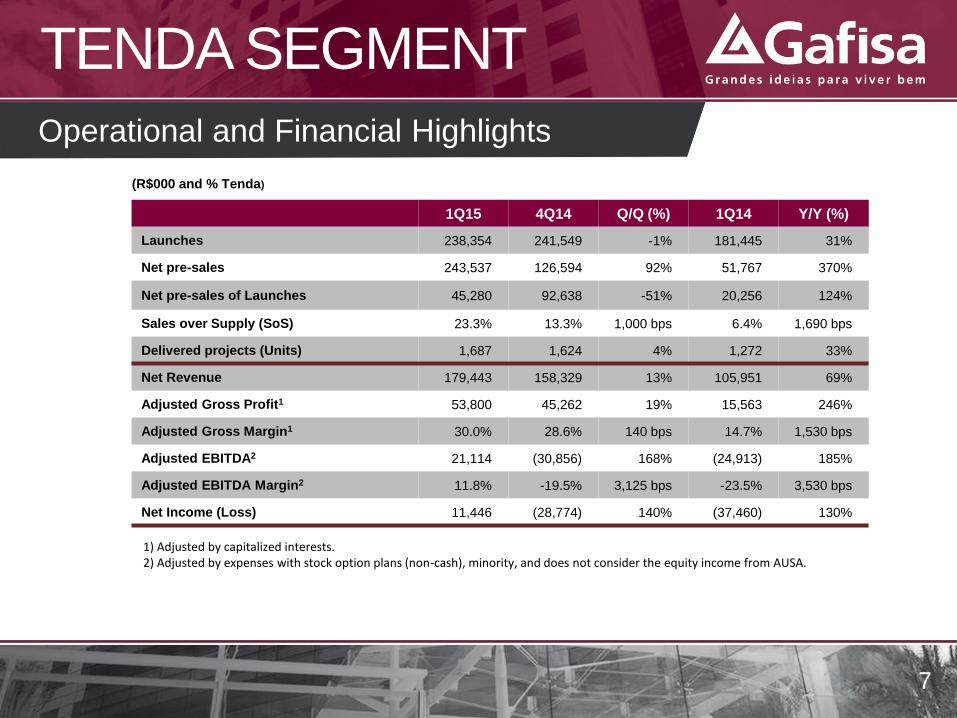
1Q15 4Q14 Q/Q (%) 1Q14 Y/Y (%)
Launches 238,354 241,549 -1% 181,445 31%
Net pre-sales 243,537 126,594 92% 51,767 370%
Net pre-sales of Launches 45,280 92,638 -51% 20,256 124%
Sales over Supply (SoS) 23.3% 13.3% 1,000 bps 6.4% 1,690 bps
Delivered projects (Units) 1,687 1,624 4% 1,272 33%
Net Revenue 179,443 158,329 13% 105,951 69%
Adjusted Gross Profit1 53,800 45,262 19% 15,563 246%
Adjusted Gross Margin1 30.0% 28.6% 140 bps 14.7% 1,530 bps
Adjusted EBITDA2 21,114 (30,856) 168% (24,913) 185%
Adjusted EBITDA Margin2 11.8% -19.5% 3,125 bps -23.5% 3,530 bps
Net Income (Loss) 11,446 (28,774) 140% (37,460) 130%
(R$000 and % Tenda)
Operational and Financial Highlights
1) Adjusted by capitalized interests. 2) Adjusted by expenses with stock option plans (non-cash), minority, and does not consider the equity income from AUSA.
8
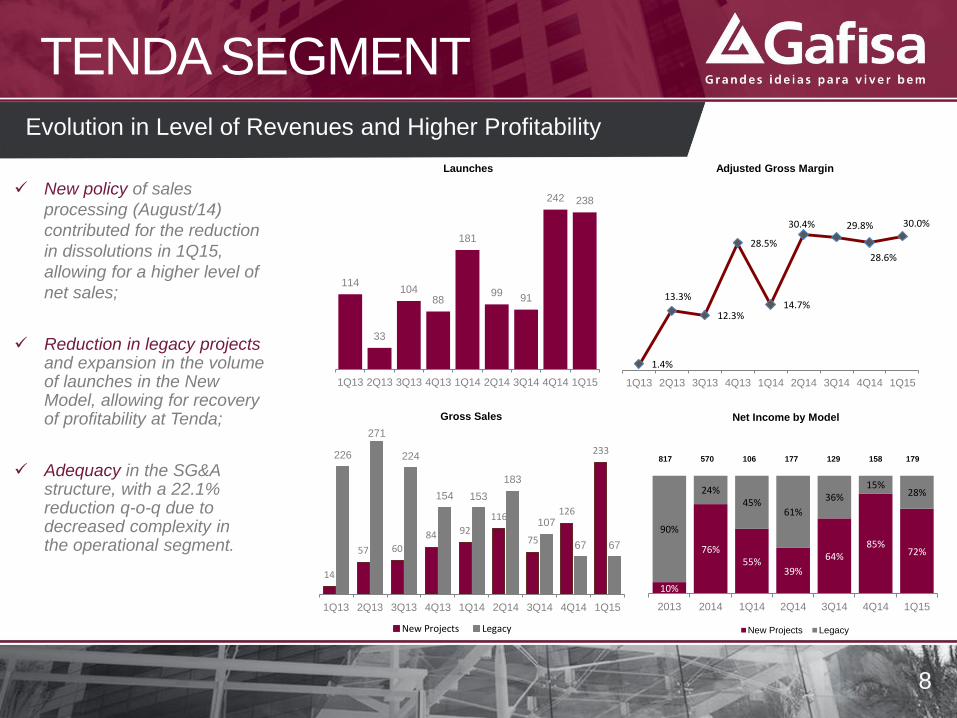
New policy of sales
processing (August/14)
contributed for the reduction
in dissolutions in 1Q15,
allowing for a higher level of
net sales;
Reduction in legacy projects and expansion in the volume of launches in the New Model, allowing for recovery of profitability at Tenda;
Adequacy in the SG&A structure, with a 22.1% reduction q-o-q due to decreased complexity in the operational segment.
TENDA SEGMENT Evolution in Level of Revenues and Higher Profitability
114
33
104 88
181
99 91
242 238
1Q13 2Q13 3Q13 4Q13 1Q14 2Q14 3Q14 4Q14 1Q15
14
57 60
84 92
116
75
126
233 226
271
224
154 153
183
107
67 67
1Q13 2Q13 3Q13 4Q13 1Q14 2Q14 3Q14 4Q14 1Q15
New Projects Legacy
1.4%
13.3%
12.3%
28.5%
14.7%
30.4% 29.8%
28.6%
30.0%
1Q13 2Q13 3Q13 4Q13 1Q14 2Q14 3Q14 4Q14 1Q15
10%
76% 55%
39%
64% 85%
72%
90%
24% 45%
61%
36% 15%
28%
2013 2014 1Q14 2Q14 3Q14 4Q14 1Q15
New Projects Legacy
Launches Adjusted Gross Margin
Gross Sales Net Income by Model
817 570 106 177 129 158 179
9
CONSOLIDATED RESULTS
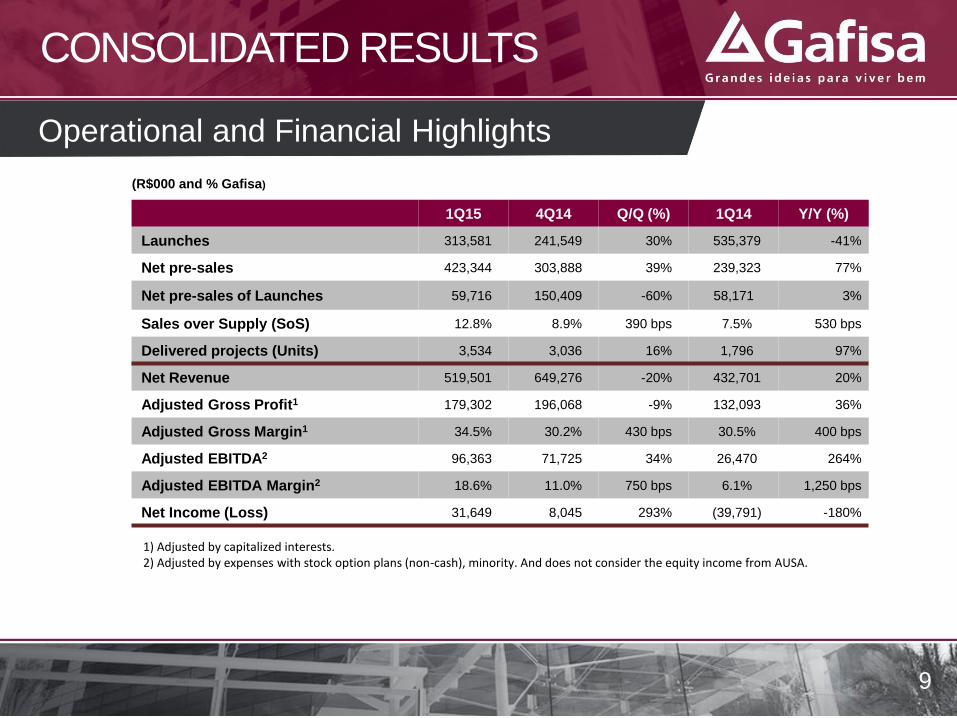
1Q15 4Q14 Q/Q (%) 1Q14 Y/Y (%)
Launches 313,581 241,549 30% 535,379 -41%
Net pre-sales 423,344 303,888 39% 239,323 77%
Net pre-sales of Launches 59,716 150,409 -60% 58,171 3%
Sales over Supply (SoS) 12.8% 8.9% 390 bps 7.5% 530 bps
Delivered projects (Units) 3,534 3,036 16% 1,796 97%
Net Revenue 519,501 649,276 -20% 432,701 20%
Adjusted Gross Profit1 179,302 196,068 -9% 132,093 36%
Adjusted Gross Margin1 34.5% 30.2% 430 bps 30.5% 400 bps
Adjusted EBITDA2 96,363 71,725 34% 26,470 264%
Adjusted EBITDA Margin2 18.6% 11.0% 750 bps 6.1% 1,250 bps
Net Income (Loss) 31,649 8,045 293% (39,791) -180%
(R$000 and % Gafisa)
Operational and Financial Highlights
1) Adjusted by capitalized interests. 2) Adjusted by expenses with stock option plans (non-cash), minority. And does not consider the equity income from AUSA.
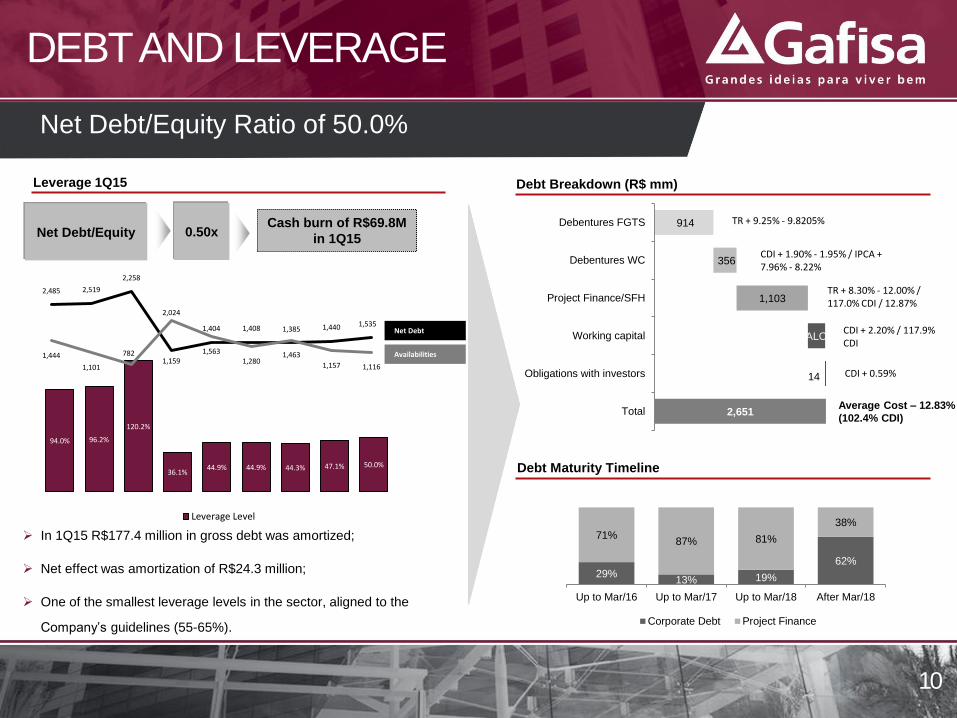
DEBT AND LEVERAGE
Net Debt/Equity Ratio of 50.0%
29% 13% 19%
62%
71% 87% 81%
38%
Up to Mar/16 Up to Mar/17 Up to Mar/18 After Mar/18
Corporate Debt Project Finance
2,651
914
14
[VALOR]
1,103
356
Total
Obligations with investors
Working capital
Project Finance/SFH
Debentures WC
Debentures FGTS
Debt Breakdown (R$ mm) Leverage 1Q15
Debt Maturity Timeline
Net Debt/Equity TR + 9.25% - 9.8205%
CDI + 1.90% - 1.95% / IPCA + 7.96% - 8.22%
TR + 8.30% - 12.00% / 117.0% CDI / 12.87%
CDI + 0.59%
CDI + 2.20% / 117.9% CDI
In 1Q15 R$177.4 million in gross debt was amortized;
Net effect was amortization of R$24.3 million;
One of the smallest leverage levels in the sector, aligned to the
Company’s guidelines (55-65%).
Average Cost – 12.83%
(102.4% CDI)
0.50x Cash burn of R$69.8M
in 1Q15
94.0% 96.2%
120.2%
36.1% 44.9% 44.9% 44.3% 47.1% 50.0%
Leverage Level
2,485 2,519
2,258
1,159
1,404 1,408 1,385 1,440 1,535
1,444
1,101
782
2,024
1,563 1,280
1,463
1,157 1,116
Availabilities
Net Debt
10
Processo de Spin Off
Ao longo do quarto trimestre, demos continuidade aos estudos para uma potencial separação das unidades de negócio Gafisa e Tenda. Durante o ano de 2014 foram implementadas uma série de ações, de modo a permitir uma operação independente: divisão efetiva de diversos departamentos, como Central de Serviços, Gente e Gestão, Jurídico, entre outras; alteração do registro da categoria de emissor de Tenda junto à (CVM), passando à Categoria A; atuação junto aos bancos e seguradoras para abertura de limite de crédito independente para Tenda; e mapeamento de contratos e avaliação de potencial impacto em virtude do spin-off. Adicionalmente, a Companhia segue dando prosseguimento aos estudos finais relacionados às alternativas de separação das duas empresas. Dentre as iniciativas e estudos sendo conduzidos, podemos destacar: • Avaliação das estruturas societárias possíveis; • Evolução dos processos de abertura de crédito em Tenda; • Avaliação sobre a futura estrutura de governança corporativa de Tenda; • Avaliação junto a BM&F/Bovespa dos procedimentos necessários para a negociação de Tenda, e avaliação de
potencial listagem de ADR Nível 1; • Definição de um modelo de estrutura de capital adequada ao ciclo de negócios de cada uma das empresas. Conforme informado quando do anuncio dos estudos iniciais, nossa expectativa é de que a potencial separação, caso aprovada, venha a ser implementada ainda no ano de 2015. A Companhia manterá seus acionistas e o mercado em geral informados quanto à evolução e os desenvolvimentos dessa potencial separação.
Status Atualizado
13
Since the beginning of the studies and evaluation of the potential separation of the GafIsa and Tenda
business units commenced in February 2014, a variety of activities have been executed in order to make the
two business units independent of one another, from both an operational perspective as well as from a
capital structure perspective. The following actions that have already been completed: (i) separation of the
administrative structures, with implementation of the changes required to processes and systems, (ii)
definition of policies and corporate governance, (iii) preparation of Tenda for having its shares traded in the
market, and (iv) performance of due diligence and studies of the various impacts the separation could have
on operational, organizational, financial and market-related aspects of the Companies.
Definition of the capital structure is one of the processes that is still ongoing, and the Company continues to
work with financial institutions in order to achieve the conditions deemed necessary for the capital structure
model, considering the business cycles of each of the business units.
As stated in a Material Fact released to the market on April 29, these discussions are ongoing and are taking
longer than had been expected initially. As a result, considering that this definition is a necessary step in the
separation process, it is not yet possible to determine when the potential separation will be concluded with
precision, and it is possible that the process could extend into 2016.
SPIN-OFF PROCESS
Updated status
11
Eventos Recentes
12
JCP e Dividendos
•No dia 12 de fevereiro de 2014, a Companhia distribuiu juros sobre o capital próprio para seus acionistas no montante total de R$130,2 milhões, e ao final do ano no dia 11 de dezembro de 2014 foi efetivado o pagamento de dividendo complementar, na totalidade de R$32,9 milhões. Dessa maneira, no exercício de 2014, a Companhia distribuiu a seus acionistas um total de R$163,1 milhões, aproximadamente R$0,40 por ação, representando um yield – caixa de 17,9% ante o preço de fechamento de 2014.
Programa Recompra Ações
•Desde o início de 2013 a Companhia, por meio de seus programas de recompra de ações, já adquiriu no mercado 73,2 milhões de ações, totalizando um desembolso de caixa de R$208,7 milhões nos últimos 24 meses. Apenas no ano de 2014, foram recompradas 54,7 milhões de ações, perfazendo R$137,4 milhões desembolsados. Do total de ações adquiridas, 57,5 milhões foram canceladas, representando cerca de 15,2% do total de ações emitidas pela Companhia. Atualmente, há um novo programa de recompra de ações no total de 27,0 milhões de ações a ser executado até fevereiro de 2016, respeitando o limite de alavancagem consolidada de 60%.
RECENT EVENTS
12
Material Fact – Potential Transaction
• In a Material Fact released to the market on April 29, the Company informed the market that it had been contacted by groups interested in evaluating the potential acquisition of an equity stake in Gafisa and Tenda, either together or separately. At this time, no proposals have been accepted or any contracts entered into by the Companies, with the exception of confidentiality agreements due to requests for information by the interested parties involved in these studies.
• The Administrations, in accordance with their fiduciary responsibilities, will evaluate any proposals that could result in the creation of value for the Companies and will communicate to their shareholders and the market in general any evolution in these discussions through presentation of a formal proposal.
Share Buyback Program
• Reaffirming our commitment to our shareholders, since the end of 2013, through the variety of buyback programs offered during the period, we have acquired 63.2 million shares. Of this amount, 57.5 million, representing 15.2% of total shares issued by the Company, have already been cancelled. In 1Q15, through the old buyback program, the Company acquired 10.9 million shares, which amounted to disbursements of R$22.1 million.
• Furthermore, the Company started a new share buyback program, which began in February of this year, with a limit of up to 27 million common shares. When added to the 10.8 million shares currently held in treasury, the total corresponds to approximately 10% of the total common shares issued by the Company.