earned value management system in … · yang berkemampuan untuk kerja pengukuran prestasi projek...
TRANSCRIPT

EARNED VALUE MANAGEMENT SYSTEM IN
MANUFACTURING INDUSTRY
FATEMEH RASOOLI HAGHIGHI
DISSERTATION SUBMITTED TO THE FACULTY OF ENGINEERING,
UNIVERSITY OF MALAYA IN PARTIAL FULFILLMENT OF THE REQUIREMENT
FOR THE DEGREE OF MASTER IN ENGINEERING (MECHANICAL)
2013

UNIVERSITI MALAYA ORIGINAL LITERARY WORK DECLARATION
Name of Candidate: FATEMEH RASOOLI HAGHGHI (I.C/Passport No:
Registration/Matric No: KGH100025
Name of Degree: Master of MECHANICAL ENGINEERING Title of Project Paper/Research Report/Dissertation/Thesis (“this Work”):
EARNED VALUE MANAGEMENT IN THE MANUFACTURING INDUSTRY
Field of Study: PROJECT MANAGEMENT
I do solemnly and sincerely declare that:
(1) I am the sole author/writer of this Work; (2) This Work is original; (3) Any use of any work in which copyright exists was done by way of fair dealing and for
permitted purposes and any excerpt or extract from, or reference to or reproduction of any copyright work has been disclosed expressly and sufficiently and the title of the Work and its authorship have been acknowledged in this Work;
(4) I do not have any actual knowledge nor do I ought reasonably to know that the making of this work constitutes an infringement of any copyright work;
(5) I hereby assign all and every rights in the copyright to this Work to the University of Malaya (“UM”), who henceforth shall be owner of the copyright in this Work and that any reproduction or use in any form or by any means whatsoever is prohibited without the written consent of UM having been first had and obtained;
(6) I am fully aware that if in the course of making this Work I have infringed any copyright whether intentionally or otherwise, I may be subject to legal action or any other action as may be determined by UM.
Candidate’s Signature Date
Subscribed and solemnly declared before,
Witness’s Signature Date
Name:
Designation:

i
This project paper is dedicated to my lovely family: my father Mansoor, my mother
Rima, and my sister Elnaz and to my beloved friend Hamed.
ii
ACKNOWLEDGEMENTS
I would like to thank everyone who had contributed to the successful completion of
this dissertation.
My deepest thank to my supervisor, Ir. Dr. Abu Bakar Mahat for his valuable
advices, guidance and his enormous patience throughout the development of the research
with attention and care.
I express my thanks and deep sense of gratitude to Mr. Kamaludin Ahmad,
Manager-Planning & Kaizen Department and Mr. Mohamed Nor Hassan, Executive-
Marketing & Sales Department, from MCIS Safety Glass Company support and guidance.
Thanks and appreciation to the helpful people at MCIS Safety Glass Company for their
support.
I would also thank my institution and my faculty members without whom this
project would have been a distant reality. I also extend my heartfelt thanks to my family
and well-wishers.
Fatemeh Rasooli Haghighi
Malaysia, May 2013

iii
ABSTRAK
Pengurusan projek adalah proses perancangan, penyusunan, motivasi dan
pengawalan sumber-sumber masa dan kos bagi mencapai matlamat tertentu yang dikenali
sebagai skop projek. Pengurusan Nilai diPerolehi (EVM) atau Nilai Projek diPerolehi /
Pengurusan Prestasi (EVPM) adalah teknik pengurusan projek yang mengukur kemajuan
projek dan prestasi secara objektif dan memberi ramalan yang tepat mengenai masalah
prestasi projek (Marshall, 2006). EVM diterima secara meluas dalam projek-projek
pembuatan di negara-negara maju seperti Amerika Syarikat, United Kingdom dan Australia
(Garrett, 2006). Pengurusan Nilai (EV) yang diperolehi tidak dikenali sebagai cara yang
biasa digunakan dalam sektor industri pembuatan di Malaysia (Khamidi, Ali et al., (2011).
Kajian ini akan membincangkan teknik Pengurusan Nilai diperolehi, satu kaedah untuk
menilai dan mengukur prestasi projek dan kemajuan, yang dikenali sebagai salah satu yang
paling tepat dan tajam teknik menguruskan (Vandevoorde & Vanhoucke, (2006), Moslemi
Naeni, Shadrokh et al. (2013)). Menurut Anbari (2003), EV diperolehi adalah satu kaedah
yang berkesan dalam pengurusan projek dan pengendalian yang menyokong kos, masa dan
skop projek. Brandon & Daniel (1998) juga memperkenalkan EVM sebagai satu teknik
yang berkemampuan untuk kerja pengukuran prestasi projek sebenar.
Bagi tujuan untuk menunjukkan keberkesanan EVM dalam pengurusan projek
pembuatan dan bagaimana diperolehi hasil dari pelaksanaan EVM, ianya akan membantu
pengurus projek dalam mengemukakan ramalan projek dan pengurusan dalam sektor
pembuatan, EVM dilaksanakan pada projek pembuatan menghasilkan kaca mata
keselamatan dalam industri automobil di Malaysia. Tujuan kerja ini adalah untuk
menunjukkan bahawa bagaimana teknik EVM boleh digunakan bagi projek-projek
perkilangan di Malaysia. Keputusan yang diperolehi daripada pelaksanaan EVM projek

iv
pembuatan ini bertujuan untuk menunjukkan bahawa EVM boleh memberi gambaran yang
sangat jelas prestasi projek dan pengurus projek serta menyediakan penilaian yang tepat
bagi kemajuan projek. Teknik ini akan membolehkan pengurus projek menilai prestasi
projek secara lebih mendalam dan membantu pengurus projek untuk mengawal dengan
lebih berkesan, memantau dan menguruskan kos projek dan jadual. Selain itu, EVM akan
memudahkan pengurus projek memberikan ramalan yang terbaik trend jangkaan prestasi
projek tersebut.
Keywords: Pengurusan diNilai Projek (EVM), Pengukuran Prestasi Projek, Ramalan
Prestasi Projek berMasalah, Pengurusan Projek Pembuatan.

v
ABSTRACT
Project management is the act of planning, organizing, motivating and controlling
resources of time and cost to achieve specific goals known as scope of project. Earned
Value Management (EVM) or Earned Value Project/Performance Management (EVPM) is
a project management technique that measures project progress and performance in an
objective manner and provide accurate forecast of project performance problem (Marshall
2006). EVM is widely accepted in many manufacturing projects in developed countries
such as the USA, UK and Australia (Garrett,2006). EVM is not classified as a common
used tool in manufacturing industry sector in Malaysia (Khamidi, Ali et al. 2011). This
study will discuss the technique of EVM, a method of evaluating and measuring project
performance and progress, which is known as one of the most accurate and sharp managing
techniques (Vandevoorde and Vanhoucke 2006, Moslemi Naeni, Shadrokh et al. 2013).
According to Anbari (2003), EVM is a powerful method of project management and
handling that supports cost, time and scope of project. Brandon & Daniel,1998 also
introduced EVM as a powerful technique of true project performance measurement.
In order to practically demonstrate the effectiveness of EVM on manufacturing
project management and how obtained result from EVM implementation would help
project managers in project forecast and management in manufacturing sector, EVM is
implemented on a manufacturing project producing safety glasses for automobile industry
in Malaysia. The aim of this work is to show that how EVM can be applied to Malaysian
manufacturing projects. The results obtained from successful implementation of EVM on
purposed manufacturing project demonstrated that EVM can bring a very clear view of the
project and provide project managers strong insight into the project progress. This
technique would enable project managers to assess project performance more in-depth and

vi
help project managers to effectively control, monitor and manage project cost and schedule.
Moreover EVM facilitates project managers with a very good prediction of future
performance trend of the project.
Keywords: Project Management, Earned Value Management (EVM), Project Performance
Measurement, Forecast Project Performance Problem, Manufacturing Project Management

vii
TABLE OF CONTENTS
ACKNOWLEDGEMENTS .............................................................................................. ii
ABSTRAK ......................................................................................................................... iii
ABSTRACT ........................................................................................................................ v
TABLE OF CONTENTS ................................................................................................ vii
LIST OF TABLES ............................................................................................................. x
LIST OF FIGURES .......................................................................................................... xi
LIST OF ABBREVIATIONS ......................................................................................... xii
LIST OF FORMULAS ................................................................................................... xiii
CHAPTER ONE ................................................................................................................ 1
INTRODUCTION ............................................................................................................. 1
1. Introduction ............................................................................................................. 1
1.1 Background of study ............................................................................................. 1
1.2 Problem Statement ................................................................................................ 2
1.3 Objectives of the Study ......................................................................................... 4
1.4 Disposition ............................................................................................................. 4
Chapter Two ....................................................................................................................... 6
EARNED VALUE, A PROJECT MANAGEMENT TECHNIQUE ............................ 6
2. Earned Value Management .................................................................................... 6
2.1 Introduction ........................................................................................................... 6
2.2 Traditional Project Management ........................................................................... 8
2.3 History of EVM ..................................................................................................... 9
2.4 EVM: How it works? .......................................................................................... 11
i. How much value is expecting to be obtained from progress according to
planned schedule? (Planned Value, PV) ................................................................................... 11
CHAPTER THREE ......................................................................................................... 14
REVIEW OF RELATED LITERATURE .................................................................... 14
3. Literature Review.................................................................................................. 14
3.1 Introduction ......................................................................................................... 14
3.2 Earned Value Management Technique Key Components................................... 14
3.3 Commercially Available EVM Tools .................................................................. 19

viii
3.4 Benefits of Earned Value Management ............................................................... 21
3.5 Application .......................................................................................................... 24
3.6 Related Earned Value Study ................................................................................ 25
CHAPTER FOUR............................................................................................................ 28
METHODOLOGY AND SURVEY DATA ................................................................... 28
4. Method and Principle ........................................................................................... 28
4.1 Introduction ......................................................................................................... 28
4.2 Methods ............................................................................................................... 29
4.2.1 Difference Measurement (Variances) ............................................................ 29
4.2.2 Efficiency Measurement (Indices) ................................................................. 30
4.2.3 Forecast (Estimate at Completion) ................................................................. 33
4.3 Other EVM Methods of Measurement ................................................................ 35
4.3.1 To Complete Performance Index, (TCPI) ...................................................... 35
4.3.2 Estimate to Completion, ETC ........................................................................ 36
4.4 MCIS SAFETY GLASS Sdn Bhd ....................................................................... 37
4.5 Background ......................................................................................................... 38
4.5.1 MCIS Production of Glasses for Proton Suzuki Swift Car ............................ 38
4.5.2 Batch Production ............................................................................................ 39
4.6 Survey Data and Application of EVM ................................................................ 42
4.6.1 Planned Value ................................................................................................ 43
4.6.2 Earned Value .................................................................................................. 49
4.6.3 Actual Cost ..................................................................................................... 51
CHAPTER FIVE ............................................................................................................. 54
RESULTS AND DISCUSSION ...................................................................................... 54
5.1 Introduction ......................................................................................................... 54
5.2 Variances and Indices .......................................................................................... 54
5.2.1 Cost Variance (CV) and Cost Performance Index ......................................... 54
5.2.2 Schedule Variance & Schedule Performance Index ...................................... 56
5.2.3 Forecasting (Estimate at Completion) ............................................................ 58
CHAPTER SIX ................................................................................................................ 62
CONCLUSIONS AND SUGGESTIONS FOR FUTURE WORK .............................. 62
6. Conclusions ............................................................................................................ 62

ix
6.1 Suggestions .......................................................................................................... 64
REFERENCES................................................................................................................. 65
Appendix A ................................................................................................................... 70
Appendix B ................................................................................................................... 71
x
LIST OF TABLES
Table1: Other Researches on EVM Cost ………………………………….. 23
Table2: OEM Costing………………………………………………………. 46
Table3: Monthly Planned Value & Cumulative Planned Value……………. 48
Table4: Earned Value ………………………………………………………. 50
Table5: Actual Cost ………………………………………………………... 53
Table6: Earned Value Cost Analysis ………………………………………. 55
Table7: Earned Value Schedule Analysis …………………………………. 57

xi
LIST OF FIGURES
Figure 1: System Perspective on the Control of an Organization…………………… 6
Figure 2: Traditional Project Management …………………………………………. 9
Figure 3: Basic Elements of EVM ………………………………………………….. 12
Figure 4: EVM Graphical Presentation ……………………………………………... 16
Figure 5: SV & CV Graph ………………………………………………………….. 17
Figure 6: Fundamental of Earned Value Management …………………………….. 22
Figure 7: Ten Benefits of EVM ……………………………………………………. 24
Figure 8: Traditional Graphical Report-SPI & CPI ………………………………… 32
Figure 9: MCIS Safety Glass Manufacturing Process …………………………….. 41
Figure 10: Cumulative Cash-Flow ………………………………………………….. 47
Figure 11: Earned Value ……………………………………………………………. 49
Figure 12: Actual Cost ……………………………………………………………… 52
Figure 13: PV, AC, &EV at Time-Now …………………………………………….. 59
Figure 14: Estimate at Completion …………………………………………………. 60
Figure 15: EAC in Comparison with final Actual Cost …………………………….. 61
Picture 1: Malaysia Calendar, 2008 ………………………………………………… 44

xii
LIST OF ABBREVIATIONS
PV Planned Value
EV Earned Value
AC Actual Cost
CV Cost Variance
SV Schedule Variance
CVP Cost Variance Percentage
SVP Schedule Variance Percentage
CPI Cost Performance Index
SPI Schedule Performance Index
EVM Earned Value Management
PM Project Manager
EAC (c) Estimate at Completion of Cost
EAC (T) Estimate at Completion of Time
BAC Budget at Completion
AUT Actual Time Utilized
PD Planned Duration
TCPI To Complete Performance Index
ETC Estimate to Completion
OB Original Budget
BP Batch Production
WSH Windshield Car Glass
FD Front Door Car Glass
RD Rear Door Car Glass
RRQ Rear Quarter Car Glass
PC Percentage to Complete
BCWP Budgeted Cost of Work Performed or EV
ACWP Actual Cost of Work Performed or AC
BCWS Budgeted Cost of Work Schedule
DOD Department of Defense
SET A Set of car glasses containing of WSH, FD, RD and RRQ

xiii
LIST OF FORMULAS
CV = EV-AC
SV = EV-PV
CPI = EV/AC
SPI = EV/PV
TCPI = (OB-EV) / (OB-AC)
EAC1(C) = AC + (BAC-EV) / CPI
EAC2(C) = BAC / CPI
EAC1(T) = ATU + (PD-ATU×SPI) / SPI
EAC2(T) = PD/SPI
ETC = EAC-AC = (BAC-AC) / CPI

1
CHAPTER ONE
INTRODUCTION
1. Introduction
1.1 Background of study
This study described the Earned Value Management method for manufacturing
project producing safety glassed for automotive industry in Malaysia. In Malaysia the
number of high-tech manufacturing projects are growing rapidly and since manufacturing
has a great influence on country economy it is important for company owners, project
managers and contractor to control and monitor their projects cost, time and scope
effectively. The performance of project can be assess by employing different traditional
methods and approaches like day to day monitoring, monthly or weekly management
reports, performance reviews, project audit report etc. (Rodrigues and Bowers 1996,
Wysocki and McGary,(2003)). In traditional approaches two types of information are
evaluated the budget (or planned) expenditure and the actual cost. In these methods the
actual cost is compared with planned expenditure and indicated that how much has been
spent at any given time. And also how much has been produced. Therefore, there is no way
to determine physical amount of work performed. In traditional methods neither can be
determined physical amount of work produced nor is it being produced according to
schedule originally planned (United States of America Department of Energy). Based on
limitation of traditional project management technique this study discusses Earned Value
Management (EVM) as an effective tool for project performance and progress
measurement, controlling and monitoring. This project management technique integrates

2
project cost, time and scope and enables project managers to forecast future progress trend
of project.
EVM uses three data sources including Planned Value (PV) or budgeted work
scheduled, Actual Cost (AC) or actual expenditure and Earned Value (EV) of physical
work performed; and compare these elements to assess project performance (United States
of America Department of Energy). To define what means by project performance: it is the
overall quality of a project in terms of its impact, value to beneficiaries, implementation
effectiveness, and efficiency and sustainability (A Guide for Project M&E,1977).
1.2 Problem Statement
This research project focuses on application of Earned Value Management (EVM)
method on a manufacturing project completed in MCIS Safety Glass Sdn Bhd in Malaysia.
The project goal is production of four types of car glasses including windshield, front door
(L/R), rear door (L/R), and rear quarter (L/R) windows for Suzuki Swift.
With the rise in number of industrial and service projects, EVM as a new and
efficient method plays an important role in integrated project controlling. Earned Value
Management is one of the methods have been used and given special attention to in today`s
world to manage and control project time and expenses (Chou, Chen et al. 2010, Khamidi,
Ali et al. 2011, Garrett,2006). Using this powerful technique, project management team can
control project performance considering originally planned cost and time of project and
thereby reduce potential losses and risk assessment(Khamidi, Ali et al. 2011). Earned Value
management expresses the relation between current real cost and work done and focuses on
project performance conformity. EVM also indicates what resources were used and what
was achieved related to the actual cost spent. If fact it makes a comparison between

3
amounts were really spent on project and what budget plan expected to be spent till time-
now. So it is clear that Earned Value can be measured after each activity is completed.
In Malaysia, the concept of Earned Value Management have not been well
appreciated by project managers, company owners and it is not very common for project
managers and contractors to implement EVM as a project management technique
(Khamidi, Ali et al. 2011). In this work Earned Value management will be introduced and
effects and results of applying Earned Value Management to projects will be discussed. To
provide real and acknowledged information and results, this method has been applied on a
completed manufacturing project from MCIS Safety Glass Sdn Bhd Company in Malaysia.
EVM is a measuring and monitoring tool for project management while project is in
ongoing phase and can provide early warnings, even after only 15 percent of project is
accomplished (Fleming and Koppelman 2006). EVM also would help project managers to
detect cost and schedule incompatibility and predict project performance and total funds
needed to finish the project. As mentioned previously during this work EVM has been
implemented on a completed job to see whether EVM predictions of cost and schedule
would match the real final result. Note that though EVM is a tool providing early warnings
and enables managers to monitor and control project progress, while considering health of
project and comparing that with the planned progress, this technique does not suggest or
recommend any solution to help project performance improvement. Meaning that EVM is
only a monitoring tool and it is project manager team responsibility to decide how to
improve the progress.
EVM is relatively less common tool utilized for project monitoring and performance
control for Malaysian manufacturing industry and currently it is rarely used as project
monitoring and controlling tool. Therefore this study shows that how EVM can be
effectively implemented in order to be used as project management technique.

4
1.3 Objectives of the Study
The main purpose of this dissertation is to study the application of Earned Value
Management in a manufacturing project. Control of project performance improvement
resulted from EVM implementation will also be determined. Findings obtained from EVM
application and calculations demonstrate that EVM is a reliable technique for project
tracking, monitoring and estimating in manufacturing industry sector in order to improve
the project management. This study has four objectives that need to be achieved and
reported in this study.
The study focuses of following four main objectives:
i. To assess EVM as a project performance monitoring, controlling and
measurement tool.
ii. To study how EVM can add value to project performance management and
manufacturing projects.
iii. To find out how accurate and precise are the results obtained from EVM
calculations.
iv. To study that how EVM can predict the future progress trend of the project.
1.4 Disposition
Chapter Two of this dissertation will give a general view about Earned Value
Management to familiarize the readers with EVM technique. In Chapter Three all
necessary basics of EVM concept are discussed and some interesting studies
concerning the implementation of EVM are summarized. Chapter Four focuses on
methodology of our work and the project in which the EVM was implemented is

5
introduced. Chapter Five is giving an overall result of this study. And last but not
least, in Chapter Six conclusion and suggestions are discussed.

6
Chapter Two
EARNED VALUE, A PROJECT MANAGEMENT TECHNIQUE
2. Earned Value Management
2.1 Introduction
Progress measurement is an activity that managers perform in order to reach the
predefined goals that are derived from the company’s strategic objectives. Figure 1,
illustrates this idea by taking a systems perspective on the control of an organization
(Lohman, Fortuin et al. 2004, Lohman,(1999)). In this figure at the transformation process
(operational level) a comparison of input and output values with predefined goals takes
place.
Figure 1: System perspective on the control of an organization (Lohman, 1999)
Input Output
Initiating Evaluating
Comparison Control
Function
Transformation Process

7
If there is discrepancy between the actual value and desire goals knowledge about
the behavior of organization is used to find an appropriate action that means modifying the
progress. The ability to measure the performance of operations can be seen as an important
prerequisite for improvement, and companies can increase the capabilities of their
performance measurement systems (PMSs) (Lohman, Fortuin et al. 2004, Neely, Gregory
et al.,(1995)). A large number of industrial and non-industrial projects have employed
project performance measurement effectively (Neely, Gregory et al.,(1995), Pillai, Joshi et
al.,(2002), Bassioni, Price et al.,(2004)).
Manufacturing companies can improve their organization profits and business if
they would be able to monitor project performance data and to detect unpredicted problems
of cost and schedule immediately in order to take correction actions. Monitoring project
data and presenting them visually in form of graphs, charts and tables is easier and more
understandable rather than numerical information. Moreover with graphical information
presentation there is no need for companies to train stuff for interpreting complex
numerical information. This idea would be achieved by choosing an adequate project
controlling and managing technique such as Earned Value Management (EVM).
Effective implementation of EVM would influence manufacturing project especially
in production phase in which the capability of change in cost and schedule plan reduces
noticeably. Project management techniques other than EVM such as WBS (work
breakdown structure) are generally applicable in project planning and initiation while using
EVM in an on-going project enables PMs to update project information frequently and to
predict and measure project outcome and performance.
Therefore EVM is a powerful management technique that enables project managers
to control and track project performance by not only monitoring project key performance
indicators and expressing them usefully but also highlighting risks and measuring project

8
performance. EVM can provide a baseline for project performance measurement so that
project outcome can be determined and controlled.
2.2 Traditional Project Management
Traditional project management is only concerning today`s date and real amount of
money spent up to the date. The actual spent money is then compared with the related
budgeted cost of the project as per schedule to measure the project performance. However,
the actual performance of the project is never measured (Wysocki and McGary,(2003)).
Considering Figure2, in traditional project management the result will not give us any view
of how much physical work have accomplished up to time-now. The only matter
considering in traditional approach is about funding and not project performance (Khamidi,
Ali et al. 2011). Let us think of simple example, consider a project that is funded
RM1,000,000 for a period of 10 months allocating budget of RM100, 000 for each month.
It is now month three and according to schedule the amount of RM300,000 should be spent,
the actual cost spent is RM300,000 as well, since the difference between measured values is
zero it can be concluded that the results are perfect against the planed expenditure
nevertheless in this method the physical completion of project is not reflected. So the
project performance will never be measured.

9
Figure 2: Traditional Project Management
2.3 History of EVM
The Earned Value concept is not in any way new, in fact the basics and the ideas
have been used for more than a century. In the late nineteenth century the industrial
workers in the American factories started using the concept of earned value. The workers
measured their earned work and actual expenses which they compared to the planned
standards. These measurements were their way to control the work in the factories. Since
they also had defined the cost variance, consisting of the actual money spent relative to the
work achieved, they used the core of earned value although they did not address it that way.
One could say that this basic definition of cost variance is what characterizes earned value
(Cabri and Griffiths,(2006)).
In the end of the 1950’s the United States Navy introduced the Program Evaluation
Review Technique (PERT) as a network scheduling and risk management device. In 1962
RM0.00
RM200.00
RM400.00
RM600.00
RM800.00
RM1,000.00
RM1,200.00
0 2 4 6 8 10 12
Tho
usa
nd
s Planned Cost
Spent Money
Time (Month)
Cost
,

10
PERT was extended to PERT/costs aiming to add resources to the time scheduler. Since the
computers back then was not powerful enough PERT did not live on for many years.
However PERT left something to the afterworld. The implementation of PERT/costs had
required some new reporting formats from the contractors. One of those formats contained
“value of work performed” versus “actual cost”(Koppelman (2005))
By the second half of the 1960’s the United States Air Force made a new effort to
oversee the industry performance. Instead of imposing a specific management control
system they wanted the industry to satisfy some criteria with their existing management
control systems. The result was an earned value concept called Cost/Schedule Control
Systems Criteria (C/SCSC) which comprise 35 criteria that one had to adapt while being a
contractor for the Department of Defense (DoD) (Buyse, Vandenbussche et al.,(2006)).
During the next three decades the C/SCSC evolved to be more and more difficult to
use. The basic criteria were added with implementation guidelines, surveillance manuals
and implementation checklist which were intended to be used as guidelines used with good
judgments. However the guidelines were not always used as guidelines but instead as
peremptory rules. Furthermore the private sector never adapted the C/SCSC. One of the
main reasons why the industry never adopted the C/SCSC, except the rigid guidelines, was
the new vocabulary. Instead of calling things what they are C/SCSC used their own
expressions and abbreviations. For example earned value was called “Budgeted Cost of
Work Performed”, BCWP, or simply “p”. Overrun was called OTB which stood for “Over
Target Baseline”. Some of those expressions are still used today by some people, although
there are simpler expressions meaning the same thing (Buyse, Vandenbussche et
al.,(2006)).
In 1995, the National Defense Industrial Association, NDIA, accepted the task of
rewriting DoD’s formal earned value criteria. The objective of the rewriting was to make

11
the criteria more practicable for the private industry. The 35 criteria became 32 and terms
as Budgeted Cost Work Performed (BCWP) and Budgeted Cost Work Scheduled (BCWS)
where changed to Earned Value and Planned Value. But the main change was in the
attitude of all parties. The private company was now adopting the technique since it had
proven to be best-practice instead of something that were forced from the government to
their contractors (Koppelman, 2005).
2.4 EVM: How it works?
The concept of Earned Value Management is to measure the physical progress
against planned details of a project to determine a good prediction of final cost and
schedule of the project (Fleming and Koppelman 2000).
Generally the EVM is used for project where estimation of costs and time at
completion is required. EVM would enable project managers to predict and control cost of
a given task as well as comparing that cost with what it was planned to be. The concept of
EVM is commonly used because it is easy to understand and also integrates time, cost, and
scope of the project present them into understandable form. According to Fleming and
Koppelman (2000), EVM focuses on actual performance obtained against what was spent
to achieve that result.
To explain Earned Value Management, Webb (2003) stated that EVM has three
basics value, Figure 3:
i. How much value is expecting to be obtained from progress according to
planned schedule? (Planned Value, PV)
ii. How much money has been spent up to time-now? (Actual Cost, AC) &
iii. How much value has been obtained or generated in reality up to time-now?
(Earned Value, EV) (Webb 2003)

12
It is very important to understand these basic elements to find out how EVM works
and comes in handy.
To clarify the EVM concept and its basic elements, let us bring an example: think of
a project that is to be completed within 12 months and the total cost of the project is
RM100,000. According to schedule after 6months 50% of the work should be completed.
So the schedule says that in the sixth month we are supposed to have done 50 percent of the
total work, then that is the percent of the total budget that we have earned so far. Therefore
the Planned Value is 50% of RM100,000, then PV = RM50,000.
Now we want to track how our project is actually doing versus budget then we have
to use Earned Value. Six months have passed and according to project financial data
RM60,000 has been spent, however, on closer view we found out that only 40% of total
work is done. From this statement it is clear that 40% of project scope is delivered to
Earned Value (EV)
Planned Value (PV)
Actual Cost (AC)
Cost
Time Time-now
Figure 3: Basic elements of EVM, source: (Webb 2003)
13
costumer or is achieved, since the Earned Value is the value of work completed in reality
then EV= 40% of the total budget, EV40 = RM40,000. On the other hand the Actual Cost
that is the actual money spent up to time-now is equal to RM60,000.
The EVM is applied to a project as the necessity of better vision of both cost and
schedule perspective would be recognized. Although the ability of EVM is generally
known as providing a clear view of how well the project is progressing and defining points
that it is over budget or cost, it is possible to acquire followings using EVM (Buyse,
Vandenbussche et al.,(2006)):
I. Early warning of any decline and unexpected problems so that project
managers team have chance to make corrective action before it is too late.
II. Accurate prediction of outcome enables PMs to make better decisions about
course of the project.
III. Accurate prediction also enables PMs to make better decisions about project
surroundings that may be influenced as the project progresses.
IV. A clear and verifiable view of project progress improves sponsor confidence
and costumer reliability.

14
CHAPTER THREE
REVIEW OF RELATED LITERATURE
3. Literature Review
3.1 Introduction
Earned Value Management is a technique that integrates three elements of project
management, time, cost, and schedule. It helps the project managers to calculate the cost
and schedule variances and to estimate the cost and schedule at completion (Chou, Chen et
al. 2010).
EVM works as a powerful tool that allows project performance monitoring at any
stage of the project. This will give project manager team the chance to detect cost and
schedule overruns at the early stage to modify the project progress and prevent project to
forget then its predefined goals . Effective implementation of EVM will affect strongly the
project progress where detailed information of project is needed and the ability of changing
cost and schedule reduces, that is called execution phase(Anbari 2003, Anbari Dec 2003).
Over the last decades, plenty of industrial and non-industrial projects have applied
EVM successfully as an effective tool to control and develop their project progress in order
to improve their business operation and profits (Lipke.et.al,(2009)).
3.2 Earned Value Management Technique Key Components
To employ the EVM as a strong and effective means, one should understand and can
answer to these questions: What is this technique? How does it work? What are the main
components used in this technique? How it can be calculated?
EVM uses the following parameters to control project performance:

15
Planned Value (PV): Previously known as the Budgeted Cost of Work
Schedule (BCWS) is the time-phase budget baseline, Figure4. PV is the
authorized and approved cost of the project, task or activity that is related to
the schedule (PMBOK.Guide,(2000).). In other word it is the value, stated in
currency, of the work that should be earned as a function of project progress
up to given point at time; i.e. it is the money that you should have spent as
per the schedule.
Budget at Completion (BAC): Total planned value for the project is known
as the budget at completion (PMBOK.Guide,(2000).).
Earned Value (EV): Is the actual work completed to the date, also called
Budgeted Cost of Work Performed (BCWP). EV is the amount, specified in
currency, of actual work performed up to a given point at time. As per the
PMBOK Guide “Earned Value (EV) is the value of work performed
expressed in terms of the approved budget assigned to that work for an
activity or WBS Component.”
Actual Cost (AC) or Actual Cost of Work Performed (ACWP): Is the
actual amount of money that you have spent up to a point of time so far.
According to PMBOK GUIDE “Actual Cost (AC) is the total cost actually
incurred in accomplishing work performed for an activity or WBS
component (PMBOK.Guide,(2000).)”.
Percentage of Completion (PC): Is a measure of project, task or activity
performance and progress until now. Note that both PC and AC are based on
the same data.

16
Figure 4: EVM Graphical Representation (Chambers+Software,(2013))
The presented curves on the EVM graph, Figure5, are actual cost (AC), planned value
(PV), and earned value (EV) curves. The AC cure demonstrates the total project cost
incurred. Meanwhile, the PV curve also called BCWS curve represents the approved cost of
the project based on schedule. The PV information is included in initial accepted
contractor. The EV curve also known as BCWP curve shows actual work completed related
to schedule. The AC and EV curves are dynamic and subjected to change as project
progresses. Furthermore, project performance and progress can be measured using cost and
schedule variances (CV & SV) and cost and schedule performance indexes (CPI & SPI).

17
Variances:
Cost Variances: Is a measure of cost performance of project that will
demonstrate how much over or under budget the project is. It can be
calculated as follow:
Cost Variance (CV) = Earned Value (EV) – Actual Cost (AC)
If the value of CV is positive or negative we are under budget or over budget
respectively, Figure 5.
Schedule Variances: Indicates the schedule performance of a project. The
information derived from this parameter will show how far ahead or behind
the project schedule we actually are. The value of SV becomes zero as the
project completed, Figure 5.
CV
SV
CV
SV GOOD
POOR
Time
SV
& C
V
0
Figure 5: SV and CV Graph

18
Variance Percentage:
Cost Variance Percent (CV% or CVP): Is the proportion of CV to EV
that demonstrates the budgetary accordance of actual cost of work done up
to a specified point of time.
Schedule Variance Percent (SV% or SVP): This parameter the
agreement of actual work performed to the schedule until now which is
normally derived from the following formula:
SVP = SV/PV.
However it is more proper to calculate SVP based on EV and replace PV
with EV in the denominator of the above formula. The SVP based on
Earned value would be described as: SVPEV = SV/ EV.
Performance Indices:
Performance Indices can be considered as parameters to show the efficiency ratio.
These parameters enable project managers to compare the health of different project with
one another. They are categorized as below:
Cost Performance Indices: It is a measure of effectiveness of cost utilized
on project and a comparison between the value of work done and the actual
cost spent on the project. If fact this we tell project managers how much they
will earn from each dollar the spent on project. CPI can be calculated as
follow:
CPI = EV/ AC

19
Schedule Performance Indices: It is a measure of progress achieved
compare to the progress planed that will tell the project managers the
efficiency of the time utilized on the project. It can be calculated from the
following formula:
SPI = EV/ PV
At this stage, this may come to mind that if we can derive all these information from
CV and SV, why it is still needed to calculate CPI and SPI?
The answer is the information derived from cost or schedule variance comes in
dollar and in fact it shows the difference between the values while the information from
indexes comes in ratio. With information derived from indexes we can compare the health
of different project to one another, however with one came from variances it is not possible.
3.3 Commercially Available EVM Tools
Over the past few decades, many companies started to use EVM tools, mostly to
improve their management program quality and capabilities beside to positioning
themselves in a higher tier of Federal Agencies contract. Software available for EVM come
in different components that are typically include:
EVM scheduling engine
EVM cost engine
EVM reporting engine

20
Leading Earned Value Tools in the Market:
Microsoft Office Project: is Microsoft’s desktop project management
scheduling application. It comes in Standard and Professional editions. The
Professional edition includes collaborative enterprise project management
capabilities when used with Microsoft Office Project Server.
Microsoft Project does not support multiple users working on a single project
at the same time. The default storage approach is the MPP file format.
However, other formats and databases are supported via ODBC.
Primavera Earned Value Management: is a powerful, flexible EVMS cost
engine. Primavera Earned Value Management is a comprehensive solution
that integrates detailed cost information with the program schedule by
aligning and combining project performance data from cost systems, adding
complex burdening rates, and tracking committed costs. While the software
has the potential to solve your earned value management needs, it can also
cause major headaches if not configured properly for your business.
Deltek: provides software solutions specifically designed to meet the needs
of project-driven businesses. Today our software applications help more than
12,000 organizations achieve success worldwide. Deltek’s solutions help
companies to improve business performance management, streamline
operations, optimize compliance processes and win new business.

21
EVMS for Project: is designed to manage projects both large and small, and
to scale up to handle hundreds of projects and users in even the largest
enterprises. It was designed from the ground up to work closely with
Microsoft Project Server (2007 and 2010) and SharePoint. It is unique
among earned value management software in its ability to seamlessly
synchronize schedule and resource data from Microsoft Project Server.
EVMS ForProject was designed around the EVM principles and processes as
outlined in the American National Standards Institute Guidelines for Earned
Value Management Systems.
Unanet Project Management: software can support your organization with
centralized project management capabilities and resource scheduling. Unanet
offers outstanding reporting with a wide range of detailed and summary
reports available including graphical dashboards, earned value, and project
costing to see true project costs. Unanet project management software can be
the basis of your project management office (PMO) and supports Project
Portfolio Management (PPM).
3.4 Benefits of Earned Value Management
Will Earned Value technique benefits exceed its cost?
There is a controversy among experts about the benefits of EVM whether exceed its
cost or not. Some believe that EVM is a very powerful management system improves

22
Project cost tracking alone is
not sufficient in order to
determine project health
Total project cost prediction is
mostly in appropriately
optimistic and subjective
Unique and complex projects
in which a multidisciplinary
approach is needed
In detailed project information
when ability to change reduces
it is difficult to estimate
corrective actions required
EVM integrates three elements of
project: time, cost, and schedule
EVM helps PMs by incrwasing
prediction accuracy & estimation
of future work performance
EVM enables Management by
Exceptions
EVM can provide performance
efficiency by generating the
efficiency indexes
EVM Stimulus EVM Benefits
project outcomes in such way that hides its cost while other ignore its advantages and focus
on its cost (Christensen 1998).
Figure 6: “The fundamentals of EVM are the same regardless of the type ot size of project
to which they are being applied.”_ PMI Practice Standard for Earned Value Management.
Management System is significant and its requirements are among the largest
drivers. However, this study did not focus on the EVMS benefits.

23
Most of the works centralized the cost of EVMS, mostly considered the incremental
cost of EVMS compliance and reporting. Lampkin (1992) have done a review paper on five
studies estimating cost of implementation and maintaining EVMS. The result was
demonstrated in a table expressing the cost range as a percentage of contract cost.
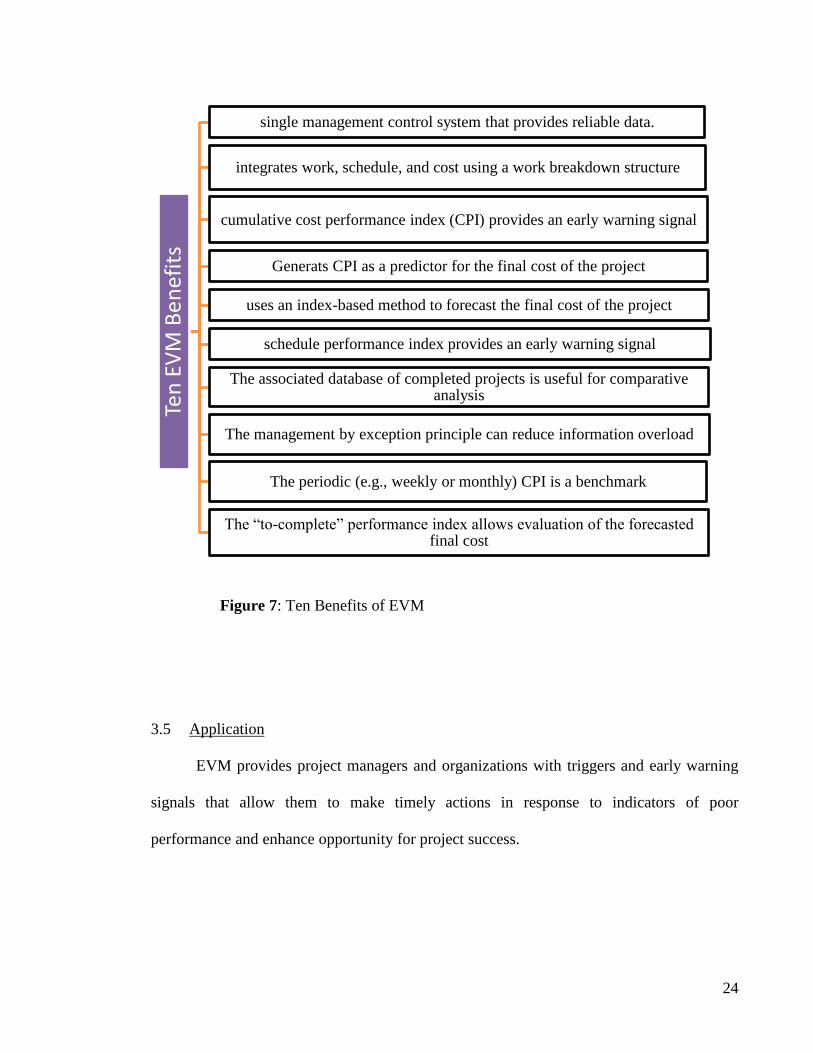
Ten advantages of EVMS:
The graph on following page, Figure8, reveals a list of ten benefits of EVMS.
Fleming and Koppelman (1996. p.22) pointed out to these factors as the legacy of
implementing EVM on government contract for about three decades.
Table 1: Related Researches on EVM Cost
Author (Year)
Method of Research
(number of samples)
Cost Drivers Related
to Over-Implementation
NSIA (1980) (Afs 1980,
Sarkar, Little et al. 1984)
Opinion survey (74
contractors)
Excessive documentation
A.D. Little (1984) (Sarkar,
Little et al. 1984)
Interview (56 managers) Excessive levels of detail in
the WBS
DoD/NSIA (1991)
(Christensen 1998)
Interview (250 mangers) Written variance analysis
reports
24
Figure 7: Ten Benefits of EVM
3.5 Application
EVM provides project managers and organizations with triggers and early warning
signals that allow them to make timely actions in response to indicators of poor
performance and enhance opportunity for project success.
Ten
EV
M B
en
efit
s
single management control system that provides reliable data.
integrates work, schedule, and cost using a work breakdown structure
cumulative cost performance index (CPI) provides an early warning signal
Generats CPI as a predictor for the final cost of the project
uses an index-based method to forecast the final cost of the project
schedule performance index provides an early warning signal
The associated database of completed projects is useful for comparative analysis
The management by exception principle can reduce information overload
The periodic (e.g., weekly or monthly) CPI is a benchmark
The “to-complete” performance index allows evaluation of the forecasted final cost

25
3.6 Related Earned Value Study
Over the past years many companies and industries over the world have accepted the
EVM technique and understood the usage and benefits on this technique since the EVM it
monitors the physical completion of the project procedure. It has become an important part
of project handling since it integrated project three important elements of the project cost,
schedule, and time with project scopes, so that many studies and researches done on this
areas (Atkinson 1999). Accordingly the IT has been recognized to have a significant role in
effective implementation of EVM technique as it facilitate the data handling (Vargas 2004,
Chou, Chen et al. 2010, Schwalbe 2010).
Earned Value acts as powerful managing and project controlling tool that
consolidates and compares project information, expresses them graphically, and points out
project risks and deficiencies to measure project performance(Gokhale and Bhatia 1997,
Anbari Dec 2003) .
Besides knowing as a powerful project performance technique, EVM aids project
managers to comprehensively control the project progress by increasing the progress
estimation degree of accuracy. This technique also helps PMs to control project risks
accurately and unified as they can provide a stage combining and comparing information
and predicting risk (Chapman 2007., Raz (2001):).
As mentioned previously Information Technology has become a useful tool in
project management and controlling that assists project managers to detect unpredicted
problems and unexpected situations to reduce the adverse impact of them. Accordingly,
Hemachandra and Ruwanpura (2008) integrated EVM and Monte Carlo Simulation and
developed a controlling tool (P.S. Hemachandra (2008)), Benjoran also, implemented a cost
control tool for five selected small-and medium-sized projects based on EVM providing a
novel and efficient system using Information and Communication Technology (ICT) and
26
developed (Benjaoran 2009). Furthermore, Lipke et al., (2009) devised a control tool for
forecasting final cost and project time. The author adopted an statistical method to EVM
and SPI to improve project managers capability to make accurate decisions and prediction
of project outcome (Lipke, Zwikael et al. 2009).
Despite all benefits mentioned previously of using EV technique some studies have
discussed factors on why EVM is not accepted widely although it is a very helpful
managerial tool? Brock R.(1983) have published an article on The Measurable News with
the title of “EVM: benefit or burden?” and pointed out to project manager`s lack of
understanding of EVM (R. 1983;Sept:) and Kemps RR. (1993) On the same magazine
commented lack of Government concentrate on EVM implementation and therefore user
involvement (RR. 1993;Dec:) as factors affected the acceptance of EVM. Moreover,
political battle between groups that initiate the EVM employment and project managers
(Butler GC 1993) on one hand and pressures to report only good news on the other hand
can be considered as another factors that influences the EVM acceptance (Association
1980). To overcome these deficiencies an effective EVM application, with high-level
management support on the basis of trust between government and contractors, knowledge
sharing and compromise relation between contractors and stakeholders is required.
Acceptance and adoption of EVM increases significantly by successful
implementation of EVM requiring various factors including: top-level management
support, Government centralization, organizational support, effective training, user-
centered application. The EVM application should also adopt easy-understanding
methodology, project environment easy-learned implementation (Kim, Wells Jr et al.
2003).
Previous studies have demonstrated the potential of effective web-based EVMS
once executed by engineering professionals and engineering applications for auto data
27
retrieval (Alheraish 2004, Ghanem¹ and AbdelRazig 2006). Among them Ghanem and
Abdelrazig for example employed a Radio Frequency Identification and introduced a new
and efficient model for tracking construction project on the basis of wireless
communication technologies. Their model enables project managers to growth productivity
reduce tracking time and labor once can generate more accurate estimates (Ghanem¹ and
AbdelRazig 2006).
Although a convenient remote data recovery is pleasant, progress measurement and
documentation for PC&M is essential especially during execution in which project is
surrounded by uncertainties. Therefore project management wishes a project tracking
system platform which is secure, accurate, easy and flexible, economical and easy-scaled-
up database in order to monitor project progress (Turban, Wetherbe et al. 1996, Bradley,
Mascaro et al. 2005, Li, Moselhi et al. 2006, Chou and O'Connor 2007).
Besides, effective implementation of EVM requires on-site managers to provide
timely data as well as web-based EVMs associated with project cost, schedule, and scope
(Alsakini, Wikström et al. 2004, Kerzner 2013). Traditionally project data were recorded
and input manually so the possibility of error occur while recording data was not out of
mind and also time spent for data recovery was not reasonable, thanks to modern IT
technology that facilitated project managers to automatic data retrieval, acquisition, and
input, simplified project monitoring and controlling (Cheung, Cheung et al. 2004, Li,
Moselhi et al. 2006, Chou and O'Connor 2007, El-Omari and Moselhi 2009).

28
CHAPTER FOUR
METHODOLOGY AND SURVEY DATA
4. Method and Principle
4.1 Introduction
The EV is a powerful tool assisting project teams to assess and evaluate the project
performance and progress by variety of indices and estimates. By definition, the EV of a
work, project, task, or activity is a measure of completed work demonstrating the budgeted
cost of work performed. In simple terms, EV shows how well and efficient project
resources are utilized by project team as well as what has been obtained until now and what
is going to be obtained in the future from the project.
In this chapter we are going to reveal methods used to conduct Earned Value in this
dissertation. First, all necessary abbreviations and formulas used in calculating Earned
Value are shown then available methods and theories behind them using in EV calculations
are discussed. In the following this study would cover an introduction to MCIS Safety
Glass Company and present a brief description of proposed project on which EV technique
was implemented. Last but not least, in the final part we surveyed and studied data
collected from the MCIS Safety Glass Sdn, Bhd. and how they were used in our EVM
calculations.

29
4.2 Methods
To calculate Earned Value for a project, task, or activity generally three methods are
used:
1. Difference Measurement (Variances)
2. Efficiency Measurement (Indices)
3. Forecast (Estimate at completion)
4.2.1 Difference Measurement (Variances)
In Earned Value Management variances are used in order to measure difference in
planned, actual, and earned cost as well as schedule. There two significant variances mostly
used: Cost Variance, and Schedule Variance.
Cost Variance (CV)
Cost Variance which is the difference between Earned Value and Actual
Cost and calculated after each activity is completed describes that how much
the project expenditure is different from initial expected cost progress. In
other words this variance demonstrates whether the project is under budget,
over budget, or compatible to budget.
Cost Variance can be calculated from the following formula:
The unit is in proposed currency so that it can be compared with the original
planned budget.
If CV is in positive value project is in favorable condition meaning that
project is under budget in compare to Planned Value unlike while CV value
is negative project progress is in bad condition and it is over budget in
compare to Planned Value.

30
Schedule Variance (SV)
Schedule Variance assists project managers to find out how far project
progress is ahead of schedule or behind of schedule in compare to original
duration. SV is the difference between Earned Value and Planned Value and
its value would be derived from the following formula:
If Schedule Variance has a positive value it shows that project progress is
ahead of schedule and is favorable, however, if SV is negative project
progress id behind schedule. While all project planned value is earned the
SV value would become zero since Earned Value is equal to Planned Value.
Note that in all variances positive value means that the project is in a
favorable status and negative value is a sign that project is in bad status.
4.2.2 Efficiency Measurement (Indices)
There are two indices widely used for efficiency measurement in earned value
calculation: Cost Performance Index (CPI) and Schedule Performance Index (SPI).
Cost Performance Index (CPI)
CPI, or cost performance indices is a measure of effectiveness of cost
utilized on project and a comparison between the value of work done and the
actual cost spent on the project. CPI is as the ratio of earned value (EV) to
actual cost (AC):

31
In simple term, CPI demonstrates that from each Ringgit spent on an activity
how much worth was created meaning that how much efficient is each
Ringgit expended. For example if CPI is equal to 90% it means that from
each ringgit spent only 90 percent worth of value has been obtained on
planned budget basis.
Results obtained from calculating CPI can be interpreted as follow:
If the CPI is more than one it is like when efficiency is more than one
meaning that earned progress is more than what was spent. Moreover, while
CPI is less than one it indicates that what is earned from project is less than
what was spent so project progress is not efficient. However, if CPI equals to
one it means that earned progress is equal to actual progress or expenditures.
Schedule Performance Index (SPI)
Schedule Performance Indices is a measure of progress achieved compare to
the progress planned that will tell the project managers the efficiency of the
time utilized on the project. SPI is the ratio of earned value (EV) to planned
value(PV):
Where, PV is the authorized and approved cost of the project, task or activity
that is related to the schedule (PMBOK.Guide,(2000).) also known as
Budgeted Cost of Work Schedule.
In simple word, SPI shows the efficiency of the time utilized for each
activity to complete. This index would enable project managers to find out
that what portion of planned schedule has been achieved up to time-now and

32
what portion of project activities have been completed on the basis of project
planned schedule.
Values obtained after calculating SPI can be interpreted as follow:
If project SPI is more than one it means that more project activities have
been completed in compare to planned schedule and if project SPI is less
than one then portion of project completed is less than what was expected to
be completed according to planned schedule therefore time utilized on
project is more efficient or less efficient respectively. However, if SPI is
equal to one so part of work completed is compatible with planned schedule.
Figure 8 shows a traditionally report of SPI and CPI recently developed during a
construction project by R.Aliverdi et al.(Aliverdi, Moslemi Naeni et al. 2013) .
Figure 8: Traditional graphical report SPI and CPI monitored over a 20 month period. It
was generated by Microsoft excel 2007. a) SPI data, b) CPI data. (Aliverdi, Moslemi Naeni et al.
2013).

33
4.2.3 Forecast (Estimate at Completion)
As mentioned before Earned Value Management enables project managers to predict
project future performance by monitoring and tracking project progress. Estimate at
Completion (EAC) is method of forecasting in EVM calculations and estimates value of
project when all planned tasks are completed. EAC is divided into two:
Estimate at Completion of cost, EAC(C)
EAC(C) indicates that how much project will costs when the total project is
completed. In fact EAC(C) is total cost value of completed project on the
basis of Budget at Completion (BAC) which is planned budget for project to
be completed. So by knowing EAC project managers would be able to
estimate total cost while project is still in earlier stage and take correct action
if needed.
EAC(C) is consists of two parts: cost already spent and estimated future cost.
Considering that project would follow current trend and nothing in project
existing condition would be changed, EAC(C) can be calculated from the
following formula:
Where, AC = Actual Cost,
BAC = Budget at Completion,
EV = Earned Value, &
CPI = Cost Performance Index
By knowing that then substituting in above equation:

34
Then finally,
Estimate at Completion of time, EAC(T)
EAC(T) is an indicator that would estimate total duration of project when all
planned tasks are completed on the basis of original planned duration of
project to be completed. EAT(T) provides project managers with reasonable
information about duration of future activities so that they would be able to
do re-baseline and take correct actions to reduce probable risks.
EAC(T) is consists of two parts: actual time utilized and future activities
estimated duration. By considering that project progresses in the same
manner as existing condition and nothing would change EAC of time can be
derived from following equation:
Where, ATU = Actual Time Utilized
PD = Planned Duration
SPI = Schedule Performance Index

35
By subtracting above fraction from ATU then we have:
Three discussed method are the most common used methods in EVM calculation,
however, there are some other methods rather than these ones. In the following we will
presents a brief description of other EVM methods of calculation.
4.3 Other EVM Methods of Measurement
4.3.1 To Complete Performance Index, (TCPI)
(Fleming and Koppelman 2000).pp137 introduced a new method called To
Complete Performance Index (TCPI) for project performance measurement using Earned
Value. TCPI is an indicator demonstrating that in order to stick to project financial goal
what performance factor much be attained on remaining progress.
TCPI can be derived using following formula:

36
Where, OB = Original Budget
EV = Earned Value
AC = Actual Cost
4.3.2 Estimate to Completion, ETC
ETC is another forecasting method using Earned Value that estimates cost of
remaining planned work. ETC is a tool for cost management that indicates how much is
expected to be spent to complete remaining work, in other word it predicts planned cost
remaining activities. For instance, let`s say that we are owning a project of which 40
percent has been completed up to now and 60 percent must be completed. The Estimate to
Complete is amount of expenditure need to complete that remaining 60 percent.
ETC can be calculated as below:
Where & , then by substituting in above equation:

37
In this part we discussed about available and fashionable methods of using EV for
analyzing, monitoring, controlling, and predicting project progress. However in addition to
theories it is important to find out how practical is EVM in real manufacturing projects to
boost projects efficiency and enhance companies cost and time utilization. In continue we
are going to present a case study so that can be used as an easy example of Earned Value
Management in practice and how well this technique can help project managers.
4.4 MCIS SAFETY GLASS Sdn Bhd
The MCIS Safety Glass Company produces safety glass for automotive industry.
The products are including windshield and side-windows glasses Malaysian automobile
companies and replacement market. MCIS Safety Glass Sdn Bhd was first found in 1973,
with the cooperation of Malaysia Cooperative Insurance Society (MCIS) and Hindustan
Safety Glass Works Pte. Ltd. and started commercial production in January, 1975. In April
2008, MCIS finally become a part of Trade-winds Corporation Berhad and its name
changed to MSIC Safety Glass Sdn. Bhd (MCIS 1973-2008).
MCIS Safety Glass Company major customers are Proton, Perodua, and Honda
respectively. MCIS Safety Glass produces high-quality car glasses of all types including
Windshield glass, Back Door Window glass, Front Door glass (left and right), Rear Door
glass (left and right), and Rear Quarter glass (left and right) with modern production line
equipment and skilled workers (MCIS 1973-2008).

38
4.5 Background
In Malaysia it is not common in manufacturing companies and factories having
Mass Production to use a controlling and monitoring technique like EVM to follow their
production progress and manufacturing projects especially in companies in which their
manufacturing projects is based on the Batch Production (BP).
The overall scope of this dissertation is to study EVM system in practice on a
manufacturing project using Batch Production (BP) technique for mass production in
Malaysia. In order to pursue our goal, in this study, we presented an introduction to EVM
previously and will discuss on result of implementing EVM on projects in continue. Then
as a practical and real example of EVM performance we implemented this system on
project of production of glasses for Suzuki Swift car from Proton Company which was
completed in MCIS Safety Glass Company.
4.5.1 MCIS Production of Glasses for Proton Suzuki Swift Car
In MCIS Safety Glass Company, as mentioned before Proton is the biggest client
and a great portion of MCIS productions are according to Proton orders. Commercial
production of “Set of Glasses for Suzuki Swift model” namely known as “Suzuki Swift”
project commenced in January, 2008 for duration of five years and completed by the end of
December 2012. Manufacturing technique is based on Batch Production so that production
volume for each month is according to costumer`s need. Therefore each month MCIS
assign production plan for that month.
39
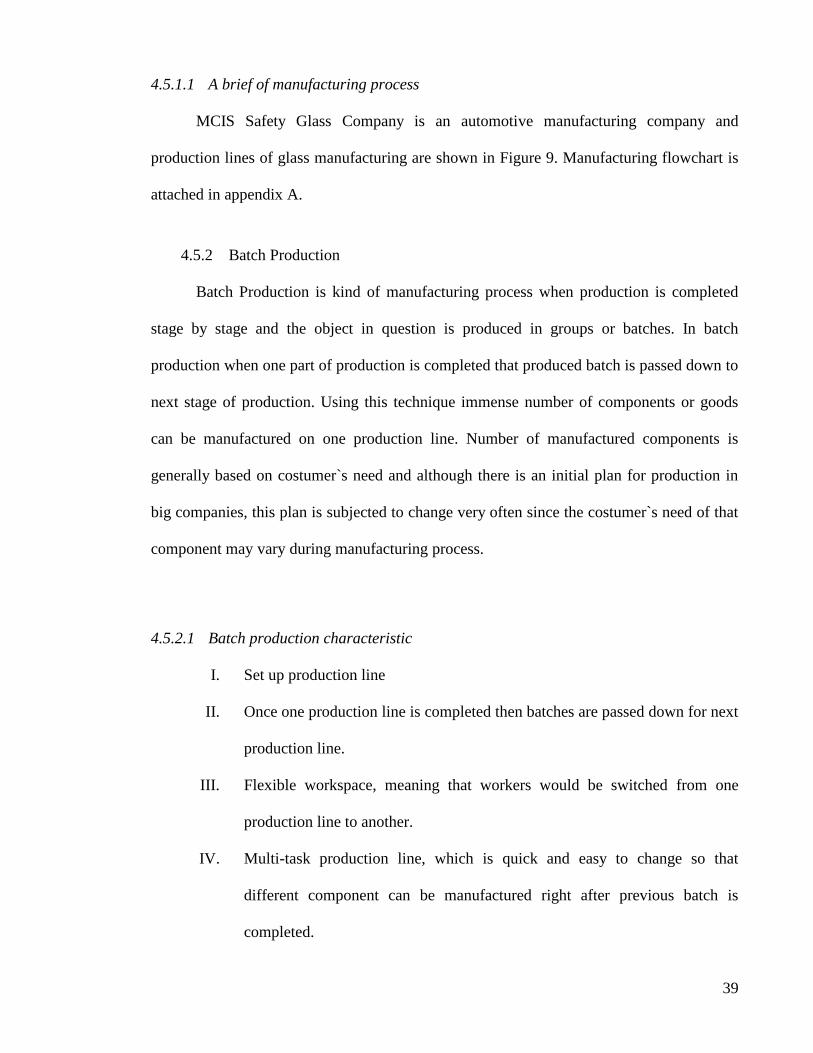
4.5.1.1 A brief of manufacturing process
MCIS Safety Glass Company is an automotive manufacturing company and
production lines of glass manufacturing are shown in Figure 9. Manufacturing flowchart is
attached in appendix A.
4.5.2 Batch Production
Batch Production is kind of manufacturing process when production is completed
stage by stage and the object in question is produced in groups or batches. In batch
production when one part of production is completed that produced batch is passed down to
next stage of production. Using this technique immense number of components or goods
can be manufactured on one production line. Number of manufactured components is
generally based on costumer`s need and although there is an initial plan for production in
big companies, this plan is subjected to change very often since the costumer`s need of that
component may vary during manufacturing process.
4.5.2.1 Batch production characteristic
I. Set up production line
II. Once one production line is completed then batches are passed down for next
production line.
III. Flexible workspace, meaning that workers would be switched from one
production line to another.
IV. Multi-task production line, which is quick and easy to change so that
different component can be manufactured right after previous batch is
completed.

40
V. Individual parts of product are purchased from another companies then
assembled in production line
VI. Production line is used for a fixed amount of time for each product and
afterward it is changed to produce different components.
VII. Several number of products can be manufactured in a single production line
VIII. Less initial outlay
IX. BP Is a common technique in companies in which forecast of demand is
difficult, trial runs for productions are needed, or manufactures products with
very high profit margins.

41
Raw Material Recieving
•Glass kind : (Model Name, Type/part no., Appearance)
•Glass Charactristic: (Size,Thickness, Dimension, Appearance,Light transmission)
•Quantity
Cutting, Grinding, & Washing
•Cuttting: (Parameter setting, Model name, Glass color, Thickness, Size)
•Grinding:(Edge grinding)
•Wasing/Inspection:(Clearness, dryness, Glass stain, Edge finishing)
Process Quality Inspection
•Glass color, Thikness, Size, Edge finishing, Cleanliness, Appearance
Printing: Ceramic Marking
•Printing Screen, Mixing Standard, Type of Paste, Oven temperature, Printing position, Silk Screen condition
Quality Check: marking printing
•Type of paste, Printing position, Ceramic paste dryness, Appearance
Tempering
•Parameter setting, Curvature, Cross curvature, Size, Surface curve, Roller inprint, Glass stain, Appearance
Final Quality Check: Tempering
•Fragmentation, Size, Curvature, Thickness, Color, Distortion, Roller inprint, Glass stain, Appearance
Quality testing
•Qua;ity testing for toughened glass other than windsheild
Holder Assembly
• Pressure, Type of holder, Holder direction, position, and strength
Final Quality Check: Holder Assy
•Type of holder, Holder position, direction, and strength, Glass stain, Appearance
Packing
•Model Name, Quantity, Identification, and Condition, Packing condition
Final Product Audit
•Model name, Quantity, Indentification, Packing condition
Delivary
•Model name, Quantity, Identifaction, Packing condition
Figure 9: MCIS SAFETY GLASS Company Manufacturing
Process

42
4.6 Survey Data and Application of EVM
According to contract between two parties, MCIS Safety Glass and Proton, four
types of glasses were produced for Proton i.e. Windshield, Front door, Rear door, and Rear
quarter that are called one SET of glass/car. Initial agreement production of 3600 volume of
SET for each year, Table2, however, since manufacturing is based on batch production and
costumer`s need production volume may change during the project progress. As mentioned
before duration of the Suzuki Swift project is five years, Table2, therefore initial planned
volume (PVvolume) for five years would become .
Note that although production volume may vary during project contract, it would not be
less than initial agreement of total of 18000 sets for five years.
Table 2, shows OEM costing for the “Suzuki Swift” and total cost of each type of
glass so total cost of one SET of glass can be calculated:
Total Cost
Total Cost
This is the total costing for MCIS Company to produce one SET of glass for one car
which is obviously less than proposed selling price- price that Proton should pay for one
SET of glass. Based on OEM costing, Table 2, proposed selling price for each type of glass
has been calculated and demonstrated so total selling price of one SET can be calculated as
following:
Total Selling Price

43
Total Selling Price
4.6.1 Planned Value
Based on the initial production planned and volume of production of each year,
Table2, we know for one year production volume would be 3600 SETs, and since a year
has twelve months, therefore production volume for one month become:
Volume per Month
And as we are aware a month has average working day of 21 days then,
15 SETs per day can be produced.
In order to calculate Planned Value we need to know real working days of each
month. Here we calculated production volume of each month for five years and tabulated in
Table3, however, as clarifying examples here we presented calculation for first quarter of
year 2008 and since the calculations are same for rest of months it would be waste of time
revealing calculations for five years. Now let`s look at year 2008, Picture1:

44
Picture1 Malaysia Calendar, 2008(Date)
January for example, except weekends, Saturdays and Sundays, there is holidays on
1st, 10
th, and 23
rd of January. Furthermore, as we are aware due to new year`s holidays
normally companies do not work for at least a week so considering these all, total January
working days would be:
January working days
And since volume of production in one day is 15 SETs then,
Total VolumeJan-2008
Now let`s look at February, which is shortest month of each year:

45
Therefore, total volume should be produced on February, 2008 would be:
February working days
Total VolumeFeb-2008
Same for March, according to Malaysia calendar, Picture1:
So February working Days
and, Total VolumeMar-2008
Total days = 29
Weekends = 8
Public holidays = 3
Total days = 31
Weekends = 10
Public holidays = 1

46
WINDSHIELD FRONT DOOR
L/R
REAR DOOR
L/R
RR QTR L/R
COST/M2 AREA
COST
COST
/M2
AREA
COST
COST
/M2
AREA
COST
COST
/M2
AREA
COST
RAW MATERIAL
GLASS COST
FILM
PRINTING
SUB TOTAL
1.216 0.397 0.228 0.062
23.94 29.12 14.79 5.87 14.79 3.37 14.79 0.92
21 25.54
3.75 4.56
48.69 59.21 14.79 5.87 14.79 3.37 14.79 0.92
PURCHASED PARTS NOT
INCLD.
NOT
INCLD
NOT
INCLD
NOT
INCLD
MFG. COST
UTILITY
MAINTENANCE
DEPRECIATION
LABOUR
ROYALITY
PROCESSING
MATERIAL
SUB TOTAL
6.58 7.55 7.55 7.55
4.13 6.78 6.78 6.78
5.95 3.97 3.97 3.97
8.21 14.45 14.45 14.45
0.64 0.13 0.13 0.13
3.19 7.55 7.55 7.55
28.7 34.9 40.43 16.05 40.43 9.2 40.43 2.51
TOOLINGS
VOLUME/YEAR
DIES/MOLD
INSPECTION
GAUGE/JIG
PALLETS
SILKSCREEN
S.SCREEN FRAME
POS FILM
MARKED UP GLASS
TESTINGS
OTHERS
SUB TOTAL
3600 5 TOTAL
9500 3500 3500 3500 34000
30000 30000 30000 15000 210000
15000 12000 12000 8000 94000
2000 500 500 500 5500
750 250 250 250 750
1500 1500
6500 2000 2000 2000 23500
1000 500 500 500 5000
66250 3.68 48750 2.71 48750 2.71 29750 1.65 374250
SUMMARY
1. MAT.COST
2. PURCHASED PART
3. MFG.COST
4. SUB TOTAL
5. TRANSPORTATION
6. ADMIN CHARGES
_% OF (4)
7. TOOLING COST
59.21 5.87 3.37 0.92
0 0 0 0
34.9 16.05 9.2 2.51
94.11 21.92 12.56 3.42
2.75 2.75 1.5 1.5 1.3 1.3 0.95 0.95 12.55
6% 5.65 6% 1.32 6% 0.75 6% 0.21
3.68 2.71 2.71 1.65
TOTAL COST
PROPOSED SELLING
PRICE
106.19 27.44 17.32 6.23 208.17
122.55
31.85 20.45
8.85 244.85
Table 2: OEM Costing
Production
Volume of one
year
Contract Duration
Total Cost & Proposed
Selling Price

47
Now that we calculated the monthly total production volume we can generate
planned value for each month considering that we are looking at proposed selling price as
proposed cost. Table 3 demonstrates monthly Planned Value and Cumulative Planned
Value for the “Suzuki Swift” production.
Note that in common manufacturing projects that production occurs in a continuous
line, for each activity there is an allocated budget so that the budget is the planned value but
in batch production manufacturing is not based on budget allocation and planning so
planned value should be calculated in different way.
In EVM implementation the Cumulative Planned Value is considered as Planned
Value (PV) so from now-on we also consider the same and whenever talk about PV in
calculation we are looking at Cumulative Planned Value. In manufacturing industry it is
very common to illustrate cumulative cash flow in form of graph knowing as S-Curve
because usually it is a non-linear S shape curve. Figure10 shows cumulative cash flow or
cumulative planned value for “Suzuki Swift”.
Figure 10: Cumulative Cash flow, Planned Value (PV)
MYR 0.00
MYR 500,000.00
MYR 1,000,000.00
MYR 1,500,000.00
MYR 2,000,000.00
MYR 2,500,000.00
MYR 3,000,000.00
MYR 3,500,000.00
MYR 4,000,000.00
MYR 4,500,000.00
MYR 5,000,000.00
Apr-07Nov-07 Jun-08 Dec-08 Jul-09 Jan-10 Aug-10 Feb-11 Sep-11 Apr-12 Oct-12May-13
PV S-Curve

48
Table 3: Monthly Planned Value & Cumulative Planned Value (Unit: Malaysian Ringgit
(MYR))
Month working days Planned Volume Monthly PV AccumulativePV
Jan-08 16 240 58764 58764
Feb-08 18 270 66109.5 124873.5
Mar-08 20 300 73455 198328.5
Apr-08 22 330 80800.5 279129
May-08 21 315 77127.75 356256.75
Jun-08 21 315 77127.75 433384.5
Jul-08 23 345 84473.25 517857.75
Aug-08 21 315 77127.75 594985.5
Sep-08 21 315 77127.75 672113.25
Oct-08 20 300 73455 745568.25
Nov-08 20 300 73455 819023.25
Dec-08 20 300 73455 892478.25
Jan-09 18 270 66109.5 958587.75
Feb-09 19 285 69782.25 1028370
Mar-09 21 315 77127.75 1105497.75
Apr-09 22 330 80800.5 1186298.25
May-09 19 285 69782.25 1256080.5
Jun-09 22 330 80800.5 1336881
Jul-09 23 345 84473.25 1421354.25
Aug-09 20 300 73455 1494809.25
Sep-09 20 300 73455 1568264.25
Oct-09 23 345 84473.25 1652737.5
Nov-09 21 315 77127.75 1729865.25
Dec-09 21 315 77127.75 1806993
Jan-10 15 225 55091.25 1862084.25
Feb-10 17 255 62436.75 1924521
Mar-10 23 345 84473.25 2008994.25
Apr-10 22 330 80800.5 2089794.75
May-10 20 300 73455 2163249.75
Jun-10 22 330 80800.5 2244050.25
Jul-10 23 345 84473.25 2328523.5
Aug-10 21 315 77127.75 2405651.25
Sep-10 20 300 73455 2479106.25
Oct-10 21 315 77127.75 2556234
Nov-10 20 300 73455 2629689
Dec-10 22 330 80800.5 2710489.5
Jan-11 15 225 55091.25 2765580.75
Feb-11 16 240 58764 2824344.75
Mar-11 23 345 84473.25 2908818
Apr-11 22 330 80800.5 2989618.5
May-11 20 300 73455 3063073.5
Jun-11 22 330 80800.5 3143874
Jul-11 21 315 77127.75 3221001.75
Aug-11 22 330 80800.5 3301802.25
Sep-11 20 300 73455 3375257.25
Oct-11 20 300 73455 3448712.25
Nov-11 21 315 77127.75 3525840
Dec-11 22 330 80800.5 3606640.5
Jan-12 19 285 69782.25 3676422.75
Feb-12 19 285 69782.25 3746205
Mar-12 23 345 84473.25 3830678.25
Apr-12 21 315 77127.75 3907806
May-12 22 330 80800.5 3988606.5
Jun-12 22 330 80800.5 4069407
Jul-12 22 330 80800.5 4150207.5
Aug-12 20 300 73455 4223662.5
Sep-12 20 300 73455 4297117.5
Oct-12 22 330 80800.5 4377918
Nov-12 20 300 73455 4451373
Dec-12 20 300 73455 4524828
planned
value is according to
initial plan and contract
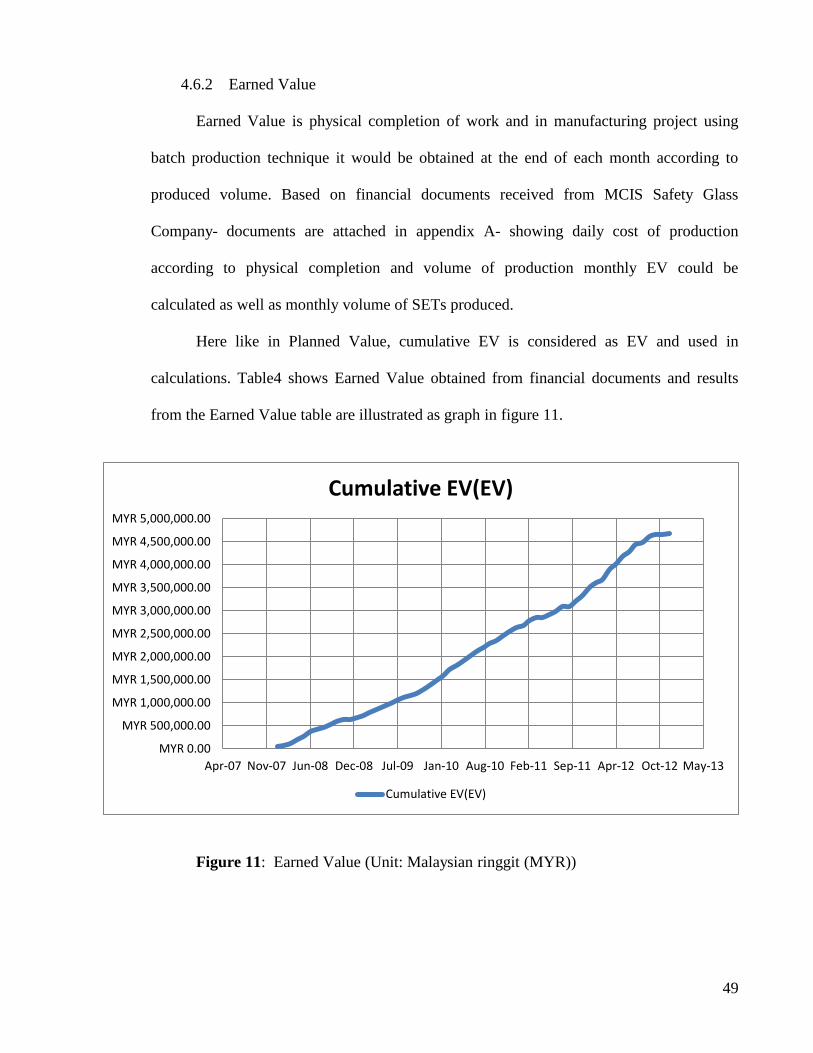
49
4.6.2 Earned Value
Earned Value is physical completion of work and in manufacturing project using
batch production technique it would be obtained at the end of each month according to
produced volume. Based on financial documents received from MCIS Safety Glass
Company- documents are attached in appendix A- showing daily cost of production
according to physical completion and volume of production monthly EV could be
calculated as well as monthly volume of SETs produced.
Here like in Planned Value, cumulative EV is considered as EV and used in
calculations. Table4 shows Earned Value obtained from financial documents and results
from the Earned Value table are illustrated as graph in figure 11.
Figure 11: Earned Value (Unit: Malaysian ringgit (MYR))
MYR 0.00
MYR 500,000.00
MYR 1,000,000.00
MYR 1,500,000.00
MYR 2,000,000.00
MYR 2,500,000.00
MYR 3,000,000.00
MYR 3,500,000.00
MYR 4,000,000.00
MYR 4,500,000.00
MYR 5,000,000.00
Apr-07 Nov-07 Jun-08 Dec-08 Jul-09 Jan-10 Aug-10 Feb-11 Sep-11 Apr-12 Oct-12 May-13
Cumulative EV(EV)
Cumulative EV(EV)

50
Month Monthly EV Cumulative EV Monthley Earned Volume Cumulative Earned Volume
Jan-08 37056 37056 151.3416377 151.3416377
Feb-08 27792 64848 113.5062283 264.847866
Mar-08 47400 112248 193.587911 458.435777
Apr-08 86976 199224 355.2215642 813.6573412
May-08 67368 266592 275.1398816 1088.797223
Jun-08 96240 362832 393.0569737 1481.854197
Jul-08 57744 420576 235.8341842 1717.688381
Aug-08 38498 459074 157.2309577 1874.919338
Sep-08 57744 516818 235.8341842 2110.753523
Oct-08 67368 584186 275.1398816 2385.893404
Nov-08 48120 632306 196.5284868 2582.421891
Dec-08 9624 641930 39.30569737 2621.727588
Jan-09 38496 680426 157.2227895 2778.950378
Feb-09 48120 728546 196.5284868 2975.478865
Mar-09 67460.4 796006.4 275.5172555 3250.99612
Apr-09 48120 844126.4 196.5284868 3447.524607
May-09 76632 920758.4 312.975291 3760.499898
Jun-09 57744 978502.4 235.8341842 3996.334082
Jul-09 57744 1036246.4 235.8341842 4232.168266
Aug-09 76992 1113238.4 314.4455789 4546.613845
Sep-09 38496 1151734.4 157.2227895 4703.836635
Oct-09 57744 1209478.4 235.8341842 4939.670819
Nov-09 76992 1286470.4 314.4455789 5254.116398
Dec-09 91248 1377718.4 372.668981 5626.785379
Jan-10 101232 1478950.4 413.4449663 6040.230345
Feb-10 105864 1584814.4 432.362671 6472.593016
Mar-10 138736 1723550.4 566.6162957 7039.209312
Apr-10 76992 1800542.4 314.4455789 7353.654891
May-10 96240 1896782.4 393.0569737 7746.711864
Jun-10 115488 2012270.4 471.6683684 8218.380233
Jul-10 96240 2108510.4 393.0569737 8611.437207
Aug-10 96240 2204750.4 393.0569737 9004.49418
Sep-10 76992 2281742.4 314.4455789 9318.939759
Oct-10 76992 2358734.4 314.4455789 9633.385338
Nov-10 96240 2454974.4 393.0569737 10026.44231
Dec-10 96240 2551214.4 393.0569737 10419.49929
Jan-11 76992 2628206.4 314.4455789 10733.94486
Feb-11 57744 2685950.4 235.8341842 10969.77905
Mar-11 96240 2782190.4 393.0569737 11362.83602
Apr-11 57744 2839934.4 235.8341842 11598.67021
May-11 9624 2849558.4 39.30569737 11637.9759
Jun-11 57744 2907302.4 235.8341842 11873.81009
Jul-11 76992 2984294.4 314.4455789 12188.25567
Aug-11 96313.65 3080608.05 393.3577701 12581.61344
Sep-11 13240 3093848.05 54.07392281 12635.68736
Oct-11 115488 3209336.05 471.6683684 13107.35573
Nov-11 115488 3324824.05 471.6683684 13579.0241
Dec-11 173232 3498056.05 707.5025526 14286.52665
Jan-12 115488 3613544.05 471.6683684 14758.19502
Feb-12 55165.44 3668709.49 225.3030018 14983.49802
Mar-12 228686.16 3897395.65 933.9847253 15917.48274
Apr-12 107752.32 4005147.97 440.0748213 16357.55757
May-12 161628.48 4166776.45 660.112232 17017.6698
Jun-12 125711.04 4292487.49 513.4206249 17531.09042
Jul-12 147468.6 4439956.09 602.2813968 18133.37182
Aug-12 35917.44 4475873.53 146.6916071 18280.06343
Sep-12 127997.76 4603871.29 522.7598938 18802.82332
Oct-12 46802.4 4650673.69 191.147233 18993.97055
Nov-12 5274.77 4655948.46 21.54286298 19015.51342
Dec-12 28462.51 4684410.97 116.2446804 19131.7581
Table 4: Earned Value

51
4.6.3 Actual Cost
Actual Cost (AC) is real and actual investment during execution phase and should
be recorded on daily basis since it is actual expenditure as project progresses. In MCIS
Safety Glass Company there is no available data of actual cost of “Suzuki Swift” project
since there have never been a consolidate program for recording actual cost daily. This is a
very common issue in many of manufacturing companies like MCIS in which importance
of recording Actual Cost on a daily basis still is uncover for both Project Managers and
Company owners.
In EVM analysis AC is one of the main elements so that in this case due to lack of
information on Actual Cost we have to try to make a good assumption in order to continue
our calculations.
4.6.3.1 Estimating Actual Cost
Form Earned Value information on one hand we could derive monthly earned
volume of SETs. On the other hand we know from Table5 That total price for MCIS Safety
Glass to produce one SET is MYR 208.17 then, by consolidating this information actual
cost of earned produced volume would be achieved and we consider this amount as Actual
Cost for our calculation. Although Actual Cost have to be based on real data not
assumption, here due to lack of information we estimated values of actual cost however
these assumptions are quite close to reality and are reliable.
For example from Table4 (EV) it can be revealed that in January 2008 EV is equal
to MYR 37,065 and dividing this amount by proposed cost-proposed selling price- Earned
volume can be derived:

52
Earned VolumeJan-2008
ACJan-2008
Results from calculating AC are tabulated in Table 5 and also demonstrated visually
as graph in Figure 12.
Figure 12: Actual Cost spent in duration of five years
MYR 0.00
MYR 500,000.00
MYR 1,000,000.00
MYR 1,500,000.00
MYR 2,000,000.00
MYR 2,500,000.00
MYR 3,000,000.00
MYR 3,500,000.00
MYR 4,000,000.00
MYR 4,500,000.00
Apr-07 Nov-07 Jun-08 Dec-08 Jul-09 Jan-10 Aug-10 Feb-11 Sep-11 Apr-12 Oct-12 May-13
Actual Cost
Actual Cost

53
Table 5: Actual Cost (Unit : Malaysian Ringgit (MYR))
Month Earned Volume Actual Value Actual Cost
Jan-08 151.3416377 31504.78872 31504.78872
Feb-08 113.5062283 23628.59155 55133.38027
Mar-08 193.587911 40299.19543 95432.5757
Apr-08 355.2215642 73946.47302 169379.0487
May-08 275.1398816 57275.86915 226654.9179
Jun-08 393.0569737 81822.67022 308477.5881
Jul-08 235.8341842 49093.60212 357571.1902
Aug-08 157.2309577 32730.76846 390301.9587
Sep-08 235.8341842 49093.60212 439395.5608
Oct-08 275.1398816 57275.86915 496671.43
Nov-08 196.5284868 40911.3351 537582.765
Dec-08 39.30569737 8182.267022 545765.0321
Jan-09 157.2227895 32729.06809 578494.1002
Feb-09 196.5284868 40911.3351 619405.4353
Mar-09 275.5172555 57354.42708 676759.8623
Apr-09 196.5284868 40911.3351 717671.1974
May-09 312.975291 65152.06633 782823.2638
Jun-09 235.8341842 49093.60212 831916.8659
Jul-09 235.8341842 49093.60212 881010.468
Aug-09 314.4455789 65458.13616 946468.6042
Sep-09 157.2227895 32729.06809 979197.6723
Oct-09 235.8341842 49093.60212 1028291.274
Nov-09 314.4455789 65458.13616 1093749.411
Dec-09 372.668981 77578.50177 1171327.912
Jan-10 413.4449663 86066.83863 1257394.751
Feb-10 432.362671 90004.93722 1347399.688
Mar-10 566.6162957 117952.5143 1465352.202
Apr-10 314.4455789 65458.13616 1530810.339
May-10 393.0569737 81822.67022 1612633.009
Jun-10 471.6683684 98187.20425 1710820.213
Jul-10 393.0569737 81822.67022 1792642.883
Aug-10 393.0569737 81822.67022 1874465.554
Sep-10 314.4455789 65458.13616 1939923.69
Oct-10 314.4455789 65458.13616 2005381.826
Nov-10 393.0569737 81822.67022 2087204.496
Dec-10 393.0569737 81822.67022 2169027.166
Jan-11 314.4455789 65458.13616 2234485.302
Feb-11 235.8341842 49093.60212 2283578.905
Mar-11 393.0569737 81822.67022 2365401.575
Apr-11 235.8341842 49093.60212 2414495.177
May-11 39.30569737 8182.267022 2422677.444
Jun-11 235.8341842 49093.60212 2471771.046
Jul-11 314.4455789 65458.13616 2537229.182
Aug-11 393.3577701 81885.287 2619114.469
Sep-11 54.07392281 11256.56851 2630371.038
Oct-11 471.6683684 98187.20425 2728558.242
Nov-11 471.6683684 98187.20425 2826745.446
Dec-11 707.5025526 147280.8064 2974026.253
Jan-12 471.6683684 98187.20425 3072213.457
Feb-12 225.3030018 46901.32588 3119114.783
Mar-12 933.9847253 194427.6003 3313542.383
Apr-12 440.0748213 91610.37555 3405152.759
May-12 660.112232 137415.5633 3542568.322
Jun-12 513.4206249 106878.7715 3649447.093
Jul-12 602.2813968 125376.9184 3774824.012
Aug-12 146.6916071 30536.79185 3805360.804
Sep-12 522.7598938 108822.9271 3914183.731
Oct-12 191.147233 39791.11949 3953974.85
Nov-12 21.54286298 4484.577787 3958459.428
Dec-12 116.2446804 24198.65512 3982658.083

54
CHAPTER FIVE
RESULTS AND DISCUSSION
5.1 Introduction
Earned Value Management of based on three basic and important elements:
i. Planned Value
ii. Earned Value
iii. Actual Cost
By knowing these basics elements from previous chapter Earned Value
Measurement and Forecast of Cost and Schedule can be done. As mentioned previously,
three common methods using EVM are:
Difference Measurement (Variances)
Efficiency Measurement (Indices)
Forecast (Estimate at completion)
And results from EVM analysis can be summarized as follows:
5.2 Variances and Indices
5.2.1 Cost Variance (CV) and Cost Performance Index
EVM enables us to forecast and control project performance and progress cost-wise.
Results from cost variance and cost performance index analysis are tabulated in Table6,
showing values of CV, CV% and CPI.

55
Table 6: Earned Value Cost Analysis (Amounts in Malaysian Ringgit)
Month CV CPI CVP
Jan-08 5551.21128 1.176202143 14.98060039
Feb-08 9714.619735 1.176202143 14.98060038
Mar-08 16815.4243 1.176202142 14.98060037
Apr-08 29844.95128 1.176202143 14.98060037
May-08 39937.08213 1.176202142 14.98060037
Jun-08 54354.41191 1.176202142 14.98060036
Jul-08 63004.80979 1.176202142 14.98060036
Aug-08 68772.04133 1.176202142 14.98060037
Sep-08 77422.4392 1.176202142 14.98060037
Oct-08 87514.57005 1.176202142 14.98060036
Nov-08 94723.23495 1.176202142 14.98060037
Dec-08 96164.96793 1.176202142 14.98060037
Jan-09 101931.8998 1.176202142 14.98060036
Feb-09 109140.5647 1.176202142 14.98060037
Mar-09 119246.5377 1.176202142 14.98060037
Apr-09 126455.2026 1.176202142 14.98060037
May-09 137935.1362 1.176202142 14.98060037
Jun-09 146585.5341 1.176202142 14.98060037
Jul-09 155235.932 1.176202142 14.98060037
Aug-09 166769.7958 1.176202142 14.98060037
Sep-09 172536.7277 1.176202142 14.98060037
Oct-09 181187.1256 1.176202142 14.98060037
Nov-09 192720.9895 1.176202142 14.98060037
Dec-09 206390.4877 1.176202142 14.98060037
Jan-10 221555.649 1.176202142 14.98060037
Feb-10 237414.7118 1.176202142 14.98060037
Mar-10 258198.1975 1.176202142 14.98060037
Apr-10 269732.0614 1.176202142 14.98060037
May-10 284149.3912 1.176202142 14.98060037
Jun-10 301450.1869 1.176202142 14.98060037
Jul-10 315867.5167 1.176202142 14.98060037
Aug-10 330284.8465 1.176202142 14.98060037
Sep-10 341818.7103 1.176202142 14.98060037
Oct-10 353352.5742 1.176202142 14.98060037
Nov-10 367769.904 1.176202142 14.98060037
Dec-10 382187.2337 1.176202142 14.98060037
Jan-11 393721.0976 1.176202142 14.98060037
Feb-11 402371.4955 1.176202142 14.98060037
Mar-11 416788.8252 1.176202142 14.98060037
Apr-11 425439.2231 1.176202142 14.98060037
May-11 426880.9561 1.176202142 14.98060037
Jun-11 435531.354 1.176202142 14.98060037
Jul-11 447065.2178 1.176202142 14.98060037
Aug-11 461493.5808 1.176202142 14.98060037
Sep-11 463477.0123 1.176202142 14.98060037
Oct-11 480777.8081 1.176202142 14.98060037
Nov-11 498078.6038 1.176202142 14.98060037
Dec-11 524029.7974 1.176202142 14.98060037
Jan-12 541330.5932 1.176202142 14.98060037
Feb-12 549594.7073 1.176202142 14.98060037
Mar-12 583853.267 1.176202142 14.98060037
Apr-12 599995.2115 1.176202142 14.98060037
May-12 624208.1281 1.176202142 14.98060037
Jun-12 643040.3967 1.176202142 14.98060037
Jul-12 665132.0783 1.176202142 14.98060037
Aug-12 670512.7264 1.176202142 14.98060037
Sep-12 689687.5593 1.176202142 14.98060037
Oct-12 696698.8398 1.176202142 14.98060037
Nov-12 697489.0321 1.176202142 14.98060037
Dec-12 701752.8869 1.176202142 14.98060037

56
I. Cost Variance is derived by subtracting AC from EV. For the proposed
project, it can be seen that CV consistently comes with positive value that
depicts a favorable scenario meaning that Earned Value is more than actual
cost spent and project earned progress is more than expenditure. Cost
Variance can also be expressed as Cost Variance Percentage (CVP) if CV is
divided by EV. Table 6 shows value of CVP that is positive and constantly
equal to 15% approximately. While CVP as positive value it indicates that
project progresses at a good condition and it is constantly 15% under-budget.
II. By referring to Table6 values of Cost Performance Index values over project
duration can be seen that is positive and constantly equal to 1.176, since CPI
demonstrates the efficiency of project progress and source utilization having
value greater than 1 depicts a very favorable scenario. Therefore project has
very high cost efficiency.
5.2.2 Schedule Variance & Schedule Performance Index
EVM enables Project Managers to measure and control time utilization and activity
duration in order to enhance project performance and efficiency. Results from Earned
Value Schedule analysis i.e. SV, SVP, and SPI are demonstrated in Table7.

57
Month SV SPI SVP
Jan-08 -21708 0.630590157 -0.585816062
Feb-08 -60025.5 0.519309541 -0.92563379
Mar-08 -86080.5 0.565970095 -0.766877806
Apr-08 -79905 0.71373451 -0.401081195
May-08 -89664.75 0.748314242 -0.336336987
Jun-08 -70552.5 0.837205761 -0.194449497
Jul-08 -97281.75 0.812145806 -0.231305995
Aug-08 -135911.5 0.771571744 -0.296055756
Sep-08 -155295.25 0.768944817 -0.300483439
Oct-08 -161382.25 0.783544632 -0.276251485
Nov-08 -186717.25 0.772024482 -0.295295711
Dec-08 -250548.25 0.719266828 -0.390304628
Jan-09 -278161.75 0.709821297 -0.408805293
Feb-09 -299824 0.708447349 -0.411537501
Mar-09 -309491.35 0.720043437 -0.388805103
Apr-09 -342171.85 0.711563386 -0.405356177
May-09 -335322.1 0.733040916 -0.364180332
Jun-09 -358378.6 0.731929319 -0.366252142
Jul-09 -385107.85 0.729055688 -0.371637335
Aug-09 -381570.85 0.744736093 -0.342757535
Sep-09 -416529.85 0.734400724 -0.361654432
Oct-09 -443259.1 0.731803084 -0.366487818
Nov-09 -443394.85 0.743682434 -0.34465997
Dec-09 -429274.6 0.762437043 -0.311583702
Jan-10 -383133.85 0.794244621 -0.259057944
Feb-10 -339706.6 0.823485117 -0.214351031
Mar-10 -285443.85 0.85791704 -0.165613869
Apr-10 -289252.35 0.861588154 -0.160647342
May-10 -266467.35 0.876820811 -0.140483879
Jun-10 -231779.85 0.89671361 -0.115183253
Jul-10 -220013.1 0.905513902 -0.104345276
Aug-10 -200900.85 0.916487957 -0.091121811
Sep-10 -197363.85 0.920389112 -0.08649699
Oct-10 -197499.6 0.922738059 -0.083731174
Nov-10 -174714.6 0.933560737 -0.071167585
Dec-10 -159275.1 0.941237514 -0.062431092
Jan-11 -137374.35 0.950327124 -0.05226924
Feb-11 -138394.35 0.950999484 -0.051525281
Mar-11 -126627.6 0.956467679 -0.045513636
Apr-11 -149684.1 0.94993204 -0.052706886
May-11 -213515.1 0.930293837 -0.074929189
Jun-11 -236571.6 0.924751564 -0.081371515
Jul-11 -236707.35 0.926511263 -0.079317694
Aug-11 -221194.2 0.933008041 -0.071802124
Sep-11 -281409.2 0.916625851 -0.090957667
Oct-11 -239376.2 0.930589686 -0.074587452
Nov-11 -201015.95 0.942987784 -0.060459124
Dec-11 -108584.45 0.969893187 -0.031041369
Jan-12 -62878.7 0.982896771 -0.017400839
Feb-12 -77495.51 0.979313596 -0.021123371
Mar-12 66717.4 1.017416602 0.017118457
Apr-12 97341.97 1.024909622 0.024304213
May-12 178169.95 1.044669724 0.042759661
Jun-12 223080.49 1.054818918 0.05196998
Jul-12 289748.59 1.069815447 0.065259337
Aug-12 252211.03 1.059713822 0.056349007
Sep-12 306753.79 1.071385944 0.066629532
Oct-12 272755.69 1.062302604 0.058648641
Nov-12 204575.46 1.045957834 0.043938515
Dec-12 159582.97 1.035268295 0.034066817
Table 7: Earned Value Schedule Analysis (Amount in Malaysian Ringgit)
58
I. SV is calculated by subtracting PV from EV and according to Table7 it can
be seen that SV values are consistently negative within four year from
beginning of project and this depicts an unfavorable scenario that the project
is behind the schedule. However, form March 2012 onward SV is constantly
positive indicating that project is ahead of schedule in the last financial year.
II. SV also can be expressed in terms of percentage is SV is divided by EV. As
it can be seen in Table7 SV lies between -0.92563379 and 0.066629532
indicating percentage of project which has not be accomplished against
planned schedule.
III. SPI is an indicator showing efficiency of time utilized during project
progress. Results from SPI analysis are tabulated and Table7 and
demonstrate that project team has performed quiet inefficient during 4years
started from 2008 since the SPI is less than 1 and varies between 52% to
98%. However in the last year of project time efficiency becomes more than
1 meaning that project time utilization is in favorable condition.
5.2.3 Forecasting (Estimate at Completion)
Apart from being a controlling and monitoring tool, EVM can be powerful
forecasting tool to estimate project total cost when all planned activities are completed.
In order to find out how Earned Value analysis would assist project managers, in
“Suzuki Swift” project we assumed that if only two third of project has been completed and
now we as project managers want to see how much our project will cost at the end of year
2012, Figure13. Two third of project would be completed until April 201. Therefore S-
curve would be as follow:

59
Figure 13: PV, AC, & EV at Time-Now
EAC(C) is calculated as follow:
EAC(C)
0
500000
1000000
1500000
2000000
2500000
3000000
3500000
4000000
4500000
5000000
Oct-06 Feb-08 Jul-09 Nov-10 Apr-12 Aug-13
AC-Apr2011
EV
PV1
BAC

60
Figure 14: Estimate at Completion
0
500000
1000000
1500000
2000000
2500000
3000000
3500000
4000000
4500000
5000000
Oct-06 Feb-08 Jul-09 Nov-10 Apr-12 Aug-13
Co
st
Time
EV
AC
PV1
EAC

61
Figure 15: Estimate at Completion in comparison with final Actual Cost
According to Figure15, there is a small error in EAC forecast that is called
Estimation Error (EER). EER percentage can be calculated as follow:
0
500000
1000000
1500000
2000000
2500000
3000000
3500000
4000000
4500000
5000000
Oct-06 Feb-08 Jul-09 Nov-10 Apr-12 Aug-13
Axi
s Ti
tle
Axis Title
EV
PV1
Actual Cost
TIme Now
BAC
EAC
Estimation Error

62
CHAPTER SIX
CONCLUSIONS AND SUGGESTIONS FOR FUTURE WORK
6. Conclusions
In this dissertation EVM system as a powerful performance measurement and
forecasting tool was successfully implemented and tested for manufacturing industry and
very interesting results have been released for far. In compare with traditional and common
project management techniques, EVM technique is more comprehensive so that it covers
more aspects of project performance and can assist project managers to boost project
performance efficiencies. EVM facilitate project managers a very clear insight to look at
project status more in depth and enables them to have a clear view about project future
performance.
What makes exception in EVM system from other project management technique is
that EVM consolidate project scope with project time and cost. As it came from results and
have been seen in this study EVM would be able to measure and analyze project cost and
time utilization provides project team with worthy information about how efficient project
sources were utilized at any point in project. By calculating variances and indices EVM can
help project team to examine and analyze current trend and performance of cost and
schedule in many different ways and from the case study it was revealed that EVM
provided very useful assessment of actual percentage of work completion. Moreover, as it
was demonstrated in this report EVM can make it possible for project managers to predict
and estimate future cost and schedule performance with a reasonable error. These types of
information cannot be generated from other managing techniques rather than EVM.
63
The implementation of the EVM methodology on manufacturing projects demands
some effort and short-term yield is not obvious. However, this effort only needs to be done
at the beginning of the project and will eventually prove valuable throughout the course of
the project. This added value consists of providing early warning signals for project
managers and in the long run, employing EVM will help to a gain better view on the
progress of the project’s performance. EVM provides project managers with quantifiable
and tangible data on whether the project is performing according to plan or not. This
quantifiable data can subsequently be extrapolated throughout the portfolio of projects and
will allow better estimates for new projects.
However, though EVM is a helpful and powerful managing technique, it is very
important that project frequent monitoring to be done to generate basic elements for Earned
Value calculation since lack of information will not give desired results specially in terms
of Actual Cost monitoring should be on a daily process.
Conclusively, we strongly believe that the EVM methodology could have helped the
studied projects in achieving a better understanding of the project performance. Moreover,
when EVM would be incorporated as a general project management tool by manufacturing
companies and its methodology would be understood well by project managers, it could
definitely serve as a powerful tool to follow up all types of manufacturing projects. EVM
will also enable PMs to apply the most appropriate forecasting methods which will
eventually lead to even better results. Nevertheless, appropriate training, and organizational
support is required to reach these objectives.
Furthermore, it can be concluded that the EVM methodology definitely helps project
managers control manufacturing projects by providing accurate forecasts and early warning
signals. All necessary information to implement this methodology is available in most
manufacturing projects. This information just has to be employed to integrate both schedule

64
and costs in one Work Breakdown Structure (WBS). Other requirements for using EVM are
to have a clearly defined scope and to have the support of the organization which enables
allocation of responsibilities.
6.1 Suggestions
While processing the data needed to evaluate the projects, some key insights were
obtained which are useful for further implementation of the EVM methodology on
manufacturing projects.
I. To join a tender, an estimate of the budget and schedule has to be set up.
Therefore, calculations have to be made concerning the cost of the different
activities which are scheduled.
II. To make the implementation of EVM a complete success, responsibilities
should be clearly assigned to the members of the project team / organization.
III. In the executed study, and in particular in the designed model, only two input
data are included. Thus the model evaluates mainly the cost and time
performance of a project. For a project to be considered successful, it is also
necessary to consider other parameters than cost and time. Such a parameter
can for instance be the quality of the performed activities.

65
REFERENCES
A Guide for Project M&E, I. (,1977). "Glossary of M&E Concepts and Terms,."
International Funf for Agricultural Development (IFAD),
http://www.ifad.org/evaluation/guide/annexa/a.htm.
Afs, C. S. D. L. A. (1980). "Proceedings of Industry/Space Division/NASA Conference and
Workshops on Mission Assurance Held at Los Angeles, California on 28 April-2 May
1980."
Alheraish, A. (2004). "Design and implementation of home automation system." Consumer
Electronics, IEEE Transactions on 50(4): 1087-1092.
Aliverdi, R., L. Moslemi Naeni and A. Salehipour (2013). "Monitoring project duration and
cost in a construction project by applying statistical quality control charts." International
Journal of Project Management 31(3): 411-423.
Alsakini, W., K. Wikström and J. Kiiras (2004). "Proactive schedule management of i
ndustrial turnkey projects in developing countries." International Journal of Project
Management 22(1): 75-85.
Anbari, F. T. (2003). "Earned value project management method and extensions." Project
management journal 34(4): 12-23.
Anbari, F. T. (Dec 2003). "EARNED VALUE PROJECT MANAGEMENT METHOD
AND EXTENSIONS." Project Management Journal: 34, 34; ABI/INFORM Complete
pg. 12
Association, N. S. I. (1980). "Cost Schedule Systems Conpendium." Washington, DC.
Atkinson, R. (1999). "Project management: cost, time and quality, two best guesses and a
phenomenon, its time to accept other success criteria." International Journal of Project
Management 17(6): 337-342.
Bassioni, H., A. Price and T. Hassan (,(2004)). "Performance measurement in
construction." Journal of Management in Engineering 20(2): 42-50.

66
Benjaoran, V. (2009). "A cost control system development: A collaborative approach for
small and medium-sized contractors." International Journal of Project Management 27(3):
270-277.
Bradley, D. C., M. Mascaro and S. Santhakumar (2005). "A relational database for trial-
based behavioral experiments." Journal of neuroscience methods 141(1): 75-82.
Butler GC, K. N. ( 1993). Cost and schedule control at besselaar. Proceedings of Project
Management Institute.
Buyse, P., T. Vandenbussche and M. Vanhoucke (,(2006)). "Performance analysis of
earned value management in the construction industry."
Cabri, A. and M. Griffiths (,(2006)). Earned value and agile reporting, IEEE.
Chambers+Software (,(2013)). "Earned Value Management Basics." CA software in
practice http://www.chambers.com.au/glossary/earned_value_management.php.
Chapman, C., and Stephen Ward. (2007.). Project risk management: processes, techniques
and insights. , Wiley,.
Cheung, S. O., K. K. Cheung and H. C. Suen (2004). "CSHM: Web-based safety and health
monitoring system for construction management." Journal of Safety Research 35(2): 159-
170.
Chou, J.-S., H.-M. Chen, C.-C. Hou and C.-W. Lin (2010). "Visualized EVM system for
assessing project performance." Automation in Construction 19(5): 596-607.
Chou, J.-S. and J. T. O'Connor (2007). "Internet-based preliminary highway construction
cost estimating database." Automation in Construction 17(1): 65-74.
Christensen, D. S. (1998). "The costs and benefits of the earned value management
process." Journal of Parametrics 18(2): 1-16.
Date, T. "Malaysia Calandar ", from http://www.timeanddate.com/calendar/.
El-Omari, S. and O. Moselhi (2009). "Data acquisition from construction sites for tracking
purposes." Engineering, Construction and Architectural Management 16(5): 490-503.

67
Fleming, Q. W. and J. M. Koppelman (2000). Earned value project management, Project
Management Institute Pennsylvania.
Fleming, Q. W. and J. M. Koppelman (2006). "Earned Value Project Management A
Powerful Tool for Software Projects." Software Management 16: 337.
Garrett, G. A. (,2006). "Earned value management." Contract.
Ghanem¹, A. and Y. AbdelRazig (2006). "A framework for real-time construction project
progress tracking."
Gokhale, H. and M. Bhatia (1997). "A project planning and monitoring system for research
projects." International Journal of Project Management 15(3): 159-163.
Kerzner, H. (2013). Project management: a systems approach to planning, scheduling, and
controlling, Wiley.
Khamidi, M. F., W. Ali and A. Idrus (2011). "Application of Earned Value Management
System on an Infrastructure Project: A Malaysian Case Study."
Kim, E., W. G. Wells Jr and M. R. Duffey (2003). "A model for effective implementation
of Earned Value Management methodology." International Journal of Project Management
21(5): 375-382.
Koppelman, F. Q. a. ((2005)). Earned Value Project Management,. Pennsylvania,, Project
Management Institute, Inc.
Li, J., O. Moselhi and S. Alkass (2006). "Internet-based database management system for
project control." Engineering, Construction and Architectural Management 13(3): 242-253.
Lipke, W., O. Zwikael, K. Henderson and F. Anbari (2009). "Prediction of project
outcome: The application of statistical methods to earned value management and earned
schedule performance indexes." International Journal of Project Management 27(4): 400-
407.
Lipke.et.al (,(2009)). " "Prediction of project outcome: The application of statistical
methods to earned value management and earned schedule performance indexes." "
International journal of project management 27.4 (2009): 400-407.
.

68
Lohman, C., L. Fortuin and M. Wouters (2004). "Designing a performance measurement
system: A case study." European Journal of Operational Research 156(2): 267-286.
Lohman, F. A. B. (,(1999)). "The effectiveness of management information."
Marshall, R. A. (2006). "The contribution of earned value management to project success
on contracted efforts: A quantitative statistics approach within the population of
experienced practitioners." Lille Graduate School of Management.
MCIS. (1973-2008). "MCIS Safety Glass Sdn Bhd." from
http://www.mcissafetyglass.com.my/.
Moslemi Naeni, L., S. Shadrokh and A. Salehipour (2013). "A fuzzy approach for the
earned value management." International Journal of Project Management.
Neely, A., M. Gregory and K. Platts (,(1995)). "Performance measurement system design: a
literature review and research agenda." International Journal of Operations & Production
Management 15(4): 80-116.
P.S. Hemachandra, J. Y. R. ((2008)). Probabilistic earned value forecasting and
activity performance index using Monte Carlo simulation. Proceedings, Annual
Conference —Canadian Society for Civil Engineering 1.
Pillai, A. S., A. Joshi and K. S. Rao (,(2002)). "Performance measurement of R&D projects
in a multi-project, concurrent engineering environment." International Journal of Project
Management 20(2): 165-177.
PMBOK.Guide (,(2000).). "A Guide to the Project Management Body of Knowledge
(PMBOK Guide)." Project Management Institute,
.
R., B. (1983;Sept:). Earned value: burden or benefit? . The Measurable News: 12–13.
Raz, T., and E. Michael ((2001):). " "Use and benefits of tools for project risk
management.".". International Journal of Project Management 19.1: 9-17.
Rodrigues, A. and J. Bowers (1996). "System dynamics in project management: a
comparative analysis with traditional methods." System Dynamics Review 12(2): 121-139.

69
RR., K. (1993;Dec:). Performance analysis: earned value and its pitfalls. The Measurable
News 1–6.
Sarkar, N., A. D. Little and R. R. Wolfe (1984). "Computer vision based system for quality
separation of fresh market tomatoes." Microfiche collection.
Schwalbe, K. (2010). Information Technology: Project Management, Course Technology
Ptr.
Turban, E., J. C. Wetherbe and E. McLEAN (1996). Information technology for
management, Wiley.
United States of America Department of Energy, Earned Value Management Tutorial
Module 1: Introduction to Earned Value Management, .
Vandevoorde, S. and M. Vanhoucke (2006). "A comparison of different project duration
forecasting methods using earned value metrics." International journal of project
management 24(4): 289-302.
Vargas, R. V. (2004). "Earned value probabilistic forecasting using Monte Carlo
simulation." AACE International Transactions: p1-1.
Webb, A. (2003). Using earned value: a project manager's guide, Gower Publishing, Ltd.
Wysocki, R. K. and R. McGary (,(2003)). Effective project management: traditional,
adaptive, extreme, Wiley. com.

70
Appendix A
Received Data from MCIS SAFETY GALSS Company Regarding “Suzuki Swift”

71
Appendix B
Malaysia Calendar from Year 2008 to Year 2012