earlywatch alert-uky production 1 service summary sap e-recruiting fi-ca 606 12 14 sapk-60612infica...
TRANSCRIPT

1
SAP Support Mailbox
From: Batch ID for Basis <[email protected]>Sent: Tuesday, April 21, 2015 12:32 AMSubject: UKD - Critical (Yellow) - SAP EarlyWatch Alert
Analysis from 04/13/2015 Until 04/19/2015
Report: UKD, Not Productive Installation: 0020171817
Session: 0010000007388
EarlyWatch Alert-UKY Production
1 Service Summary
This EarlyWatch Alert session detected issues that could potentially affect your system. Take corrective action as soon as possible.
Alert Overview
Some tablespaces with long read or write times were detected.
Based on response times in your ABAP system performance problems may occur.
Hardware resources may have been exhausted with the risk of performance degradation.
Expensive SQL statements cause load on the database server.
Standard users have default password.
A high number of users has critical authorizations
Perform the following Guided Self Services.
Guided Self Service FAQ SAP Note
SQL Statement Tuning 1601951
Security Optimization Service 696478
For more information about Guided Self-Services, see SAP Enterprise Support Academy.
Register for an Expert-Guided Implementation Session for the Guided Self-Service at SAP Enterprise Support Academy - Learning Studio - Calendar.

2
Check Overview Topic Rating Topic Subtopic
Rating Subtopic
SAP System Configuration
Database - Maintenance Phases
Operating System(s) - Maintenance Phases
Performance Overview
Performance Evaluation
Workload Distribution
Workload by Application Module
DB Load Profile
SAP System Operating
Availability based on Collector Protocols
Program Errors (ABAP Dumps)
Update Errors
Table Reorganization
Hardware Capacity
DB Performance
Database Version
Locking
Average Read and Write Times
Missing Indexes
DB Administration
Database Growth and Freespace
10 Largest and Fastest Growing Tables
Tablespaces with a critical size
Tables with a critical size
Table Virtualization
Enhanced Monitoring
Log File Management
Logfiles Recommendations
Database Backup History
Database Server Load From Expensive SQL Statements
Expensive SQL Statements
Database Server Load
Security
Default Passwords of Standard Users
Control of the Automatic Login User SAP*
Protection of Passwords in Database Connections
ABAP Password Policy
Users with Critical Authorizations
3
Check Overview Topic Rating Topic Subtopic
Rating Subtopic
Software Change Management
Number of Changes
Note: The recommendations in this report are based on general experience. Test them before using them in your production system. Note that EarlyWatch Alert is an automatic service.
Note: If you have any questions about the accuracy of the checks in this report or the correct configuration of the SAP Solution Manager EarlyWatch Alert service, create a customer message on component SV-SMG-SER-EWA.
Note: If you require assistance in resolving any concerns about the performance of the system, or if you require a technical analysis of other aspects of your system as highlighted in this report, create a customer message on component SV-BO. For details of how to set the appropriate priority level, see SAP Note 67739.
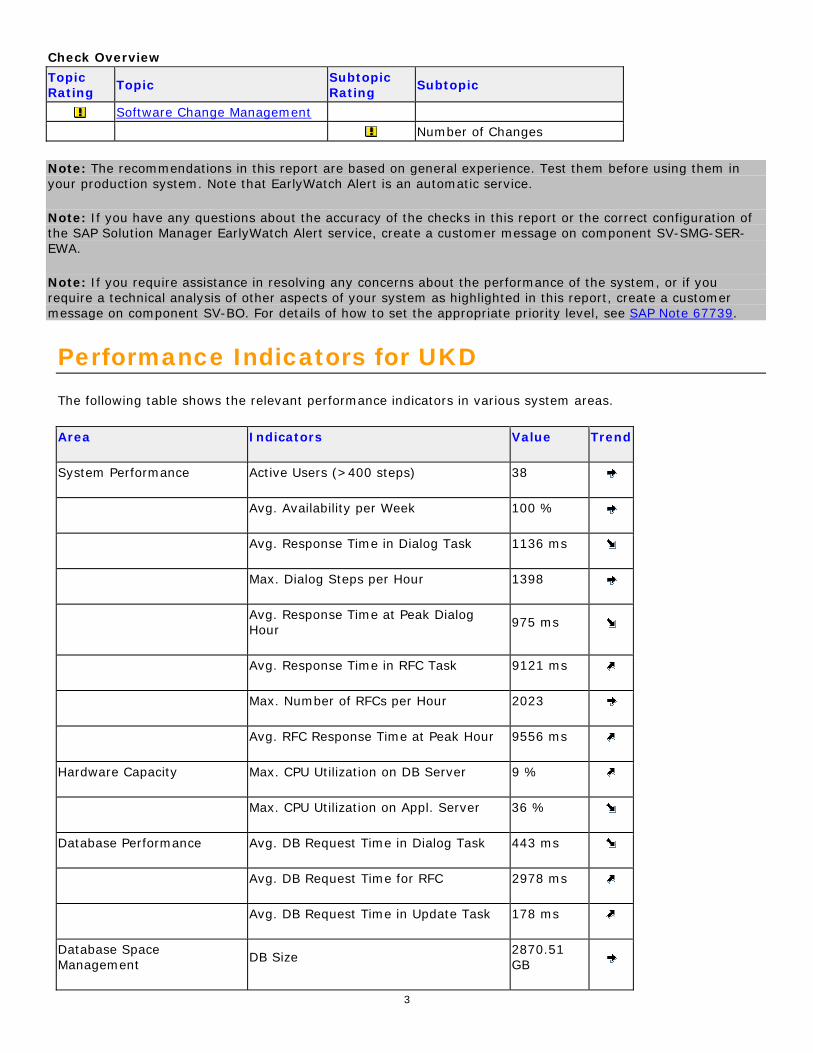
Performance Indicators for UKD The following table shows the relevant performance indicators in various system areas.
Area Indicators Value Trend
System Performance Active Users (>400 steps) 38
Avg. Availability per Week 100 %
Avg. Response Time in Dialog Task 1136 ms
Max. Dialog Steps per Hour 1398
Avg. Response Time at Peak Dialog Hour 975 ms
Avg. Response Time in RFC Task 9121 ms
Max. Number of RFCs per Hour 2023
Avg. RFC Response Time at Peak Hour 9556 ms
Hardware Capacity Max. CPU Utilization on DB Server 9 %
Max. CPU Utilization on Appl. Server 36 %
Database Performance Avg. DB Request Time in Dialog Task 443 ms
Avg. DB Request Time for RFC 2978 ms
Avg. DB Request Time in Update Task 178 ms
Database Space Management DB Size 2870.51
GB

4
Area Indicators Value Trend
DB Growth Last Month 1.12 GB
2 Landscape
2.1 Products and Components in current Landscape Product SID SAP Product Product Version UKD SAP ERP ENHANCE PACKAGE 6.06 Main Instances (ABAP or Java based) SID Main Instance UKD SAP ECC Server UKD Add-on: DMIS - 2.0 Databases SID Database System Database Version UKD DB2 for Linux UNIX and Windows 9.7
2.2 Servers in current Landscape SAP Application Servers SID Host Instance Name Logical Host ABAP JAVA UKD r3sbx r3sbx_UKD_00 r3sbx
UKD r3sbxa02 r3sbxa02_UKD_02 trndb
UKD r3sbxa01 r3sbxa01_UKD_01 r3sbxa01
DB Servers SID Host Logical Host (SAPDBHOST) UKD r3sbxa02 r3sbx
2.3 Hardware Configuration Host Overview
Host Hardware Manufacturer Model CPU
Type Virtualization Operating System
No. of CPUs
Memory in MB
r3sbx IBM 8205-E6B POWER7 SPLPAR,
UNCAPPED AIX 6.1 16 53760
r3sbxa01 IBM 7778-23X POWER6 SPLPAR,
UNCAPPED AIX 6.1 8 16128
r3sbxa02 IBM 8205-E6B POWER7 SPLPAR,
UNCAPPED AIX 6.1 16 32768

5
3 Service Preparation and Data Quality of UKD
Configuration hints for optional service data are provided.
SAP ERP ENHANCE PACKAGE system UKD is not fully prepared for delivery of future remote services.
Rating Check Performed
Service Data Quality
ST-PI and ST-A/PI Plug-Ins
Service Preparation Check (RTCCTOOL)
Service Data Control Center
Hardware Utilization Data
In preparation for SAP services, ensure that connections, collectors, and service tools are up to date. These functionalities are explained in SAP Notes 91488 and 1172939.
3.1 Service Data Quality The service data is collected by the Service Data Control Center (SDCCN) or read from the Solution Manager's BW or Configuration and Change Database (CCDB).
This section comprehensively shows issues with the data quality and provides hints on how to resolve them.
Legend for 'Priority' in Service Data Quality Prio. Explanation: Impact of Missing or Erroneous Data
Overall important data are missing. Detecting a critical situation may fail. Report cannot be rated green or yellow.
Data for an important chapter are missing. Some issues may not be detected. Report cannot be rated green.
Some important check could not be processed. The report can be rated green nevertheless.
Only checks of minor importance are affected.
An optional check was skipped.
3.1.1 Quality of Service Data in Solution Manager Diagnostics - BW

6
Prio. Report Area affected Details and Related Infocube SAP
Note
Workload of ABAP System UKD
Reading performance data from BW returned neither data nor an error code. A timeout may have occurred. Infocube: 0CCMSMTPH used in section 'Workload Overview UKD'.
1332428
3.2 ST-PI and ST-A/PI Plug-Ins The table below shows the service plug-ins implemented and their releases and patch levels. These recommendations are derived from report RTCCTOOL. For more information about RTCCTOOL, see SAP Note 309711.
Rating Plug-In Release Patch Level Release Rec. Patch Level Rec.
ST-A/PI 01R_731 1 01R_731 1
ST-PI 2008_1_700 11 2008_1_700 11
3.3 Hardware Utilization Data
Host Operating System Performance Data
r3sbx AIX 6.1 --
r3sbxa01 AIX 6.1 --
r3sbxa02 AIX 6.1 --
Hardware capacity checks could not be run successfully due to missing data. See SAP Note 1309499.
4 Software Configuration For UKD
We have listed recommendations concerning the current software configuration on your system.
Your system's software versions are checked. If known issues with the software versions installed are identified, they are highlighted.

7
4.1 Codepage Technology Support It was not possible to detect whether you are using other codepage technologies in addition to Unicode. We support and fully recommend Unicode in systems involving multiple languages. As of SAP NetWeaver Release 7.0, Unicode is the only supported
and available codepage technology.
We can only ensure data consistency in installations with multiple languages if the entire system is based on Unicode. See SAP Note 838402 -> Attachments -> "Customer Letter" for information about our supported codepage technologies. Recommendation: If you are using a codepage technology other than Unicode, we recommend that you review our disclaimer, which you can find at: /unicode -> Unicode Media Library -> SAP ERP 6.0 and MDMP -> "Disclaimer: MDMP with SAP 6.0". For more information about how to migrate to Unicode completely, see the document "Roadmap: From MDMP to SAP ERP 6.0 Unicode", which you can find at the path above.
We recommend that you review SAP Note 179991, which contains recommendations relevant to your SAP component. If you are not using multiple languages, ignore this recommendation.
4.2 SAP Application Release - Maintenance Phases
SAP Product Version End of Mainstream Maintenance Status
EHP6 FOR SAP ERP 6.0 12/31/2025
In October 2014, SAP announced a maintenance extension for SAP Business Suite 7 core application releases to 2025. If you are running a relevant release, see SAP Note 1648480 for more details and applicable restrictions.
4.3 Support Package Maintenance - ABAP The following table shows an overview of currently installed software components.
Support Packages
Software Component Version Patch
Level
Latest Avail. Patch Level
Support Package Component Description
DMIS 2011_1_731 8 8 SAPK-11608INDMIS DMIS Component
EA-APPL 606 12 14 SAPK-60612INEAAPPL
SAP R/3 Enterprise PLM, SCM, Finance
EA-DFPS 606 12 14 SAPK-60612INEADFPS
SAP R/3 Enterprise Defense Forces & Public Security
EA-FINSERV 606 12 14 SAPK-60612INEAFINSRV
SAP R/3 Enterprise Financial Services
EA-GLTRADE 606 12 14 SAPK-60612INEAGLTRAD
SAP R/3 Enterprise Global Trade

8
Support Packages
Software Component Version Patch
Level
Latest Avail. Patch Level
Support Package Component Description
EA-HR 606 41 48 SAPK-60641INEAHR SAP R/3 Enterprise Human Resources
EA-IPPE 406 7 8 SAPK-40607INEAIPPE
SAP R/3 Enterprise Integrated Product and Process Engineering
EA-PS 606 12 14 SAPK-60612INEAPS SAP R/3 Enterprise Public Services
EA-RETAIL 606 12 14 SAPK-60612INEARETAIL
SAP R/3 Enterprise Retail
ECC-DIMP 600 13 26 SAPK-60013INECCDIMP
ECC Discrete Industries Mill Products
ERECRUIT 606 12 14 SAPK-60612INERECRUIT SAP E-Recruiting
FI-CA 606 12 14 SAPK-60612INFICA FI-CA, Contract Accounts Receivable and Payable (virtuell)
FI-CAX 606 12 14 SAPK-60612INFICAX
FI-CAX: Extended FI-CA
FINBASIS 600 25 26 SAPK-60025INFINBASIS
SAP R/3 Enterprise FINBASIS
HCLRL 402_600 7 SAPK-40207INHCLRL
INSURANCE 600 13 26 SAPK-60013ININSURANC
INSURANCE SAP Insurance
IS-CWM 600 13 26 SAPK-60013INISCWM
IS-CWM Catch Weight Management
IS-H 606 15 SAPK-60615INISH IS-Hospital IS-M 600 13 26 SAPK-60013INISM IS Media
IS-OIL 600 13 26 SAPK-60013INISOIL
IS-OIL SAP OIL & GAS Upstream / Downstream
IS-PS-CA 606 12 14 SAPK-60612INISPSCA
IS-PS-CA, Tax&Revenue; Campus Management
IS-UT 600 13 26 SAPK-60013INISUT IS-UT
LSOFE 606 6 7 SAPK-60606INLSOFE
Learning Solution - Front End
MDG_APPL 606 12 14 SAPK-60612INMDGAPPL MDG Applications
MDG_FND 731 12 14 SAPK-73112INMDGFND MDG Foundation
OTEXBAS 1000_700 1 SAPK-30401INOTEXBAS
Opentext Basis Add On
OTEXEIM 0350_605 0 Otexeim OTEXERP 1000_600 0 DOCU LINK ERP OTEXRL 1000_700 0 Otexrl PI_BASIS 731 12 15 SAPK- SAP R/3 Basis Plug-In

9
Support Packages
Software Component Version Patch
Level
Latest Avail. Patch Level
Support Package Component Description
73112INPIBASIS
PLMWUI 702 12 14 SAPK-70212INPLMWUI PLM WUI
SAP_ABA 731 12 15 SAPKA73112 SAP Application Basis
SAP_AP 700 31 32 SAPKNA7031 SAP Application Platform
SAP_APPL 606 12 14 SAPKH60612 SAP R/3 Standard SAP_BASIS 731 12 15 SAPKB73112 SAP Basis Component
SAP_BS_FND 731 12 14 SAPK-73112INSAPBSFND
SAP Business Suite Foundation
SAP_BW 731 12 15 SAPKW73112 SAP Business Information Warehouse
SAP_HR 604 79 86 SAPKE60479 SAP R/3 Standard HR SEM-BW 600 25 26 SAPKGS6025 SAP SEM Server
SMERP 610_700 4 4 SAPK-61004INSMERP SMERP
SMFND 610_700 4 4 SAPK-61004INSMFND SMFND
SPINGTK 203_700 0 Spinifexit-generic Reporting by SpinifexIT Pty Ltd
ST-A/PI 01R_731 1 2 SAPKITAB9N SAP Service Tools for Applications Plug-In
ST-PI 2008_1_700 11 11 SAPKITLRDK SAP Solution Tools Plug-In
USC2B 100 1 1 SAPK-10001INUSC2B Usc2b
WEBCUIF 731 12 14 SAPK-73112INWEBCUIF SAP Web UIF
4.4 Database - Maintenance Phases
Database Version End of Standard Vendor Support* Comment Status SAP
Note
DB2 for Linux, UNIX and Windows 9.7 See Relevant SAP
Note
1168456
* Maintenance phases and duration for the DB version are defined by the vendor. Naming of the phases and required additional support contracts differ depending on the vendor. Support can be restricted to specific patch levels by the vendor or by SAP.
The end of vendor support dates given in this table are the regular End-of-Support dates published by IBM. If you have obtained your DB2 license from SAP ("application-specific license" (ASL) or "OEM license", as explained in SAP Note 1260217), refer to the SAP Note listed in the table.

10
See the "Database Version" section in the database section for additional information.
4.5 Operating System(s) - Maintenance Phases
Host Operating System
End of Standard Vendor Support* Comment Status SAP
Note
3 Hosts AIX 6.1 Not Yet Defined by
Vendor
1179765
* Maintenance phases and duration for the OS version are defined by the vendor. Naming of the phases and required additional support contracts differ depending on the vendor. Support can be restricted to specific patch levels by the vendor or by SAP. Check in the referenced SAP Note(s) whether your SAP system requires a specific patch release to guarantee support for your operating system version.
4.6 SAP Kernel Release The following table lists all information about your SAP kernel(s) currently in use.
Instance(s) SAP Kernel Release Patch Level Age in Months OS Family
3 instances 721_EXT_REL 300 11 AIX
4.6.1 Kernel out of date
Your current SAP kernel release is probably not up to date.
Recommendation: Make sure that you are using the recommended SAP kernel together with the latest Support Package stack for your product.
4.6.2 Additional Remarks
SAP releases Support Package stacks (including SAP kernel patches) on a regular basis for most products (generally 2–4 times a year). We recommend that you base your software maintenance strategy on these stacks.
You should only consider using a more recent SAP kernel patch than that shipped with the latest Support Package Stack for your product if specific errors occur.
For more information, see SAP Service Marketplace at http://service.sap.com/sp-stacks (SAP Support Package Stack information) and http://service.sap.com/patches (patch information).
5 Hardware Capacity

11
We have checked your solution for potential CPU or memory bottlenecks and found that the hardware resources may have been exhausted. An increase in the workload may have a negative impact on performance.
No CPU virtualization data is available for at least one shared CPU pool LPAR (SPLPAR).
Recommendation: For more information about providing the data required for SAP services, see SAP Notes 994025 and 1147334.
5.1 Overview System UKD General This analysis focuses on the workload during the peak working hours (9-11, 13) and is based on the hourly averages collected by SAPOSCOL. For information about the definition of peak working hours, see SAP Note 1251291.
CPU If the average CPU load exceeds 75%, temporary CPU bottlenecks are likely to occur. An average CPU load of more than 90% is a strong indicator of a CPU bottleneck.
Memory If your hardware cannot handle the maximum memory consumption, this causes a memory bottleneck in your SAP system that can impair performance. The paging rating depends on the ratio of paging activity to physical memory. A ratio exceeding 25% indicates high memory usage (if Java has been detected 0%) and values above 50% (Java 10%) demonstrate a main memory bottleneck.
Server Max. CPU load [%] Date Rating RAM
[MB] Max. Paging [% of RAM] Date Rating
r3sbx
53760 0
r3sbxa01
16128 0
r3sbxa02
32768 0
6 Business Key Figures System errors or business exceptions can be a reason for open, overdue, or unprocessed business documents or long-lasting processes. SAP Business Process Analysis, Stabilization and Improvement offerings focus on helping you to find these documents (as it may directly or indirectly negatively impact business).
This section provides an example of indicators, and its findings are a basis of further SAP offerings. In the example below, the backlog of business documents is compared to daily or weekly throughput or set in relation to absolute threshold numbers.
It provides business information to discuss possible technical or core business improvement process potential.
SAP tools and methods can help to monitor and analyze business processes in more detail.

12
NOTE: Overdue or exceptional business documents are often caused by system errors, such as user handling issues, configuration or master data issues, or open documents on inactive organizational units or document types, that can be included in the measurements. These documents are rarely processed further by the business departments and often do not have a direct impact on customer satisfaction, revenue stream, or working capital. Nevertheless, these documents can have negative impacts on other areas such as supply chain planning accuracy, performance (of other transactions, reports, or processes), and reporting quality.
6.1 SAP Business Process Analytics With SAP Business Process Analytics in SAP Solution Manager, you can continuously analyze the above key figures and around 750 additional out-of-the-box key figures for continuous improvement potential in your SAP business processes.
With SAP Business Process Analytics, you can perform the following functions:
(1) Internal business process benchmarking (across organizational units, document types, customers, materials, and so on) for a number of exceptional business documents and/or for the cumulated monetary value of these documents.
(2) Age analysis to measure how many open documents you have from the previous years or months.
(3) Trend analysis for these business documents over a certain time period.
(4) Create a detailed list for all of these exceptional business documents in the managed system, enabling a root cause analysis to find reasons why these documents are open, overdue, or erroneous.
SAP Business Process Analytics can help you to achieve the following main goals:
- Gain global transparency of business-relevant exceptions to control template adherence
- Improve process efficiency and reduce process costs by reducing system issues and eliminating waste (for example, user handling, configuration issues, and master data issues)
- Improve working capital (increase revenue, reduce liabilities and inventory levels)
- Ensure process compliance (support internal auditing)
- Improve supply chain planning (better planning results and fewer planning exceptions)
- Improve closing (fewer exceptions and less postprocessing during period-end closing)
SAP also provides business process improvement methodology to help you identify and analyze improvement potential within your business processes using Business Process Analytics in SAP Solution Manager and visualize it for your senior management.
For more information, navigate to the following link: here.
6.2 SAP Active Global Support Follow-Up Opportunities In general, SAP Active Global Support provides several self-assessments or guided services to encourage customers to benefit from an SAP Business Process Stabilization and/or Business Process Improvement project.

13
If you have an SAP Enterprise Support contract, SAP Active Global Support provides you with the following offering for obtaining business process analytics and implementing improvements:
- SAP Expert Guided Implementation Business Process Analytics and Improvement (SAP EGI Portfolio Overview)
- CQC Business Process Analytics and Improvement (fact sheet).
If you have an SAP Max Attention Contract, contact your Technical Quality Manager (TQM) for information about how SAP Active Global Support can help you obtain business process analytics and implement improvements.
7 Workload of System UKD This chart displays the main task types and indicates how their workload is distributed in the system. The table below lists the detailed KPIs.
Response Time Components In Hours Task Type Response Time Wait Time CPU Time DB Time GUI Time RFC 540.4 0.1 6.7 176.4 0.0 BATCH 254.0 0.1 11.7 231.8 0.0 Others 15.3 0.0 1.8 6.2 0.7
7.1 Workload By Users User activity is measured in the workload monitor. Only users of at least medium activity are counted as 'active users'.
Users Low Activity Medium Activity High Activity Total Users
dialog steps per week 1 to 399 400 to 4799 4800 or more

14
Users Low Activity Medium Activity High Activity Total Users
measured in system 38 29 9 76
7.2 Workload Distribution UKD The performance of your system was analyzed with respect to the workload distribution. We did not detect any major problems that could affect the performance of your SAP system.
7.2.1 Workload by Application Module
The following diagrams show how each application module contributes to the total system workload. Two workload aspects are shown: - CPU time: total CPU load on all servers in the system landscape - Database time: total database load generated by the application
All programs that are not classified in the SAP Application Hierarchy (transaction SE81) are summarized in the "Un-Assigned" category. Customer programs, industry solutions, and third-party add-on developments fall into this category.

15
7.2.2 DB Load Profile
The number of work processes creating database load in parallel is not significantly high.
The following diagram shows the DB load caused by dialog, RFC, HTTP(S), and background tasks, over different time frames.
The data provided in the diagram represents the average number of database processes occupied by each task type in the database during the specified time frames.
These statistics are calculated as a weekly average, the average values over six working days with a unit of one hour. Periods between 00:00-06:00 and 21:00-24:00 contain an average value per hour, as these are not core business hours.
You can enable 24-hour monitoring by implementing SAP Note 910897. With 24-hour monitoring, the time profile returns the workload of the system or application server on an hourly basis rather than returning an average value per hour for the periods 00:00–06:00 and 21:00–24:00.
By comparing the load profiles for dialog and background activity, you can get an overview of the volume of background activity during online working hours.

16
8 Performance Overview UKD
The performance of your system was analyzed with respect to average response times and total workload. We have detected some problems that may impair system performance. To ensure adequate performance in your core business transactions, you should take corrective action as soon as possible. For more information, please contact SAP Support.
Rating Check
Performance Evaluation
The following table shows the average response times for various task types:
Averages of Response Time Components in ms Task type
Dialog Steps
Response Time
CPU Time
Wait Time
Load Time
DB Time
GUI Time
DIALOG 43563 1,135.7 135.7 1.4 12.0 443.5 56.4 RFC 213408 9,117.4 113.1 2.0 0.2 2,976.2 0.0 UPDATE 2072 234.1 19.6 10.2 3.4 178.2 0.0 UPDATE2 809 130.9 9.3 0.2 0.9 110.0 0.0 BATCH 66109 13,831.0 636.8 6.2 4.0 12,621.7 0.0 SPOOL 30249 10.0 0.5 2.9 0.2 1.0 0.0 HTTP 72456 76.7 7.7 1.2 0.9 36.0 0.0
8.1 Performance Evaluation The measured times are compared against reference times to provide a rating.
17
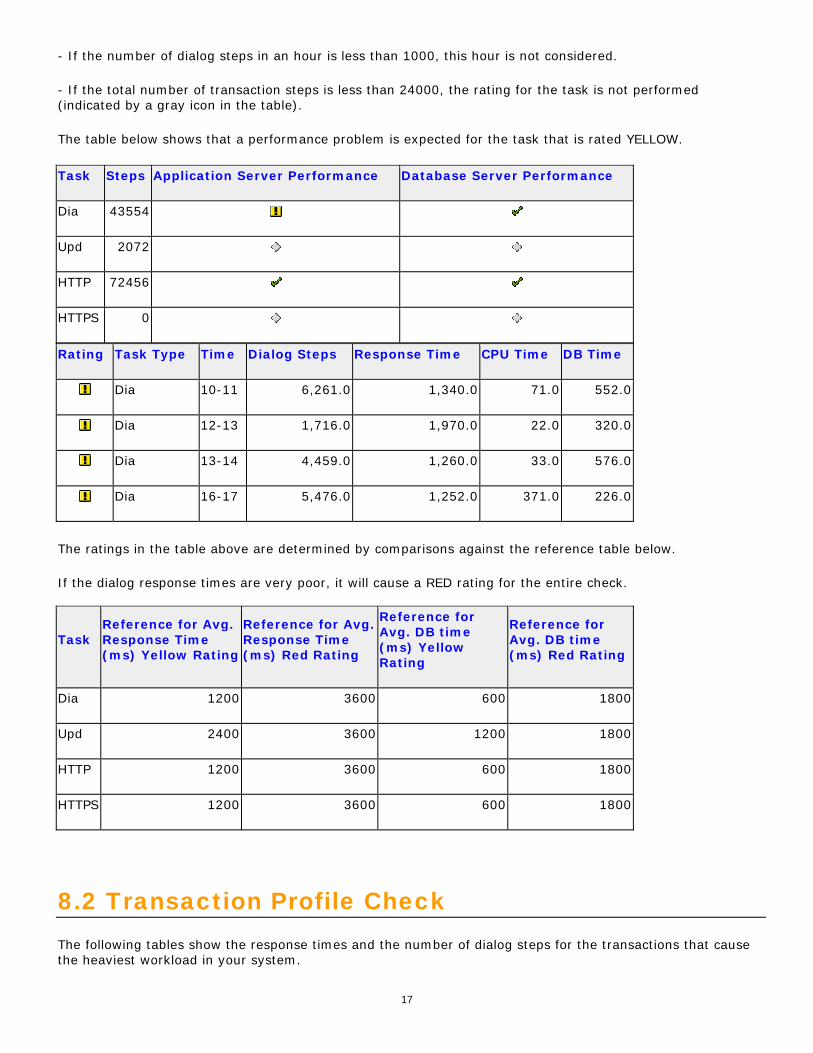
- If the number of dialog steps in an hour is less than 1000, this hour is not considered.
- If the total number of transaction steps is less than 24000, the rating for the task is not performed (indicated by a gray icon in the table).
The table below shows that a performance problem is expected for the task that is rated YELLOW.
Task Steps Application Server Performance Database Server Performance
Dia 43554
Upd 2072
HTTP 72456
HTTPS 0
Rating Task Type Time Dialog Steps Response Time CPU Time DB Time
Dia 10-11 6,261.0 1,340.0 71.0 552.0
Dia 12-13 1,716.0 1,970.0 22.0 320.0
Dia 13-14 4,459.0 1,260.0 33.0 576.0
Dia 16-17 5,476.0 1,252.0 371.0 226.0
The ratings in the table above are determined by comparisons against the reference table below.
If the dialog response times are very poor, it will cause a RED rating for the entire check.
Task Reference for Avg. Response Time (ms) Yellow Rating
Reference for Avg. Response Time (ms) Red Rating
Reference for Avg. DB time (ms) Yellow Rating
Reference for Avg. DB time (ms) Red Rating
Dia 1200 3600 600 1800
Upd 2400 3600 1200 1800
HTTP 1200 3600 600 1800
HTTPS 1200 3600 600 1800
8.2 Transaction Profile Check The following tables show the response times and the number of dialog steps for the transactions that cause the heaviest workload in your system.

18
8.2.1 Transactions by Total Workload
The following tables list the activities with the highest contribution to the total workload.
Workload by Transaction (Batch)
Transaction Dialog Steps
Total Resp. Time in %
Total Resp. Time in s
Total CPU Time in s
Total DB Time in s
RSAL_BATCH_TOOL_DISPATCHING 167 44.9 433,154.0 234.0 431,074.8 ZPM_ORDERSAVED_EVENTS 1008 18.0 173,261.0 7.0 173,194.6 RSDBAJOB 13 11.3 109,199.0 9,313.0 95,262.1 RHBAUS00 91 5.6 53,931.0 13,826.0 38,546.1 RM06ENP0 10 3.5 33,527.0 6,929.0 26,501.1 RPCALCU0_CE 1 2.5 23,664.0 3,131.0 20,092.1 /sapwork/bin/zdb2_rind 3 2.0 19,552.0 0.0 0.3 ZCM_BA_USHRCM_OUTBOUND 5 1.0 9,299.0 246.0 9,146.8 RSWWCOND 336 0.9 8,563.0 94.0 7,854.9 /BDL/TASK_SCHEDULER 168 0.8 7,594.0 2.0 26.2
21.0% of the total response time in the above table is caused by customer transactions.
8.2.2 Transactions by DB Load
The following transaction profiles list the transactions that have the greatest share in the database load, sorted by percentage of total database access times.
Database Load by Transactions (Batch)
Transaction Dialog Steps
Total DB Time in %
Total DB Time in s
RSAL_BATCH_TOOL_DISPATCHING 167 50.6 431,075.0 ZPM_ORDERSAVED_EVENTS 1008 20.3 173,195.0 RSDBAJOB 13 11.2 95,262.0 RHBAUS00 91 4.5 38,546.0 RM06ENP0 10 3.1 26,501.0 RPCALCU0_CE 1 2.4 20,092.0 ZCM_BA_USHRCM_OUTBOUND 5 1.1 9,147.0 RSWWCOND 336 0.9 7,855.0 RSAL_BATCH_TOOL_STARTUPDISP 11 0.6 5,122.0 RSWWERRE 504 0.5 3,851.0
21.4% of the total database time in the above table is caused by customer transactions.
8.3 RFC Load by Initiating Action The load in task type RFC is shown. In the workload monitor, this information is shown as 'Load from External Systems'. The calling system can be an application server of the system itself or any external system using the RFC interface. The 'Initial Action' is the calling program initiating the RFC. The total response time for each initial action is shown as an absolute value and as a percentage compared to the total RFC load considered in this table. The average times (per dialog step) are shown in milliseconds [ms].

19
Calls from external systems are shown if they account for at least 8h or 5% of the total RFC load. Local calls are shown if they account for at least 24h or 20% of the total RFC load.
Load Overview Initial System Load [s] Load % Local system UKD 3,663 17.13 Sum of external systems 17,721 82.87 RFC load (sum of above) 21,384 100.00 RFC load in Performance Overview 1,945,717 9,099.01 Load of all task types in Performance Overview 2,957,463 13,830.37
Top 20 RFC Calls From External Systems - Average Times [ms]
Initial System Initial Action
Total Resp. Time in s
% of RFC Load
Avg. Response Time
Avg. CPU Time
Avg. DB Time
Avg. Roll Wait Time
SMD EFWK RESOURCE MANAGER 11,871 55.51 1,271.5 216.4 717.7 7.3 R3P SAP_COLLECTOR_PERFMON_SWNCCOLL 3,087 14.44 936.9 282.9 368.7 1.3 R3P SAP_CCMS_MONI_BATCH_DP 864 4.04 712.9 6.3 13.1 0.6 R3P SAP_COLLECTOR_PERFMON_RSAMON40 275 1.29 545.8 2.7 2.4 0.3 SMP SAP_CCMS_MONI_BATCH_DP 268 1.25 538.0 4.9 3.5 0.2 R3P ZBA_AUDIT_PERF_STATS 241 1.13 716.1 304.6 2.3 0.4 SMX SAP_CCMS_CPH_MINCOLL 214 1.00 211.8 10.9 8.9 0.6 SMX SAPLSALC 201 0.94 185.8 11.2 11.6 0.4 SMX SAP_CCMS_CPH_QTRCOLL 140 0.65 897.7 44.0 31.7 0.2 R3P SAP_COLLECTOR_PERFMON_RSSTAT90 57 0.26 2,020.8 513.6 928.0 1.1 SMX SAP_CCMS_CPH_HRCOLL 50 0.24 801.3 21.6 17.4 0.3 R3P SWWDHEX 50 0.23 12,484.5 262.5 5,502.5 3.5 R3D SEU_INT 48 0.22 543.7 14.7 257.8 0.2 R3D SE24 45 0.21 304.0 4.7 31.5 0.4 SMP SMWP_BATCH 43 0.20 599.5 6.6 9.7 0.2 SMD SMWP_BATCH 41 0.19 541.4 6.8 7.5 0.2 R3P SAP_COLLECTOR_PERFMON_RSHOSTDB 40 0.19 118.1 16.7 35.4 1.5 SMD LANDSCAPE FETCH 25 0.12 712.1 17.1 70.3 0.2

20
Top 20 RFC Calls From External Systems - Average Times [ms]
Initial System Initial Action
Total Resp. Time in s
% of RFC Load
Avg. Response Time
Avg. CPU Time
Avg. DB Time
Avg. Roll Wait Time
R3P SAP_COLLECTOR_PERFMON_RSTUNE80 24 0.11 575.4 154.5 40.2 0.9 R3P SAP_COLLECTOR_PERFMON_RSSTATPH 22 0.10 515.0 19.8 241.3 1.1
9 SAP System Operating UKD
Your system was analyzed with respect to daily operation problems. We did not detect any major problems that could affect the operation of your SAP System.
9.1 Availability based on Collector Protocols
A value of 100% means that the collector was available all day. "Available" in the context of this report means that at least one SAP instance was running. If the SAP collector was not running correctly, the values in the table and graphics may be incorrect.
To check these logs, call transaction ST03N (expert mode) and choose "Collector and Performance DB -> Performance Monitor Collector -> Log".
This check is based on the logs for job COLLECTOR_FOR_PERFORMANCEMONITOR that runs every hour.
The job does NOT check availability; it carries out only general system tasks such as collecting and aggregating SAP performance data for all servers/instances. The log does not contain any direct information about availability; it contains only information about the status of the hourly statistical data collection.

21
As of SAP Basis 6.40, system availability information is available in the CCMS (Computing Center Management System) of an SAP System, in Service Level Reporting of SAP Solution Manager.
This function is provided by the relevant Solution Manager Support Packages as an advanced development. For more information, refer to SAP Note 944496, which also lists the prerequisites that must be fulfilled before implementation can take place."
9.2 Update Errors In a system running under normal conditions, only a small number of update errors should occur. To set the rating for this check, the number of active users is also taken into consideration.
We did not detect any problems.
9.3 Table Reorganization The largest tables and/or rapidly growing tables of system UKD were checked. No standard SAP recommendations for the applicable data volume management were found.
9.4 Transports Transports were not found in the period analyzed.
9.5 Program Errors (ABAP Dumps) 28 ABAP dumps have been recorded in your system in the period 04/13/2015 to 04/17/2015. ABAP dumps are generally deleted after 7 days by default. To view the ABAP dumps in your system, call transaction ST22 and choose Selection. Then select a timeframe.
Date Number of Dumps
04/13/2015 2
04/14/2015 6
04/15/2015 11
04/16/2015 3
04/17/2015 6
Name of Runtime Error Dumps Server (e.g.) User (e.g.) Date (e.g.)
Time (e.g.)
CALL_FUNCTION_PARM_MISSING 1 r3sbxa01_UKD_01 BFCOLL0 04/14/2015 11:45:48
SYNTAX_ERROR 2 R3SBXA02_UKD_02 R3P_FI_BATCH 04/14/2015 13:45:15
OBJECTS_OBJREF_NOT_ASSIGNED 1 r3sbxa01_UKD_01 LCAO2 04/15/2015 09:16:23

22
Name of Runtime Error Dumps Server (e.g.) User (e.g.) Date (e.g.)
Time (e.g.)
MESSAGE_TYPE_X 1 r3sbxa01_UKD_01 SEHENS1 04/15/2015 09:23:33
SYSTEM_CORE_DUMPED 1 r3sbx_UKD_00 LCAO2 04/15/2015 09:38:04
CALL_METHOD_CONFLICT_TYPE 1 r3sbx_UKD_00 NILAV2 04/15/2015 11:02:01
CONVT_NO_NUMBER 2 r3sbxa01_UKD_01 WUJF01 04/15/2015 11:15:38
ASSERTION_FAILED 2 r3sbxa01_UKD_01 TCO242 04/16/2015 17:38:14
RAISE_EXCEPTION 9 r3sbxa01_UKD_01 SSIZE0 04/17/2015 09:20:59
UNCAUGHT_EXCEPTION 4 r3sbxa01_UKD_01 T-MPW019 04/17/2015 13:45:44
CALL_FUNCTION_CONFLICT_TYPE 4 r3sbxa01_UKD_01 SSIZE0 04/17/2015 15:49:20
It is important that you monitor ABAP dumps using transaction ST22 on a regular basis. If ABAP dumps occur, you should determine the cause as soon as possible. Based on our analysis, we expect no serious problems at the moment.
10 Security
Critical security issues were found in your system. See the information in the following sections.
Rating Check
Default Passwords of Standard Users
Control of the Automatic Login User SAP*
Protection of Passwords in Database Connections
ABAP Password Policy
Gateway and Message Server Security
Users with Critical Authorizations

23
10.1 ABAP Stack of UKD
10.1.1 Default Passwords of Standard Users
Standard users have default passwords.
Recommendation: Run report RSUSR003 to check the usage of default passwords by standard users. Ensure that users SAP* (must exist in all clients), SAPCPIC, and EARLYWATCH have non-default passwords in all clients. For more information, see "Protecting Standard Users" either on SAP Help Portal or in the SAP NetWeaver AS ABAP Security Guide. Make sure that the standard password for user TMSADM has been changed in client 000, and delete this user in any other client. SAP Note 1414256 describes a support tool to change the password of user TMSADM in all systems of the transport domain. SAP Note 1552894 shows how to update the report RSUSR003 to show the status of user TMSADM.
10.1.2 ABAP Password Policy
If password login is allowed for specific instances only, the password policy is checked only for these instances.
10.1.3 Users with Critical Authorizations
For more information about the following check results, see SAP Note 863362.
Recommendation: Depending on your environment, review your authorization concept and use the Profile Generator (transaction PFCG) to correct roles and authorizations. You can use the User Information System (transaction SUIM) to check the results. For each check, you can review the roles or profiles that include the authorization objects listed in the corresponding section.
10.1.3.1 Super User Accounts
Users with authorization profile SAP_ALL have full access to the system. There should be a minimum of such users. The number of users with this authorization profile is stated for each client.
Client No. of Users Having This Authorization No. of Valid Users Rating
000 8 10
001 1 1
300 26 213752
Authorization profile: SAP_ALL
10.1.3.2 Users Authorized to Change or Display all Tables
24
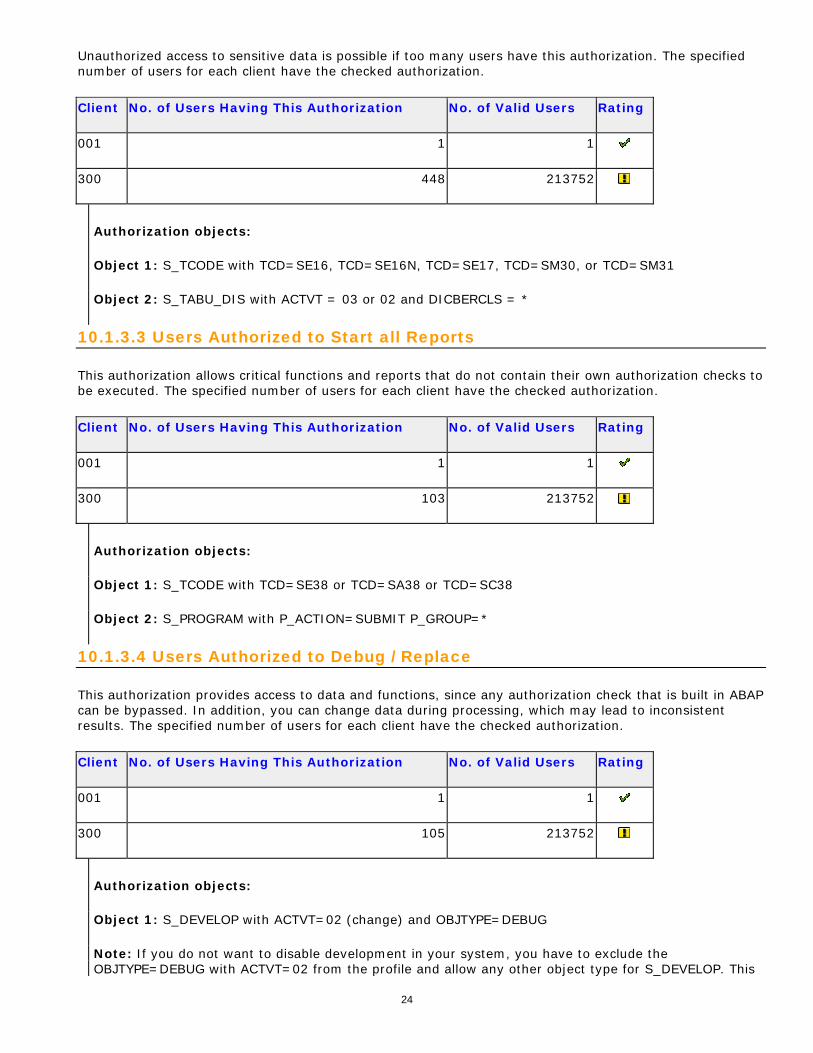
Unauthorized access to sensitive data is possible if too many users have this authorization. The specified number of users for each client have the checked authorization.
Client No. of Users Having This Authorization No. of Valid Users Rating
001 1 1
300 448 213752
Authorization objects:
Object 1: S_TCODE with TCD=SE16, TCD=SE16N, TCD=SE17, TCD=SM30, or TCD=SM31
Object 2: S_TABU_DIS with ACTVT = 03 or 02 and DICBERCLS = *
10.1.3.3 Users Authorized to Start all Reports
This authorization allows critical functions and reports that do not contain their own authorization checks to be executed. The specified number of users for each client have the checked authorization.
Client No. of Users Having This Authorization No. of Valid Users Rating
001 1 1
300 103 213752
Authorization objects:
Object 1: S_TCODE with TCD=SE38 or TCD=SA38 or TCD=SC38
Object 2: S_PROGRAM with P_ACTION=SUBMIT P_GROUP=*
10.1.3.4 Users Authorized to Debug / Replace
This authorization provides access to data and functions, since any authorization check that is built in ABAP can be bypassed. In addition, you can change data during processing, which may lead to inconsistent results. The specified number of users for each client have the checked authorization.
Client No. of Users Having This Authorization No. of Valid Users Rating
001 1 1
300 105 213752
Authorization objects:
Object 1: S_DEVELOP with ACTVT=02 (change) and OBJTYPE=DEBUG
Note: If you do not want to disable development in your system, you have to exclude the OBJTYPE=DEBUG with ACTVT=02 from the profile and allow any other object type for S_DEVELOP. This

25
means that development and debugging with visualization is still possible. You can achieve this by linking two authorizations to the object S_DEVELOP: one with all object types (except for "DEBUG") and all activities, and another for the object type DEBUG only and all activities (except for 02).
10.1.3.5 Users Authorized to Display Other Users Spool Request
This authorization allows unauthorized access to sensitive data contained in spool requests. The specified number of users for each client have the checked authorization.
Client No. of Users Having This Authorization No. of Valid Users Rating
001 1 1
300 110 213752
Authorization objects:
Object 1: S_TCODE with TCD = SP01 or SP01O
Object 2: S_ADMI_FCD with S_ADMI_FCD = SP01 or SP0R
Object 3: S_SPO_ACT with SPOACTION = BASE and DISP and SPOAUTH = * or __USER__
10.1.3.6 Users Authorized to Administer RFC Connections
If too many users have this authorization, two problems can occur: - Unauthorized access to other systems - Malfunction of interfaces if invalid connection data is entered
The specified number of users for each client have the checked authorization.
Client No. of Users Having This Authorization No. of Valid Users Rating
001 1 1
300 85 213752
Authorization objects:
Object 1: S_TCODE with TCD=SM59
Object 2: S_ADMI_FCD with S_ADMI_FCD = NADM
Object 3: S_RFC_ADM with ACTVT NE 03
11 Software Change and Transport Management of UKD

26
Software change management issues were found in your system. See the information in the following sections.
11.1 SAP Netweaver Application Server ABAP of UKD
Rating Check Performed
Number of Changes
11.1.1 Number of Changes
Performing changes is an important cost driver for the IT department. It is only acceptable to make a large number of software and configuration changes in exceptional situations, such as during go-live for an implementation project.
No data from the managed system could be found in the configuration and change database (CCDB). Check whether the diagnostics setup for the managed system has been performed as described in SAP Note 1472465. Solution Manager Diagnostics provides valuable features for root cause analysis and is an important data source for various support services. The CCDB data is required here to check the configuration of the managed system.
12 Data Volume Management (DVM)
A statement regarding Data Volume Management on your system UKD could not be provided.
This report does not have a Data Volume Management (DVM) section because your SAP Solution Manager system does not fulfill the technical requirements, or the ST-A/PI release on your system UKD is too low (or could not be identified). For more information, see SAP Note 2036442. As a workaround, an attempt was made to check the database size and growth per year for your system UKD. However, the database size or growth per year could not be collected. As a consequence, a statement regarding Data Volume Management in your system UKD could not be provided.

27
13 Database Performance
In the checks performed, problems regarding the performance of your database were found.
Rating Check
Database Version
Locking
Average Read and Write Times
Missing Indexes
13.1 Database Version UKD
SID Database Version Fix Pack level Build Level DBSL Patch
UKD DB2 for Linux UNIX and Windows 9.7 8 s130316 220
For the latest database versions and Fix Packs, see also SAP Note 101809. For more information about known errors in DB2 Fix Packs, see SAP Note 1346902.
SID Database Start Date [yyyy/mm/dd]
Database Up Time [Days]
Download Collection Date [yyyy/mm/dd]
UKD 2015/04/07 14 2015/04/20
13.1.1 Average Read and Write Times for Tablespaces
Tablespace Partition
Avg. Read Time [ms]
Read Time Threshold [ms]
Avg. Write Time [ms]
Write Time Threshold [ms]
% of Total Reads
R3P#BTABI 0 10.68 10.00 0.30 5.00 54.71
We have checked active tablespaces for poor performance. Tablespaces with long read or write times were detected. This may be due to a non-optimal storage layout.
28
Note: To avoid unrealistic figures and to ensure that only active tablespaces are checked, the analysis is restricted to 95% of the total workload. The remaining tablespaces are considered inactive.
Recommendation: For optimal I/O performance, ensure the following: - Each tablespace should consist of several containers, distributed over your SAP data directories in a round-robin fashion. - DB2_PARALLEL_IO is enabled only for tablespaces with one container per RAID device or stripe set. - Individual containers are not too large. Avoid too many levels of striping. - All containers for one DB2 stripe set are the same size. If some containers are smaller, parallel prefetching may not be optimal. - If the operating system and file system type allow direct (DIO) or concurrent (CIO) I/O, deactivate file system caching at database level (see tablespace snapshot) to avoid double buffering. System caching should only be active for dedicated tablespaces used to store LONG/LOB data only. For more information, see the document "Creating table spaces without file system caching" in the IBM Information Center.
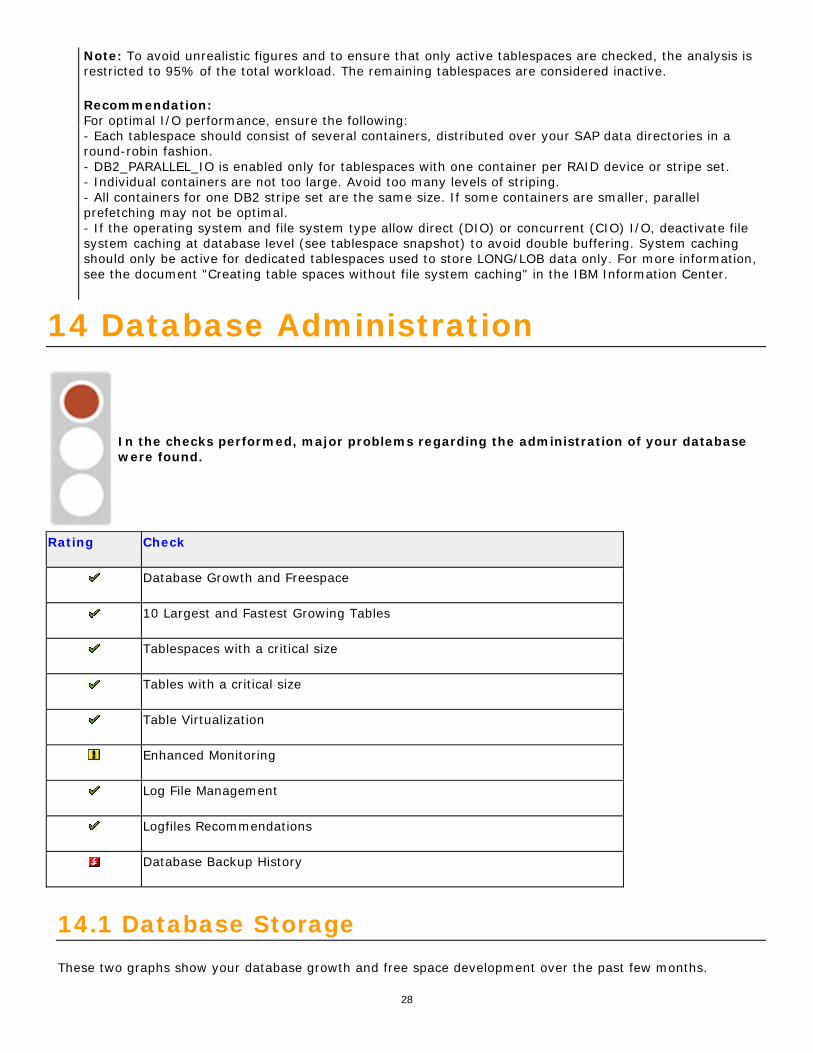
14 Database Administration
In the checks performed, major problems regarding the administration of your database were found.
Rating Check
Database Growth and Freespace
10 Largest and Fastest Growing Tables
Tablespaces with a critical size
Tables with a critical size
Table Virtualization
Enhanced Monitoring
Log File Management
Logfiles Recommendations
Database Backup History
14.1 Database Storage These two graphs show your database growth and free space development over the past few months.

29
Note: If limited history is displayed (for example 1 or 2 months), it is most likely due to the setting of the DCF collector 'Tablespaces (Storage)' in DBACOCKPIT. Go to transaction DBACOCKPIT -> Configuration -> Data Collection Framework using the Webdynpro. Check the retention ('Days Kept in History' column). The default is 90 days but you can increase this value to a longer timeframe.
The following table displays the current size and the monthly growth of your database in GB.
Date Current Size (GB) Monthly Growth (GB)
02/01/2015 2,868.77 0.00
03/01/2015 2,869.39 0.62
04/01/2015 2,870.51 1.12
14.2 10 Largest and Fastest Growing Tables The following tables displays the 10 largest and fastest growing tables stored in the database.

30
Table Name Tablespace Size (GB)
ZCAFLATTABLCHAS R3P#USER1D 186.36
CDCLS R3P#CLUD 145.15
GMIA R3P#ZGMIAD 144.27
PPOIX R3P#BTABD 111.78
CDHDR R3P#BTABD 109.94
ZZSPLITA R3P#ZTABD 105.73
PCL2 R3P#BTABD 90.91
SOFFCONT1 R3P#BTABD 90.28
DFKKOPBW R3P#BTABD 73.76
ARFCSDATA R3P#BTABD 71.13
Name Tablespace Monthly Growth (GB)
INDX R3P#BTABD 0.00
BALDAT R3P#BTABD 0.00
DDPRS R3P#DDICD 0.00
/1CADMC/00000665 R3P#ZDBTABLOGD 0.00
/1CADMC/00000664 R3P#ZDBTABLOGD 0.00
/1CADMC/00000663 R3P#ZDBTABLOGD 0.00
/1CADMC/00000662 R3P#ZDBTABLOGD 0.00
/1CADMC/00000661 R3P#ZDBTABLOGD 0.00
/1CADMC/00000660 R3P#ZDBTABLOGD 0.00
/1CADMC/00000659 R3P#ZDBTABLOGD 0.00
14.3 Data Collection Framework As of SAP_BASIS 7.02 and DB2 V9.5, a new infrastructure is used to manage the history of data. This infrastructure is called the data collection framework (DCF). The DCF collects the data independently of the SAP system. The history data for the database objects (tables and indexes) is collected with this DCF infrastructure. The default retention of the DCF collector that stores tablespace details is currently set to 14 days, as opposed

31
to several weeks with the older method. This DCF collector is used to monitor the database size and growth in remote services such as SAP EarlyWatch Alert. Limited reporting of such data is therefore available with the default settings. Recommendation: To overcome this, we recommend that you change the default setting of the DCF collector 'Tablespaces (Storage)' (or 'Tablespaces' depending on your SAP_BASIS release) from 14 days to at least 90 days for 'Days Kept in History'. Note that the additional space impact for longer history is low. We also recommend that you use at least the 'SAP Default' template when configuring the DCF collectors.
14.4 Tablespaces with a critical Size No DMS tablespaces were found for which the 'Used Size' or 'Total Size' is critical.
Note: Make sure the relevant file systems are large enough to allow further tablespace growth.
14.5 Tables with a critical size Your system was checked for tables that have reached their size limits. No tables were critical. For technical reasons (expensive operation to check all tables in the system), we could not check whether all tables are already enabled for 'Large RIDs'.
Background: For tables that are not enabled for 'Large RIDs', the size restrictions of DB2 V8 64, 128, 256, or 512 GB still apply (depending on whether they are stored in tablespaces of page size 4, 8, 16, or 32 KB). This is the case even if the tablespaces have been converted to type 'Large'. Even if such tables are far smaller than the old size limits, they could still be affected. Once all pages below the old size limit are occupied by tables enabled for 'Large RIDs', even small tables that are not enabled for 'Large RIDs' cannot grow any further, leading to SQL errors, or even to unplanned downtime.
Recommendation: Convert ALL DMS tablespaces to type 'Large' (if not already done) and enable ALL tables for 'Large RIDs' as soon as possible, to benefit from the increased table and tablespace size limits. This is especially important for tablespaces that only contain a single table and are close to the former V8 size limit. Such tables require at least a reorganization of their indexes before they can grow beyond the V8 size limit.
To check whether a tablespace has been converted to type 'Large', use the following command: SELECT tbspace FROM syscat.tablespaces WHERE datatype = 'L'
To convert a tablespace to type 'Large', use the following command: db2 alter tablespace <tablespace> convert to large It is not necessary to convert SYSCATSPACE to large.
With the following SQL statement, you can count the number of tables that are not yet enabled for 'Large RIDs': select large_rids, count(*) as number from sysibmadm.admintabinfo where tabschema not like 'SYSIBM%' group by large_rids
To ease the task of converting tablespaces to type 'large' and reorganizing tables/indexes, SAP has developed the tool 'Large RID Tool'. It can be found as an attachment to SAP Note 1108956. The PDF document that is also attached describes the use in detail and offers the possibility to reorganize tables/indexes via a convenient front end. See the following article in SDN, which describes the tool in more detail: http://scn.sap.com/people/johannes.heinrich/blog/2007/11/14/new-tool-for-activation-of-large-record-identifiers-in-db2-9-for-linux-unix-and-windows

32
14.6 Enhanced Monitoring Settings
Parameters Description Current Value Recommendation
MON_LOCKWAIT Monitoring lock wait configuration parameter WITHOUT_HIST NONE
MON_LW_THRESH Monitoring lock wait threshold configuration parameter 300000000 5000000
At least one of the parameters listed above is not set according to our standard recommendations.
Recommendation: Adjust the parameters to the recommended settings.
Background: If you are using the new time-spent metrics introduced in DB2 V9.7, you first need to ensure that the new in-memory metrics are activated in the database configuration. These are activated by default for new databases created on DB2 >= V9.7 but deactivated for migrated databases.
Once these are activated, the new metrics (including time spent) are collected within DB2 memory and can be accessed in any number of ways. You can look at the current in-memory values using one of the new table functions (that is, look for the ones with the prefix MON_GET_*) for any connection, unit of work, and so on, or from the package cache. You can also collect data for a specific execution using the activity event monitor (introduced in DB2 V9.5) for a specific unit of work using the new UOW event monitor, and so on. This data is also used in SAP Solution Manager 7.1 and DBACOCKPIT.
14.7 Log File Management The DB2 database is running in log retention mode as recommended. Ensure that all log files are archived starting from the last complete backup to allow any kind of recovery.
14.8 Logfiles Recommendations Database Logging Information (Since Database Start) Parameter / KPI Current Setting / Value logfilsiz (MB) 256 logprimary 20 logsecond 40 Total Log Space Available To Database (MB) 14857 Maximum Log Space Used in (MB) 2033 Maximum Secondary Log Space Used in (MB) 0 Maximum Number of Secondary Log Files Used 0
The "log_dir" directory should have at least enough space to hold all the primary and secondary log files. As a safety margin, twice this size is recommended. The "log_archive" directory should be large enough to store all the log files from three workdays.

33
14.9 Database Backup History
Timestamp Partition Return Code Granularity Type Weekday Weekindex
12.04.2015 at 23:18:42 0 0 Database Online Sunday 2
07.04.2015 at 23:22:02 0 0 Database Online Tuesday 2
05.04.2015 at 23:18:25 0 1224- Database Online Sunday 1
Week Date Log text
2 12.04.2015 The last successful backup on 12.04.2015 has occured (more than) 7 days before the download date 20.04.2015
Some serious database backup problems were detected that may endanger any possible database recovery.
Recommendation: As these backup problems can lead to data loss (if backups cannot be restored) and/or increased recovery times, you must analyze and fix the underlying root cause(s) as soon as possible. If the backup problems persist, open a customer message on component BC-DB-DB6.
14.10 Further Recommendations Administration of db2diag.log The DB2 diagnostic file db2diag.log contains diagnostic records about administrative events and specific error information about problems encountered within DB2. Once created, the db2diag.log file grows continually. To avoid long access times via transaction DBACOCKPIT, we recommend that you keep the size of the file reasonably small. Use the command "dbdiag -A" to create a new db2diag.log file on a regular basis. Alternatively, rename the file at OS level. A new db2diag.log file will then be created automatically by the DB2 database manager. As of DB2 V9.7, a series of 10 rotating diagnostic log and 10 administration notification log files can be used by setting the DBM CFG parameter DIAGSIZE. Its value determines the combined, overall size of the database diagnostic and administration notification log files. In this way, these log files can be used in a rotating order with a fixed maximum size. As of SAP Basis Release 7.02, the Web dynpro-based DBA Cockpit offers a "Weekly Switch" of the database diagnostic log as an alternative way of archiving the db2diag.log under a new name (similar to using db2diag –A). You can access this option from the menu by choosing "Configuration-> Monitoring Settings". For more information, see the IBM DB2 Information Center and the guide "Database Administration Using the DBA Cockpit: IBM DB2 for LUW", which is available on SAP Service Marketplace at https://service.sap.com/instguides -> SAP NetWeaver -> SAP NetWeaver<release> -> Operations -> Database-Specific Guides.
Supported DB2 versions and Fix Packs SAP Note 101809 contains a complete list of supported DB2 versions and Fix Packs. Check this SAP Note at regular intervals for the latest available DB2 Fix Pack and also to verify that your Fix Pack is still supported.
Also see the following important SAP Notes for DB2:

34
SAP Note Number Description
101809 DB6: Supported Fix Packs for DB2 UDB for UNIX and Windows
975352 DB6: Configuring DB2 Auto Reorg for space reclaim and index cleanup
1168456 DB6: End-of-Support Dates
1309424 DB6: DBA Cockpit Correction Collection SAP Basis 7.01 / 7.11
1314750 DB6: DBA Cockpit Correction Collection SAP Basis 7.00 / 7.10
1329179 DB6: DB2 V9.7 Standard Parameter Settings
1346902 DB6: Known Errors and available Fixes in DB2 9.7 for LUW
1351160 DB6: Using DB2 9.7 with SAP Software
1425488 DB6: Performance problems with volatile tables
1456402 DB6: DBA Cockpit Correction Collection SAP Basis 7.02/7.30/7.31
1499214 DB6: Database Administration - Learning Offerings
1630506 DB6: History management of monitoring data
1837312 DB6: Upgrade to Version 10.5 of DB2 for LUW
1929142 DB6: DROP INDEX may result in database marked as bad
1942183 DB6: When to consider a table or index reorganization
15 Database server load from expensive SQL statements - UKD
The SQL statements that we have identified cause a significant load on the database server. This results in performance problems, not only for the transactions that execute these statements but also for other users.
Database Load From Expensive Statements Rating Total Execution Time[%]

35
Database Load From Expensive Statements Rating Total Execution Time[%]
83.52
The table above shows the cumulative amount of problematic statements identified. If the database was inactive for more than one day before the analysis was performed, the information provided may not be entirely accurate.
Note: The overall section rating is linked to the above table rating; the ratings are described in SAP Note 1625795. If the table rating is RED, there are SQL statements that cause a high percentage of the overall load on your SAP system. If the table rating is YELLOW, there are SQL statements that cause a considerable percentage of the overall load on your SAP system. If the table rating is GREEN, your system SQL statement cache contains no significant problems. If the table rating is UNRATED, the analysis of your system's SQL statement cache found that the total SQL statements were <= 1,000,000, or statements per day were below 500,000 or some analysis data was unavailable for evaluation.
The following table lists the load of each SQL statement individually. The load of the statement is evaluated against the total load since database startup.
Note: If an object name in this table contains the character "/", it may indicate a join. If an object is not in the ABAP Dictionary (transaction SE12) with the object name listed, check for each part of the join (items separated by "/").
15.1 Analysis of DB SQL CACHE on 04/20/2015 at 04:27 Expensive SQL Statements Overview
Object Name
Total Execution Time[%]
Avg. Execution Time[ms]
Executions Rows Read[%]
Rows Returned [%]
Rows Written[%]
Sort Overflows
TRFCQOUT 28.59 173,645.01 3328 0.00 0.00 0.00 0 BDCP2 19.80 165,143.97 2423 0.00 0.00 0.00 0 AUFK 14.97 162,626.83 1860 41.31 0.00 0.00 0 ARFCSSTATE 9.41 754,983.35 252 0.03 0.22 0.00 0 EDIDC 8.26 68,897.84 2424 0.00 0.00 0.00 0 EDIDC 2.49 30,976.15 1627 0.00 0.00 0.00 0
15.1.1 Access on TRFCQOUT
Statement Data:
Cache Statistics
Total Executions
Total Execution Time[ms]
Avg. Execution Time[ms]
Rows Read
Rows Written
Rows Returned
Total User CPU Time[ms]
Total Logical Reads
Sort Overflows
3328 577890603 173,645.01 209 0 23268 1114340 70111950 0

36
Access Plan:
-----------
Total Cost: 481291
Query Degree: 1
Cumulative Total Cost: 481291
Cumulative CPU Cost: 7.00766e+09
Cumulative I/O Cost: 122040
Cumulative Re-Total Cost: 3249.43
Cumulative Re-CPU Cost: 6.25397e+09
Cumulative Re-I/O Cost: 0
Cumulative First Row Cost: 3717.88
Estimated Bufferpool Buffers: 122041
Rows
RETURN
( 1)
Cost
I/O
|
133
GRPBY
( 2)
481291
122040
|
3.17295e+06
IXSCAN
( 3)
480879
122040

37
|
3.17295e+06
INDEX: SAPR3P
TRFCQOUT~1
Q1
Program Data:
Origin of ABAP coding Program Name Line Created By Last Changed By Last Changed On /SDF/LIS_ABAPF01 00000523 SAP SAP 08/13/2012
000523 SELECT mandt qname dest COUNT( * ) MIN( qcount ) 000524 FROM trfcqout CLIENT SPECIFIED 000525 APPENDING TABLE pt_queues 000526 WHERE mandt = gs_f80_clients-mandt 000527 GROUP by mandt qname dest.
15.1.2 Access on BDCP2
Statement Data:
Cache Statistics
Total Executions
Total Execution Time[ms]
Avg. Execution Time[ms]
Rows Read
Rows Written
Rows Returned
Total User CPU Time[ms]
Total Logical Reads
Sort Overflows
2423 400143849 165,143.97 223 0 2422 842777 57521639 0
Access Plan:
-----------
Total Cost: 1.27868e+06
Query Degree: 1
Cumulative Total Cost: 1.27868e+06
Cumulative CPU Cost: 9.34691e+09
Cumulative I/O Cost: 132031
Cumulative Re-Total Cost: 4305.48
Cumulative Re-CPU Cost: 8.28649e+09
Cumulative Re-I/O Cost: 0

38
Cumulative First Row Cost: 1.27868e+06
Estimated Bufferpool Buffers: 132032
Rows
RETURN
( 1)
Cost
I/O
|
1
GRPBY
( 2)
1.27868e+06
132031
|
1.80848e+06
IXSCAN
( 3)
1.27844e+06
132031
|
3.61696e+06
INDEX: SAPR3P
BDCP2~001
Q1
Program Data:
Origin of ABAP coding Program Name Line Created By Last Changed By Last Changed On RBDMONI_CCMS_IDOC 00000577 SAP SAP 01/25/2006

39
000576 * umgestellt auf BDCP2 000577 SELECT COUNT(*) FROM bdcp2 CLIENT SPECIFIED INTO val_bdcp2 000578 WHERE mestype IN mestyp AND process EQ ' ' 000579 AND mandt EQ mandt.
15.1.3 Access on AUFK
Statement Data:
Cache Statistics
Total Executions
Total Execution Time[ms]
Avg. Execution Time[ms]
Rows Read Rows Written
Rows Returned
Total User CPU Time[ms]
Total Logical Reads
Sort Overflows
1860 302485912 162,626.83 2651100817 0 6 2697597 2728581203 0
Access Plan:
-----------
Total Cost: 142003
Query Degree: 1
Cumulative Total Cost: 142003
Cumulative CPU Cost: 1.24292e+09
Cumulative I/O Cost: 13266.5
Cumulative Re-Total Cost: 588.164
Cumulative Re-CPU Cost: 1.132e+09
Cumulative Re-I/O Cost: 0
Cumulative First Row Cost: 85.8411
Estimated Bufferpool Buffers: 13030.7
Rows
RETURN
( 1)
Cost
I/O
|
12174.9
FETCH

40
( 2)
142003
13266.5
/---+----\
163928 1.47535e+06
IXSCAN TABLE: SAPR3P
( 3) AUFK
1708.02 Q1
364.932
|
1.47535e+06
INDEX: SAPR3P
AUFK~B
Q1
Program Data:
Origin of ABAP coding
Program Name Line Created By
Last Changed By
Last Changed On
ZPM_ORDERSAVED_EVENTS 00000053 GFSLAY2 SEHENS1 09/24/2013
000052 000053 SELECT mandt aufnr FROM aufk INTO TABLE gt_ordersaved 000054 WHERE autyp = '30' 000055 AND werks = 'UK10' 000056 AND aenam <> 'BAT-PM' 000057 AND ( ( ( erdat = gd_date AND erfzeit > gd_time ) 000058 OR ( erdat > gd_date ) ) 000059 OR ( ( aedat = gd_date AND aezeit > gd_time ) 000060 OR ( aedat > gd_date ) ) ).
15.1.4 Access on ARFCSSTATE
Statement Data:
Cache Statistics
Total Executions
Total Execution Time[ms]
Avg. Execution Time[ms]
Rows Read
Rows Written
Rows Returned
Total User CPU Time[ms]
Total Logical Reads
Sort Overflows
252 190255805 754,983.35 1855044 0 1854974 353108 15083532 0

41
Access Plan:
-----------
Total Cost: 537547
Query Degree: 1
Cumulative Total Cost: 537547
Cumulative CPU Cost: 8.976e+09
Cumulative I/O Cost: 136121
Cumulative Re-Total Cost: 4226.93
Cumulative Re-CPU Cost: 8.13531e+09
Cumulative Re-I/O Cost: 0
Cumulative First Row Cost: 100.104
Estimated Bufferpool Buffers: 136122
Rows
RETURN
( 1)
Cost
I/O
|
1.55195e+06
FETCH
( 2)
537547
136121
/----+-----\
1.55195e+06 3.10389e+06
IXSCAN TABLE: SAPR3P
( 3) ARFCSSTATE
172452 Q1

42
43112
|
3.10389e+06
INDEX: SAPR3P
ARFCSSTATE~05
Q1
Program Data:
Origin of ABAP coding Program Name Line Created By Last Changed By Last Changed On /SDF/LIS_ABAPU15 00000119 SAP SAP 08/13/2012
000116 000117 000118 *Taken from SM58 000119 select * from arfcsstate 000120 into table arfcistate 000121 where arfcreturn = space. "#EC CI_NOFIRST
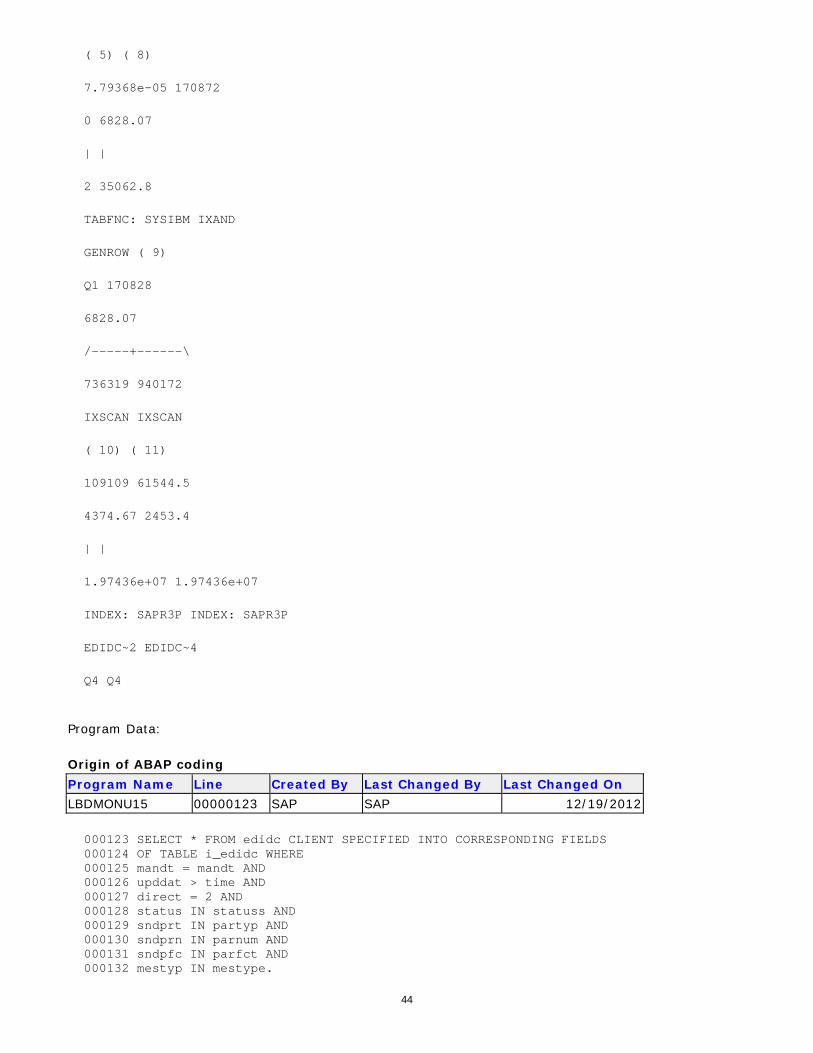
15.1.5 Access on EDIDC
Statement Data:
Cache Statistics
Total Executions
Total Execution Time[ms]
Avg. Execution Time[ms]
Rows Read
Rows Written
Rows Returned
Total User CPU Time[ms]
Total Logical Reads
Sort Overflows
2424 167008365 68,897.84 2891 0 2674 991605 11069532 0
Access Plan:
-----------
Total Cost: 501845
Query Degree: 1
Cumulative Total Cost: 501845
Cumulative CPU Cost: 6.93408e+09
Cumulative I/O Cost: 22234.4
Cumulative Re-Total Cost: 3506.11
Cumulative Re-CPU Cost: 6.74799e+09

43
Cumulative Re-I/O Cost: 0
Cumulative First Row Cost: 170897
Estimated Bufferpool Buffers: 15406.3
Rows
RETURN
( 1)
Cost
I/O
|
35062.8
NLJOIN
( 2)
501845
22234.4
/------+-------\
2 17531.4
TBSCAN FETCH
( 3) ( 6)
0.00371707 174441
0 7703.16
| /---+----\
2 35062.8 1.97436e+07
SORT RIDSCN TABLE: SAPR3P
( 4) ( 7) EDIDC
0.00265868 170872 Q4
0 6828.07
| |
2 35062.8
TBSCAN SORT
44
( 5) ( 8)
7.79368e-05 170872
0 6828.07
| |
2 35062.8
TABFNC: SYSIBM IXAND
GENROW ( 9)
Q1 170828
6828.07
/-----+------\
736319 940172
IXSCAN IXSCAN
( 10) ( 11)
109109 61544.5
4374.67 2453.4
| |
1.97436e+07 1.97436e+07
INDEX: SAPR3P INDEX: SAPR3P
EDIDC~2 EDIDC~4
Q4 Q4
Program Data:
Origin of ABAP coding Program Name Line Created By Last Changed By Last Changed On LBDMONU15 00000123 SAP SAP 12/19/2012
000123 SELECT * FROM edidc CLIENT SPECIFIED INTO CORRESPONDING FIELDS 000124 OF TABLE i_edidc WHERE 000125 mandt = mandt AND 000126 upddat > time AND 000127 direct = 2 AND 000128 status IN statuss AND 000129 sndprt IN partyp AND 000130 sndprn IN parnum AND 000131 sndpfc IN parfct AND 000132 mestyp IN mestype.

45
15.1.6 Access on EDIDC
Statement Data:
Cache Statistics
Total Executions
Total Execution Time[ms]
Avg. Execution Time[ms]
Rows Read
Rows Written
Rows Returned
Total User CPU Time[ms]
Total Logical Reads
Sort Overflows
1627 50398195 30,976.15 2197 0 2111 196705 3035897 0
Access Plan:
-----------
Total Cost: 1.16363e+06
Query Degree: 1
Cumulative Total Cost: 1.16363e+06
Cumulative CPU Cost: 3.40243e+10
Cumulative I/O Cost: 51139
Cumulative Re-Total Cost: 17530.6
Cumulative Re-CPU Cost: 3.374e+10
Cumulative Re-I/O Cost: 0
Cumulative First Row Cost: 170897
Estimated Bufferpool Buffers: 44311
Rows
RETURN
( 1)
Cost
I/O
|
175314
NLJOIN
( 2)
1.16363e+06

46
51139
/------+-------\
10 17531.4
TBSCAN FETCH
( 3) ( 6)
0.0103566 174441
0 7703.16
| /---+----\
10 35062.8 1.97436e+07
SORT RIDSCN TABLE: SAPR3P
( 4) ( 7) EDIDC
0.00825907 170872 Q4
0 6828.07
| |
10 35062.8
TBSCAN SORT
( 5) ( 8)
0.000202636 170872
0 6828.07
| |
10 35062.8
TABFNC: SYSIBM IXAND
GENROW ( 9)
Q1 170828
6828.07
/-----+------\
736319 940172
IXSCAN IXSCAN
( 10) ( 11)

47
109109 61544.5
4374.67 2453.4
| |
1.97436e+07 1.97436e+07
INDEX: SAPR3P INDEX: SAPR3P
EDIDC~2 EDIDC~4
Q4 Q4
Program Data:
Origin of ABAP coding Program Name Line Created By Last Changed By Last Changed On LBDMONU15 00000096 SAP SAP 12/19/2012
000096 SELECT * FROM edidc CLIENT SPECIFIED INTO CORRESPONDING FIELDS 000097 OF TABLE i_edidc WHERE 000098 mandt = mandt AND 000099 upddat > time AND 000100 direct = 1 AND 000101 status IN statuss AND 000102 rcvprt IN partyp AND 000103 rcvprn IN parnum AND 000104 rcvpfc IN parfct AND 000105 mestyp IN mestypa.
16 Trend Analysis This section contains the trend analysis for key performance indicators (KPIs). Diagrams are built weekly once the EarlyWatch Alert service is activated.
In this report, historical data for "Transaction Activity", "System Performance", and "Database Performance" is taken directly from workload monitor ST03, because EarlyWatch Alert data has been accumulated for less than 20 sessions.
In this section, a "week" is from Monday to Sunday. The date displayed is the Sunday of the week.
16.1 System Activity The following diagrams show the system activity over time.
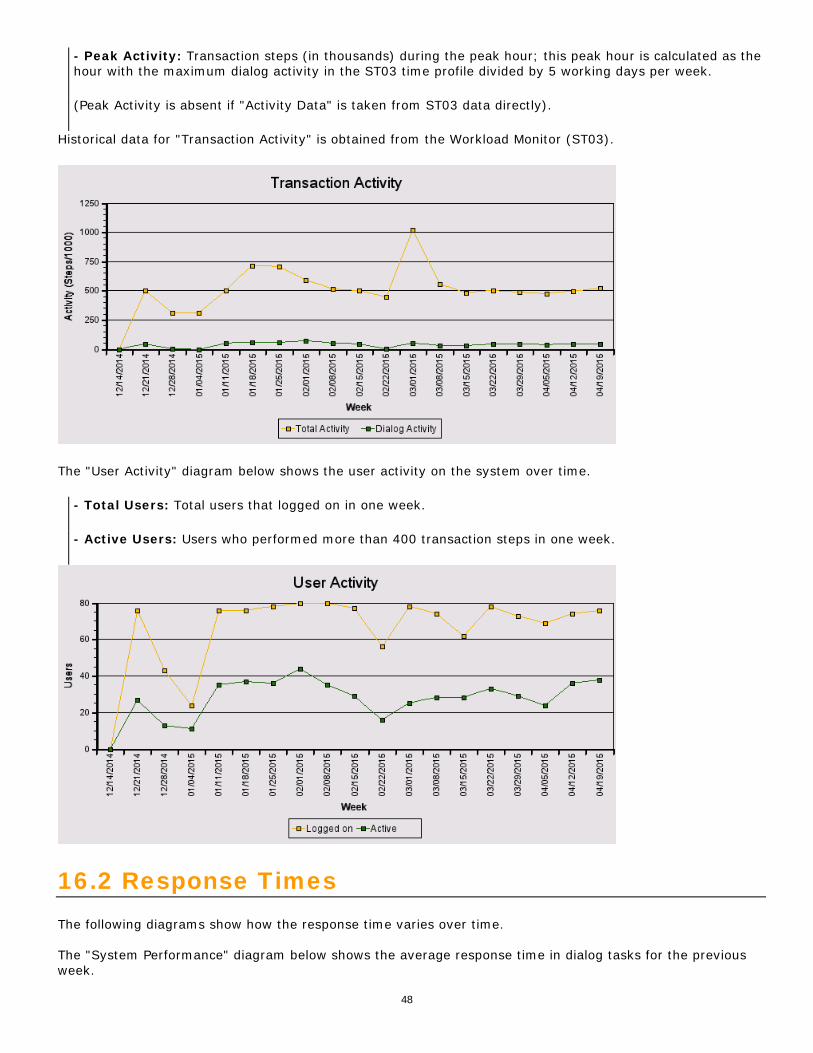
The "Transaction Activity" diagram below depicts transaction activity in the system over time.
- Total Activity: Transaction steps performed each week (in thousands)
- Dialog Activity: Transaction steps performed in dialog task each week (in thousands)
48
- Peak Activity: Transaction steps (in thousands) during the peak hour; this peak hour is calculated as the hour with the maximum dialog activity in the ST03 time profile divided by 5 working days per week.
(Peak Activity is absent if "Activity Data" is taken from ST03 data directly).
Historical data for "Transaction Activity" is obtained from the Workload Monitor (ST03).
The "User Activity" diagram below shows the user activity on the system over time.
- Total Users: Total users that logged on in one week.
- Active Users: Users who performed more than 400 transaction steps in one week.
16.2 Response Times The following diagrams show how the response time varies over time. The "System Performance" diagram below shows the average response time in dialog tasks for the previous week.

49
Historical data for "System Performance" is obtained from the Workload Monitor (ST03).
The "Database Performance" diagram below shows the average DB response time in dialog tasks.
The "Top 5 transactions" diagram below shows the average response time in dialog tasks for the top 5 transactions.

50
The "Transaction Code" table below shows the load percentage caused by the top 5 transactions.
Transaction Code Load (%)
PIQCOH00 17.0
SE37 12.6
{_ADVISOR_CONFIG_GAF 8.0
ZGM_PRINT_FORMS 5.5
MEMASSCONTRACT 4.4

51
16.3 Application profile In the following, we analyzed the trend within the following time frames:
Short term: From calendar week 12/2015 to 15/2015
Long term: From calendar week 04/2015 to 15/2015
The table below shows the time profile of the top applications by total workload during the analyzed period.
Top Applications by Response Time
Task Type Application
Total Resp. Time in s
% of Total Load
Avg. Resp. Time in ms
Long Term Growth (%/year)
Short Term Growth (%/year)
Avg. DB Time in ms
Avg. CPU Time in ms
Dialog SPAM 158613 16 1248919 18.0- 18.0- 14116 477 Dialog ZMM_PRA_RPT 64273 6 95645 502.7- 10.4- 87035 250 Dialog ZCM_CHICKERING_IMPOR 57737 6 384911 104.5- 390.0- 380435 3400 Dialog SESSION_MANAGER 54957 6 2664 34.0- 1,980.1- 401 144 Dialog SAPMSEU0 45418 5 747 70.4- 140.1- 180 59 Dialog ZPYR_SALARY_CAP 41181 4 17517 461.1- 754.7- 9543 1215 Dialog PIQST10 33527 3 3197 214.4 1,573.4- 1177 75 Dialog YMM_MNGD_FRIGHT_COST 29722 3 6582 210.6- 194.9- 532 158 Dialog SE37 29329 3 683 303.8 1,558.3 247 37 Dialog PQ_FEE_CALC 22532 2 67462 0.0 0.0 9985 12622 Dialog SE16N 22434 2 1879 105.4- 170.5 1722 58 Dialog RS_TESTFRAME_CALL 19695 2 2427 147.5 2,010.0- 243 39 Dialog ZMM_MATERIAL_DOC_LIS 15852 2 23874 2,995.9- 2,995.9- 11689 1749 Dialog SWI2_DURA 15170 2 114061 0.0 0.0 110885 4841 Dialog ZCM_CHICKERING_NEWFI 14887 1 1488727 469.9 469.9 1471244 13622 Dialog ZCM_MOVESTUDENT 14330 1 18442 0.0 0.0 2555 192 Dialog IW37N 11593 1 25591 67.4- 147.2 19527 168 Dialog ZFI_ILAB_MASTER_DATA 11473 1 61684 406.1- 603.4- 47116 158

52
Top Applications by Response Time
Task Type Application
Total Resp. Time in s
% of Total Load
Avg. Resp. Time in ms
Long Term Growth (%/year)
Short Term Growth (%/year)
Avg. DB Time in ms
Avg. CPU Time in ms
Dialog SE11 11353 1 570 56.4 487.7- 495 28 Dialog ZJWB_001_ELIGIBLE_SE 10379 1 42535 655.0- 655.0- 165 56
The graph below shows how the average response time of the top five applications varies over time. Data is normalized to 100% equaling the average value.
16.4 System Operation The following diagram or table shows important KPIs for system operation.
16.5 Hardware Capacity

53
The following diagram or table shows CPU max load from database server and all Appl servers.
Report time frame: Service data was collected starting at 04/20/2015 04:25:06. This took 120 minutes.
You can see sample EarlyWatch Alert reports on SAP Service Marketplace at /EWA -> Library -> Media Library.
General information about the EarlyWatch Alert is available at SAP Note 1257308.