early spatial and temporal validation of modis lai product - boston
TRANSCRIPT

Early spatial and temporal validation of MODIS LAI product
in the Southern Africa Kalahari
J.L. Privette a,*, R.B. Myneni b, Y. Knyazikhin b, M. Mukelabai c, G. Roberts d, Y. Tian b,Y. Wang b, S.G. Leblanc e
aCode 923, NASA’s Goddard Space Flight Center, Greenbelt, MD 20771, USAbDepartment of Geography, Boston University, 675 Commonwealth Ave., Boston, MA, USA
cMeteorological Office, PO Box 910144, Mongu, ZambiadDepartment of Geography, University College London, UK
eCanadian Centre for Remote Sensing, Ottawa, Canada
Received 27 March 2001; received in revised form 10 April 2002; accepted 16 April 2002
Abstract
We evaluate the operational MODIS Leaf Area Index (LAI) product using field-sampled data collected at five sites in southern Africa in
March 2000. One site (Mongu, Zambia) was sampled monthly throughout the year. All sites were along the International Geosphere
Biosphere Programme’s (IGBP) Kalahari Transect, which features progressively lower annual precipitation, and hence, lower vegetation
productivity, from north to south. The soils are consistently sandy. At each site, we sampled the vegetation overstory along three 750-m
transects using the Tracing Radiation and Architecture in Canopies (TRAC) instrument. The resulting plant area index values were adjusted
with ancillary stem area data to estimate LAI. Despite some instrument characterization and production issues in the first year of MODIS
operations, our results suggest the first-year MODIS LAI algorithm correctly accommodates structural and phenological variability in
semiarid woodlands and savannas, and is accurate to within the uncertainty of the validation approach used here. Limitations of this study and
its conclusions are also discussed.
D 2002 Published by Elsevier Science Inc.
1. Introduction
In November 1999, NASA launched Terra, the first of the
major Earth Observing System (EOS) platforms. Terra
includes five sensors, including MODerate Resolution Imag-
ing Spectroradiometer (MODIS; Kaufman, Herring, Ranson,
& Collatz, 1998). MODIS is a wide field-of-view (2330 km)
sensor that views most locations each day and all locations
within 2 days. Although its heritage primarily includes the
Advanced Very High Resolution Radiometer, MODIS has
many significant improvements. These include 36 spectral
bands at resolutions of 250, 500 or 1000 m, on-board
calibration systems, and well-characterized performance
(e.g., modulation transfer function for precise geolocation).
Despite its technological improvements, Terra may be
most noteworthy for ushering in the age of multidisciplinary
operational products. Since 1990, MODIS science teams,
stratified by land, atmosphere and ocean disciplines, have
been formulating and testing computer algorithms capable
of generating global change research parameters in near
real-time. A separate team was charged with developing
calibration and low-level operational products (e.g., geo-
location), and a fifth team was added in 1997 to assist in
product validation (Justice, Starr, Wickland, Privette, &
Suttles, 1998; Privette et al., 2000).
The MODIS Land Discipline Team (MODLAND) has a
particularly challenging role in generating a wide variety of
global products at vastly different temporal and spatial
scales (Justice et al., 1998). Perhaps one of the mostly
widely anticipated MODLAND products is leaf area index
(LAI), a unitless parameter describing the mean green leaf
area per given land area (Myneni et al., 2002, this issue).
The popularity of LAI stems from its use in many applica-
tions, such as modeling atmospheric carbon assimilation,
evapotranspiration, fire fuel potential, habitat characteristics
and herbivore grazing potential. Further, the MODIS prod-
0034-4257/02/$ - see front matter D 2002 Published by Elsevier Science Inc.
PII: S0034 -4257 (02 )00075 -5
* Corresponding author. Tel.: +1-301-614-6630; fax: +1-301-614-6695.
E-mail address: [email protected] (J.L. Privette).
www.elsevier.com/locate/rse
Remote Sensing of Environment 83 (2002) 232–243

uct is the only operational LAI product from satellites
currently available.
The importance of LAI led to its emphasis within Southern
Africa Validation of EOS (SAVE; Privette, 2000), a valida-
tion project funded by the EOS Validation Program Office.
SAVE was designed to validate land and atmospheric prod-
ucts from several EOS sensors at multiple field sites. It also
served as one of the foundational projects for the Southern
African Regional Science Initiative (SAFARI 2000; Swap &
Annegarn, 1999). The fieldwork reported here was conducted
under the auspices of this international initiative.
This article describes the methods and early results of
SAVE’s LAI validation activities in Zambia and Botswana.
Following a brief description of the MODIS LAI product,
we outline our field sites and sampling methods. Next, we
quantitatively evaluate the MODIS LAI against the field
measurements in both time and space. We conclude with a
discussion of possible errors in both the satellite and field
measurements.
This article focuses on data collected in the year 2000 and
processed with the so-called MODAPS V001 system. We
note thatMODIS ‘‘first light’’ was 24 February 2000, the LAI
product release occurred in early August, and updates to
‘‘lower level’’ products (such as calibration, cloud masking,
and atmospheric correction) occurred throughout 2000 as
understanding of sensor and algorithm characteristics grew.
These changes led to variable accuracy in some higher-level
products. We provide this early assessment of LAI to help
benchmark and allow tracking of product accuracy, espe-
cially following sensor or algorithm changes, throughout the
mission. Further, we hope to provide some transparency to
the EOS end-user community on one activity being used to
ascribe operational product accuracy. Finally, these results
may help guide other operational product teams (e.g., from
EOS Aqua, National Polar Orbiting Operational Environ-
mental Satellite System [NPOESS], Global Land Imager)
developing their algorithmic approaches.
2. The MODIS LAI product
The MODIS LAI product (MOD 15A2; Level 4) is
defined as the one-sided green leaf area per unit area. The
1-km product is produced on a daily or 8-day compositing
period, where the selected value in a compositing period is
that with the highest corresponding fraction of absorbed
photosynthetically active radiation (FPAR). We provide a
brief summary below, and refer readers elsewhere (Myneni
et al., 2002, this issue) for further details.
The algorithm is based on rigorous three-dimensional
radiative transfer theory (Myneni, Asrar, & Gerstl, 1990),
but is optimized for inversion using look-up tables and
sophisticated approaches to solving the radiative transport
equation (Knyazikhin, Martonchik, Myneni, et al., 1998;
Knyazikhin, Martonchik, Diner, et al., 1998). The algorithm
ingests atmospherically corrected bidirectional reflectance
factors, and their corresponding sun-view geometries, in up
to seven spectral bands (648, 858, 470, 555, 1240 and 2130
nm). To date, only two bands (648 and 858 nm) are being
used. The 250 and/or 500 m resolution bands are aggregated
into normalized 1 km resolution grid cells prior to ingest
(Wolfe, Roy, & Vermote, 1998).
The algorithm also employs a 1 km landcover map strati-
fied by sixmajor world biomes. The biomes are used to define
uniquemodel configurations, including some fixed parameter
values, appropriate for the biome characteristics. Look-up
tables are then generated for each biome by running themodel
for various combinations of LAI and fractional cover. During
algorithm execution, the algorithm compares themodeled and
observed reflectances for a suite of canopy structures and soil
patterns that represent the range of expected natural condi-
tions. All canopy/soil patterns for which modeled and
observed reflectances differ by less than the uncertainty of
the observed reflectances are considered acceptable solutions.
A scale-independent test of energy conservation is also
applied. The mean LAI and FPAR for this solution set are
reported as the MODIS LAI and FPAR product values. When
acceptable solutions are not found, a backup algorithm based
on directional vegetation indices is employed.
The LAI product is reprojected onto an Integerized
Sinusoidal (IS) 10j grid. It is distributed in HDF-EOS
format and includes extensive quality control and assur-
ance information. In this study, we used the daily 1 km
product values closest to the field-measurement dates
when MODIS quality control fields indicated good qual-
ity. In the absence of good quality retrievals (e.g., due to
persistent cloudiness, data loss or instrument problems),
the 8-day composite product was used if its quality
control fields indicated good quality.
3. Field sites
The field sites used in this study occur along a f 950 km
north–south transect extending from Mongu, Zambia to
Tshane, Botswana (see Fig. 1). This transect is a subsection
of the Kalahari Transect (Scholes & Parsons, 1997, Ringrose
& Chanda, 2000), one of the International Geosphere Bio-
sphere Programme’s (IGBP) Terrestrial Transects (Steffen,
2000). The Transects span significant variations in major
environmental or land-use factors. The Kalahari Transect
extends over a rainfall gradient (f 200 to f 1000 mm/
year) in an area of fairly constant soil types: the Kalahari
sands. There is some local soil variation associated with pans
and subsurface duricrusts. All sites are on the southern
African plateau with elevations of about 1000 m.
Two types of LAI assessments are discussed in this study.
First, five sites were characterized over a 20-day period in
March 2000 (Dowty et al., 2000). Second, one of those sites
(Mongu) was resampled approximately monthly from April
through December. Below, we briefly summarize key fea-
tures of each site.
J.L. Privette et al. / Remote Sensing of Environment 83 (2002) 232–243 233

3.1. Mongu, Zambia—15.438 south; 23.253 east
This site is on the edge of the Kataba Local Forest,
approximately 20 km south of Mongu, Zambia. The vege-
tation cover is Kalahari woodland (also known as Miombo
woodland on sand) dominated by Brachystegia spiciformis
(a broadleaf semi-evergreen with alternate pinnate leaves),
with a sparse woody understory (see Fig. 2a; Storrs, 1995).
The Local Forest designation implies that the area can be
used for government-regulated subsistence harvesting (usu-
ally for firewood or lumber) by local villagers. As one of the
EOS Land Validation Core Sites, the site features a climb-up
30 m tower amidst the f 12 m trees. The mean annual
rainfall is about 950 mm.
3.2. Pandamatenga, Botswana—18.655 south; 25.500 east
This site is approximately 100 km south of Kasane,
Botswana. The vegetation cover is an open woodland
dominated by Schinzophyton rautanenii (a broadleaf decid-
uous with heavy, spreading crowns and palmate leaves),
Baikiaea plurijuga (common name Zambezi teak, a broad-
leaf with dense crowns and pinnately compound leaves—
deciduous to nearly evergreen) and Burkea africana (a
deciduous or semi-deciduous broadleaf with bipinnately
compound leaves at branch ends) with patches of high grass
biomass (see Fig. 2b). The overstory height is about 12 m.
The site is subjected to light sheep grazing. The mean
annual rainfall is about 630 mm.
3.3. Maun, Botswana—19.923 south; 23.594 east
This site is about 20 km northeast of Maun in a woodland
managed by the Harry Oppenheimer Okavango Research
Centre. The vegetation cover is mopane woodland (Colo-
ophospermum mopane; a broadleaf deciduous with paired
leaflets) with some thick patches of Terminalia sericea (a
broadleaf deciduous with simple leaves spirally arranged at
branch ends) thicket (see Fig. 2c). The mean height of
overstory species is about 7 m. There are some adjacent
shrubland patches with no overstory members. Mean annual
rainfall is about 460 mm.
3.4. Okwa River Crossing, Botswana—22.409 south;
21.713 east
This site is located where the Trans-Kalahari Highway
crosses the fossil Okwa River bed (dry), approximately 80
km south of Ghanzi, Botswana. This site has some topo-
graphic variation and soil characteristics which distinguish it
from the surrounding landscape. The vegetation cover is an
open shrubland, dominated by Acacia mellifera, T. sericea
Fig. 1. Map of southern Africa showing measurement sites used in this study. From north to south, the sites are Mongu, Zambia, and Pandamatenga, Maun,
Okwa River Crossing and Tshane, Botswana. The image qualitatively corresponds to the mean composited NDVI for first 10 days of years 1982–1993, where
yellow represents more desert-like conditions, and green represents more dense vegetation.
J.L. Privette et al. / Remote Sensing of Environment 83 (2002) 232–243234

Fig. 2. Photographs of (a) Mongu (August, dry season), (b) Pandamatenga (wet), (c) Maun (wet), (d) Okwa River Crossing (wet), and (e) Tshane (wet). Note
the differences in understory, bare soil exposure and canopy density. The numbers, showing the date, Universal Time, and geographic location of the
photograph, were determined from the Global Positioning System (GPS).
J.L. Privette et al. / Remote Sensing of Environment 83 (2002) 232–243 235

and Grewia flava, with scattered short trees (see Fig. 2d).
Mean annual rainfall is about 400 mm.
3.5. Tshane, Botswana–24.164 south; 21.893 east
This site is located approximately 15 km south of Tshane,
Botswana. The vegetation cover is open savanna dominated
by Acacia luederitzii and A. mellifera with an overstory
height of about 7 m (see Fig. 2e). Mean annual rainfall at
Tshane is about 365 mm. Light grazing occurs.
4. Methods
4.1. Instrumentation
The data used in this study were collected using the
Tracing Radiation and Architecture of Canopies (TRAC)
instrument developed by Jing Chen and his colleagues
(Chen, 1996; Chen & Cihlar, 1995; Chen, Leblanc, &
Kwong, 2000). TRAC includes three pyranometers (two
uplooking, one downlooking) sensitive to photosyntheti-
cally active radiation (400–700 nm). The instrument is
hand-carried along linear transects during periods of direct
sunlight (i.e., non-cloudy conditions). It effectively samples
sunfleck size and frequency by recording the photosynthetic
photon flux density (PPFD) at 32 Hz. Each value is recorded
as a four-digit integer. The user is required to enter a date/
time stamp in the data (accomplished with the press of a
button) at fixed intervals along the transects.
Proprietary TRAC software is used to determine the gap
fraction and clumping index of the overstory from one of the
uplooking pyranometers (Chen et al., 2000; Leblanc, in
press). Clumping is estimated by determining the deviation
of the measured gap size distribution from that of randomly
distributed foliage (Nilson, 1971; Miller & Norman, 1971).
Fig. 2 (continued).
J.L. Privette et al. / Remote Sensing of Environment 83 (2002) 232–243236

This value is used to adjust the effective plant area index
(PAI), which assumes non-clumped foliage, to the actual
PAI (Chen, 1996). The PAI is the sum of the LAI and the
stem area index (SAI, also referred to as non-photosynthe-
sizing area index), i.e.,
PAI ¼ LAIþ SAI: ð1Þ
The software requires specification of the canopy char-
acteristic foliage size. We used a value of 40 mm which is
reasonable based on observation, literature (e.g., Storrs,
1995), and limited sampling (G. Midgely, personal commu-
nication, 2001). Using TRAC data from June 11 (Mongu,
Transect B), we also determined that the derived LAI
changed by less than 2% when specified foliage size was
perturbed by F 10 mm. The TRAC solar geometry is
computed internally based on the user-provided earth coor-
dinates and the TRAC-recorded date and time.
TRAC was prototyped and has been extensively used in
coniferous forests, including use in validation of satellite-
derived LAI maps of Canada (Chen et al., in press). Its
application in woodlands and savannas has been limited to
date. Still, the ability of TRAC to compensate for extreme
foliage clumping and gaps (and hence deviation from uni-
form leaf distribution) suggests that it may be one of the
more suitable instruments for semiarid systems.
4.2. Transect design
We employed the same sampling design at each site.
Specifically, we defined three parallel transects, each 750 m
in length and 250 m apart (Fig. 3). The transects extended in
the east–west direction, and were denoted N(orth), A and B
from north to south (at Mongu, we denoted these A, B and
C). Stake flags were placed each 25 m to notify the user
when to enter a time stamp in the TRAC data record.
Distances were determined using an ultrasonic transponder
and sensor (Distance Measuring Equipment 201, Haglof
Sweden, accurate to 1%) and directions determined with a
standard compass. This design allowed TRAC to sample an
area approximately commensurate with the 1 km resolution
of the MODIS LAI product.
4.3. Data reduction
Although TRAC is conceptually easy to operate, field
sampling can be challenging especially under variable cloud
conditions. Among other duties, the operator must stop
motion and deactivate the sensor whenever a cloud passes
in front of the sun. Such conditions are frequent in the
African rainy season, considering that a single 750 m
transect can take nearly 40 min to traverse (Chen et al.,
2000 recommend a velocity of 0.3 m/s).
Fig. 3. TRAC sampling occurred along three east–west transects, each 750 m long and 250 m apart. Flag stakes were placed each 25 m to identify TRAC time
stamp locations. In this IKONOS NDVI image, darker green patches are typically tree crowns and whiter areas are exposed soil. The darker area emanating
from the lower right of the scene is the Kataba Local Forest near Mongu, Zambia.
J.L. Privette et al. / Remote Sensing of Environment 83 (2002) 232–243 237
Occasional anomalies are typically introduced into the
data stream through operator error. These may include the
absence of a time mark (e.g., if the operator did not see a
flag or forgot to press the button), errant time marks (e.g.,
caused by a tree limb striking the instrument button), or
compensating for sensor deactivation/reactivation when a
cloud temporarily obscures the sun. Because the data
collected on a single transect are voluminous (mean file
size is about 700 Kb), we developed software, written in
Interactive Display Language (IDL), to assist in the visual
and statistical detection and correction of anomalies. After
data reduction, a typical transect profile contains subseg-
ments of similar PPFD values indicating either crown or
gap. Close inspection of these data reveals that TRAC is
able to trace the decreasing transmittance from the edge to
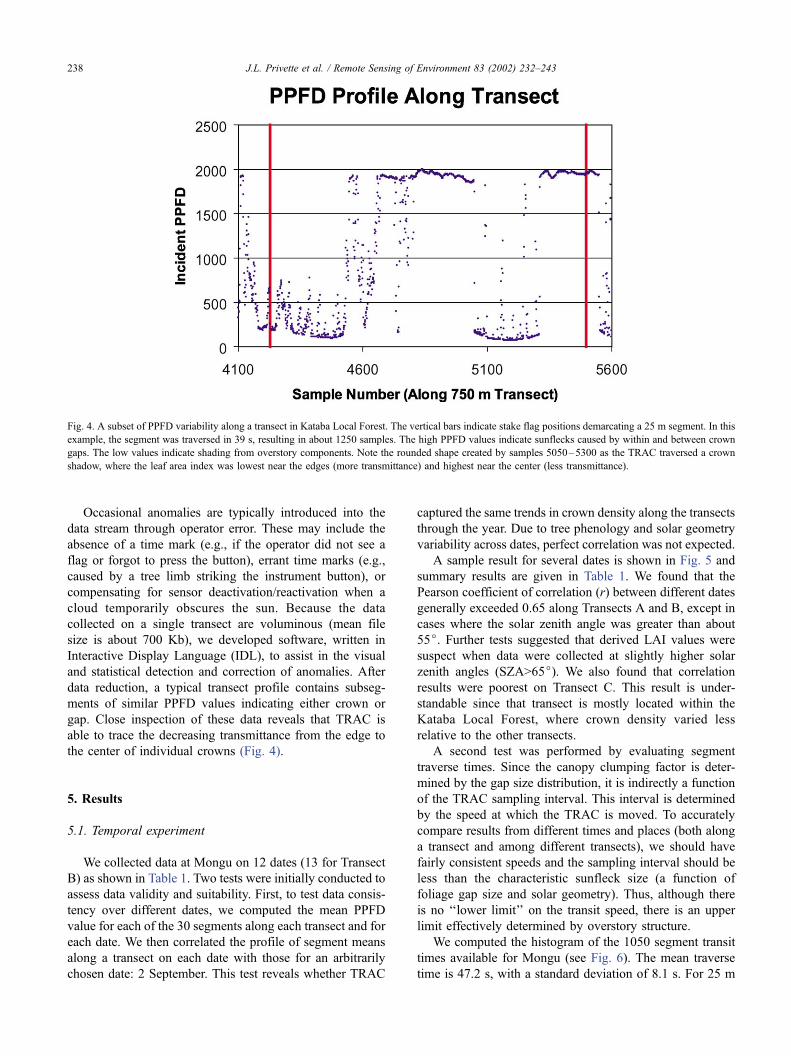
the center of individual crowns (Fig. 4).
5. Results
5.1. Temporal experiment
We collected data at Mongu on 12 dates (13 for Transect
B) as shown in Table 1. Two tests were initially conducted to
assess data validity and suitability. First, to test data consis-
tency over different dates, we computed the mean PPFD
value for each of the 30 segments along each transect and for
each date. We then correlated the profile of segment means
along a transect on each date with those for an arbitrarily
chosen date: 2 September. This test reveals whether TRAC
captured the same trends in crown density along the transects
through the year. Due to tree phenology and solar geometry
variability across dates, perfect correlation was not expected.
A sample result for several dates is shown in Fig. 5 and
summary results are given in Table 1. We found that the
Pearson coefficient of correlation (r) between different dates
generally exceeded 0.65 along Transects A and B, except in
cases where the solar zenith angle was greater than about
55j. Further tests suggested that derived LAI values were
suspect when data were collected at slightly higher solar
zenith angles (SZA>65j). We also found that correlation
results were poorest on Transect C. This result is under-
standable since that transect is mostly located within the
Kataba Local Forest, where crown density varied less
relative to the other transects.
A second test was performed by evaluating segment
traverse times. Since the canopy clumping factor is deter-
mined by the gap size distribution, it is indirectly a function
of the TRAC sampling interval. This interval is determined
by the speed at which the TRAC is moved. To accurately
compare results from different times and places (both along
a transect and among different transects), we should have
fairly consistent speeds and the sampling interval should be
less than the characteristic sunfleck size (a function of
foliage gap size and solar geometry). Thus, although there
is no ‘‘lower limit’’ on the transit speed, there is an upper
limit effectively determined by overstory structure.
We computed the histogram of the 1050 segment transit
times available for Mongu (see Fig. 6). The mean traverse
time is 47.2 s, with a standard deviation of 8.1 s. For 25 m
Fig. 4. A subset of PPFD variability along a transect in Kataba Local Forest. The vertical bars indicate stake flag positions demarcating a 25 m segment. In this
example, the segment was traversed in 39 s, resulting in about 1250 samples. The high PPFD values indicate sunflecks caused by within and between crown
gaps. The low values indicate shading from overstory components. Note the rounded shape created by samples 5050–5300 as the TRAC traversed a crown
shadow, where the leaf area index was lowest near the edges (more transmittance) and highest near the center (less transmittance).
J.L. Privette et al. / Remote Sensing of Environment 83 (2002) 232–243238

segments, this corresponds to a mean speed of 0.53 m/s and
hence a TRAC sampling interval of 1.66 cm. Although we
do not have independent data on the characteristic gap (or
sunfleck) size in semiarid African woodlands, our sampling
interval was less than half of our assumed characteristic
leaf size (4.0 cm). Although the traverse time’s standard
deviation is nearly 20% of the mean, the histogram is
skewed towards longer traverse times and hence shorter
sampling intervals. In such oversampling cases, the derived
LAI is not affected. Hence, our TRAC speed seems
sufficient.
5.2. Within-site spatial evaluation
Our site-wide PAI sample consisted of 90 values (3
transects� 30 segments/transect, where each value repre-
sents the mean PAI over 25 m). To assess spatial variability
over the area, we determined the PAI density distribution for
both a wet (20 April) and a dry (2 September) season case
(see summary statistics in Table 2).
Several trends are immediately apparent. First, the wet
season PAI is roughly double the dry season value. Not
surprisingly, Transect C has a higher ( < 0.4 units) mean PAI
than do Transects A or B. Because C is primarily within the
Kataba Local Forest, it is subject to less land use pressure
(e.g., cropping, harvesting). Besides impacting PAI, varying
land use may lead to some differences in age or species.
Finally, there is greater variability in the wet season case,
Fig. 6. TRAC segment transit times for 1050 segments gathered through the
year at Mongu. The mean transit time corresponds to a horizontal sampling
interval of about 1.66 cm. This distance is less than the estimated
characteristic sunfleck size, suggesting TRAC is able to completely resolve
typical sunflecks. This is required in TRAC software to properly reconstruct
the overstory gap size distribution.
Fig. 5. Mean PPFD values for each segment along Transect B on four dates
(June 14, August 5, September 2 and November 6), each collected at a
unique solar angle. The relatively high correlation demonstrated that TRAC
was consistently responding to varying crown density along the transects.
Poorly correlated data sets suggested that TRAC data may be less useful
when gathered under high solar zenith angles (e.g., >69j).
Table 1
Characteristics of data sets (Transects A to C from top to bottom) collected
at Mongu
Filename Month Day PAI SZA PPFD Correlation
Mean SD Maximum
Transect A
MT19040A 4 19 2.1 26.0 1092 692 2340 0.78
MT17050A 5 17 1.4 44.8 776 575 1591 0.79
MT14060A 6 14 1.3 44.2 831 557 1692 0.77
MT29060A 6 29 1.2 41.4 967 634 1793 0.70
MT05080A 8 5 1.1 42.3 954 511 1612 0.91
MT16080A 8 16 1.1 29.6 1196 599 1860 0.92
MT02090A 9 2 1.0 30.1 1073 372 1512 1.00
MT27090A 9 27 1.0 57.7 682 287 1206 0.44
MT17100A 10 17 0.9 71.3 134 48 307 0.52
MT06110A 11 6 1.2 25.5 1304 734 2083 0.61
MT21110A 11 21 1.4 9.5 1334 798 2229 0.63
MT19120A 12 19 1.6 69.5 323 215 1013 0.31
Transect B
MT29020B 2 29 2.1 65.3 360 195 1245 0.53
MT20040B 4 20 1.7 36.0 817 611 1863 0.87
MT14060B 6 14 1.4 39.9 887 601 1771 0.80
MT29060B 6 29 1.4 47.9 724 531 1551 0.79
MT17070B 7 17 1.2 37.2 938 575 1697 0.83
MT05080B 8 5 1.2 34.3 1057 565 1825 0.90
MT16080B 8 16 1.2 37.8 944 542 1677 0.84
MT02090B 9 2 0.9 23.8 1135 373 1604 1.00
MT27090B 9 27 1.1 46.5 931 365 1611 0.62
MT18100B 10 18 1.0 41.0 1017 431 1600 0.64
MT06110B 11 6 1.1 15.5 1458 761 2183 0.79
MT21110B 11 21 1.4 6.3 1425 792 2246 0.80
MT19120B 12 19 1.2 69.6 326 211 1013 � 0.15
Transect C
MT20040C 4 20 2.4 51.5 479 400 1527 � 0.08
MT17050C 5 17 2.9 35.7 746 619 2041 0.27
MT14060C 6 14 1.8 38.8 677 574 1708 0.40
MT07070C 7 7 1.8 41.5 701 593 1773 0.43
MT17070C 7 17 1.6 45.8 637 492 1605 0.37
MT07080C 8 7 1.3 34.0 936 558 1707 0.82
MT16080C 8 16 1.6 47.0 594 398 1402 0.37
MT02090C 9 2 1.3 22.5 902 368 1448 1.00
MT18100C 10 18 1.3 30.4 1023 505 1725 0.42
MT06110C 11 6 1.6 5.2 1262 737 2285 0.50
MT21110C 11 21 2.0 15.0 1025 693 2153 0.27
MT19120C 12 19 2.4 48.3 510 499 1799 0.52
PAI = plant area index, SZA= solar zenith angle (deg.), PPFD= photosyn-
thetic photon flux density, and correlation is relative to the profile of mean
segment PPFD values collected on 2 September.
J.L. Privette et al. / Remote Sensing of Environment 83 (2002) 232–243 239

both within and between the transects. This was also evident in the
correlation testing (see previous section).
The TRAC PAI includes green and senescent leaves,
stems and woody material. Thus, to evaluate the MODIS
LAI, we estimated the expected range (minimum, maximum)
of green LAI from TRAC by subtracting (adding) one stand-
ard deviation to the mean PAI, then subtracting the maximum
(minimum) estimated stem area index. We did not measure
stem area at Mongu, however Asner (1998 and personal
communication, 2001) reports that the range 0.3 < SAI < 0.4
is robust over a large sample of North and South American
woodlands and savannas. Although we adopt these values,
we continue to provide both LAI and the original PAI values
through the remainder of this article such that readers can
consider or apply other SAI values as desired.
The MODIS LAI is well within our TRAC-derived LAI
ranges (Table 2). Relative to the TRAC mean LAI, the
MODIS value is 0.3 units less in the wet season, but 0.1
units larger in the dry season. Because TRAC represents
overstory, LAI and MODIS represents total LAI, the
MODIS wet season value appears to underestimate the true
LAI in the April (wet season) case.
Next, we compared the TRAC PAI and MODIS LAI
estimates for April through December (see Fig. 7). There are
several trends to note. First, the temporal PAI profiles of the
transects exhibit similar seasonal profiles, with Transect C
having consistently higher values. The MODIS LAI follows
a similar trajectory as expected. Both depict leaf loss during
senescence in May through July, with minimum foliar
biomass in September, and green-up beginning in October.
MODIS data also suggest that the lowest LAI conditions
occurred near early September. This is consistent with
miombo species (Storrs, 1995), which begin generating
roots and leaves before the onset of the wet season (first
rains typically in October; fully established wet season in
Fig. 8. Comparison of TRAC-derived green LAI range and MODIS green
LAI values. The TRAC-derived PAI curve was determined by fitting the
PAI data with a third-order polynomial, and the LAI range was determined
by subtracting the maximum and minimum SAI values suggested by Asner
(1998 and personal communication, 2001) from the PAI curve. Only PAI
values from data collected when the solar zenith angle was lower than 69jwere used to fit the curve.
Fig. 7. Mean PAI values for each transect through the year at Mongu,
Zambia. Note the PAI of Transect C (that occurring primarily within the
Kataba Forest) is higher than for the other transects throughout the year,
especially in the wet season. The red squares show the MODIS LAI values
for the study site. The asterisks indicate PAI values from data collected
when the solar zenith angle was larger than 69j, under which conditions thederived values appear less accurate. The colors of the asterisk symbols
correspond to the transect colors shown in the legend.
Table 2
Spatial variability of TRAC-derived plant and leaf area indices at Mongu for wet and dry season cases
Date Transect Plant area index Leaf area index
Mean SD Mean Minimuma Maximuma MODISb
April 20 (wet season) A 2.3 0.9 * * * *
B 1.9 0.8 * * * *
C 2.6 0.9 * * * *
all 2.3 0.9 1.9 0.9 2.9 1.6
September 02 (dry season) A 1.0 0.4 * * * *
B 1.0 0.4 * * * *
C 1.3 0.4 * * * *
all 1.1 0.4 0.8 0.3 1.3 0.9
(*) Intentionally left blank.a The minimum (maximum) values of the range were estimated by subtracting (adding) one standard deviation to the mean, then subtracting the maximum
(minimum) estimated stem area index (0.4 and 0.3, respectively).b The MODIS value is provided for comparison to TRAC values.
J.L. Privette et al. / Remote Sensing of Environment 83 (2002) 232–243240

November). Together, the findings suggest the MODIS LAI
product is showing reasonable behavior throughout the
miombo phenological cycle.
To estimate quantitative agreement, we fit the mean PAI
values for each transect and date with a third-order poly-
nomial (standard error = 0.3, Chi squared fit = 2.6), then
subtracted the typical upper (0.4) and lower (0.3) SAI values
suggested by Asner (1998 and personal communication,
2001). The results are shown in Fig. 8. Except for the April
date (noted above), the TRAC LAI are lower than the
MODIS LAI as would be expected since TRAC only views
overstory. Both data sets suggest a gradual decrease in leaf
area from April through September, followed by a sharp
green-up beginning in October. The mean difference
between the TRAC LAI (assuming SAI = 0.35) and the
MODIS LAI is 0.2 (standard deviation = 0.2). Predictably,
the largest error occurs for April just after MODIS com-
menced operations (i.e., poorest instrument characteriza-
tion).
5.3. Kalahari Transect spatial evaluation
Although the temporal comparisons at Mongu suggest
appropriate MODIS product behavior for different pheno-
logical periods, they do not show the product’s behavior for
different vegetation structural conditions. Indeed, the crown
heights and spacing were effectively constant at the Mongu
site.
The other sites along the Kalahari exhibited markedly
different canopy structural characteristics (see Site Descrip-
tions and Fig. 2 above). Therefore, we compared the mean
TRAC values, determined over the three transects at each
site, with the MODIS value. Due to inconsistent MODIS
operations and cloud frequency in March 2000, the
MODIS LAI could not always be generated for these sites
on or near the TRAC sampling date. Thus, we generalized
two classes of savanna, the first including Pandamatenga
and Maun, the second including Okwa and Tshane. We
determined a single LAI for each class by finding mean
MODIS LAI of cloud-free grid cells within 10� 10 km
boxes centered on the study sites between March 22 and
April 6. This approach assumes that areas around the study
sites are structurally similar. This seems reasonable based
on inspection of the LAI histograms for the 10� 10
sample sets. Further, due to expected stability in the
vegetation phenology between the TRAC and MODIS
sampling dates, we assume any differences in time are
minimal compared to inter-site differences. Results are
shown in Fig. 9.
Again, the MODIS LAI shows reasonable behavior. The
MODIS LAI exceeded the TRAC LAI for Maun, Okwa and
Tshane as would be expected, but was less than the TRAC
value at Mongu and equal at Pandamatenga. The mean
difference between the TRAC LAI (assuming SAI = 0.35)
and the MODIS LAI over all sites is 0.2 (standard devia-
tion = 0.3). The greatest difference occurred for Okwa,
however, that result is consistent with the height of vegeta-
tion there relative to the TRAC operational height.
6. Discussion
Given the timing of the Kalahari Campaign and this
assessment relative MODIS’ initial operations, the results
are encouraging. They suggest that the MODIS LAI algo-
rithm is generating sensible values over southern Africa, and
is accommodating different phenological states and struc-
tural attributes (different degrees of crown shadowing, over-
story and understory prevalence, and bare soil exposure).
Although there is a current effort to reprocess early MODIS
products (using the MODAPS V003 system), initial com-
parisons suggest the reprocessed LAI values are quantita-
tively similar to the initial product values for semiarid
vegetation. This is particularly true in cases of low atmos-
pheric aerosol loading (AOT< 0.15 at 550 nm), a condition
that was common along the Kalahari during the wet season
campaign (M. Mukelabai, unpublished data). Thus, we
expect our results to change little upon MODIS reprocess-
ing. Other limitations to our results are discussed below.
We have considered MODIS LAI behavior for different
canopy phenological states and structures to assess robust-
ness. Nevertheless, the statistical significance of a compar-
ison on any one date or site is limited by the use of a single
MODLAND LAI grid cell—specifically, the one overlap-
ping the sampling area. This problem is somewhat mitigated
by the aggregation of up to16 samples (250 m resolution) in
the 1 km reflectance product used by the LAI algorithm.
Aggregation increases the signal-to-noise ratio, i.e., reduces
random errors. There are two practical methods for increas-
ing the MODIS sample size per site and date. First, we could
collect ground data over larger areas (e.g., 5� 5 km). Recall
Fig. 9. Mean TRAC PAI, TRAC-derived LAI, and MODIS LAI product
values for five structurally different sites along the Kalahari Transect in
March 2000. Pandamatenga is abbreviated as Panda. See text for details on
the MODIS LAI estimates. Note the Mongu TRAC data were collected on
April 19 and 20 since cloudiness prevented sufficient measurements at this
site during the Kalahari Campaign.
J.L. Privette et al. / Remote Sensing of Environment 83 (2002) 232–243 241

that although our method provides 93 LAI estimates per site
and date, each is a mean value determined over 25 m (i.e.,
from about 1500 TRAC measurements). Thus, an expanded
sampling area would require additional resources. Second,
we could scale the ground data over larger areas using other
data sources. Tian et al. (in press) comprehensively address
this issue for the Maun site using data collected alongside our
TRAC data, together with Landsat and IKONOS imagery.
Other approaches are discussed in Campbell, Burrows,
Gower, & Cohen (1999) and Weiss et al. (2001).
Second, our estimates of the MODIS LAI uncertainty
assume that stem area index data from North and South
American savanna systems (specifically Texas, New Mex-
ico, Chile and Brazil; Asner, 1998) can be applied to
Kalahari systems. Some species sampled in the ancillary
data, e.g., Prosopis glandulosa (mesquite), are fine-leaved
evergreen shrubs reminiscent of some African acacia spe-
cies. We hope to measure SAI at some Kalahari sites in
future work to evaluate the accuracy of this assumption. As
noted above, the provision of PAI values throughout this
article allows readers to consider other SAI ranges. As with
any method used to estimate LAI from light obscuration
methods, we must assume that there is equal probability that
a stem is obscuring light or that a leaf is obscuring light. In
the wet season, it seems likely that leaves more typically
cover woody components. This may explain why the
MODIS LAI is outside the range of TRAC PAI in the peak
dry season (Fig. 7), but is within the range of measured PAI
when foliar biomass is higher.
Third, the understory LAI was not adequately estimated
with the TRAC system as it was used in this study.
Typically, TRAC was held just below waist level (approx-
imately 0.7 m) during sampling. Foliage below that height
can be indirectly characterized using data from the down-
looking PAR sensor on TRAC, however, the current version
of TRAC software does not use that data. For Mongu and
most of the other Kalahari sites (predominately excepting
Okwa River Crossing), the majority of leaf area was in the
overstory, and hence visible to TRAC uplooking sensor.
Thus, we speculate that the omission of understory intro-
duced only a small error, particularly at the northern sites
(This is confirmed with other data sources in Privette et. al.,
2002). At Pandamatanga, there were a few areas of dense
grass. However, most of that area had only sparse grass
probably due to grazing. At Okwa, most leaf area was in
grass and fairly low shrubbery, suggesting our TRAC-
derived LAI is least accurate for this site.
The generality of our MODIS assessment may also be
limited by ecosystem. Kalahari soils are sandy and relatively
bright (typically a medium gray color), although moisture
and litter tends to darken them. Since soils in woodlands and
savannas tend to be more exposed than in other ecosystems,
the MODIS LAI algorithm may perform differently else-
where. Still, it was encouraging that algorithm results were
accurate in both wet (darker soil) and dry (bright soil)
seasons.
Just as the error budget is considered in generating the
MODIS LAI product, it must be used to interpret our optical
estimates of LAI. However, the dependence on proprietary
software or destructive samples makes this task difficult.
Each of the other limitations noted above will be addressed
in future work.
Obviously, comprehensive evaluation of the MODIS
LAI product requires independent data from many world-
wide sites and biomes before uncertainty claims can be
made about the product. An evaluation at more than 25
sites was recently initiated through an international work-
ing group on LAI validation (Privette, Morisette, Baret,
Gower, & Myneni, 2001). Results from this effort,
together with community recommendations on ‘‘best
practice’’ field and data protocols, will be provided in
future publications.
7. Conclusions
In this study, we derived leaf area index from optical
measurements, and compared these data to the operational
MODIS LAI product. These data were collected at four sites
along the IGBP Kalahari Transect in Botswana in March
2000, and monthly at one site in western Zambia from
March through December. The MODIS product captured the
phenology in a Kalahari Woodland, from peak-biomass in
March–April (latter part of wet season), senescence, peak
dry season and minimum foliar biomass in early September,
and rapid green-up into the next wet season. The LAI varied
between 0.8 and about 1.9 through that period. Further, the
MODIS LAI product also captured the decreasing LAI from
Mongu, Zambia (LAI f 1.7) through Tshane, Botswana
(LAI < 0.5) in the wet season. We conclude that first-year
MODIS LAI 1 km product performed well for African
semiarid woodlands and savannas.
Acknowledgements
The Kalahari Transect campaign was successfully
accomplished only with the help and cooperation of the
whole team. We sincerely thank all who participated. We
appreciate the help of C. Chirara, B. Mantlana, and K. Tabor
in defining transects. We particularly thank L. Otter, B.
Scholes, T. Suttles, S. Ringrose, O. Totolo, D. Lesolle, E.
Veenendaal, F. Nortje, H. Annegarn and B. Swap for the
extensive logistical help, and the Governments of Zambia
and Botswana for their gracious hosting of our activities. We
also thank the reviewers of the original manuscript for their
helpful comments. This study was part of the SAFARI 2000
Initiative. The TRAC data used in this study are available
via the Oak Ridge Data Active Archive Center’s Mercury
system. All MODIS data are available via the EROS Data
Center.
J.L. Privette et al. / Remote Sensing of Environment 83 (2002) 232–243242

References
Asner, G. P. (1998). Biophysical and biochemical sources of variability in
canopy reflectance. Remote Sensing of Environment, 64, 234–253.
Campbell, J. L., Burrows, S., Gower, S. T., & Cohen, W. B. (1999). Bigfoot
Field Manual, Ver. 2.1. Oak Ridge National Laboratory (p. 216,
ORNL/TM).
Chen, J. M. (1996). Optically-based methods for measuring seasonal var-
iation in leaf area index in boreal conifer stands. Agricultural and
Forest Meteorology, 80, 135–163.
Chen, J. M., & Cihlar, J. (1995). Plant canopy gap size analysis theory for
improving optical measurements of leaf area index. Applied Optics, 34,
6211–6222.
Chen, J. M., Leblanc, S. G., & Kwong, M. (2000). Manual for TRAC.
Ottawa: Canada Centre for Remote Sensing.
Chen, J. M., Pavlic, G., Brown, L., Cihlar, J., Leblanc, S. G., White, H. P.,
Hall, R. J., Peddle, D., King, D. J., Trofymow, J. A., Swift, E., Van der
Sanden, F. J., & Pellikka, P. (2002). Derivation and validation of Ca-
nada-wide coarse-resolution leaf area index maps using high-resolution
satellite imagery and ground measurements. Remote Sensing of Envi-
ronment, 80(1), 165–184.
Dowty, P., Frost, P., Lesolle, P., Midgley, G., Mukelabai, M., Otter, L.,
Privette, J., Ramontsho, J., Ringrose, S., Scholes, B., & Wang, Y.
(2000). Summary of the SAFARI 2000 wet season field campaign along
the Kalahari Transect. EOS Earth Observations, 12(3), 29–34.
Justice, C. O., Starr, D., Wickland, D., Privette, J. L., & Suttles, T. (1998).
EOS land validation coordination: an update. EOS Earth Observations,
10(3), 55–60.
Justice, C. O., Vermote, E., Townshend, J. R. G., Defries, R., Roy, D. P.,
Hall, D. K., Salomonson, V. V., Privette, J. L., et al. (1998). The MOD-
erate Resolution Imaging Spectroradiometer (MODIS): land remote
sensing for global change research. IEEE Transactions on Geoscience
and Remote Sensing, 36(4), 1228–1249.
Kaufman, Y. J., Herring, D. D., Ranson, K. J., & Collatz, G. J. (1998). Earth
observing system AM1 mission to Earth. IEEE Transactions on Geo-
science and Remote Sensing, 36(4), 1045–1055.
Knyazikhin, Y., Martonchik, J. V., Diner, D. J., Myneni, R. B., Verstraete,
M., Pinty, B., & Gobron, N. (1998). Estimation of vegetation leaf area
index and fraction of absorbed photosynthetically-active radiation from
atmosphere-corrected MISR data. Journal of Geophysical Research,
103, 32239–32256.
Knyazikhin, Y., Martonchik, J. V., Myneni, R. B., Diner, D. J., & Running,
S. W. (1998). Synergistic algorithm for estimating vegetation canopy
leaf area index and fraction of absorbed photosynthetically active radi-
ation from MODIS and MISR data. Journal of Geophysical Research,
103, 32257–32274.
Leblanc, S. G. (2002). Correction to the plant canopy gap size analysis
theory used by the Tracing Radiation and Architecture of Canopies
instrument. Applied Optics (in press).
Miller, E. E., & Norman, J. M. (1971). A sunfleck theory for plant canopies:
I. Length of sunlit segments along a transect. Agronomy Journal, 63,
735–738.
Myneni, R. B., Asrar, G., & Gerstl, S. A. W. (1990). Radiative transfer in
three-dimensional leaf canopies. Transport Theory and Statistical
Physics, 19, 205–250.
Myneni, R. B., Hoffman, S., Knyazikhin, Y., Privette, J. L., Glassy, J., Tian,
Y., Wang, Y., Song, X., Zhang, Y., Smith, G. R., Lotsch, A., Friedl, M.,
Morisette, J. T., Votava, P., Nemani, R. R., & Running, S. W. (2002).
Global products of vegetation leaf area and fraction absorbed PAR from
year one of MODIS data. Remote Sensing of Environment, 83, 214–231
(this issue).
Nilson, T. (1971). A theoretical analysis of the frequency of gaps in plant
stands. Agricultural and Forest Meteorology, 8, 25–38.
Privette, J. L. (2000). Southern Africa Validation of NASA’s Earth Observing
System (SAVE EOS). Proc. IJPRS Remote Sensing, 2000, Cape Town.
Privette, J. L., Asner, G. P., Conel, J., Huemmrich, K. F., Olson, R., Rango,
A., Rahman, A. F., Thome, K., & Walter-Shea, E. A. (2000). The
Prototype Validation Exercise (PROVE) at Jornada: overview and les-
sons learned. Remote Sensing of Environment, 74(1), 1–12.
Privette, J.L, Morisette, J., Baret, F., Gower, S. T., & Myneni, R. B. (2001).
Summary of the international workshop on LAI product validation.
EOS Earth Observations, 13(3), 18–22.
Privette, J.L., Tian, Y., Roberts, G., Scholes, R.J., Wang, Y., Caylor, K.C.,
Frost, P., & Mukelabai, M. (2002). Structural characteristics and rela-
tionships of kalahari woodlands and savannas. Global Change Biology,
(submitted).
Ringrose, S., & Chanda, R. (Eds.) (2000). Towards sustainable manage-
ment in the Kalahari Region: some essential background and critical
issues (p. 304). Gaborone: Directorate of Research and Development,
University of Botswana.
Scholes, R. J., & Parsons, D. A. B. (Eds.) (1997). The Kalahari Transect:
Research on Global Change and Sustainable Development in Southern
Africa, IGBP Report 42 (p. 61). Stockholm: IGBP Secretariat.
Steffen, W. (2000). The IGBP terrestrial transects: tools for resource man-
agement and global change research at the regional scale. In S. Ring-
rose, & R. Chanda (Eds.), Towards Sustainable Management in the
Kalahari Region: Some Essential Background and Critical Issues
( pp. 1–12). Gaborone: Directorate of Research and Development, Uni-
versity of Botswana.
Storrs, A. E. G. (1995). Know Your Trees: Some Common Trees Found in
Zambia. Lusaka, Zambia: Regional Soil Conservation Unit.
Swap, R. J., & Annegarn, H. (Eds.) (1999). Southern African Regional
Science Initiative: SAFARI 2000: Science Plan, Available at http://
safari.gecp.virginia.edu.
Tian, Y., Woodcock, C. E., Wang, Y., Privette, J. L., Shabanov, N. V., Zhou,
L., Buermann, W., Dong, J., Veikkanen, B., Hame, T., Ozdogan, M.,
Knyazikhin, Y., & Myneni, R. B. (2002). Multiscale Analysis and
Validation of the MODIS LAI Product over Maun, Botswana. Remote
Sensing of Environment (in press).
Weiss, M., de Beaufort, L., Baret, F., Allard, D., Bruguier, N., & Marloie,
O. (2001). Mapping leaf area index measurements at different scales for
the validation of large swath satellite sensors: first results of the VA-
LERI project. Proceedings of the 8th International Symposuim on Phys-
ical Measurements and Signatures in Remote Sensing, Aussois, France,
8–12 January (pp. 125–130).
Wolfe, R. E., Roy, D. P., & Vermote, E. (1998). MODIS land data storage,
gridding and compositing methodology: level 2 grid. Remote Sensing of
Environment, 36(4), 1324–1338.
J.L. Privette et al. / Remote Sensing of Environment 83 (2002) 232–243 243