early numeracy research project · summary in this document, an overview of the project is given,...
TRANSCRIPT

Early Numeracy Research Project
(1999-2001)
Summary of the Final Report

SUMMARY
In this document, an overview of the project is given, situating the Early Numeracy Research Project (ENRP) within a research and Victorian education context. The aims of the research are stated, the research methodology outlined, followed by major findings.
1.1 Background In the past ten years, there has been growing consensus among political and educational bodies that the early years of schooling are crucial in providing the kind of positive start to students’ literacy and mathematics learning needed to develop confident and capable lifelong learners.
In the Adelaide Declaration on National Goals for Schooling in the Twenty First Century, an aim was stated that “every child commencing school from 1998 will achieve a minimum acceptable literacy and numeracy standard within four years” (Ministers’ Council on Employment, Education, Training and Youth Affairs [MCEETYA], 1997). The ENRP provided the opportunity to make an important contribution to achieving that goal. For the purposes of the project and this report, the research team takes the definition of “numeracy” as offered by the MCEETYA Benchmarking Task Force (1997, p. 4):
[Numeracy is] the effective use of mathematics to meet the general demands of life at school and at home, in paid work, and for participation in community and civic life.
Within this report, the terms “numeracy” and “mathematics” will both be used, depending upon the context.
The ENRP was initiated in Victoria following the success of the Early Literacy Research Project. The Early Literacy Research Project [Hill, P. W., & Crévola, C. A. 1999. The role of standards in educational reform for the 21st century. In D. D. Marsh (Ed.), Preparing our schools for the 21st century, Association of Supervision and Curriculum Development Yearbook, pp. 117-142] worked with 27 disadvantaged Victorian primary schools to bring about substantial improvements in early literacy outcomes. Part of this research involved the development of models and guidelines for teaching, assessment and additional support for young children learning to read. As a result of the research, Hill and Crévola offered a general design for improving learning outcomes, which they believed had application in literacy, numeracy, and other curriculum areas. The nine Design Elements were Beliefs and Understandings; Leadership and Coordination; Standards and Targets; Monitoring and Assessment; Classroom Teaching Programs; Professional Learning Teams; School and Class Organisation; Intervention and Special Assistance; and Home, School and Community Partnerships.
The Early Numeracy Research Project (ENRP) was established in 1999 as a joint venture between Australian Catholic University, Monash University, the Victorian Department of Employment, Education and Training (DEET), the Catholic Education Office (CEO, Melbourne), and the Association of Independent Schools Victoria (AISV), in 35 project (“trial”) schools and 35 control (“reference”) schools, at Grades Prep to 2.
The 35 trial schools (28 DEET, 4 CEO, and 3 AISV) were selected from approximately 400 schools who applied to participate. The trial schools were chosen according to the schools’ demonstrated commitment to numeracy as a priority. In addition, sector staff checked that schools had made substantial progress on implementing Early Years Literacy. The DEET schools were chosen also to represent the range of Victorian schools, in terms of geographical location, socio-economic status, language background, school size and Koori population. The 35 matching reference schools were
Summary of the Early Numeracy Research Project Final Report 1

selected from the remaining Victorian primary schools, seeking the closest match taking into account all of the above variables. Two schools, one trial and one reference, were special schools. 354 teachers participated in the ENRP in trial schools over the three years, with 115 participating for the full three years, 85 for two of the three years, and 154 for one year only.
1.2 The Aims of the ENRP The stated aims of the Early Numeracy Research Project were the following: • to assist schools to implement the design elements as part of the school’s mathematics program; • to challenge teachers to explore their beliefs and understandings about how children develop their
understanding of mathematics, and how this can be supported through the teaching program; and • to evaluate the effect of the design elements and the professional development program on student
numeracy outcomes.
1.3 Some Key Differences Between Literacy and Numeracy Given that the success of the Early Literacy Research Project provided the impetus for the ENRP, it was important to consider those aspects of teaching and learning of numeracy (and therefore mathematics) that differed in important ways from equivalent aspects of literacy. These include: • teachers’ personal confidence with mathematics; • the need to improve the perceptions of children, teachers and parents regarding mathematics; • the lack of a shared understanding of the “big ideas” of mathematics in the early years; and • the lack of comprehensive assessment instruments and processes for early years. So, the context in which the Early Numeracy Research Project commenced was challenging, and yet promising and exciting.
1.4 Research Design The major elements of the research design were the following: • the development of a framework of “growth points” in young children’s understanding of
mathematics across a range of mathematical domains; • the development of associated assessment instruments, designed to show growth across these
domains, as measured by movement through the growth points; • delivery of focused professional development; • implementation of appropriate school support structures (built around the Design Elements); • monitoring of student achievement and growth over time; and • documenting effective practice of teachers, professional learning teams and schools. These components will now be discussed briefly.
1.4.1 The ENRP learning, teaching and assessment framework of “growth points”
The project team studied available research on key stages or levels in young children’s mathematics learning, as well as frameworks developed by other authors and groups to describe learning.
In developing the ENRP learning, teaching and assessment framework of growth points, it was intended that the framework would • reflect the findings of relevant research in mathematics education from Australia and overseas; • emphasise important ideas in early mathematics understanding in a form and language readily
Summary of the Early Numeracy Research Project Final Report 2
understood and, in time, retained by teachers;
• reflect, where possible, the structure of mathematics; • allow the mathematical knowledge and understanding of individuals and groups to be described; • form the basis of planning and teaching; • provide a basis for task construction for assessment via interview, and the recording and coding
process that would follow; • allow the identification and description of improvement in learning where it exists; • enable a consideration of those students who may benefit from additional assistance; • have sufficient “ceiling” to describe the knowledge and understanding of all children in the first three
years of school.
Growth points were developed in the areas of Number (incorporating the domains of Counting, Place Value, Addition and Subtraction Strategies, and Multiplication and Division Strategies), Measurement (incorporating the domains of Length, Mass and Time), and Space (incorporating the domains of Properties of Shape, and Visualisation and Orientation). There were no domains for Chance and Data, as it was decided that the research base was not strong enough for Chance, and piloted interview tasks for Data were unsatisfactory in revealing growth over time. Chance and Data however had a considerable emphasis within the professional development program and in the development of ongoing assessment tasks.
Within each mathematical domain, growth points were stated with brief descriptors in each case. There were four to six growth points in each domain. To illustrate the notion of a growth point, consider the child who is asked to find the total of two collections of objects (with nine objects screened from view, and another four objects). Many young children “count all” to find the total (“1, 2, 3, ... , 11, 12, 13”), even once they are aware that there are nine objects in one set and four in the other. Other children realise that by starting at 9 and counting on (“10, 11, 12, 13”), they can solve the problem in an easier way. Counting All and Counting On are therefore two important growth points in children’s developing understanding of addition.
As an example, the six growth points for the domain of Addition and Subtraction Strategies are shown in Figure 1.
These growth points informed the creation of assessment items, and the recording, scoring and subsequent analysis of student responses.
It should be noted that the framework was developed to describe mathematical growth of children from five to eight years of age.
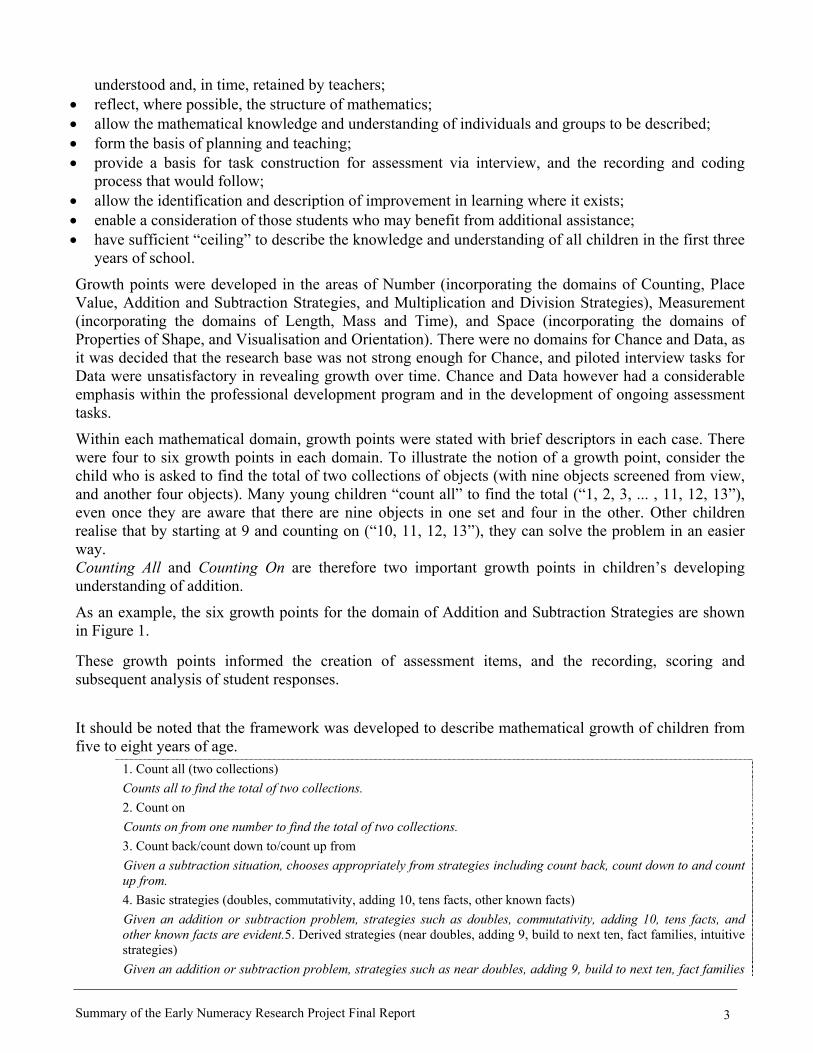
1. Count all (two collections) Counts all to find the total of two collections. 2. Count on Counts on from one number to find the total of two collections. 3. Count back/count down to/count up from Given a subtraction situation, chooses appropriately from strategies including count back, count down to and count up from. 4. Basic strategies (doubles, commutativity, adding 10, tens facts, other known facts) Given an addition or subtraction problem, strategies such as doubles, commutativity, adding 10, tens facts, and other known facts are evident.5. Derived strategies (near doubles, adding 9, build to next ten, fact families, intuitive strategies) Given an addition or subtraction problem, strategies such as near doubles, adding 9, build to next ten, fact families
Summary of the Early Numeracy Research Project Final Report 3

and intuitive strategies are evident. 6. Extending and applying addition and subtraction using basic, derived and intuitive strategies Given a range of tasks (including multi-digit numbers), can solve them mentally, using the appropriate strategies and a clear understanding of key concepts.
Figure 1. ENRP Growth Points for the domain of Addition and Subtraction Strategies.
The last growth point for many domains served as a kind of “catch-all”, and if the framework was extended to the upper primary grades, there would need to be more elaboration of these higher growth points.
1.4.2 The development of assessment instruments Assessment of children’s mathematical understanding occurred in three main forms during the project: a one-to-one interview, ongoing assessment tasks, and the variety of formal and informal assessment techniques developed by teachers. The development of a one-to-one, task-based interview was a major initiative of the project.
It was used by classroom teachers in trial schools with all children in Grades Prep to 2 in February/ March and November, each year of the project.
The interview was used on 34 398 occasions with P-2 children during the ENRP, with 11 421 children being interviewed at least once (see Table 1). Further interviews were conducted as part of two other smaller, related projects at Grades P-4, giving a total of 36 574 interviews in the period 1999-2001.
The interview was complemented by a set of Ongoing Assessment Tasks that were developed by the research team, and intended for use by classroom teachers at appropriate times. Table 1 Numbers of Students Interviewed in Trial and Reference Schools by Grade Level and Month, 1999-2001
Grade level Month and year Prep Grade 1 Grade 2 Trial Ref. Trial Ref. Trial Ref. Totals February/March 1999—DEET only 1238 463 1233 425 1168 331 4858 June 1999—CEO/AISV only 264 n/a* 264 n/a* 277 n/a* 805 November 1999 1524 407 1507 384 1442 284 5548 February/March 2000 1488 504 1504 419 1544 367 5826 November 2000 1483 452 1512 384 1539 317 5687 February/March 2001 1437 524 1467 527 1518 428 5901 November 2001 1455 474 1482 471 1496 395 5773 Totals 8889 2824 8969 2610 8984 2122 34398
*There were no reference schools for CEO/AISV schools in 1999
The third part of the assessment was the various forms of assessment that teachers used, developed by individuals and teams at the school level. In some cases, these were formal (tests, one-to-one assessments, brief questionnaires), while generally they were more informal, involving anecdotal records and other forms of observation.
The ENRP one-to-one interview was conducted with every child in trial schools and a random sample of around 40 children in each reference school at the beginning and end of the school year, over a 30- to 40-minute period. The disadvantages of pen and paper tests have been well established by Clements [Clements, M. A. 1995. Assessing the effectiveness of pencil-and-paper tests for school mathematics. In B. Atweh & S. Flavel (Eds.), Galtha: MERGA 18: Proceedings of the 18th Annual Conference of the Mathematics Education Research Group of Australasia. (pp. 184-188). Darwin, NT: University of the
Summary of the Early Numeracy Research Project Final Report 4

Northern Territory] and others, and these disadvantages are particularly evident with young children, where reading issues are of great significance. The face-to-face interview was an appropriate response to these concerns. The interviews were conducted by the regular Grade Prep-2 classroom teacher in trial schools, and a trained team of interviewers in reference schools. A range of procedures was developed to maximise consistency in the way in which the interview was administered across the 70 schools.
Although the full text of the ENRP interview involved around 60 tasks in Number, Measurement and Space (with several sub-tasks in many cases), no child moved through all of these. The interview was of the form of a “choose your own adventure” story, in that the interviewer made one of three decisions after each task, as instructed in the interview schedule. Given success with a task, the interviewer continued with the next task in the given mathematical domain as far as the child could go with success. Given difficulty with the task, the interviewer either abandoned that section of the interview and moved on to the next domain or moved into a detour, designed to elaborate more clearly the difficulty a child might be having with particular content.
The interview provided information about those growth points achieved by a child in each of the nine domains. Figure 2 shows a question from the interview, from the section on Addition and Subtraction Strategies. Words in italics are instructions to the interviewer; normal type are the words the interview used with the child.
18) Counting On a) Please get four green teddies for me. Place 9 green teddies on the table. b) I have nine green teddies here (show the child the nine teddies, and then screen the nine teddies with the ice-cream lid). That’s nine teddies hiding here and four teddies here (point to the groups). c) Tell me how many teddies we have altogether. … Please explain how you worked it out. d) (If unsuccessful, remove the lid). Please tell me how many there are altogether.
Figure 2. An excerpt from the Addition and Subtraction Strategies interview questions.
When children were interviewed on subsequent occasions, the progress they had made during the previous interview was used to determine the appropriate starting point within each domain.
Trained coders at Australian Catholic University took the record sheets completed by the interviewers, and used a coding scheme to assign achieved growth points to each child for each mathematical domain.
The research team found that at least one full day of professional development on conducting the interview, with the opportunity for some practice and further discussion, was essential preparation for using the interview with children. The research team also visited schools to offer comment and advice to teachers as they were interviewing children. The quality and consistency of the data over the three years of the project could only have been achieved with such a commitment to preparation and follow-up.
1.4.3 Delivery of focused professional development
The professional development program occurred (formally) at several levels:
The 250 or so teachers from the 35 trial schools throughout Victoria met with the research team centrally each year for an average of five full days. The focus of these days was on understanding the framework and interview, and on appropriate classroom strategies, content and activities for meeting identified needs of students. Some schools nominated a Mathematics Additional Assistance Specialist Teacher for additional professional development. There were 21 such people in 2000, and 14 in 2001. On four or five occasions each year, all teachers met in their regional cluster groups for two hours, usually after school.
Each cluster contained from three to five school teams. One member of the university research team (the
Summary of the Early Numeracy Research Project Final Report 5

Cluster Coordinator) was responsible for leading a planned, common workshop with each cluster group. The focus was on sharing, discussion of between-session tasks, a particular content focus for the day, and agreement on subsequent action.
The third level of professional development took place at the school and classroom level. Schools formed professional learning teams, led by the Early Numeracy Coordinator, and consisting of the coordinator and all teachers involved in numeracy in Prep-2. These teams met weekly or fortnightly at the school for planning and sharing.
Cluster coordinators visited each school approximately six times per year, spending time in classrooms co-teaching or observing, participating in planning meetings, jointly leading parent evenings, and acting as a “sounding board” for teachers, coordinators and principals. Over the three years of the project, members of the research team made 578 school visits (approximately 16.5 per school on average), as well as 86 visits for the case studies of particularly effective teachers and schools.
1.4.4 Implementation of the design elements As mentioned earlier, Hill and Crévola (1999) offered a general design for improving learning outcomes, which they believed had application in literacy, numeracy, and other curriculum areas. The professional development program outlined above provided considerable input to teachers, coordinators and principals on the issues of implementation of these Design Elements. The professional development for principals and coordinators focused largely on particular Design Elements, namely Leadership and Coordination, Home, School and Community Partnerships, and School and Class Organisation.
1.4.5 Monitoring of student achievement and growth over time Interviews were conducted twice-yearly in trial and reference schools. Children’s movement through growth points therefore provided a measure of growth in knowledge, skills and understandings over time. The comparison between trial and reference schools provided a measure of any growth beyond what could “normally be expected”.
At various times during the project, data were collected from teachers on student growth in areas other than those reflected by movement through the growth points, such as attitudes and persistence. As is outlined later in this summary, such affective growth was just as impressive as the cognitive growth.
1.4.6 Documenting effective practice of teachers and professional learning teams
By considering student data from particular classes and schools, the research team was able to identify particularly effective teachers and professional learning teams, in terms of student growth in understanding. These teachers and schools were then the focus of detailed case studies in the third year of the project. The team studied six individual teachers for whom the data on children’s growth in 1999 and 2001 was particularly impressive. The teachers studied were two Prep (one of whom was a successful teacher in a high NESB school), one Prep/1, one Grade 1, one Grade 1/2, and one Grade 2.
Two schools (one city and one country) were also chosen for their consistent and impressive growth over the two years. There was a focus on the work of the professional learning teams and the leadership at these schools, with a particular focus on the implementation of the Design Elements.
1.5 Research Methodology Given the wide scope and many phases of the research, multiple methods were used in the Early
Summary of the Early Numeracy Research Project Final Report 6

Numeracy Research Project, with a range of qualitative and quantitative data collection methods. The major forms of data collection in the ENRP, with examples, are given below: • Individual student interviews. All students in P-2 in ENRP trial schools and a random sample of
approximately 40 in each of the reference schools in March and November were interviewed each year, 1999 to 2001.
• Questionnaires. Data were collected on teachers’ perceived changes in their practices, their expectations of student performance, growth and mathematical behaviours, their grouping and other classroom organisational preferences, their planning processes, their personal confidence with mathematics, the time they allocated to particular strands in mathematics, and their opinions on the professional development program. Coordinators and principals were surveyed on their professional learning teams and the implementation of the Design Elements in their schools, and coordinators kept regular folios.
• Teacher, coordinator and principal interviews. All coordinators were interviewed (with interviews audiotaped), with detailed discussion on the workings of their professional learning teams. In the case studies of particularly effective teachers and schools, the six case study teachers, principals and coordinators were interviewed. In addition, a sample of Prep teachers whose students had shown the greatest growth in the Length domain was interviewed, seeking information on their approaches to teaching that topic. Within the case studies of the Additional Assistance and Intervention program, teachers, coordinators, principals, parents and students were also interviewed.
• Case study classroom observations. In the schools that were the focus of particular case studies (six individual teacher case studies, and two school case studies), teachers were observed by two members of the research team for a number of lessons. Following each lesson, teachers were interviewed about what had transpired in the lesson, and its relationship to other lessons.
• Artefacts. The research team collected many samples of student work, planning documents, worksheets and other artefacts over the course of the research.
1.6 Professional Development Within the ENRP A major feature of the Early Numeracy Research Project was the multi-level professional development in which teachers, coordinators and principals engaged. Over the three years of the project, the professional development program included a range of content, in five broad areas: • knowledge of how children learn mathematics;
• collecting and analysing information on individual and group understanding of mathematics;
• pedagogical content knowledge (the “intersection” of mathematical content and general pedagogy); and
• implementing the Design Elements; and
• personal knowledge of mathematics.
The professional development content for coordinators and principals focused largely on the Design Elements, with particular emphasis on leadership and coordination and professional learning teams. Table 2 gives examples for each year of the project of the kind of content addressed in the teachers’ professional development, using the headings above.
In reflecting on the success of the ENRP in teacher professional development, it is recommended that
Summary of the Early Numeracy Research Project Final Report 7

professional development offered by sectors provide an appropriate mix of these aspects, valuing teachers’ professional knowledge and judgement, and providing opportunities to try new approaches and come back together for sharing and further discussion and planning.
Table 2 Sample Content from the Teachers’ Professional Development Program 1999 2000 2001
Knowledge of how children learn mathematics
developing key ideas underpinning counting
young children’s play and spatial concepts
where do ideas of patterns and notions of equality lead?
Collecting and analysing information on individual and group understanding of mathematics
rich assessment tasks in measurement
ongoing assessment looking at our class data in groups
Pedagogical content knowledge (the “intersection” of mathematical content and general pedagogy)
short, flexible maths games
using materials and manipulatives in maths
multiple intelligences and the maths classroom
Implementing the design elements parent participation in maths learning
insights from maths additional assistance specialists
planning in professional learning teams
Personal knowledge of mathematics principles of measurement
two-dimensional geometry
building my own knowledge of number
1.7 Teachers as Professionals and Co-Researchers
In the initial stages of the ENRP, many teachers commented that they would prefer that the research team “tell them what to do and they would just do it”. From the first professional development session, the research team attempted to make it clear that they regarded project teachers as co-researchers. It was explained that there was much to be learned by all involved, and that a collaborative approach was the desired one.
Of the paradigms or themes that Doyle [Doyle, W. 1990. Themes in teacher education research. In W. R. Houston (Ed.), Handbook of research on teacher education (pp. 3-41). New York: Macmillan] identified as underlying proposals for teacher education (the good employee, the junior professor, the fully functioning person, the innovator, and the reflective professional), the Reflective Professional provides the best “fit” for this desired approach. According to this paradigm, both preservice and inservice teacher education should
foster capacities of observation, analysis, interpretation, and decision making. … Within this framework, research and theory do not produce rules or prescriptions for classroom application but rather knowledge of methods of inquiry useful in deliberating about teaching problems and practices. (Doyle, 1990, p. 6)
It is interesting that in the third year of the project, there appeared to be fairly general agreement that the co-researcher model was a powerful and appropriate approach.
Rather than a recipe, the notion of rich ingredients that are combined to meet the needs of individual children, the mathematics and the teaching context, using the professional judgement of teachers, was a powerful and successful approach.
Summary of the Early Numeracy Research Project Final Report 8

1.8 Findings on Student Growth In 1999, 2000 and 2001, there was positive, encouraging growth in reference schools. However, trial schools outperformed reference schools each year in every one of the content areas compared (Counting, Place Value, Addition and Subtraction Strategies, Multiplication and Division Strategies, Time, Length, Properties of Shape, and Visualisation and Orientation), at every grade level. This was the case whether all 35 trial schools were considered, or when separate analyses were undertaken for DEET, CEO and AISV schools.
Analysis of Variance indicated that all the differences mentioned above were highly statistically significant (p < .005 in every case).
1.8.1 Comparison between trial and reference schools on mean growth (2001) Combining all grade levels, the mean growth from March 2001 to November 2001 in each domain is presented in Table 3 for trial and reference school students. This table shows the figures for DEET, CEO and AISV schools combined. The figures are very similar when DEET students are considered separately, or when data from other years are considered.
In determining the figures in the table, for each student, the difference between the growth point achieved in March and that for November was found, and these averaged across all the students in all grades in trial and reference schools, respectively. The figures in the table are therefore expressed in growth points.
Table 3 Mean Growth Comparisons Between Trial and Reference Schools, 2001 (DEET, CEO, AISV Combined) 2001 mean growth for P-2 (in growth points) Mathematical domain Reference schools
(n = 1341) Trial schools
(2159 < n < 4143) Counting 0.81 1.07 Place Value 0.56 0.74 Addition & Subtraction Strategies 0.79 1.09 Multiplication & Division Strategies 0.72 0.97 Time 0.48 0.65 Length 0.37 0.64 Properties of Shape 0.31 0.54 Visualisation & Orientation 0.21 0.30
It is clear that the growth in trial schools was consistently greater for all domains. This impressive difference in growth continued the pattern from the first two years of the project.
1.8.2 Student growth over the three years of the project
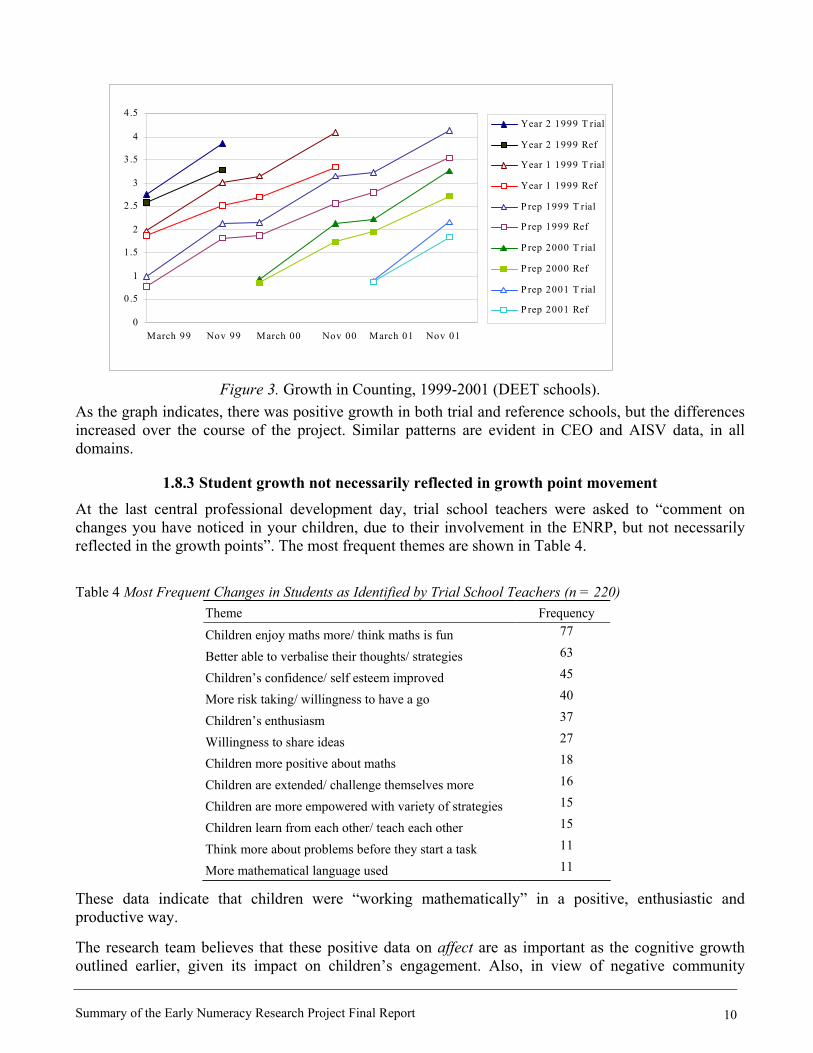
In the following analysis, the growth of the 1085 students who were involved in the project for the full three years (and therefore for six interview periods) is given. There were 867 children in trial schools and 218 children in reference schools for whom this was the case.
The vertical scale shows mean growth point achieved at each interview time, for each cohort of students.
The graph below is for the domain of Counting for DEET schools (Figure 3), but all other domain growth graphs show similar patterns. The symbols used in the graph are chosen to assist with matching (triangle = “trial school”; rectangle = “reference school”). It should be noted that some lines finish prematurely or start later on. This is because Grade 2 children left the project at the end of 1999 and 2000 respectively, and new Preps joined in 2000 and 2001.
Summary of the Early Numeracy Research Project Final Report 9
0
0.5
1
1.5
2
2.5
3
3.5
4
4.5
March 99 Nov 99 March 00 Nov 00 March 01 Nov 01
Year 2 1999 T rial
Year 2 1999 Ref
Year 1 1999 T rial
Year 1 1999 Ref
P rep 1999 T rial
P rep 1999 Ref
P rep 2000 T rial
P rep 2000 Ref
P rep 2001 T rial
P rep 2001 Ref
Figure 3. Growth in Counting, 1999-2001 (DEET schools). As the graph indicates, there was positive growth in both trial and reference schools, but the differences increased over the course of the project. Similar patterns are evident in CEO and AISV data, in all domains.
1.8.3 Student growth not necessarily reflected in growth point movement At the last central professional development day, trial school teachers were asked to “comment on changes you have noticed in your children, due to their involvement in the ENRP, but not necessarily reflected in the growth points”. The most frequent themes are shown in Table 4. Table 4 Most Frequent Changes in Students as Identified by Trial School Teachers (n = 220)
Theme Frequency
Children enjoy maths more/ think maths is fun 77
Better able to verbalise their thoughts/ strategies 63
Children’s confidence/ self esteem improved 45
More risk taking/ willingness to have a go 40
Children’s enthusiasm 37
Willingness to share ideas 27
Children more positive about maths 18
Children are extended/ challenge themselves more 16
Children are more empowered with variety of strategies 15
Children learn from each other/ teach each other 15
Think more about problems before they start a task 11
More mathematical language used 11
These data indicate that children were “working mathematically” in a positive, enthusiastic and productive way.
The research team believes that these positive data on affect are as important as the cognitive growth outlined earlier, given its impact on children’s engagement. Also, in view of negative community
Summary of the Early Numeracy Research Project Final Report 10
perceptions of mathematics and the average person’s perceptions of themselves as a learner of mathematics, improving students’ attitudes and confidence is an important achievement.
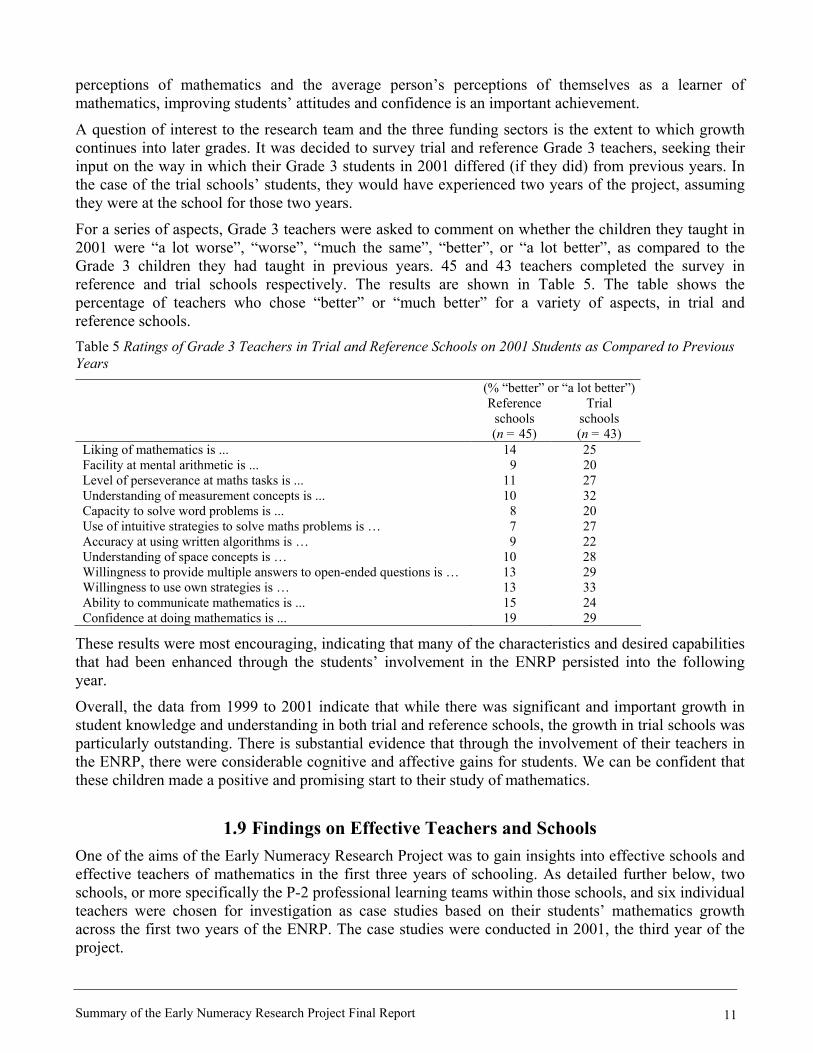
A question of interest to the research team and the three funding sectors is the extent to which growth continues into later grades. It was decided to survey trial and reference Grade 3 teachers, seeking their input on the way in which their Grade 3 students in 2001 differed (if they did) from previous years. In the case of the trial schools’ students, they would have experienced two years of the project, assuming they were at the school for those two years.
For a series of aspects, Grade 3 teachers were asked to comment on whether the children they taught in 2001 were “a lot worse”, “worse”, “much the same”, “better”, or “a lot better”, as compared to the Grade 3 children they had taught in previous years. 45 and 43 teachers completed the survey in reference and trial schools respectively. The results are shown in Table 5. The table shows the percentage of teachers who chose “better” or “much better” for a variety of aspects, in trial and reference schools. Table 5 Ratings of Grade 3 Teachers in Trial and Reference Schools on 2001 Students as Compared to Previous Years
(% “better” or “a lot better”) Reference
schools (n = 45)
Trial schools (n = 43)
Liking of mathematics is ... 14 25 Facility at mental arithmetic is ... 9 20 Level of perseverance at maths tasks is ... 11 27 Understanding of measurement concepts is ... 10 32 Capacity to solve word problems is ... 8 20 Use of intuitive strategies to solve maths problems is … 7 27 Accuracy at using written algorithms is … 9 22 Understanding of space concepts is … 10 28 Willingness to provide multiple answers to open-ended questions is … 13 29 Willingness to use own strategies is … 13 33 Ability to communicate mathematics is ... 15 24 Confidence at doing mathematics is ... 19 29
These results were most encouraging, indicating that many of the characteristics and desired capabilities that had been enhanced through the students’ involvement in the ENRP persisted into the following year.
Overall, the data from 1999 to 2001 indicate that while there was significant and important growth in student knowledge and understanding in both trial and reference schools, the growth in trial schools was particularly outstanding. There is substantial evidence that through the involvement of their teachers in the ENRP, there were considerable cognitive and affective gains for students. We can be confident that these children made a positive and promising start to their study of mathematics.
1.9 Findings on Effective Teachers and Schools One of the aims of the Early Numeracy Research Project was to gain insights into effective schools and effective teachers of mathematics in the first three years of schooling. As detailed further below, two schools, or more specifically the P-2 professional learning teams within those schools, and six individual teachers were chosen for investigation as case studies based on their students’ mathematics growth across the first two years of the ENRP. The case studies were conducted in 2001, the third year of the project.
Summary of the Early Numeracy Research Project Final Report 11

Six teachers were chosen for intensive study within the ENRP. The case study teachers were chosen due to high student growth in 1999 and 2000, to represent a cross-section of grades, with one teacher from each of Grade Prep, Grade Prep/1 Grade 1, Grade 1/2 and Grade 2. The research team was interested also in effective teaching in a class made up of children from predominantly non-English speaking backgrounds (NESB). Thus, the sixth case chosen for study was a Prep teacher in a school with a high NESB population, whose children had shown much growth in both 1999 and 2000.
1.9.1 Individual case studies of particularly effective teachers In selecting cases of individual teachers for study, the key criterion was interview results for 1999 and 2000 showing children’s mathematical growth across the ENRP learning, teaching and assessment framework domains.
Other criteria taken into account included a cross-section of grade levels, a mix of straight and composite classes, class size, teacher participation in the ENRP for the three year period and teaching the same grade for all of the three years, a mixture of city and non-city locations and school profile (e.g., NESB, number of children, SLN Index).
The six case study teachers were studied intensively through use of the following data sources: • Five lesson observations by two researchers, incorporating detailed observer field notes, photographs
of lessons and collection of artefacts. • Teacher interviews following the lessons. • Teacher questionnaires completed through the duration of the project. • Teacher responses to other relevant questions and tasks posed to them.
Through consideration of related research and following extensive trialling, it was agreed that data would be collected for the categories shown in Figure 4.
Mathematical focus
Features of tasks Materials, tools and representations
Adaptions/ connections/ links Organisational style(s), teaching approaches
Learning community and classroom interaction Expectations
Reflection Assessment methods
Figure 4. Categories for case study data collection.
Within these categories, there were many sub-categories. For example, within Adaptations / Connections / Links the following illustrative examples were provided: • Allocation of task (e.g., to differing abilities) • Adaptation of task (e.g., “on the run”/modification/flexibility) • Teachable moments – response • Intervention (strategies, for whom) • Engagement/Interest • Links to other mathematical lessons/tasks • Links to students’ lives/other Key Learning Areas (KLAs)
Summary of the Early Numeracy Research Project Final Report 12

This report includes themes that emerged for at least four of the six case study teachers and therefore represent some commonality within this group of teachers. These themes are listed in Figure 5, under the nine categories of the ENRP lesson observation and analysis guide, along with one extra category that emerged from the data.
Effective early numeracy teachers… Mathematical focus • focus on important mathematical ideas
• make the mathematical focus clear to the children Features of tasks • structure purposeful tasks that enable different possibilities, strategies and
products to emerge • choose tasks that engage children and maintain involvement
Materials, tools and representations
• use a range of materials/representations/contexts for the same concept
Adaptions/ connections/ links
• use teachable moments as they occur • make connections to mathematical ideas from previous lessons or
experiences Organisational style(s), teaching approaches
• engage and focus children’s mathematical thinking through an introductory, whole group activity
• choose from a variety of individual and group structures and teacher roles within the major part of the lesson
Learning community and classroom interaction
• use a range of question types to probe and challenge children’s thinking and reasoning
• hold back from telling children everything • encourage children to explain their mathematical thinking/ideas • encourage children to listen and evaluate others’ mathematical
thinking/ideas, and help with methods and understanding • listen attentively to individual children • build on children’s mathematical ideas and strategies
Expectations • have high but realistic mathematical expectations of all children • promote and value effort, persistence and concentration
Reflection • draw out key mathematical ideas during and/or towards the end of the lesson
• after the lesson, reflect on children’s responses and learning, together with activities and lesson content
Assessment methods
• collect data by observation and/or listening to children, taking notes as appropriate
• use a variety of assessment methods • modify planning as a result of assessment
Personal attributes of the teacher
• believe that mathematics learning can and should be enjoyable • are confident in their own knowledge of mathematics at the level they are
teaching • show pride and pleasure in individuals’ success
Figure 5. Common themes emerging from six individual ENRP case studies.
1.9.2 Case studies of particularly effective professional learning teams Student data from 1999 and 2000 also enabled the research team to identify schools for which the student growth was particularly impressive overall. Two schools, and their professional learning teams in particular, were chosen for detailed study during 2001. One school was a metropolitan school, close to the median in terms of school size, socio-economic status, percentage of children whose language background was other than English, and various other indices that are discussed in this report. The second school was a very small country school.
Summary of the Early Numeracy Research Project Final Report 13

Classroom observations, school curriculum and other documents, and interviews with teachers, the early numeracy coordinator and principal, provided a sense of what it was that might have led these schools to be successful in enhancing student learning. Not surprisingly, there were commonalities across the two schools and professional learning teams, but also differences. Some differences were by the very nature of the size and locations of the schools.
Both schools exhibited very strong and harmonious teams, with the active support of the principal. Parent communities participated enthusiastically in parent information and Family Maths nights, but there was little evidence of parents working in classrooms during mathematics. Both schools made considerable use of ENRP Growth Points in planning and assessment. Mathematics lessons involved extensive use of open-ended tasks, much sharing and discussion of strategies. Mathematics issues tended to be incorporated into general meetings of the P-2 teams. Much planning and discussion occurred during lunch and recess breaks and in passing. Discussion of children’s mathematical learning became the norm.
Both schools made extensive use of the ENRP Growth Points in planning. One principal was very hands-on in his support, while the other worked more quietly behind the scenes, to put in place supportive structures and funding for teachers’ work. At both schools, some teachers tended to spend three or more lessons on a given topic before moving on, while others addressed a number of topics in the one week. The city school had straight grades, while the small country school had composite grades. The country school participated in the ENRP intervention program, while the city school offered additional assistance within class.
Overall, the picture in these two successful schools was of harmonious, effective teams with good administrative support, that had a clear mathematical focus in their teaching, valued the ideas of each other and the children, and worked together, with impressive results.
1.10 Key Findings on Children’s Mathematical Understanding
The Prep Detour within the Early Numeracy Interview enabled a very clear picture of the mathematical knowledge and understandings that young children bring to school, and the development of these aspects during the first year of school. Most Prep children arrive with considerable skills and understandings in areas that have been traditional content for this grade level. As acknowledged by many trial school teachers, this means that expectations could be raised considerably in terms of what can be achieved in the first year. Prep children showed impressive growth during their first year at school. For Prep Detour tasks for which few children were successful at the beginning of the school year, the vast majority succeeded in November.
The analysis of ENRP data shows that all domains should be part of the curriculum at each grade level in the early years of schooling. Growth points are clearly written, developmentally appropriate, and provide readily interpreted goals for describing student learning. Students will benefit if teachers use these as the basis of planning, teaching and assessment.
In a number of domains, barriers to student learning (i.e., particularly challenging skills or concepts) were identified, and there were certain growth points which took children significant time to achieve.
Summary of the Early Numeracy Research Project Final Report 14

1.11 Key Findings in Relation to the Design Elements
1.11.1 Leadership and coordination Most data collection in the ENRP for this design element focused on the role of the Early Numeracy Coordinator. Many principals commented on the crucial leadership role played by coordinators with their professional learning teams. As one principal noted: “The coordinator has been a vital element in the professional growth of the team, and she has had the confidence (and support from the ENRP team) to combine pressure and support to engender change”. Using questionnaires, journals and diaries, the research team collected data on the components of the role, the time needed for this work, the challenges faced in the role, and advice on the recommended time to carry out this role. During a week in which coordinators kept detailed diaries of their role (during August 2000), the time taken in the role varied from approximately 2 to 31 hours, with the number of separate tasks performed varying from 2 to 32. The major components of the role, as revealed in a variety of questionnaires were: • organisation and management; • meetings; • consulting with others/ liaison; • teaching and mentoring; • course planning; • researching materials and activities; • making, purchasing and assembling resources; and • documenting ENRP work.
During one week in the second year of the project, coordinators kept detailed diaries on the various aspects of their role and the time taken for each task in that week. The mean amount of total time was 7.6 hours per week, that is, approximately 1.1 hours per professional learning team member, on average.
The diaries indicated that only three coordinators spent any time during that week on within-class support for other teachers in the team. This totalled four hours. However, the 578 visits made to schools by the research team in support roles over the three years meant that they provided the kind of mentoring (particularly in classrooms) that would ideally be carried out by an Early Numeracy Coordinator. This individual mentoring is particularly crucial for an area like mathematics where many teachers lack personal confidence with the subject.
1.11.2 Monitoring and assessment The ENRP one-to-one interview was particularly powerful in the following respects: • It provided detailed, reliable information on what children knew and could do, collected in an
enjoyable way for young children. • It provided a means of measuring growth over time. • It indicated particular areas of strength and difficulty for young children. • It helped to identify those children who may benefit from additional assistance and intervention. • It provided an important basis for planning and teaching. • The kinds of questions asked during the interview (being highly revealing of children’s thinking)
provided a model for questioning during classroom interactions. The ongoing assessment tasks provided by the research team provided the opportunity for teachers to update the information they had on individuals and groups from the interviews at the start of the year.
Summary of the Early Numeracy Research Project Final Report 15
This information complemented the data collected by teachers using a variety of formal and informal tools.
1.11.3 Classroom teaching programs
One of the most important changes noted in classroom teaching programs was the knowledge and use of the ENRP Growth Points. When asked to state the greatest change in their teaching as a result of the project, the responses of 63 out of 220 teachers could be summarised as “growth points inform planning”. 74% of trial school teachers began their planning of lessons with mathematical content as the basis of their lessons, compared with 65% in reference schools. The most common teaching practices that trial school teachers indicated as changes over the course of the project were: • more open-ended tasks and activities; • more probing questioning/ asking why and how/ valuing children’s thinking; • challenging and extending children/ higher expectations; • more practical/ hands-on activities; and • greater emphasis on reflection/ sharing.
The data collected in relation to classroom teaching programs complements that of the individual case studies and that collected under School and Class Organisation.
1.11.4 Professional learning teams Each trial school was required to establish a professional learning team for numeracy at P-2, consisting of all teachers working in numeracy in Prep-2. Coordinators’ folios provided the major data source for information on the operation and development of these teams. Teams varied considerably in terms of their size, their composition over the project, the regularity of their meetings, and their cooperation and independence.
Mathematics became a major focus of professional interactions over the course of the project. Coordinators and principals reported teachers focusing on student needs based on assessment data, being enthused after professional development events, increasing the sharing of ideas, experimenting with their practice and incorporating new techniques. Parent evenings, both informational and family maths type evenings tended to unite teams and were very successful.
During the second and third years, planning was the major focus of meetings of professional learning teams, as was incorporating the large number of new teachers into the project each year.
In summary, data from principals, coordinators and teachers confirmed that participation in professional learning teams stimulated growth in four main areas: • Knowledge about the teaching and learning of mathematics. • The capacity to cater for the needs of individual students. • Attitudes to, and personal confidence with mathematics. • The level of teamwork and collegiality.
1.11.5 School and class organisation Data were collected on assignment of children to classes, grouping strategies, time spent on mathematics, and class sizes.
Summary of the Early Numeracy Research Project Final Report 16

In the final year of the project (2001), 52% of trial school classes were straight grades, with 48% being composite. The most common arrangement was a Grade 1/2. 29.6% of all classes had this composition, with 25.7% of classes being Preps. Data were collected on the ways in which trial school teachers organised their classes during the mathematics lesson. When asked in the final weeks of the project to indicate the most common way in which they organised their students to work on tasks in the mathematics classroom during the main part of the lesson, there was an almost even split between • individual work, with discussion being allowed or encouraged (33.5%); • children working in pairs (33.0%); and • children working in larger groups (two or more) (33.5%).
74.4% of teachers indicated that they used all three working group sizes at different times. Teachers were asked to identify the most common way in which groups were formed when children worked in pairs or other small groups. The distribution of the various forms of group assignment were • heterogeneous (31.5%); • homogeneous (28.5%); • heterogeneous with one special group (26.0%); and • student choice (14.0%).
Only 7.6% of teachers indicated that they used only one of these options. There was considerable variety in the ways in which groups were used and in how children were assigned to groups. Teachers indicated that the content and activities for the day were a major factor in these decisions. For example, one case study teacher paired “strong literacy children” with less strong literacy children for a mathematical activity with a high literacy demand.
Data were collected on the time spent on teaching mathematics. The majority of teachers (65.7% in trial schools and 56.1% in reference schools) formally allocated one hour per day to the teaching of mathematics. Mean times were 297 minutes per week for trial schools and 280 minutes per week for reference schools. The difference of three or four minutes per day does not seem great, but the cumulative effect over the school year may be.
Class sizes decreased over the course of the project, probably due to DEET policy in this area. In 1999, 11.9% of classes were 30 or more, while this percentage was 1.0% by 2001. There was a correlation of -0.23 between class size and student growth in 2001.
1.11.6 Intervention and additional assistance
Within the ENRP, two strategies were used for assisting low-attaining students. The first was to provide high quality professional development for all teachers to increase their professional knowledge about assisting such children in the classroom. The second strategy was to withdraw individuals or groups of three low-attaining students for 30 minutes each day, to participate in a specialised intervention program.
Summary of the Early Numeracy Research Project Final Report 17

During 2000 and 2001, schools were invited to nominate a Mathematics Additional Assistance Specialist Teacher. These teachers received five full days and two shorter sessions of professional development over the year, to prepare them to implement an intervention program. Twenty-one teachers trained in 2000; 14 teachers in 2001. The professional development focused on identifying those students who might benefit from such assistance, and appropriate experiences to accelerate children’s number learning.
The programs at schools involved daily 30-minute sessions for individuals and/or groups of three or four, at Grade 1 and/or Grade 2, for 10 to 20 weeks. Within the sessions, there was an emphasis on problem solving, activities focusing on the four number domains, and a time of reflection.
There was no clear answer as to which program structure was most effective. The effectiveness of the individual and small group program structures varied according to mathematical domain and grade level. Both program structures accelerated children’s learning in both grade levels and in all domains, with one exception. The individual program structure did not accelerate children’s progress in the Addition and Subtraction Strategies domain.
1.11.7 Home, school and community partnerships
During the ENRP, schools used a variety of strategies to build links with the school community.
All schools conducted information evenings in 1999, which were well attended. More than half of the schools reported more than 50% of parents attending. These evenings outlined the purposes of the ENRP, outlined the quality of the information gained through one-to-one interviews, explored interactively how and why mathematics teaching was changing, and discussed examples of the kind of everyday family activities that could support the mathematics learning of primary-aged children.
Most schools also ran family maths evenings each year, in which parents and children engaged together in a variety of activities, often themes such as football, the Olympics, and a teddy bear night.
20 schools reported using parent helpers in 2001, with one school running a four-session Parents as Tutors course. The Parents as Tutors program was attended by 32 and 35 parents in 2000 and 2001 respectively.
A third of schools used take-home materials such as maths treasure chests or bags or commercial materials.
1.11.8 Beliefs and understandings
Hill and Crévola claimed that teachers’ beliefs and understandings underpinned all of the Design Elements. Within the ENRP professional development program, there was considerable emphasis on four main aspects of teachers’ knowledge: • knowledge of how children learn mathematics and how mathematical understanding develops; • knowledge of individual learners of mathematics; • pedagogical content knowledge; and • knowledge of mathematics. At the beginning and end of the project, teachers were asked to locate their personal background knowledge of mathematics and their confidence in teaching mathematics on a scale from 1 to 10. The means were 6.31 (entry) and 6.82 (exit) for personal knowledge, and 6.94 (entry) and 7.93 (exit) for confidence in teaching mathematics, with the growth in both cases being statistically significant (p < .001). The number of teachers whose responses were categorised as being confident or positive about
Summary of the Early Numeracy Research Project Final Report 18

Summary of the Early Numeracy Research Project Final Report 19
teaching mathematics increased from 47 to 103, while those claiming to be lacking in confidence decreased from 26 to 11.
In response to the question at the end of the project about greatest changes in teaching practice, interestingly many teachers focused on their knowledge. 49 out of 220 identified their enhanced knowledge of individual student understanding, while 28 nominated increased confidence in teaching mathematics. In discussing their knowledge of individual children’s mathematical understanding, many teachers spoke of the general knowledge of children’s understanding provided by the framework of growth points, and the specific knowledge of children provided by the interview.
In relation to beliefs about the nature of mathematics, there was considerable change over the course of the project. In completing the sentence, “mathematics is ...”, the following differences were evident: • 52 teachers volunteered statements relating to affective aspects of mathematics (e.g., enjoyment,
challenge), compared to 20 at the start of the project; • 60 teachers made statements in relation to mathematics being connected and problem solving, while
none had done so in the entry questionnaire.
In general, the descriptions of the nature of mathematics were far broader at the end of the project than at the start. In terms of teaching role, at the end of the project, many more teachers commented on their role in facilitating sharing of ideas/ guiding/ modelling, with an increased emphasis on evaluating children’s understanding, and their role as motivating and inspiring children to learn mathematics.
There were important and interesting changes in teachers’ expectations of what children knew and could do. On a whole range of sample items (e.g., knowing that 78 is 7 tens and 8 ones), teachers were asked, at the beginning and end of the project, for each grade level they were teaching, to predict whether all, most, some or none of their children would know the particular item at the beginning and end of the school year. An important overall finding was that teachers were far more likely to claim that some or most of their children could do a particular item, with far fewer being classified as none or all. This appears to be an indication that increased teacher knowledge, through their own interview data and project data overall, led teachers to have a much clearer and more accurate picture of what children know and can do, with a recognition of the wide spread of capabilities of their children, but also an increased recognition that some items (e.g., “recall and use addition and subtraction facts to 20”) are very difficult for most children in P-2.
1.12 In Summary
The ENRP framework of growth points provided a general structure for understanding young children’s developing mathematical skills and concepts. The interview provided specific information on what individuals and groups of children knew and were able to do. Professional development, including a clear focus on the Design Elements, was provided at the central, cluster, school and classroom levels.
The framework and the interview, together with interactive professional development, provided the opportunity for teachers to build their own knowledge of mathematics and the teaching of mathematics. The data from the ENRP show clearly that the result was enhanced learning for children, positive attitudes to the subject by children and teachers, and many insights from this research that can now be shared with a wider audience.