early network events in the later success of...
TRANSCRIPT

EARLY NETWORK EVENTS IN THE LATER SUCCESS
OF CHINESE ENTREPRENEURS
(pre-print, to appear in Management and Organization Review)
May, 2017 © Ronald S. Burt* and Sonja Opper**
*University of Chicago Booth School of Business, Chicago, IL 60637
Tel: +1 312-953-4089, [email protected]
**Department of Economics, Lund University, Lund, Sweden Tel: +46 46-222 7906, [email protected]
ACKNOWLEDGEMENT: Ronald Burt is grateful to the University of Chicago Booth School of Business for financial support during the work reported here. Sonja Opper is grateful to the Marianne and Marcus Wallenberg Foundation for support of this work. We are grateful to the Jan Wallanders and Tom Hedelius Foundation for the grant to Sonja Opper that funded the fieldwork in China providing the data analyzed here, and to Na Zou and Ke Zeng for assistance coding event descriptions into kinds. This manuscript, supplement materials, and the network instrument in English are available online (and, for variation on the theme, the questionnaire with event name generators used in the 1998 GSB Alumnae Survey, GSBAS1.pdf): http://faculty.chicagobooth.edu/ronald.burt/research.

Early Network Events and Later Success, Page 1
EARLY NETWORK EVENTS IN THE LATER SUCCESS
OF CHINESE ENTREPRENEURS
ABSTRACT
We trace the social networks around Chinese entrepreneurs back to their firm’s
founding to learn about the role early events play in the later success of a business. We
use name generator questions paired with career history questions to identify “event
contacts” missed by the usual focus on current business. We draw four conclusions
from interviews with a large, stratified random sample of entrepreneurs: (1) Relations
with event contacts stand out for guanxi qualities of high trust relatively independent of
the surrounding network structure, and are critical to distinguishing more successful
entrepreneurs from the less successful. (2) The substance of a significant event
matters less than the fact that the entrepreneur deems it significant. (3) When family is
turned to for support it is most likely at founding, but family is not the usual source of
support at founding. Rather, entrepreneurs turn to people they have known for many
years, typically people beyond the entrepreneur’s family. (4) The transition from
founding to first significant event stands out as distinctly consequential for later success.
Entrepreneurs who turn for help on their first significant event to a person separate
from, but especially close to, the founding contact are more successful in their business
development. That early move is not visible in the later network around the
entrepreneur.

Early Network Events and Later Success, Page 2
Social science research and personal anecdotes offer many answers to the
question of who entrepreneurs turn to during significant events in the history of their
business: There are professional stories: Turn to the most recognized or most
experienced experts. There are social stories: Turn to the best people available at a
good price, such as family professionals or trusted friends who owe a favor. There are
contingency stories: Turn to people most appropriate to the specific opportunity or issue
now presenting. Take the question to China around the turn of the century, and the
answers become more complex as rapidly changing organizational needs during the
life-cycle of a firm coincide with dynamic change in the firm’s surroundings and
institutional environment.
What constitutes a “significant” event in the eyes of the entrepreneurs who built
their businesses during China’s ongoing market reforms can therefore vary over time.
After all, private companies have only recently attained full legal rights and constitutional
equality with public ownership firms, and continue to experience limited access to
scarce resources such as credit, land use rights, and skilled human capital (Nee and
Opper, 2012). Similarly, the pool of accessible experts to whom entrepreneurs can turn
for help and support could have changed considerably over time. Who was even willing
to help entrepreneurs starting up new organizations in the absence of fully developed
institutional support for private enterprise? Are family relations offering the most reliable
source of support for entrepreneurial success in China (Huang, 1990)? Should one
involve prominent people such as party or government officials to gain regulatory
protection and access to state-controlled resources (Li, Meng, Wang and Zhou, 2008;
Nee and Opper 2010; Peng and Luo, 2000)? Or should one rather abstain from their
involvement? Equally important: Should one turn to the same trusted individuals again
and again, or turn to a broader set of people? And if contact variation matters, should
new contacts be embedded in the emergent network or does the inclusion of distant ties
isolated from the emergent cluster of trusted contacts offer advantages for building the
business?
To date, there have not been network data from which authoritative answers
could be derived on the role of early business events, contacts involved and their
influence on future business success. This is in spite of the apparent influence of early

Early Network Events and Later Success, Page 3
events and related event contacts on the further development of business networks.
What is needed to explore the underlying dynamics, is a fine-grained account
documenting not only current contacts, but also incorporating the entrepreneur’s history
of contacts, that have been crucial in the company development over time and may or
may not continue to be an active source of support. Such approach would also be
helpful to test the more general assumption that acting on network advantage
cumulates over time as individuals learn to identify rewarding opportunities and how to
bring them to fruition (Burt, 1992).
To explore how early network experience shapes the evolving process of network
emergence and advantage, this study employs novel data — combining both current
contacts with historic event data — describing the social networks around 700 Chinese
entrepreneurs whose businesses are a stratified random sample of private enterprises
in three provinces surrounding the Yangtze River Delta: China’s financial center,
Shanghai, with Nanjing the capital of Jiangsu Province to the north, and Hangzhou the
capital of Zhejiang Province to the south. The sample entrepreneurs founded their
businesses around the turn of the century (specifically, year 2000.2 on average), and
are a 2012 continuation of samples surveyed in 2006 and 2009 by Nee and Opper
(2012). All of the sample firms are entrepreneurial ventures, but 79% of them are in
2012 mature ventures in the sense that they had survived more than eight years. The
three provinces account in 2013 for 20.2% of China’s gross domestic product, and
31.9% of China’s imports and exports. We begin with a quick introduction to our data
on networks.
NETWORK DATA Figure 1 is an example of the kind of network data we have on each entrepreneur. The
respondent (large square in the center of the figure) founded his business 13 years ago
in Zhejiang province, and grew it to 467 employees by the time of the survey. He
named nine contacts, largely interconnected by close relations (thin line) with a few
especially close relations (bold lines). Two contacts are close together in the figure to

Early Network Events and Later Success, Page 4
the extent that the relation between them is strong, and their relations with others are
similar (spring embedding, Borgatti, 2002).
Our network data were obtained with name generator and name interpreter items.
Such items are routine in network survey research (Marsden, 2011), in network surveys
of management populations in particular (Burt, 2010:281ff.), and have precedent in
China (Ruan, 1998, the 2003 Chinese General Social Survey, Bian and Li, 2012; Xiao
and Tsui, 2007; Batjargal et al., 2013). The survey instrument and materials are
available in the original English (see acknowledgement note).
Name generators are survey questions that elicit the names of individuals with
whom the respondent has specified kinds of relationships. We used the six name
generators listed to the left in Table 1. For example, each respondent was asked to
name the “three or four people who have been most valuable to your business activities
this year.” To stretch the network data back into a respondent’s history, we asked about
contacts associated with significant events back to the firm’s founding. We do not
provide an objective definition of what makes an event “significant.” We want to capture
what the respondent deems significant, not what we deem significant. However, we do
limit significance to events important in the overall “history of the company
development.” An example-timeline in the questionnaire further clarifies that we are
looking for milestone events in the company’s development. The idea is to create a time
line of concrete events, and then ask for the names of contacts who were most valued
during each event. In response to the first two name generators in Table 1, all
respondents named a contact most valuable when the business was founded, then
most named five subsequent events, and a person most valued for help during the
event. People named in association with significant events we reference as “event
contacts.” We refer to people named on any of the other four name generators in Table
1 as “current contacts,” which are the usual focus of business network research. A
contact can be cited on more than one name generator, so it is often the case that a
current contact is also an event contact (contacts 5 and 6 in Figure 1).
——— Figure 1 and Table 1 About Here ———
Early Network Events and Later Success, Page 5
Significant events cited during the interview with the Figure 1 entrepreneur are
listed on a time line to the upper-left in the figure. Contact 1 was cited as the most
valued person in founding the business. Securing the first overseas customer was a
significant event in the second year of the business, and person 2 was cited as most
valued through that event. Significant events continue across the time line, each event
eliciting the name of a person most valued during the event. Some respondents cite the
same people again and again (especially family), but the respondent in Figure 1 named
a different person for each event.1 As most valued current contacts, most valued
employee, and most difficult person, the respondent cited the five people indicated by
dark dots in Figure 1.
Name interpreters are questions that ask the respondent to describe relations with
and among the cited contacts. We used the seven name interpreters listed to the right
in Table 1. We asked respondents how long they had known each contact, how often
they met with each contact, and so on. Trust was measured by asking the respondent to
rate his or her trust in each contact.2 To scale relations, we asked respondents whether
1Family are not often cited by the entrepreneurs (8.31% of cited contacts are nuclear or
extended family), but when cited, family members are often cited multiple times, and for significant events. A regression model with respondent fixed effects predicting number of events in which a contact is cited from a dummy variable distinguishing family contacts returns a 1.15 coefficient and 20.53 test statistic. A logit model with respondent fixed effects predicting from the family variable which contact was valued in founding the business returns a 2.39 coefficient and 20.59 test statistic.
2The Chinese word "信任” in the trust question in Table 1 is a term as ambiguous in Chinese as "trust" is in English. Interviewers were trained to guide respondent queries about what we mean by trust in the following way: “Consider the extent to which you trust each of the listed people. For example, suppose one of the people asked for your help. The help is not extreme, but it is substantial. It is a level of help you cannot offer to many people. To what extent would you trust each person to give you all the information you need to decide on the help? For example, if the person were asking for a loan, would they fully inform you about the risks of them being able to repay the loan? If the person was asking you give a job to one of their relatives, would they fully inform you about their relative's poor work attitude or weak abilities, or other qualities that would make you prefer not to hire the relative?” In this situation, it is valuable to know for our network analysis that trust scores vary primarily within rather than between networks. Trust variance across relationships is 60% network differences within respondents, 10% individual differences between respondents, and 30% random error (Burt, Bian, and Opper, 2017).

Early Network Events and Later Success, Page 6
their relation with each contact was “especially close,” “close,” “less close,” or “distant,”
and asked them to describe whether the connection between each named contact was
“especially close, “distant,” or something in between (“neither distant nor especially
close”). With each connection in a respondent’s network scaled from 0 to 1, we
computed network metrics often used in studies of trust and achievement (e.g., Burt,
Kilduff, and Tasselli, 2013, for quick review). The nine contacts in Figure 1 form a
network slightly larger and less dense than the sample average (respective z-scores of
1.77 and –0.72). Size adjusted for density shows the effective size of the network is
broader than average (5.86 nonredundant contacts, 1.53 z-score), and the network
constrains the respondent less than is average in the sample (.371 network constraint,
-1.38 z-score).
EVENT CONTACTS The entrepreneurs cite a total of 4,464 contacts. Figure 2 shows that current contacts
exclude many people valued in significant events. About half of current contacts are
people cited as most valued during significant events in the history of the business
(1,564 of 3,123). The current network excludes, for the average entrepreneur, about
two contacts who were only valued during significant events in the history of the
business. Those two excluded contacts are a 43% extension on current contacts (1,341
divided by 3,123).
The balance of event and current contacts in Figure 2 is confounded by question
order. The Chinese entrepreneurs were presented with event name generators before
being asked about current contacts, so they were primed to think about the history of
the business when naming contacts significant in this year’s business activities.3
3Survey network items, like most survey questions, are affected by respondent mood
when interviewed. Bailey and Marsden (1999) show that preceding the General Social Survey network questions with questions about the respondent's family predispose people to think about family issues when naming network contacts. Smith, Menon, and Thompson (2012) show that people exposed to material about losing one’s job before a network interview, are more likely to report a network of densely interconnected contacts.

Early Network Events and Later Success, Page 7
Therefore, the ratio of event-only contacts to current contacts is probably higher than
displayed in Figure 2.
——— Figure 2 and Table 2 About Here ———
Event contacts are cited in association with the history of the business, so it could
seem reasonable to discuss them as contacts from an entrepreneur’s past, but more
than half of them are currently met daily. We measured the strength of relations with
event and current contacts in terms of emotional closeness, duration, frequency, and
trust (Table 1). Table 2 shows that the entrepreneurs have trust in event contacts
higher than they have in contacts only in their current network, are more likely to cite
event contacts as “especially close,” and have known event contacts for more than a
dozen years on average, versus the five and half for which they have known contacts
only in their current network. Regardless, event contacts continue to be a feature in
current networks. About half of event-only contacts are met daily (43.65%), which is
about the same as current-only contacts (45.48%). Rather than saying event contacts
are stronger ties than current contacts, it is more accurate to say that people cited as
both event and current contacts are stronger ties than people cited for either one alone.
Kinds of Events by Content Respondents gave a brief description of each event they cited. A Mainland Chinese
graduate student coded the descriptions on two characteristics (with the coding
reviewed by the coauthor fluent in Chinese): What is the broad substantive content of
the event, and is the event about a loss to the business, or an opportunity for gain?
——— Table 3 About Here ———
We began with 14 content categories of events. Some were combined because of
low frequency. Some were combined to remove unreliable distinctions. The final nine
are listed in Table 3 with example respondent descriptions. The first kind of event is
founding, about which each respondent was asked directly (name generator is given in
the first row of Table 3). Event categories are listed in Table 3 in the order of when they
occurred on average. There is one founding event per respondent, which defines year
one. The next significant event tends to be one of three kinds, clustered around the fifth

Early Network Events and Later Success, Page 8
year of business: There is a problem with a supplier. The business gets its first big
customer contract, domestic or overseas. There is a financial problem.
The next significant events, a couple years later, tend to be inside and outside the
business. Outside the business, there is an award or affiliation with a business
association, or a significant exchange with the government (e.g., preferential treatment
regarding tax or land, certification for broader class of business, sometimes imposition
of a fine or restriction). The more often-cited kinds of events are inside the business.
Most concern management issues, but a substantial minority concern technology
adopted to improve efficiency or sell new products, so technology events are broken out
as a separate kind of event. The business is up and running by year eight, when
general market conditions are the last cited events.
Most of the cited events concern growth — big contracts, expanded production,
secure revenue or supplies. The two exceptions are finance, which is often an
explanation for the business losing money (46% concern loss) and market forces (92%
concern loss). The frequent concern for loss associated with market development
events is likely a result of the survey timing, which coincided with the global economic
crisis.
Kinds of Events by Timing
The average year in which a kind of event occurs varies between businesses, and of
course varies with the age of a business. A business founded four years ago cannot yet
have an event in year eight. Table 4 shows how events differ by the order in which they
are reported (columns) and the year in which they occur (rows). The totals in the
bottom row of Table 4 show one founding event for each respondent (700 events), one
first significant event per respondent (700 events), and so on, down to the 675
respondents who cited a fifth significant event. The “Founding” column shows all 700
founding events in year one. The first significant event tends to occur in the first or
second year of a business (276 plus 255 constitute 76% of the 700 first significant
events), but timing varies: Six respondents said their first significant event occurred after
they had been in business for a decade or more.

Early Network Events and Later Success, Page 9
There is no objective standard defining an event significant. We focus on the
order of events because respondents are free to define what constitutes a significant
event, and they typically selected events across the life of their business. The longer the
business has been in operation, the more spread out the events.4 The pattern is only
slightly different with business age held constant.5
——— Table 4 and Figure 3 About Here ———
Figure 3 is a guide to more and less strong connections associated with events.
Event timing is measured on the horizontal axes: the order in which an event is cited,
the year in which the event occurs, then the point in the history of a business in which
the event occurs (event year divided by firm age, to control for newer versus older
businesses). We combine events occurring more than 10 years after founding because
4This observation is based on a cluster analysis of time profiles. We created a time profile
for each respondent defined by the years in which events occurred. For example, the time profile for the Figure 1 entrepreneur is 2, 3, 7, 10, 13, corresponding to the years in which the entrepreneur's five significant events occur. The squared Euclidean distance between two profiles is small to the extent that events in each profile occur in the same years after founding. Cluster analysis of profiles for the 675 entrepreneurs who reported five events, using the Ward minimum-variance method in Stata (see supplement Figure S1) reveals three distinct clusters: a cluster of profiles that occur within the first decade of business, a cluster of profiles that occur within the first 15 years of business, and a cluster of profiles that occur within the first 22 years of business. Within each cluster, events are about evenly distributed over time (mean year in which each event occurs for each cluster is in the inset box to the right of the cluster dendogram in Figure S1). The first cluster is young businesses (8.84 years old on average), the second is older businesses (13.95 years old on average), and the third is still older businesses (22.10 years old on average).
5Business age is held constant by measuring events as a proportion of business age. For example, an event .5 in proportional time occurred half way between founding and the 2012 survey. Cluster analysis of proportional time profiles (same method as in the previous footnote and reported in supplement Figure S2) also reveals three clusters. Profiles for each cluster are reported in the inset box to the left of the cluster dendogram in Figure S2. Events are distributed about evenly over time, differing in the first event: The first cluster spreads over the whole life of a business. The second cluster begins with the first event late (about a third of the way into the business’ life). The third cluster begins at about the same time as the first cluster, but with a larger gap between the first and second events. We tested for trust and success association with time to first event. A control for time to first event adds nothing to the prediction of trust in Table S1 (-1.68 t-test for years to first event, 0.37 t-test for proportional time to first event), nothing to the prediction of success in Table 6 (respective t-tests of 1.00 and 0.41), and nothing to the prediction of success in Table 7 from networks limited to current, founding, and Event 1 contacts (respective t-tests of 1.28 and 0.63). Therefore, we focus in the text on event order, rather than physical or proportional time.

Early Network Events and Later Success, Page 10
strength of tie measures do not change much after the first decade. To simplify the third
graph, portions of business history are rounded to the closest lower decimal. For
example, percentages over the “0.0” score are averages across all events that
happened between founding and before the business reached 10% of its current age.
The vertical axes measure in four ways the strength of the respondent’s relation
with the person cited as most valued during an event — average number of years
known as of the survey in 2012 (left axis), then percent cited for the highest level of
trust, percent “especially close” to the respondent, and percent who are members of the
respondent’s family (right axis). Years known, and family can be assumed to predate
the event for which a person is cited as helpful, but trust and emotional closeness are
recorded for 2012, during the survey interview, so they are likely to have been affected
by the contact’s help during the cited event, rather than vice versa.
There are two patterns in Figure 3. First, founding is a special event unto itself.
Founding is when family is most likely to be cited for help, and founding is associated
with the highest levels of trust and emotional closeness with people the entrepreneur
has known for many years. Second, the first significant event is more like founding than
are any of the subsequent events. Strength of tie to the person cited for help during the
first significant event after founding is discernibly weaker than the tie to the person cited
in association with founding, but the first-event tie is also discernably stronger than ties
with people cited in association with later events. The results in Figure 3 are well
aligned with research on trust. Beneficiaries of pro-social or cooperative behavior are
typically more inclined to trust the other than those who have not experienced such a
critical test (Kollock, 1994). Experience of fair, and potentially advantageous behavior
can solidify trust towards the other (Hardin, 1991). Such effects can be pronounced
when help is in short supply and therefore most valuable. The early stages of firm
development, typically characterized by weak organizational legitimacy (Suchman,
1995), standard problems of the liability of newness (Stinchcombe 1965) and—in the
case of China—weak institutional support providing necessary access to key resources

Early Network Events and Later Success, Page 11
(Nee & Opper, 2012; Peng & Luo, 2000; Xin & Pierce, 1996), could therefore present
key stages of network formation.
Kinds of Events in Broader Context
We broaden the frame of reference in Figure 4, which is a classical multidimensional
scaling of relationship characteristics. Two characteristics are close together in Figure 4
to the extent that they often occur in the same relationships.6 Included are the kind of
event cited, the year it was cited, the kind of person cited, and categories of relationship
strength in terms of frequency, years known, trust, and emotional closeness. The figure
would be cluttered if verbal descriptions were included for each of the 48 characteristics,
but we display a few to make it easier to make sense of the space.
The entrepreneurs most differentiate their relations from positive to negative,
which is the horizontal axis in Figure 4. Four broad categories of relationships are
distinguished by the vertical axis cutting across the horizontal, with more personal
relations at the top of Figure 4, and less personal at the bottom. The two dimensions,
positive-negative versus personal-work, have also been reported in American and
French management populations (Burt, 2005:52; 2010:287).
Relations in the upper-right of Figure 4 define the entrepreneur’s core network, his
or her “guanxi circle” (Luo, Cheng, and Zhang, 2016). Guanxi ties are distinguished by
three simultaneous qualities: (1) familiarity, intimacy, (2) trust, and (3) mutual obligation
(Bian, 1997; see Bian, Forthcoming, for analytical review of the literature; see Luo,
Huang, and Wang, 2011, for meta-analysis; and Chen, Chen, and Huang, 2013, for
broader review). In the upper-right quadrant of Figure 4, are contacts from the
respondent’s family (item 28), people “especially close” to the respondent (item 40),
6We measure the tendency for two characteristics to appear in the same relations with a
Jaccard coefficient, which is the number of relations in which the two characteristics occur together, divided by the total number of relations in which either occurs. The two-dimension solution in Figure 4 fits the data well. The first dimension is defined by the eigenvector associated with an eigenvalue of 5.63. The second dimension corresponds to an eigenvalue of 3.23, and the third to a 1.64 eigenvalue. The first two dimensions together describe 79% of the association variance, and are drawn in Figure 4 in proportion to their eigenvalues.

Early Network Events and Later Success, Page 12
people in whom respondents have the highest trust (item 36), and importantly, the
people cited as most valued during the business founding and the first significant event
in the history of the business. Burt and Burzynska (2017: Table 6) show that relations
with the people cited as most valued during the business founding can be treated as
guanxi ties. None of the event categories listed in Table 3 is close to the founding and
first event in Figure 4, which means that the businesses have diverse beginnings — no
one kind of event is characteristically the first significant event.
——— Figure 4 About Here ———
The lower-right quadrant of Figure 4 contains positive work ties. Kinds of events
are clustered around the second, third, fourth, and fifth significant events in the history
of the business. We shaded an area surrounding the cluster. Kinds of events in the
cluster are management events (item 11), technology events (item 13, production
improvements and new products), and customer events (item 8, largely achievements
by the sales department). Also near is the entrepreneur’s most valued employee (item
24), indicating that the valued employee is often cited on Events 2, 3, 4, and 5. Further
down in the lower-right quadrant are people valued in this year’s business activities
(item 22), people met daily (item 41), people with whom the respondent is emotionally
close, but not especially close (item 39), and people in whom the respondent has high
trust, but not the highest level (item 35).
The lower-left quadrant contains suspect ties, relations with people of whom the
respondent is wary. Here is the person cited for creating the most difficulty for the
respondent this year (item 23), people in whom the respondent has the lowest level of
trust (item 33), people from whom the respondent feels emotionally “distant” (item 37),
people met less than monthly (item 37), and people the respondent has known for the
shortest period of time (item 45).
The upper-left quadrant of Figure 4 contains less-close personal ties. These are
positive relations, but they are less intimate than the guanxi ties to the further right.
Here are people known since childhood (item 26), neighbors (item 31), members of the
Communist Party (item 32), and so on. Here too are events related to supplier issues

Early Network Events and Later Success, Page 13
(item 7), financial issues (item 9), collaboration with other businesses (item 12), dealing
with the government (item 10), and general market issues (item 14). We shaded the
area around the events to highlight the cluster, which combines events concerning the
world outside the business and sets the type of contacts (less close personal ties)
clearly apart from the contacts involved in internal affairs (work ties) and those crucial at
the founding stage (guanxi ties).
Family Versus Long-Standing Relationships
Given numerous texts emphasizing the central role of family in Chinese life, and the
family-like qualities ascribed to guanxi ties in particular (see above references on the
meaning of guanxi ties), it is tempting to expect a network process in which
entrepreneurs rely on family to get the business going, then turn to less-close friends
and acquaintances, for help with subsequent events (e.g., Guo and Miller, 2010).
Consistent with that image, Figure 3 and 4 show that family often helped in founding the
businesses. Thirty-one percent of entrepreneurs in Figure 3 cite a family member as
the most valued contact in founding the business, and family is most likely to be cited as
a valued contact during the first couple years of a business. Family, founding contact
and contact most valued in the first significant event are together in the upper-right
guanxi quadrant of Figure 4.
While it is correct to say that when family is cited as a valued contact, it is cited
early in the history of a business, it is not correct to say that the entrepreneurs typically
turned to family when founding their business. Thirty-one percent of entrepreneurs
citing family as founding contacts means that a large majority, 69%, of entrepreneurs
cite non-family members as their most valued contact in founding the business. As
much as family members are a resource on whom the entrepreneur can legitimately
make a claim, they are also people to whom the entrepreneur has a social
responsibility. Entrepreneurship is by definition a risky venture, all the more so in China
at the turn of the century under a legal system inexperienced with private enterprise and
protecting property rights. Many of the respondents are cautious not to tie up all family
resources in the same venture in order to hedge their risks in an uncertain environment.

Early Network Events and Later Success, Page 14
The network structure confirms this view. The majority of entrepreneurs found help
outside the family, indeed outside the usually-suspected sources of social support in
China, such as childhood friends, classmates, neighbors, or connections to other
institutions such as the military or the Communist Party.
——— Table 5 and Figure 5 About Here ———
In fact, the best predictor of who an entrepreneur cites as most helpful in founding
the business is not a social category or an institution; it is how long the entrepreneur
and contact have known each other. Table 5 contains a logit equation predicting which
of an entrepreneur’s contacts is cited for help in founding the business. The equation is
estimated with respondent fixed effects, so respondent differences such as network size
and business age are held constant to focus on the identity of contacts cited for help in
founding the business. Founding contacts tend to be people still met often at the time of
the survey (-3.21 test statistic for days between meetings), and people beyond the
interconnected current contacts (-2.66 test statistic for structural embedding). None of
the seven kinds of contacts distinguished have any association with a contact being
helpful at founding. Particularly noteworthy are the irrelevance of characteristics often
discussed as guanxi – childhood friends, classmates, and family (test statistics of -1.62,
0.62, and 0.93 respectively). The dominant predictor of who gets cited as a founding
contact is duration — the number of years for which the respondent and contact have
known each other (16.87 test statistic).
The image of family is so central to the concept of guanxi relations that it is easy to
focus on the zero-order evidence of family importance in Figures 3 and 4, ignoring the
Table 5 evidence of family and other familiar institutions being irrelevant to founding
when network structure is held constant. In Figure 5, we focus on three key variables in
Table 5 to clearly integrate the two bits of evidence.
There is a strong zero-order tendency to turn to family for help in founding the
business. The solid bars in Figure 5 show the number of people cited as founding
contacts and the white bars show the number cited for other reasons. Across the solid
bars, family is 31.4% of founding contacts (220 divided by 700), as reported in Table 5,

Early Network Events and Later Success, Page 15
and people beyond the seven roles distinguished in Table 5 are 44.4% of founding
contacts (311 “no role” contacts). The logit regression predicting who gets cited for help
in founding the business shows a strong tendency to turn to family (5.4 test statistic),
and a tendency to avoid no-role contacts (-16.2 test statistic). No-role contacts are
more often cited than family as founding contacts, but the entrepreneurs so often turn to
no-role contacts for other reasons that no-role contacts have a negative association with
founding (no-role solid bars in Figure 5 are dwarfed by no-role white bars).
The association between founding and family is complicated by the fact that family
contacts tend to be people known for many years, and years known is the stronger
predictor of who an entrepreneur turns to for help in founding the business. Within each
entrepreneur’s network, we distinguish “long-standing connections” as people the
entrepreneur has known for longer than the average for his or her cited contacts.
Contacts known for fewer years are treated as “new connections.” Most of the family
contacts cited for founding are long-standing connections. Only 26 family contacts are
new connections, and most of them are not cited as founding contacts. Assuming some
amount of age homophily in each network, family contacts who are new connections are
going to be children, nieces, and nephews, who are not typically cited as most valued in
founding the business. The same pattern is true for people who are one of the other six
role categories in Table 5, and for contacts beyond the seven roles in Table 5 — the
people cited as founding contacts tend to be people known for a long time.
Corresponding to the logistic equation in Table 5, the logistic equation in Figure 5
predicting who gets cited for help in founding the business shows no tendency to turn to
family once years known are held constant (1.2 test statistic), and a strong tendency to
turn to people known for many years (17.7 test statistic). There is still in Figure 5 a
tendency to avoid no-role people, but the tendency disappears when we hold constant
the other network predictors in Table 5 (-3.1 test statistic in Figure 5 drops to -0.7 in
Table 5). We get the same results when we run the logistic equations in Figure 5 to
predict who gets cited as most valued in any of the significant events: family is often
cited when years known are not held constant (6.5 test statistic), but is negligible when

Early Network Events and Later Success, Page 16
years known are held constant (1.2 test statistic). In short, entrepreneurs often turned
to family for help in founding their business, but more precisely, they turned to all kinds
of people with whom they had long-standing relationships.7
TRUST AND EVENT CONTACTS Closed networks facilitate trust by creating a credible reputation cost for bad behavior,
so trust is more likely in relationships embedded in a closed network (Burt, 2005:Chps.
3-4, for review), and the trust association with network closure around the Chinese
entrepreneurs is similar to the association reported in research on manager networks in
the West (Burt and Burzynska, 2017: Figure 4). The key difference in the Chinese
networks is that a large proportion of relations have developed to a level that provides
trust independent of surrounding network structure. Trust between an entrepreneur and
certain colleagues does not depend on the threat of reputation cost, at least not
reputation cost measured by mutual friends before whom bad behavior would be
humiliating. Rather, the entrepreneur and colleague know one another so well that they
trust independent of the surrounding network structure.
Burt and Burzynska (2017) propose that such relations correspond to what is often
discussed in Chinese society as guanxi. Figure 6 displays their analytical framework to
distinguish guanxi ties. The trust expected in a relationship (T, the vertical axis), is
predicted by the extent to which the relationship is embedded in a closed network,
measured by the number of third parties connecting the two people in the relationship
(TP, horizontal axis). Such embedding can be measured in various ways by strength of
connection through third parties, but we get the same results with more sophisticated
7 We focus on “no role” contacts being none of the seven familiar sources of contacts
listed in Table 5 because that we know for certain. With less clarity, we know that many of them are or were co-workers. Table 1 lists “colleague” as one of the roles a contact could play, which the respondent’s worksheet defined as “you and the person have been employed in the same organization.” Of the 3,645 “no role” contacts in Table 5 and Figure 5, most are “colleagues” (79%). However, we failed in the questionnaire to distinguish between colleagues in the current organization versus former employers. The ambiguity should be removed in future data collection. We put a warning about this point on the downloadable network questionnaire in the acknowledgement note.

Early Network Events and Later Success, Page 17
measures, so we discuss closure simply in terms of the number of mutual contacts
connecting two people within the respondent’s network.
——— Figure 6 About Here ———
The dashed line in Figure 6 describes the level of trust a respondent has in the
current contacts not cited in association with a significant event in the history of the
business. Here, trust is associated with closure around relations with nonevent contacts.
The contact most valued in founding the business, in contrast, enjoys high trust
independent of the surrounding network, as illustrated with the solid line. The equation
and computed parameters show that relationships with founding contacts are a kind of
guanxi tie. Trust within relations with founding contacts is higher on average than is
trust within relations with nonevent contacts (γ = 2.874). The strong trust association
with closure for nonevent contacts (β = 1.170) is sharply decreased, indeed virtually
eliminated, for relations with founding contacts (λ = -1.011, making the slope of the bold
line 1.170 – 1.011, or 0.159). In short, trust within relations with founding contacts is
high and relatively independent of the surrounding network structure, making them
guanxi ties.
The parameters in the Figure 6 equation should be estimated with controls for
context and respondent differences. When we add controls for frequency, duration, and
respondent fixed effects, the estimates are smaller, but still statistically significant (.761
for slope β [14.85 t-test], 2.294 for level adjustment γ [16.04 t-test], and -.727 for slope
adjustment λ [-7.58 t-test]). When we run the estimation with G equal to 1 if a contact is
family, we get similar results showing — not surprisingly — that family is a guanxi tie
(1.593 for slope β [29.60 t-test], 2.651 for level adjustment γ [8.32 t-test], and –.892 for
slope adjustment λ [-3.80 t-test]).8
8We went one step further to see whether the Figure 6 association between trust and
closure is different in family firms versus other firms. We use the common definition of family firms: owner-operated firms in which the respondent’s spouse or children are employees. By this criterion, 254 of the 700 businesses are family firms. Respondents for family firms are almost twice as likely to turn to family in founding the business: 44% of family firms cite family as founding contacts, versus 24% of other firms (versus 31% for the whole sample, see the
Early Network Events and Later Success, Page 18
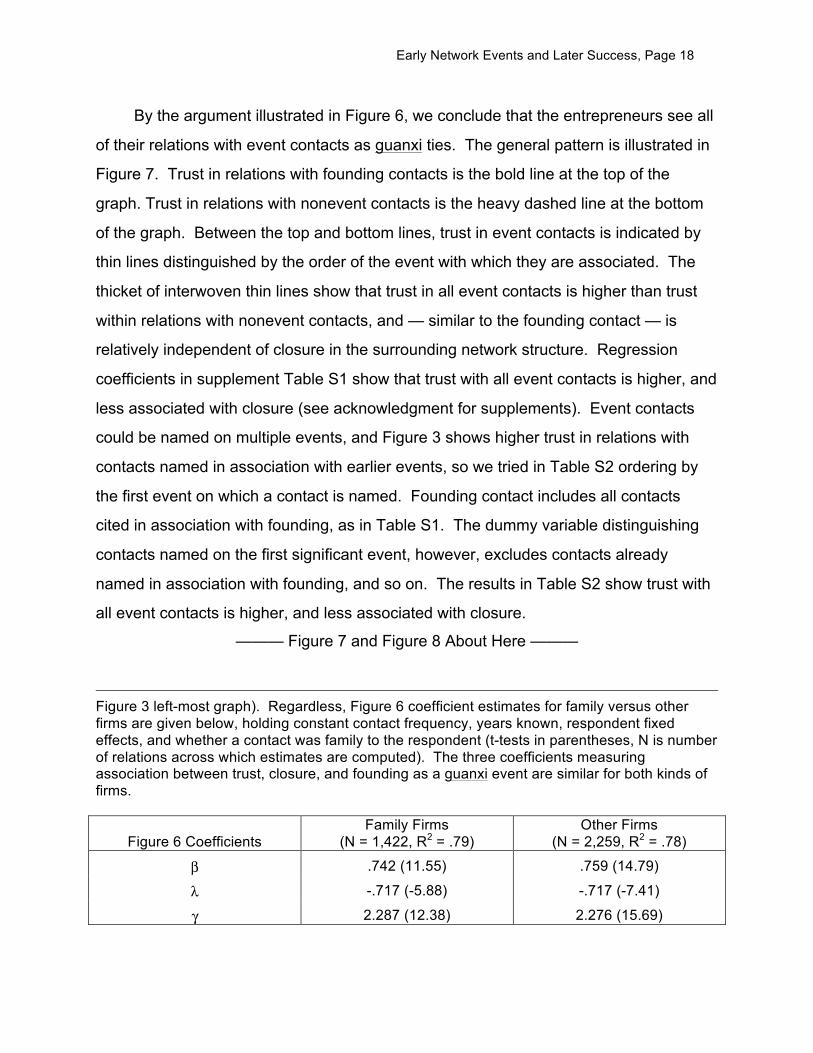
By the argument illustrated in Figure 6, we conclude that the entrepreneurs see all
of their relations with event contacts as guanxi ties. The general pattern is illustrated in
Figure 7. Trust in relations with founding contacts is the bold line at the top of the
graph. Trust in relations with nonevent contacts is the heavy dashed line at the bottom
of the graph. Between the top and bottom lines, trust in event contacts is indicated by
thin lines distinguished by the order of the event with which they are associated. The
thicket of interwoven thin lines show that trust in all event contacts is higher than trust
within relations with nonevent contacts, and — similar to the founding contact — is
relatively independent of closure in the surrounding network structure. Regression
coefficients in supplement Table S1 show that trust with all event contacts is higher, and
less associated with closure (see acknowledgment for supplements). Event contacts
could be named on multiple events, and Figure 3 shows higher trust in relations with
contacts named in association with earlier events, so we tried in Table S2 ordering by
the first event on which a contact is named. Founding contact includes all contacts
cited in association with founding, as in Table S1. The dummy variable distinguishing
contacts named on the first significant event, however, excludes contacts already
named in association with founding, and so on. The results in Table S2 show trust with
all event contacts is higher, and less associated with closure.
——— Figure 7 and Figure 8 About Here ———
Figure 3 left-most graph). Regardless, Figure 6 coefficient estimates for family versus other firms are given below, holding constant contact frequency, years known, respondent fixed effects, and whether a contact was family to the respondent (t-tests in parentheses, N is number of relations across which estimates are computed). The three coefficients measuring association between trust, closure, and founding as a guanxi event are similar for both kinds of firms.
Figure 6 Coefficients Family Firms
(N = 1,422, R2 = .79) Other Firms
(N = 2,259, R2 = .78)
β .742 (11.55) .759 (14.79)
λ -.717 (-5.88) -.717 (-7.41)
γ 2.287 (12.38) 2.276 (15.69)

Early Network Events and Later Success, Page 19
Figure 8 shows a similar pattern for the kind of event with which a contact is
associated. Kinds of events are numbered as in Table 3. As in Figure 7, there is a
thicket of interwoven lines for kinds of events in Figure 8. Statistical tests in supplement
Table S3 show that trust in event contacts is usually higher, and less associated with
closure for each kind of event. The more kinds of events distinguished, the less reliable
the distinctions, so, just to be sure about our results with nine kinds of events, we
aggregate to three kinds in Table S4: founding, “inside” events (shaded cluster to the
lower-right in Figure 4), and “outside” events (Figure 4 shaded cluster to the left). The
test statistics in Table S4 show the same pattern of trust significantly higher with all
event contacts, and significantly less associated with closure around the relationship.9
We conclude that the trust attributed to guanxi ties is behavioral in that trust is high
and relatively independent of closure for all contacts who have proven themselves by
helping the respondent through a significant event. We find no trust differences
between kinds of events — with one exception: Founding stands above the other eight
kinds of events in Table 3. Trust is least associated with closure, and reaches its
highest average levels in relationships with the contacts who helped an entrepreneur
found his or her business. Again, these findings resonate well with trust research
9Distinctions between kinds of events require subjective judgments, so the irrelevance of
such distinctions in Figure 8 made us concerned about the reliability of the distinctions in Table 3. The coding was reviewed by the author fluent in Chinese, and seemed sensible, but as a further check we had a second research associate working in Beijing code all 4,163 events into the Table 3 categories to compare with the coding we had. Reliability is high on average. The two coders agreed whether an event was a gain or a loss on 98% of the events, and agreed in their assignment of 74% of events to the Table 3 categories. The coders disagreed most clearly on customer events versus collaboration events (categories 3 and 7 in Table 3). Entrepreneurs often collaborated with others to produce a new product or secure a customer contract. Most of the disagreements between the coders were one coding an event as a customer issue while the other coded the event as a collaboration issue. If customer and collaboration issues are combined, the two coders agreed in their assignment of 84% of events. Given no statistical difference between customer and collaboration issues in Figure 8, we are confident in our conclusion in the text: all substantive kinds of significant events have the potential to generate guanxi ties.

Early Network Events and Later Success, Page 20
showing higher levels of trust, once trustor and trustee have experienced a “critical test”
in exchanging and receiving a unilateral favor (Kollock, 1995).10
BUSINESS SUCCESS, BROKERAGE, AND EVENT CONTACTS The network association with business success by the Chinese entrepreneurs is similar
to the association reported in research on manager networks in the West (Burt and
Burzynska, 2017: Figure 3). The theoretical argument is that the large, open networks
around “network brokers” provide information breadth, timing, and arbitrage advantages
in detecting and developing good ideas, so success and achievement are more likely in
large, open networks (Burt, 2005: Chaps. 1-2; Burt, Kilduff, and Tasselli, 2013, for
review). Figure 9 shows two network associations with success for the Chinese
entrepreneurs. Across the horizontal axis, constraint is a network metric measuring the
extent to which a person’s network is small and closed (Burt, 1992; Burt, Kilduff, and
Tasselli, 2013). Intuitively, network constraint increases from zero to one with the
proportion of person’s network time and energy consumed by one group. Constraint
decreases with the extent to which the person has many contacts (size), increases with
the extent to which the person’s network is closed by strong connections among
contacts (density), and increases with the extent to which the person’s network is closed
by a partner strongly connected with all contacts (hierarchy). Large, open networks are
to the left in Figure 9. Small, closed networks are to the right. As predicted by theory,
10Our conclusion is robust to years known. In networks around Western managers, time
distinguishes relations that can be discussed as guanxi-like ties in that trust is independent of structural embedding and high for colleagues with whom respondents have worked for multiple years. The time required to establish a guanxi-like tie in an organization can be determined by replicating trust correlations with network closure for contacts within intervals of time known. For example, among bankers and analysts, the trust-closure association is strong for colleagues known for a year or two, then the correlation drops to zero, and average trust increases, for colleagues known more than two years (Burt and Burzynski, 2017: Figure 4). In other words, two years is the time required to establish a guanxi-like tie for the bankers and analysts. We checked for change in the trust-closure association across the years for which a Chinese entrepreneur had known a contact. The dashed-line strong, positive trust-closure associations for nonevent contacts in Figures 7 and 8, and the solid-line negligible trust-closure associations for event contacts, are consistent across the years for which an entrepreneur has known the contact (see Figure S3 in the supplement materials). Years known adds nothing to our guanxi distinction between event and nonevent contacts.

Early Network Events and Later Success, Page 21
the solid regression line through the solid dots in the graph shows success decreasing
with the extent to which an entrepreneur is embedded in a small, closed network. And
as reported by Burt and Burzynska (2017: Table 3), the strong network association with
success disappears when event contacts not cited as current are excluded from an
entrepreneur’s network (dashed line through hollow dots in Figure 9). We want to know
whether the network association with success comes back when contacts made in
certain kinds of events are returned to an entrepreneur’s network, which will tell us
whether certain kinds of event contacts matter more than others in predicting future
business success.
——— Figure 9 and Table 6 About Here ———
We use Burt and Burzynska’s (2017) measure of success. This is success as an
entrepreneur can be argued to experience it. A self-made man is a success to the
extent that his business lets him be a big man to the people around him — making it so
that (1) a lot of money passes through his hands, (2) jobs can be found for deserving
friends, new contacts, or members of their families, and (3) the company signals its
technological sophistication by holding its own patents. Business success in Figure 9 is
a z-score defined by the principal component of all three indicators (first principal
component describes 65% of variance in the three indicators, and Burt and Burzynska,
2017: Table 1, report the network association with each of the three success indicators
individually).11
We extend the original specification to control for the success a business had in
place when it was registered as a private enterprise.12 Business success at founding is
11We also looked at the network association with success as a Western investor would
want to experience it — profits. We measure profits by return on assets (net income divided by book value of assets, both for the last full year, 2011). When we predict return on assets from the variables in Table 6, plus a control for log assets, profits are significantly lower for entrepreneurs in relatively closed networks (-2.88 t-test for log network constraint), and average returns over the last three years are similarly lower in relatively closed networks (-2.63 t-test for log network constraint).
12A business is founded when formally registered as a private enterprise. However, many of the sample businesses had been in operation before they were registered. Some operated under a different legal form. Others started operations, and even signed their first contract,

Early Network Events and Later Success, Page 22
a principal component extracted from number of full-time employees and annual sales
at founding. The principal component describes 86% of variance in the two indicators.
Table 6 shows the baseline model for the network association with success. Beyond
controls for industry differences, the age of a business, and level of success when
initially registered as a business, the primary predictors of success are whether the
founder is still running the business (negative association with success), whether the
business has a research and development (R&D) department (positive association with
success), and the extent to which there is a small, closed network around the person
running the business (negative association with high-constraint networks).13
Number and Kind of Event Contacts
The central concern in this analysis is to uncover the role of event contacts in the
network association with success. Table 7 shows what would have happened if the
entrepreneurs had been asked for fewer event contacts. For each row, we delete
certain contacts and re-assemble the network around each of the 700 entrepreneurs.
We compute network constraint for the new networks, and re-estimate the model in
Table 6 with the new measure of network constraint. The first row of Table 7
corresponds to what would have happened if we did not ask the event questions. We
remove from each entrepreneur’s network any contact that was not cited on one of the
three current contact name generators: Who have been your most valued contacts
without formal registration. In its first year as a registered private enterprise, the median business had 20 full-time employees and sales of 1,500,000 yuan (about 180 thousand U.S. dollars at the turn of the century). Without the control for founding success, Burt and Burzynska (2017, Table 1) report a -.440 regression coefficient for log network constraint with a .131 standard error. Table 6 shows that holding constant success-at-founding weakens the coefficient slightly, but shrinks the standard error more, resulting in a stronger test statistic for the network association with success (-3.64 here versus -3.36 in Burt and Burzynska).
13We also looked into an extension that turned out to be negligible. The Chinese national constitution was amended in 2004, increasing the status of private enterprise and institutional protection of private property (http://www.npc.gov.cn/englishnpc/Constitution/node_2825.htm). Suspecting the network association with success might be stronger for businesses founded after the amendment, we added level and slope adjustments to Table 6 for businesses registered after the amendment. Both adjustments are negligible. Success is negligibly lower for businesses founded after the amendment (-0.37 test statistic) and negligibly less associated with having a large, open network (0.26 test statistic).

Early Network Events and Later Success, Page 23
during business activities this year? Who is your most valued employee? Who has
made it most difficult for you in your business activities this year? The average
entrepreneur named four and a half current contacts (3,123 contacts in the first row of
Table 7 divided by 700 respondents equals 4.46). The smallest network is composed of
two contacts. The largest composed of eight. The regression coefficient and test
statistic in the first row of Table 7 show that the structure of current contact networks
has no association with success, which is the point in Burt and Burzynska’s (2017:Table
3) cautionary analysis. Even with question-order priming possibly increasing the number
of event contacts cited as current contacts, the first row of Table 7 shows that current
contacts alone do not capture the network association with business success.
——— Table 7 About Here ———
The second row of Table 7 shows what happens when we include people named
as most valued during the founding of the business. Of the 700 people named, 379 are
also named as current contacts, so they are already included in the first row of Table 7.
The remaining 321 founding contacts not named as current are added to the networks
in the second row. Row two shows the largest increase in network association with
business success (-.026 regression coefficient increases to -.339). The association
continues to strengthen when additional event contacts are included in the networks.14
The bottom row of the table shows the strong association when all current and event
contacts are included, which corresponds to the association in Table 6.
We draw two conclusions from Table 7. First, it would be wise to include at least
two event name generators in future studies of entrepreneur networks, one asking for
the contact most valued in founding the business, and a second asking for the contact
most valued in the first significant event in the business history. People named on
those two generators are sufficient to get a strong network association with success.
14The order of events matters. When we predict success from networks composed of
current contacts plus contacts cited for the most recent events — events four and five — the added contacts do not improve prediction. Entries for a new row in Table 7 would be a -.130 coefficient, .095 standard error, and a negligible -1.36 t-test. In short, predicting success depends on including contacts helpful in early events.

Early Network Events and Later Success, Page 24
Our prior analysis identified the same two contacts as discernably different from others,
best described as guanxi ties (Figure 4) that are especially close and highly trusted
(Figure 3), independent of social embeddedness and the nature and content of the
specific event with which they are associated (Figure 8). Second, more is better. The
network association with success is strongest when all event contacts are included, and
strengthens when the networks are expanded from the fourth to the fifth event. The
implication is that the association might be stronger still if the entrepreneurs had been
asked for more event contacts.
——— Table 8 About Here ———
What about kinds of events? Perhaps the network association with success varies
with the kinds of events through which contacts are valued? Perhaps the contact that
helped secure the first big customer contract is key? Perhaps having a contact that
helped with financing is key? These questions are answered by the results in Table 8.
We begin with the current contacts around an entrepreneur, then add contacts named
for each kind of event distinguished in Table 3. The network association with success is
statistically negligible for each of the eight kinds of events in Table 3. We also tried
combining kinds of events as they are clustered in the two shaded areas in Figure 4 as
events inside or outside the business. The network association with success is
statistically significant when contacts named for inside events are added to current
contacts, but those are also the largest number of contacts added (746 in second role of
Table 8). In fact, the coefficient measuring the network association with success
increases systematically with the number of contacts added by an event category (.75
R2 across the 10 event categories in Table 8; the coefficient strengthens by -.040 for
every 100 contacts added). These results correspond well with the lack of
differentiation between different kinds of events in predicting trust (Figure 8). If particular
kinds of event contacts were decisive for the overall business success, we would see
more pronounced differentiation across contacts in Table 8. Given the lack of
differentiation in Table 8, we conclude that the key to an entrepreneur’s network

Early Network Events and Later Success, Page 25
association with success is the diversity of his or her contacts in dealing with events, not
the substantive nature of the events deemed significant.15
Current Contacts Underestimate Brokers
Networks defined by current contacts poorly predict success in the first row of Table 7
and Table 8 because the networks typically underestimate a person’s access to
structural holes. Current-contact networks contain fewer non-redundant contacts, and
pose higher levels of network constraint (2.7 contacts and 70.0 points of constraint, on
average). Adding event contacts broadens the diversity of contacts (3.7 non-redundant
contacts on average, and 56.6 points of network constraint). There is more here than
just a higher level of closure among current contacts. A higher level of closure alone
would affect the intercept coefficient predicting business success in Table 7 and Table
8, but need not eliminate the association between success and network structure. The
problem is that closure is not uniformly higher for networks limited to current contacts.
Closure is particularly overstated by current contacts in open networks.
Consider Figure 10. The 700 entrepreneurs are ordered on the horizontal axis by
the level of network constraint on them from current and event contacts. The horizontal
axis in Figure 10 is the horizontal axis in Figure 9, and the network predictor of business
success in Table 6. The vertical axis in Figure 10 is the difference between network
constraint defined by current contacts minus constraint defined by all contacts. High on
the vertical axis are people whose network of current contacts is more closed than their
full network of current and event contacts. The solid dots in the figure are people for
whom network constraint is about the same whether or not event contacts are included
in their network.
——— Figure 10 About Here ———
15The first event is exceptional in terms of recovering the success association with
success (Table 7) and the strength of relationship with contacts cited for the first event (Figure 3), so we tested for success variation across kinds of first events. Distinctions between kinds of events that are irrelevant in general (Table 8) could be consequential in the first event. They are not. Adding to Table 6 dummy variables distinguishing the eight kinds of post-founding events does not improve the success prediction (F(7,683) = 0.86, P ~ .54).

Early Network Events and Later Success, Page 26
Three points are illustrated. First, most observations are above zero on the
vertical axis, illustrating the tendency for current-contact networks to be more closed
than networks with event contacts included. Second, large differences between
networks with and without event contacts are concentrated to the left of the graph, over
the large, open networks around network brokers. If a person’s current and event
contacts are densely connected, so network constraint is high to the right in Figure 10,
then constraint is still high when the network is limited to current contacts.
Third, error in capturing broker networks correctly is associated with business
success. Three categories of entrepreneurs are distinguished in Figure 10. One
hundred and sixty-one entrepreneurs have a network constraint score about the same
with or without event contacts. These are the solid dots in Figure 10.
Below the solid dots, a few entrepreneurs have networks more closed when event
contacts are included. The table to the right in Figure 10 shows that these 38 people
were most likely to turn to family for help when founding their businesses (57.9% cited a
family member as most valued at founding), and ended up less successful with their
businesses (-.26 average z-score success). For these entrepreneurs below the solid
dots in Figure 10, event contacts improve success prediction by capturing the lower
success associated with dependence on a closed network of contacts.
Above the solid dots, the majority of networks are more open when event contacts
are included. The table in Figure 10 shows these 501 people were least likely to rely on
family when founding their business (26.8% cited a family member as most valued at
founding), and ended up more successful in building their business (.04 z-score
success). In other words, for the entrepreneurs above the solid dots in Figure 10, event
contacts improve success prediction by better capturing the diversity of their contacts,
which is associated with more successful businesses.16
16Differences between the three categories are statistically significant. Predicting
business success from a 1, 0, -1 contrast between the three rows in the Figure 10 table yields a 2.25 test statistic (P ~ .03). Logit regression yields a -4.62 test statistic (P < .001) predicting, from the same contrast, which entrepreneurs cite a family member as most valued contact in founding the business. The result in Figure 10 is not about family firms. It is about who

Early Network Events and Later Success, Page 27
Early Diversity Is Particularly Important
To study contact diversity more closely, we looked at the entrepreneur networks as a
tournament based on citing new contacts for each subsequent event. Left to right in
Figure 11 is a tournament in which entrepreneurs are removed at each step if they cite
a contact for the current event that they already cited for a previous event. The 700
entrepreneurs sort on the first event into 339 who drop out and 361 who continue. The
339 drop outs cite the same contact for the first event that they cited for founding. The
remaining 361 continue by citing a contact on the first event who is different from the
contact cited for founding. Of the 361 continuing entrepreneurs, 266 cite a contact on
the second event different from the two contacts cited on event one and founding. The
tournament continues to the last 67 entrepreneurs who cite a contact on Event 5
different from any contact they cited previously.
——— Figure 11 and Table 9 About Here ———
The lines in Figure 11 show how average business success and network
constraint change as entrepreneurs are winnowed in the tournament. The person cited
on the first significant event is particularly noteworthy. There is a large difference in
success between entrepreneurs who return to their founding contact versus
entrepreneurs who turn to a new contact for the first event (.09 z-score increase).
entrepreneurs turn to at founding. In fact, the heads of family firms are more likely to turn to family at founding. Using the definition in footnote 8 of a family firm, about half of the entrepreneurs running a family firm turn to family at founding, versus a quarter of those running non-family firms (44% versus 24% respectively, 27.86 chi-square, P < .001). But family firms are more likely the solid dots in Figure 10 rather than the lower hollow dots who turned to family at founding (about half of the solid dots in Figure 10 are family firms versus a third of the hollow dots; 47% versus 32% respectively, 13.13 chi-square, P < .001). More, the negligible success association in the first row of Table 7 for current contacts is quite strong for family firms (-.560 coefficient, .191 standard error, -2.93 test statistic, P ~ .003, for the slope adjustment for family firms when a family-firm dummy is added to the equation). We do not discuss this in the text because the slope adjustment for family firms is negligible when the founding and first event contacts are included in an entrepreneur’s network (third row of Table 7, -1.80 test statistic for family-firm slope adjustment), and accordingly quite negligible when all event contacts are included (bottom row of the table, -0.57 test statistic). In short, current contacts in the networks around family-firm entrepreneurs better capture the diversity of the entrepreneur’s contacts because family is a source of both current and event contacts, but the family-firm difference is negligible when founding and first-event contacts are included in the networks, and disappears when all event contacts are included.

Early Network Events and Later Success, Page 28
Turning to another new contact for the second event does not produce as large a
difference (.04 z-score increase). Similarly, turning to a new contact for the first event is
associated with a large decrease in network constraint (10 point decrease from 62 to
52), relative to the decrease associated with turning to a new contact for the second
event (2 point decrease from 52 to 50). There are also large differences associated
with citing a unique contact for the fifth event, but at that point, only 67 of the initial 700
entrepreneurs remain in the tournament.
To test whether the changes visible in Figure 11 matter when other factors are
held constant, we add in Table 9 three sequence variables to the base model in Table
6: Is the Event 1 contact different from the founding contact? Is the Event 2 contact
different from the Event 1 contact? Is the Event 5 contact different from the Event 4
contact? Differences in success have a statistically significant association only with the
transition from founding to Event 1 (2.00 t-test in Model A), which also explains some of
the success association with overall network constraint (-2.53 t-test for constraint in
Model A is lower than the -3.54 in Table 6).
Successful transition from founding to the first significant event is more subtle than
simply finding a new contact to help with the first event. Switching to a new person for
the first event increases diversity, but not if the person contacted is closely connected to
the founding contact, and close connection turns out to be important. The rows of Table
10 distinguish three levels of connection between an entrepreneur’s founding contact
and Event 1 contact: The highest level, in row one, is that the two contacts are the
same person. The next level is that they are different people who are especially close.
The third level is that they are not especially close. Levels two and three are the people
in Figure 11 turning to a new contact for Event 1. Business success in Table 10 is low
on average for entrepreneurs who turn to their founding contact for Event 1, but even
lower for entrepreneurs who turn to a different person on Event 1 who is not especially
close with their founding contact. The highest success is associated with entrepreneurs
who turn to a different person on Event 1 who is especially close to the founding
contact. Even better if the especially close contact is family. The highest success in the

Early Network Events and Later Success, Page 29
table is for entrepreneurs who turn to family on the first event — but not a family
member cited for help in founding the business.
We term the shaded cells in Table 10 “positive moves” because later success is
positive in all three cells. We do not claim that the entrepreneurs who made these
moves were strategic in selecting the person to whom they turned for help on the first
significant event. Rather, we believe that the entrepreneurs who made a positive move
are entrepreneurs who had a strong core to the initial network with which they launched
their business (cf. Ruef and Grigoryeva, 2017, on ethnic entrepreneurship more likely in
neighborhoods containing only a few people of the entrepreneur’s ethnicity). These
entrepreneurs had two or more mutually supportive contacts in their core network, one
helpful at founding and the other helpful with the first significant event. It is certainly
possible that an especially close relation developed between the people after founding,
but family pre-dates the founding and they are the Event 1 contacts for whom positive
moves have the highest later business success. On the second and subsequent
events, successful positive-move entrepreneurs cite diverse contacts: The transition
from Event 1 to Event 2, and subsequent transitions show that the transition most
associated with success is picking a new contact not especially close to contacts helpful
on previous events.
——— Table 10 About Here ———
Correlates of positive moves are illustrated in Figure 11. Success is higher on
average for entrepreneurs who turn to multiple event contacts (increasing line through
solid dots), but success is consistently higher than that for entrepreneurs who began
their event sequence with a positive move (increasing line through hollow dots). At the
bottom of Figure 11, network constraint is slightly higher at Event 1 since the second
contact is especially close to the founding contact, but the positive-move entrepreneurs
tend to select nonredundant contacts for subsequent events, which eliminates the
constraint difference between positive-move and other entrepreneurs by the fifth event.
Testing statistical significance, results in Table 9 show that a positive move is
associated with significantly higher business success (2.42 t-test in Model B), is little

Early Network Events and Later Success, Page 30
reduced when network constraint is held constant (2.44 t-test in Model C), and does
little to erode the success association with aggregate network constraint (-3.22 t-test in
Model C). In short, turning to a new person on Event 1 — family or anyone else
especially close to the founding contact — creates advantage not evident in the later
network.
We tested the stability of our results for time, event content, and geography. With
respect to time, the average first event occurs a little more than a year after founding
(1.14 years). Many first events occur within a year of founding (276), and many occur a
year after founding (255). Then the frequency drops off over a long tail that extends up
to 10 years after founding. We created a three-category variable distinguishing same
year, one year, or longer and used it to add a level and slope adjustment to Model C in
Table 10 to test for the success associated with a positive move being higher or lower in
different years. The success association with a positive move is negligibly stronger for
first events further from founding (F(2,687) = 1.25, P ~ .29). With respect to the kinds of
events listed in Table 3, the first events are disproportionately about customers (42%)
and management issues in the business (27%). The most common remaining kinds
occur less than half as often as management issues (for the first event). We added a
level and slope adjustment to Model C to test whether the success associated with a
positive move is higher or lower for customer events. Both adjustments are negligible
(F(2,687) = 0.68, P ~ .51). Adjustments for management events are similarly negligible
(F(2,687) = 0.12, P ~ .89). With respect to geography, positive moves on Event 1 are
more likely in Shanghai (43%) than in Jiangsu (32%) or Zhejiang (33%), but there are
no statistically significant regional differences in the success association with positive
moves (F(4,685) = 0.68, P ~ .61).
CONCLUSIONS We traced the social networks around Chinese entrepreneurs back to their firm’s founding stage to answer two questions: To whom do entrepreneurs turn during significant events, and what role do those contacts play in the current network? To

Early Network Events and Later Success, Page 31
answer these questions, we use name generator questions paired with career history
questions to incorporate contacts missed by the usual focus on current business.
People named for their value during significant events we discuss as “event contacts,”
about which we draw four conclusions.
Event Name Generators
Event name generators add valuable information to the usual practice of asking about
the current network around a manager. For one thing, relations with people named as
event contacts, on average, have guanxi qualities of high trust relatively independent of
the surrounding network (Figures 7 and 8). For another thing, the success association
with large, open networks depends on event contacts for the Chinese entrepreneurs.
Absent the people named as event contacts, there is no success association with
network structure (Figure 9). Anchoring name generators on concrete events in the
entrepreneur’s past helps him or her recall key people beyond the immediate who
helped build the business.
Kinds of Events
The substance of a significant event matters less than the fact that the entrepreneur
deems it significant. We compared events for categories of substance (Table 3 and
Figure 4), but did not find significant differences between categories in the trust or
success associations with network structure (Figure 8 and Table 8). Event contacts
matter for trust and success largely in terms of their order and the network structure
around them.
Family Versus Duration
When family is turned to for support it is most likely at founding, but family is not the
primary source of support at founding. Rather, entrepreneurs turn to people they have
known for many years, typically people beyond the entrepreneur’s family (Table 5 and
Figure 5). Family never disappears. Family provides about one in ten contacts cited for
help through significant events during the first decade of the business (Figure 3). For
subsequent significant events as for founding, however, entrepreneurs turn less often to

Early Network Events and Later Success, Page 32
family than they turn to people outside the family, people with whom they have built up a
long-standing relationship.
Critical Events
Two events are particularly consequential: the business founding, and the first event
deemed significant by the entrepreneur. Asking about more events is valuable (Table
7), but the first two stand above the others. Relations with founding contacts are
associated with the highest trust and least dependence on surrounding network
structure (Figures 7 and 8), and, when added to current contacts, are sufficient to
recover the success association with network structure (Table 7). Contacts valued
during the first significant event strengthen the association with success (Table 7), but
more importantly, the transition from founding to first event has implication for later
business success (Figure 11 and Table 9). Entrepreneurs who turn for help on their first
significant event to a person separate from, but especially close to, the founding contact
are more successful in their business development (Table 10). That early “positive
move” is not visible in the final network around the entrepreneur (Figure 11). We do not
claim that the entrepreneurs who made positive moves were strategic in selecting in the
person to whom they turned for help on the first significant event. We suspect that the
entrepreneurs who made positive moves are people who had a strong core to the initial
network with which they launched their business. Those entrepreneurs had two or more
mutually supportive contacts in their core network, one helpful at founding and the other
helpful with the first significant event. At this point, we are speculating. If our results on
the Chinese entrepreneurs generalize, there is much to be learned about later success
from research on the role played by an entrepreneur’s network right after founding.
Specifically it will be interesting to explore the underlying mechanisms driving these
results. Why are initial events more important than following events? Do these events
stand out as learning moments shaping the later network emergence and cumulative
success? Or does an entrepreneur’s response to initial events simply reflect an innate
preference or style of building exchange relations that is productive in the long run?

Early Network Events and Later Success, Page 33
Limitations
We note four limitations to our analysis. The first is sampling. Our entrepreneurs come
from provinces rich in entrepreneurs, and central in the emergent Chinese economy. All
three provinces are fairly well developed institutionally. The IMD Global
Competitiveness Index, for instance, ranked Zhejiang province 18th globally in terms of
government efficiency in the year 2005 — closely following the US and ahead of Taiwan
(IMD 2005: 51). Given the region’s advanced development, we cannot be sure to find
the same network results in China’s less developed regions.
Second, we are limited by our survey data to surviving businesses. This limitation
is generic to survey research, but particularly troubling for research on entrepreneurial
ventures, which are prone to failure. While we acknowledge that our results are limited
to variable levels of trust and success across surviving businesses, we also note that
the limitation might not be as severe in China as in Western contexts because failure is
often postponed or avoided by going dormant. Given a wide-spread emphasis on
internal finance, reliance on short-term employment contracts and limited operation
costs, entrepreneurs often go through periods of sharp decline by temporarily closing
their business, rather than declaring it dead. A weakly enforced bankruptcy law makes
this practice all the more viable. In our sample we find this practice confirmed with only
3 percent bankruptcies in the three years preceding the survey. This implies that
relatively weak firms could survive to remain in our sample. Regardless, given the
strong network association with success, and the importance of early contacts to that
success, there is much to be learned from studying how early contacts are associated
with early survival.
Third, we know that an event contact is seen as valuable during a significant
event, but we do not know what the contact did that made him or her valuable. The
contact could have provided emotional support, financial support, guanxi access to a
third party who resolved the event, or something else. The strong trust and
performance results associated with event contacts makes it promising to study contact
behavior during the events.

Early Network Events and Later Success, Page 34
Fourth, we focus on the network around each entrepreneur, giving little attention to
cultural, and economic, and institutional events in the broader Chinese environment.
We did not ignore the broader environment. Controlling for business age can absorb
some trend variation in the environment, and we found the network association with
business success consistent before and after private enterprise was put on an equal
footing with state enterprise by the 2004 constitutional amendment (see footnote 13). In
predicting trust, we use respondent fixed effects to remove environmental differences
with respect to when a business was founded, and the substance of significant events
did not matter in our analysis as much as the fact that the events were deemed
significant by the entrepreneur. However, we wonder how the effects associated with
event contacts vary with the broader Chinese environment. How much does it matter
that the broader economy was doing well during the event, or doing badly, or going
through a significant transition?
REFERENCES Bailey, Stefanie and Peter V. Marsden. 1999. “Interpretation and interview context:
examining the General Social Survey name generator using cognitive methods.”
Social Networks 21: 287-309. Batjargal, Bat, Michael A. Hitt, Anne S. Tsui, Jean-Luc Arregle, Justin W. Webb, Toyah
L. Miller. 2013. “Institutional polycentrism, entrepreneur’s social networks, and new
venture growth.” Academy of Management Journal 56: 1024-1049. Bian, Yanjie. 1997. “Bringing strong ties back in: indirect ties, network bridges, and job
searches in China.” American Sociological Review 62: 366-385.
Bian, Yanjie. Forthcoming. “The prevalence and increasing significance of guanxi.” China Quarterly In Press.
Bian, Yanjie, and Lulu Li. 2012. “The Chinese General Social Survey (2003-8).” Chinese
Sociological Review 45: 70-97. Borgatti, Stephen P. 2002. NetDraw. Boston, MA: Analytic Technologies. Burt, Ronald S. 1992. Structural Holes. Cambridge, MA: Harvard University Press.
Burt, Ronald S. 2005. Brokerage and Closure. Oxford: Oxford University Press. Burt, Ronald S. 2010. Neighbor Networks. Oxford: Oxford University Press.

Early Network Events and Later Success, Page 35
Burt, Ronald S., Yanjie Bian, and Sonja Opper. 2017. ”More or less guanxi: trust is 60% network context, 10% individual differences.” Working Paper, University of
Chicago. Burt, Ronald S. and Katarzyna Burzynska. 2017. “Chinese entrepreneurs, social
networks, and guanxi.” Management and Organization Review 12: 221-260.
Burt, Ronald S., Martin Kilduff, and Stefano Tasselli. 2013. “Social network analysis: foundations and frontiers on network advantage.” Annual Review of Psychology 64: 537-547.
Chen, Chao C., Xiao-Ping Chen, and Shengsheng Huang. 2013. “Chinese guanxi: an integrative review and new directions for future research.” Management and Organization Review 9: 167-207.
Guo, Chun and Jane K. Miller. 2010. “Guanxi dynamics and entrepreneurial firm creation and development in China.” Management and Organization Review 6: 267-291.
Hardin, Russell. 1991. “Trusting persons, trusting institutions.” Pp. 185-209, in Strategy and Choice. , edited by Richard J. Zeckhauser. Cambridge, MA: MIT Press.
Huang, Phillip. 1990. The Peasant Family and Rural Development in the Yangzi Delta,
1350–1988. Stanford, CA: Stanford University Press. IMD. 2005. IMD World Competitiveness Yearbook 2005. Lausanne: IMD. Kollock, Peter. 1994. “The emergence of exchange structures: An experimental study of
uncertainty, commitment, and trust.” American Journal of Sociology 100: 313-345. Li, Hongbin, Lingsheng Meng, Qian Wang, and Li- An Zhou. 2008. “Political
Connections, Financing and Firm Performance: Evidence from Chinese Private
Firms.” Journal of Development Economics 87: 283– 299. Luo, Jar-Der, Meng-Yu Cheng, and Tian Zhang. 2016. “Guanxi circle and organizational
citizenship behavior: context of a Chinese workplace.” Asia Pacific Journal of
Management 33: 649-671. Luo, Yadong, Ying Huang, and Stephanie Lu Wang. 2011. “Guanxi and organizational
performance: a meta-analysis.” Management and Organization Review 8: 139-
172.

Early Network Events and Later Success, Page 36
Marsden, Peter V. 2011. “Survey methods for network data.” Pp. 370-388 in The SAGE Handbook of Social Network Analysis, edited by John P. Scott and Peter J.
Carrington. Thousand Oaks, CA: Sage. Nee, Victor and Sonja Opper. 2012. Capitalism from Below: Markets and Institutional
Change in China. Cambridge, MA: Harvard University Press.
Nee, Victor and Sonja Opper. 2010. “Political capital in a market economy.” Social Forces 88: 2105-2133.
Peng, Michael W., and Yadong Luo. 2000. “Managerial ties and firm performance in a
transition economy: The nature of a micro-macro link.” Academy of Management Journal 43: 486-501.
Ruef, Martin and Angelilna Grigoryeva. 2017. “Jim Crow, ethnic economies, and status
attainment: occupational mobility among U.S. Blacks, 1880-1940.” Working Paper, Department of Sociology, Duke University.
Ruan, Danching. 1998. “The content of the General Social Survey discussion networks:
an exploration of General Social Survey discussion name generator in a Chinese context.” Social Networks 20: 247-264.
Smith, Edward Bishop, Tanya Menon, and Leigh Thompson. 2012. “Status differences
in the cognitive activation of social networks.” Organization Science 23: 67-82. Stinchombe, Arthur L. 1965. “Social structure and organizations”, Pp. 142-194 in
Handbook of Organizations, edited by James G. March. Chicago, IL: Rand
McNally. Suchman, Mark. 1995. “Managing legitimacy: Strategic and institutional approaches.”
Academy of Management Review 20: 571-610.
Xiao, Zhixing and Anne S. Tsui. 2007. "When brokers may not work: the cultural contingency of social capital in Chinese high-tech firms." Administrative Science Quarterly 52: 1-31.
Xin, Katherine, and Jone L. Pearce. 1996. “Guanxi: connections as substitutes for formal institutional support.” Academy of Management Journal 39: 1641-1658.

Table 1. Survey Network Items
Name Generator Items Name Interpreter Items (Founding) Who was the one person who was most valuable to you in founding the firm? (700 contacts cited)
Contact Gender (male, female)
Emotional Closeness to Contact (especially close, close, less close, distant)
Duration of Connection with Contact (years known)
Frequency of Contact (daily, weekly, monthly, less often)
Trust in Contact (1 to 5, low to high trust) “Think about your trust level towards him/her. Please circle the closest option (1 least trust; 5 highest trust).” In Chinese: 想一想
您对他/她的信任程度; 请在表意最接近的选项上画圈 (1最不信任-5最信任)
Contact Role (circle all that apply: family, extended family, neighbor, party, childhood, classmate, colleague, military, business association)
Matrix of Connections between Contacts (especially close, distant, or something in between)
(Three to Five Other Events) Now please do the same thing for each of the significant events you listed. The first significant event you listed was (say first event) in (say year). Who was the person most valuable to you during that event? (2,701 contacts cited)
(Core Current) Shifting now to business this year, and thinking about people inside or outside your firm, who are the three or four people who have been most valuable to your business activities this year? (2,357 contacts cited)
(Difficult) In contrast to people who help and are valued in your business activities, there are usually some people who make life difficult. Without mentioning the person’s name, who was the most difficult person to deal with in your business activities this year? Just jot a name or initials in the box below. Only you are going to know who this person is. (700 contacts cited)
(Employee) Shifting to happier thoughts, who do you think was your most valuable senior employee this year? (700 contacts cited)
(N.E.C.) Now that you have a list of contacts on the roster worksheet, please look it over quickly. Is there anyone particularly significant for your business who has not been mentioned? If yes, please enter their name at the bottom of the list. There are many people you could mention. These would just be people particularly significant for your business. (16 contacts cited)
NOTE — Name generators, listed in order asked in interview, identify respondent contacts (number of cited contacts in parentheses). In total, 4,464 different contacts are cited. Name interpreters flesh out relationships with each cited contact, and define connections among the contacts. The name generators are asked first in the interview, followed by the name interpreters.

Table 2. Strength of Tie with Cited Contacts
Kind of Contact Mean Trust
Percent Especially
Close
Mean Years Known
Contact Frequency
Daily Weekly Monthly Less Often Total
Event Only 4.29 34% 13.10 572 (43%)
410 (30%)
229 (17%)
130 (10%)
1,341 (100%)
Event & Current 4.46 45% 13.33 1,056 (68%)
397 (25%)
99 (6%)
12 (1%)
1,564 (100%)
Current Only 3.07 5% 5.50 709 (45%)
471 (30%)
135 (9%)
244 (16%)
1,559 (100%)
Total 3.92 28% 10.53 2,337 (52%)
1,278 (29%)
463 (10%)
386 (9%)
4,464 (100%)
NOTE — Trust is measured on a five-point scale (test statistic with fixed respondent effects for no difference between rows: F(2,3762) = 1170.81, P < .001). Especially close contacts are distinguished from close, less close, and distant (test statistic with fixed respondent effects for no difference between the rows: 207.18 chi-square, 2 d.f., P < .001). Years known are significantly different across the rows (test statistic with fixed respondent effects for no difference: F(2,3762) = 829.96, P < .001). Contact frequency is significantly different across the rows (244.06 chi-square, 2 d.f., P < .001, for an ordinal logit predicting frequency categories from the rows). Percentage of row contacts at each level of frequency is given in parentheses.

Kinds of Events (N) % Loss Year Examples
1. Founding (700) 0% 1.00 “Who was the one person who was most valuable to you in founding the firm?”
2. Supplier (255) 9% 5.16 “replaced the main supplier” “major suppliers signed a cooperation contract” “suppliers had problems providing raw materials; resulted in serious losses”
3. Customer (833) 4% 5.25 “company signed a big contract, which helped working capital ” “company signed first export contract,” “contract signed for custom product with large state-owned enterprise”
4. Financial (184) 46% 5.44 “successfully raised money for the purchase of equipment” “obtained loans to small and medium-size private enterprises” “corporate cash flow difficulty; faced production difficulties”
5. Government (102) 4% 6.75 “got preferential taxation policies” “enjoyed preferential land policies of the government” “obtained international agreements certification”
6. Business Management (1,006) 10% 7.13
“mismanagement; serious business losses; almost closed down” “security control group concerned with product quality was established” “established classification of job responsibilities”
7. Collaborations and Associations (215) 2% 7.53
“established cooperative relations with the domestic textile industry” “joined the association of private entrepreneurs” “received excellent quality award of Zhejiang Province”
8. Business Technology (519) 2% 8.18
“introduction of new technology and equipment” “adopted new technologies; developed new products” “updated production technology; improved efficiency”
9. Market Generally (349) 92% 9.36 “price of raw materials increased, so the cost of production increased” “financial crisis in Southeast Asia; we lost some customers” “industry competition more fierce; had development difficulties”
NOTE — Number of events cited is in parentheses, followed by percent of events that are about loss (versus growth), then year on average in which the row category of events occur. A total of 4,163 events are cited, which is more than the 2,905 contacts in Figure 2 cited for events because some people are cited for more than one event. Categories six and eight are events inside the business.
Table 3. Kinds of Significant Events

Table 4. Event Order and Event Year
Event Year Founding Event 1 Event 2 Event 3 Event 4 Event 5 Total
1 700 276 9 4 0 0 989
2 0 255 73 8 4 1 341
3 0 89 173 33 6 1 302
4 0 26 147 90 15 3 281
5 0 25 125 129 40 14 333
6 0 15 68 104 75 18 280
7 0 3 43 93 106 37 282
8 0 4 23 68 100 95 290
9 0 1 13 47 74 85 220
10+ 0 6 26 124 268 421 845
Total 700 700 700 700 688 675 4,163

Table 5. The Most Valued Contacts at Founding Are Most Distinguished by Years Known
Predict Founding Contact Means
Coefficient S.E. Test
Statistic Founding Contacts
Other Contacts
Rarely-Met Contacts (days between meetings, 1-90) -.015 .005 -3.21 5.651 14.866
Contacts Known for Many Years (1-60) .393 .023 16.87 20.270 8.716
Structurally Embedded Contacts (number third parties, 0-6) -.635 .239 -2.66 3.104 3.043
Childhood Friend (0-1) -1.562 .923 -1.62 .041 .005
Classmate in School (0-1) .430 .694 0.62 .164 .020
Co-Member in Business Association (0-1) -.292 .836 -.35 .013 .032
Family Members (0-1) .643 .694 0.93 .314 .040
Contact from the Military (0-1) -.408 1.085 -.38 .014 .003
Neighbor (0-1) 1.509 .801 1.88 .054 .012
Contact from the Party (0-1) .946 .913 1.04 .019 .009
None of the Above (0-1) -.479 .710 -.67 .444 .886
NOTE — This is a logit regression with respondent fixed effects predicting which of a respondent’s contacts is cited for help in founding the business (N = 4,464 relationships, chi-square = 1609.32, 11 d.f., P << .001). Categories of contact frequency are entered in days (1 for “daily,” 7 for “weekly,” 30 for “monthly,” and 90 for “less often”). Number of third parties (structural embedding) is increased by one and logged to capture the nonlinear association to be displayed in Figure 5 (but means here are counts of third parties). Contacts could be cited for multiple roles (e.g., contact could be a “neighbor” and a “classmate”). “None of the Above” is 1 if contact is none of the seven kinds of contacts listed. ** P < .01 *** P < .001
**
***
**

Table 6. Predicting Business Success
Coefficient Standard Error Test Statistic
Network Constraint (20 – 100) -.414 .114 -3.64
Respondent Is Founder (0 – 1) -.364 .072 -5.03
Firm Age (years since founding, 1 - 30) .044 .006 7.09
Business Has R&D Department (0 – 1) .703 .058 12.04
Level of Success at Founding (z-score) .434 .029 15.07
Electronics Business (0 – 1) -.141 .095 -1.49
Machinery Business (0 – 1) .007 .081 0.09
Medicine Manufacturing (0 – 1) -.077 .104 -0.74
Transport Business (0 – 1) -.121 .081 -1.48
Intercept 1.123
R2 .447
NOTE — OLS regression predicting business success (vertical axis in Figure 8) from row variables. Success is a z-score first principal component combining employees, sales, and patents (describes 65% of variance in the three indicators, see text). Success at founding is a similar z-score (see footnote 12). Network constraint is measured as the log of 100 times constraint (horizontal axis in Figure 9). Firm age is 2012 minus the year in which the business was founded. ** P < .01 *** P < .001
***
***
***
***
***

Table 7. Beyond Current Contacts, the Initial Two Contacts
Are Key to Predicting Business Success
Entrepreneur’s Network Network Constraint
Lowers Success Standard
Error Test
Statistic Only Current Contacts (3,123 contacts) -.026 .108 -0.24
Plus Founding Contacts (add 321 contacts) -.339 .138 -2.45
Plus Event-One Contacts (add 215 contacts) -.410 .136 -3.02
Plus Event-Two Contacts (add 225 contacts) -.360 .125 -2.88
Plus Event-Three Contacts (add 212 contacts) -.352 .120 -2.94
Plus Event-Four Contacts (add 199 contacts) -.405 .116 -3.49
All Contacts (add 169 contacts for total of 4,464) -.414 .114 -3.64
NOTE — Each row is the estimated regression coefficient predicting business success from log network constraint using the model in Table 6, but with networks limited to the row contacts. Networks in the top row exclude all contacts not cited as current. Networks in the bottom row include all current and all event contacts, which are the networks used to get the estimates in Table 6. * P < .05 ** P < .01 *** P < .001
*
**
**
**
***
***
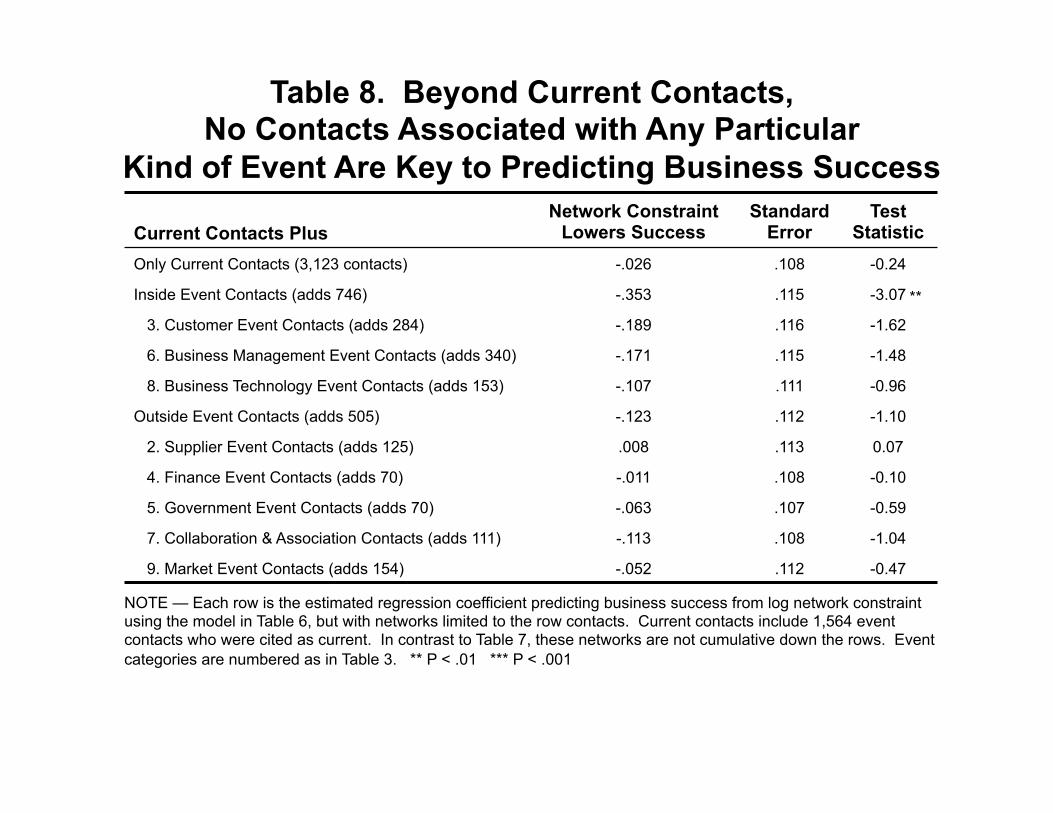
Table 8. Beyond Current Contacts, No Contacts Associated with Any Particular
Kind of Event Are Key to Predicting Business Success
Current Contacts Plus Network Constraint
Lowers Success Standard
Error Test
Statistic Only Current Contacts (3,123 contacts) -.026 .108 -0.24
Inside Event Contacts (adds 746) -.353 .115 -3.07
3. Customer Event Contacts (adds 284) -.189 .116 -1.62
6. Business Management Event Contacts (adds 340) -.171 .115 -1.48
8. Business Technology Event Contacts (adds 153) -.107 .111 -0.96
Outside Event Contacts (adds 505) -.123 .112 -1.10
2. Supplier Event Contacts (adds 125) .008 .113 0.07
4. Finance Event Contacts (adds 70) -.011 .108 -0.10
5. Government Event Contacts (adds 70) -.063 .107 -0.59
7. Collaboration & Association Contacts (adds 111) -.113 .108 -1.04
9. Market Event Contacts (adds 154) -.052 .112 -0.47
NOTE — Each row is the estimated regression coefficient predicting business success from log network constraint using the model in Table 6, but with networks limited to the row contacts. Current contacts include 1,564 event contacts who were cited as current. In contrast to Table 7, these networks are not cumulative down the rows. Event categories are numbered as in Table 3. ** P < .01 *** P < .001
**

Table 9. Predicting Business Success, Adding Sequence
A B C
Network Constraint (20 – 100) -.315 (-2.53) — -.385 (-3.22)
Event 1 Contact ≠ Founding Contact (0 – 1) .125 (2.00) — —
Event 1 Contact is a Positive Move (0 – 1) — .154 (2.42) .150 (2.44)
Event 2 Contact ≠ Event 1 Contact (0 – 1) -.010 (-0.13) .102 (0.72) -.012 (-0.16)
Event 5 Contact ≠ Event 4 Contact (0 – 1) .067 (0.85) .102 (1.30) .062 (0.79)
Respondent Is Founder (0 – 1) -.366 (-5.05) -.369 (-5.08) -.358 (-4.94)
Firm Age (years since founding, 1 - 30) .045 (7.03) .046 (7.18) .044 (6.94)
Business Has R&D Department (0 – 1) .705 (12.07) .690 (11.78) .702 (12.04)
Level of Success at Founding (z-score) .436 (15.13) .434 (14.99) .433 (15.06)
Electronics Business (0 – 1) -.139 (-1.46) -.146 (-1.53) -.142 (-1.00)
Machinery Business (0 – 1) .001 (0.01) -.005 (-0.06) .000 (0.00)
Medicine Manufacturing (0 – 1) -.093 (-0.89) -.089 (-0.58) -.093 (-0.89)
Transport Business (0 – 1) -.124 (-1.52) -.122 (-1.49) -.127 (-1.56)
Intercept 0.617 -.713 .920
R2 .451 .445 .453
NOTE — OLS regression predicting z-score business success (vertical axis in Figure 9) from row variables in Table 6 (t-test in parentheses), plus certain event-contact combinations. Event 1 contact is a “positive move” when it is in one of the shaded cells in Table 10. * P < .05 ** P < .01 *** P < .001
*
*
***
***
***
***
*
***
***
***
***
**
*
***
***
***
***
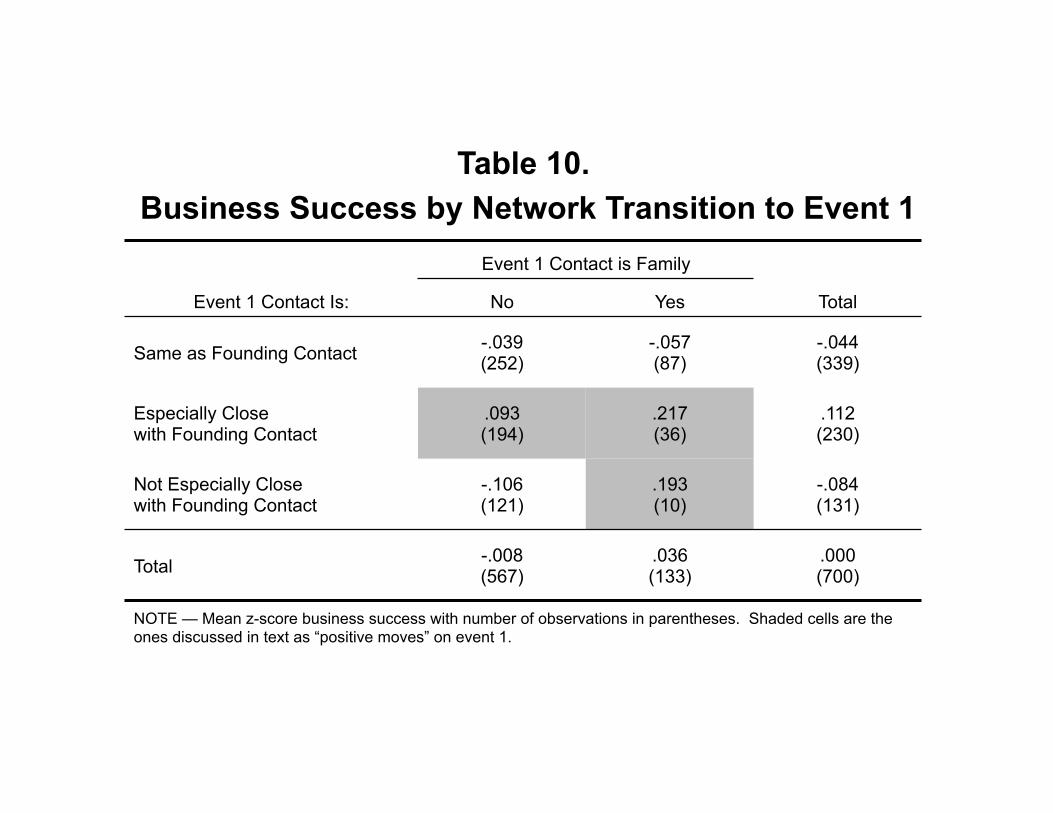
Table 10. Business Success by Network Transition to Event 1
Event 1 Contact Is:
Event 1 Contact is Family
Total No Yes
Same as Founding Contact -.039 (252)
-.057 (87)
-.044 (339)
Especially Close with Founding Contact
.093 (194)
.217 (36)
.112 (230)
Not Especially Close with Founding Contact
-.106 (121)
.193 (10)
-.084 (131)
Total -.008 (567)
.036 (133)
.000 (700)
NOTE — Mean z-score business success with number of observations in parentheses. Shaded cells are the ones discussed in text as “positive moves” on event 1.

Event Time Line(years since founding above, percent business life below)
1. Person known for 27 years, cited as most valuable in founding the business.
6. Person known for 7 years, cited as most valued in fifth event, and as a most valuable current contact, and as most valued employee.
4. Person known for 13 years, cited as most valued in third event.
Respondent founder of 13-year business, now 467 employees.
8. Person known for 4 years, cited as a most valued current contact.
2. Person known for 19 years, cited as most valued in the first event.
3. Person known for 17 years, cited as most valued in the
second event.
7. Person known for 7 years, cited as a most valued current contact.
5. Person known for 15 years, cited as most valued in the
fourth event, and as a most valued
current contact.
9. Person most difficult to deal with this year, known 4 years (machine break down caused heavy losses)
trust
trust
trust
trust
trust
Figure 1. Example Network Observation Line thickness indicates closeness. High-trust relation indicated by “trust.” No line is “distant” relationship. Respondent is the square. Network Metric, Z-Score: Size (9, 1.77), Density (.342, -.72), Effective Size (5.86, 1.53), Constraint (.371, -1.38)

Figure 2. Sources of Cited Contacts
Current Contacts Event
Contacts
Family
Other
Unknown
SOURCE:
1,559 Contacts Cited
Only as Current
Key Contacts
1,564 Contacts Cited
as Current and
for Value in
Significant Events
1,341 Contacts Cited
for Value in
Significant Events
Nu
mb
er o
f C
on
tac
ts

Figure 3. People Cited for Founding and First Significant Event
Stand Apart from Other Contacts
10+
Year in Which Event OccursOrder in Which Event Is CitedFounding
Portion of Business History in Which Event Occurs
Years Known
% High Trust
% Especially Close
% Family
PercentYears Known

Figure 4. Kinds of Events in Broader Context NOTE — Classical multidimensional scaling of Jaccard coefficients measuring co-occurrence of characteristics (N = 4,464). Axes are proportional in length to the eigenvalues defining them. Axes cross at their zero point. The two displayed dimensions describe 79% of variance in the 48 items. Solid circles are the name generators in Table 1 (1 - 6 are the event name generators). Hollow circles are the
Table 2 coded kinds of events on which event contacts were named. Squares are responses to the name interpreters in Table 1.
KINDS OF EVENTS 7 supplier event 8 customer event 9 finance event 10 government event 11 management event 12 collaboration event 13 technology event
14 market event 15 growth event 16 loss event 17 event in year one 18 event in year two 19 event in year three 20 event in year four 21 event after year four
CURRENT CONTACTS 22 valued current contact 23 most difficult contact 24 most valuable employee 25 valued contact, n.e.c.
26 knew from childhood
27 classmate 28 family 28 female 30 military 31 neighbor 32 party
33 low trust
34 trust level 3 35 trust level 4 36 trust level 5 (max)
37 distant 38 less close 39 close 40 especially close
41 meet daily 42 meet weekly 43 meet monthly 44 meet less often 45 known < 6 years 46 known 6 - 10 years 47 known 11 - 20 years 48 known > 20 years
Less ClosePersonal Ties
25
27
26
31
9
10
3018
32
20
19
12 14
7
SuspectTies
23
Difficult
Contact
45
Known < 6 Years
33 Minimum Trust
38
4437
34
43
29
GuanxiTies
Founding
Event 1
Event 2
24
36
Highest Trust
16
1728
Family
40
Known > 20 Years
48
8
Positive Work Ties
Event 4
Event 5
Event 3
22 Valued Current
Contact
39 Close
15
13
11
47
daily
41
46
42
3521
NAME INTERPRETERS

Figure 5. Duration, Family, and Founding NOTE — These are the 4,464 cited relationships sorted into three role categories: family or classmate, one or more of the five other roles in Table 6, or none of the seven roles in Table 6. “Long-Standing Connections” are contacts who the entrepreneur has known for more years than the average for which he or she has known his or her cited contacts. The two equations are logit regression models predicting who is cited as a founding contact (1/(1 + e-f).
Coefficients are estimated with respondent fixed effects. Test statistics are given in parentheses.
Family
New ConnectionsContacts Known for Respondent
Average or Fewer Number of Years
Long-Standing ConnectionsRelations Known for Longer than
Respondent’s Average
f = 0.98 Family - 2.48 NoRole
(5.4) (-16.2)
f = 0.35 Family - 0.77 NoRole + 0.39 YearsKnown
(1.2) (-3.1) (17.7)
Other
Role
No
Role
Family Other
Role
No
Role
1012
168218301
931
13912714024
2,403
Contacts cited as most valued in founding the business.
Contacts not cited for founding.

NOTE — Dots are average scores on vertical axis at each level of horizontal. Vertical axis is mean respondent trust in a contact, measured on a five-point scale (T). Horizontal axis is closure measured by the number of other people in the respondent’s network connected with the contact evaluated for trust (count of third parties, TP). G is a dummy variable equal to 1 for a guanxi tie, here operationalized by a citation as the most valued contact in founding the business. Parameters are computed by OLS for 2,259 relations, 700 relations with founding contacts, and 1,559 relations with contacts not cited in association with a significant event in the history of the business.
Figure 6. Guanxi Graph for Closure-Trust Association
Re
sp
on
de
nt
Ev
alu
ati
on
of
Tru
st
in C
on
tac
t
(1 fo
r low
trus
t, 5
for h
igh
trust
)
6+
T = (α + γG) + (β + λG) ln(TP)
β + λ
β
α = 1.706
γ = 2.874
β = 1.170
λ = −1.011
γ
α
Network Closure
Number of Third Parties
Linking Respondent
with Contact
Guanxi
Other

NOTE — Dots are average Y scores at each level of X. Vertical axis is mean respondent trust in a contact, measured on a five-point scale. Horizontal axis is the number of other people in the respondent’s network connected with the contact evaluated for trust.
Figure 7. Event Contacts Are Guanxi Regardless of Citation Order
Res
pond
ent E
valu
atio
n of
Tru
st in
Con
tact
(1 fo
r low
trus
t, 5
for h
igh
trust
)
Network ClosureNumber of Third Parties
Linking Respondentwith Contact
6+

Res
pond
ent E
valu
atio
n of
Tru
st in
Con
tact
(1 fo
r low
trus
t, 5
for h
igh
trust
)
Network ClosureNumber of Third Parties
Linking Respondentwith Contact
6+
NOTE — Dots are average Y scores at each level of X. Vertical axis is mean respondent trust in a contact, measured on a five-point scale. Horizontal axis is the number of other people in the respondent’s network connected with the contact evaluated for trust.
Figure 8. Event Contacts Are Guanxi Regardless of Event Substance

NOTE — Dots are average success scores within five-point intervals of network constraint. Business success is measured by the first principal component of patents, employees, and sales adjusted for having a research and development department. Solid dots
are averages for network scores computed from current contacts plus all event contacts. Hollow dots are averages for network scores computed from only current contacts. Lines are success predicted by the natural logarithm of network constraint. Test
statistics are from Tables 6 and 7. The network association with success clearly depends on including event contacts.
Figure 9.
Business Success Is
Associated with Large, Open
Network,
But Not if Limited to
Current Contacts
Network Constraint (x 100)many ——— Structural Holes ——— few
Z-Sc
ore
Bus
ines
s Su
cess
(ma
ny e
mp
loye
es,
hig
h s
ale
s,
an
d p
ate
nts
)
Full Network (t = -3.64) Current Network (t = -0.24)
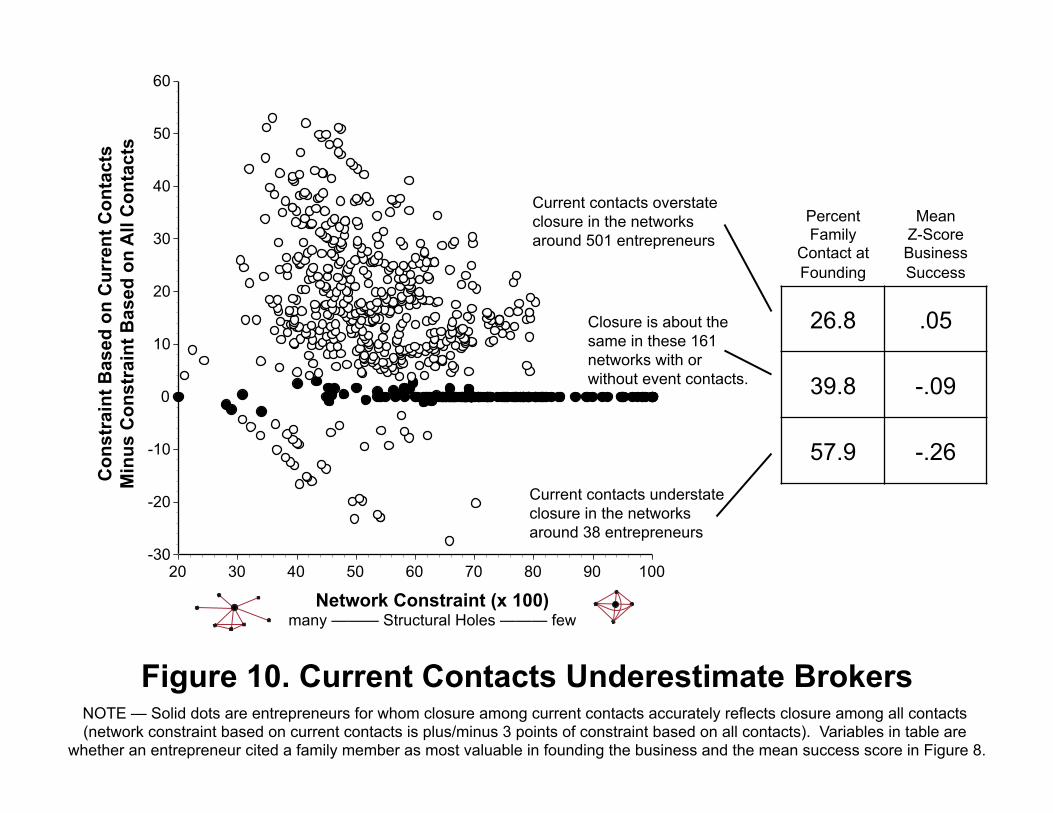
NOTE — Solid dots are entrepreneurs for whom closure among current contacts accurately reflects closure among all contacts (network constraint based on current contacts is plus/minus 3 points of constraint based on all contacts). Variables in table are
whether an entrepreneur cited a family member as most valuable in founding the business and the mean success score in Figure 8.
Figure 10. Current Contacts Underestimate Brokers
Network Constraint (x 100)many ——— Structural Holes ——— few
Con
stra
int B
ased
on
Cur
rent
Con
tact
s M
inus
Con
stra
int B
ased
on
All
Con
tact
s
Current contacts overstate
closure in the networks
around 501 entrepreneurs
Current contacts understate
closure in the networks
around 38 entrepreneurs
Closure is about the
same in these 161
networks with or
without event contacts.
Percent Family
Contact at Founding
Mean Z-Score Business Success
26.8 .05
39.8 -.09
57.9 -.26

Figure 11. Large, Open Network Is Good, but Initial Positive Move Makes It Better
Event 1 Contact IsFoundingContact
(N = 339)
Event 1 Contact IsDifferent
From Founding(N = 361)
Event 2 Contact IsDifferent
FromEarlier
(N = 266)
Event 3 Contact IsDifferent
FromEarlier
(N = 185)
Event 4 Contact IsDifferent
FromEarlier
(N = 109)
Event 5 Contact IsDifferent
FromEarlier
(N = 67)
Z-Sc
ore
Bus
ines
s Su
cces
s in
201
2(m
any
empl
oyee
s, h
igh
sale
s, a
nd p
aten
ts)
Net
wor
k C
onst
rain
t in
2012
(100
x C
)
Mean
Mean for Entrepreneurs Who Made a Positive Move on Event 1
B. Greatest success if event sequence began with positive move
A. Increasing average success with multiple event contacts
C. Early positive move invisible in later network