early immune responses to sars coronavirus in ferrets · early immune responses to sars coronavirus...
TRANSCRIPT

Early immune responses to SARS Coronavirus in ferrets
For the Degree of Philosophy of Doctorate
Abdolali Danesh
Graduate Department of Immunology
University of Toronto
© Copyright by Abdolali Danesh, 2012
ii
Early immune responses to SARS Coronavirus in ferrets
Abdolali Danesh
Doctor of Philosophy
Graduate Department of Immunology
University of Toronto
2012
Abstract
Severe acute respiratory syndrome (SARS) was defined as an invasive respiratory
disease in 2002, which originally came from China and rapidly spread all over the globe.
Acute pneumonia and lower respiratory tract involvement most affected the middle aged
individuals and elderly with a mortality rate of 11%. While SARS Corona virus (SARS-
CoV) has maintained its potential capacity to reemerge, clinical study of the immune
system of SARS patients, as well as controlled studies may lead to application of new
treatment strategies in future.
Throughout this work, I have focused on early immune responses to SARS-CoV
in humans and in ferrets. CXCL0 has been associated with alterations in the clinical
course of several infectious diseases, including SARS and influenza. Here I have cloned
ferret CXCL10 gene and have expressed its recombinant protein. I demonstrate that the
CXCL10 plasma level in SARS patients is associated with the severity of disease. I also
show that endogenous ferret CXCL10 exhibits similar mRNA expression patterns in the
lungs of deceased SARS patients and ferrets experimentally infected with SARS-CoV.
Type I interferons (IFNs) are indispensable parts of the innate immunity during early

iii
stages of infection. A clear distinction between genes upregulated by direct virus-cell
interactions and genes upregulated by secondary IFN production has not been made yet.
Here, I have investigated differential gene regulation in ferrets upon subcutaneous
administration of IFN-2b and during SARS-CoV infection. In vivo experiments
revealed that IFN-2b causes upregulation of abundant IFN response genes (IRGs),
chemokine receptors, and other genes that participate in phagocytosis and leukocyte
migration. SARS-CoV infection of ferrets leads to upregulation of varieties of IRGs and a
broad range of genes involved in cell migration and inflammation. This work allowed
dissection of several molecular signatures present during SARS-CoV infection, which are
part of a robust IFN antiviral response. Since localization of CD8+ Tcells may contribute
to tissue injury, I have characterized ferret CD8 gene and have generated reagents that
can be used in future studies with the aim of evaluating CD8+ T cells localization in the
ferret lung during infection with SARS-CoV.

iv
Key words:
Ferret, Animal model, SARS, Chemokines, CXCL10, Interferon, Gene expression, CD8

v
Co-authorships
The following thesis contains material from published papers and one written manuscript
co-authored by Charit Seneviratne, Cheryl M. Cameron, Mark E. Devries, Alyson A.
Kelvin, David Banner, Luoling Xu, Longsi Ran, Steven E. Bosinger, Thomas Rowe,
Marcus Czub, Colleen B. Jonsson, , Alberto J. León, Yuan Fang, Honglin Chen, Yi
Guan, Atsuo Ochi, Mark J. Cameron and David J. Kelvin.
All data analysis, experimental design and procedures were performed by Ali Danesh
within this thesis with the following exceptions. Charit Seneviratne designed and helped
with cloning and expression of ferret CXCL10 and CD8. Cheryl M. Cameron and
Thomas Rowe performed ferret experiments at BSL3 animal facility in Alabama, USA.
Colleen B. Jonsson supervised the BSL3 animal facility and helped with experimental
design and animal ethics protocols for the work performed in Alabama, USA. Mark E.
Devries helped with designing the degenerate primers and submission of ferret sequences
to the GeneBank. Alyson A. Kelvin ran real-time PCR on biopsies of lung tissues from
deceased SARS patients and critically reviewed the third chapter. David Banner helped
with immunoblots in chapter 2 and 4, and immunohsitochemistry in chapter 4. Luoling
Xu ran microarray experiments and helped with chemotactic assay. Longsi Ran and
Alberto Leon helped with microarray data analysis. Steven E. Bosinger reviewed chapter
2 and 4. Marcus Czub provided us with ferret total RNA for the first round of gene
sequencings. Yuan Fang, Honglin Chen and Yi Guan helped with sequencing ferret
genes. Atsuo Ochi helped with immunoblots in Chapter 4. He also designed experiments
and wrote the manuscript for Apendix I. Mark J. Cameron designed cytokine assay on
plasma of SARS patients, helped with microarray analysis and critically reviewed

vi
chapters 2 and 3. All Chapters (introduction, two published papers that a version of which
appears in this thesis, one manuscript and general discussion) were written by Ali Danesh
and David J. Kelvin. Appendix I (published paper) was written by Atsou Ochi, Ali
Danesh and David J. Kelvin.

vii
Acknowledgements
I would like to start with my special thanks to my supervisor Dr. David Kelvin. You
taught me how to work efficiently at UHN and University of Toronto. You let me work
on different areas of immunity of infectious diseases, which led to several publications.
Under your supervision, I learned how to deal with new scientific challenges in a world-
class research environment. I would like to thank Dr. Li Zhang and Dr. Rupert Kaul for
their extensive support, critical reviews of my research progress and for the enthusiasm
they brought to me.
Thanks to all members of Kelvin lab for their enormous support. Thanks to Dr. Mark
Cameron for all his support. His excellent scientific points of views were very important
to me. Thanks to Dr. Luoling Xu for all her helps and for providing us with necessary
reagents. I would like to thank Dr. Longsi Ran for all his help with microarray data
analysis.
I am in debt to my wife, Shideh, for all her dedication, support and inspiring hope and
courage to me. Thanks to my sister, my brothers and my parents for encouraging and
helping me in other aspects of my life.
I would like to thank the Canadian SARS Research Network, Toronto and Area nurses
and clinicians and clinical laboratory members for their support and contribution.

viii
Contents
Title page………………………………………………………………………………......i
Abstract……………………………………………………………………………….…...ii
Key words………………………………………………………………………………...iv
Co-authorships………………………………………………………………………….....v
Acknowledgments………………………………………………………………….……vii
Table of contents………………………………………………………………………….ix
List of figures……………………………………………………………………………xiv
List of tables……………………………………………………………………………..xvi
List of appendices……………………………………………………………………....xvii
List of abbreviations……………..…………………………………………………......xvii
ix
Table of contents
Chapter 1: introduction……………………………………………………………….....1
Overview…………………...…………………………………………………………..1
1 Coronaviruses………………...………………………………………………………..2
1.1 SARS-CoV………………………………………………………………………….....3
1.2 SARS-CoV Genomic Structure…………………………………………………….....4
1.3 SARS-CoV Receptors…………………………………………………………………5
1.4 SARS-CoV Life Cycle……………………………………………………………..….6
1.5 Characteristics of SARS-CoV…………………………………………………………7
1.6 Determination of TCID50……………………………………………………………..7
1.7 SARS Definition……………………………………..………………………………10
1.8 SARS diagnosis…………………………………………………………………...…10
1.9 SARS Treatment…………………………………………………………..…………11
1.10 SARS Vaccines..........................................................................................................11
2 Immune System...........................................................................................................12
2.1 Innate immune system……………………………………………………………….13
2.2 Adaptive immune system………………………………………………………….…16
2.3 Inflammation and lymphocyte activation....................................................................23
2.4 Interferons…………………………………………………………………………....27
2.5 Interferon regulated genes………………………………………………………...….30
2.6 CXCL10 (IP-10)………………………………………………………………..……31
2.7 Immune System and SARS……………………………………………………..……33
2.8 Immunopathology of SARS………………………………………………………….34

x
2.9 Cytokines and SARS……………………………………………………………...…35
2.10 IRGs and SARS…………………………………………………………………….36
2.11 SARS and leukopenia……………………………………………………………....37
3 SARS animal models……….………..………………………………………….……38
4 Hypothesis………………...………………………………………………………..…38
5 Objectives……….………..…………………………………………………………..39
Chapter 2: Upregulation of CXCL10 is associated with disease progression in
SARS-CoV- infected humans and ferrets……………………………………………..51
1 Introduction……….………….………………………………………………………51
2 Materials and methods………..……………………………………………………...54
2.1 SARS patients……………………………………………………………………..…54
2.2 Animals………………………………………………………………………………54
2.3 Titration of SARS-CoV……………………………………………………………...55
2.4 Viral load and clinical characteristics of infected ferrets.............................................55
2.5 Cytometric Bead Array (CBA)………………………………………………………56
2.6 Human lung biopsies and total RNA purification……………………………………57
2.7 Ferret total RNA purification and cDNA synthesis……………………………….…57
2.8 Real-time RT-PCR…………………………………………………………………...57
2.9 Amplification, cloning and sequencing of ferret-specific genes…………………….58
2.10 Generation of an expression vector for ferret CXCL10.............................................58
2.11 Cell culture, plasmid transfections, and protein purification.....................................59
2.12 Western Blot analysis………………………………………………………………59
2.13 Isolation of Peripheral Blood Mononuclear cells (PBMC) for
chemotaxis Assays…………………………………………………………………60

xi
2.14 Chemotaxis Assay……………………………………………………………….….60
2.15 Gene accession numbers……………………………………………………………61
2.16 Statistical analysis………………………………………………………………..…62
3 Results……….…………………………………………………………………...….62
3.1 CXCL9 and CXCL10 plasma level of patients with SARS…………………………62
3.2 Cloning and sequence analysis of ferret CXCL9, CXCL10, CXCL11
, and CXCR3………………………………………………………………………....67
3.3 Expression of recombinant ferret CXCL10 protein and detection by
western blot…………………………………………………………………………..73
3.4 Chemotactic activity of recombinant ferret CXCL10 protein…………………….…73
3.5 Stimulation of ferret PBMCs with LPS induces mRNA expression of
CXCL9, CXCL10 and CXCL11…………………………………….……………….77
3.6 Increased CXCL10 and CXCR3 mRNA expression in lung biopsies
from fatal outcome SARS patients at autopsy……………………….………………80
3.7 Expression of CXCL10 in lung biopsies of ferrets infected with
SARS-CoV…………………………………………………………………………...80
4 Discussion……………….……………..………………………………………..……83
Chapter 3: Early gene expression events in ferrets in response to SARS
coronavirus infection versus direct interferon-alpha2b
stimulation…………………………………………...……………………..91
1 Introduction……………………..……………….…………………………………....91
2 Materials and methods……………. ….……………………………………………...94
2.1 Ferrets……………………………………………………………………………......94
2.2 In vitro blood stimulation with IFN-2b…………………………………………….94
2.3 In vivo injection of ferrets with IFN-2b……………………………………………95
2.4 In vivo infection of ferrets with SARS-CoV………………………………………...95

xii
2.5 Intracellular staining…………………………………………………………………96
2.6 Cloning and sequencing of ferret-specific genes…………………………………….96
2.7 Gene accession numbers……………………………………………………………..97
2.8 Quantitative Real-Time PCR (qRT-PCR)………………………………………...…97
2.9 Microarray analysis…………………………………………………………………..98
2.10 Statistical analysis…………………………………………………………………..99
3 Results………………..……………………………………………..………………100
3.1 IFN-2b stimulation and SARS-CoV infection induced STAT1
phosphorylation and increased the expression levels of IRGs………………..…….100
3.2 Microarray analysis of IFN-2b injection or SARS-CoV infection
in ferret peripheral blood…………………………………………………...…..…..105
3.3 Microarray analysis of IFN-2b injection or SARS-CoV infection
in ferret lungs…………………………………………………………………….…115
3.4 Pathway and functional group differential gene expression patterns………………118
4 Discussion………………...…………………………………………………………127
Chapter 4: Cloning, expression and characterization of ferret CD8……………..137
1 Introduction……….…………..……………………………………………………..137
2 Materials and methods………………...………………………………………….…139
2.1 Antibodies…………………………………………………………………………..139
2.2 Animals……………………………………………………………………….…….139
2.3 Total RNA purification and cDNA synthesis………………………………………139
2.4 Amplification, cloning and sequencing of ferret CD8…………………...……….
2.5 Generation of ferret CD8 expression vector………………………………………140
2.6 Cell culture, plasmid transfection, and protein purification………………….…….140

xiii
2.7 Western Blot analysis………………………………………………………………141
2.8 Gene accession numbers……………………………………………………………142
2.9 Isolation of Peripheral Blood Mononuclear cells (PBMC)…………………………142
2.10 Cell surface staining of ferret PBMCs…………………………………………….142
2.11 Immunofluorescent staining of ferret CD8-transfected COS-7 cells
with rabbit polyclonal antibody………………………………………………...…143
2.12 Generation of monoclonal ferret CD8 supernatant………………………….…..143
3 Results…….……….……………………………………………………………..…145
3.1 Cloning and sequence analysis of ferret CD8…………………………………….145
3.2 Expression of recombinant ferret CD8……………………………………………
3.3 Anti-human CD8 polyclonal antibody reacts with ferret PBMCs and
with CD8transfected COS-7 cells……………………………………………..…153
3.4 Generation of mouse anti-ferret CD8 monoclonal supernatant…………………...157
4 Discussion………….………….………………………………………………...….160
Chapter 5: General discussion…………………………………………………..........165
5.1 SARS correlation with CXCL10 in humans and ferrets …………………………...166
5.2 Early gene regulation events in SARS-CoV infection versus IFN-2b injection
in ferrets ……………………………………………………………………………168
5.3 Characterization of ferret CD8……………………………………………………...172
5.4 Future studies……………………………………………………………………….173
Appendix I: Cloning, Expression and Immunoassay Detection of
Ferret IFN-……………………………………………………………..181
1 Introduction……………………...………………………..…………………………181
2 Materials and methods…………….………..………………………………….……184

xiv
2.1 Experimental animals…………………………………………………...…………..184
2.2 Total RNA purification and cDNA cloning of ferret IFN-………………………..1
2.3 Gene Transfection, Expression in COS-7 cells, and Protein
Purification……………………………………………………………………….…185
2.4 Western Blot analysis…………………………………………………………...….186
2.5 Isolation of Peripheral Blood Mononuclear Cells (PBMC)……………………...…186
2.6 Mouse B cell hybridoma preparation……………………………………………….187
2.7 Ferret IFN--specific ELISA………………………………………………….……187
2.8 Ferret IFN--specific ELISPOT assay………………………………..…………….188
2.9 Infection of ferrets with Influenza A virus…………………………………..……..188
3 Results……….…………..……………………………………………………..……189
3.1 Cloning of ferret IFN-cDNA and the expression of His6-,V5-tagged
recombinant IFN- in COS-7 transfectant cells………………………………….…189
3.2 Generation of monoclonal Abs specific for ferret IFN-γ…………...........................196
3.3 Utilization of monoclonal antibodies for the detection of ferret
IFN-by ELISA and ELISPOT immunoassays………………………………..…..199
4 Discussion……….…………………………….……………………………..……..207
Appendix II copyright wavers…………………………………………………..……214
List of figures:
Figure 1-1 Determination of TCID50 in a 96 well plate by cytopathic effect….…...…….9
Figure 1-2 Location, domains and ligands of human TLRs……….…………….………15
Figure 1-3 Antigen uptake and development of humoral and cell-mediated
adaptive immune responses……….………………………………………....18
Figure 1-4 Differentiation of CD4+ Th1 cells under the influence of
cytokines……………………………………………………………………....19

xv
Figure 1-5 Differentiation of CD4+ Th2 cells under the influence of
cytokines………………………………………..…………………………....20
Figure 1-6 Differentiation of CD4+ Th17 cells under the influence of
cytokines………………………………………………..…………………....21
Figure 1-7 Differentiation of CD4+ regulatory T cells under the influence of
cytokines…………………………………………………..………………....22
Figure 1-8 Development of adaptive immune response……….………………..……….26
Figure 1-9 Type I interferon signaling and upregulation of IRGs….……….………..….29
Figure 2-1 Mean CXCL10 level changes in plasma of different SARS groups.………...63
Figure 2-2 Mean CXCL9 level changes in plasma of different SARS groups….……….65
Figure 2-3 Multiple alignments of the primary amino acid sequences
of CXCL9, CXCL10, CXCL11, and CXCR3……………………..…..…….68
Figure 2-4 Phylogenetic analysis of ferret CXCL9, CXCL10, CXCL11
, and CXCR3………………………..………………………………..……... 70
Figure 2-5 The recombinant ferret CXCL10 protein migrates to
18.5kDa and is active in cell migration assays…………..…………...……...75
Figure 2-6 Induction of chemokine gene expression by lipopolysacharide………....…..78
Figure 2-7 CXCL10 and CXCR3 mRNA expression in lung tissues of
humans and ferrets infected with SARS-CoV…………………………...….81
Figure 3-1 In vitro phosphorylation of STAT1 in peripheral blood of ferrets
following stimulation with IFN-2b…………………………...………..…101
Figure 3-2 In vivo phosphorylation of STAT1 in ferret peripheral blood
mononuclear cells………….……………………………………...……..…103
Figure 3-3 Gene expression profile measured by qRT-PCR in peripheral blood
of ferrets stimulated with IFN-2b in vitro……………………..………….106
Figure 3-4 Microarray and qRT-PCR analysis of IRG expression in peripheral
blood and lung necropsies of ferrets injected with IFN-2b or
infected with SARS-CoV in vivo during the time course………… …..…...111
Figure 3-5 Intersect analysis of IRGs expression in blood and lung tissue
xvi
from IFN-2b injected and SARS–CoV infected ferrets….…………….…116
Figure 3-6 IRG pathway analyses of microarray datasets in lung necropsies
of IFN-2b injected and SARS-CoV infected ferrets……………………...120
Figure 3-7 Microarray analysis of immune response pathways in peripheral
blood and lung necropsies of ferrets injected with IFN-2b or
infected with SARS-CoV in vivo during the time course……….……….…124
Figure 4-1 Multiple alignment of the predicted full-length ferret CD8
amino acid sequence with CD8 sequences from other species
using Clustal-X software………………….…………………………...……146
Figure 4-2 Phylogenetic tree representing homology between ferret and
other known mammalian CD8 sequences……………………………..….149
Figure 4-3 COS-7 transfected cells express ferret CD8 recombinant protein………...151
Figure 4-4 Reactivity of ferret PBMCs and CD8-transfected COS-7 cells
with a polyclonal anti-human CD8α antibody…….…………………….….154
Figure 4-5 Flow cytometry staining and western blot analysis of cell culture
media from a hybridoma cell line and ferret CD8-transfected
COS-7 cells…………….……………………………………………….…..158
Appendix-Figure 1 Ferret IFN- cDNA……………...…………………………………190
Appendix-Figure 2 Secretion of ferret IFN- by COS-7 cell transfectants……....…….194
Appendix-Figure 3 Detection of ferret IFN- by a monoclonal anti-ferret
IFN- Ab………….………………………………………….……197
Appendix-Figure 4 Measurement of IFN- in the mitogen-stimulated ferret
PBMC culture supernatants by ELISA……………………………201
Appendix-Figure 5 Detection of increased levels of IFN- in ferret serum after
infection with H3N2 influenza A virus……………………………203
Appendix-Figure 6 ELISPOT assay for the IFN- producing cells in
mitogen-stimulated ferret PBMCs…………………………...……205
List of tables:
Table 2-1 Amino acid identity of ferret CXCL9, CXCL10, CXCL11 and
CXCR3 with known species sequences………………………………………72

xvii
Table 3-1 Amino acid percentage identity of ferret immune genes
compared to known species………………………………………..…..……109
Table 3-2 Summary of differentially regulated genes in top functional groups
during the time course in IFN-2b-injected or SARS-CoV infected
ferrets………………………………………………………..………………110
Table 3-3 Interferon-regulated genes fold change during the time course
in IFN-2b-injected or SARS-CoV infected ferrets….………..……………114
Table 3-4 Comparison of canonical pathways between ferrets injected with
IFN-2b and those infected with SARS-CoV during the time
course...….…122
Table 3-5 Natural history of ferrets, infected with 103
TCID of
SARS-CoV……………..........................................................................……128
Table 4-1 The percentage amino acid identity between the ferret CD8α
amino acid sequence and CD8α protein sequences from other
mammals………………………………………………………………….…148
List of Appendices:
Appendix I Cloning, Expression and Immunoassay Detection of Ferret IFN-
List of abbreviations:
3CLpro
Chymotrypsin-Like Protease
ABSL3 Animal Biohazard Safety Level 3
ACE Angiotensin Converting Enzyme
ACE2 Angiotensin Converting Enzyme 2
APC Antigen Presenting Cells
ARDS Acute Respiratory Distress Syndrome
BLAST Basic Local Alignment search Tool
C3 Complement Component 3
CBA Cytometric Bead Array
CFB Complement Factor 3
CNS Central Nervous System
crKL V-crk sarcoma virus CT10 oncogene homolog
DAD Diffuse Alveolar Damage
DEMEM Dulbecco’s Modified eagle’s Medium
DNM1L Dynamin 1-Like

xviii
E Ag Small Envelope Antigen
EBI European Bioinformatics institute
ECL Enhanced Chemiluminiscent
EIF2AK2 Eukaryotic Translation Factor 2-alpha Kinase 2
ER Endoplasmic Reticulum
ERK Extracellular Signal-Regulated Kinase
FCGR Fragment C Gamma Receptor
FDR False Discovery Rate
GAS Gamma Activation Site
GTPase Guanosine Triphosphatase
HA Hemagglutinin-Acetylesterase
HAT Hypoxanthine Aminoprotein Thymidine
HCoV-229-E Human Coronavirus 229-E
HCoV-OC43 Human Coronavirus OC43
HCV Hepatitis C Virus
IFI Interefron Induced genes
IFI44L IFI44 Ligand
IFIT Interferon-Induced protein with Tetratricopeptide Repeat
IFN Interferon
IFNR Interferon Receptor
IL-8 Intracellular Cell Adhesion Molecule
iNOS Nitric Oxide Synthase
IP-10 Interefron-gamma inducible Protein 10
IRF Interferon Regulatory Factor
IRG Interferon Response Gene
ISG Interferon Stimulated Gene
ISGF Interferon Stimulatory Factor
ISRE Interferon-Stimulated Response Element
I-TAC Interferon-inducible T-cell Alpha Chemoattractant
ITGB Integrin Beta
JAK Janus Kinase
KLH Keyhole Limpet Hemocyanine
LCMV Lymphocytic Choriomeningitis Virus
LPS Lipopolysaccharide
M Matrix
M Ag Membrane Antigen
CDC Centre for Disease Control
M-CSF Monocyte-Colony Stimulating Factor
MFI Mean Fluorescent Intensity
MHC Major Histocompatibility Antigen
MHV Mouse Hepatitis Virus
MIG Monokine induced by gamma interferon
MT1H MethalloThionein 1 H
MVA Vaccinia Ankara
MX Myxovirus Resistance
N Ag Nucleocapsid Antigen

xix
NA Neuraminidase
NCBI National centre for Biotechnology Information
NK cell Natural Killer Cell
NOD Non-Obese Diabetic
NP Nucleocapsid
NS Not Significant
OAS Oligoadenylate Synthase
OASL OAS ligand
ORF Open Reading Frame
p38 Protein Kinase 38
PAMP Pattern Associated molecular Pattern
PBMC Peripheral Blood Mononuclear Cells
PBS Phosphate Buffered Saline
PIAS Protein Inhibitor of Activated STAT
PLIER Probe Logarithmic Error Intensity Estimate
PLP Papain-Like Protease
PMA Phorbol Myristate Acetate
Pol RNA-Dependent RNA Polymerase
Poly I:C Polyinosinic: Polycytidylic Acid
PSMB8 Proteasome Subunit Multifunctional beta 8
qRT-PCR Quantitative Real-time PCR
RLM-RACE RNA Ligase Mediated Rapid Amplification of cDNA
RSAD2 Radial S-adenocyl Methionine Domain Containing 2
S Ag Spike Antigen
SARS Acute Respiratory Syndrome
SARS-CoV SARS Coronavirus
SDC1 Syndecan 1
SDS Polyacrylamide Gel Electrophoresis
SOCS Cytokine Signaling
SRI Southern Research Institute
STAT Signal Transducer and Activator of Transcription
TCR T cell Receptor
TLR Toll-Like Receptor
TMB Tetramethylbenzidine
TOR2 SARS Coronavirus Toronto Strain 2
TPBS Phosphate Buffered Saline
TyK Tyrosine Kinase
USP18 Ubiquitin Specific Protein 18
UTR Untranslated region
WHO World Health Organization

1
Introduction
Overview
Emerging viral respiratory diseases that cause acute respiratory distress syndrome
(ARDS-like) diseases have been an important recent focus of the medical community,
virologists and immunologists. Severe acute respiratory syndrome (SARS) and pandemic
H1N1 influenza are two examples of respiratory diseases that have caused outbreaks in
different countries within the same decade, imposing social and economic crises1,2
.
SARS emerged as a new viral infectious disease in 2002. The etiological agent of
SARS was a novel virus, called SARS corona virus (SARS-CoV)3. The influenza-like
disease first was reported in China4. The viral infection mostly resulted in an acute
atypical form of pneumonia and lower respiratory tract involvement affecting middle-
aged individuals and the elderly5,6
. Prior to the outbreak of SARS, coronaviruses were
believed to be the causative agents of mild upper respiratory infections2,7
. Conversely, the
SARS corona virus was the first identified coronavirus to be the etiological agent of a
severe respiratory illness. SARS was spread to other Asian and European countries and to
North America by travelers6. It appeared as two separate outbreaks in spring of 2003 in
Toronto, infecting approximately 800 people and resulting in 43 deaths according to
World Health Organization (WHO) records (http://www.who.int/csr/sars/en/). SARS is
described as a disease with multi-organ involvement in severe cases. With a mortality
rate of 11%, SARS would be a potential disaster if it remerged into the human
population8.
Pandemic H1N1 influenza is a viral respiratory infection that was first identified
in 20079. Several strains of the virus have been identified, including pH1N1 A/mex/4108

2
and pH1N1 A/Cal079,10
. While the symptoms of pandemic influenza are similar to
seasonal influenza, in some individuals the infection is more virulent and can lead to
rapid development of ARDS and death11,12
. Individuals with pre-existing medical
conditions were more vulnerable to infection than patients with no medical history. In
high-risk patients, antiviral therapy with oseltamivir or zanamivir was thought to be
beneficial13
. Although the best strategy was the production and use of pandemic H1N1
vaccine, the unavailability of a large vaccine stock in poor or developing countries
reduced the efficacy of this method. Another issue is that a huge percentage of population
did not receive the vaccine in 2009 in developed countries such as the United States14-16
.
In both the case of SARS and pandemic H1N1 influenza infection, a balance
between different arms of immune system has been suggested to be essential in the
clearance of the disease with minimal side effects, while an imbalance may lead to tissue
injury17-19
. Clinical study of the immune system of infected patients, as well as research
conducted on appropriate animal models, may be of great value in the development of
new treatment strategies.
Throughout this work, with the aim of building ferrets as an immune model for
viral respiratory diseases, I have focused on early immune responses to SARS-CoV in
humans and in ferrets.
1. Coronaviruses
Coronaviruses are spherical, enveloped, RNA positive stranded viruses. They are
the largest RNA viruses with an approximate genome size of 27500-31500 bases20
.
Coronaviruses are classified as a genus in the family Coronaviradae and order

3
Nidovirales20
. Human Coronavirus 229E (HCoV-229-E) and Human Coronavirus OC43
(HCoV-OC43) are the main cause of the common cold after rhinoviruses7.
1.1 SARS-CoV
In early 2003, a new Coronavirus associated with a severe acute respiratory
syndrome was identified6. It was the first observation that a Coronavirus could be the
etiological agent of a deadly respiratory disease. At first it was hypothesized that SARS-
CoV may be a mutant human Coronavirus with newly acquired virulence, or the result of
recombination between separate human and animal Coronaviruses21
. It is now believed
that SARS-CoV is a previously unknown Coronavirus that through evolution obtained
the ability to infect humans20
. The bat, palm civet, raccoon dog, domestic cat, red fox and
Chinese ferret badger are all likely to have been reservoirs of SARS-CoV20,21
.
SARS-CoV has four structural proteins: Spike (S), nucleocapsid (N), small
envelope (E) and membrane (M)22
. Coronaviruses are divided into three groups based on
genome, natural host, antigenic and serologic similarities and differences20,22
.
Alphacoronaviruses (group I) usually infect mammals, different members of
betacoronaviruses (group II) can either infect mammals or birds, and
gammacoronaviruses (group III) infect birds. Replicase and structural gene analysis has
revealed that SARS-CoV is an early split from betacoronaviruses. Unlike other members
of this group, SARS-CoV does not have the gene for hemagglutinin esterase20
. In this
context some investigators have suggested designating a new group for SARS-CoV20,23
.
Two strains of SARS-CoV were isolated and sequenced in Canada and the United
States independently at the same time. Tor2 strain of the SARS-CoV was isolated from a

4
sample taken from a patient infected in Toronto and was sequenced at the Center for
Disease Control (BCCDC) in Vancouver24
. UKH-1, also known as the Urbani strain, was
sequenced in Atlanta, USA. After a short period of time, another strain was sequenced in
Taiwan and named SARS TW. The nucleotide sequences of these strains were different
at only 24 positions25
.
1.2 SARS-CoV Genomic Structure
A single stranded RNA of 29751 nucleotides with a 5’ cap and a polyadenylated
tail, comprises the SARS-CoV genome23
. The capped leader sequence is 60 nucleotide
long followed by an untranslated region of 204 nucleotides. Replicase, a non-structural
polyprotein is coded by two overlapping open reading frames (ORFs). ORF1a and
ORF1b are at positions 265-13398 and 13399-21485, respectively23
. Once ORF1a is
translated by host ribosome, a –1 frame shift facilitates the translation of ORF1b and the
synthesis of a single polyprotein. Cleavage of the polyprotein by proteases produces the
necessary proteins for viral replication. Structural proteins are located downstream of
ORF1b. The Spike gene is at position 21492-25259 and its product is a type I
glycoprotein made of S1 and S2 subunits23
. The second structural gene is Envelope (E) at
position 26117-26347, which its product is a 76 amino acid type II membrane protein26
.
The third structural gene is Membrane (M) at position 26398-2706324
. This gene
produces a transmembrane glycoprotein which its association with spike glycoprotein is
necessary for envelope formation and viral assembly. Nonstructural X1 and X2 genes are
positioned between S and E genes. X3, X4 and X5 are three other nonstructural genes,
which are located between M and N genes23,24
. The potential products of these

5
nonstructural proteins are not similar to any other known viral proteins. Nucleocapsid, a
glycoprotein with 422 amino acids in length is the product of the fourth structural gene
positioned at 28120-2933824,25
. At the end of the SARS-CoV genome there is a short
untranslated region23-26
.
1.3 SARS-CoV Receptors
Two types of receptors have been identified as SARS-CoV receptors. Angiotensin
converting enzyme 2 (ACE2) of the renin-angiotensin network is the main receptor for
SARS-CoV and binds to spike antigen27
. CD209 (L-SIGN), an integral type II
transmembrane protein is known as the second receptor for spike glycoprotein28,29
.
Angiotensin II causes vasoconstriction and controls sodium balance that results in blood
pressure homeostasis29
. The enzyme that catalyzes the conversion of angiotensin II from
angiotensin I is called angiotensin converting enzyme (ACE). ACE2 is an inhibitor of
angiotensin I and II; it converts angiotensin II to angiotensin 1-7. ACE2 is essential for
SARS infection in vivo. ACE2 knockout mice are resistant to lung infection with SARS-
CoV. Wild type mice infected with SARS-CoV showed decreased levels of ACE2.
Treatment of SARS-CoV-infected mice with recombinant spike antigen reduced the
pathology of the disease compared to untreated infected controls29
.
Gastric acid aspiration results in lung injury and sometimes leads to acute
respiratory distress syndrome (ARDS)30
. ACE2 plays a protective role in experimentally
induced acid injury in mice. It is shown that ACE2 knockout mice had increased lung
injury compared to the wild types. Rescue therapy with recombinant ACE2 was

6
associated with lesser degrees of lung injury in knockout mice30
. These findings
emphasize that ACE2 is important for SARS pathogenesis, not only as a viral receptor
but also in ARDS development29,30
.
1.4 SARS-CoV Life Cycle
Exposure of cells to SARS-CoV results in the interaction of Spike glycoprotein
with ACE2, which leads to fusion of virus envelope and cell membrane30
. The single
stranded positive RNA can then be translated directly by host ribosomes. Open reading
frames (ORF1a and ORF1b) translate the replicase protein, a single polypeptide of >7000
amino acids. Virally coded proteases such as chymotrypsin-like protease (3CLpro
) and
papain-like protease (PLP) cleave the polypeptide and produce RNA-dependent RNA
polymerase (Pol) and other proteins involved in viral replication30,31
. A negative stranded
RNA is copied from the genomic RNA by RNA-dependent RNA polymerase to produce
positive subgenomic mRNAs and is also as a template for the production of new positive
genomic RNA. Subgenomic mRNAs translate to structural proteins31
. Assembly of
nucleocapsid glycoprotein synthesized from mRNA and newly synthesized genomic
RNA occurs in the cytoplasm to form helical nucleocapsids. E and M proteins are
synthesized on membrane-bound polysomes and transported to the endoplasmic
reticulum (ER) and then to the Golgi apparatus. E and M interaction triggers the
formation of envelope and enclosure of the nucleocapsid31,32
. After synthesis on
membrane polysomes, Spike glycoprotein is added to the envelope and finally the new
virions are released by exocytosis. Glycosylation of all structural proteins occurs in the

7
Golgi apparatus. The Spike protein undergoes trimerization and cleavage to S1 and S2 in
the ER30-33
.
1.5 Characteristics of SARS-CoV:
SARS-CoV can be grown or titrated in FrhK-4 (fetal rhesus monkey kidney) or
Vero E6 (African green monkey epithelial) cells34
. SARS-CoV induces apoptosis in
epithelial cells of the lung35
. It also induces apoptosis leading to DNA fragmentation,
apoptotic body formation and mitochondrial damage in Vero E6 cells36
. Infection of
pneumocyte II cells in the lung of infected humans leads to syncytia formation36
. The
infectivity of SARS-CoV is lost after incubation at 37 °C for 15 minutes. Dried droplets
of the virus on plastic surfaces are stable for 5 days at room temperature and a relative
humidity of 40-50%. The infectivity of dried droplets was lost at high and humid
temperatures (38 °C, 80-90% relative humidity)37
. Common fixatives such as 70%
methanol, 10% bleach, 10% formaldehyde, and high (>12) or low (<3) PH inactivates the
virus)38
. In respiratory samples of infected patients, SARS-CoV survived for 5 days at 24
°C. The virus survived for 3 days in loose stool39
. Long term storage of the virus stock
can be performed in liquid nitrogen and the titrated working aliquots can be kept in -80
°C for months. These research specimens should be kept in locked tanks or freezers in a
BSL3 facility39
.
1.6 Determination of TCID50

8
TCID50 is an endpoint dilution technique that is used to quantify the amount of a
virus required to kill or generate a cytopathic effect in 50% of infected host cells. This
method was invented by Reed and Muench. TCID50 is more commonly used for titration
when the viruses do not grow in cell cultures or cannot form plaques. To determine
TCID50, serial dilutions of viral stock are prepared. Target cells infected with different
dilutions of the virus are added into different rows of a 96 well plate and incubated at 37
°C in a CO2 incubator. After approximately 3-7 days, depending on the virus and the
target cell, the percentage of cell death is counted for each dilution. Proportionate
distance (PD) is calculated as (% next above 50%)-50% / (% next above 50%) – (% next
below 50%). Then 50% end point is calculated and added to PD, and finally log TCID50
is calculated. To calculate TCID50/ml, TCID50 is divided by the volume of initial viral
inoculum added to each well40
(Figure 1-1).

9
Lysis
No lysis
Control
10-1
10-2
10-3
10-4
10-5
10-6
10-7
10-8
Dilution
70% endpoint
Figure 1-1: Determination of TCID50 in a 96 well plate by cytopathic effect

10
1.7 SARS Definition
Severe acute respiratory syndrome (SARS) was defined as the sudden onset of
severe respiratory symptoms in association with confirmation of infection by
(subsequently identified) SARS-CoV virus. Many SARS symptoms were non-specific
and similar to that of other types of pneumonia at onset41
. Fever, chills, myalgia, malaise,
headache, cough, dyspnea, diarrhea and nausea were common symptoms of SARS. A
confirmed case of SARS should demonstrate a fever of 38oC or higher, at least one of the
symptoms of lower respiratory tract involvement, radiographic evidence of lung
infiltrates and no alternative diagnosis of other pathogens, and at least one laboratory
finding of SARS, according to the World Health Organization (WHO) definition41
.
1.8 SARS diagnosis
Lung radiography of SARS patients was of great importance during the
outbreak42
. Airspace opacity in the lower lung lobes was found in many infected
individuals infected with SARS-CoV at the onset of the disease. Roughly 90% of patients
showed pulmonary opacities 7 days post-infection43
. Multifocal or bilateral lung
involvement occurred in 70% of patients44
. One of the unusual laboratory findings in
SARS patients was leuckopenia and lymphopenia accompanied by neutrophilia. Many
viral diseases, including Influenza A and Cytomegalovirus, are accompanied with
leukocytosis and lymphocytosis45
. However, the majority of SARS patients showed
leuckopenia, lymphopenia and neutrophilia with platelet counts of less than 150,000/l
(thrombocytopenia). Lactate dehydrogenase and creatine kinase were the only highly

11
elevated biochemistry markers46,47
. Electron microscopy evaluation of lung tissue
preparations and real-time PCR are thought to be the most accurate methods of laboratory
diagnosis48
. Anti-spike seroconversion from IgM to IgG and viral culture techniques are
accurate but time consuming42
.
1.9 SARS Treatment
At the initial outbreak of SARS, the therapeutic choice for treatment of SARS was
a combinational therapy of ribavirin and corticosteroids. Subsequently, laboratory
findings showed the inefficacy of ribavirin in the inhibition of SARS-CoV grown in Vero
E6 cells. Published clinical data was indicative of ineffectiveness of ribavirin as well49-51
.
Corticosteroids were the elective therapy during the second outbreak of SARS in
Toronto43-46
. Delayed lung injury accompanied with reduced viral load was observed in
treated SARS patients with corticosteroids46
. A small cohort of patients was treated with
interferon- and corticosteroids in Toronto47
. In an experimental model of SARS,
treatment of SARS-CoV-infected Cynomolgus macaques with pegylated IFN-
significantly reduced viral replication and lung injury52
. SARS-CoV neutralizing anti-
human IgG1 antibody against whole inactivated virus has also been effective in ferret
model53
.
1.10 SARS Vaccines

12
One of the first attempts to develop a SARS vaccine was the generation of
adenovirus vaccines that contained the SARS S1, M and N proteins. Rhesus monkeys
were immunized intramuscularly with this trivalent vaccine followed by a booster on day
28. Strong antibody responses against S1, and T cell responses against N were shown54
.
Yang et al. demonstrated the efficacy of a DNA vaccine targeting the spike glycoprotein
in mice55
. This DNA vaccine induced CD4+ and CD8
+ T cell responses and significant
antibody production. The SARS viral load was reduced significantly in immunized mice
challenged with SARS-CoV compared to unvaccinated mice56
. In one study, cellular and
humoral immune responses were detected in BALB/c mice after immunization with
plasmids containing M, N, Sa and Sb SARS-CoV antigens. M antigen stimulated the
highest cellular immune response, while Sa and Sb antigens stimulated the highest
humoral immune response57
.
However, some candidate SARS vaccines have also been shown to exacerbate
pathogenesis. In another study, the use of recombinant vaccinia Ankara (rMVA)
expressing SARS-CoV S or N antigens did not prevent SARS-CoV infection in ferrets,
and immunized ferrets exhibited strong inflammatory responses and focal liver necrosis
after SARS-CoV challenge58
.
2. Immune System
The complex and dispersed network of the immune system protects us against
pathogens and foreign substances. The immune system is the second line of defense after

13
natural barriers such as skin, mucus membrane and mucosal secretions. The immune
system of humans and other vertebrates consists of two arms; innate and adaptive59-61
.
2.1 Innate immune system
The first defense to dangers after breakdown of natural barriers is the mechanisms
of the innate immune system. The innate immune system reacts against pathogen and
non-pathogen foreign substances by mobilization of innate immune cells and various
innate macromolecules in a rapid and nonspecific manner. Importantly, the innate
immune response to a pathogen does not generate immunological memory for future
encounters with the same pathogen59,60
.
Main functions of the innate immune system are vast and range from cell
recruitment to removal of debris62
. Importantly, cytokine and chemokine secretion leads
to cell maturation and the recruitment of the immune cells to the site of infection62
.
Hallmarks of innate immune activation include the release of acute phase proteins such as
serum amyloid A and C-reactive protein and activation of complement62,63
. Finally,
elimination of foreign substances and dead cells is accomplished by phagocytic cells
through ingestion by the process of phagocytosis63,64
. The phagocytosed matter can then
be presented to adaptive immune cells for the downstream activation of the adaptive
immune system64,65
.
Proinflammatory cytokines and acute phase proteins are important mediators for
recruitment of the immune cells to the site of infection65
. Recruited cells along with other

14
resident immune cells such as macrophages and dendritic cells initiate inflammation at
the site of infection65,66
. Immune cells are capable of sensing pathogen-associated
molecular patterns (PAMPs) of the pathogens by their pattern recognition receptors
(PRRS)62,63
. PAMPS are conserved structures of pathogens that are sensed by the innate
immune cells63
. Much attention has been paid to the role of a famous group of PAMPS
called toll-like receptors (TLRs). A total of nine mammalian TLRs are known, each one
capable of detecting different or overlapping viral, bacterial or microbial
structures(Figure 1-2)60,62
. TLRs are specific for viral PAMPS for example the ligand for
TLR3 is double-stranded RNA, while TLR7 ligand is single-stransed RNA. TLR4 is an
example of a TLR, capable of recognizing bacterial lipopolysaccharide (LPS)63,64
.
Ligation on the cell surface of the TLRs with its ligand activates cell signaling pathways
that often lead to the production of cytokines and antimicrobial molecules60,62
. TLR
ligation leads to the recruitment of adaptor proteins such as MyD88 and TIRAP to the
intracellular portion of the receptor. These molecules activate downstream protein
kinases in order to amplify the signal and subsequent transcription factor initiation.
Transcription factors such as NF-kB and IRF3 translocate to the nucleus to influence
gene regulation and generation or suppression of inflammatory response63-65
.

15
TLR1TLR2,lipopeptide
TLR2TLR6,lipopeptides
TLR5,flagellin
TLR4,LPSTLR2,
peptidoglycan
TLR3, dsRNA
TLR7, ssRNA
TLR8, ssRNA
TLR9, CPG DNA
Endosome
Nucleus
Leucine –rich motif
Cysteine-rich motifTIR domain
Figure 1-2: Location, domains and ligands of human TLRs (Adapted from cellular
and molecular immunology, Abbas et. al, 2012)

16
2.2 Adaptive immune system
The second part of the immune system is the adaptive immune system. Its
function is to specifically eliminate the foreign invasion and support the non-specific
innate immune system. Two unique aspects of the adaptive immune system are
specificity and the increased magnitude of response during a second encounter with an
antigen (memory). The adaptive immune response is fully developed approximately two
weeks following antigen encounter60,61
. Adaptive immune system is centered by B and T
lymphocytes and works by specific recognition of individual antigens. Both B cells and T
cells are dependent on their antigen receptors for recognition of antigens61,65
(Figure 1-3).
The somatic hypermutaion and recombination of antigen recognition gene segments
(V(D)J) on B and T cells allows the generation of a vast pool of antigen receptors. Each
specific antigen receptor can only be expressed on one B or T lymphocyte clone67
. The B
cell receptor complex is composed of two parts, a surface innmuoglobulin that is specific
for a given antigen on each clone of B cells and a signal transduction part called ig- / ig-
(CD79) dimmer that expands to the cytoplasm and each chain contains an
immunoreceptor tyrosine-based motif (ITAM)68
. A certain clone of B lymphocytes that is
specific for unique antigen, expands and produces one type of immunoglobulin that is
specific for one epitope67,69
.
The T cell receptor (TCR) on the surface of T lymphocytes is responsible for
recognizing peptide antigen fragments that are presented by antigen presenting cells
(APC) in the context of the MHC66
. Cytotoxic T cells, the effector arm of cell-mediated
immune response, are CD8+ T cells that react with peptide-MHC I complex on the
surface of APCs. Another subset of the T cells is T helper cells (CD4+) that bind peptide-
17
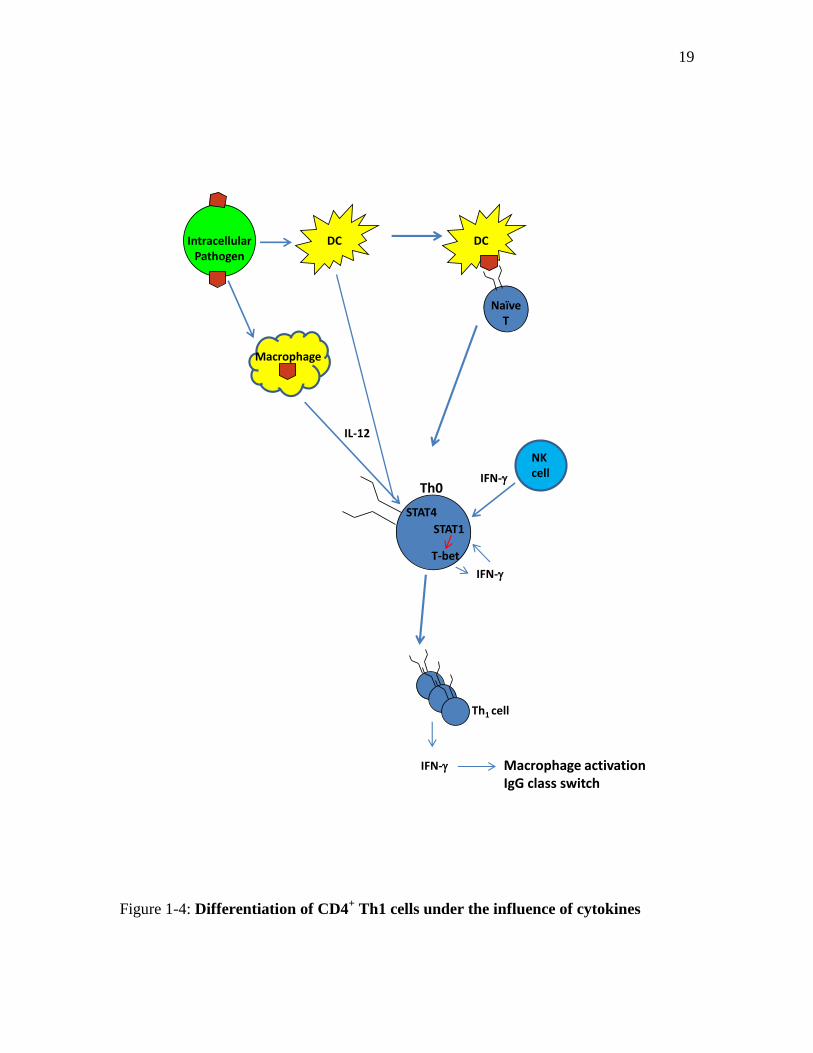
MHC II complexes with their TCR. T helper cells are sub classified into Th1, Th2 and
Th17 cells based on their cytokine profiles65
. The role of Th1 cells is to boost the cell-
mediated immune response, mainly by secretion of IFN- and IL-12(Figure 1-4)66
. Th2
cells promote the humoral immune response and mainly by secreting IL-4, IL-5 and IL-
13 that act to activate and maturate B cells(Figure 1-5)66
. Th17 cells are involved in
inflammatory responses and release cytokines such as IL-17, IL-17a, IL-21 and IL-
22(Figure 1-6)65,70
.
Another subset of CD4+ T cells are regulatory T cells that primarily secrete TGF-
and/or IL-10, and are pivotal for the maintenance of self tolerance as well as regulation
of the homeostasis of T cells pool 70
(Figure 1-7).

18
Pathogen
IL-4
APC
Th1
cell
IFN-
Tcytotoxic
Cell lysis andphagocytosis
B cell
Humoralimmunity
Cell-mediatedimmunity
Infected cell
Plasma cell
Figure 1-3: Antigen uptake and development of humoral and cell-mediated adaptive
immune responses
19
DCIntracellularPathogen
Th0
NaïveT
Macrophage
DC
NKcellIFN-
IL-12
STAT1
STAT4
T-bet
IFN-
Th1 cell
IFN- Macrophage activationIgG class switch
Figure 1-4: Differentiation of CD4+ Th1 cells under the influence of cytokines

20
IgE class switchEosinophil activationMucosal secretion
DCParasite
Th0
NaïveT
DC
Mastcell
IL-4
STAT6GATA-3
NFAT
IL-4
IL-4IL-5IL-13
Th2 cell
Figure 1-5: Differentiation of CD4+ Th2 cells under the influence of cytokines

21
DCBacteria, fungi
Th0
NaïveT
DC
Eosinphils?
IL-1IL-6
STAT3
IL-21 gene
InflammationBarrier function
IL-21
IL-17IL-22
Th17 cell
TGF-
RORtDC
IL-23
Figure 1-6: Differentiation of CD4+ Th17 cells under the influence of cytokines

22
DC
Th0
NaïveT
DC
IL-10
FOXP3
IL-21 gene
Immune suppressionInducible regulatory T cell(CD3+CD4+CD25+FOXP3+
TGF-
CD25
Self peptide
Figure 1-7: Differentiation of CD4+ regulatory T cells under the influence of
cytokines

23
2.3 Inflammation and lymphocyte activation
T and B lymphocytes with their specific receptors for approximately 107 different
antigens are essential parts of the adaptive immune response. In their encounter with
antigen, each single clone of lymphocytes undergoes clonal expansion and thus, from a
small pool of lymphocytes a large group of effector cells is generated, which is highly
specific for a given pathogen60,71
. T cells play a central role in adaptive immunity. CD8+
cytotoxic T cells are involved in direct killing of virally infected cells via recognition of
processed antigen in the context of MHC I. CD4+ T cells provide help to B cells and
cytotoxic T cells after recognition of antigen-MHC II complex and expansion into Th1,
Th2 or Th17 subsets that was discussed earlier65,72
.
Activation of naïve T cells occurs in the secondary lymphoid organs, including
regional lymph nodes; mucosa associated lymphoid tissues and spleen. Naïve T cells
circulate in the body and enter these organs; if do not encounter antigens presented by
dendritic cells, they leave the organ and recirculate73
. Average time that a lymphocyte
stays in a secondary organ in the absence of its specific antigen is one day73
. Immature
dendritic cells at the site of viral infection take up antigens and after maturation migrate
to secondary lymphoid organs and present antigens to T cells. In steady estate, DCs
continuously migrate from tissues to the regional lymph nodes at a very low level but
their migration will be increased upon increased CCR7 expression during inflammatory
conditions74
. Migration of DCs starts a few hours after infection and maximizes in the
first or second day post infection75
. After antigen stimulation and clonal expansion, which
usually takes 4-8 days, effector T cells leave the secondary lymphoid organs and migrate

24
to the site of infection. Generation of effector cells will be faster if the number of specific
clones for a given pathogen is higher76,77
.
Activation of Naïve T cells and their entrance to lymph nodes is regulated by a
multistep process in which adhesion molecules (e.g. L-selectin and LFA-1) and
chemokines (CCL19 and CD21) play a key role. Naïve T cells through L-selectin weakly
adhere to L-selectin ligand on high endothelial venules (HEV) of the lymph nodes. Stable
adhesion of naïve T cells occurs through the interaction of LFA-1 on T cells and ICAM-1
on HEV. The avidity of ICAM-1 is increased by bound CCL19 and CCL21 on the
surface of HEV77
. Furthermore, interaction of these chemokines with their receptor
CCR7 leads to complete arrest of naïve T cells. Now naïve T cells are ready for
extravascular migration to the T cell zone where the CCL19 and CCL21 concentration is
the highest. Naïve T cells approximately stay for one day if antigen encounter does not
happen and then exit lymph nodes and recirculate and enter to other lymph nodes or
secondary lymphoid organs77,78
. A chemoattractant called sphingosine phosphate one
(S1P) and its receptor sphingosine phosphate one receptor (S1PR) is responsible for the
exit of naïve T cells. The blood level of S1P is high and the expression of S1PR on naïve
T cells is low because at high S1P concentrations, S1PR gets internalized. S1P
concentration in secondary lymphoid tissues such as lymph nodes is low. If T cell
activation does not happen, higher levels of S1PR on naïve T cells are expressed which
leads to the exit of T cells under the influence of higher concentration of S1P in
circulation79-81
.
Upon antigen encounter, activated T cells express CD69, which blocks S1PR
expression on T cells and causes their retention in lymph node. This provides T cells

25
enough time to undergo clonal expansion. At the end of expansion, the decrease of CD69
results in re-expression of S1PR on effector T cells and their exit from lymph node. Other
important events are the reduction of CCR7 and L-selectin expression, which is in the
favor of effector T cell exit81,82
.
Effector T cells migrate to the site of infection under the influence of other sets of
adhesion molecules and chemokine receptors. At the site of infection and in response to
pathogens, proinflammatory cytokines such as IL-1 are secreted, which increases the
expression of P-selectin, E-selectin and ICAM-1 on the surface of endothelial cells of
post capillary venules. Expression of CXCR3 on cytotoxic T cells attracts them toward
the high gradient of CXCL9, CXCL10 and CXCL1177,78
. Interaction of adhesion
molecules on endothelial cells with their ligands on T cells causes their rolling and arrest
and extravascular migration to the site of infection. Migration of other effector cells such
as Th1 cells, Th2 cells and Th17 cells is under the control of CXCR3 and CCR5; CCR4;
and CCR6 respectively72
. B cells use the same basic rules for their migration and
activation. Immature B cells leave the bone marrow and enter the red pulp of the spleen
and move into the white pulp in response to CXCL13 (CXCR5 ligand). B cells stay for
one day and then reenter the circulation after maturation and home to bone marrow,
regional lymph nodes or mucosa by similar mechanisms that explained for T cells74,78
(Figure 1-8).

26
APC
Pathogen
T cell
Plasma cell
Pathogen
Tcytotoxic
Infected cell
Apoptosis
B cellT cell
Memory
Day 0Antigenrecognition
Day 21Memoryformation
Day 14Adaptiveimmunity
Day 4-8Clonalexpansion
Magnitude of response
Effectorcell
B cell
Figure 1-8: Development of adaptive immune response (Adapted from cellular and
molecular immunology, Abbas et. al., 2012).

27
2.4 Interferons
The name interferons originate from their ability to “interfere” with viral
replication in host cells. Interferons are a family of cytokines involved in host immune
responses against viruses, bacteria and parasites. Type I interferons (IFN-,IFN-IFN-
IFN-and IFN- and type II interferon (IFN-) are involved in innate and adaptive
immune responses, respectively83
. Separate genes encode 13 members of IFN- family.
Type I IFNs are mainly secreted by monocytes/macrophages. There is only one IFN-
which is mostly secreted by fibroblasts. IFN- and IFN- are highly inducible by viruses
and synthetic double-stranded RNA83
. All type I interferons bind to the same
heterodimeric cell surface receptor made up from IFN receptor chain 1 (IFNAR1) and
IFN receptor chain 2 (IFNAR2)84
. Incubation of peripheral blood mononuclear cells
(PBMCs) of healthy individuals with SARS-CoV resulted in the production of IFN- as
well as IFN- in a dose-dependent manner85
. Inhibition of viruses by IFN- occurs
through interferon regulated genes (IRGs) such as 2’-5’ oligoadenylate synthase (OAS),
Myxovirus resistant 1 (MX1), interferon stimulated gene 15 (ISG15) and also through the
increase of NK cell activity, downregulation of MHC II expression and upregulation of
MHC I expression47
. Treatment of SARS patients with IFN- in conjunction with other
therapies such as corticosteroids may have provided clinical benefit during the SARS
outbreaks in Toronto86
.
IFN- is the 17 KD product of a single gene87
. Th1 CD4+ cells, CD8
+ cells and
NK cells are IFN- producing cells. IL-12 and IL-18 are capable of inducing the
production of IFN- and their synergistic function leads to production of higher levels of

28
IFN-88
. T cells produce IFN- upon stimulation by IFN- and IFN-. Similar to IFN-,
IFN- prevents viral replication by upregulation of many IRGs. The receptor for IFN- is
a heterodimer of two chains (IFNGR1 and IFNGR2)89
. IFN- activates
monocytes/macrophages and neutrophils and induces respiratory burst for killing the
phagocytosed pathogens and therefore boosts the innate immune system. Both MHC I
and MHC II are upregulated following the stimulation of cells with IFN-. Differentiation
of CD4+ cells to Th1 cells and inhibition of Th2 cells is under the influence of IFN-.
IFN- is a more potent activator of NK cells than type I interferons88,89
.
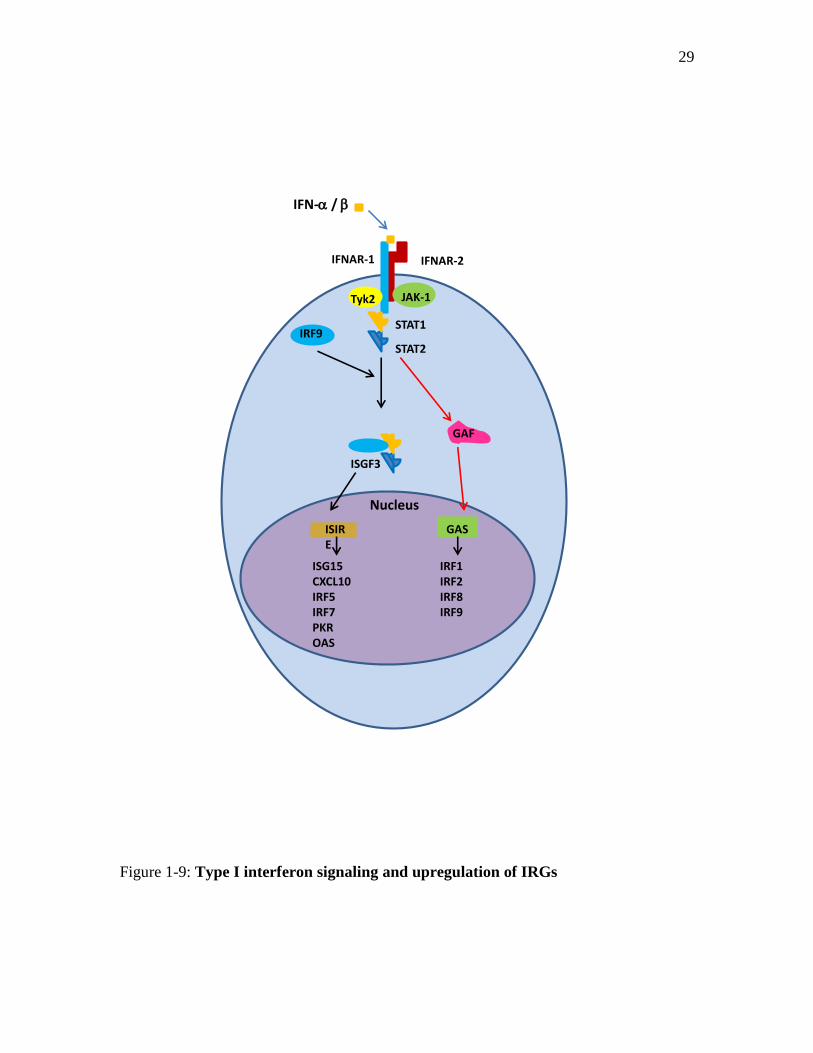
Signal transduction of IFN- and IFN- is distinct but partially overlaps.
Phosphorylation of Janus Kinase 1 (JAK1) and Tyrosine Kinase 2 (Tyk2) occurs after
ligation of IFN- to its receptor89
. This leads to phosphorylation of Signal Transducer
and Activator of Transcription 1 and 2 (STAT1 and STAT2). The STAT1-STAT2
heterodimer binds to Interferon Regulatory Factor 9 (IRF-9) and generates a complex
called Interferon Stimulatory Factor 3 (ISGF3). ISGF3 binds to Interferon-Stimulated
Response Element (ISRE) followed by activation and transcription of IRGs (Figure 1-
9)89,90
.
Stimulation of IFN- receptor by it’s ligand leads to phosphorylation of JAK1 and
JAK290
. This in turn leads to the phosphorylation and dimerization of STAT1. STAT1
dimers interact with Gamma Activation Site (GAS) in the nucleus that is located in the
promoter of many target genes such as IRF-1, IRF-9, Inducible Nitric Oxide Synthase-2
(iNOS-2) and Suppressor of Cytokine Signaling-1 (SOCS-1)90-92
.
29
IFNAR-2
IFN- /
IFNAR-1
Nucleus
JAK-1Tyk2
STAT1
STAT2
GAS
GAF
IRF9
ISGF3
ISIRE
ISG15CXCL10IRF5IRF7PKROAS
IRF1IRF2IRF8IRF9
Figure 1-9: Type I interferon signaling and upregulation of IRGs
30
2.5 Interferon regulated genes
Regulation of hundreds of genes downstream of the IFN signaling pathway
triggers the production of antiviral molecules in virally infected cells. In turn, viruses
have evolved strategies to avoid the IFN system. Understanding of virus-host interaction
is an exciting field of IFN research86
.
The downstream signaling pathways of type I and type II IFNs share similarities
but also have differences. While the STAT1-STAT2 heterodimer is present downstream
of type I interferons signaling pathway, the STAT1 homodimer is the dominant complex
downstream of the type II IFN pathway, accompanied with a lower engagement of
STAT1-STAT2 heterodimer93
. ISRE-mediated gene activation downstream of type I
interferons mainly leads to upregulation of ISG15, CXCL10, IRF-5, IRF-7, OAS, PKR,
while GAS-mediated gene activation downstream of type II interferon mainly leads to
upregulation of IRF-1, IRF-2, IRF-8 and IRF-994
. There are many other genes that are
shared between the two pathways (e.g. MX1, MHC I, etc). For a detailed list of IRGs,
please refer to IRGs database at http:www.lerner.ccf.org/labs/williams/.
Cross-talk also exists between type I and type II IFN pathways. Upon stimulation
of the type II IFN receptor and upregulation of IRF-1 and IRF-2, these two transcriptional
factors bind to the ISRE element, boosting the upregulation of downstream genes of type
I IFNs. Following the stimulation of type I IFNs, STAT5 and CrKL (V-crk sarcoma
virus CT10 oncogene homolog (avian)-like) are phosphorylated and heterodimerized, and
are then capable of binding to the GAS element and boosting the upregulation of the
Type II interferon signaling pathway93,94
.

31
IRGs exert their effect through different mechanisms, such as the direct targeting
of viral entry, the inhibition of protein synthesis or the degradation of viral RNA. Some
well-known IRGs and their functions are as follows; MX1 is a dynamin-like large
guanosine triphosphatase (GTPase), which has antiviral activity against a wide range of
RNA viruses. The antiviral activity of MX1 is effective at the early stages of the viral
cycle in the nucleus or cytoplasm95
. OAS is an adenylate synthetase that uses adenosine
triphosphate to synthesize 2’,5’-oligoadenylates. The latter activate latent RNase L that
is involved in the degradation of viral RNA96
. ISG15 is an ubiquitin-like enzyme that
covalently conjugates to a large number of cellular proteins; however this does not
usually lead to protein degradation. In the case of HIV-1, ISG15 inhibits the release of
virions97
.
2.6 CXCL10 (IP-10)
One of the IRGs downstream of IFN signaling pathway is a chemokine, CXCL10,
also known as IFN- inducible protein 10 (IP-10)98
. CXCL10 has been associated with
Th1-like diseases99
. Chemokines are a family of cytokines with chemoatractic, mitogenic
and immunomodulatory activities98
. The molecular weight of CXCL10 is 10 KD.
CXCL9, CXCL10 and CXCL11 are CXC chemokines, sharing the same seven
transmembrane G protein coupled receptor called CXCR3100
.
CXCL10 expression in thymic, splenic, and lymph node stromal cells is
constitutive at a low level101
. CXCL10 is highly inducible in endothelial cells,
monocytes, fibroblasts, keratinocytes, neutrophils, astrocytes, activated T cells99
. It has

32
been demonstrated that IFN-, IFN-, IFN-ß, TNF-, IL-1 ß, monocyte-colony
stimulating factor (M-CSF) and also exogenous factors including viruses and LPS can
induce CXCL10 production102
. The type of stimulant and stimulated cell may be
important in the magnitude of CXCL10 expression. For example, many cell types show
stronger response to IFN-, but skin fibroblasts are better responders to TNF-102
.
CXCR3 is a seven transmembrane receptor that is expressed on activated Th1
cells, activated CD8+ T cells, memory CD4
+ cells, memory CD8
+ T cells, NK cells,
dendritic cells, leukemic B cells, eosinophils and dividing microvascular endothelial
cells99
.
CXCL9, CXCL10 and CXCL11 function as chemoattractants for T lymphocytes,
B lymphocytes and natural killer cells103
, although their induction patterns are not the
same. In experimentally induced hepatitis of mice with adenovirus, accumulation of T
lymphocytes in liver is dependent on simultaneous upregulation of CXCL9 and
CXCL10104
. In an allograft rejection model, CXCL10 was expressed in the heart tissue
within 1 day, while CXCL9 was detected after 3 days post-transplantation105
. Infection of
mice with Lymphocytic Choriomeningitis Virus (LCMV) results in high levels of
CXCL10 expression in the pancreas 1 day post-infection, but there was no significant
change of CXCL9 and CXCL11106
.
CXCL10 level of expression is increased in psoriasis, multiple sclerosis,
rheumatoid arthritis, transplant rejection, inflammatory bowel diseases, viral meningitis,
pulmonary sarcoidosis, and chronic hepatitis, suggesting its correlation with Th1-type
diseases107
. CXCL10 expression could be beneficial or detrimental depending on the

33
disease type. Interestingly, non-obese diabetic (NOD) mice, vaccinated with CXCL10
DNA are protected from spontaneous diabetes108
. Neutralization of CXCL10 in mice
prevents the disease progression in Th1-dominant type I diabetes108
. As well,
neutralization of CXCL10 or blocking of its receptor (CXCR3) results in reduced HIV-1
replication109
. Furthermore, CXCL10 expression is necessary for the clearance of mouse
hepatitis virus (MHV)110
. Neutralization of CXCL10 led to increased mortality and
delayed viral clearance of MHV110
.
2.7 Immune System and SARS
The mortality rate in SARS patients older than 65 years was greater than 50%,
while children presented with mild symptoms111,112
. SARS patients treated with
corticosteroids showed less lung injuries and IFN- therapy was effective in SARS
treatment47,52
. These findings are suggestive of the immune system as a key player in
SARS containment and progress. Pathological studies also suggested an important role
for the immune system in SARS pathogenesis113
. It has been demonstrated that the
number of alveolar macrophages were significantly increased in the lung after infection
with SARS-CoV113
. Infiltration of B and T lymphocytes has been reported in lung
biopsies of deceased SARS patients. Patients that were not treated with corticosteroids
demonstrated greater infiltration of immune cells113
.
Measurement of blood cytokine levels in SARS patients at disease onset would be
valuable in determining the magnitude, specificity and quality of immune response to
SARS-CoV99-100-101
.

34
2.8 Immunopathology of SARS
The two types of alveolar cells are type I and type II pneumocytes also known as
“squamous alveolar cells” and “great alveolar cells”, respectively. Pneumocyte II is the
primary target of SARS-CoV114
. The interaction occurs between spike glycoprotein of the
virus and ACE2 on the surface of these cells. Pneumocyte II cells are located at the
angles between alveolar septa and make up 12% of the lung cells115
. They differentiate
into pneumocyte I cells and produce pulmonary surfactant proteins. Diffuse alveolar
damage (DAD) in SARS is suggested to be the result of penumocyte II destruction during
the immune inflammatory response against SARS-CoV116
. The pathology of SARS is
defined as acute phase, proliferative phase and fibrotic phase. DAD usually develops in
the acute phase of the infection. Pneumocyte II cells undergo regenerative hyperplasia in
the proliferative phase117
. Metaplasia of pneumocyte I cells, formation of fibrin in
pulmonary vessels and focal honeycomb fibrosis are other outcomes of infection with
SARS-CoV. Infiltration of CD3+ T cells, CD20
+ B cells, CD4
+ and CD8
+ cells to the lung
has been shown, which may lead to more injury in the lungs of SARS patients117
. CD8+
cells were the most common infiltrating cells, whereas CD56+ NK cells were absent.
Infiltration of lymphoid cells was lower in patients who received higher doses of
corticosteroids117,118
. It is believed that SARS is a systemic disease and systemic cytokine
activation might have a great impact on the multi organ involvement118,119
. Spleen
lymphoid depletion was observed in many SARS patients with complicated outcomes.
Lymphopenia and depletion of spleen from lymphoid cells may be correlated to cytokine
involvement120
.

35
Other pathological features of SARS that were reported in some patients might be
due to hypoxemia (O2 saturations less than 95% in blood). Pathological features of SARS
in non-respiratory organs, including skeletal muscle fiber necrosis, heart muscle fiber
necrosis, necrotic lesions in the adrenal gland, acute tubular necrosis of kidney and
hepatitis is suggested as hypoxemia effects115,120
. There was no evidence of encephalitis
or any specific damage to the brain in SARS patients117
.
2.9 Cytokines and SARS
The main role of cytokines is to orchestrate the innate and adaptive immune
responses against pathogens. TLRs are involved in the recognition of pathogens and the
activation of downstream transcription factors such as NFB and production of
proinflammatory cytokines121
. TNF-, IL-1 and IL-6 are three cytokines known as early
response cytokines122
. Chemokine and adhesion molecule upregulation by TNF-, lead to
the recruitment of leukocytes to the site of infection123
. Chemokine receptors are
expressed on many immune and non-immune cell types. They play an important role in
polarized immune responses. CXCL10 is an example of a chemokine that boosts Th1
response124
.
In vitro and in vivo studies have shown a strong association between blood
cytokines and the pathologic outcomes of SARS infection. The existence of a cytokine
storm in SARS patients with non-favorable outcomes has been suggested by many
investigators125
. In one study, the serum level of IFN-, IL-1, IL-6, IL-12, IL-8, MCP-1
and CXCL10 were significantly increased one week post-infection with SARS-CoV non-

36
favorable outcomes. While IFN- and CXCL10 (Th1 cytokines) were elevated in this
study, the level of IL-10 (anti-inflammatory) and IL-4 (Th2 cytokine) remained
unchanged125
. In another study IL-6 upregulation in the peripheral blood of SARS
patients was correlated to the severity of the disease. Furthermore, the level of IL-1 and
TNF- was not significantly changed in this study126
. While CXCL10 was elevated in
early and progressive stages of SARS, the level of IL-1, IL-2, IL-4, IL-10, IL-12, TNF-
, IFN- and RANTES was normal in another cohort of patients127
. Tang et al. has also
shown the adverse association of the CXCL10, CXCL9 and IL-8 levels with the severity
of the disease128
. Huang et al. found increased levels of IFN-, IL-18, TGF-, IL-6,
CXCL10, CCL2, CXCL9 and IL-8 in SARS patients129
. Elevated levels of IL-1 and
normal levels of IL-6, TNF-, IL-12 and IL-8 were observed in children infected with
SARS-CoV111
. A significant increase in inflammatory cytokines in the peripheral blood
could be an indication of high levels of these soluble factors at the site of infection and
leak to the blood stream. This may lead to infiltration of leukocyte subpopulations and
generation of exaggerated immune response at the site of infection. As the measurement
of cytokine levels in the lungs of SARS patients is difficult, the use of an appropriate
animal model would be of great importance.
2.10 IRGs and SARS
In most SARS patients the illness resolved with no need for hospitalization3,6
. As
stated above, activation of interferon regulated genes (IRGs) and modulation of innate
and adaptive immunity is partly controlled by interferons. Some scientists have linked the

37
severity of SARS with poor interferon responses1,6,18
. Other studies have shown a direct
correlation between high levels of expression of some IRGs such as CCL2 and CXCL10
with the severity of the disease129
. It was shown that single-nucleotide mutations in the
sOAS1 and MX1 gene were associated with poor outcome in SARS patients130,131
. The
peak expression level of IRGs was during the acute phase of the disease and their
resolution was associated with the recovery in patients with good outcome. IFNAR1 and
IFNGR1 were upregulated in patients with poor outcome, while majority of the
remaining IRGs were downregulated in these patients86
. Evaluation of IRG expression in
a controlled study in an animal model would be beneficial, as poor upregulation of IRGs
in SARS patients is associated with poor outcome. Also it would be important to find out
how the IRG expression can be improved, for example by using therapeutic agents.
2.11 SARS and leukopenia
Pulmonary infiltration and air-space consolidation at the acute phase of SARS
was shown by chest radiography115
. Leukopenia and significant reduction of lymphocyte
subpopulations in peripheral blood of SARS patients was also shown. Absolute count of
T lymphocytes (CD3+), T helper cells (CD4
+) and T cytotoxic cells (CD8
+) was
significantly decreased during the first week in one study132
. Similar observations were
reported by other investigators, showing the existence of leukopenia in SARS
patients120,133
.
38
3. SARS animal models
Several animal models have been used for the in vivo study of SARS-CoV
infection. SARS-CoV replicates in the lung of Cynomolgus macaques with minimal
clinical symptoms52,120,134
. The virus replicates in mice as well, but rapid clearance and
absence of the disease symptoms have limited the use of this animal model109
.
Ferrets are susceptible to infection with SARS-CoV and the virus replicates well
in their lungs134
. They are capable of transmitting the virus to other uninfected ferrets
housed with them. Ferrets shed the virus from pharynx two days post-infection. Infected
animals present a number of symptoms similar to those seen in humans, such as lethargy
and elevated body temperature134
. Histological changes and pathologic changes in lung
necropsies of infected ferrets have been shown135
. It has been suggested that the ferret is a
more appropriate animal model for SARS compared to murine and primate models.
Martina et al. have shown that from 6 ferrets infected with SARS-CoV, 4 showed SARS
symptoms such as pharyngeal shedding, lethargy and lung lesions and one died at day
7134-136
.
4. Hypothesis
My general hypothesis is that unbalanced expression of interferon regulated genes
at early stages of infection with SARS-CoV is correlated with the severity of illness.
Specifically, the high and persistent expression of CXCL10 is associated with
severity of SARS in humans. Moreover, SARS-CoV infection in ferrets is associated with

39
upregulation of CXCL10 and poor upregulation of protective IRGs (MX1, OAS1, OAS2,
IG15 and IFI44).
5. Objectives
The objective of this study was to evaluate early immune responses in ferrets after
their infection with SARS-CoV. Specifically, I sought to investigate the role of interferon
regulated genes such as CXCL10 during severe SARS infection in humans. With the aim
of utilizing ferrets as an immune animal model of SARS, SARS-CoV infected ferrets
were examined to determine if the IRG profiles were similar to those of SARS infected
human patients.
Here, I propose that high levels of CXCL10, an interferon regulated gene, is
associated with poor outcome and disease progression in SARS-CoV-infected humans
and ferrets.
Subsequently, I investigated the interferon regulated genes role in the generation
of an antiviral state in SARS-CoV-infected ferrets. Furthermore, I went on to determine
if the profile of ferret interferon regulated genes was similar to that of injected ferrets
with IFN-2b in the hopes of delineating the interferon signaling post SARS infection. I
propose that there are similarities and differences between SARS-CoV-infected ferrets
and IFN-2b-injected ferrets in terms of expression of interferon regulated genes, which
may suggest the benefits of IFN therapy in possible future outbreaks of SARS.
Furthermore, localization of CD8+ cells may contribute to tissue injury in the
ferret model of SARS. The characterized ferret CD8 gene and generated reagents for
ferret CD8 molecule in this thesis can be used in future studies to examine the

40
localization of CD8+ T lymphocytes in the lung of SARS-CoV infected ferrets and its
role in SARS pathology.
41
Reference List
1. Cowling,B.J. et al. Community psychological and behavioral responses through
the first wave of the 2009 influenza A(H1N1) pandemic in Hong Kong. J. Infect.
Dis. 202, 867-876 (2010).
2. Jin,Y. et al. Prevalence and clinical characteristics of human CoV-HKU1 in
children with acute respiratory tract infections in China. J. Clin. Virol. 49, 126-
130 (2010).
3. Lee,N. et al. A major outbreak of severe acute respiratory syndrome in Hong
Kong. N. Engl. J. Med. 348, 1986-1994 (2003).
4. Li,W. et al. Animal origins of the severe acute respiratory syndrome coronavirus:
insight from ACE2-S-protein interactions. J. Virol. 80, 4211-4219 (2006).
5. Lau,E.H. et al. A comparative epidemiologic analysis of SARS in Hong Kong,
Beijing and Taiwan. BMC. Infect. Dis. 10, 50 (2010).
6. Poutanen,S.M. et al. Identification of severe acute respiratory syndrome in
Canada. N. Engl. J. Med. 348, 1995-2005 (2003).
7. Breslin,J.J. et al. Human coronavirus 229E: receptor binding domain and
neutralization by soluble receptor at 37 degrees C. J. Virol. 77, 4435-4438 (2003).
8. Manocha,S., Walley,K.R. & Russell,J.A. Severe acute respiratory distress
syndrome (SARS): a critical care perspective. Crit Care Med. 31, 2684-2692
(2003).
9. Vincent,A.L. et al. Characterization of an influenza A virus isolated from pigs
during an outbreak of respiratory disease in swine and people during a county fair
in the United States. Vet. Microbiol. 137, 51-59 (2009).
10. Mahony,J.B. et al. Multiplex PCR tests sentinel the appearance of pandemic
influenza viruses including H1N1 swine influenza. J. Clin. Virol. 45, 200-202
(2009).
11. Dawood,F.S. et al. Emergence of a novel swine-origin influenza A (H1N1) virus
in humans. N. Engl. J. Med. 360, 2605-2615 (2009).
12. Perez-Padilla,R. et al. Pneumonia and respiratory failure from swine-origin
influenza A (H1N1) in Mexico. N. Engl. J. Med. 361, 680-689 (2009).
13. Deyde,V.M. et al. Detection of molecular markers of drug resistance in 2009
pandemic influenza A (H1N1) viruses by pyrosequencing. Antimicrob. Agents
Chemother. 54, 1102-1110 (2010).

42
14. Nougairede,A. et al. Likely correlation between sources of information and
acceptability of A/H1N1 swine-origin influenza virus vaccine in Marseille,
France. PLoS. One. 5, e11292 (2010).
15. Horney,J.A., Moore,Z., Davis,M. & MacDonald,P.D. Intent to receive pandemic
influenza A (H1N1) vaccine, compliance with social distancing and sources of
information in NC, 2009. PLoS. One. 5, e11226 (2010).
16. Maurer,J., Uscher-Pines,L. & Harris,K.M. Perceived seriousness of seasonal and
A(H1N1) influenzas, attitudes toward vaccination, and vaccine uptake among
U.S. adults: does the source of information matter? Prev. Med. 51, 185-187
(2010).
17. Lau,Y.F., Tang,L.H., Ooi,E.E. & Subbarao,K. Activation of the innate immune
system provides broad-spectrum protection against influenza A viruses with
pandemic potential in mice. Virology 406, 80-87 (2010).
18. Giamarellos-Bourboulis,E.J. et al. Effect of the novel influenza A (H1N1) virus in
the human immune system. PLoS. One. 4, e8393 (2009).
19. Chen,J. et al. Cellular immune responses to severe acute respiratory syndrome
coronavirus (SARS-CoV) infection in senescent BALB/c mice: CD4+ T cells are
important in control of SARS-CoV infection. J. Virol. 84, 1289-1301 (2010).
20. Lau,S.K. et al. Ecoepidemiology and complete genome comparison of different
strains of severe acute respiratory syndrome-related Rhinolophus bat coronavirus
in China reveal bats as a reservoir for acute, self-limiting infection that allows
recombination events. J. Virol. 84, 2808-2819 (2010).
21. Li,F. Structural analysis of major species barriers between humans and palm
civets for severe acute respiratory syndrome coronavirus infections. J. Virol. 82,
6984-6991 (2008).
22. Yu,I.M. et al. Recombinant severe acute respiratory syndrome (SARS)
coronavirus nucleocapsid protein forms a dimer through its C-terminal domain. J.
Biol. Chem. 280, 23280-23286 (2005).
23. Woo,P.C. et al. Characterization and complete genome sequence of a novel
coronavirus, coronavirus HKU1, from patients with pneumonia. J. Virol. 79, 884-
895 (2005).
24. Rota,P.A. et al. Characterization of a novel coronavirus associated with severe
acute respiratory syndrome. Science 300, 1394-1399 (2003).
25. Marra,M.A. et al. The Genome sequence of the SARS-associated coronavirus.
Science 300, 1399-1404 (2003).
43
26. Ortego,J., Escors,D., Laude,H. & Enjuanes,L. Generation of a replication-
competent, propagation-deficient virus vector based on the transmissible
gastroenteritis coronavirus genome. J. Virol. 76, 11518-11529 (2002).
27. He,Y., Li,J. & Jiang,S. A single amino acid substitution (R441A) in the receptor-
binding domain of SARS coronavirus spike protein disrupts the antigenic
structure and binding activity. Biochem. Biophys. Res. Commun. 344, 106-113
(2006).
28. Jeffers,S.A. et al. CD209L (L-SIGN) is a receptor for severe acute respiratory
syndrome coronavirus. Proc. Natl. Acad. Sci. U. S. A 101, 15748-15753 (2004).
29. Kuba,K. et al. A crucial role of angiotensin converting enzyme 2 (ACE2) in
SARS coronavirus-induced lung injury. Nat. Med. 11, 875-879 (2005).
30. Imai,Y. et al. Angiotensin-converting enzyme 2 protects from severe acute lung
failure. Nature 436, 112-116 (2005).
31. Grigoriev,A. Mutational patterns correlate with genome organization in SARS
and other coronaviruses. Trends Genet. 20, 131-135 (2004).
32. Lai,M.M. SARS virus: the beginning of the unraveling of a new coronavirus. J.
Biomed. Sci. 10, 664-675 (2003).
33. Qinfen,Z. et al. The life cycle of SARS coronavirus in Vero E6 cells. J. Med.
Virol. 73, 332-337 (2004).
34. Stadler,K. et al. SARS--beginning to understand a new virus. Nat. Rev. Microbiol.
1, 209-218 (2003).
35. Lang,Z. et al. Pathological study on severe acute respiratory syndrome. Chin Med.
J. (Engl. ) 116, 976-980 (2003).
36. Yan,H. et al. SARS coronavirus induces apoptosis in Vero E6 cells. J. Med. Virol.
73, 323-331 (2004).
37. Chan,K.H. et al. The Effects of Temperature and Relative Humidity on the
Viability of the SARS Coronavirus. Adv. Virol. 2011, 734690 (2011).
38. Rabenau,H.F., Kampf,G., Cinatl,J. & Doerr,H.W. Efficacy of various
disinfectants against SARS coronavirus. J. Hosp. Infect. 61, 107-111 (2005).
39. Lim,W., Ng,K.C. & Tsang,D.N. Laboratory containment of SARS virus. Ann.
Acad. Med. Singapore 35, 354-360 (2006).
40. LaBarre,D.D. & Lowy,R.J. Improvements in methods for calculating virus titer
estimates from TCID50 and plaque assays. J. Virol. Methods 96, 107-126 (2001).

44
41. Leong,H.N. et al. Clinical and laboratory findings of SARS in Singapore. Ann.
Acad. Med. Singapore 35, 332-339 (2006).
42. Liang,G. et al. Laboratory diagnosis of four recent sporadic cases of community-
acquired SARS, Guangdong Province, China. Emerg. Infect. Dis. 10, 1774-1781
(2004).
43. Muller,M.P. et al. Early diagnosis of SARS: lessons from the Toronto SARS
outbreak. Eur. J. Clin. Microbiol. Infect. Dis. 25, 230-237 (2006).
44. Hui,D.S. et al. Severe acute respiratory syndrome: correlation between clinical
outcome and radiologic features. Radiology 233, 579-585 (2004).
45. Muller,M.P. et al. Can routine laboratory tests discriminate between severe acute
respiratory syndrome and other causes of community-acquired pneumonia? Clin.
Infect. Dis. 40, 1079-1086 (2005).
46. Fan,C.K. et al. Clinical and laboratory features in the early stage of severe acute
respiratory syndrome. J. Microbiol. Immunol. Infect. 39, 45-53 (2006).
47. Loutfy,M.R. et al. Interferon alfacon-1 plus corticosteroids in severe acute
respiratory syndrome: a preliminary study. JAMA 290, 3222-3228 (2003).
48. Schroeder,J.A. et al. Microwave-assisted tissue processing for same-day EM-
diagnosis of potential bioterrorism and clinical samples. Micron. 37, 577-590
(2006).
49. Leong,H.N. et al. Investigational use of ribavirin in the treatment of severe acute
respiratory syndrome, Singapore, 2003. Trop. Med. Int. Health 9, 923-927 (2004).
50. Wang,W.K. et al. Temporal relationship of viral load, ribavirin, interleukin (IL)-
6, IL-8, and clinical progression in patients with severe acute respiratory
syndrome. Clin. Infect. Dis. 39, 1071-1075 (2004).
51. Barnard,D.L. et al. Enhancement of the infectivity of SARS-CoV in BALB/c
mice by IMP dehydrogenase inhibitors, including ribavirin. Antiviral Res. 71, 53-
63 (2006).
52. Haagmans,B.L. et al. Pegylated interferon-alpha protects type 1 pneumocytes
against SARS coronavirus infection in macaques. Nat. Med. 10, 290-293 (2004).
53. ter Meulen,J. et al. Human monoclonal antibody as prophylaxis for SARS
coronavirus infection in ferrets. Lancet 363, 2139-2141 (2004).
54. Gao,W. et al. Effects of a SARS-associated coronavirus vaccine in monkeys.
Lancet 362, 1895-1896 (2003).

45
55. Yang,Z.Y. et al. A DNA vaccine induces SARS coronavirus neutralization and
protective immunity in mice. Nature 428, 561-564 (2004).
56. Huang,J., Ma,R. & Wu,C.Y. Immunization with SARS-CoV S DNA vaccine
generates memory CD4+ and CD8+ T cell immune responses. Vaccine 24, 4905-
4913 (2006).
57. Wang,Z., Yuan,Z., Matsumoto,M., Hengge,U.R. & Chang,Y.F. Immune
responses with DNA vaccines encoded different gene fragments of severe acute
respiratory syndrome coronavirus in BALB/c mice. Biochem. Biophys. Res.
Commun. 327, 130-135 (2005).
58. Czub,M., Weingartl,H., Czub,S., He,R. & Cao,J. Evaluation of modified vaccinia
virus Ankara based recombinant SARS vaccine in ferrets. Vaccine 23, 2273-2279
(2005).
59. Tan,A.T. et al. A longitudinal analysis of innate and adaptive immune profile
during hepatic flares in chronic hepatitis B. J. Hepatol. 52, 330-339 (2010).
60. Liu,G., Zhang,L. & Zhao,Y. Modulation of immune responses through direct
activation of Toll-like receptors to T cells. Clin. Exp. Immunol. 160, 168-175
(2010).
61. Ricklin,D., Hajishengallis,G., Yang,K. & Lambris,J.D. Complement: a key
system for immune surveillance and homeostasis. Nat. Immunol. 11, 785-797
(2010).
62. Kawai,T. & Akira,S. Innate immune recognition of viral infection. Nat. Immunol.
7, 131-137 (2006).
63. Akira,S., Uematsu,S. & Takeuchi,O. Pathogen recognition and innate immunity.
Cell 124, 783-801 (2006).
64. Kawai,T. & Akira,S. The role of pattern-recognition receptors in innate immunity:
update on Toll-like receptors. Nat. Immunol. 11, 373-384 (2010).
65. Iwasaki,A. & Medzhitov,R. Regulation of adaptive immunity by the innate
immune system. Science 327, 291-295 (2010).
66. Vari,F. & Hart,D.N. Loading DCs with Ag. Cytotherapy. 6, 111-121 (2004).
67. Dudley,D., Chaudhuri,J., Bassing,C. & Alt,F. Mechanism and control of V(D)J
recombination versus class switch recombination: similarities and differences.
Adv. Immunol. 86, 43-112 (2005).
68. Chu,P. & Arber,D. CD79: a Review. Appl. immunohistochem. Mol. Morphol. 9,
97-106 (2001).

46
69. Eason,D. et al. Mechanisms of antigen receptor evolution. Semin. Immunol. 16,
215-226 (2004).
70. Moss,R.B. et al. Th1/Th2 cells in inflammatory disease states: therapeutic
implications. Expert. Opin. Biol. Ther. 4, 1887-1896 (2004).
71. Kim,T.S., Sun,J. & Braciale,T.J. T cell responses during influenza infection:
getting and keeping control. Trends Immunol. 32, 225-231 (2011).
72. Locksley,R.M. Nine lives: plasticity among T helper cell subsets. J. Exp. Med.
206, 1643-1646 (2009).
73. Boyman,O., Letourneau,S., Krieg,C. & Sprent,J. Homeostatic proliferation and
survival of naive and memory T cells. Eur. J. Immunol. 39, 2088-2094 (2009).
74. Halin,C., Mora,J.R., Sumen,C. & von Andrian,U.H. In vivo imaging of
lymphocyte trafficking. Annu. Rev. Cell Dev. Biol. 21, 581-603 (2005).
75. Randolph,G.J., Ochando,J. & Partida-Sanchez,S. Migration of dendritic cell
subsets and their precursors. Annu. Rev. Immunol. 26, 293-316 (2008).
76. Moon,J.J. et al. Naive CD4(+) T cell frequency varies for different epitopes and
predicts repertoire diversity and response magnitude. Immunity. 27, 203-213
(2007).
77. Jenkins,M.K., Chu,H.H., McLachlan,J.B. & Moon,J.J. On the composition of the
preimmune repertoire of T cells specific for Peptide-major histocompatibility
complex ligands. Annu. Rev. Immunol. 28, 275-294 (2010).
78. von Andrian,U.H. & Mackay,C.R. T-cell function and migration. Two sides of the
same coin. N. Engl. J. Med. 343, 1020-1034 (2000).
79. Mora,J.R. & von Andrian,U.H. T-cell homing specificity and plasticity: new
concepts and future challenges. Trends Immunol. 27, 235-243 (2006).
80. Marzio,R., Mauel,J. & Betz-Corradin,S. CD69 and regulation of the immune
function. Immunopharmacol. Immunotoxicol. 21, 565-582 (1999).
81. Maceyka,M., Harikumar,K.B., Milstien,S. & Spiegel,S. Sphingosine-1-phosphate
signaling and its role in disease. Trends Cell Biol. 22, 50-60 (2012).
82. Spiegel,S. & Milstien,S. The outs and the ins of sphingosine-1-phosphate in
immunity. Nat. Rev. Immunol. 11, 403-415 (2011).
83. Hall,J.C. & Rosen,A. Type I interferons: crucial participants in disease
amplification in autoimmunity. Nat. Rev. Rheumatol. 6, 40-49 (2010).
47
84. Galligan,C.L. et al. Interferons and viruses: signaling for supremacy. Immunol.
Res. 35, 27-40 (2006).
85. Castilletti,C. et al. Coordinate induction of IFN-alpha and -gamma by SARS-CoV
also in the absence of virus replication. Virology 341, 163-169 (2005).
86. Cameron,M.J. et al. Interferon-mediated immunopathological events are
associated with atypical innate and adaptive immune responses in patients with
severe acute respiratory syndrome. J. Virol. 81, 8692-8706 (2007).
87. Yun,P.L., DeCarlo,A.A. & Hunter,N. Modulation of major histocompatibility
complex protein expression by human gamma interferon mediated by cysteine
proteinase-adhesin polyproteins of Porphyromonas gingivalis. Infect. Immun. 67,
2986-2995 (1999).
88. Smeltz,R.B. Profound enhancement of the IL-12/IL-18 pathway of IFN-gamma
secretion in human CD8+ memory T cell subsets via IL-15. J. Immunol. 178,
4786-4792 (2007).
89. Shtrichman,R. & Samuel,C.E. The role of gamma interferon in antimicrobial
immunity. Curr. Opin. Microbiol. 4, 251-259 (2001).
90. Uddin,S. & Platanias,L.C. Mechanisms of type-I interferon signal transduction. J.
Biochem. Mol. Biol. 37, 635-641 (2004).
91. Ramana,C.V., Gil,M.P., Schreiber,R.D. & Stark,G.R. Stat1-dependent and -
independent pathways in IFN-gamma-dependent signaling. Trends Immunol. 23,
96-101 (2002).
92. Haque,S.J. & Williams,B.R. Signal transduction in the interferon system. Semin.
Oncol. 25, 14-22 (1998).
93. Garcia-Sastre,A. & Biron,C.A. Type 1 interferons and the virus-host relationship:
a lesson in detente. Science 312, 879-882 (2006).
94. Takaoka,A. & Yanai,H. Interferon signalling network in innate defence. Cell
Microbiol. 8, 907-922 (2006).
95. Haller,O., Staeheli,P. & Kochs,G. Interferon-induced Mx proteins in antiviral host
defense. Biochimie 89, 812-818 (2007).
96. Bonnevie-Nielsen,V. et al. Variation in antiviral 2',5'-oligoadenylate synthetase
(2'5'AS) enzyme activity is controlled by a single-nucleotide polymorphism at a
splice-acceptor site in the OAS1 gene. Am. J. Hum. Genet. 76, 623-633 (2005).
97. Okumura,A., Lu,G., Pitha-Rowe,I. & Pitha,P.M. Innate antiviral response targets
HIV-1 release by the induction of ubiquitin-like protein ISG15. Proc. Natl. Acad.
Sci. U. S. A 103, 1440-1445 (2006).

48
98. Luster,A.D. & Ravetch,J.V. Genomic characterization of a gamma-interferon-
inducible gene (IP-10) and identification of an interferon-inducible hypersensitive
site. Mol. Cell Biol. 7, 3723-3731 (1987).
99. Dufour,J.H. et al. IFN-gamma-inducible protein 10 (IP-10; CXCL10)-deficient
mice reveal a role for IP-10 in effector T cell generation and trafficking. J.
Immunol. 168, 3195-3204 (2002).
100. Murphy,P.M. et al. International union of pharmacology. XXII. Nomenclature for
chemokine receptors. Pharmacol. Rev. 52, 145-176 (2000).
101. Villagomez,M.T., Bae,S.J., Ogawa,I., Takenaka,M. & Katayama,I. Tumour
necrosis factor-alpha but not interferon-gamma is the main inducer of inducible
protein-10 in skin fibroblasts from patients with atopic dermatitis. Br. J.
Dermatol. 150, 910-916 (2004).
102. Frangogiannis,N.G., Mendoza,L.H., Smith,C.W., Michael,L.H. & Entman,M.L.
Induction of the synthesis of the C-X-C chemokine interferon-gamma-inducible
protein-10 in experimental canine endotoxemia. Cell Tissue Res. 302, 365-376
(2000).
103. Belperio,J.A. et al. Role of CXCL9/CXCR3 chemokine biology during
pathogenesis of acute lung allograft rejection. J. Immunol. 171, 4844-4852
(2003).
104. Arai,K., Liu,Z.X., Lane,T. & Dennert,G. IP-10 and Mig facilitate accumulation of
T cells in the virus-infected liver. Cell Immunol. 219, 48-56 (2002).
105. Hancock,W.W. et al. Donor-derived IP-10 initiates development of acute allograft
rejection. J. Exp. Med. 193, 975-980 (2001).
106. Christen,U., McGavern,D.B., Luster,A.D., von Herrath,M.G. & Oldstone,M.B.
Among CXCR3 chemokines, IFN-gamma-inducible protein of 10 kDa (CXC
chemokine ligand (CXCL) 10) but not monokine induced by IFN-gamma
(CXCL9) imprints a pattern for the subsequent development of autoimmune
disease. J. Immunol. 171, 6838-6845 (2003).
107. Agostini,C. et al. Cxcr3 and its ligand CXCL10 are expressed by inflammatory
cells infiltrating lung allografts and mediate chemotaxis of T cells at sites of
rejection. Am. J. Pathol. 158, 1703-1711 (2001).
108. Shigihara,T. et al. CXCL10 DNA vaccination prevents spontaneous diabetes
through enhanced beta cell proliferation in NOD mice. J. Immunol. 175, 8401-
8408 (2005).
109. Glass,W.G., Subbarao,K., Murphy,B. & Murphy,P.M. Mechanisms of host
defense following severe acute respiratory syndrome-coronavirus (SARS-CoV)
pulmonary infection of mice. J. Immunol. 173, 4030-4039 (2004).

49
110. Liu,M.T. et al. The T cell chemoattractant IFN-inducible protein 10 is essential in
host defense against viral-induced neurologic disease. J. Immunol. 165, 2327-
2330 (2000).
111. Ng,P.C. et al. Inflammatory cytokine profile in children with severe acute
respiratory syndrome. Pediatrics 113, e7-14 (2004).
112. Xie,X., Chen,J., Wang,X., Zhang,F. & Liu,Y. Age- and gender-related difference
of ACE2 expression in rat lung. Life Sci. 78, 2166-2171 (2006).
113. Theron,M., Huang,K.J., Chen,Y.W., Liu,C.C. & Lei,H.Y. A probable role for
IFN-gamma in the development of a lung immunopathology in SARS. Cytokine
32, 30-38 (2005).
114. Chan,W.S. et al. Coronaviral hypothetical and structural proteins were found in
the intestinal surface enterocytes and pneumocytes of severe acute respiratory
syndrome (SARS). Mod. Pathol. 18, 1432-1439 (2005).
115. Franks,T.J. et al. Lung pathology of severe acute respiratory syndrome (SARS): a
study of 8 autopsy cases from Singapore. Hum. Pathol. 34, 743-748 (2003).
116. Chow,K.C., Hsiao,C.H., Lin,T.Y., Chen,C.L. & Chiou,S.H. Detection of severe
acute respiratory syndrome-associated coronavirus in pneumocytes of the lung.
Am. J. Clin. Pathol. 121, 574-580 (2004).
117. Ng,W.F., To,K.F., Lam,W.W., Ng,T.K. & Lee,K.C. The comparative pathology
of severe acute respiratory syndrome and avian influenza A subtype H5N1--a
review. Hum. Pathol. 37, 381-390 (2006).
118. Ding,Y. et al. The clinical pathology of severe acute respiratory syndrome
(SARS): a report from China. J. Pathol. 200, 282-289 (2003).
119. Sheng,W.H. et al. Clinical manifestations and inflammatory cytokine responses in
patients with severe acute respiratory syndrome. J. Formos. Med. Assoc. 104,
715-723 (2005).
120. Cui,W. et al. Expression of lymphocytes and lymphocyte subsets in patients with
severe acute respiratory syndrome. Clin. Infect. Dis. 37, 857-859 (2003).
121. Strieter,R.M., Belperio,J.A. & Keane,M.P. Host innate defenses in the lung: the
role of cytokines. Curr. Opin. Infect. Dis. 16, 193-198 (2003).
122. Neri,M. et al. Myocardial expression of TNF-alpha, IL-1beta, IL-6, IL-8, IL-10
and MCP-1 after a single MDMA dose administered in a rat model. Curr. Pharm.
Biotechnol. 11, 413-420 (2010).

50
123. Norris,D.A. Cytokine modulation of adhesion molecules in the regulation of
immunologic cytotoxicity of epidermal targets. J. Invest Dermatol. 95, 111S-120S
(1990).
124. Culley,F.J., Pennycook,A.M., Tregoning,J.S., Hussell,T. & Openshaw,P.J.
Differential chemokine expression following respiratory virus infection reflects
Th1- or Th2-biased immunopathology. J. Virol. 80, 4521-4527 (2006).
125. Wong,C.K. et al. Plasma inflammatory cytokines and chemokines in severe acute
respiratory syndrome. Clin. Exp. Immunol. 136, 95-103 (2004).
126. Zhang,Y. et al. Analysis of serum cytokines in patients with severe acute
respiratory syndrome. Infect. Immun. 72, 4410-4415 (2004).
127. Jiang,Y. et al. Characterization of cytokine/chemokine profiles of severe acute
respiratory syndrome. Am. J. Respir. Crit Care Med. 171, 850-857 (2005).
128. Tang,N.L. et al. Early enhanced expression of interferon-inducible protein-10
(CXCL-10) and other chemokines predicts adverse outcome in severe acute
respiratory syndrome. Clin. Chem. 51, 2333-2340 (2005).
129. Huang,K.J. et al. An interferon-gamma-related cytokine storm in SARS patients.
J. Med. Virol. 75, 185-194 (2005).
130. Hamano,E. et al. Polymorphisms of interferon-inducible genes OAS-1 and MxA
associated with SARS in the Vietnamese population. Biochem. Biophys. Res.
Commun. 329, 1234-1239 (2005).
131. He,J. et al. Association of SARS susceptibility with single nucleic acid
polymorphisms of OAS1 and MxA genes: a case-control study. BMC. Infect. Dis.
6, 106 (2006).
132. Li,T. et al. Significant changes of peripheral T lymphocyte subsets in patients
with severe acute respiratory syndrome. J. Infect. Dis. 189, 648-651 (2004).
133. Tang,X. et al. Measurement of subgroups of peripheral blood T lymphocytes in
patients with severe acute respiratory syndrome and its clinical significance. Chin
Med. J. (Engl. ) 116, 827-830 (2003).
134. Martina,B.E. et al. Virology: SARS virus infection of cats and ferrets. Nature
425, 915 (2003).
135. Marshall,E. & Enserink,M. Medicine. Caution urged on SARS vaccines. Science
303, 944-946 (2004).
136. See,R.H. et al. Severe acute respiratory syndrome vaccine efficacy in ferrets:
whole killed virus and adenovirus-vectored vaccines. J. Gen. Virol. 89, 2136-
2146 (2008).

51
Chapter 2
Upregulation of CXCL10 is associated with disease progression in
SARS-CoV- infected humans and ferrets.
(A version of this chapter is published in Molecular Immunology, Volume 45 (2008),
1288–1297 as “Cloning, expression and characterization of ferret CXCL10”.
Ali Danesh, Charit Seneviratne, Cheryl M. Cameron, David Banner, Mark E. Devries,
Alyson A. Kelvin, Luoling Xu, Longsi Ran, Steven E. Bosinger, Thomas Rowe, Marcus
Czub, Colleen B. Jonsson, Mark J. Cameron and David J. Kelvin, with permission from
Elsevier)
1. Introduction
The CXCL9 (MIG), CXCL10 (IP-10), and CXCL11 (I-TAC) chemokines, along
with their cognate receptor CXCR3 participate in the development and regulation of Th1
responses. The expression of CXCL9, 10, and 11 can be induced in virtually all cell
types by a variety of stimulants including IFN-γ, TLR activation and viral infection1-3
.
There is evidence in the literature that strongly suggests that CXCL10 is an important
regulator of Th1 polarized immune responses4, and that, in some instances, the CXCL9,
10 and 11:CXCR3 axis can generate pathological inflammatory conditions5-8
. While
several reports have identified an increased expression of CXCL9 or CXCL10 following
viral infection in animal models or humans5,7,9-11
, the role of these chemokines and their
receptor CXCR3 in the development of ARDS (acute respiratory distress syndrome)-like
diseases associated with pathogenic pulmonary viral infections is unknown. Support for
a role of this subfamily of chemokines in SARS comes from observations by ourselves
and other groups showing a correlation between increased systemic levels of CXCL10 in
SARS coronavirus (SARS-CoV)12-14
and H5N1-infected individuals15
, as well as

52
chronically elevated levels of systemic expression of CXCL10 in patients with poor
outcome post-infection12,14
.
It has been suggested that the ferret is a more appropriate animal model for SARS
compared to murine and primate models16
. Cynomolgus macaques (Macaca fascicularis)
fail to show clinical symptoms following infection with SARS-CoV, despite viral
replication in the species16,17
. In mice, the SARS-CoV replicates well, but the value of
the model as representative of the human condition has been debated due to rapid
clearance of the virus and the absence of clinical symptoms18
. In contrast, SARS-CoV
replicates well in ferrets with infected animals demonstrating a number of clinical
manifestations similar to those seen in humans, such as lethargy and elevated body
temperature16
. Furthermore, SARS-CoV infected ferrets display histological evidence of
pneumonitis, and a certain degree of mortality has been reported, which is also consistent
with the human disease16,17
. Replication of SARS-CoV occurs both in the upper and
lower respiratory tract, and development of ARDS-like disease also occurs in some
patients19,20
. Diarrhea has been reported in a portion of cases of human H5N1 infection,
and was also noted in many infected ferrets21-23
.
The ferret is the preferred animal model for influenza research, including that
with avian strains such as the H5N1 sub-type, as it closely mimics the human disease in
terms of susceptibility to infection, transmission, pathology and spectrum of symptoms
observed upon infection. For example, ferrets infected with highly pathogenic human
isolates of H5N1 virus develop rhinorrea and ocular discharge, anorexia, otologic
manifestations, fever, weight loss, dyspnea, pulmonary infiltrates and lymphophenia23-25
.

53
The major drawback to the use of the ferret model for either SARS-CoV or
influenza virus research is the general lack of immunological reagents. To investigate the
roles of CXCL9, 10, 11 and CXCR3 in SARS and avian influenza pathogenesis in the
ferret model, there is a need to develop ferret-specific antibodies to accurately assess
chemokine expression levels in infected animals, and to neutralize any effects these
chemokines might have in pathogenesis progression and clearance of infection.
As a first step towards this goal, we have cloned and sequenced the genes
encoding ferret CXCL9, CXCL10, CXCL11 and CXCR3 orthologues, and then
expressed and purified recombinant ferret CXCL10 protein. Next we showed that
expression of CXCL9, 10, and 11 were induced by LPS stimulation of ferret PBMC
cultures. We have also demonstrated that CXCL10 plasma level in different groups of
SARS patients is elevated. In addition, we have shown that levels of the mRNA
expression of CXCR3 and CXCL10 are increased in the lungs of deceased patients
infected with SARS-CoV during the SARS outbreak in Toronto. Furthermore, we have
confirmed that the increased CXCL10 expression observed in these patients is paralleled
in ferrets infected with SARS-CoV.

54
2. Materials and methods
2.1 SARS patients
Blood samples of suspected SARS patients were received every 7 days until day
28 or longer from University Health network hospitals in Toronto. Written consent was
obtained by hospital officials from patients or from their legal designates. Plasma was
harvested from collected blood for measurement of cytokines levels. Clinical data was
obtained from collaborating hospitals and entered in a database. Only confirmed cases
of SARS based on WHO definition of SARS (described in introduction) and a positive
RT-PCR test for SARS-CoV were included in this study.
2.2 Animals
Six-month-old male Fitch ferrets (Mustela putorius furo) were purchased from
Triple F Farms Inc. (Sayre, Pa. USA). Animals used for non-infectious experimentation
were housed at Toronto General Research Institute animal facility. The animal use
protocol was approved by Animal Care Committee of the University Health Network,
Toronto, Ontario. All experiments were conducted in accordance with committee
recommendations. Animals were quarantined and monitored for one week prior to tissue
and blood collection. The animals’ diet was based on a low fat/high protein regimen
recommended by Triple F Farms for small carnivores. Animal experiments involving
virus work were performed in the Animal Biohazard Safety Level 3 (ABSL3) facility at
Southern Research Institute (Birmingham, Alabama, USA), in accordance with the
approved protocols. Briefly, three male ferrets (castrated, descented), weighing
approximately 800-1000g, were infected intranasally with 103 TCID50 SARS-CoV virus

55
(TOR2 strain) in 1 mL PBS. An additional three animals were mock-infected using 1 mL
PBS alone. Infected animals were deeply anesthetized and euthanized via exsanguination
between days 5 and 7 post-infection, and lung tissue was obtained at necropsy and
immediately homogenized in Tripure reagent (Roche Diagnostics, Indianapolis, USA).
2.3 Titration of SARS-CoV:
A SARS-CoV Tor-2 strain provided by Dr. Feldman, University of Manitoba, was
propagated and titrated in Vero E6 cells at BSL3 animal facility of southern Research
Institute, Alabama U.S.A. 20,000 Vero E6 cells in 100 l cell culture media were added
to each well of a 96-well plate. Plate was incubated overnight at 37 °C in CO2 incubator.
The viral stock was serially diluted at 10-fold intervals from 10-1
to 10-8
. 100 l of each
viral dilution was added to wells of one row. Plate was incubated in the CO2 incubator for
another 3 days. The cytopathic effect in Vero E6 cells, which is the structural changes of
virally infected cells and leads to their lysis, was considered for determining the endpoint
and calculation of TCID50/ml. The endpoint was the lowest viral titer that caused the
lysis of infected cells in some but not all wells of a row in a 96 well plate. Each row of
the plate was representative of a titer as is described in chapter one.
2.4 Viral load and clinical characteristics of infected ferrets
The dose of SARS-CoV in my study was chosen based on smaller studies
performed in the Southern Research Institute by our collaborators, indicating that a lower
dose of the virus (103 TCID50/ml) generated more reproducible data. With this dose, less

56
variation of lung infectivity was observed and nasal turbinate and lung infectivity were at
its highest level. High doses of SARS-CoV (107 TCID50/ml) resulted in minimal nasal
turbinate infectivity. Ferrets were inspected daily for signs, symptoms, onset, severity and
duration of disease. The activity was scored at a scale of 1 to 3, with 3 as the worst.
Infected ferrets showed increased temperature and loss of appetite, which last for 7 days.
Sneezing started at day 3 and last until day 10 post-infection. Subcutaneous temperatures
showed increased levels in SARS-CoV infected ferrets from day 2 to 7 post-infection
with its peak at day 2 (38 °C), while the temperature of mock-infected ferrets was
between (36.5-37 °C). Viral levels in the nasal turbinates of infected ferrets peaked on
day 3 (107 TCID50), and dropped to undetectable level at day 7. Virus levels in the lungs
peaked at day 5 (105 TCID50) and dropped by day 7.
2.5 Cytometric Bead Array (CBA)
The level of CXCL9 and CXCL10 in the plasma of SARS patients were assayed
by chemokine cytometric bead array (CBA) kit (BD Biosciences, San Jose, CA).
Detection limits were 2 to 10000 pg/ml. Briefly, standards were reconstituted in assay
diluent and serially diluted to achieve a range of 0 to 10000 pg /ml. Fifty ul of mixed
capture beads, 50 ul standard / test samples and 50 ul PE detection reagent were added to
each tube. Tubes were incubated 3 hours in dark at room temperature. Beads were
washed with 1 ml wash buffer and re-suspended in 300 µl of 2% paraformaldehyde in
PBS. Data were acquired, using BD FACSCalibure flow cytometer. Results were
generated using BD CBA analysis software.

57
2.6 Human lung biopsies and total RNA purification
Total RNA was purified using Tripure mRNA kits (Roche Diagnostics,
Indianapolis, USA). Briefly, lung lower bilateral lobe biopsies collected from deceased
SARS patients at autopsy were homogenized in 2 mL Tripure reagent in a 50 mL
polypropylene tube at room temperature and chloroform extraction of RNA was
performed and then cleaned by DNase. Informed consent was obtained from subjects or
their substitute decision makers under the approval of the Research Ethics Boards of the
University Health Network and participating Toronto-area hospitals.
2.7 Ferret total RNA purification and cDNA synthesis
Ferret whole blood was diluted 1:1 with RPMI (Invitrogen, USA) and stimulated
with mitogens, lipopolysaccharide (LPS) (1 ug/mL), phorbol myristate acetate (PMA) (50
ng/mL) and ionomycin (0.1 mM), or polyinosinic: polycytidylic acid (poly I:C) (25
g/mL) by incubating at 37ºC in 5% CO2 for 1, 2, 4, 8, and 16 hours prior to RNA
purification. Paxgene RNA isolation method (Qiagen, Missisauga, Canada) was used for
RNA purification and then RNA was cleaned by DNase. Purified human or ferret total
RNA was reverse transcribed to cDNA using reverse transcriptase II (Invitrogen,
Carlsbad, USA).
2.8 Real-time RT-PCR
The following components were added to the reaction mixture plus cDNA to a
total volume of 10 µL in distilled water: 0.25 l cDNA, 250 nM forward gene-specific
primer, 250 nM reverse gene-specific primer, 5 L Cyber Green (Applied Biosystems,

58
Foster City, California, USA). In a single experiment, each reaction was performed in
triplicate. An ABI 7900 Sequence Detection System (Applied Biosystems, Foster City,
California, USA) was used for amplification. Initial denaturation was 15 minutes at
95oC, followed by 40 cycles of amplification. Each cycle consisted of a denaturation step
(15 seconds at 95oC) and an annealing/extension step (1 minute at 60
oC). Gene
expression levels were normalized to β-actin and data was analyzed by SDS 2.1 software
(Applied Biosystems, California).
2.9 Amplification, cloning and sequencing of ferret-specific genes
Purified RNA was reverse transcribed to cDNA using reverse transcriptase II
(Invitrogen, Carlsbad, USA). Gene specific degenerate primers were designed based on
multiple gene sequence alignment analysis of several species using the ClustalW (1.83)
web-based program from European Bioinformatics Institute (EBI) and then used to clone
the cDNAs for each gene. Primers were tested in silico using Primer Express (Applied
Biosystems, CA, USA). Standard PCR was performed using degenerate primers and
template cDNA. Specific bands were gel purified (Qiagen, Mississauga, Canada) and
cloned into the pCR 2.1-TOPO vector (Invitrogen, Calsbad, USA). Sequences of positive
clones were confirmed using ABI 3730XL DNA analyzers (Center for Applied
Genomics, Toronto, Ontario). Identification of genes was carried out by Basic Local
Alignment Search Tool (BLAST) analyses against National Centre for Biotechnology
Information (NCBI) data (http://www.ncbi.nlm.nih.gov/BLAST/).
2.10 Generation of an expression vector for ferret CXCL10

59
Kozak sequences were engineered at the 5’ end of the ferret CXCL10 cDNA and
the 3’ end termination codon was removed prior to sub-cloning into the pcDNA3.1/
His6.V5/ TOPO expression vector (Invitrogen, Mississauga, Canada). The removal of
the termination codon enabled the cloned gene to be expressed as a fusion protein that is
tagged at the C-terminus with the His6 and V5 epitopes. Sequencing was repeated to
ensure that no errors had been introduced and to verify that the gene had been inserted in
the correct open reading frame.
2.11 Cell culture, plasmid transfections, and protein purification
COS-7 cells were maintained in Dulbecco’s modified eagle’s medium (DMEM),
substituted with 10% fetal bovine serum (Invitrogen, Mississauga, Canada) at 37ºC, 5%
CO2. COS-7 cells (1x10⁷) were transiently transfected with Effectene (Qiagen, Canada).
After 24-48 hours of incubation, conditioned media was run through Ni-NTA metal
immobilized affinity columns (0.5-1 mL). Bound protein was washed and eluted. Eluted
fractions were screened via Western blot using antibodies that specifically recognize the
epitope tags. Positive fractions were pooled and dialyzed against phosphate buffered
saline (PBS) at 4ºC and concentrated by lyophilization.
2.12 Western Blot analysis
SDS-Polyacrylamide gel electrophoresis (SDS-PAGE) was performed with pre-
cast gels (10-15%, Bio-Rad, USA). Protein blots were blocked with 5% milk
protein/Phosphate buffered saline-Tween 0.02% (TPBS) buffer for 1 hour at room
temperature followed by 16 hours incubation at 4°C with mouse-anti-His6 primary

60
antibody (Invitrogen, Canada) at 508 ng/mL. The blots were washed with TPBS and
incubated with goat-anti-mouse-HRP secondary antibody (Santa Cruz, USA) for 1 hour
at room temperature. Bands were visualized using enhanced chemiluminiscent (ECL)
reagents (GE healthcare, Canada). Goat polyclonal anti-human CXCL10 antibody (R&D
systems, USA) was used to demonstrate cross-reactivity with ferret recombinant
CXCL10.
2.13 Isolation of Peripheral Blood Mononuclear cells (PBMC) for Chemotaxis
Assays
PBMCs were isolated from ferret whole blood by centrifuging over Histopaque
density gradient (Sigma Chemicals, St. Louise, MO). Briefly, whole blood was diluted
1:1 with PBS (10 mL), layered over 5 mL Histopaque solution, and centrifuged at 400Xg
for 20 minutes. The enriched mononuclear cell layer at the Histopaque-plasma interface
was harvested, washed twice in PBS, and resuspended in chemotaxis binding buffer
(RPMI 1640, 1% bovine serum albumin, 25 mM HEPES).
2.14 Chemotaxis Assay
The Boyden chamber procedure was performed as described previously26
. Briefly,
a 25 L aliquot of recombinant ferret CXCL10 was diluted in chemotaxis medium was
placed in the lower compartment and 50 L of PBMC suspension (1x10⁶
cells/mL) was
placed in the upper compartment. The two compartments were separated by a
polycarbonate filter (5 μm pore size; Neuroprobe, Cabin John, MD). The chamber was
incubated for 3 hours at 37ºC in humidified air with 5% CO2. At the end of the

61
incubation period, filters were removed fixed and stained with Diff-Quik (Harlew, Gibbs-
town, NJ). The number of migrating cells was counted in three high power fields (400X)
by light microscopy. Results are expressed as mean ± SD for at least three independent
experiments.
2.15 Gene accession numbers
Nucleotide sequences of the complete coding regions of CXCL9, 10 and 11 were
submitted to the GeneBank. Partial nucleotide sequence of CXCR3 coding sequence was
also submitted and the following accession numbers were obtained:
Ferret CXCL9 (EF492057), Ferret CXCL10 (EF492058), Ferret CXCL11
(EF492059), Ferret CXCR3 (EF492060).
2.16 Statistical analysis
The student’s t test or the Mann-Whitney rank sum test for two independent
populations was used for statistical analysis via SPSS for Windows V13.0 software
(SPSS Inc., Chicago, IL). P≤0.05 was considered significant.

62
3. Results
3.1 CXCL9 and CXCL10 plasma level of patients with SARS
Cross-sectional analysis of CXCL9 and CXCL10 levels was performed on plasma
of Toronto SARS patients. The mean CXCL10 levels in mild SARS and ICU non-fatal
groups at the onset of disease and 7 days post-onset was measured. The mean level of
CXCL10 in plasma was significantly higher in SARS patients compared to healthy
controls (Figure 2-1). At day 14, the CXCL10 plasma level was high only in ICU
patients. At this day, ICU fatal patients showed higher levels of CXCL10 compared to
ICU non-fatal patients. At day 28, CXCL10 only remained significantly increased in the
ICU-fatal group, while other groups had decreased levels of this chemokine (Figure 2-1).
CXCL9 is closely related to CXCL10 with overlapping functions and both of
these chemokines share the same receptor (CXCR3). However CXCL9 had a different
pattern of expression. Only the ICU non-fatal group presented a significant increase in
CXCL9 mean level at day 14 compared to healthy control group (Figure 2-2).

63
Figure 2-1. Mean CXCL10 level changes in plasma of different SARS groups.
Comparison of CXCL10 plasma concentration of mild SARS group (day 0, 7, 14, 28),
ICU non-fatal group (day 0, 7, 14, 28), and ICU fatal group (day 14, 28) with healthy
controls (day 0). Y-axis is representative of CXCL10 mean concentration as pg/ml.
Statistical analysis was performed using the student t test. P values show the degree of
significance for each condition compared to healthy controls (*P< 0.01)

64
Days post-infection
CX
CL
10
pg
/ml
0 7 14 280
2000
4000
6000
8000
10000Healthy control
SARS mild
ICU non-fatal
ICU fatal* *
*
*
* * *
*

65
Figure 2-2. Mean CXCL9 level changes in plasma of different SARS groups.
Comparison of CXCL9 plasma concentration of mild SARS group (day 0, 7, 14, 28), ICU
non-fatal group (day 0, 7, 14, 28), and ICU fatal group (day 14, 28) with healthy controls
(day 0). Y-axis is representative of CXCL9 mean concentration as pg/ml. Statistical
analysis was performed using the student t test. P values show the degree of significance
for each condition compared to healthy controls (*P< 0.01)
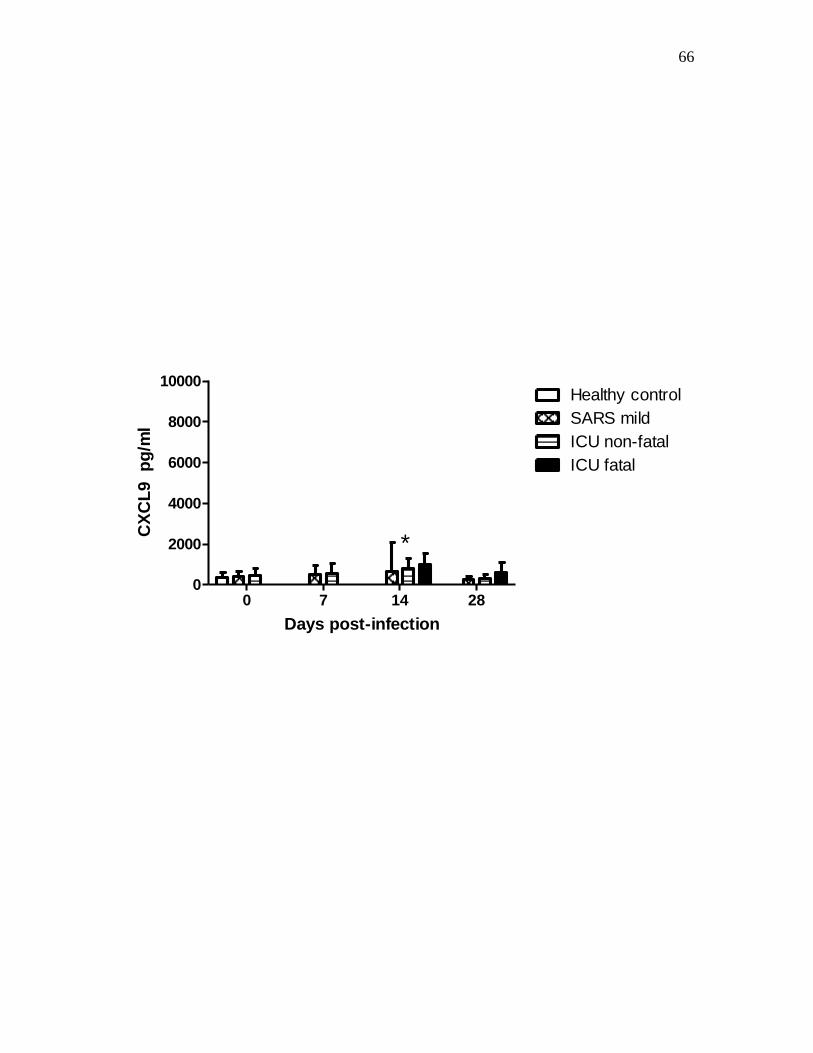
66
Days post-infection
CX
CL
9
pg
/ml
0 7 14 280
2000
4000
6000
8000
10000Healthy control
SARS mild
ICU non-fatal
ICU fatal
*

67
3.2 Cloning and sequence analysis of Ferret CXCL9, CXCL10, CXCL11, and
CXCR3
The cloning of ferret genes encoding CXCL9, CXCL10, CXCL11 and CXCR3
was performed using ferret cDNA derived from PBMC cultures stimulated with various
mitogens to induce cytokines and chemokines expression (see Methods). Each gene was
amplified by primers designed from consensus sequences derived from multiple
nucleotide sequence alignments among various species. In the case of CXCL10, the full-
length coding region was not fully sequenced due to the lack of sequence conservation at
the 5’ and 3’ end of the coding region. To address this issue, sequences upstream and
downstream of the open reading frame were sequenced by RNA ligase mediated rapid
amplification of cDNA ends (RLM–RACE). For CXCR3, we amplified and sequenced a
partial cDNA within the coding region. As expected, the predicted full-length amino acid
sequences for ferret CXCL9, CXCL10, CXCL11 (126, 98 and 94 amino acids
respectively) and the predicted partial CXCR3 sequence (229 out of 368 amino acids)
show significant homology to corresponding sequences in various other species (Figure
2-3A-D). Phylogenetic analysis was performed using ClustalW and phylogenetic trees
constructed using protein parsimony with a bootstrap value of 100. The ferret nucleotide
sequences were translated to amino acid sequences using “Translate” (ExPASy,
proteomics). Amino acid sequences of other species were obtained from Genbank
(http://www.ncbi.nlm.nih.gov/Genbank). The phylogenetic tree shown for genes
indicated a higher similarity existed between ferret gene and those of humans and order
carnivora than between the ferret and order rodentia (Figure 2-4A,B, Table 2-1).

68
Figure 2-3. Multiple alignments of the primary amino acid sequences of CXCL9,
CXCL10, CXCL11, and CXCR3. The putative translated full length protein sequences
of ferret CXCL9 (A), CXCL10 (B), CXCL11 (C) and the putative translated partial
sequence of ferret CXCR3 (D) were compared with orthologous protein sequences from
human, dog and or cow, where available.
CXCL9: EF492057, XM_591770, BC063122
CXCL10: EF492058, AB183191, NM_001565
CXCL11: EF492059, XM_594243, NM_005409
CXCR3: EF492060, AB185149, NM_001504

69
A
)
B
)
C
)
D
)

70
Figure 2-4. Phylogenetic analysis of ferret CXCL9, CXCL10, CXCL11, and
CXCR3. The full length putative protein sequences obtained for A) ferret CXCL9,
CXCL10, CXCL11 and B) partial putative protein sequence of ferret CXCR3 were
aligned with all available orthologues from cow, dog, human, mouse, rat, pig and frog
using ClustalW 1.83, and phylogenetic trees constructed using protein parsimony with a
bootstrap value of 100. All chemokines cluster specifically within their orthologous
groups.
Accession numbers:
CXCL9: NP_663705, NP_032625, NP_002407, XP_591770
CXCL10: NP_001008691, NP_620789, NP_067249, NP_001556, NP_001010949,
NP_001040016
CXCL11: NP_891997, NP_062367, NP_005400
CXCR3: NP_001011067, CAH64842, NP_445867, NP_034040, NP_001011673,
NP_0011495, NP_001011887

71
A)
B)
Human CXCL10
Rat CXCL11
Mouse CXCL11
Human CXCL11
Ferret CXCL11
Rat CXCL9
Mouse CXCL9
Human CXCL9
Cow CXCL9
Ferret CXCL9
Cow CXCL10
Pig CXCL10
Ferret CXCL10
Dog CXCL10
Rat CXCL10
Mouse CXCL10
96.049.1
49.9
84.7
98.8
84.8
100
99.6
97.979.5
100
92.575.4
Rat
Mouse
Pig
Cow
Human
Dog
Ferret
Frog
99.4
56.3
41.6
27.6
85.7

72
Species CXCL9 CXCL10 CXCL11 CXCR3
Human 68 80 86 91
Dog __ 81 __ 92
Cow 72 80 82 89
Mouse 58 67 63 86
Values shown represent % amino acid identity, with highest % for each gene in bold .
Table 2-1. Amino acid identity of ferret CXCL9, CXCL10, CXCL11 and CXCR3
with known species sequences

73
3.3 Expression of recombinant ferret CXCL10 protein and detection by western blot
A C-terminal His6/V5-tagged expression construct was generated in order to
produce recombinant ferret CXCL10 protein (predicted molecular weight of 18.5kDa,
including epitope tags). We transiently transfected COS-7 cells with this expression
construct and purified recombinant ferret CXCL10 by affinity chromatography. Eluted
fractions were subjected to western blot analysis using anti-HIS antibody. A single band
was noted at the expected molecular weight of 18.5 kDa. COS-7 cells transfected with
empty vector did not show reactivity with anti-His antibody, while recombinant ferret
IFN- reacted with same antibody at 34 KDa as a positive control (Figure 2-5A). As
recombinant ferret CXCL10 shows a high degree of homology with human CXCL10, we
tested whether our ferret recombinant CXCL10 would be recognized by an anti-human
CXCL10 polyclonal antibody. As shown in Figure 2-5B, ferret recombinant CXCL10
and human recombinant CXCL10 are reactive with a polyclonal goat anti-human
CXCL10 antibody.
3.4 Chemotactic activity of recombinant ferret CXCL10 protein
The purified recombinant ferret CXCL10 protein was tested for chemotactic
activity using ferret PBMC cultures in a Boyden chamber. Chemotactic migration of
ferret PBMCs increased upon treatment with ferret CXCL10 protein in a dose-dependent
manner. Maximal migration occurred at 200 ng/mL ferret CXCL10 protein, above which
concentration a declining response was observed. Therefore our CXCL10 induced
chemotaxis data conformed to a classical bell-shaped chemotaxis dose-response curve,

74
and was consistent with previous reports for recombinant human CXCL927
and
recombinant human IL-826
. Recombinant ferret CXCL10 attracted a statistically

75
Figure 2-5. The recombinant ferret CXCL10 protein migrates to 18.5kDa and is
active in cell migration assays. A) Anti-His6 western blot of purified recombinant
ferret CXCL10 (fCXCL10) protein (from elution 2) shows a single band at 18.5kDa
compared with ferret IFN- (fIFN-with a band at 34 KDa. B) Goat anti-human
CXCL10 (hCXCL10) polyclonal antibody is cross-reactive with ferret CXCL10
(fCXCL10) recombinant protein. C) Migration of ferret PBMCs following the exposure
to increasing doses of recombinant ferret CXCL10 protein. The results are expressed as
mean cell
count of three high-powered fields obtained in 3 experiments.* P< 0.05 compared to
migration induced by medium alone using student’s t test.
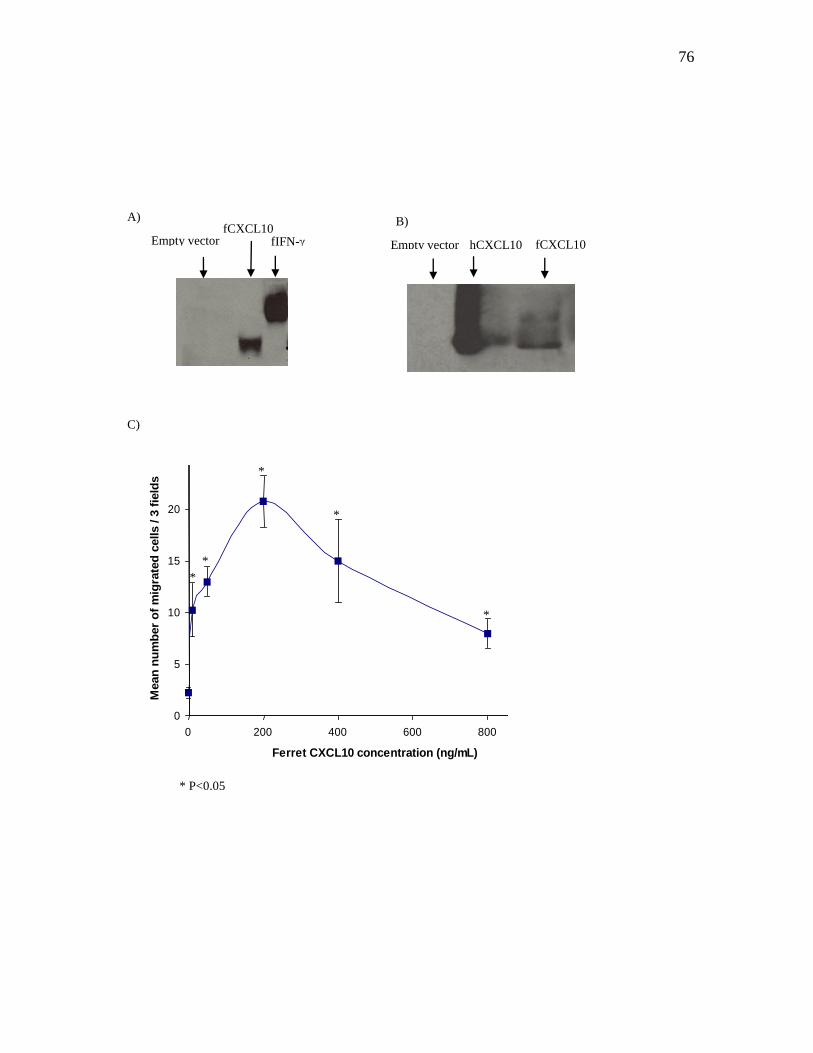
76
C)
* P<0.05
0
5
10
15
20
25
0 200 400 600 800 1000
Ferret CXCL10 concentration (ng/mL)
Mean
nu
mb
er
of
mig
rate
d c
ells / 3
fie
lds
*
*
*
*
*
Empty vector fCXCL10
fIFN-
A)
fCXCL10
B)
hCXCL10 Empty vector

77
significant greater number of PMBCs when compared to the negative control wells
(media alone) at all concentrations used in the assay (P<0.05) (Figure 2-5C). These
results confirmed that our recombinant ferret CXCL10 protein demonstrated biological
activity.
3.5 Stimulation of ferret PBMCs with LPS induces mRNA expression of CXCL9,
CXCL10 and CXCL11
We predict that stimulation of ferret PBMC cells with lipopolysaccharide (LPS)
should promote the secretion of pro-inflammatory cytokines and chemokines in
accordance to data from other species28-30
. Sequence analysis of ferret CXCL9, 10 and
11 genes enabled us to design primers for use in real-time PCR experiments in order to
detect gene expression of these chemokines. Initially, we set out to validate the
specificity of the primers and then aimed to test whether CXCL9, 10 and 11 transcription
is induced in ferret blood cells upon LPS treatment. Quantitative real-time PCR on
cDNA derived from ferret whole blood stimulated with LPS was performed and
demonstrated that CXCL9, CXCL10 and CXCL11 mRNA expression was induced at
various times following LPS treatment relative to unstimulated control cDNA. The peak
increase for CXCL9 (3-fold above unstimulated control, P<0.05) and CXCL11 (greater
than 8-fold above unstimulated control, P<0.01) occurred at 4 hours post-stimulation,
while for CXCL10 the peak increase (60-fold above unstimulated control, P<0.01)
occurred at 2 hours following LPS treatment (Figure 2-6).

78
Figure 2-6. Induction of chemokine gene expression by lipopolysacharide. Ferret
peripheral blood was stimulated with 0.1 mg/ml LPS for the time points indicated.
Utilizing primers specific for the ferret CXCL9, CXCL10, and CXCL11 genes, mRNA
expression was quantified. The Y-axis indicates the abundance of mRNA after
stimulation with LPS compared to untreated samples. Treatment time is indicated by X-
axis. Error bars indicate the SD of the relative quantities of the triplicates. Quantity
readings of triplicates at each time point are compared with quantity readings of
unstimulated triplicates, using student’s t test. The peak increases for CXCL9 and
CXCL11 occurred at 4 hours post-stimulation (P<0.05 and P<0.01 respectively), while
for CXCL10 was at 2 hours following LPS treatment (P<0.01).

79
mRNA expression
Time 0 1 h 2 h 4 h 8 h 16 h
Fold
in
cre
ase
0
10
20
30
40
50
60
70
CXCL10
mRNA expression
Time 0 1 h 2 h 4 h 8 h 16 h
Fold
incre
ase
0
2
4
6
8
10
CXCL11
mRNA expression
Time 0 1 h 2 h 4 h 8 h 16 h
Fold
incra
ese
0
1
2
3
4
5
CXCL9
* *
* * *
**
**
**
*
**
*P<0.05
**P<0.01

80
3.6 Increased CXCL10 and CXCR3 mRNA expression in lung biopsies from fatal
outcome SARS patients at autopsy
We and others have demonstrated increased levels of CXCL10 in the plasma of
SARS patients during acute and progressive illness12,14,31,32
. In order to compare the
expression of CXCL10 in lung biopsies of ferrets infected with SARS-CoV, we evaluated
the expression of CXCL10 and its receptor CXCR3 in the lungs of fatal outcome SARS
patients as well. Real-time PCR analysis was performed on cDNA purified from the lung
biopsies of 3 deceased SARS patients and 3 control patients who died from non-
respiratory illnesses. The results show high expression of CXCL10 and CXCR3 mRNA
in SARS patients (P<0.05) and no expression in control cadaveric lung biopsies (Figure
2-7A,B).
3.7 Expression of CXCL10 in lung biopsies of ferrets infected with SARS-CoV
In order to further dissect the ferret model of SARS-CoV infection and determine
if it is representative of the disease in humans on a molecular basis, we endeavored to
determine whether if the mRNA expression of the chemokine CXCL10 is increased in
SARS-infected ferrets. Real-time PCR analysis of CXCL10 gene expression in lung
tissue from both SARS-infected and uninfected ferrets was carried out. Consistent with
our findings in human SARS patients, ferrets experimentally infected with SARS-CoV
demonstrated a significant increase in CXCL10 mRNA expression in the lower
respiratory tract compared to uninfected control animals (P<0.05) (Figure 2-7C).

81
Figure 2-7. CXCL10 and CXCR3 mRNA expression in lung tissues of humans and
ferrets infected with SARS-CoV. A, CXCL10 and B, CXCR3 are significantly
increased in the lungs of fatal outcome SARS (P<0.05). RNA was isolated from bilateral
lower lung biopsies from 3 deceased SARS patients and from lower lung biopsies from 3
control cadaveric lungs. C, CXCL10 mRNA levels in the lungs of mock vs. SARS-CoV
infected ferrets. Data represent averages from 3 animals per group, performed in
triplicate wells. Asterisks indicate statistical significance using Mann-Whitney rank sum
test (P<0.05).

82

83
4. Discussion
The CXCL9, 10 and 11–CXCR3 axis has been reported to play a role in the
immune response following viral infection14,33-36
. The ferret represents an important
animal model for a number of human viral infectious diseases16,37,38
.
CXCL10 mainly recruits Th1 cells and NK cells to the site of infection1. The level
of this chemokine was increased in all patient groups at the onset of disease and remained
elevated during the disease course. The mean level of CXCL10 remained in the same
level as in mild SARS patients and ICU non-fatal groups at day 7 post-onset. While
CXCL10 was decreased at day 14 in the mild SARS group, it remained significantly
elevated in ICU groups implying that high level of this chemokine is associated with the
persistence of the disease. CXCL10 plasma level decreased to baseline in recovered
patients. Only ICU fatal patients had high levels of CXCL10 compared to other patients
groups or healthy controls.
CXCL10 is inducible in many cells of the respiratory system, including
endothelial cells, airway epithelial cells, monocytes and fibroblasts2,3
. It is likely that in
the course of SARS one or more of these cell types produce high levels of this
chemokine. High levels of CXCL0 in patients with a poor outcome may be associated
with increased damage to the lung. Production of CXCL10 in the lung may attract
lymphocytes to the site of infection and the development of ARDS13,18,31
. Neutralization
of CXCL10 in ferrets in future studies may reveal the precise role of this chemokine in
the pathogenecity SARS.
CXCL9, another chemokine with many overlapping functions with CXCL10 was
not significantly increased during the SARS-CoV infection.

84
As our findings in humans are a part of an uncontrolled retrospective study, we
went on to further study the role of CXCL10 in our ferret model. We report here for the
first time cloning and sequencing of the ferret genes for CXCL9, CXCL10, CXCL11 and
CXCR3. The ferret sequences of these chemokines and their cognate receptor were
highly conserved with human, dog and cow sequences.
Purified recombinant ferret CXCL10 was detected as a single band on anti-His6
western blots that ran close to the predicted molecular weight of 18.5kDa. Since
recombinant CXCL10 was expressed in a mammalian cell line (COS-7), it is reasonable
to assume that the recombinant protein is properly processed at the post-translational
level. Furthermore, we have demonstrated that recombinant ferret CXCL10 protein
exhibited biological activity in terms of stimulating chemotaxis in peripheral blood
mononuclear cells.
CXCL9, CXCL10 and CXCL11 are non-ELR chemokines found at increased
levels in a variety of viral diseases34
. Previous work has shown that CXCL10 mRNA
expression is strongly up-regulated in conjunction with CXCR3 in mice infected with
Lymphocytic Choriomeningitis Virus (LCMV), particularly in the pancreas and at early
stages of infection10
. More recently, it has demonstrated that LCMV infection of the
murine central nervous system (CNS) is associated with CXCL9 and CXCL11 up-
regulation33
. Several animal models have shown that inflammation-based pathology
induced by viral infections can be reduced by either neutralization of chemokines or
blockade of their receptor36,39,40
. Treatment of spontaneously diabetic NOD mice with
CXCL10 neutralizing antibodies suppressed the incidence of diabetes41
. In the MHV

85
mouse model of encephalitis, neutralization of CXCL9 or CXCL10 (or in CXCL10-null
mice) resulted in reduced neuropathology despite increased viral load5,11
.
The absence of immunological reagents for the ferret model of SARS and H5N1
has hindered a direct investigation into the role played by the CXCL9, 10 and 11-CXCR3
axis in the immmunopathogenesis of viral disease. The availability of the cloned genes
for ferret CXCL9, CXCL11 and CXCR3, will enable the expression and purification of
recombinant proteins. Biologically active recombinant purified CXCL10 protein has
been prepared and will be utilized immediately in a number of in vitro and in vivo assays.
Using these proteins we intend to generate specific monoclonal and polyclonal
neutralizing antibodies to investigate the involvement of these chemokines in the
pathogenesis of SARS and H5N1 diseases.
We and others have previously reported the elevation of CXCL10 in the serum of
SARS patients12,14,31
. Furthermore, the depletion of lymphocyte subsets from peripheral
blood might be partly due to the influence of CXCL10 in that up-regulation of CXCL10
in the lung might be influential in the recruitment and sequestration of lymphocyte
subsets to the site of infection14
. This in turn may lead to severe pathological
consequences as described in a number of viral infections including SARS and bird flu32
.
In conclusion, we have demonstrated increased gene expression of CXCL10 and
its receptor CXCR3 in lung biopsies of deceased SARS patients. We observed a similar
pattern of CXCL10 mRNA expression in the lungs of ferrets infected with SARS-CoV,
lending further support to the argument that ferrets are a highly representative model of
the human disease. We have identified a subfamily of chemokines and their cognate
receptor in ferrets and carried out an initial characterization of one of these chemokines.

86
This study is a fundamental step towards the development of a more readily available
array of immunological tools for use in investigating the mechanism of disease in this
natural model of viral infection.
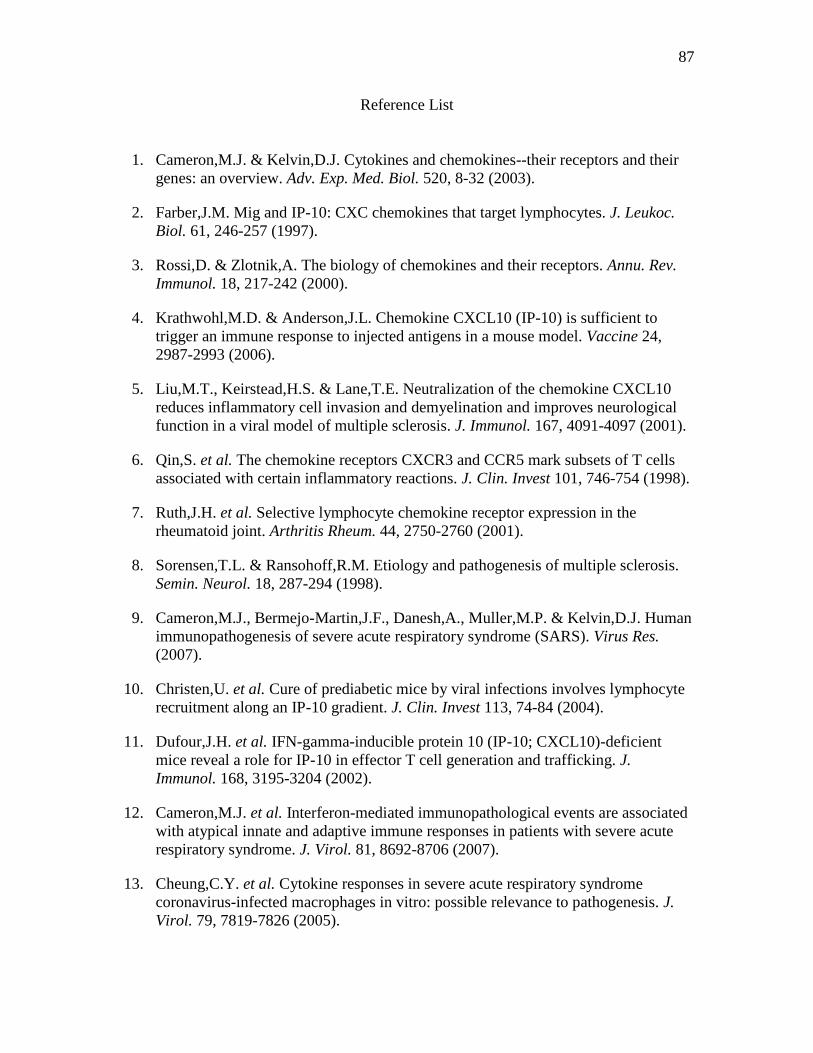
87
Reference List
1. Cameron,M.J. & Kelvin,D.J. Cytokines and chemokines--their receptors and their
genes: an overview. Adv. Exp. Med. Biol. 520, 8-32 (2003).
2. Farber,J.M. Mig and IP-10: CXC chemokines that target lymphocytes. J. Leukoc.
Biol. 61, 246-257 (1997).
3. Rossi,D. & Zlotnik,A. The biology of chemokines and their receptors. Annu. Rev.
Immunol. 18, 217-242 (2000).
4. Krathwohl,M.D. & Anderson,J.L. Chemokine CXCL10 (IP-10) is sufficient to
trigger an immune response to injected antigens in a mouse model. Vaccine 24,
2987-2993 (2006).
5. Liu,M.T., Keirstead,H.S. & Lane,T.E. Neutralization of the chemokine CXCL10
reduces inflammatory cell invasion and demyelination and improves neurological
function in a viral model of multiple sclerosis. J. Immunol. 167, 4091-4097 (2001).
6. Qin,S. et al. The chemokine receptors CXCR3 and CCR5 mark subsets of T cells
associated with certain inflammatory reactions. J. Clin. Invest 101, 746-754 (1998).
7. Ruth,J.H. et al. Selective lymphocyte chemokine receptor expression in the
rheumatoid joint. Arthritis Rheum. 44, 2750-2760 (2001).
8. Sorensen,T.L. & Ransohoff,R.M. Etiology and pathogenesis of multiple sclerosis.
Semin. Neurol. 18, 287-294 (1998).
9. Cameron,M.J., Bermejo-Martin,J.F., Danesh,A., Muller,M.P. & Kelvin,D.J. Human
immunopathogenesis of severe acute respiratory syndrome (SARS). Virus Res.
(2007).
10. Christen,U. et al. Cure of prediabetic mice by viral infections involves lymphocyte
recruitment along an IP-10 gradient. J. Clin. Invest 113, 74-84 (2004).
11. Dufour,J.H. et al. IFN-gamma-inducible protein 10 (IP-10; CXCL10)-deficient
mice reveal a role for IP-10 in effector T cell generation and trafficking. J.
Immunol. 168, 3195-3204 (2002).
12. Cameron,M.J. et al. Interferon-mediated immunopathological events are associated
with atypical innate and adaptive immune responses in patients with severe acute
respiratory syndrome. J. Virol. 81, 8692-8706 (2007).
13. Cheung,C.Y. et al. Cytokine responses in severe acute respiratory syndrome
coronavirus-infected macrophages in vitro: possible relevance to pathogenesis. J.
Virol. 79, 7819-7826 (2005).

88
14. Tang,N.L. et al. Early enhanced expression of interferon-inducible protein-10
(CXCL-10) and other chemokines predicts adverse outcome in severe acute
respiratory syndrome. Clin. Chem. 51, 2333-2340 (2005).
15. Peiris,J.S. et al. Re-emergence of fatal human influenza A subtype H5N1 disease.
Lancet 363, 617-619 (2004).
16. Martina,B.E. et al. Virology: SARS virus infection of cats and ferrets. Nature 425,
915 (2003).
17. Marshall,E. & Enserink,M. Medicine. Caution urged on SARS vaccines. Science
303, 944-946 (2004).
18. Glass,W.G., Subbarao,K., Murphy,B. & Murphy,P.M. Mechanisms of host defense
following severe acute respiratory syndrome-coronavirus (SARS-CoV) pulmonary
infection of mice. J. Immunol. 173, 4030-4039 (2004).
19. Ng,W.F., To,K.F., Lam,W.W., Ng,T.K. & Lee,K.C. The comparative pathology of
severe acute respiratory syndrome and avian influenza A subtype H5N1--a review.
Hum. Pathol. 37, 381-390 (2006).
20. Ye,J. et al. Molecular pathology in the lungs of severe acute respiratory syndrome
patients. Am. J. Pathol. 170, 538-545 (2007).
21. Sidwell,R.W. & Smee,D.F. In vitro and in vivo assay systems for study of influenza
virus inhibitors. Antiviral Res. 48, 1-16 (2000).
22. Sweet C. Pathogencity of influenza viruses. Smith H. Microbiology Reviews 44,
303-330. 1980.
Ref Type: Generic
23. Zitzow,L.A. et al. Pathogenesis of avian influenza A (H5N1) viruses in ferrets. J.
Virol. 76, 4420-4429 (2002).
24. Govorkova,E.A. et al. Lethality to ferrets of H5N1 influenza viruses isolated from
humans and poultry in 2004. J. Virol. 79, 2191-2198 (2005).
25. Maines,T.R. et al. Avian influenza (H5N1) viruses isolated from humans in Asia in
2004 exhibit increased virulence in mammals. J. Virol. 79, 11788-11800 (2005).
26. Xu,L. et al. Modulation of IL-8 receptor expression on purified human T
lymphocytes is associated with changed chemotactic responses to IL-8. J. Leukoc.
Biol. 57, 335-342 (1995).
27. Liao,F. et al. Human Mig chemokine: biochemical and functional characterization.
J. Exp. Med. 182, 1301-1314 (1995).

89
28. Loos,T. et al. TLR ligands and cytokines induce CXCR3 ligands in endothelial
cells: enhanced CXCL9 in autoimmune arthritis. Lab Invest 86, 902-916 (2006).
29. Nau,G.J., Schlesinger,A., Richmond,J.F. & Young,R.A. Cumulative Toll-like
receptor activation in human macrophages treated with whole bacteria. J. Immunol.
170, 5203-5209 (2003).
30. Tassiulas,I. et al. Apoptotic cells inhibit LPS-induced cytokine and chemokine
production and IFN responses in macrophages. Hum. Immunol. 68, 156-164 (2007).
31. Chien,J.Y., Hsueh,P.R., Cheng,W.C., Yu,C.J. & Yang,P.C. Temporal changes in
cytokine/chemokine profiles and pulmonary involvement in severe acute respiratory
syndrome. Respirology. 11, 715-722 (2006).
32. Ng,P.C. et al. Chemokine response in children with SARS. Arch. Dis. Child 90,
422-423 (2005).
33. Christensen,J.E., de Lemos,C., Moos,T., Christensen,J.P. & Thomsen,A.R.
CXCL10 is the key ligand for CXCR3 on CD8+ effector T cells involved in
immune surveillance of the lymphocytic choriomeningitis virus-infected central
nervous system. J. Immunol. 176, 4235-4243 (2006).
34. Luster,A.D. Chemokines--chemotactic cytokines that mediate inflammation. N.
Engl. J. Med. 338, 436-445 (1998).
35. Tschen,S.I. et al. CNS viral infection diverts homing of antibody-secreting cells
from lymphoid organs to the CNS. Eur. J. Immunol. 36, 603-612 (2006).
36. Xie,J.H. et al. Antibody-mediated blockade of the CXCR3 chemokine receptor
results in diminished recruitment of T helper 1 cells into sites of inflammation. J.
Leukoc. Biol. 73, 771-780 (2003).
37. Suguitan,A.L., Jr. et al. Live, attenuated influenza A H5N1 candidate vaccines
provide broad cross-protection in mice and ferrets. PLoS. Med. 3, e360 (2006).
38. Vos,A., Muller,T., Cox,J., Neubert,L. & Fooks,A.R. Susceptibility of ferrets
(Mustela putorius furo) to experimentally induced rabies with European Bat
Lyssaviruses (EBLV). J. Vet. Med. B Infect. Dis. Vet. Public Health 51, 55-60
(2004).
39. Carr,D.J., Chodosh,J., Ash,J. & Lane,T.E. Effect of anti-CXCL10 monoclonal
antibody on herpes simplex virus type 1 keratitis and retinal infection. J. Virol. 77,
10037-10046 (2003).
40. Dawson,T.C., Beck,M.A., Kuziel,W.A., Henderson,F. & Maeda,N. Contrasting
effects of CCR5 and CCR2 deficiency in the pulmonary inflammatory response to
influenza A virus. Am. J. Pathol. 156, 1951-1959 (2000).

90
41. Shigihara,T. et al. CXCL10 DNA vaccination prevents spontaneous diabetes
through enhanced beta cell proliferation in NOD mice. J. Immunol. 175, 8401-8408
(2005).

91
Chapter 3
Early gene expression events in ferrets in response to SARS coronavirus
infection versus direct interferon-alpha2b stimulation
(A version of this chapter is published in Virology, volume 409, 2011, p102-112 as
“Early gene expression events in ferrets in response to SARS coronavirus infection
versus direct interferon-alpha2b stimulation”
Ali Danesh, Cheryl M. Cameron, Alberto J. León, Longsi Ran, Luoling Xu, Yuan Fang,
Alyson A. Kelvin, Thomas Rowe, Honglin Chen, Yi Guan, Colleen B. Jonsson, Mark J.
Cameron and David J. Kelvin, with permission from Elsevier.)
1. Introduction
Viral respiratory infections are a major worldwide cause of morbidity and
mortality1,2
. Emerging viral threats, such as the severe acute respiratory syndrome
coronavirus (SARS-CoV), avian influenza H5N1 and pandemic influenza H1N1 virus are
well-poised to cause epidemics or pandemics that could be socially and economically
disastrous3-5
.
For decades, ferrets have been used for the investigation of influenza infection
since they are susceptible to influenza viruses6. More recently, ferrets have also been
shown to be a good model of human SARS-CoV infection7. We have previously
characterized ferret cytokine and chemokine genes as well as have developed
immunological assays for evaluating the ferret immune system following SARS and
influenza infection8-10
.
Ligation of the interferon (IFN) alpha receptors 1 and 2 (IFNAR1 and IFNAR2)
with IFN- induces IFN signaling pathways and promotes IFN gene induction.
Formation of the signal transducer and activator of transcription 1 and 2 (STAT1-
STAT2) heterodimer occurs following the phosphorylation of Janus kinase 1 (JAK1) and

92
tyrosine kinase 2 (Tyk2) that are associated with IFNAR2 and IFNAR1, respectively11
.
These two kinases phosphorylate STAT1 and STAT2, which together form a complex
with interferon regulatory factor 9 (IRF9)12
. The interferon stimulatory factor 3 complex
(ISGF3) binds to interferon-stimulated response element (ISRE) and activates
transcription of IFN- inducible genes, including 2’-5’ oligoadenylate synthase 1
(OAS1), myxovirus resistance 1 (MX1), interferon stimulated gene 15 (ISG15) and many
other IFN-response genes (IRGs)13
.
IFN- stimulation ultimately promotes a cellular antiviral state which is
hallmarked by the upregulation of IRGs14
. Although IFN signaling gene upregulation
during viral infection has been the subject of previous reports, there is little information
regarding the host immune responses directly induced by viruses versus those that are
upregulated due to secondary IFN stimulation15-18
. Here we used our previously-
described ferret model19
to identify genes that were regulated by SARS-CoV infection
compared to IFN-2b stimulation in the ferret model to elucidate immune responses
during viral infection. We examined the phosphorylation status of signaling molecules in
IFN-2b stimulated peripheral blood mononuclear cells (PBMCs). We also analyzed the
in vivo gene expression profiles of ferret PBMCs and lung necropsies following IFN-2b
injection during the time course. Evaluation of gene expression patterns in PBMCs and
lung necropsies of SARS-CoV infected ferrets led us to the identification of 7
upregulated IRGs that also were upregulated in response to IFN-2b injection. Our
findings in ferrets suggested IFN-2b injection and SARS-CoV infection led to similar as
well as unique gene expression signatures in a global point of view. Increased knowledge
of the interaction of these gene expression signatures may improve our understanding of

93
the immune system of ferrets as a preferred animal model of severe respiratory viral
illnesses.

94
2. Materials and methods
2.1 Ferrets
Male, 1 kg, six-month-old ferrets (Mustela putorius furo) were purchased from
Marshall Farms Inc. (Oak Park, IL) and housed at the Toronto General Research Institute
animal facility (Toronto, Canada) or at Southern Research Institute (Birmingham, AL,
USA). Ferrets were quarantined and monitored five days prior to tissue and blood
collection. The ferrets’ diet was based on a low fat/high protein regimen as recommended
by Marshal Farms. Animal protocols were approved and monitored by the Animal Care
Committee of the University Health Network or of the Southern research Institute.
2.2 In vitro blood stimulation with IFN-2b
Whole blood was drawn from 4 ferrets and diluted ¼ with cell culture media
(Invitrogen, CA). Two ml of diluted blood from 4 animals was stimulated with 0.001
g/ml IFN-2b (pegylated IFN-2b, Schering-Plough, Pointe-Claire, Canada) in separate
wells and incubated at 37oC (5% CO2) for 1 and 3 hours. PBS was added to 3 control
wells. The cultured blood was then harvested and injected to PaxGene tubes and RNA
was purified (Invitrogen, CA). One ml of blood stimulated with IFN-2b and or PBS was
also added to 10 ml Lyse/Fix buffer (BD Biosciences, USA) for evaluation of
phosphorylation status of signaling molecules at 0, 15, 30, 45, 60, 75 and 90 minutes,
using PhosFlow antibodies (BD Biosciences, USA).

95
2.3 In vivo injection of ferrets with IFN-2b
Subcutaneous injections of 1 ml of PBS (control) or 1 g/ml of IFN-2b were
performed on the back of each ferret. Two ml of blood was collected directly into
PaxGene tubes. One gram of the lung necropsy was added to TRIzol® reagent
(Invitrogen CA). Collected blood and lung tissues were used for RNA isolation, which
then used for microarray, and quantitative real-time PCR analysis. One ml blood was
added to Lyse/Fix buffer (BD Biosciences, San Jose, CA) for analysis of the signaling
molecule phosphorylation status.
2.4 In vivo infection of ferrets with SARS-CoV
Ferrets were infected with SARS-CoV in the Animal Biohazard Safety Level 3
(ABSL3) facility at Southern Research Institute (Birmingham, AL, USA), in accordance
with the approved protocols. Three male ferrets, weighing approximately 800–1000 g,
were infected intranasally with 103 TCID50 SARS-CoV TOR2 strain (isolated from a
patient in Toronto and sequenced at CDC, Vancouver, BC) in 1 mL PBS. An additional 3
animals were mock-infected with 1 mL PBS. Animals were anesthetized and blood and
lung necropsies were collected for RNA purification. Infection of ferrets with the above
mentioned dose results in weight loss, decreased activity temperature increase and
histology lesions with no mortality during the disease course19
. A summary of natural
history of ferrets infected with SARS-CoV has been provided as Table 3-5.

96
2.5 Intracellular staining
One ml of in vitro-stimulated blood with IFN-2b or PBS and/or 1 ml of blood
drawn from the IFN-2b or PBS injected ferrets and/or 1ml blood from infected ferrets
with SARS-CoV or mock controls (in vivo) was added to 10 ml Lyse/Fix buffer (BD
Biosciences, USA) and incubated in a 37oC water bath for 10 minutes. Tubes were then
centrifuged at 300g for 5 minutes and the cells were washed twice with cold PBS. One ml
Perm III (BD Biosciences, USA) was added to each tube and the tube was incubated on
ice for 20 minutes to permeabilize cells for intracellular staining. Cells were washed with
Perm/Wash (BD Biosciences, USA) and 106 cells were added to each tube for flow
cytometry. Twenty l of phosphorylated P-STAT1, P-STAT3, P-STAT4, P-STAT5, P-
p38 and P-ERK antibodies conjugated with Alexa-Fluor 488 was added to separate tubes
(BD Biosciences, USA). Matched isotype control was added to one tube as a negative
control. Tubes were incubated at room temperature in the dark for 30 minutes. Cells were
washed with cold Perm wash (BD Biosciences, USA) and fixed with 2%
paraformaldehyde in PBS. Twenty-thousand events were acquired with a BD
FACSCalibur (BD Biosciences, USA) and data were analyzed, using FlowJo software
(Tree Star Inc., USA).
2.6 Cloning and sequencing of ferret-specific genes
Cloning and sequencing was performed as described previously9. Briefly, purified
RNA was reverse transcribed to cDNA using Invitrogen RT-kits (Invitrogen, Carlsbad,
CA). Gene-specific degenerate primers were designed based on multiple gene sequence
alignment analysis of several species using ClustalW (1.83) and then used to clone the

97
cDNAs for each gene. Standard PCRs were performed and specific bands were gel-
purified (Qiagen, Mississauga, Canada) and cloned into the pCR 2.1-TOPO vector
(Invitrogen, Calsbad, USA). Sequences of positive clones were confirmed using an ABI
3730XL DNA analyzer (Applied Biosystems, Foster City, CA). The identification of
genes was performed using Basic Local Alignment Search Tool (BLAST) analyses
against National Centre for Biotechnology Information (NCBI) database.
2.7 Gene accession numbers
STAT1 (EU835493), STAT2 (EU835988), MX1 (EU835483), OAS1
(EU835484), ISG15 (EU835986), ISG20 (EU835990), IRF7 (EU835985), IFI35
(EU835487), PKR (EU835989), P52RIPK (EU835488), CXCL8 (EU835489), SOCS3
(EU835987)
2.8 Quantitative Real-Time PCR (qRT-PCR)
The following components were added to the reaction mixture plus cDNA to a
total volume of 10 µL in distilled water: 0.2 l cDNA, 250 nmol forward gene-specific
primer, 250 nmol reverse gene-specific primer and 5 L Cyber Green (Applied
Biosystems, Foster City, CA). For every experiment, each reaction was performed in
triplicate. An ABI 7900 Sequence Detection System (Applied Biosystems, Foster City,
CA) was used for amplification. Initial denaturation was 15 minutes at 95oC, followed by
40 cycles of amplification. Each cycle consisted of a denaturation step (15 seconds at
95oC) and an annealing/extension step (1 minute at 60
oC). Expression levels were

98
normalized to β-actin and data was analyzed by SDS 2.1 software (Applied Biosystems,
Foster City, CA).
2.9 Microarray analysis
Briefly, 0.5 g of total RNA was isolated using Paxgene whole blood purification
kits or TRIzol® reagent. Oligonucleotide microarray analysis was performed using
Affymetrix two-cycle cRNA synthesis and IVT kits (Affymetrix, Santa Clara, CA).
cRNA samples (20 g) were labelled and hybridized to Affymetrix GeneChip Canine
Genome 2.0 Arrays to monitor the gene expression of over 18,000 Canis familiaris
mRNA/EST-based transcripts and over 20,000 non-redundant predicted genes. As
described earlier, canine arrays were used following the observation of high levels of
homology between canine and ferret nucleotide sequences (average of 89% identity)8,20
.
Table 3-1 demonstrates the amino acid identity of genes in this study compared to
available orthologues of human and mouse. The arrays were scanned using an Affymetrix
GCS3000 7G system according to standard Affymetrix protocols. Probe-level analysis
was performed using Probe Logarithmic Intensity Error (PLIER). The raw intensity
values for each individual target on the Affymetrix chips were pre-processed with
variance stabilization, log2-transformation and were then normalized against the time
zero datasets with ArrayAssist V 5.5.1 (Stratagene, USA). Student’s t-tests or EDGE time
course differential expression analysis21
were performed with Benjamini-Hochberg false
discovery rate (FDR) correction. Genes with a significant difference were selected for
agglomerative hierarchical clustering with Pearson distance metrics and average linkage
distance measurements between clusters using GeneLinker Platinum V 4.6.1 (Improved

99
Outcomes Software, Kingston, Canada). Ingenuity Pathway Analysis 5.0 software
(Ingenuity Systems Inc., Redwood City, CA) was used to annotate and organize the gene
expression data into networks and pathways. Pathways and functional categories were
considered as over-represented when Fisher’s exact test P value was ≤0.05. Datasets are
publicly available at the NCBI’s Gene Expression
Omnibus (http://www.ncbi.nlm.nih.gov/geo) accession number GSE22581.
2.10 Statistical analysis
T tests or EDGE analyses were used for statistical analysis considering a biological
filter of 1.5 fold change compared to controls and a P value of ≤0.05 as significant.

100
3. Results
3.1 IFN-2b stimulation and SARS-CoV infection induced STAT1 phosphorylation
and increased the expression levels of IRGs
We first investigated the phosphorylation of the IFN- receptor downstream
signaling molecule STAT1 to determine the signaling potential of IFN-2b in ferrets.
The phosphorylation status of STAT1 was evaluated using phosphorylated amino acid
specific monoclonal antibody for flow cytometry analysis that cross-reacted with the
phosphorylated ferret protein. Peripheral blood mononuclear cells (PBMCs)
demonstrated a significant STAT1 phosphorylation response 15 minutes post-stimulation
with IFN-2b in vitro compared to the control stimulated with PBS alone (Figue 3-1).
Since STAT1 phosphorylation was observed in vitro, we then determined whether
IFN-2b could activate STAT1 in vivo. Four ferrets were subcutaneously injected with 1
g/kg IFN-2b and peripheral blood samples were taken at 0, 3 and 6 hours post-
stimulation for flow cytometry examination. By 3 hours, samples extracted from all
ferrets demonstrated significant STAT1 phosphorylation in the PBMCs. Control ferrets
injected with PBS did not demonstrate marked STAT1 phosphorylation at any time point.
The STAT1 average mean fluorescent intensity (MFI) of the IFN-2b injected group was
significantly increased compared to the average of its control group (P<0.01) (Figure 3-
2A). These results indicated that STAT1 was also inducible by IFN-2b in vivo.

101
Figure 3-1. In vitro phosphorylation of STAT1 in peripheral blood of ferrets
following stimulation with IFN-2b. Average mean fluorescent intensities ( MFI) of
IFN-2b stimulated ferret whole blood in 3 wells from 3 ferrets and PBS-stimulated
blood in 3 wells from 3 ferrets were measured by flow cytometry (Y axis) in PBMCs
gates. The X axis indicates the MFI changes during the time course. Lines with black
diamonds: phosphorylated STAT1 in control ferret cells, lines with black squares:
phosphorylated STAT1 in ferret cells cultured with IFN-2b. *P<0.01 using student t
test.

102
* P<0.01
0
10
20
30
40
50
60
70
0' 15' 30' 45' 60' 75' 90'
Time course
MF
I
Mock
IFN-a2b injected
* *
* * *
IFN-2b
stimulated Moc
k

103
Figure 3-2. In vivo phosphorylation of STAT1 in ferret peripheral blood
mononuclear cells. A) In vivo stimulation with IFN-2b; the STAT1 average mean
fluorescent intensities (MFI) of IFN-2b-injected (n=4) and control (n=4) groups were
measured by flow cytometry during the time course (X axis) in the PBMC gate. The Y
axis indicates the MFI between STAT1 phosphorylation and isotype control. White
bars: Control group, black bars IFN-2b injected group. P<0.01, using student t test. B)
In vivo infection with SARS-CoV; the STAT1 average MFI in PBMCs of 3 SARS-CoV
infected ferrets (black bars) versus 3 mock controls (white bars) during the time course
(P<0.01). Bars are representative averages of MFI between STAT1 phosphorylation
and isotype control.
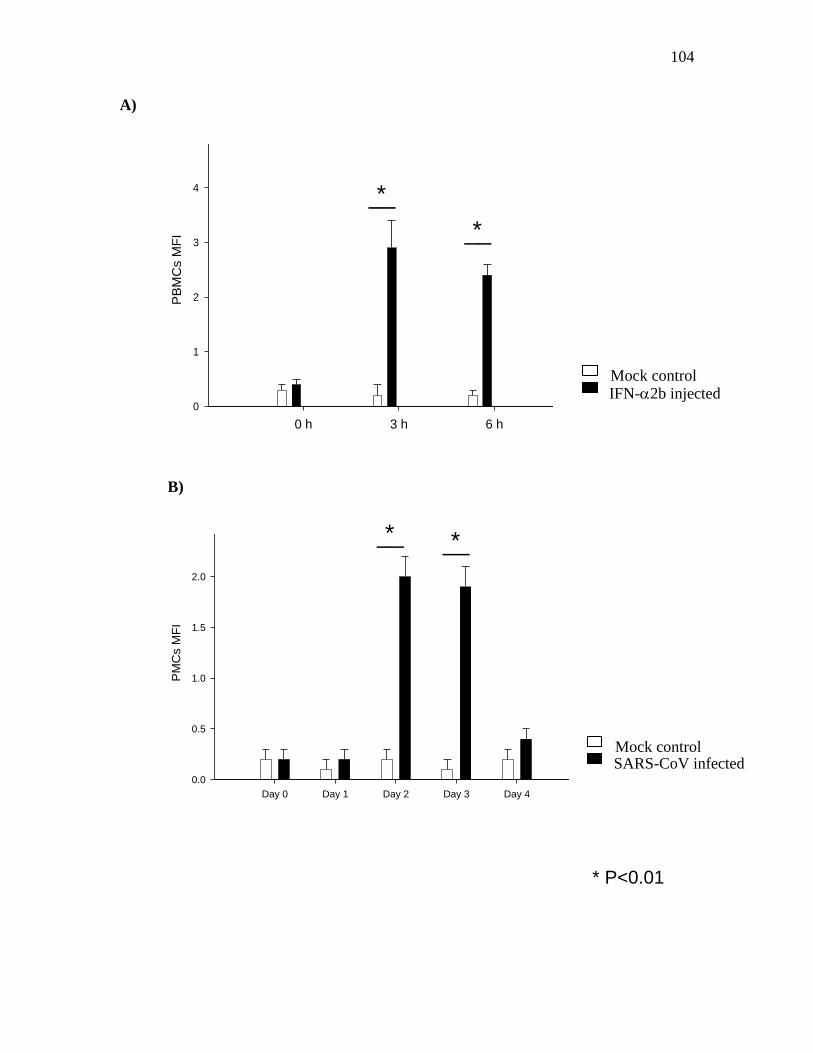
104
A)
B)
Day 0 Day 1 Day 2 Day 3 Day 4
PM
Cs M
FI
0.0
0.5
1.0
1.5
2.0
2.5
__ * __ *
0 h 3 h 6 h
PB
MC
s M
FI
0
1
2
3
4
5
__ *
__ *
IFN-2b injected Mock control
SARS-CoV infected Mock control
* P<0.01

105
IFN signaling is critical to successful antiviral responses during infection22
.
Therefore, we next investigated the phosphorylation status of STAT1 following SARS-
CoV infection. We infected ferrets with SARS-CoV or PBS control and measured the
phosphorylation of STAT1 by flow cytometry. Three ferrets infected with SARS-CoV
demonstrated significant STAT1 phosphorylation in PBMCs post-infection with a
maximum peak at day 3 (P<0.01). Control ferrets mock-infected with PBS did not
demonstrate significant STAT1 phosphorylation at any time point (Figure 3-2B).
Since STAT1 was phosphorylated following SARS-CoV infection and IFN-2b
injection, we investigated select IRG expression by qRT-PCR following in vitro
stimulation of ferret peripheral whole blood with IFN-2b. In vitro stimulation with IFN-
2b led to significant upregulation of STAT1 and several IRGs such as MX1, OAS1,
ISG15, ISG20, IRF7 and interferon-induced protein 35 (IFI35). As expected, activation
of IFN- receptor signaling initiated transcriptional activation of interferon response
genes (Figure 3-3).
3.2 Microarray analysis of IFN-2b injection or SARS-CoV infection in ferret
peripheral blood
We then assessed genome-wide gene expression following in vivo IFN-2b
administration in ferrets. Ferrets were subcutaneously injected with PBS (control) or IFN-
2b and blood samples were drawn for RNA isolation 1 and 2 days after injection.
Without a commercially available ferret microarray, the RNA was then used for
microarray analysis on the Affymetrix GeneChip Canine Genome 2.0 Array (see
106
Figure 3-3. Gene expression profile measured by qRT-PCR in peripheral blood of
ferrets stimulated with IFN-2b in vitro. Whole blood drawn from 8 ferrets was
stimulated with either IFN-2b or with PBS as the control group. qRT-PCR was
performed to measure the gene expression at the mRNA level. Values are shown as fold
increases after normalization against -actin. White and black bars represent the mean
value of control group and IFN-2b injected group respectively. STAT1 and downstream
IRGs were significantly upregulated during the time course (P<0.001***, P<0.01**,
using student t test).

107
0 h 1 h 3 h
0
2
4
6
8
10 STAT1
***
***
0 h 1 h 3 h
0
5
10
15
20
25
30 MX1
***
***
0 h 1 h 3 h
0
10
20
30
40
50
60 ISG15
**
**
0 h 1 h 3 h
0
20
40
60
80
100 OAS1
**
**
0 h 1 h 3 h
0
2
4
6
8
10
12
14ISG20
**
**
0 h 1 h 3 h
0
20
40
60
80 IRF7
**
**
0 h 1 h 3 h
0.0
0.5
1.0
1.5
2.0
2.5
3.0 IFI35
**
**
*** P<0.001 ** P<0.01
IFN-2b stimulated
Control

108
Materials and Methods), because ferret genes show a high degree of homology with
canine genes as we have previously established8,20,23
(Table 3-1). The peripheral blood
gene expression data from IFN-2b-injected group was normalized to the control group.
The t-test analyses showed the highest number of significant changes occurred at day 2,
with a total of 2717 upregulated and 1230 downregulated genes in peripheral blood of the
IFN-2b-injected ferrets (Table 3-2). A threshold of at least 1.5 fold-change and a p
value for the t-tests of less than 0.05 were chosen. The peak upregulation of a cluster of
IRGs, including MX1, OAS1, OAS2, ISG15, IFI44 and ubiquitin specific protein 18
(USP18), occurred at day 1, while peak upregulation of IRGs such as JAK1, JAK2,
protein inhibitor of activated STAT1 (PIAS1) IRF1, interferon- receptor 1 (IFNGR1),
and eukaryotic translation initiation factor 2-alpha kinase 2 (EIF2AK2) occurred at day 2
post-injection (Figure 3-4A and Table 3-3).
After assessing the large scale gene expression profile following ferret in vivo
IFN-2b stimulation, we validated the expression of selected IRGs by qRT-PCR
according to the availability of the ferret specific primers. We found STAT1 and IRGs
such as MX1, OAS1 and ISG15 were significantly upregulated in ferrets injected with
IFN-2b compared to the controls (Figure 3-4B). The lack of ferret sequences for other
IRGs prevented us from confirming the upregulation of these genes.
To determine if STAT1 phosphorylation was correlated with IRG activation in
our ferret animal model of SARS-CoV infection19
, we went on to analyze host gene
expression following SARS-CoV infection. The gene expression data at day 2 post-
infection with SARS-CoV was normalized to the mock control dataset. Unfortunately,

109
Table 3-1. Amino acid percentage identity of ferret immune genes compared to
known species. Gene symbol Dog Human Mouse
STAT1 90 89 87
STAT2 79 86 75
STAT3 97 98 98
MX1 89 78 72
OAS1 79 70 65
ISG15 87 73 64
ISG20 81 75 72
IRF1 93 89 79
IRF2 100 94 93
IRF7 80 73 65
IFI35 82 74 71
PKR 100 100 98
P52RIPK 88 86 81
CXCL8 90 76 52
CXCL9 NA* 68 58
CXCL10 81 80 67
CXCL11 NA 86 63
NFKB 98 97 93
NFKB inhibitor 100 94 87
CXCR3 92 91 86
CCL5 96 83 76
SOCS3 100 100 97
SOCS5 98 95 88
IFN-α 71 54 48
IFN-β 75 57 44
IFN-γ 86 63 48
TNF-α 95 88 77
IL-1β 71 61 58
IL-4 84 47 36
IL-6 75 58 38
IL-16 78 65 67
CCL13 80 NA NA
TLR3 95 89 87
TLR7 100 96 92
*NA = not available

110
Table 3-2. Summary of differentially regulated genes in top functional groups during
the time course in IFN-2b-injected or SARS-CoV infected ferrets.
IFN-2b SARS-CoV
Day 1 Day 2 Day 1 Day 2
BL LG BL LG LG BL LG
Total upregulated genes 716 82 2717 512 4222 138 1014
Total downregulated genes 51 147 1230 550 1248 414 894
Cellular process ↑ 440 44 1581 266 2180 69 542
Cellular process ↓ 15 83 577 318 570 229 427
Metabolic process ↑ 328 30 1212 175 1573 52 369
Metabolic process ↓ 8 58 383 247 392 188 297
Intracellular signaling cascade
↑ 50 3 205 40 271 12 63
Intracellular signaling cascade
↓ 2 11 81 0 80 29 60
Cell cycle ↑ 48 6 160 23 178 6 45
Cell cycle ↓ 0 11 36 44 38 30 29
Immune response ↑ 32 6 82 18 125 9 44
Immune response ↓ 0 2 32 0 39 7 29
Number of regulated genes in different functional categories with at least 1.5-fold change
and a significant t-test of p<0.05 (↑ upregulated, ↓ downregulated).

111
Figure 3-4. Microarray and qRT-PCR analysis of IRG expression in peripheral
blood and lung necropsies of ferrets injected with IFN-2b or infected with SARS-
CoV in vivo during the time course. A) Ferrets were injected with IFN-2b or with
PBS. Whole blood or lung necropsies were collected at day 1 and day 2. mRNA was
purified, converted to cRNA and ran on the Affymetrix Canine gene chip II. Hierarchal
microarray EDGE analysis demonstrated a cluster of IRGs, which were significantly
upregulated (red color). B) Upregulation of IRGs was confirmed at peak time-points with
qRT-PCR, where ferret specific primers were available. White and black bars are the
mean gene expression level of control and injected ferrets respectively, normalized to
actin. C) Differential upregulation of IRGs observed following the microarray analysis of
blood and lung necropcies of ferrets infected with SARS-CoV. D) Upregulation of 4
IRGs was confirmed by qRT-PCR.
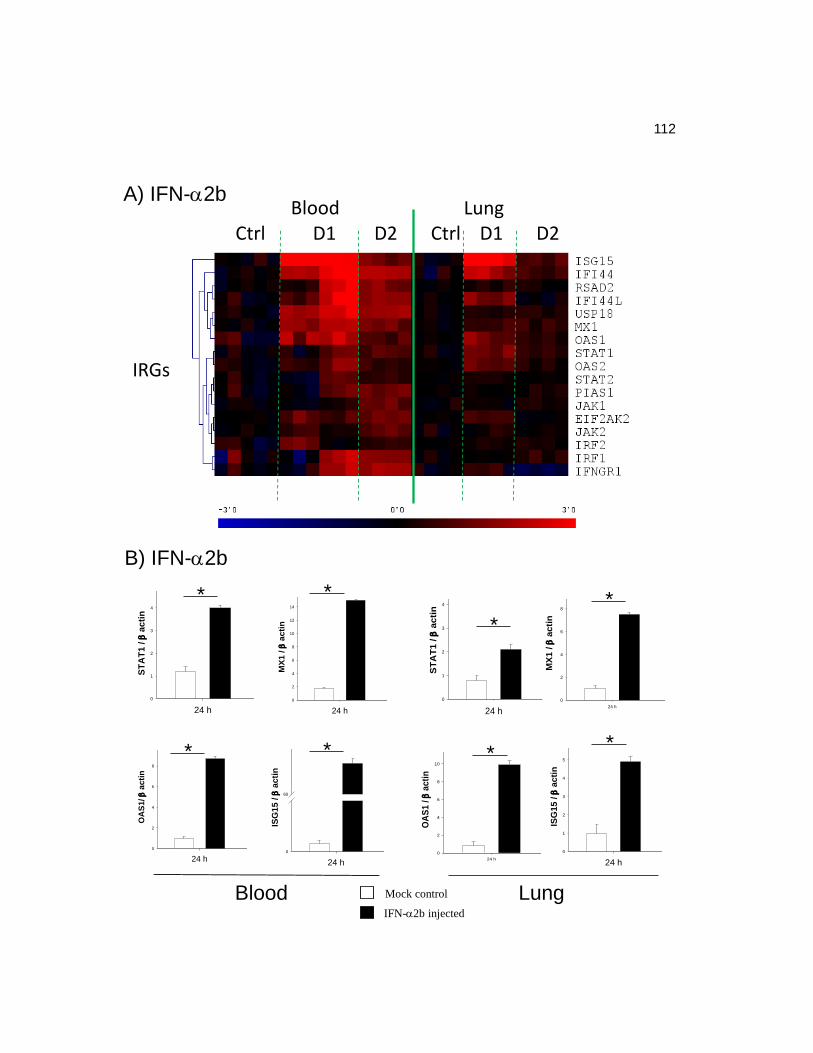
A) IFN-a2b
IRGs
Ctrl D1 D2 Ctrl D1 D2Blood Lung
Blood Lung
24 h
ST
AT
1 /
a
cti
n
0
1
2
3
4
5
24 h
MX
1 /
ac
tin
0
2
4
6
8
10
12
14
16
24 h
OA
S1/ a
cti
n
0
2
4
6
8
10
24 h
ISG
15 /
acti
n
0
60
80
* *
* *
24 h
ST
AT
1 /
a
cti
n
0
1
2
3
4
5
24 h
MX
1 /
a
cti
n
0
2
4
6
8
10
24 h
OA
S1
/
ac
tin
0
2
4
6
8
10
12
24 h
ISG
15
/
ac
tin
0
1
2
3
4
5
6
*
*
*
*
B) IFN-a2b
IFN-a2b injected
Mock control
112

C) SARS-CoV
IRGs
Ctrl D2 Ctrl D1 D2
Blood Lung
Blood Lung
48 h
ST
AT
1 /
acti
n
0
1
2
3
4
5
6 *
48 h
OA
S1
/
ac
tin
0
2
4
6
8
10
12
14 *
48 h
MX
1 /
ac
tin
0
1
2
3
4
5
6 *
48 h
ISG
15 /
acti
n
0
10
20
30
40
50
*
48 h
OA
S1
/
ac
tin
0
1
2
3
4
5 *
48 h
ISG
15 /
acti
n
0
1
2
3
4
5
*
*
48 h
MX
1 /
acti
n
0
2
4
6
8
10
12
14
16
48 h
ST
AT
1 /
ac
tin
0
2
4
6
8
10
12
14 *
D) SARS-CoV
SARS-CoV infected
Mock control
113

114
Table 3-3. Interferon-regulated genes fold change during the time course in IFN-
2b-injected or SARS-CoV infected ferrets.
Symbol Gene Name
IFN-α2b SARS-CoV
Day 1 Day 2 Day 1 Day 2
Blood Lung Blood Lung Lung Blood Lung
Interferon-regulated genes (IRGs)
EIF2AK2 eukaryotic translation initiation factor 2-alpha kinase 2 1.9 1.7 2.4 - 1.8 - -
IFI35 interferon-induced protein 35 - - - - 2.1 - 1.5
IFI44 interferon-induced protein 44 5.8 4.1 4.3 1.6 5.2 5.5 7.0
IFI44L interferon-induced protein 44-like 3.7 2.7 3.2 - 2.7 3.1 3.8
IFIT1
interferon-induced protein with tetratricopeptide repeats
1 - - - - 1.7 - -
IFNGR1 interferon gamma receptor 1 - - 3.8 - 1.7 - -
IRF1 interferon regulatory factor 1 - - 3.0 - 1.7 - 1.6
ISG15 ISG15 ubiquitin-like modifier 11.0 14.3 2.4 1.8 35.2 14.0 10.8
JAK1 Janus kinase 1 (a protein tyrosine kinase) - - 2.2 - - - -
JAK2 Janus kinase 2 (a protein tyrosine kinase) - - 2.1 - - - -
MX1 myxovirus (influenza virus) resistance 1, interferon-
inducible protein p78 (mouse) 3.8 1.6 2.5 - 5.7 2.4 4.4
OAS1 2.,5.-oligoadenylate synthetase 1, 40/46kDa 4.0 2.5 1.9 - 11.4 4.6 2.1
OAS2 2.-5.-oligoadenylate synthetase 2, 69/71kDa 2.1 2.2 - - 5.2 4.1 2.9
OASL 2.-5.-oligoadenylate synthetase-like - - - - - 2.2 -
PIAS1 protein inhibitor of activated STAT, 1 - - 2.4 - - - -
PSMB8
proteasome (prosome, macropain) subunit, beta type, 8
(large multifunctional peptidase 7) - - - - 1.7 - 1.7
RSAD2 radical S-adenosyl methionine domain containing 2 2.9 - 2.7 - - 9.3 2.1
SOCS1 suppressor of cytokine signaling 1 - - - - - 10.2 -
STAT1 signal transducer and activator of transcription 1, 91kDa 1.5 2.6 1.9 - 3.0 2.7 2.1
USP18 ubiquitin specific peptidase 18 4.9 - 3.7 - - 6.0 -
Upregulated genes relative to controls, showing ≥1.5-fold increase and t-test’s p<0.05.

115
blood samples from day 1 post-infection did not meet minimal RNA quality for
microarray analysis, preventing us from performing a time-course study on the peripheral
blood. There were 138 upregulated and 414 downregulated genes (p < 0.05, > 1.5 fold
change) as ascertained by t-test analysis at day 2 post-infection (Table 3-2). IRGs,
including STAT1, MX1, OAS1, OAS2, ISG15, IFI44, suppressor of cytokine signaling 1
(SOCS1), radical S-adenosyl methionine domain containing 2 (RSAD2), USP18 and
OAS ligand (OASL) were significantly upregulated (Figure 3-4C and Table 3-3). The
upregulation of STAT1, MX1, OAS1 and ISG15 were validated with qRT-PCR (Figure
3-4D). These gene expression and STAT1 phosphorylation findings suggested that
robust IFN responses were activated following SARS-CoV infection 2 days post-
infection.
Interferon canonical pathway analysis confirmed the similarities between the
expression patterns of IRGs at day 2. STAT1, MX1, OAS1, USP18, RSAD2, ISG15 and
IFI44 were upregulated in the peripheral blood of IFN-2b-injected and SARS-CoV-
infected ferrets. In contrast, OASL, OAS2 and SOCS1 were upregulated during SARS-
CoV infection alone (Figure 3-5A).
3.3 Microarray analysis of IFN-2b injection or SARS-CoV infection in ferret lungs
Since SARS-CoV infection causes severe lung pathology we went on to compare
and contrast the genes upregulated by IFN-2b stimulation and SARS-CoV infection in
the lungs of ferrets. Microarray analysis was performed on lung necropsies of IFN-2b-
injected ferrets compared to controls. The peak gene expression occurred at day 2 with a

116
Figure 3-5. Intersect analysis of IRGs expression in blood and lung tissue from IFN-
2b injected and SARS–CoV infected ferrets. Venn diagrams are representative of
IRGs upregulation and indicate the total number of regulated genes. The time points were
chosen according to the highest expression levels of IRGs. For more information, refer to
Table 3-3.

117
A) Blood, day 2
SARS-CoV IFN-2b
IFI44 ISG15 MX1 OAS1 RSAD2 STAT1 UPS18
OAS2 OASL SOCS1
EIF2AK2 IFI44L IFNGR1 IRF1 JAK1 JAK2 PIAS1
3699 304 248
SARS-CoV IFN-2b
130 5371 99
B) Lung, day 1
EIF2AK2 IFI44 IFI44L ISG15 OAS1 OAS2 MX1 STAT1
IFI35 IFIT1 IFNGR1 IRF1 PSMB8
Total regulated genes
Total regulated genes
Upregulated IRGs
Upregulated IRGs
118
total of 512 upregulated and 550 downregulated (p < 0.05) genes (Table 3-2).
Interestingly, the strongest upregulation of several IRGs, such as STAT1, MX1, OAS1,
OAS2, ISG15, IFI44, IFI44 ligand (IFI44L) and EIF2AK2, occurred on day 1 (Figure 3-
4A and Table 3-3). There was a marked increase in the total number of regulated genes
from lung necropsies of SARS-CoV-infected ferrets compared to lungs from IFN-2b-
stimulated ferrets. The SARS-CoV infected ferrets had a peak in gene expression at day 1
with 4222 upregulated versus 1248 downregulated genes (p < 0.05) (Table 3-2). Both the
number of upregulated IRGs and the expression levels peaked at day 1, including
STAT1, MX1, OAS1, OAS2, ISG15, IRF1, interferon-induced protein with
tetratricopeptide repeats 1 (IFIT1), IFI35, IFI44, IFI44L, proteasome subunit
multifunctional beta 8 (PSMB8), EIF2AK2 and IFNRG1. JAK1 was the only IRG that
was downregulated at day 1 (Figure 3-4C). The upregulation of STAT1, MX1, OAS1 and
ISG15 was validated with qRT-PCR on lung necropsies of ferrets injected with IFN-2b
or infected with SARS-CoV (Figure 3-4D). The comparison of microarray results
between the lung tissue of IFN-2b-injected and SARS-CoV-infected ferrets at day 1
revealed commonalities in the expression patterns of most IRGs. STAT1, MX1, OAS1,
OAS2, ISG15, IFI44, IFI44L and EIF2AK2 were among the overlapping genes (Figure
3-5B).
3.4 Pathway and functional group differential gene expression patterns
To further model the pathways involved in the host response to SARS-CoV and
the direct effects of IFN-2b administration, functional analysis of the regulated genes

119
was performed using Ingenuity Pathway Analysis software. For each experimental group,
genes showing changes in their expression levels were mapped into high-level Gene
Ontology categories: cellular process, metabolic process, intracellular signaling cascade,
cell cycle and immune response (Table 3-2). The number of genes present in each
functional category is representative of the level of biological activity in each
experimental group with respect to the controls. Analysis of the IFN signaling canonical
pathway showed the upregulation of STAT1, MX1, OAS1, OAS2, ISG15 and IFI44 in
lung necropsies of IFN-2b injected and SARS-CoV infected ferrets (Figure 3-6).
Functional classification of upregulated genes showed that IFN-2b induces
increased expression of phagocytosis-related genes, such as Fc fragment of IgG, high
affinity Ia, receptor CD64 (FCGR1A) and dynamin 1-like (DNM1L), leukocyte
transendothelial migration genes, such as integrin beta 1 and 2 (ITGB1 and ITGB2), and
upregulation of chemokine receptors, chemokine C-C motif receptor 3, 7 and 9 (CCR3,
CCR7, CCR9) and chemokine C-X-C motif receptor 4 (CXCR4) (Table 3-4). These
results suggest that IFN-2b is able to activate specific functions of the leukocyte
responses in blood samples after exposure.
The lungs of ferrets infected with SARS-CoV showed broader immune responses
than IFN-2b-injected ferrets, as demonstrated by the higher number of regulated genes
in several functional categories related to the activation of the immune responses,
including: complement and coagulation, cell adhesion molecules and leukocyte activation
(Figure 3-7).

120
Figure 3-6. IRG pathway analyses of microarray datasets in lung necropsies of IFN-
2b injected and SARS-CoV infected ferrets. Ingenuity pathway analyses indicated
similar patterns of IRGs upregulation, downstream of STAT1 signaling pathway in lung
tissue from ferrets A) injected with IFN-2b and B) infected with SARS-CoV.

IFN-a2b injected ferrets
SARS CoV infected ferrets
B)
-4 0 4
A)
121

122
Table 3-4. Comparison of canonical pathways between ferrets injected with IFN-2b
and those infected with SARS-CoV during the time course.
Symbol Gene Name
IFN-α2b SARS-CoV
Day 1 Day 2 Day
1 Day 2
Blood Lung Blood Lung Lung Blood Lung
Apoptosis
BAX BCL2-associated X protein 1.8 - 2.4 - 4.4 - -
CASP3 caspase 3, apoptosis-related cysteine peptidase - - 1.6 - 1.5 - -
CASP6 caspase 6, apoptosis-related cysteine peptidase 1.9 - 2.5 - - - -
CASP7 caspase 7, apoptosis-related cysteine peptidase - - 1.9 - - - -
CASP8 caspase 8, apoptosis-related cysteine peptidase - - 1.6 - - - -
ENDOD1 endonuclease domain containing 1 - - 1.7 - - - -
TNFSF10 tumor necrosis factor (ligand) superfamily, member 10 1.8 - 2.0 1.5 2.3 2.5 2.6
Cell cycle
CCNA1 cyclin A1 - - 1.6 - - - -
CCND3 cyclin D3 - - 2.1 - - - -
CCNE1 cyclin E1 - - 1.6 - 1.6 - 1.5
CDK7 cyclin-dependent kinase 7 - - 1.9 - - - -
SMAD2 SMAD family member 2 - - 2.0 - - - -
SMAD4 SMAD family member 4 1.6 - 3.3 - - - -
Chemokines/Chemokine receptors
CCL14 chemokine (C-C motif) ligand 14 - - - - 2.6 1.7 -
CCL17 chemokine (C-C motif) ligand 17 - - - - 2.2 - -
CCL19 chemokine (C-C motif) ligand 19 - - - - 2.1 - -
CCL2 chemokine (C-C motif) ligand 2 - - - - 1.5 - -
CCL25 chemokine (C-C motif) ligand 25 - - - - 1.7 - -
CCL4 chemokine (C-C motif) ligand 4 - - - - 1.5 - 1.6
CCR3 chemokine (C-C motif) receptor 3 - - 1.6 - - - -
CCR7 chemokine (C-C motif) receptor 7 - - 1.7 - - - -
CCR9 chemokine (C-C motif) receptor 9 - - 1.5 - - - -
CXCL12
chemokine (C-X-C motif) ligand 12 (stromal cell-derived
factor 1) - - 1.8 - 3.5 - -
CXCL14 chemokine (C-X-C motif) ligand 14 - - 1.8 - - - -
CXCR3 chemokine (C-X-C motif) receptor 3 - - - - - - 1.7
CXCR4 chemokine (C-X-C motif) receptor 4 1.7 - 2.2 - - - -

123
Table 3-4. (continued)
Symbol Gene Name
IFN-α2b SARS-CoV
Day 1 Day 2 Day
1 Day 2
Blood Lung Blood Lung Lung Blood Lung
Fc gamma R-mediated phagocytosis
ARPC1A actin related protein 2/3 complex, subunit 1A, 41kDa - - 2.0 - 3.0 - -
ARPC1B actin related protein 2/3 complex, subunit 1B, 41kDa 1.6 - 1.9 - 3.6 - -
ARPC5 actin related protein 2/3 complex, subunit 5, 16kDa 2.1 - 4.0 - - - -
CFL2 cofilin 2 (muscle) - - 1.8 - - - -
DNM1L dynamin 1-like - - 1.8 - - - -
FCGR1A Fc fragment of IgG, high affinity Ia, receptor (CD64) 1.6 - 1.5 - - - -
LYN v-yes-1 Yamaguchi sarcoma viral related oncogene homolog - - 1.9 - - - -
PTPRC protein tyrosine phosphatase, receptor type, C 2.2 - 4.9 - 1.7 - -
SYK spleen tyrosine kinase - - 1.6 - - - -
Glycolysis-gluconeogenesis
ACSS1 acyl-CoA synthetase short-chain family member 1 1.5 - 1.6 - - - 1.5
ACSS2 acyl-CoA synthetase short-chain family member 2 - - 2.4 - 1.9 - -
LDHA lactate dehydrogenase A 2.1 - 2.1 - - - -
LDHB lactate dehydrogenase B - - 1.9 - 3.1 - -
LDHC lactate dehydrogenase C 1.9 - 2.0 - - 1.7 -
PDHA1 pyruvate dehydrogenase (lipoamide) alpha 1 - - 1.5 - 1.8 - -
PDHB pyruvate dehydrogenase (lipoamide) beta 1.5 - 1.7 - - - -
PGM1 phosphoglucomutase 1 - - 1.8 - - 2.0 -
Leukocyte transendotelial migration
CXCR4 chemokine (C-X-C motif) receptor 4 1.7 - 2.2 - - - -
ITGA4
integrin, alpha 4 (antigen CD49D, alpha 4 subunit of VLA-4
receptor) 2.1 - 2.6 - - - -
ITGB1
integrin, beta 1 (fibronectin receptor, beta polypeptide,
antigen CD29 includes MDF2, MSK12 - - 1.9 - - - -
ITGB2
integrin, beta 2 (complement component 3 receptor 3 and 4
subunit) - - 1.6 - 3.0 - -
Wnt signaling pathway
APC adenomatous polyposis coli - 1.5 1.8 1.7 1.7 - -
AXIN2 axin 2 - - 2.1 - - - 1.6
CSNK1A1 casein kinase 1, alpha 1 2.1 - 3.3 - 1.8 - -
CSNK1E casein kinase 1, epsilon - - 1.6 - 2.0 - -
CTNNB1 catenin (cadherin-associated protein), beta 1, 88kDa 1.8 - 3.5 - 2.0 - -
LEF1 lymphoid enhancer-binding factor 1 - - 2.3 - 1.6 - -
SMAD2 SMAD family member 2 - - 2.0 - - - -
SMAD4 SMAD family member 4 1.6 - 3.3 - - - -
TCF7 transcription factor 7 (T-cell specific, HMG-box) - - 1.5 - 1.6 - -
Upregulated genes relative to controls, showing ≥1.5-fold increase and t-test’s p<0.05.

124
Figure 3-7. Microarray analysis of immune response pathways in peripheral blood
and lung necropsies of ferrets injected with IFN-2b or infected with SARS-CoV in
vivo during the time course. Ferrets were injected with IFN-2b or with PBS. Whole
blood or lung necropsies were collected at different time-points. mRNA was purified and
used for microarray EDGE analysis. Three immune pathways that play key roles in early
immune responses (“Leukocyte activation”, “cell adhesion molecules” and “complement
and coagulation”) were used to identify similarities and differences. Red and blue colors
are representative of upregulation and downregulation, respectively. A) IFN-2b
injected ferrets. B) SARS-CoV infected group.

Leukocyteactivation
A) IFN-a2b
Ctrl D1 D2 Ctrl D1 D2
Blood Lung
Cell adhesionmolecules
Complementand coagulation
125

Leukocyte activation
B) SARS-CoV
Ctrl D2 Ctrl D1 D2
Blood Lung
Cell adhesion molecules
Ctrl D2 Ctrl D1 D2
Blood Lung
Complement and coagulation
Ctrl D2 Ctrl D1 D2
126

127
4. Discussion
Type I IFNs are a critical component of the innate immune response during viral
infections. The function of many downstream genes has been studied in-depth, however,
it is likely that the presence of the virus and subsequent TLR-mediated signaling are
required to deploy full IRG-mediated antiviral activity24
. In this study we investigated the
gene signatures induced following subcutaneous administration of IFN-2b in ferrets.
We also analyzed the signaling pathways during an infection with SARS-CoV, and by
means of comparative analysis we profiled IFN gene responses in the context of a
respiratory infection. We used an experimental model of infection with SARS-CoV in
ferrets, which causes mild symptoms without mortality. The pathological features of this
model were previously published19
and a summary of the clinical information can be
found in Table 3-5.
We assessed the capacity of subcutaneous administration of IFN-2b to activate
antiviral responses in ferrets. The activation levels of several intracellular signaling
proteins were studied by using phospho-specific antibodies and subsequent FACS
analysis. STAT1 plays a key role downstream of IFN signaling while STAT3 and STAT5
are thought to be involved at a lesser extent, and/or weak participation of STAT4,
mitogen activated protein kinase 38 (p38) and Extracellular Signal-Regulated Kinase
(ERK)25
. In vitro incubation of ferret PBMCs with IFN-2b led to strong
phosphorylation of STAT1, weak phosphorylation of STAT3 and STAT5 and no
phosphorylation of STAT4, p38 and ERK. Furthermore, the activation of the STAT1
signaling pathway in vitro was confirmed at the mRNA level with the presence of many

128
Table 3-5. Natural history of ferrets, infected with 103
TCID of SARS-CoV (adapted
from Chu et al, Virology, Vol. 374, 2008).
SARS-CoV-infected Mock controls
Total number of ferrets 42 18
Peak temperature day 2 (38oC) day 2 (36.9oC)
Sneezing 17/42 0/18
Diarrhea 5/42 1/18
Mortality 0/42 0/18
Lowest WBC count 4.0 x 10³ /l (day 2) 8.0 x 10³ /l (day 2)
Lowest lymphocyte count 1.8 x 10³ /l (day 2) 5.0 x 10³ /l (day 2)
Peak viral titer in nasal wash day 2
Peak viral titer in lung day 5

129
downstream IRGs, including MX1, OAS1, OAS2, ISG15, and IFI44. The in vivo effects
of IFN-2b were also investigated. STAT1 showed increased phosphorylation levels in
the peripheral blood at early hours post-injection, while STAT3 and STAT5 remained
unchanged. Moreover, we did not observe mRNA gene expression of interleukin 8 (IL-8)
and Suppressor of Cytokine Signaling 3 (SOCS3) at the mRNA level, suggesting that
STAT326
and STAT527
, respectively, do not participate in vivo in response to IFN-2b.
The global numbers of regulated genes found in the microarray results constitute
good estimators of the intensity of the host response at different time-points. In vivo
effects of IFN-2b can be observed 24 hours after the injection and their peak is reached
48 hours post-injection. IRGs are markedly increased in both blood and lung tissue,
however the responses in the blood show greater breadth and magnitude as compared
with the responses observed in lung tissue (Table 3-3). This suggests that the
administration protocol of IFN-2b used in this study is only capable of inducing a
limited activation in lung tissue. Therefore, alternative protocols including direct
administration of IFN-2b into the respiratory tract or subcutaneous administration at
higher doses should be explored in order to achieve stronger antiviral responses at the
infection sites. Gene expression during SARS-CoV infection, on the other hand, shows
the presence of strong antiviral and inflammatory responses in the lungs 24 hours post-
infection, fading on day 2 post-infection in both blood and lung tissue.
As expected, IFN-2b stimulates the increased expression of a variety of IRGs
that play a central role in the clearance of viral infections, including MX1, OAS1, OAS2
and ISG15. They exert their effects through different mechanisms of action, such as
direct targeting of viral entry, inhibition of protein synthesis or degradation of viral RNA.

130
MX1 is a dynamin-like large guanosine triphosphatase (GTPase), which has antiviral
activity against a wide range of RNA viruses. The antiviral activity of MX1 is effective at
the early stages of the viral cycle in the nucleus or cytoplasm22
. OAS is an adenylate
synthetase, which uses adenosine triphosphate to synthesize 2’,5’-oligoadenylates. The
latter activates latent RNase L that is involved in the degradation of viral RNA28
. ISG15
is an ubiquitin-like enzyme that covalently conjugates to a large number of cellular
proteins; however this does not usually lead to protein degradation. In the case of HIV-1,
ISG15 inhibits the release of virions29
.
Upregulation of similar sets of IRGs by SARS-CoV and IFN-2b were observed,
including 7 IRGs (STAT1, ISG15, MX1, OAS1, OAS2, IFI44 and IFI44L) in the
peripheral blood and lung tissue of both groups. In contrast, several IRGs, including
IFI35, IFIT1 and PSMB8, were only upregulated in the lungs during SARS-CoV
infection. These results suggest that the expression of certain IRGs lie beyond the direct
control of IFN-α2b, and additional signals such as activation of TLR-signaling by viral
components are probably required to assemble a fully functional antiviral response.
Although the induction of IRGs by IFN-α2b is the hallmark feature of IFN
responses, a full understanding of the biological effects of antiviral IFNs requires a
comprehensive study of the additional functional responses triggered by IFN-α2b. In the
blood of ferrets injected with IFN-α2b, the upregulation of genes that participate in
glycolysis-gluconeogenesis (e.g. acyl-CoA synthetases and lactate dehydrogenases)
(Table 3-4) are indicators of higher levels of metabolic activity. Moreover, IFN also
induces the expression of genes related with apoptosis (e.g. caspases and TNFSF10) and
cell cycle (e.g. cyclins and SMAD family members). It is unclear whether IFN-α2b alone

131
is capable of inducing apoptosis and/or cell replication in vivo, however, the upregulation
of these genes may indicate that PBMCs are now more responsive to signals capable of
triggering cell cycle events. Upregulation of chemokine receptors, such as CCR3, CCR7,
CCR9 and CXCR4 may indicate that IFN-α2b can increase the responsiveness of PBMCs
to locally-produced chemokines. Likewise, increased levels of genes that are involved in
leukocyte transendothelial migration and Fc-gamma receptor-mediated phagocytosis
(Table 3-4) suggest that IFN-α2b enhances leukocyte responses30
. Interestingly, a number
of genes that are part to the Wnt signaling pathway were found to be upregulated (Table
3-4). This indicates that in vivo administration of IFN-α2b also has effects over
lymphocyte maturation and differentiation31
.
The lungs of ferrets infected with SARS-CoV show the upregulation of a broader
variety of genes, as compared with IFN-α2b administration, and depicts a more complex
biological environment dominated by the antiviral responses, leukocyte infiltration and
other inflammatory responses (Figure 3-7B). A number of chemokine ligands, such as
chemokine C-C motif ligand 2 (CCL2), CCL4, CCL14, CCL19 and CCL25, and cell
adhesion molecules, such as activated leukocyte cell adhesion molecule (ALCAM) and
intercellular adhesion molecule 1 (ICAM1) are upregulated during SARS-CoV infection,
but these were not induced by the administration of IFN-α2b (Figure 3-7A and Table 3-
4). SARS-CoV also induced the upregulation of genes of the complement system such as
complement component 3 (C3) and complement factor B (CFB) (Figure 3-7B). Taken
together, these results depict how IRGs and other arms of the innate immune responses
are capable of resolving the respiratory infection caused by SARS-CoV infection.

132
Previously, gene regulation has been investigated using microarray analysis with
the intent on revealing molecular pathways imperative to H1N1 infection32
. Here we
investigated gene regulation of SARS-CoV infected and IFN-2b injected ferrets.
Microarray analysis was conducted on RNA from lungs and blood on day 1 and day 2.
The number of upregulated genes was quantified and compared to the number of
downregulated genes for each sample type. The number of downregulated genes was
greater than upregulated genes in the day 1 IFN-2b lungs and in the day 2 SARS-CoV
infected blood samples. To expose the molecular signature of this finding we then broke
down the genes from each group into their respective functional pathways: cellular
process, metabolic process, intracellular signaling cascade, cell cycle, and immune
response. Interestingly, we found that for every functional pathway the day 1 IFN-2b
injected lungs had more downregulated genes than upregulated genes (except the
Immune response) where blood samples from the same animals had the opposite trend of
more upregulated genes. Furthermore, the SARS-CoV infected animals had the opposite
trend where day 1 lungs had more upregulated genes and in the blood of day 2 there were
more downregulated genes. These findings may be indicative of the activity of the
stimulant IFN-2b compared to SARS-CoV. Moreover, the difference in the number of
genes regulated shows that IFN-2b and SARS-CoV have different spatial stimulation
which may be an important finding when determining the therapeutic efficacy of IFN-
2b. It is possible that the increase in gene expression in the blood samples following
IFN-2b injection is indicative of activation of systemic immunity where the SARS-CoV
infection had an increase of lung gene expression signifying possible local inflammation.
133
Type I IFNs play a critical role during antiviral responses, however their functions
in vivo have not yet been fully resolved. Additional research is required to define the
optimal IRGs profile that is present during successfully cleared viral infections.
Moreover, fine tuning of the IRGs responses may achieve more prolonged and wider
protection by therapeutic agents such as attenuated vaccines against respiratory viruses.

134
Reference List
1. Kolling,U.K. et al. Leucocyte response and anti-inflammatory cytokines in
community acquired pneumonia. Thorax 56, 121-125 (2001).
2. Thompson,W.W. et al. Mortality associated with influenza and respiratory syncytial
virus in the United States. JAMA 289, 179-186 (2003).
3. Dawood,F.S. et al. Emergence of a novel swine-origin influenza A (H1N1) virus in
humans. N. Engl. J. Med. 360, 2605-2615 (2009).
4. Dushoff,J., Plotkin,J.B., Viboud,C., Earn,D.J. & Simonsen,L. Mortality due to
influenza in the United States--an annualized regression approach using multiple-
cause mortality data. Am. J. Epidemiol. 163, 181-187 (2006).
5. Weiss,R.A. & McMichael,A.J. Social and environmental risk factors in the
emergence of infectious diseases. Nat. Med. 10, S70-S76 (2004).
6. HULL,R.B. & LOOSLI,C.G. Adrenocorticotrophic hormone (ACTH) in the
treatment of experimental air-borne influenza virus type A infection in the ferret. J.
Lab Clin. Med. 37, 603-614 (1951).
7. Martina,B.E. et al. Virology: SARS virus infection of cats and ferrets. Nature 425,
915 (2003).
8. Cameron,C.M. et al. Gene expression analysis of host innate immune responses
during Lethal H5N1 infection in ferrets. J. Virol. 82, 11308-11317 (2008).
9. Danesh,A. et al. Cloning, expression and characterization of ferret CXCL10. Mol.
Immunol. 45, 1288-1297 (2008).
10. Ochi,A. et al. Cloning, expression and immunoassay detection of ferret IFN-
gamma. Dev. Comp Immunol. 32, 890-897 (2008).
11. Marijanovic,Z., Ragimbeau,J., van der,H.J., Uze,G. & Pellegrini,S. Comparable
potency of IFNalpha2 and IFNbeta on immediate JAK/STAT activation but
differential down-regulation of IFNAR2. Biochem. J. 407, 141-151 (2007).
12. Takaoka,A. & Yanai,H. Interferon signalling network in innate defence. Cell
Microbiol. 8, 907-922 (2006).
13. Uddin,S. & Platanias,L.C. Mechanisms of type-I interferon signal transduction. J.
Biochem. Mol. Biol. 37, 635-641 (2004).

135
14. Chevaliez,S. & Pawlotsky,J.M. Interferon-based therapy of hepatitis C. Adv. Drug
Deliv. Rev. 59, 1222-1241 (2007).
15. Cameron,M.J. et al. Interferon-mediated immunopathological events are associated
with atypical innate and adaptive immune responses in patients with severe acute
respiratory syndrome. J. Virol. 81, 8692-8706 (2007).
16. Chelbi-Alix,M.K. & Wietzerbin,J. Interferon, a growing cytokine family: 50 years
of interferon research. Biochimie 89, 713-718 (2007).
17. Haagmans,B.L. et al. Pegylated interferon-alpha protects type 1 pneumocytes
against SARS coronavirus infection in macaques. Nat. Med. 10, 290-293 (2004).
18. Loutfy,M.R. et al. Interferon alfacon-1 plus corticosteroids in severe acute
respiratory syndrome: a preliminary study. JAMA 290, 3222-3228 (2003).
19. Chu,Y.K. et al. The SARS-CoV ferret model in an infection-challenge study.
Virology 374, 151-163 (2008).
20. Rowe,T. et al. Modeling host responses in ferrets during A/California/07/2009
influenza infection. Virology 401, 257-265 (2010).
21. Storey,J.D., Xiao,W., Leek,J.T., Tompkins,R.G. & Davis,R.W. Significance
analysis of time course microarray experiments. Proc. Natl. Acad. Sci. U. S. A 102,
12837-12842 (2005).
22. Haller,O., Staeheli,P. & Kochs,G. Interferon-induced Mx proteins in antiviral host
defense. Biochimie 89, 812-818 (2007).
23. Fang,Y. et al. Molecular characterization of in vivo adjuvant activity in ferrets
vaccinated against influenza virus. J. Virol. 84, 8369-8388 (2010).
24. Bosinger,S.E. et al. Global genomic analysis reveals rapid control of a robust innate
response in SIV-infected sooty mangabeys. J. Clin. Invest 119, 3556-3572 (2009).
25. Li,H., Gade,P., Xiao,W. & Kalvakolanu,D.V. The interferon signaling network and
transcription factor C/EBP-beta. Cell Mol. Immunol. 4, 407-418 (2007).
26. Gharavi,N.M. et al. Role of the Jak/STAT pathway in the regulation of interleukin-
8 transcription by oxidized phospholipids in vitro and in atherosclerosis in vivo. J.
Biol. Chem. 282, 31460-31468 (2007).
27. Barclay,J.L., Anderson,S.T., Waters,M.J. & Curlewis,J.D. Regulation of suppressor
of cytokine signaling 3 (SOC3) by growth hormone in pro-B cells. Mol. Endocrinol.
21, 2503-2515 (2007).
136
28. Bonnevie-Nielsen,V. et al. Variation in antiviral 2',5'-oligoadenylate synthetase
(2'5'AS) enzyme activity is controlled by a single-nucleotide polymorphism at a
splice-acceptor site in the OAS1 gene. Am. J. Hum. Genet. 76, 623-633 (2005).
29. Okumura,A., Lu,G., Pitha-Rowe,I. & Pitha,P.M. Innate antiviral response targets
HIV-1 release by the induction of ubiquitin-like protein ISG15. Proc. Natl. Acad.
Sci. U. S. A 103, 1440-1445 (2006).
30. Corssmit,E.P. et al. Effects of interferon-alpha (IFN-alpha) administration on
leucocytes in healthy humans. Clin. Exp. Immunol. 107, 359-363 (1997).
31. Staal,F.J., Luis,T.C. & Tiemessen,M.M. WNT signalling in the immune system:
WNT is spreading its wings. Nat. Rev. Immunol. 8, 581-593 (2008).
32. Shapira,S.D. et al. A physical and regulatory map of host-influenza interactions
reveals pathways in H1N1 infection. Cell 139, 1255-1267 (2009).

137
Chapter 4
Cloning, expression and characterization of ferret CD8 (A version of this chapter is submitted to journal of “Veterinary Immunology and
Immunopathology”, as Cloning and characterization of ferret CD8 and
development of a ferret CD8 hybridoma clone, Danesh et al.)
1. Introduction
Ferrets (Mustela putorius furo) are considered to be the preferred animal model
for studying viral respiratory diseases such as influenza and SARS1-3
. The ferret model
has been used in influenza research for several years and mimics the human season of
influenza4,5
. As a result, ferrets have been used for testing for the safety and efficacy of
live attenuated influenza vaccines. Currently, anti-sera hemagglutinin assays in ferrets are
used to measure antigenic distance in evaluation of new influenza vaccines6.
Specific immune responses have a significant impact on outcomes of infectious
respiratory diseases7,8
. Despite the prominent use of ferrets in medical research, the
immune system of these animals remains poorly characterized9. Recently we reported the
characterization of the ferret chemokines, CXCL9, CXCL10 and CXCL11, which are
important in migration of mononuclear cells to sites of infection10
. In order to evaluate
the immune response during the course of a viral infection, it is important to be able to
determine the activity of the immune cells, such as T cells11
. T lymphocytes are essential
components of immune responses that have yet to be characterized in the ferret
model12,13
. The lack of ferret specific antibodies capable of detecting T lymphocyte
surface molecules has hindered the evaluation of specific subsets of T cells, either in vivo
or in vitro, in ferret infectious disease models.
CD8 is a cell surface molecule that is used to distinguish cytotoxic T
lymphocytes14
. The CD8 molecule is expressed either as a heterodimer of and chains,

138
or as a homodimer of the chain15
. CD8+ cells comprise a subset of cell-mediated
immunity, cytotoxic T cells, that are essential in the eradication of virally infected cells or
tumors7,16
. CD8 is a co-stimulatory molecule for the T cell receptor and is necessary for
the recognition of the MHC I-peptide complex on antigen presenting cells15,17
. The
infiltration of CD8 positive cells to the site of infection has been demonstrated in several
studies18-22
.
In this study, we report for the first time the cloning of full-length ferret
CD8cDNA coding sequence. We expressed and characterized recombinant ferret
CD8 protein using polyclonal antibodies. We employed the expressed recombinant
protein to screen hybridoma supernatants derived from mice immunized with intact ferret
peripheral blood mononuclear cells (PBMCs). From these screenings, we identified a
parental hybridoma cell line whose secreted antibody specifically reacts with over-
expressed ferret CD8. We characterized this hybridoma cell line with both
immunoblotting and flow cytometry with recombinant CD8. The development of a
monoclonal antibody that recognizes ferret CD8 provides an important reagent for the
study of cytotoxic T cells in ferret models of viral infection.

139
2. Materials and methods
2.1 Antibodies
Monoclonal anti-V5 and polyclonal anti-HIS antibodies were obtained from
Invitrogen (Mississauga, Canada). Polyclonal anti-human CD8 (H-160), FITC-
conjugated goat anti-rabbit IgG antibody, PE-conjugated donkey anti-mouse IgG, and
HRP-conjugated goat anti-mouse HRP, were purchased from Santa Cruz Biotechnology
(Santa Cruz, California).
2.2 Animals
Ferrets (Mustela putorius furo) were obtained from Triple F farms (Sayre,
Pennsylvania), and housed at the Toronto General Research Institute animal facility as
described previously10
. Animals were used in accordance to an animal use protocol for
non-infectious experimentation, which was approved by Animal Care Committee of the
University Health Network.
2.3 Total RNA purification and cDNA synthesis
Ferret whole blood was diluted 1:1 in RPMI (Invitrogen) and cultured at 37oC in
5% CO2 after stimulation with 1 g/mL LPS, 50 ng/mL PMA and 0.1 mM ionomycin, or
25 g/mL poly I:C. Cultures were harvested and collected in Paxgene RNA tubes and
total RNA extraction was performed (Qiagen, Mississauga, Canada). Total RNA was
transcribed to cDNA using Superscript II reverse transcriptase (Invitrogen).

140
2.4 Amplification, cloning and sequencing of ferret CD8
Degenerate primers were designed according to multiple nucleotide sequence
alignment of known CD8 sequences using ClustalW from European Bioinformatics
Institute (EBI). The primers were 5’-GGCCGAAGGGCGCAACTT-3’ (forward) and 5’-
GCCACACAGGATCCATCTCCA-3’ (reverse). A cDNA fragment of 729 base pairs
was amplified by standard PCR using these primers. The amplified cDNA fragment was
excised from an agarose gel and purified (Qiagen). The purified fragment was subcloned
into pCR 2.1 TOPO vector (Invitrogen). Plasmid DNA was isolated from positive clones
and sequenced using an ABI 3730XL DNA analyzer (Center for Applied Genomics,
Toronto, Ontario). The ferret CD8 cloning sequence was identified by a Basic Local
Alignment Search Tool (BLAST) search of the NCBI databases.
2.5 Generation of ferret CD8expression vector
PCR-based subcloning was used to generate an expression vector for ferret
CD8. The primers used to amplify ferret cDNA were 5’-GCCATGGCCTCTCGGGT
GACCCCCC-3’ (forward) and 5’-GACATATTTCTCTGAAGGGCT-3’ (reverse). These
primers engineered at 5’ Kozak sequence and the 3’ termination codon removed. The
cDNA was subcloned into the pcDNA-3.1/His6/V5-TOPO expression vector (Invitrogen),
which produces a fusion protein tagged at the C-terminus with His6 and V5 epitopes
when transfected into mammalian cell lines.
2.6 Cell culture, plasmid transfection, and protein purification
141
COS-7 cells were maintained in Dulbecco’s modified eagle’s medium (DMEM),
substituted with 10% fetal bovine serum (Invitrogen) at 37ºC, 5% CO2. COS-7 cells
were transiently transfected with Effectene (Qiagen). After 48 hours, the cells were
harvested and lysed in 1% NP40 buffer. Aliquots of the lysates were prepared for
western blots by boiling in Laemmli buffer. The soluble portion of the cell lysates was
run through Ni-NTA metal immobilized affinity column and bound protein was washed
and eluted into several fractions (Novogen, San Diego, California). Fractions from
washes and elutions were evaluated by western blot with anti-V5. Positive fractions were
pooled and dialyzed into PBS at 4ºC.
2.7 Western Blot analysis
SDS-Polyacrylamide gel electrophoresis (SDS-PAGE) was performed with pre-
cast gels (10-15%, Bio-Rad), and transferred to nitrocellulose membranes. The
membranes were blocked with 5% milk in phosphate buffered saline-Tween 0.02%
(TPBS) followed by 16 hours incubation with primary antibodies at the appropriate
dilutions. The blots were washed with TPBS and incubated with a goat-anti-mouse-HRP
secondary antibody. Following the final wash, bands were visualized using enhanced
chemiluminiscent (ECL) reagent (GE healthcare, UK). In some instances, ferret CD8
was immunoprecipitated with anti-His antibody (Invitrogen) or polyclonal anti-human
CD8 prior to western blot analysis.

142
2.8 Gene accession numbers
Complete coding sequence of ferret CD8 was submitted to the GeneBank and an
accession number was obtained (EF492056). Accession numbers used for the multiple
sequence alignment and phylogenetic tree are: P01731 (mouse), P33706 (dog), P41688
(cat), P07725 (rat), P30433 (orangutan), AAH25715 (human), AAI51260 (cow) and
AAT52341 (pig).
2.9 Isolation of Peripheral Blood Mononuclear cells (PBMC)
Ferret PBMCs were isolated by centrifugation through Histopaque solution
(Sigma Chemicals). Briefly, 5 mL whole blood was diluted 1:1 with PBS, layered on 5
ml Histopaque solution and centrifuged at 400 g for 20 minutes. The enriched
mononuclear cell layer at the Histopaque-plasma interface was harvested, washed twice
and re-suspended in PBS.
2.10 Cell surface staining of ferret PBMCs
Ferret blood was collected in EDTA tubes and PBMCs were isolated as described
above. 1 x 10⁶
cells/100 L PBS was incubated with 0.2 g primary antibody for 20
minutes at room temperature. Cells were washed and re-suspended in 100 L PBS. 0.2
g secondary antibody was added to each tube and incubated for 20 minutes while
protected from light. Cells were washed with PBS and fixed with 2% paraformaldehyde
in PBS. 10000 events were acquired using a FACS Calibure flow cytometer and Cell
Quest software (Becton Dickinson). The acquired data was analyzed using Flow Jo 7.2
software (Tree Star, Inc.).

143
2.11 Immunofluorescent staining of ferret CD8-transfected COS-7 cells with
rabbit polyclonal antibody
COS-7 cells were transiently transfected with the ferret CD8 expression vector.
Transfected cells were fixed with 4% formaldehyde in PBS and permeablized with
Triton-X100 (0.3%). Primary antibody solutions, diluted in 5% FCS in PBS, were added
to tubes and incubated at 37oC for 1 hour (anti-V5 antibody and polyclonal anti-human
antibody at a concentration of 0.02 g/l). Appropriate secondary antibodies (anti-mouse
IgG-PE or anti-rabbit IgG-FITC) were added to tubes at a concentration of 0.02 g/l
and incubated for 1 hour at 37oC, while protected from light. The cells were washed and
the coverslips were mounted onto slides with Gold antifade with DAPI (Invitrogen).
Images were captured from prepared slides using an LSM 510 META NLO microscope
(Zeiss).
2.12 Generation of monoclonal ferret CD8 supernatant
Mouse immunizations and hybridoma production were performed by Promab
Technologies Inc. Balb/c mice were immunized by three separate injections of ferret
PBMCs. Animals were sacrificed and splenocytes were harvested for fusion with the
Sp2/0 mouse myeloma cells. Single cell lines of hybridomas were cultured and cell
culture media from growing cells were used for screening by cell-based ELISA. Briefly,
96-well plates were coated with 200,000 ferret PBMCs/well. Plates were blocked with
5% BSA in PBS. 100 l hybridoma media was added to each well and plates were
incubated for 1 hour at room temperature. Plates were washed five times with PBS. 10 l
HRP-labeled anti-mouse IgG (0.02 g/l) was added to each well and incubated at room

144
temperature for 1 hour. Following three washes with PBS, tetramethylbenzidine (TMB)
was added to each well. Positive wells were visualized by color change and positive
clones were further grown and expanded. Later, supernatants from hybridoma cells, that
tested positive in ELISA assays, were screened with ferret CD8-transfected COS-7
cells, using western blots and flow cytometry.

145
3. Results
3.1 Cloning and sequence analysis of ferret CD8
Cloning of full-length ferret CD8 coding sequence was performed using ferret
cDNA derived from mitogen-stimulated PBMCs as described in the methods section.
Primers used for cloning were designed from inter-species consensus sequences after
multiple nucleotide sequence alignment of various species (Figure 4-1). The predicted
full-length amino acid sequence of ferret CD8 (242 amino acids) is homologous to
CD8 sequences of other species (Figure 4-1B, Table 4-1), with highest amino acid
identity to dog (78%) and cat (77%). Phylogenic analysis of amino acid sequences
confirms that ferret CD8 protein is most closely related to dog CD8(Figure 4-2).
3.2 Expression of recombinant ferret CD8
A C-terminal His6/V5-tagged expression construct was generated to produce
recombinant ferret CD8 protein by transfection in mammalian cells. COS-7 cells were
transiently transfected with the ferret CD8 expression construct and whole lysates were
subjected to western blot analysis using the anti-V5 antibody. A band was detected at the
expected molecular weight (38 kDa) in protein derived from CD8-transfected COS-7
cells, while no band was detected in the untransfected control lane (Figure 4-3A).
Affinity purified recombinant ferret CD8 also migrated to 38 kDa when subjected to
western blot analysis using anti-V5 antibody (Figure 4-3B).

146
Figure 4-1. Multiple alignment of the predicted full-length ferret CD8 amino acid
sequence with CD8 sequences from other species Clustal-X software. The predicted
amino acid sequence of ferret CD8 was aligned with CD8 protein sequences from
other mammalian species using Clustal-X software. The numbers to the right of the
sequences represent amino acid positions. Putative signal peptide, extracellular,
transmembrane, and cytoplasmic domains are indicated. Available sequences for CD8
used in the alignments were mouse (Mus musculus) (P01731), dog (Canis lupus
familiaris) (P33706), cat (Felis catus) (P41688), rat (Rattus norvegicus) (P07725), human
(Homo sapiens) (AAH25715), cow (Bos taurus) (AAI51260) and pig (Sus scrofa)
(AAT52341).

147
Signal peptide Extracellular domain
Transmembrane domain Cytoplasmic domain

148
Table 4-1. The percentage amino acid identity between the ferret CD8α amino acid
sequence and CD8α protein sequences from other mammals.
Species Percent Identity with Ferret (%)
Human 66
Dog 78
Cat 77
Cow 61
Pig 59
Mouse 45
Rat 50

149
Figure 4-2. Phylogenetic tree representing homology between ferret and other
known mammalian CD8 sequences. A phylogenetic tree was constructed using
CLUSTAL W and MEGA 3.1 packages and bootstrapped 100 times. Bootstrapping
confidence values are between 66 and 100. The numbers on the nodes of the dendrogram
represent bootstrap values. The full-length ferret nucleotide sequence was translated to
amino acid sequence using “Translate” (ExPASy, proteomics). The sequences used for
phylogenetic analysis were mouse (Mus musculus) (P01731), dog (Canis lupus
familiaris) (P33706), cat (Felis catus) (P41688), rat (Rattus norvegicus) (P07725), human
(Homo sapiens) (AAH25715), cow (Bos Taurus) (AAI51260), and orangutan (Pongo
pygmaeus) (P30433).

150

151
Figure 4-3. COS-7 transfected cells express ferret CD8 recombinant protein. COS-7
cells were either untransfected or transfected with pcDNA-3.1/His6/V5-TOPO expression
vector using Effectene. A) Western blot performed on lysate of COS-7 cells transfected
with ferret CD8, using anti-V5. B) Western blot performed on purified ferret CD8
recombinant protein, using anti-V5.

152
49
38
28
14
kDa
Anti-V5
62
A)
Anti-V5
B)
64
50
36
22
kDa CD8 a
Transfected COS-7
cell lysatesPurified Protein

153
3.3 Anti-human CD8 polyclonal antibody reacts with ferret PBMCs and with CD8
transfected COS-7 cells
Ferret PBMCs were stained with a commercially available polyclonal anti-human
CD8 antibody (H-160). Using flow cytometry, 32% of PBMCs were observed to cross-
react with this antibody (Figure 4-4A). The polyclonal antibody also detected a protein
band with a molecular weight corresponding closely with that of endogenous CD8 in
lysates derived from ferret splenocytes (Figure 4-4B). No protein band was detected in
lysates from the ferret brain-derived cell line, Mpf, which does not express CD8 (Figure
4-4B). H-160 was also tested for cross-reactivity with the expressed recombinant ferret
CD8. Lysates were prepared from transfected COS-7 cells and immunoprecipitated with
anti-His or with H-160. The immunoprecipitates were subjected to western blot analysis
with anti-His or H-160, and a 38 kDa band was detected consistently (Figure 4-3C). To
confirm the cross-reactivity of H-160 antibody with recombinant CD8 protein, we
performed immunofluorescence staining. COS-7 cells transfected with ferret CD8 were
co-stained with H-160 and anti-V5 antibody. Fluorescence microscopy revealed that the
H-160 signal (green) overlapped with the anti-V5 signal (red). Surprisingly, we observed
that the transiently expressed ferret CD8 protein was accumulated in the cytoplasm and
very little expression was seen on the cell surface. We further tested for CD8
expression on the cell surface by flow cytometry. Indeed, transfected cells labeled with
H-160 were reactive in flow cytometry as compared to untransfected cells (Figure 4-4E).
These results suggest that the recombinant protein shares antigenicity with human CD8.
Furthermore, although transfected cells exhibit predominantly cytoplasmic expression of
recombinant CD8, they do express some ferret CD8 protein on the cell surface. However,

154
Figure 4-4. Reactivity of ferret PBMCs and CD8-transfected COS-7 cells with a
polyclonal anti-human CD8α antibody. A) Ferret PBMCs were stained with a
polyclonal anti-human CD8 antibody and subjected to flow cytometry analysis. Results
were compared to an isotype (secondary antibody alone) control. B) Western blot
analysis of ferret splenocytes with rabbit anti-human antibody. Protein from lysates
derived from a ferret brain cell line (Mpf) was used as a negative control. C) Ferret CD8a
transfected COS-7 cells lysates was immunoprecipitated either with anti-His or with anti-
human CD8 antibody and western blots were probed with anti-His and or anti-human-
CD8 antibodies. D) Immunostaining of ferret CD8-transfected COS-7 cells with rabbit
polyclonal anti-human CD8 and the epitope tag antibody (anti-V5) on separate
channels. The cells were stained with the nuclear stain DAPI and results were compared
to untransfected COS-7 cells. E) Ferret CD8-transfected COS-7 cells were stained with
polyclonal anti-human CD8 subjected to flow cytometry. Results were compared to
untransfected COS-7 cells.

155
Secondary antibody aloneAnti-human CD8
(H-160)
A)
kDa
38
Anti-human CD8
(H-160)
28
49
B) C)
kDa
49
38
28
17
WB: Anti-His-tag
A B C A B C
A: COS-7 cell lysate,
B and C: His-tagged ferret CD8
transfected COS-7 extracts
HH
L L
IP:
Anti-human
CD8 (H-160)
Scattered plot

156
D)
Untransfected COS-7 cells and
polyclonal anti-human CD8 (H-160)
CD8α transfected COS-7 cells and
polyclonal anti-human CD8 (H-160)
E)
COS-7 cells transfected with ferret CD8
anti-human CD8
(H-160) Anti-V5
DAPI Merge

157
polyclonal antibodies are not appropriate for quantitative flow cytometric analysis of T
lymphocytes. We tested a panel of commercially available antibodies (clones SK1, SK2,
G42-8, RPA-T8, OX-8 and 341), however, none exhibited cross-reactivity with ferret
PBMCs.
3.4 Generation of mouse anti-ferret CD8 monoclonal supernatant
In parallel to the cloning and sequencing of ferret CD8, we began
immunizations of mice with ferret PBMCs to generate hybridoma clones expressing
antibodies that recognize cell surface markers. Following ELISA-based screening of
over 1000 clones, we tested the ELISA-positive hybridoma supernatants in flow
cytometry staining of ferret PBMCs. We identified several parental clones that exhibited
a positive profile in flow cytometry analysis of PBMCs, including a clone designated
8F9. Ferret CD8-transfected COS-7 cells and untransfected cells were stained with 8F9
antibody and subjected to flow cytometry. The results demonstrated that 8F9 was
reactive with transfected cells as compared to untransfected cells (Figure 4-5A). Using
western blots analysis on lysates from CD8transfected COS-7 cells, we detected a
band at 38 kDa with 8F9, which aligned with an identical western blot performed in
parallel with anti-V5 (Figure 4-5B). 8F9 did not detect a band in lysates from
untransfected cells (Figure 4-5B).

158
Figure 4-5. Flow cytometry staining and western blot analysis of cell culture media
from a hybridoma cell line and ferret CD8-transfected COS-7 cells. A) COS-7 cells,
transiently transfected with ferret CD8, were stained with hybridoma supernatant (8F9)
and subjected to flow cytometric analysis. Results were compared to an isotype
(secondary antibody alone) control. B) Protein derived from ferret CD8-transfected
COS-7 cell lysates was subjected to western blots using the hybridoma supernatant from
clone 8F9. Identical blots were probed with anti-V5. Protein derived from untransfected
COS-7 cells was used as a negative control.

159
Secondary antibody alone
A)
B)
8F9
A: Transfected COS-7 cells probed with 8F9 parental clone
B: untransfected COS-7 cells probed with 8F9 parental clone
C: Transfected COS-7 cells probed with anti-V5
38 kDa
A B C
38 kDa
Scattered plot

160
4. Discussion
We previously reported the importance of characterization of the ferret as an
animal model to study respiratory infectious diseases, and subsequently characterized a
subfamily of ferret chemokines10
. Others have used ferret as an animal model for
influenza and SARS-CoV infection and have emphasized specific advantages that the
ferret has over other existing animal models, including mice and monkeys1-3
. A major
disadvantage for the use of ferrets in influenza and SARS research is the general lack of
immunological reagents, such as antibodies that can distinguish subsets of T
lymphocytes. To address this problem, we have cloned and sequenced the ferret CD8
gene. The predicted amino acid sequence of ferret CD8 contains 242 amino acids and
includes a highly conserved putative signal peptide of 21 amino acids. We observed
lower homology in the extracellular domain between ferret orthologues, which may
explain the inability of commercially available CD8 monoclonal antibodies to recognize
ferret CD8.
To express recombinant ferret CD8, we used plasmid transfections in COS-7
cells, which are a cell line derived from the kidney of African green monkey that does not
express CD8. We assayed and detected ferret recombinant CD8using western blot
analysis of transfected CD8-COS-7 cell lysates with anti-V5. The molecular weight of
the recombinant protein correlated with both the predicted molecular weight of ferret
CD8, and what had been reported previously for other species23
. Next, we tested
commercially available polyclonal antibodies to validate the recombinant protein. A
polyclonal anti-human CD8 antibody, which we found to be reactive with ferret PBMCs,
cross-reacted in flow cytometry, western, and immunofluorescence analysis with COS-7

161
cells over-expressing ferret CD8. These results confirmed that recombinant ferret CD8
shares antigenicity with other CD8 orthologues.
The expressed ferret CD8protein was used to screen ferret-specific cell surface
antibodies. To develop these monoclonal antibodies, we screened hybridoma
supernatants derived from mice immunized with intact ferret PBMCs using cell-based
ELISA, flow cytometry staining of ferret PBMCs, and western blots of recombinant
CD8over-expressed in COS-7 cells. Up to this point, we have identified a single
mouse IgG secreting clone, 8F9, which detects recombinant ferret CD8 protein in
western blot and flow cytometry.
It has been demonstrated that SARS- and H5N1- infected patients had post-
mortem lymphocyte infiltration to the lung, consisting mainly of CD8 positive cells24
.
Depletion of lymphocyte subsets from peripheral blood is under the influence of
chemokines and their migration to the lung have been suggested25-27
. The infiltration of
lymphocytes into the lung may lead to pathological consequences and, in some cases, to
the development of acute respiratory distress syndrome (ARDS)24
. Large-scale
production and purification of this monoclonal antibody will enable us to demonstrate the
presence or absence of cytotoxic T lymphocytes in lung infiltrates of experimentally
infected ferrets with SARS-CoV and H5N1 virus.
In summary, we have demonstrated for the first time the cloning, characterization,
and expression of ferret CD8. We used the recombinant protein to identify a
monoclonal hybridoma clone that recognizes ferret CD8 This study represents an
important step towards the development of reagents to characterize distinct T lymphocyte
populations in ferret models of infectious disease.

162
Reference List
1. Darnell,M.E. et al. Severe acute respiratory syndrome coronavirus infection in
vaccinated ferrets. J. Infect. Dis. 196, 1329-1338 (2007).
2. Martina,B.E. et al. Virology: SARS virus infection of cats and ferrets. Nature 425,
915 (2003).
3. Peltola,V.T., Boyd,K.L., McAuley,J.L., Rehg,J.E. & McCullers,J.A. Bacterial
sinusitis and otitis media following influenza virus infection in ferrets. Infect.
Immun. 74, 2562-2567 (2006).
4. Lambkin,R. et al. Strong local and systemic protective immunity induced in the
ferret model by an intranasal virosome-formulated influenza subunit vaccine.
Vaccine 22, 4390-4396 (2004).
5. Small,P.A., Jr., Waldman,R.H., Bruno,J.C. & Gifford,G.E. Influenza infection in
ferrets: role of serum antibody in protection and recovery. Infect. Immun. 13, 417-
424 (1976).
6. Gupta,V., Earl,D.J. & Deem,M.W. Quantifying influenza vaccine efficacy and
antigenic distance. Vaccine 24, 3881-3888 (2006).
7. Belz,G.T., Bedoui,S., Kupresanin,F., Carbone,F.R. & Heath,W.R. Minimal
activation of memory CD8(+) T cell by tissue-derived dendritic cells favors the
stimulation of naive CD8(+) T cells. Nat. Immunol. 8, 1060-1066 (2007).
8. Zheng,B. et al. Rectification of age-associated deficiency in cytotoxic T cell
response to influenza a virus by immunization with immune complexes. J.
Immunol. 179, 6153-6159 (2007).
9. Svitek,N. & von,M., V. Early cytokine mRNA expression profiles predict
Morbillivirus disease outcome in ferrets. Virology 362, 404-410 (2007).
10. Danesh,A. et al. Cloning, expression and characterization of ferret CXCL10. Mol.
Immunol. 45, 1288-1297 (2008).
11. Hauge,S., Madhun,A.S., Cox,R.J., Brokstad,K.A. & Haaheim,L.R. A comparison of
the humoral and cellular immune responses at different immunological sites after
split influenza virus vaccination of mice. Scand. J. Immunol. 65, 14-21 (2007).
12. Boon,A.C., de Mutsert,G., Fouchier,R.A., Osterhaus,A.D. & Rimmelzwaan,G.F.
Functional profile of human influenza virus-specific cytotoxic T lymphocyte
activity is influenced by interleukin-2 concentration and epitope specificity. Clin.
Exp. Immunol. 142, 45-52 (2005).
163
13. Hoji,A. & Rinaldo,C.R., Jr. Human CD8+ T cells specific for influenza A virus M1
display broad expression of maturation-associated phenotypic markers and
chemokine receptors. Immunology 115, 239-245 (2005).
14. Willemsen,R.A. et al. CD8 alpha coreceptor to improve TCR gene transfer to treat
melanoma: down-regulation of tumor-specific production of IL-4, IL-5, and IL-10.
J. Immunol. 177, 991-998 (2006).
15. Pinto,R.D., Nascimento,D.S., Vale,A. & Santos,N.M. Molecular cloning and
characterization of sea bass (Dicentrarchus labrax L.) CD8alpha. Vet. Immunol.
Immunopathol. 110, 169-177 (2006).
16. Vikman,S. et al. CD8(+) T cells against multiple tumor-associated antigens in
peripheral blood of midgut carcinoid patients. Cancer Immunol. Immunother.
(2007).
17. Somamoto,T., Yoshiura,Y., Nakanishi,T. & Ototake,M. Molecular cloning and
characterization of two types of CD8alpha from ginbuna crucian carp, Carassius
auratus langsdorfii. Dev. Comp Immunol. 29, 693-702 (2005).
18. Anglen,C.S., Truckenmiller,M.E., Schell,T.D. & Bonneau,R.H. The dual role of
CD8+ T lymphocytes in the development of stress-induced herpes simplex
encephalitis. J. Neuroimmunol. 140, 13-27 (2003).
19. Brown,T.J. et al. CD8 T lymphocytes and macrophages infiltrate coronary artery
aneurysms in acute Kawasaki disease. J. Infect. Dis. 184, 940-943 (2001).
20. Chen,H.C. et al. Lymphocyte activation and hepatic cellular infiltration in
immunocompetent mice infected by dengue virus. J. Med. Virol. 73, 419-431
(2004).
21. Foxwell,A.R., Kyd,J.M., Karupiah,G. & Cripps,A.W. CD8+ T cells have an
essential role in pulmonary clearance of nontypeable Haemophilus influenzae
following mucosal immunization. Infect. Immun. 69, 2636-2642 (2001).
22. Wang,Y., Lobigs,M., Lee,E. & Mullbacher,A. CD8+ T cells mediate recovery and
immunopathology in West Nile virus encephalitis. J. Virol. 77, 13323-13334
(2003).
23. Shaw,A.S. et al. Short related sequences in the cytoplasmic domains of CD4 and
CD8 mediate binding to the amino-terminal domain of the p56lck tyrosine protein
kinase. Mol. Cell Biol. 10, 1853-1862 (1990).
24. Ng,W.F., To,K.F., Lam,W.W., Ng,T.K. & Lee,K.C. The comparative pathology of
severe acute respiratory syndrome and avian influenza A subtype H5N1--a review.
Hum. Pathol. 37, 381-390 (2006).

164
25. Aggarwal,A., Agarwal,S. & Misra,R. Chemokine and chemokine receptor analysis
reveals elevated interferon-inducible protein-10 (IP)-10/CXCL10 levels and
increased number of CCR5+ and CXCR3+ CD4 T cells in synovial fluid of patients
with enthesitis-related arthritis (ERA). Clin. Exp. Immunol. 148, 515-519 (2007).
26. Cameron,M.J. et al. Interferon-mediated immunopathological events are associated
with atypical innate and adaptive immune responses in patients with severe acute
respiratory syndrome. J. Virol. 81, 8692-8706 (2007).
27. Hsieh,M.F. et al. Both CXCR3 and CXCL10/IFN-inducible protein 10 are required
for resistance to primary infection by dengue virus. J. Immunol. 177, 1855-1863
(2006).

165
General Discussion
SARS-CoV is an emerging infectious disease of the 21st century that claimed
more than 840 lives worldwide1. SARS is a severe respiratory disease in middle aged and
elderly humans and can be a potential threat that may cause outbreaks if it re-emerges in
future1-3
. The acute phase of SARS infection has been linked with the lack of a Th2
response and the existence of a Th1 response accompanied by increased proinflammatory
cytokines4,5
. While the role of Th1-mediated immune responses has been wildly studied
the role of innate immunity during the early stages of SARS is still not well understood.
Our human cytokine and gene expression data suggest that patients with poor outcome
show distinctive features in their innate immune responses6. Taken together, I believe that
interferon regulated genes (IRGs) play a key role during the early hours post-infection
with SARS-CoV and they might determine the degree of severity. This prompted the
investigation of the interferon responses in ferrets as are the preferred animal model of
SARS7. Ferrets have shown greater susceptibility to SARS-CoV compared to mice
8.
SARS-CoV replicates well in ferrets. SARS infection in ferrets mimics human symptoms
accompanied with histological evidence of pneumonitis and a percentage of mortality. In
addition, unlike mice, ferrets transmit the disease7,8
. The drawback to study the immune
system of ferrets was the lack of immunological reagents for this model9,10
. I started
building my new immune model of SARS infection in ferrets with the aim of transposing
our gene expression findings from human patients into a more controlled experimental
environment, and paying special attention to the interferon responses.

166
5.1 SARS correlation with CXCL10 in humans and ferrets:
The clinical presentation of SARS in humans had a diverse range from
asymptomatic infection in some cases to respiratory failure in others1-3,11
. In our studies,
IFN-was significantly increased in SARS patients with mild disease compared to the
patients who needed critical care6. Treatment of SARS patients with corticosteroids
delayed the lung injury in some patients and IFN-α therapy was reported to be effective
in SARS treatment12
; together, these findings point to the important role of the immune
response in the containment of SARS disease progress5,13,14
. We also found that IFN-
was increased in SARS patients with mild disease compared to patients who needed
critical care6.
I propose that an exaggerated immune response during the early stage of SARS
infection, featured by strong expression of some IRGs such as chemokines, may break
down the homeostasis of the immune system in those patients that were not able to clear
the virus at early stages of the infection. CXCL10 is one the IRGs that drew my attention
as an important player in SARS containment or spread. I have shown that the level of
CXCL10 was increased in mild SARS patients and ICU SARS patients compared to
healthy controls. ICU SARS patients had significantly higher levels of CXCL10
compared to the mild SARS patients, moreover, the highest levels of CXCL10 were
observed in those ICU patients who died. Some of the IRGs, such as CXCL10 and CCL2
are important regulators of cell migration to the site of infection and dysregulation of
these cheomokines may be associated to severity of the disease14,15
. Other investigators
have studied the level of proinflammatory and Th1/Th2 cytokines in SARS patients, and
although different profiles were defined, the levels of CXCL10 were consistently

167
upregulated in different groups of patients5,13,16,17
. Some investigators have suggested that
a “cytokine storm” is the main determinant of poor outcome in SARS patients5,13,15
. In
our previous gene expression study in SARS patients6
and also in this study, the levels of
proinflammatory and Th1/Th2 cytokines were examined. Patients with poor outcome did
not show an increased expression of proinflammatory cytokines and our data does not
support the “cytokine storm” hypothesis. Instead, a CXCL10 response seems to correlate
with the severity of the disease, which may enforce its effects by recruiting infiltrating
cells in the lung. Infiltration of cells to the lung under the influence of different
combinations of chemokines is an interesting field that could be addressed in future
studies in ferrets. Identification of the genes that display a strong correlation with SARS
pathology can be beneficial in different aspects. For example, modulation of CXCL10
activity might represent a novel therapeutic approach, either by direct neutralization of
CXCL10 or by blocking its receptor (CXCR3) and CXCL10 signalling. These
hypotheses can be tested further in a future ferret study. Moreover, strong upregulation of
CXCL10 but not other closely related chemokines, such as CXCL9 was a distinctive
feature of SARS that is not seen during influenza infection even though both diseases
may present some similar symptoms at onset. Therefore, CXCL10 can be considered as a
specific biomarker for early diagnosis of SARS. The comparison of SARS and influenza
infection in terms of disease course and CXCL10 expression pattern is an interesting
topic and needs to be the subject of further investigation.
CXCL10 is an important regulator of Th1 polarized immune responses18
and in
some instances, can promote inflammation and pathological events19-21
. However, the
role of this chemokine and its receptor CXCR3 in the development of ARDS-like

168
diseases associated with pathogenic pulmonary viral infections is not well understood. I
have sequenced for the first time the full mRNA sequence of ferret CXCL10, which is
highly conserved with its human homolog. Later, I expressed the recombinant ferret
CXCL10 and demonstrated its biological activity in a chemotaxis assay as well as its
cross-reactivity with a polyclonal antibody against human CXCL10. The purified
CXCL10 protein can be used for generating ferret specific monoclonal antibodies that
detect and or neutralize ferret CXCL10 for future studies.
I have shown the presence of increased expression of CXCL10 in the lung
biopsies of deceased SARS patients. Infected ferrets with SARS-CoV showed a similar
pattern of CXCL10 gene expression at mRNA level in their lungs. This similarity, further
supports that ferrets are the preferred animal model of SARS7. The role of CXCL10 in
lung pathological outcomes following SARS-CoV infection in ferrets can be further
tested by means of neutralization studies.
5.2 Early gene regulation events in SARS-CoV infection versus IFN-2b injection in
ferrets:
We previously demonstrated that imbalanced immune responses and deviated
expression of IRGs are associated to poor outcome in SARS patients6. Patients who
needed hospitalization or were transferred to ICU showed high levels of CXCL10 and
CCL2 in their serum. IRGs such as MX1, methallothionein 1H (MT1H), Syndecan 1
(SDC1) and IFIT3 were upregulated in mild SARS patients but not in ICU SARS
patients6. Other investigators have shown a similar correlation between SARS severity
and the expression pattern of chemokines4-6,13
. It has been shown that a poor IFN
response is associated with poor outcome in SARS patients12
. We observed increased

169
levels of IFN- in the plasma of our mild SARS patients compared to ICU SARS
patients. The level of IFN- in plasma was also increased in all mild SARS patients6. In
order to obtain a broader perspective of the role of IRGs and other immune mediators, we
went on to analyze the gene expression patterns in the peripheral blood and lung
necropsies of SARS-CoV-infected ferrets.
STAT1, a key molecule involved in IFN- and IFN- signaling, showed higher
levels of phosphorylation in the peripheral blood, and its mRNA levels were increased in
both the peripheral blood and the lungs of SARS-CoV-infected ferrets. Interestingly, the
lungs showed a higher number of total regulated genes and also more upregulated IRGs,
as compared with the blood. I defined a cluster of protective IRGs (STAT1, MX1, OAS1,
OAS2, ISG15 and IFI44), which were upregulated in both peripheral blood and lung
tissues of infected ferrets with SARS-CoV.
We used 6 month old ferrets, which are considered as young adults. SARS
infection in young ferrets produces mild symptoms and low mortality rate, which is
similar to the pattern found in young patients11
. The pattern of upregulated IRGs in the
young ferrets possessed many similarities with the findings in mild SARS patients, the
majority of which were young adults. Moderate expression of CXCL10 and formation of
an antiviral estate by protective IRGs seems to be a desired environment for the clearance
of the virus and the resolution of the disease, while strong upregulation of CXCL10 and
decreased expression of protective IRGs may lead to poor outcome. In this regard, I
suggest a future study in which senior ferrets (approximately 4 year old) would be
infected with SARS-CoV for investigating the pattern of IRG expression in their blood

170
and lung. For such an experiment, I hypothesize that increased CXCL10 expression and
decreased expression of protective IRGs in old versus young ferrets is associated with
severity of symptoms and higher mortality rates in old ferrets.
Interaction of IFNs with their receptors leads to activation of downstream
signaling, regulation of target genes and, generally, the establishment of an antiviral
estate22,23
. The IFN-family is a diverse group of cytokines, sharing 50% homology
amongst the group members24
. Although the gene expression patterns of IFN- have
been studied in human and mouse, the role of the different IFN- subtypes has not been
studied in detail in animal models. The gene expression patterns following IFN-2b and
ribavirin treatment in the peripheral blood of hepatitis C virus (HCV) patients was the
subject of a study by Taylor et al.25
. They used microarray analysis to evaluate the cyclic
changes in gene expression during the course of the treatment. However, the use of
combined therapy agents in that study and the lack of groups of patients and healthy
controls that received IFN-2b alone, prevented to clearly distinguish the direct effect of
IFN-2b on the peripheral blood. They have also studied the gene expression patterns of
human PBMCs after in vitro stimulation with IFN-2b26
. To my knowledge, there is no
published data on gene regulation in the lung necropsies of mouse or ferrets after
treatment with IFN-2b.
Here I hypothesize that IFN-2b can be used as a therapeutic agent and is able to
reduce the severity of SARS-CoV infection in ferrets. I have shown the responses
induced by IFN-2b injection and SARS-CoV infection in ferrets, both in vitro and in
vivo, in order to show the possible benefits of IFN-2b therapy. I have shown for the first

171
time that stimulation of ferret cells with IFN-2b, or subcutaneous injection of IFN-2b,
leads to phosphorylation of STAT1 and upregulation of protective IRGs in ferret PBMCs
and in their lungs. I found that genes associated with immune pathways such as leukocyte
activation pathway, cell adhesion molecules pathway and the complement pathway were
upregulated in the peripheral blood and lung necropsies from ferrets. Many genes of the
functional pathways, including cellular process, metabolic process, intracellular signaling
and cell cycle were also upregulated in blood and lung tissue. I have found that IFN-2b
regulates different arms of the immune response at early hours post administration in
ferrets. I have been able to identify a cluster of important protective IRGs that play a
critical role in providing an antiviral estate in the peripheral blood and lung necropsies of
injected ferrets with IFN-2b. Expression of an overlapping array of protective IRGs in
the lungs of the SARS-CoV-infected ferrets and IFN-2b injected ferrets may be an
indication of the potential benefit of using IFN-2b as a therapeutic agent. However as
mentioned earlier, more direct evidence for the efficacy of IFN-2b therapy needs to be
further investigated in future studies to conclude that such a therapy is effective. This
could be achieved by infecting young and senior ferrets with SARS-CoV and their
subsequent treatment with IFN-2b. Here, if SARS remerges in future, early treatment of
high risk diagnosed SARS patients, such as elderly patients or those with other medical
complications, may help to control the severity of the infection. This could reduce the
need of long-term hospitalization and its huge costs. Prophylaxis treatment of high risk
individuals such as professional health workers during an outbreak may also be valuable,
especially when current antiviral therapies have not yet proven their full efficacy in
SARS infection11,12
.

172
Microarray gene expression analysis revealed differences between SARS-CoV
infection and IFN-2b injection in my study as well. There were more upregulated IRGs
in the lung of infected ferrets with SARS-CoV compared to their blood. On the other
hand, ferrets injected with IFN-2b showed higher number of upregulated IRGs in the
peripheral blood than in the lung tissue. These differences can be the result of the
localized lung infection in SARS, versus the systemic effects caused by IFN-2b
injection. Immune responses and functional pathways followed the same trend as well. I
believe that, in a future study, it may be interesting to consider the use of higher doses of
subcutaneous IFN-2b, multiple doses, and/or to explore the intranasal administration of
IFN-2b to achieve stronger antiviral responses in the lungs. I speculate that faster and
stronger upregulation of protective IRGs such as MX1, OAS1, OAS2 and ISG15 limits
the viral growth and leads to a reduction in the lung damage. Viral confinement within
the infected tissue may limit the production of high levels of chemokines such as
CXCL10. It has been shown that SARS-CoV can directly upregulate this chemokine in
vitro4. As we and others have shown, high levels of CXCL10 are associated with poor
outcome during SARS-CoV infection5,6,13,15
, which might be the result of the recruitment
of an excessive number of immune cells into the lung and their contribution to self-
damage.
5.3 Characterization of ferret CD8
Many SARS patients at the onset of the disease presented unilateral or bilateral
air-space consolidation2. Pulmonary infiltration was increased in patients with poor
outcome, according to chest X-rays2,27
. Significant reduction of lymphocyte

173
subpopulations in peripheral blood of SARS patients have been reported by many
investigators28,29
. Absolute count of T lymphocytes (CD3+
), T helper cells (CD4+
), T
cytotoxic cells (CD8+
), B cells and NK cells were substantially reduced during the acute
phase of the disease, as compared to the healthy control group28,29
. Immunohistochemical
evaluation of sections prepared from the lung of deceased SARS patients has suggested
the infiltration of CD20+
B cells, CD8+
T cells and CD4+
T cells to the lung30
. The
number of CD8+ cells was notably higher than CD4
+ cells, whereas CD56
+ NK cells were
absent30
. Patients who had received higher doses of steroids had lower degrees of
lymphoid cells infiltration30,31
. In the last chapter of my thesis I cloned, expressed and
characterized the full-length ferret CD8cDNA coding sequence. The aim of this part of
my project was to be able to evaluate the infiltration of CD8+ cells in the lungs of
infected ferrets with SARS-CoV in future studies. CD8+ cells express CXCR3 on their
cell surface and could migrate to the site of infection under the influence of CXCL1032
. I
hypothesize that under the influence of CXCL10, CD8+ cells migrate to the lung of
infected ferrets with SARS-CoV. I believe that neutralization of CXCL10 with
monoclonal antibodies or the inhibition of its receptor CXCR3 by means of small-
molecule antagonists, will reduce the infiltration of CD8+ cells in the lung of ferrets
infected with SARS-CoV, and subsequently decrease symptoms severity and mortality
rates.
5.4 Future studies
The observation of lymphopenia in peripheral blood of SARS patients and the expression
of CXCL10 in lung necropsies of deceased SARS patients might be an indication of rapid

174
migration of lymphocytes to the lung under the influence of the CXCR3-CXCL10 axis.
However, monitoring host immune responses in an uncharacterized animal model
requires the generation of more reagents with modern technologies.
Sequencing the entire genome of ferrets would be a priority for developing desired
reagents at large scale. Here I suggest sequencing the ferret entire genome using a high-
throughput method which is fast and cost-effective. The history of nucleotide sequencing
backs to 1970s and the RNA genome of a bacteriophage was the first complete genome
made available33
. The chain-termination method was the first DNA sequencing method,
developed a few years later. In this method, single stranded DNA, DNA primers, DNA
polymerase and radioactive labeled dNTPS were used for sequencing the DNA
fragments. The limitation of this technology is the non-specific binding of the primer to
the DNA34
. Dye-terminator technology was the next method of choice, and is still used
today. It was improved for automated sequencing, which is fast and uses fluorescent
labeling for safety and ease of analysis. However unequal light emission peak heights are
a disadvantage of this method that may cause errors35
. Another disadvantage of all
methods so far discussed is their limitation in sequencing large DNA fragments. Only
short DNA fragments of up to 1000 base pairs can be sequenced by these methods. High-
throughput sequencing, which does not utilize standard methods such as dye reporters has
developed to produce hundreds of thousands or millions of sequences at once with a low
cost36
. The first next generation sequencing technology was a bead-based method called
Massively Parallel Signature Sequencing (MPSS)37
. This technology was complex and
expensive and finally was bought and modified by Illumina, using reversible dye-
terminator technology in which DNA molecules are attached to primers on a slide and

175
amplified to local colonies38
. DNA nanoball sequencing is one the next generation
sequencing methods, in which small fragments of genomic DNA can be amplified and
used for unchained sequencing by ligation to read the nucleotide sequences. Large
numbers of DNA nanoballs at low cost can be sequenced and assembled by this method
for sequencing the whole genome39
.
In situ hybridization would be another technique that could be used for evaluation of gene
expression40
. Making recombinant proteins is time-consuming, but using RNA In Situ
hybridization could be a fast approach for poorly characterized animal models. Having
the gene sequences, one can produce fluorescently labeled complementary RNA to utilize
it for determining the expression level of genes of interest. Antibody phage display
technology is a fast approach for producing large libraries of antibodies against desired
targets. This can be performed by fusion of the DNA coding sequences of the target
protein to one of the genes encoding the phage surface proteins. However affinity
selection of these antibodies needs the expression of recombinant protein in an expression
vector and exposing the phage antibodies to these recombinant antibodies to immobilized
recombinant target antigen41
.
The sequenced genes by high-throughput technology can be used to express immune
genes at the protein level as recombinant proteins. These recombinant proteins can be can
be used for the generation of hybridoma clones and the development of monoclonal
antibodies. Generated antibodies can be used for development of ELISA kits to measure
endogenous gene products at the protein level. Neutralizing antibodies also can be used in
neutralization assays.

176
Sequences obtained by one of these modern technologies can be further used to produce
ferret microarray chips. Sequences also can be used for designing ferret specific primers
for confirmation of microarray results. Expression of cytokine, chemokine, cell surface
markers and transcription factors at the mRNA level in the tissue biopsies can also be
assessed by In Situ hybridization.
In this thesis I have shown that the expression pattern of CXCL10 in the lung of infected
ferrets with SARS-CoV was similar to its expression in the lung of deceased SARS
patients. I suggest that CXCL10 may play an important role in the severity of the disease
and I propose future studies in order to neutralize CXCR3-mediated signaling by using
small-molecule inhibitors such as AMG479. I also suggest the neutralization of CXCL10
with a neutralizing antibody generated by phage or hybridoma technologies in future.
Ferrets may be infected with SARS-CoV and treated with CXCL10 neutralizing
antibodies. In this future study, the survival of treated ferrets compared to untreated
ferrets could be evaluated. Additionally, ferret specific monoclonal anti-CXCL10
antibodies could be used for measurement of CXCL10 at the protein level. Other factors
that should be assessed include the infiltration of leukocytes to the lung and gene
expression profiles in the lung or peripheral blood of ferrets. This could be achieved
using custom made ferret specific microarray chips. CXCL10 is an example of an IRG
that may play a key role in the pathogenesis of SARS.
There are other IRGs that may be protective against infection with SARS-CoV. I have
shown in the third chapter of my thesis that SARS-CoV infection and IFN-2b injection
in ferrets have their unique, as well as overlapping gene expression patterns. I suggest
that IFN-2b can be used as a therapeutic agent in a future study to investigate whether

177
this cytokine is able to reduce the severity of SARS-CoV infection in ferrets. It may be
valuable to explore the use of higher doses of IFN-2b in order to induce stronger IFN
responses in the lungs. I suggest the use of ferret specific microarray chips to evaluate the
gene expression patterns in treated versus untreated animals. Real-time PCR and in situ
hybridization could be used to confirm the microarray results. Finally, I propose the use
of alternative administration routes of IFN-2b, such as intranasal administration, for
future studies. It is important to mention that I used one single dose of IFN-2b in my
experiments. Considering treatments with multiple doses may also be beneficial for
creating a long-lasting IRGs response, as in day 2 post-injection of IFN-2b, I observed a
decline in the number and the expression levels of IRGs.

178
Reference List
1. Leong,H.N. et al. Clinical and laboratory findings of SARS in Singapore. Ann.
Acad. Med. Singapore 35, 332-339 (2006).
2. Hui,D.S. et al. Severe acute respiratory syndrome: correlation between clinical
outcome and radiologic features. Radiology 233, 579-585 (2004).
3. Lee,N. et al. A major outbreak of severe acute respiratory syndrome in Hong
Kong. N. Engl. J. Med. 348, 1986-1994 (2003).
4. Spiegel,M. & Weber,F. Inhibition of cytokine gene expression and induction of
chemokine genes in non-lymphatic cells infected with SARS coronavirus. Virol.
J. 3, 17 (2006).
5. Wong,C.K. et al. Plasma inflammatory cytokines and chemokines in severe acute
respiratory syndrome. Clin. Exp. Immunol. 136, 95-103 (2004).
6. Cameron,M.J. et al. Interferon-mediated immunopathological events are
associated with atypical innate and adaptive immune responses in patients with
severe acute respiratory syndrome. J. Virol. 81, 8692-8706 (2007).
7. Martina,B.E. et al. Virology: SARS virus infection of cats and ferrets. Nature
425, 915 (2003).
8. Chu,Y.K. et al. The SARS-CoV ferret model in an infection-challenge study.
Virology 374, 151-163 (2008).
9. Haagmans,B.L. et al. Pegylated interferon-alpha protects type 1 pneumocytes
against SARS coronavirus infection in macaques. Nat. Med. 10, 290-293 (2004).
10. Marshall,E. & Enserink,M. Medicine. Caution urged on SARS vaccines. Science
303, 944-946 (2004).
11. Poutanen,S.M. et al. Identification of severe acute respiratory syndrome in
Canada. N. Engl. J. Med. 348, 1995-2005 (2003).
12. Loutfy,M.R. et al. Interferon alfacon-1 plus corticosteroids in severe acute
respiratory syndrome: a preliminary study. JAMA 290, 3222-3228 (2003).
13. Huang,K.J. et al. An interferon-gamma-related cytokine storm in SARS patients.
J. Med. Virol. 75, 185-194 (2005).
14. Cheung,C.Y. et al. Cytokine responses in severe acute respiratory syndrome
coronavirus-infected macrophages in vitro: possible relevance to pathogenesis. J.
Virol. 79, 7819-7826 (2005).

179
15. Tang,N.L. et al. Early enhanced expression of interferon-inducible protein-10
(CXCL-10) and other chemokines predicts adverse outcome in severe acute
respiratory syndrome. Clin. Chem. 51, 2333-2340 (2005).
16. Krathwohl,M.D. & Anderson,J.L. Chemokine CXCL10 (IP-10) is sufficient to
trigger an immune response to injected antigens in a mouse model. Vaccine 24,
2987-2993 (2006).
17. Glass,W.G., Subbarao,K., Murphy,B. & Murphy,P.M. Mechanisms of host
defense following severe acute respiratory syndrome-coronavirus (SARS-CoV)
pulmonary infection of mice. J. Immunol. 173, 4030-4039 (2004).
18. Dufour,J.H. et al. IFN-gamma-inducible protein 10 (IP-10; CXCL10)-deficient
mice reveal a role for IP-10 in effector T cell generation and trafficking. J.
Immunol. 168, 3195-3204 (2002).
19. Liu,M.T., Keirstead,H.S. & Lane,T.E. Neutralization of the chemokine CXCL10
reduces inflammatory cell invasion and demyelination and improves neurological
function in a viral model of multiple sclerosis. J. Immunol. 167, 4091-4097
(2001).
20. Ruth,J.H. et al. Selective lymphocyte chemokine receptor expression in the
rheumatoid joint. Arthritis Rheum. 44, 2750-2760 (2001).
21. Christen,U. et al. Cure of prediabetic mice by viral infections involves
lymphocyte recruitment along an IP-10 gradient. J. Clin. Invest 113, 74-84
(2004).
22. Hall,J.C. & Rosen,A. Type I interferons: crucial participants in disease
amplification in autoimmunity. Nat. Rev. Rheumatol. 6, 40-49 (2010).
23. Galligan,C.L. et al. Interferons and viruses: signaling for supremacy. Immunol.
Res. 35, 27-40 (2006).
24. Chen,J., Baig,E. & Fish,E.N. Diversity and relatedness among the type I
interferons. J. Interferon Cytokine Res. 24, 687-698 (2004).
25. Taylor,M.W., Tsukahara,T., McClintick,J.N., Edenberg,H.J. & Kwo,P. Cyclic
changes in gene expression induced by Peg-interferon alfa-2b plus ribavirin in
peripheral blood monocytes (PBMC) of hepatitis C patients during the first 10
weeks of treatment. J. Transl. Med. 6, 66 (2008).
26. Taylor,M.W. et al. Global effect of PEG-IFN-alpha and ribavirin on gene
expression in PBMC in vitro. J. Interferon Cytokine Res. 24, 107-118 (2004).
27. Ye,J. et al. Molecular pathology in the lungs of severe acute respiratory syndrome
patients. Am. J. Pathol. 170, 538-545 (2007).

180
28. Cui,W. et al. Expression of lymphocytes and lymphocyte subsets in patients with
severe acute respiratory syndrome. Clin. Infect. Dis. 37, 857-859 (2003).
29. Tang,X. et al. Measurement of subgroups of peripheral blood T lymphocytes in
patients with severe acute respiratory syndrome and its clinical significance. Chin
Med. J. (Engl. ) 116, 827-830 (2003).
30. Ng,W.F., To,K.F., Lam,W.W., Ng,T.K. & Lee,K.C. The comparative pathology
of severe acute respiratory syndrome and avian influenza A subtype H5N1--a
review. Hum. Pathol. 37, 381-390 (2006).
31. Franks,T.J. et al. Lung pathology of severe acute respiratory syndrome (SARS): a
study of 8 autopsy cases from Singapore. Hum. Pathol. 34, 743-748 (2003).
32. Lindell,D.M., Lane,T.E. & Lukacs,N.W. CXCL10/CXCR3-mediated responses
promote immunity to respiratory syncytial virus infection by augmenting
dendritic cell and CD8(+) T cell efficacy. Eur. J. Immunol. 38, 2168-2179 (2008).
33. Fiers,W. et al. Complete nucleotide sequence of bacteriophage MS2 RNA:
primary and secondary structure of the replicase gene. Nature 260, 500-507
(1976).
34. Sanger,F. & Coulson,A.R. A rapid method for determining sequences in DNA by
primed synthesis with DNA polymerase. J. Mol. Biol. 94, 441-448 (1975).
35. Rosenthal,A. & Charnock-Jones,D.S. New protocols for DNA sequencing with
dye terminators. DNA Seq. 3, 61-64 (1992).
36. Hall,N. Advanced sequencing technologies and their wider impact in
microbiology. J. Exp. Biol. 210, 1518-1525 (2007).
37. Brenner,S. et al. Gene expression analysis by massively parallel signature
sequencing (MPSS) on microbead arrays. Nat. Biotechnol. 18, 630-634 (2000).
38. Mardis,E.R. Next-generation DNA sequencing methods. Annu. Rev. Genomics
Hum. Genet. 9, 387-402 (2008).
39. Porreca,G.J. Genome sequencing on nanoballs. Nat. Biotechnol. 28, 43-44 (2010).
40. Jin,L. & Lloyd,R.V. In situ hybridization: methods and applications. J. Clin. Lab
Anal. 11, 2-9 (1997).
41. Hoogenboom,H.R. Overview of antibody phage-display technology and its
applications. Methods Mol. Biol. 178, 1-37 (2002).
181
Appendix I
Cloning, Expression and Immunoassay Detection of Ferret IFN-
(A version of this Appendix is published in Developmental and Comparative
Immunology, volume 32 (8), (2008), 890-7, as “Cloning, Expression and Immunoassay
Detection of Ferret IFN-”
Atsuo Ochi, Ali Danesh, Charit Seneviratne, David Banner, Mark E. Devries, Thomas
Rowe, Luoling Xu, Longsi Ran, Markus Czub, Steven E. Bosinger, Mark J. Cameron,
Cheryl M. Cameron, and David J. Kelvin, with permission from Elsevier.)
1. Introduction
Influenza A viruses infect millions of people world-wide resulting in high
morbidity and mortality rates, particularly in the very young and elderly 1-4. Certain
highly pathogenic avian influenza A viruses, such as the H5N1 strain, are a significant
threat to global health. H5N1 influenza has a high mortality rate, even in healthy young
adults, and while human to human transmission has been limited, mutation or genetic
reassortment of H5N1 influenza A virus may create a strain readily capable of human to
human transmission and with pandemic potential.
Cytokines are important mediators of the immune response and have been shown
to play a pivotal role in host immune defense to microbial infection 5. Interferon gamma
(IFN- has been recognized as a multipotent cytokine due to its broad range of
regulatory functions during virus-induced host immune responses 6,7
. IFN- can directly
influence the differentiation of T cells and promote Th1-type immune responses in CD4+
and CD8+ T cells
8,9. Virtually all immune cell types express receptors for IFN- and are
influenced by this cytokine. Signaling by IFN- leads to up-regulation of class II major
histocompatibility complex (MHC) expression, which in turn increases the antigen
presentation to CD4+ T cells by macrophages, dendritic cells, and B cells
10,11. IFN- also

182
increases the expression of class I MHC, resulting in enhanced stimulation of antigen-
specific CD8+ T cells
12,13. Upon stimulation of these cells by IFN-, CD8
+ T cells are
important in the eradication of intracellular virus during recovery from viral infections 14-
16. Moreover, high levels of IFN- bias the polarity of CD4
+ T helper cells towards a Th1
phenotype, characterized by production of IL-2 and IFN- 17,18
. A Th1-type immune
response is fundamental to the development of host immunity against many pathogens,
including influenza A virus 19-21
. IFN- is also necessary for T cell-mediated viral
clearance and limitation of latent viral infections 22
. Moreover, IFN- production is
considered to be critical in determining vaccine efficacy 23,24
. Therefore, measurement of
IFN- production in both natural and experimental influenza A virus infections will
improve our understanding of the antiviral immune response, which may assist the
development of more effective vaccines.
Several animal models have been developed for testing the efficacy of influenza vaccines
and antiviral therapies, including mice, rats, guinea pigs, nonhuman primates and
ferrets25-28. Ferrets (Mustela putorius furo) have been used by researchers to identify
novel viruses, determine strain toxicity and evaluate vaccines 29. Ferrets are naturally
susceptible to human strains of influenza virus and display many of the same symptoms
that appear in humans, including sneezing, nasal discharge, weight loss and an increased
body temperature 30
. Indeed, the Spanish flu virus (H1N1) was first identified in ferrets
31. Ferrets therefore represent a fundamentally important model for studying the
transmission and pathogenesis of influenza. A current limitation to the ferret influenza
model, however, is the lack of species-specific immunological reagents required to assess
host responses in vaccinated and infected animals. In the current study, we report the full

183
length cloning of the ferret IFN-cDNA, expression of the recombinant cytokine, and the
generation of monoclonal antibodies suitable for ELISA and ELISPOT detection of
natural ferret IFN-.

184
2. Materials and methods
2.1 Experimental animals
Six-month old male ferrets (Mustela putorius furo) were purchased from Triple F
Farms Inc. (Sayre, PA. USA) and housed at the Southern Research Institute (SRI) BSL-2
animal facility (Birmingham, AB). Approval by animal care committee at SRI was
obtained for all procedures. After arrival, ferrets were quarantined and monitored for one
week prior to tissue and blood collection. Animal diets were based on a low fat, high
protein regimen.
Female Balb/c mice (4-6 wks old) were purchased from Jackson Laboratories
(Bar Harbor, ME, USA).
2.2 Total RNA purification and cDNA cloning of ferret IFN-
Ferret whole blood was diluted 1:1 with RPMI 1640 cell culture media
(Invitrogen, Carlsbad, USA) and stimulated with mitogens (LPS (1 g/ml, Sigma
Chemicals, St. Louise, MO, USA), PMA (50 ng/ml, Sigma), ionomycin (0.1 mM, Sigma)
and poly I:C (25 g/ml, Sigma) and incubated at 37ºC in 5% CO2 for 2, 4, 8, and 12
hours prior to RNA purification. Paxgene RNA isolation method (Qiagen, Mississauga,
Canada) was used. cDNA was synthesized from purified total RNA by reverse
transcriptase II (Invitrogen). A 907 bp cDNA fragment was amplified by PCR using
consensus sequence primers based on nucleotide sequence alignment of IFN- from
multiple species, including dog, cat, and pig. The PCR fragment was isolated, cloned and
sequenced to confirm that it encompassed the full-length coding sequence for ferret IFN-
. An expression vector for IFN- was generated by PCR-based subcloning using the
185
following primers: 5’-CGATGAATTATACAAGCTATATCTTA-3’ (forward) and 5’-
TTTCGATGCTCTG CGGCCGGGAAA-3’ (reverse). The resulting 501kb fragment
was ligated into pCR 3.1-TOPO vector (Invitrogen). Nucleotide sequences of positive
clones were confirmed by dideoxy sequencing using ABI 3730XL DNA analyzers
(Center for Applied Genomics, Toronto, Ontario). Gene identification was carried out by
Basic Local Alignment Search Tool (BLAST) analyses against National Centre for
Biotechnology Information (NCBI) databases at National Institutes of Health, USA.
Multiple sequence alignment was performed using Clustal X included in the Lasergene
Software package (DNAStar Inc., Madison, WI).
2.3 Gene Transfection, Expression in COS-7 cells, and Protein purification
PCR was used to generate a Kozak sequence at the 5’ end of the ferret cDNA, and
to remove 3’ end termination codons before sub-cloning into pcDNA3.1/His6.V5/TOPO
expression vector (Invitrogen) to produce a His6/V5 tagged form of the protein.
Expression constructs were sequenced to verify sequence and orientation.
COS-7 cells were maintained in Dulbecco’s modified Eagle’s medium (DMEM)
(Invitrogen), supplemented with 10% fetal bovine serum (Invitrogen) at 37ºC, 5% CO2.
COS-7 cells were transiently transfected with plasmid encoding the recombinant ferret
IFN- using Effectene (Qiagen). After 24-48 hours, the cell culture supernatant from the
IFN--transfected cells was run through Ni-NTA metal immobilized affinity column
(Novagen, EMS Chemicals, San Diego, CA, USA) to bind HIS-tagged recombinant ferret
IFN- protein. The purified protein was washed, eluted and fractions were collected.
Eluted fractions were screened by immunoblotting using an antibody recognizing the V5
186
epitope (Invitrogen). Fractions containing the IFN- protein were pooled and dialyzed
against phosphate buffered saline (PBS) at 4ºC and concentrated by spin column
(Nanosep 10k OMEGA, Pall Life Science, East Hills, NY, USA). The protein
concentration was determined by protein assay kit (Pierce, Rockford, IL, USA).
2.4 Western Blot analysis
10-15% SDS-Poylacrylamide gel electrophoresis (SDS-PAGE) was performed
with pre-cast gels (Bio-Rad, USA), or 10% NuPAGE pre-cast gels (Invitrogen). Protein
was transferred to nitrocellulose and the membranes were blocked with 5% fat free milk,
0.01% Tween-20 in PBS (TPBS) for 1 hour at room temperature. Membranes were
incubated at 4C for 4-16 hours with monoclonal anti-V5 Ab (1:1000) (Invitrogen) or
hybridoma culture supernatant (1:50). Hybridized membranes were washed with TPBS
and incubated with goat-anti-mouse-HRP (1:5000) (Santa Cruz, CA, USA) for 1 hour at
room temperature. Protein blots were visualized using enhanced chemiluminescent (ECL)
reagents (GE Healthcare, Canada).
2.5 Isolation of Peripheral Blood Mononuclear Cells (PBMC)
PBMCs were isolated from ferret blood gradient centrifugation through
Histopaque solution (Sigma). Briefly, whole blood was diluted 1:1 with PBS (10 ml),
layered on to 5 ml Histopaque solution, and centrifuged 400 xg for 20 min. The enriched
mononuclear cell layer at the Histopaque-plasma interface was harvested and used as the
source of PBMCs.
187
2.6 Mouse B cell hybridoma preparation
Recombinant ferret IFN- (50 g) and 2 mg of keyhole limpet hemocyaine (KLH)
(Calbiochem, San Diego, CA, USA) were diluted in 0.5 ml PBS. Five l of
glutaraldehyde was added and the mixture was allowed to incubate at room temperature
for 1 hour. Due to the appearance of aggregates, the whole mixture was washed on a spin
column (Nanosep 10k OMEGA, Pall Life Science) and concentrated to 0.1 ml volume.
Following centrifugation, 0.5 ml PBS was added and the mixture was centrifuged again.
After two rounds of PBS addition and centrifugation, the mixture was made up to 0.5 ml
in PBS and used as the source for the priming antigen. Mice were immunized with 25 l
antigen suspension in emulsified Complete Freund's Adjuvant. Mice were injected an
additional two times at bi-weekly intervals with 5 g of recombinant ferret IFN-. Three
days after the third injection, spleen cells were removed and isolated for fusion with
Sp2/0-Ag14 using polyethylene glycol (Roche, Mannheim, Germany) and hypoxanthine
aminopterin thymidine (HAT) resistant hybridomas were selected. Hybridoma cells were
screened for the reactivity against IFN- by ELISA using Nunc MaxiSorp 96 well plates
coated with ferret IFN- (100 l, 0.1 g/ml).
2.7 Ferret IFN--specific ELISA
A 96-well ELISA plate (MaxiSorb, Nunc) was coated with 100 l/well
monoclonal anti-IFN- (2 g/ml) overnight at 4C. The wells were blocked with 150 l
1% BSA in PBS for 1 hour at 37C. Supernatants from mitogen-stimulated PBMC
cultures or serum from influenza A virus infected ferrets were loaded into each well at
dilutions described in the text and incubated for 1 hour at 37C. Wells were washed with

188
PBS/0.5% Tween-20 and then incubated for 1 hour at room temperature with biotin-
conjugated anti-IFN- antibody (1 g/ml in 0.5% Tween-20/1%BSA). The wells were
washed three times with PBS/0.5% Tween-20 before incubation with HRP-Avidin for 30
minutes. The substrate, (o-phenylenediamine, Sigma) was applied for 15 minutes at
room temperature. Colorimetric changes were quantitated using an automated ELISA
reader (Quant, BIO-TEK Instruments, Winooski, VT, USA).
2.8 Ferret IFN--specific ELISPOT assay
PVDF plates (Millipore, MAIPS4510) or MaxiSorp plates (Nunc) were coated
with a monoclonal anti-ferret IFN- antibody as the capture antibody, and blocked with
1% BSA-PBS. Ferret PBMCs were cultured in the presence of stimulating reagents as
described in the text for 18 hours. Wells were washed with water to remove cells and
then captured IFN- was detected by a biotin-conjugated detection antibody coupled to
HRP-avidin (Sigma). The ELISPOT was developed using DAB (Vector Laboratories,
Burlingame, CA, USA).
2.9 Infection of ferrets with Influenza A virus
Male ferrets (castrated, descented) weighing approximately 800-1000 g were
infected intranasally with 106 EID50 influenza virus (H3N2 strain: A/Panama/2007/99) in
1 ml PBS. An additional three animals were mock-infected using PBS diluent alone.
Animals were euthanized humanely six days post-infection, and serum was obtained
using 10 ml SST vacutainer tubes.

189
3. Results
3.1 Cloning of ferret IFN- cDNA and the expression of His6-,V5-tagged
recombinant IFN- in COS-7 transfectant cells
A cDNA encoding ferret IFN- was cloned from isolated total RNA derived from
mitogen-stimulated ferret PBMCs as described in the materials and methods. The cDNA
sequence and predicted amino acid sequence for ferret IFN- are depicted in Figure
Appen.-1A. Amino acid sequence homology to the predicted ferret IFN- was highest in
the Eurasian badger (Meles meles) (97%), followed by the canine (86%) and feline (83%)
sequences (Fig. Appen.-1B). The homology of ferret IFN- to human and mouse IFN-
was 63% and 48%, respectively. Phylogenetic analysis using BLAST (see Figure
Appen.-1C) indicates that closest orthologue of ferret IFN- is that of the badger. The
ferret IFN- cDNA was subcloned into the His6-,V5-fusion protein expression vector and
subsequently transfected into COS-7 cells to produce recombinant IFN- protein. Ferret
IFN- protein was secreted from the COS-7 transfectants and migrated as a 35-45 kDa
band when subjected to immunoblotting experiments using a V5-specific antibody
(Figure Appen.-2). Since the estimated molecular weight of ferret IFN- is ~17kDa as the
monomer, the band detected in Coomassie blue staining and immunoblotting is constant
with the dimerized form of IFN-.
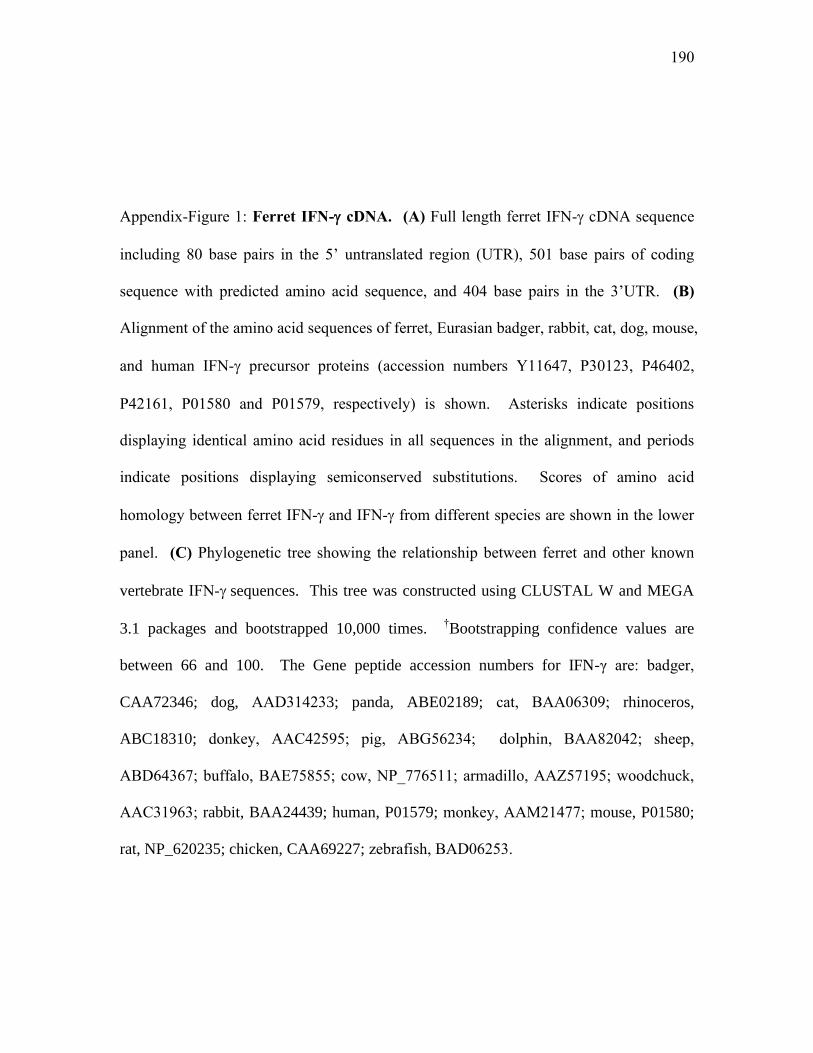
190
Appendix-Figure 1: Ferret IFN- cDNA. (A) Full length ferret IFN- cDNA sequence
including 80 base pairs in the 5’ untranslated region (UTR), 501 base pairs of coding
sequence with predicted amino acid sequence, and 404 base pairs in the 3’UTR. (B)
Alignment of the amino acid sequences of ferret, Eurasian badger, rabbit, cat, dog, mouse,
and human IFN- precursor proteins (accession numbers Y11647, P30123, P46402,
P42161, P01580 and P01579, respectively) is shown. Asterisks indicate positions
displaying identical amino acid residues in all sequences in the alignment, and periods
indicate positions displaying semiconserved substitutions. Scores of amino acid
homology between ferret IFN- and IFN- from different species are shown in the lower
panel. (C) Phylogenetic tree showing the relationship between ferret and other known
vertebrate IFN-sequences. This tree was constructed using CLUSTAL W and MEGA
3.1 packages and bootstrapped 10,000 times. †Bootstrapping confidence values are
between 66 and 100. The Gene peptide accession numbers for IFN-γ are: badger,
CAA72346; dog, AAD314233; panda, ABE02189; cat, BAA06309; rhinoceros,
ABC18310; donkey, AAC42595; pig, ABG56234; dolphin, BAA82042; sheep,
ABD64367; buffalo, BAE75855; cow, NP_776511; armadillo, AAZ57195; woodchuck,
AAC31963; rabbit, BAA24439; human, P01579; monkey, AAM21477; mouse, P01580;
rat, NP_620235; chicken, CAA69227; zebrafish, BAD06253.

191
A)

192
B)

193
C)

194
Appendix-Figure 2: Secretion of ferret IFN- by COS-7 cell transfectants. Detection
of recombinant ferret IFN- by V5-tag-specific immunoblotting. Secreted recombinant
ferret IFN- was enriched using a His-affinity column. The first three eluate fractions,
shown in lanes 1, 2 and 3 respectively, were analysed by V5-specific immunoblotting.
The arrow indicates the dominant protein band observed in fraction 2 and 3.
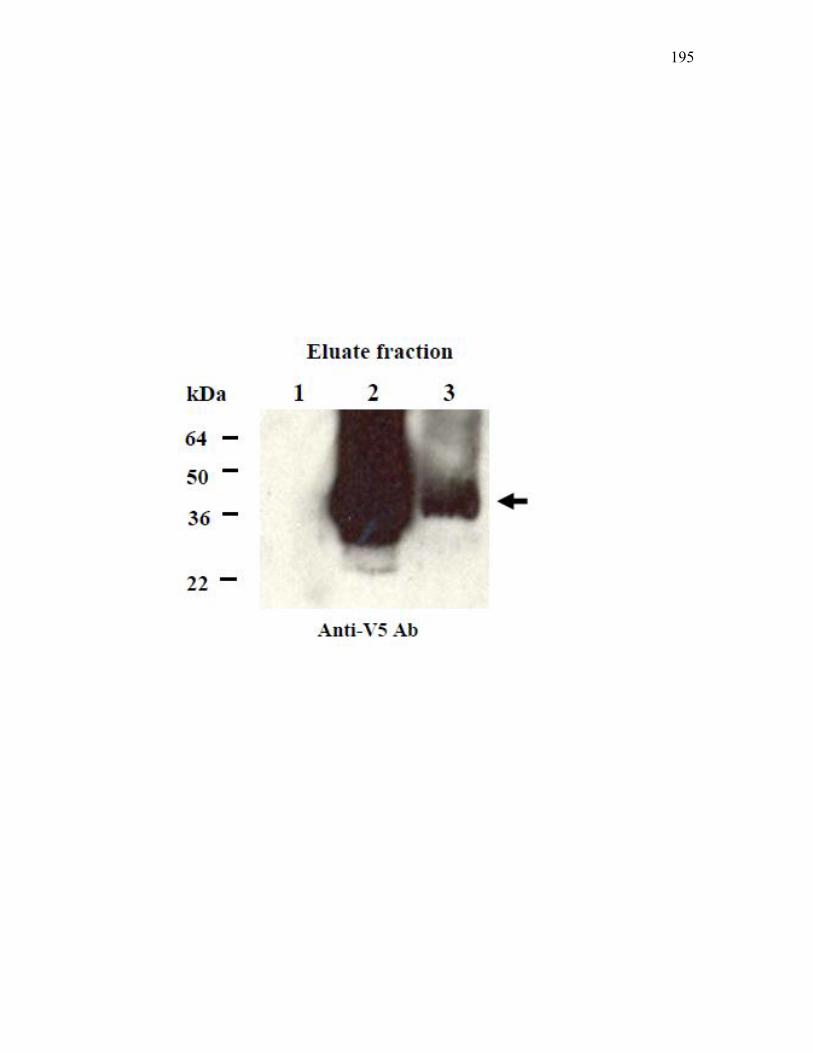
195
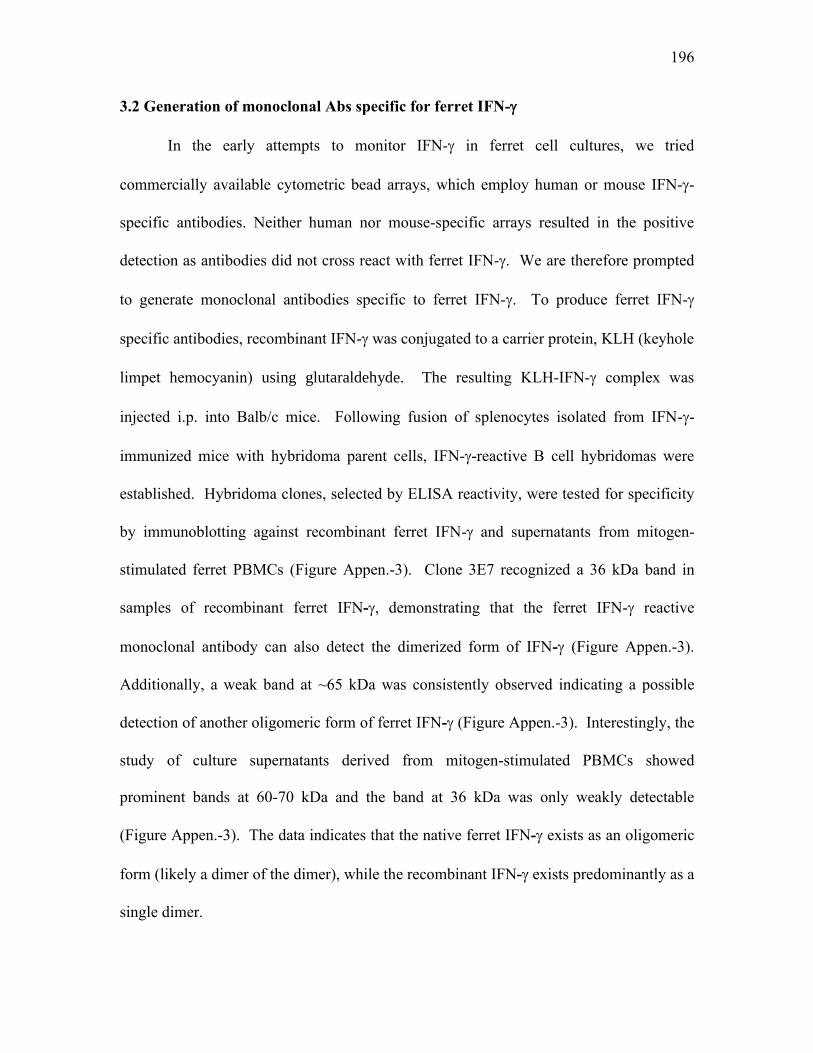
196
3.2 Generation of monoclonal Abs specific for ferret IFN-
In the early attempts to monitor IFN- in ferret cell cultures, we tried
commercially available cytometric bead arrays, which employ human or mouse IFN--
specific antibodies. Neither human nor mouse-specific arrays resulted in the positive
detection as antibodies did not cross react with ferret IFN-. We are therefore prompted
to generate monoclonal antibodies specific to ferret IFN-. To produce ferret IFN-
specific antibodies, recombinant IFN-was conjugated to a carrier protein, KLH (keyhole
limpet hemocyanin) using glutaraldehyde. The resulting KLH-IFN- complex was
injected i.p. into Balb/c mice. Following fusion of splenocytes isolated from IFN--
immunized mice with hybridoma parent cells, IFN--reactive B cell hybridomas were
established. Hybridoma clones, selected by ELISA reactivity, were tested for specificity
by immunoblotting against recombinant ferret IFN- and supernatants from mitogen-
stimulated ferret PBMCs (Figure Appen.-3). Clone 3E7 recognized a 36 kDa band in
samples of recombinant ferret IFN-, demonstrating that the ferret IFN- reactive
monoclonal antibody can also detect the dimerized form of IFN- (Figure Appen.-3).
Additionally, a weak band at ~65 kDa was consistently observed indicating a possible
detection of another oligomeric form of ferret IFN- (Figure Appen.-3). Interestingly, the
study of culture supernatants derived from mitogen-stimulated PBMCs showed
prominent bands at 60-70 kDa and the band at 36 kDa was only weakly detectable
(Figure Appen.-3). The data indicates that the native ferret IFN- exists as an oligomeric
form (likely a dimer of the dimer), while the recombinant IFN- exists predominantly as a
single dimer.

197
Appendix-Figure 3: Detection of ferret IFN- by a monoclonal anti-ferret IFN- Ab.
Western blot analysis of recombinant ferret IFN- using monoclonal Abs (LEFT PANEL).
Lysates from COS-7 cells transfected with recombinant ferret IFN- samples were
analyzed by Western blot using a monoclonal antibody established from mouse
immunized by recombinant ferret IFN- and shown in the left panel (RIGHT PANEL).
Supernatants derived from ferret PBMC cultures stimulated with PMA plus ionomycin,
were analyzed by Western blot using anti-ferret IFN- monoclonal antibody. Arrows at
the right of each panel indicate the dimers for lower molecular weight protein bands and
putative tetramer as higher molecular weight species.

198

199
3.3 Utilization of monoclonal antibodies for the detection of ferret IFN-by ELISA
and ELISPOT immunoassays
An important application for monoclonal anti-ferret IFN- antibodies is the
detection and quantitation of IFN- protein in biological samples. To this end, we tested
our monoclonal antibodies for utility in a ferret IFN--specific ELISA assay. To select
the antibody pair for IFN- recognition in ELISA assays, we tested monoclonal
antibodies derived from different clones. The clone 3E7 was conjugated to biotin and
used as the detection antibody against Ferret IFN- and antibodies from five other clones
were used to coat the assay wells. Of the five monoclonal anti-Ferret IFN- antibodies
that we screened in this manner, the clone 1E3 consistently showed the presence of Ferret
IFN- in mitogen-stimulated ferret spleen cell supernatants. Therefore, we decided to
continue using 1E3 as the ELISA capture antibody paired with 3E7 as the detection
antibody. As shown in Figure Appen.-4A, an ELISA was carried out using the paired
capture and biotin-conjugated detection antibodies, and demonstrated an increase in
optical density that correlated directly with the concentration of purified recombinant
IFN-. The increase in optical density exhibited a smooth logarithmic correlation
between 10 pg/ml and 10 ng/ml of recombinant IFN- protein (R2 = 0.9826). Using this
standard curve, we measured the concentration of IFN- in in vitro stimulated PBMC
supernatants. IFN- was present only in samples that were treated with PMA in
conjunction with a Ca2+ ionophore (Figure Appen.-4B). The results indicate that the
monoclonal antibodies selected are applicable for ferret IFN--specific ELISA.
Our primary scope in developing the ferret IFN--specific monoclonal antibodies
was to develop a reagent with which to measure IFN- immune responses in tissues or

200
cells derived from influenza A virus-infected ferrets. To this end, an ELISA using the
capture-detection monoclonal antibody pair was used to assess the level of IFN- in sera
obtained from influenza A-infected ferrets. The assay showed substantial levels of
circulating IFN- on day 6 post-infection (Figyre Appen.-5). The level of IFN- in serum
from the non-infected control ferret was below the detection limit. These results show
that the ELISA assay using our anti-ferret IFN- monoclonal antibodies will be
invaluable in monitoring systemic IFN- responses during a host response against virus
infection.
ELISPOT IFN- assays are also a key tool in the determination and quantitation
of IFN--secreting cells. To develop a ferret-specific IFN- ELISPOT assay we
employed the same set of monoclonal ferret IFN- antibodies, clone 3E7 and 1E3.
ELISPOT was performed on ferret PBMCs that had been stimulated with PMA plus
ionomycin. As demonstrated in Figure Appen.-6, increasing numbers of IFN- secreting
cells were detected in direct proportion to the number of stimulated cells plated, while the
number of IFN- positive cells did not increase above background when increasing
numbers of unstimulated cells were plated. The results indicate that 3E7 and 1E3 anti-
ferret IFN- monoclonal antibodies will be invaluable for performing ELISPOT analysis
of IFN- levels in ferret tissue.

201
Appendix-Figure 4: Measurement of IFN- in the mitogen-stimulated ferret PBMC
culture supernatants by ELISA. (A) Standard curve for ferret IFN-ELISA. ELISA
plate well were coated with a monoclonal anti-ferret antibody generated in our laboratory.
Recombinant ferret IFN- was sequentially diluted and loaded to the antibody-coated
wells. Captured ferret IFN- was detected by a second monoclonal anti-ferret IFN-
antibody generated in our laboratory conjugated to biotin, using the avidin-HRP detection
method. Logarithmic dilution was used to derive a standard curve for downstream
applications of the ELISA. (B) IFN- in mitogen stimulated ferret PBMC supernatants.
ELISA utilizing the monoclonal ferret IFN- antibody as a capture antibody was
performed on COS-7 cells treated with PMA, ionomycin or both. Results represent the
mean values of triplicate samples.

202
A)
B)

203
Appendix-Figure 5: Detection of increased levels of IFN- in ferret serum after
infection with H3N2 influenza A virus. Serum from two ferrets (Animals A and B) was
taken 6 days post-infection. Sera from infected ferrets and one uninfected control were
loaded on to ELISA plates coated with the ferret IFN- specific capture antibody-coated
and the samples were analyzed as indicated in Figure Appen.-4. Results represent the
means of triplicate samples.

204

205
Appendix-Figure 6: ELISPOT assay for the IFN- producing cells in mitogen-
stimulated ferret PBMCs. ELISPOT assay was performed in the same manner outlined
for Figure Appen.-4 for capture and detection. COS-7 cells were plated in serial dilution
and stimulated with PMA plus ionomycin for 18 hours and IFN-γ secreting cells were
detected by biotinylated capture antibody. The y-axis depicts the number of IFN- spot
forming cells per well; total cells per well are indicated on the x-axis. Data shown are the
average of triplicate samples.

206

207
4. Discussion
Experimental models that would allow the testing of effective treatments or
vaccines for infection by novel influenza A viruses are currently in high demand. Ferrets
have been used as an animal model of infection with influenza A viruses to test the
severity of the disease and also to evaluate efficacy of potential vaccines32
. IFN-
synthesis in vivo is a central regulator in host immune responses against viral infection.
In this study we describe the cloning of a full length cDNA for IFN- and expression of
the recombinant IFN- protein. Furthermore, we describe the generation of two
monoclonal antibodies specific for ferret IFN- and the subsequent development of
immunoassays for the detection of native IFN-γ. We anticipate that the IFN-γ
immunoassays established in this study will be useful in gaining insight into ferret
antiviral responses and in other immune processes in general. Previous studies on IFN-γ
have shown that there is a strict species-specific activity of IFN-γ. IFN- genes isolated
from diverse species such as guinea pig, turkey, rhino, and catfish have been previously
described in the literature33-37
. Since ferrets are susceptible to human viral diseases,
including influenza A virus 38
and SARS-coronavirus 30
, we expect that the availability of
the ferret IFN-γ assay system described in this study will greatly expand the utility of the
ferret infection model.
Unexpectedly, the monomeric form of IFN-γ (17kDa) was detectable at only low
levels in recombinant ferret IFN- samples. Instead, a dominant band at ~36 kDa was
consistently observed during Western blotting whereas a weak band at 65-70 kDa was
also observed in the same sample. Conversely, when native IFN- in mitogen-stimulated
PBMC culture supernatants were investigated with monoclonal antibodies, dominant

208
bands were identified at 65-70 kDa and the ~36 kDa band was barely detectable.
Oligomeric forms of IFN-γ were very stable aggregates, as treatment with reducing
reagents, guanidine or urea did not disrupt the IFN-γ into its monomeric form. Since the
IFN-γ dimer was also observed in supernatants from mitogen-stimulated ferret PBMC
cultures, it is unlikely that the dimerization is caused by the epitope tags present on the
recombinant protein. The recombinant IFN-γ dimer was found to have biological
function consistent with known IFN-γ activity 39
. Treatment of ferret PBMC cultures
with the dimerized recombinant IFN-γ increased the surface presentation of class II MHC,
suggesting that the recombinant ferret IFN- is able to maintain biological function in the
dimerized form. We observed, however, a IFN- specific band in Western blotting of
mitogen-stimulated PBMC culture supernatants at a molecular mass at 65 kDa. This
suggests that the probable form of ferret IFN- in vivo exists in tetrameric form rather
than a dimeric form. Our observation of recombinant ferret IFN- seems to contradict the
recent report on guinea pig IFN-γ in which recombinant IFN-γ was shown to exist
primarily as a monomer 40
. Recombinant guinea pig IFN- was expressed in bacteria,
and the purified protein was capable of stimulating the class II MHC expression in guinea
pig cells. It has been reported previously that human IFN-γ shows a dominant band at
approximately 65 kDa in immunoblotting and human IFN-γ specific receptors are shown
to be reactive with IFN-γ dimers 41
. Other groups have demonstrated that carbohydrate
modification alters the molecular nature of human IFN- 42
. Taken together, these
observations suggest that it is not unreasonable to find that ferret IFN-γ may exist in
monomeric, dimeric and oligomeric forms. Subtle variation in amino acid sequences
between two species may result in differences in post-translational modification by

209
glycosylation, which could result in differential association of monomers into oligomers.
Alternatively, the origin of cells secreting IFN-, such as CD8+ T cells or NK cells, may
determine the differences observed in IFN-γ oligomerization. The interaction between
ferret IFN-γ and its receptor under physiological conditions may be mediated by IFN-γ
dimerization or oligomerization. Whether or not dimerization is the mechanism of IFN-γ
activation in other species obviously requires further investigation.
Cloning and expression of biologically active ferret IFN-γ is critical in the
development of immunoassays such as ELISPOT and ELISAs for detection of interferon
production and interferon producing cells. These reagents will be invaluable in the
assessment of vaccine efficacy against influenza A and other emerging infectious viruses.

210
Reference List
1. Morens,D.M. & Fauci,A.S. The 1918 influenza pandemic: insights for the 21st
century. J. Infect. Dis. 195, 1018-1028 (2007).
2. Poland,G.A., Jacobson,R.M. & Targonski,P.V. Avian and pandemic influenza: An
overview. Vaccine (2007).
3. Thomas,J.K. & Noppenberger,J. Avian influenza: A review. Am. J. Health Syst.
Pharm. 64, 149-165 (2007).
4. Mills,C.E., Robins,J.M., Bergstrom,C.T. & Lipsitch,M. Pandemic influenza: risk of
multiple introductions and the need to prepare for them. PLoS. Med. 3, e135 (2006).
5. Muller,U. et al. Functional role of type I and type II interferons in antiviral defense.
Science 264, 1918-1921 (1994).
6. Huang,S. et al. Immune response in mice that lack the interferon-gamma receptor.
Science 259, 1742-1745 (1993).
7. Bouley,D.M., Kanangat,S., Wire,W. & Rouse,B.T. Characterization of herpes
simplex virus type-1 infection and herpetic stromal keratitis development in IFN-
gamma knockout mice. J. Immunol. 155, 3964-3971 (1995).
8. Muller,U. et al. Functional role of type I and type II interferons in antiviral defense.
Science 264, 1918-1921 (1994).
9. Whitmire,J.K., Tan,J.T. & Whitton,J.L. Interferon-gamma acts directly on CD8+ T
cells to increase their abundance during virus infection. J. Exp. Med. 201, 1053-
1059 (2005).
10. Steeg,P.S., Moore,R.N., Johnson,H.M. & Oppenheim,J.J. Regulation of murine
macrophage Ia antigen expression by a lymphokine with immune interferon
activity. J. Exp. Med. 156, 1780-1793 (1982).
11. Wadee,A.A., Kuschke,R.H. & Dooms,T.G. The inhibitory effects of
Mycobacterium tuberculosis on MHC class II expression by monocytes activated
with riminophenazines and phagocyte stimulants. Clin. Exp. Immunol. 100, 434-439
(1995).
12. Maudsley,D.J. & Morris,A.G. Regulation of IFN-gamma-induced host cell MHC
antigen expression by Kirsten MSV and MLV. II. Effects on class II antigen
expression. Immunology 67, 26-31 (1989).
13. Thomas,H.E., Parker,J.L., Schreiber,R.D. & Kay,T.W. IFN-gamma action on
pancreatic beta cells causes class I MHC upregulation but not diabetes. J. Clin.
Invest 102, 1249-1257 (1998).

211
14. Refaeli,Y., Van Parijs,L., Alexander,S.I. & Abbas,A.K. Interferon gamma is
required for activation-induced death of T lymphocytes. J. Exp. Med. 196, 999-
1005 (2002).
15. Maraskovsky,E., Chen,W.F. & Shortman,K. IL-2 and IFN-gamma are two
necessary lymphokines in the development of cytolytic T cells. J. Immunol. 143,
1210-1214 (1989).
16. Smith,P.M., Wolcott,R.M., Chervenak,R. & Jennings,S.R. Control of acute
cutaneous herpes simplex virus infection: T cell-mediated viral clearance is
dependent upon interferon-gamma (IFN-gamma). Virology 202, 76-88 (1994).
17. Bradley,L.M., Dalton,D.K. & Croft,M. A direct role for IFN-gamma in regulation
of Th1 cell development. J. Immunol. 157, 1350-1358 (1996).
18. Constant,S.L. & Bottomly,K. Induction of Th1 and Th2 CD4+ T cell responses: the
alternative approaches. Annu. Rev. Immunol. 15, 297-322 (1997).
19. Halford,W.P., Halford,K.J. & Pierce,A.T. Mathematical analysis demonstrates that
interferons-beta and -gamma interact in a multiplicative manner to disrupt herpes
simplex virus replication. J. Theor. Biol. 234, 439-454 (2005).
20. Karupiah,G., Fredrickson,T.N., Holmes,K.L., Khairallah,L.H. & Buller,R.M.
Importance of interferons in recovery from mousepox. J. Virol. 67, 4214-4226
(1993).
21. Katze,M.G., He,Y. & Gale,M., Jr. Viruses and interferon: a fight for supremacy.
Nat. Rev. Immunol. 2, 675-687 (2002).
22. Steed,A.L. et al. Gamma interferon blocks gammaherpesvirus reactivation from
latency. J. Virol. 80, 192-200 (2006).
23. Lee,S., Gierynska,M., Eo,S.K., Kuklin,N. & Rouse,B.T. Influence of DNA
encoding cytokines on systemic and mucosal immunity following genetic
vaccination against herpes simplex virus. Microbes. Infect. 5, 571-578 (2003).
24. Asanuma,H., Sharp,M., Maecker,H.T., Maino,V.C. & Arvin,A.M. Frequencies of
memory T cells specific for varicella-zoster virus, herpes simplex virus, and
cytomegalovirus by intracellular detection of cytokine expression. J. Infect. Dis.
181, 859-866 (2000).
25. Alarcon,J.B., Hartley,A.W., Harvey,N.G. & Mikszta,J.A. Preclinical evaluation of
microneedle technology for intradermal delivery of influenza vaccines. Clin.
Vaccine Immunol. 14, 375-381 (2007).
26. Ben Yedidia,T. & Arnon,R. Towards an epitope-based human vaccine for
influenza. Hum. Vaccin. 1, 95-101 (2005).

212
27. Giebink,G.S. Otitis media: the chinchilla model. Microb. Drug Resist. 5, 57-72
(1999).
28. Suguitan,A.L., Jr. et al. Live, attenuated influenza A H5N1 candidate vaccines
provide broad cross-protection in mice and ferrets. PLoS. Med. 3, e360 (2006).
29. Reid,A.H., Taubenberger,J.K. & Fanning,T.G. The 1918 Spanish influenza:
integrating history and biology. Microbes. Infect. 3, 81-87 (2001).
30. Roberts,A. & Subbarao,K. Animal models for SARS. Adv. Exp. Med. Biol. 581,
463-471 (2006).
31. Reid,A.H., Taubenberger,J.K. & Fanning,T.G. The 1918 Spanish influenza:
integrating history and biology. Microbes. Infect. 3, 81-87 (2001).
32. Suguitan,A.L., Jr. et al. Live, attenuated influenza A H5N1 candidate vaccines
provide broad cross-protection in mice and ferrets. PLoS. Med. 3, e360 (2006).
33. Jeevan,A. et al. Production and characterization of guinea pig recombinant gamma
interferon and its effect on macrophage activation. Infect. Immun. 74, 213-224
(2006).
34. Loa,C.C., Hsieh,M.K., Wu,C.C. & Lin,T.L. Molecular identification and
characterization of turkey IFN-gamma gene. Comp Biochem. Physiol B Biochem.
Mol. Biol. 130, 579-584 (2001).
35. Milev-Milovanovic,I. et al. Identification and expression analysis of interferon
gamma genes in channel catfish. Immunogenetics 58, 70-80 (2006).
36. Morar,D. et al. Cloning, sequencing and expression of white rhinoceros
(Ceratotherium simum) interferon-gamma (IFN-gamma) and the production of
rhinoceros IFN-gamma specific antibodies. Vet. Immunol. Immunopathol. 115, 146-
154 (2007).
37. Svitek,N. & von,M., V. Early cytokine mRNA expression profiles predict
Morbillivirus disease outcome in ferrets. Virology 362, 404-410 (2007).
38. Maher,J.A. & DeStefano,J. The ferret: an animal model to study influenza virus.
Lab Anim (NY) 33, 50-53 (2004).
39. Farrar,M.A. & Schreiber,R.D. The molecular cell biology of interferon-gamma and
its receptor. Annu. Rev. Immunol. 11, 571-611 (1993).
40. Jeevan,A. et al. Production and characterization of guinea pig recombinant gamma
interferon and its effect on macrophage activation. Infect. Immun. 74, 213-224
(2006).

213
41. Kudo,S. & Kawano,K. Association and dissociation properties of natural human
interferon gamma. J. Chromatogr. B Biomed. Sci. Appl. 723, 25-30 (1999).
42. Fukuta,K. et al. Remodeling of sugar chain structures of human interferon-gamma.
Glycobiology 10, 421-430 (2000).