early education and care pre and post assessment report
TRANSCRIPT

Early Care and Education
Pre- and Post-Assessment
Study
Early Care and Education Pre- and Post-
Assessment Report
Kristin Flanagan, Ph.D.
Ariela Greenberg, Ph.D.
AUGUST 2013


Early Care and Education
Pre- and Post-Assessment Study:
Early Care and Education
Pre- and Post-Assessment Report
August 2013
Kristin Flanagan, Ph.D.
Ariela Greenberg, Ph.D.
1000 Thomas Jefferson Street NW
Washington, DC 20007-3835
202.403.5000 | TTY 877.334.3499
www.air.org
Copyright © 2013 American Institutes for Research. All rights reserved.


Contents
Introduction ......................................................................................................................................1
Future Student Performance ............................................................................................................3
Florida’s High-Frequency Preschool Assessments ..........................................................................7
Galileo System for the Electronic Management of Learning (Galileo) .....................................9
Teaching Strategies Gold (TSGOLD) .....................................................................................12
Florida Voluntary Prekindergarten Assessment (VPK) ...........................................................15
Learning Accomplishment Profile, Third Edition (LAP-3) .....................................................18
Early Learning Accomplishment Profile (E-LAP) ..................................................................21
Summary ........................................................................................................................................24
References ......................................................................................................................................25
Appendixes
Appendix A. Concordance Tables .................................................................................... A-1
Appendix B. Alignment Tables ......................................................................................... B-1

Introduction
High-quality early childhood education (ECE) programs regard school readiness as a primary
goal—a notion underscored by the first National Education Goals Panel, which aimed for all
children in the United States to start school ready to learn by the year 2000 (Kagan, 1990). The
work of the Goals Panel ignited the idea to agree on measurable standards of school readiness,
against which children could be assessed, and that meeting such standards would predict future
academic success. These measurable standards of school readiness are still in development
across the nation, despite a great deal of theoretical and empirical work by both researchers and
practitioners (Lewit & Baker, 1995; National Research Council [NRC], 2008a). Although some
consensus in the field supports that ECE programs should focus on getting children ready to
learn as they enter formal schooling, the concept of readiness in early childhood has been
difficult to define and measure (Kagan, Moore, & Bredekamp, 1995; Meisels, 1999; NRC,
2008a; Shepard, Kagan, & Wurtz, 1998).
Regardless of the complicated nature of defining and assessing school readiness, the call for
readiness for kindergarten has expanded with the rapid growth of and financial investment in ECE
programs (Meisels, 2007). States have rapidly developed standards to define what children are
expected to know to be ready for kindergarten and later schooling (Council of Chief State School
Officers [CCSSO], 2010; Daily, Burkhauser, & Halle, 2010; Howard & Wiley, 2007; Scott-
Little, Lesko, Martella, & Milburn, 2007). Even with the development of early learning
standards, however, measuring and assessing children’s progress in alignment with these
standards remains a complicated undertaking (NRC, 2008a; CCSSO, 2010).
The purpose of Florida’s Pre-and Post-Assessment Study is three-fold:
1. Provide a statewide inventory of early care and education pre- and post-assessment
instruments currently used throughout the Early Learning Coalitions (ELCs), the
Redlands Christian Migrant Association (RCMA), the East Coast Migrant Head Start
(ECMHS), and Head Start grantees in Florida
2. Determine how the ELCs, RCMA, ECMHS, and Head Start grantees are using each pre-
and post-assessment tool
3. Determine whether assessment instruments currently in use produce data that can be
related to future student academic performance
The Summary of Initial Findings Report addresses the first two purposes. The report creates a
statewide inventory of the measures in use by Florida’s early care and education providers, as
reported by Florida’s ELCs, Head Start grantees, the RCMA, and the ECMHS. The report also
establishes information regarding how the ELCs, Head Start grantees, the RCMA, and the
ECMHS are using such measures. Finally, the Summary of Initial Findings Report presents
information about the alignment of the measures with Florida’s early learning standards for
children aged birth through 4 years old.
American Institutes for Research Pre- and Post-Assessment Report—1

This report addresses the third purpose by providing information about which preschool
assessments in use within Florida’s ELCs, Head Start grantees, the RCMA, and the ECMHS are
potentially related to future student performance. The findings presented in this report are
divided into two sections:
Future Student Performance. Results from an analysis of which preschool assessments
have the strongest content concordance with Florida Kindergarten Readiness Screener
(FLKRS)1 and the Word Recognition section of the Stanford Early School Achievement
Test (SESAT)
Florida’s Preschool Assessments. Results from an analysis of survey data gathered from
Florida’s ELCs, Head Start grantees, the RCMA, and the ECMHS to better understand
the individual assessments in use within the state
1 The FLKRS consists of a subset of the Early Childhood Observation System™ (ECHOS™) and the Florida
Assessments for Instruction in Reading–Kindergarten (FAIR-K).
American Institutes for Research Pre- and Post-Assessment Report—2

Future Student Performance
One methodology2 for determining which preschool assessment instruments produce data that
can be related to future student academic performance on the FLKRS is establishing an in-depth
content alignment. This alignment of preschool assessments and FLKRS to a common set of
standards quantifies the content of the assessments to more easily compare their composition.
Preschool assessments that dedicate similar allocations of items as the FLKRS can be expected
to be more highly related with future student performance, as measured by the FLKRS.
The following preschool assessments were identified, as part of this study’s statewide survey of
Florida’s ELCs, Head Start grantees, the RCMA, and the ECMHS, as being in use:
Battelle Developmental Inventory (BDI-2)
BRIGANCE Head Start Developmental Inventory (HSDI)
BRIGANCE Comprehensive Inventory of Basic Skills (CIBS)
Bracken Basic Concept Scale, Third Edition: Receptive (BBCS-3:R)
Child Observation Record (COR)
Creative Curriculum Developmental Continuum for Ages 3–53
Devereux Early Childhood Assessment (DECA)
Early Learning Accomplishment Profile (E-LAP)
Florida Voluntary Prekindergarten Assessment (VPK)
Galileo System for the Electronic Management of Learning (Galileo)
Learning Accomplishment Profile, Third Edition (LAP-3)
Preschool Language Scale, Fourth Edition (PLS-4)
Teaching Strategies Gold (TSGOLD)
Test of Preschool Early Literacy (TOPEL)
The table within Appendix A presents the relative allocation of items for each of the preschool
assessments and for the FLKRS. To determine allocation of items, the number of items within
each assessment was first mapped to each subdomain in the Florida Standards for 4-year-olds.
Next, the number of items was calculated as a percentage of all items on the assessment. It
should be noted that the total percentage of items can exceed 100 percent because any given item
could potentially map to multiple subdomains. For example, an item that relates to the construct
of children speaking with peers would align with standards about expressive language in the
language and literacy domain and with standards regarding peer interactions in the social-
2 An alternative methodology is the examination of student-level data, where the predictive ability of the preschool
assessment with the kindergarten assessments is examined with either simple correlations or more complex
multivariate, multilevel regression models. However, for this report, the student-level data was unavailable. 3 Creative Curriculum Developmental Continuum was replaced by the publisher with Teaching Strategies Gold
(TSGOLD). Therefore, TSGOLD was included in the analysis for the report, and Creative Curriculum
Developmental Continuum was not included.
American Institutes for Research Pre- and Post-Assessment Report—3
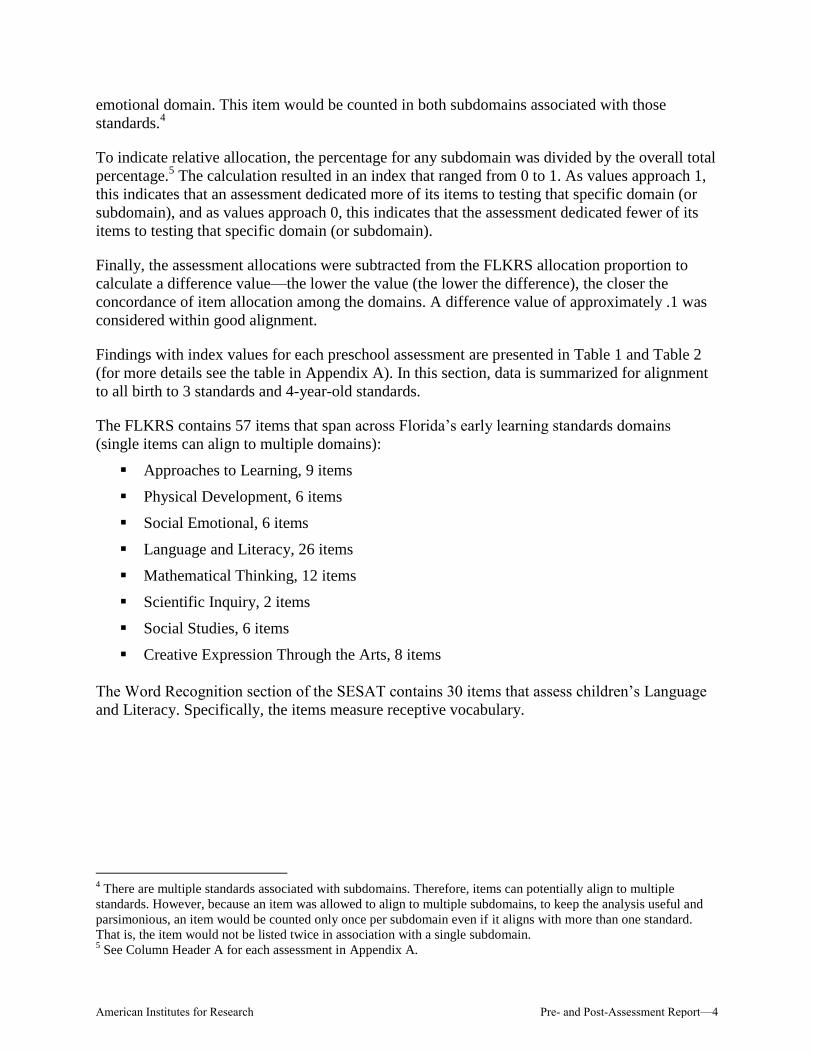
emotional domain. This item would be counted in both subdomains associated with those
standards.4
To indicate relative allocation, the percentage for any subdomain was divided by the overall total
percentage.5 The calculation resulted in an index that ranged from 0 to 1. As values approach 1,
this indicates that an assessment dedicated more of its items to testing that specific domain (or
subdomain), and as values approach 0, this indicates that the assessment dedicated fewer of its
items to testing that specific domain (or subdomain).
Finally, the assessment allocations were subtracted from the FLKRS allocation proportion to
calculate a difference value—the lower the value (the lower the difference), the closer the
concordance of item allocation among the domains. A difference value of approximately .1 was
considered within good alignment.
Findings with index values for each preschool assessment are presented in Table 1 and Table 2
(for more details see the table in Appendix A). In this section, data is summarized for alignment
to all birth to 3 standards and 4-year-old standards.
The FLKRS contains 57 items that span across Florida’s early learning standards domains
(single items can align to multiple domains):
Approaches to Learning, 9 items
Physical Development, 6 items
Social Emotional, 6 items
Language and Literacy, 26 items
Mathematical Thinking, 12 items
Scientific Inquiry, 2 items
Social Studies, 6 items
Creative Expression Through the Arts, 8 items
The Word Recognition section of the SESAT contains 30 items that assess children’s Language
and Literacy. Specifically, the items measure receptive vocabulary.
4 There are multiple standards associated with subdomains. Therefore, items can potentially align to multiple
standards. However, because an item was allowed to align to multiple subdomains, to keep the analysis useful and
parsimonious, an item would be counted only once per subdomain even if it aligns with more than one standard.
That is, the item would not be listed twice in association with a single subdomain. 5 See Column Header A for each assessment in Appendix A.
American Institutes for Research Pre- and Post-Assessment Report—4

Tab
le 1
. P
resc
hool
Ass
ess
men
ts:
All
oca
tion
of
Item
s b
y D
om
ain
Do
mai
n
Ass
essm
ents
BD
I-2
HS
DI
CIB
S
BB
CS
-3:R
C
OR
D
EC
A
E-L
AP
V
PK
G
alile
o
LA
P-3
P
LS
-4
TS
GO
LD
T
OP
EL
App
roac
hes
to L
earn
ing
0.
05
0.02
–
– 0.
11
0.18
0.
50
– 0.
09
0.01
–
0.07
–
Phy
sica
l Dev
elop
men
t 0.
46
0.22
0.
11
– 0.
11
– 0.
38
– 0.
19
0.54
–
0.12
–
Soc
ial E
mot
iona
l 0.
14
0.12
0.
13
– 0.
16
0.82
0.
13
– 0.
15
0.07
–
0.22
–
Lang
uage
and
Lite
racy
0.
25
0.43
0.
66
0.80
0.
42
– –
0.80
0.
22
0.22
0.
87
0.24
1.
00
Mat
hem
atic
al T
hink
ing
0.
05
0.09
0.
04
0.16
0.
04
– –
0.20
0.
13
0.07
0.
13
0.14
–
Sci
entif
ic In
quiry
0.
02
0.13
0.
06
0.04
0.
04
– –
– 0.
11
0.03
0.09
–
Soc
ial S
tudi
es
0.02
–
– –
0.04
–
– –
0.04
0.
01
– 0.
06
–
The
Art
s 0.
02
– –
– 0.
08
– –
– 0.
07
0.06
–
0.06
–
TO
TA
L
1.00
1.
00
1.00
1.
00
1.00
1.
00
1.00
1.
00
1.00
1.
00
1.00
1.
00
1.00
Tab
le 2
. K
ind
ergart
en A
sses
smen
ts:
All
oca
tion
of
Item
s b
y D
om
ain
Do
mai
n
Ass
essm
ent
FL
KR
S
SE
SA
T
App
roac
hes
to L
earn
ing
0.
12
0.00
Phy
sica
l Dev
elop
men
t 0.
08
0.00
Soc
ial E
mot
iona
l 0.
08
0.00
Lang
uage
and
Lite
racy
0.
35
1.00
Mat
hem
atic
al T
hink
ing
0.
16
0.00
Sci
entif
ic In
quiry
0.
03
0.00
Soc
ial S
tudi
es
0.08
0.
00
The
Art
s 0.
11
0.00
TO
TA
L
1.00
1.
00
American Institutes for Research Pre- and Post-Assessment Report—5

Preschool assessments that offer coverage across multiple domains include the BDI-2, HSDI,
CIBS, COR, Galileo, and TSGOLD. Assessments such as DECA have a focus on the social
emotional; VPK and the BBCS-3:R have a focus on language, literacy, and mathematics; and the
TOPEL has a focus on language and literacy. The E-LAP and the LAP-3 reflect multiple
domains; however, they appear to have a relatively high concentration of items relating to
physical development, compared to the FLKRS.
The more detailed table in Appendix A supports examination of allocation of items not only of
overall domains but also of content areas within domains (subdomains). For example, the 26
items on the FLKRS that align to the language and literacy domain represent listening and
understanding, vocabulary, sentences and structure, conversation, emergent reading, and
emergent writing. Therefore, the table supports analysis of assessments at the subdomain level.
Other preschool assessments in use within Florida, such as LAP-3, BDI-2, HSDI, and the CIBS,
may cover these subdomains of language and literacy similar to the FLKRS; however, the
FLKRS also has a portion of items allocated to approaches to learning (i.e., eagerness and
curiosity, persistence, creativity and inventiveness, and planning and reflection), whereas
measures such as the CIBS and the LAP-3 do not.
The majority of the preschool assessment in use in Florida contain some portion of items that
address Florida’s early learning standards for 4-year-olds in terms of language and literacy; the
two exceptions are the DECA and the E-LAP (the E-LAP measures language and literacy;
however is designed for children younger than 4-years-old). The Word Recognition section of
the SESAT is largely a measure of receptive vocabulary, as such preschool assessments such as
the BDI; BBCS-3:R; CIBS; HSDI; COR; VPK; Galileo; LAP-3; PLS-4; TOPEL; and TSGOLD
offer strong alignment in terms of word recognition (see Appendix A). However, in terms of
fielding these assessments, for the most part organizations responded that they tend to field the
entire assessment (Flanagan and Greenberg, 2013). Therefore, in terms of concordance with the
SESAT, the relevant item set or subscales within the aforementioned measures would offer the
strongest alignment to the SESAT.
Our alignment analysis results indicate that three preschool assessments currently in use within
Florida have high concordance of composition at both the domain and subdomain levels with the
FLKRS. These preschool assessments are Galileo, TSGOLD, and COR, where a lower
difference score (potential range is 0.00 to 1.00) means higher concordance: Galileo (.02 to .13);
TSGOLD (.02 to .14); and COR (.01 to .12).
American Institutes for Research Pre- and Post-Assessment Report—6

Florida’s High-Frequency Preschool Assessments
As Florida builds deeper understanding of the preschool assessments in use within the state, in
terms of assessment content and alignment to Florida’s early learning standards and concordance
with their kindergarten assessments, this section of the report provides information on ease of
use; frequency of use; and use of information from select assessments in use in the field.
This section further explores the survey data that were collected to establish which preschool
assessments were in use within Florida. Fourteen assessments were identified as being in use by
Florida’s ELCs, Head Start grantees, the RCMA, and the ECMHS (see Table 3).
Table 3. Number of ELCs, Head Start Grantees, RCMAs, and ECMHSs Reporting Use of
Each Assessment, Overall and by Respondent Type
Assessment Overall
Respondent Type
ELC Head Start RCMA ECMHS
Teaching Strategies Gold
(TSGOLD) 28 19 9 0 0
Florida Voluntary Prekindergarten Assessment
(VPK) 14 3 11 0 0
Learning Accomplishment Profile, Third Edition
(LAP-3) 13 8 3 1 1
Galileo System for the Electronic Management of Learning (Galileo)
11 0 11 0 0
Early Learning Accomplishment Profile
(E-LAP) 8 5 2 1 0
Creative Curriculum Developmental Continuum
for Ages 3–5 6 3 3 0 0
Devereux Early Childhood Assessment
(DECA) 5 1 4 0 0
Battelle Developmental Inventory
(BDI-2) 4 1 3 0 0
Child Observation Record
(COR) 2 1 0 1 0
Preschool Language Scale, Fourth Edition
(PLS-4) 2 0 2 0 0
Bracken Basic Concept Scale, Third Edition: Receptive
(BBCS-3:R) 1 1 0 0 0
BRIGANCE Comprehensive Inventory of Basic Skills
(CIBS) 1 0 1 0 0
BRIGANCE Head Start Developmental Inventory
(HSDI) 1 0 1 0 0
Test of Preschool Early Literacy
(TOPEL) 1 1 0 0 0
None 0 0 0 0 0
American Institutes for Research Pre- and Post-Assessment Report—7

The first report associated with this study, the Summary of Initial Findings Report, presents
information about the survey data in terms of organizations. The report provides information
regarding the preschool assessments in use and how organizations are using assessments overall
(across all organizations) and also by respondent type (i.e., ELC, Head Start grantees, RCMA,
ECMHS). With a slightly different lens than the first report, this report presents analysis with a
focus on the assessment. Specifically, in this section, we will present detailed information about
the use of the five most frequently used assessments—two of which demonstrate high content
concordance with the FLKRS (Galileo and TSGOLD). The five preschool assessments that we
present (indirect assessments and then direct assessments) include the following:
Galileo System for the Electronic Management of Learning (Galileo)
Teaching Strategies Gold (TSGOLD)
Florida Voluntary Prekindergarten Assessment (VPK)
Learning Accomplishment Profile, Third Edition (LAP-3)
Early Learning Accomplishment Profile (E-LAP)
Of the five most frequently reported assessments, three were indirect assessments (Galileo,
TSGOLD, and VPK), and two were direct assessments (LAP-3 and E-LAP). TSGOLD, LAP-3,
and E-LAP tended to be used by ELCs, whereas Galileo and the VPK tended to be used by Head
Start grantees. All five assessments had a majority of organizations responding that the
assessments were used to monitor children’s progress and to inform instruction and curricular
practices and were relatively easy to use.
American Institutes for Research Pre- and Post-Assessment Report—8

Galileo System for the Electronic Management of Learning (Galileo)
The Galileo has 483 items across 11 framework domains: cognition and general knowledge
(early mathematics, logic and reasoning, nature and science, social studies), language and
literacy, approaches to learning, creative arts, social and emotional development, physical
development and health (Flanagan & Greenberg, 2013). Galileo is completed by the classroom
educator for each child from one to a dozen or more times a year and is intended to measure
progress. In comparison to the state standards for all age groups, items on the Galileo cover all
the standards for scientific inquiry, arts, and 4-year-olds approaches to learning. Other domains
align at a rate of 9 percent to 92 percent, except for 3-year-olds social-emotional standards,
which do not align to any items (Flanagan & Greenberg, 2013).
Table 4 details the reported characteristics about Galileo usage. There were 11 organizations out
of 62 that reported using Galileo. Key findings include:
Galileo was reported as being used only by Head Start grantees. Florida’s ELCs,
RCMAs, and ECMHSs did not report using Galileo.
During a program year, Galileo was reported as being used with 4-year-olds.
In general, Galileo is administered to all of the children, and the entire assessment is used.
Approximately one-third of organizations reported that Galileo takes between 16 and 30
minutes; another one-third selected ‘other.’ The respondents that selected ‘other’ clarified
that Galileo does not have to be administered at once and that information can be entered
as the child’s behaviors or demonstration of skills are observed.
The majority of organizations find Galileo easy to use.
Head Start grantees reported three purposes for using Galileo: (1) to inform instructional
or curricular practices; (2) to monitor children’s progress; and (3) for program evaluation.
The majority of Head Start grantees that identified use of Galileo report that the
assessment is voluntarily used to monitor children’s progress.
American Institutes for Research Pre- and Post-Assessment Report—9

Table 4. Reported Characteristics of the Galileo System for the Electronic Management of
Learning (Galileo)
Characteristic Response
n Percent
11 100.0
Age group of children assessed
Younger than 1 year 2 18.2
1-year-olds 2 18.2
2-year-olds 3 27.3
3-year-olds 8 72.7
4-year-olds 11 100.0
5-year-olds 8 72.7
Older than 5 years 0 0.0
How often is assessment administered
Once 0 0.0
Twice 0 0.0
Three times 4 36.4
Four times 2 18.2
More than four times 1 9.1
Don’t know 0 0.0
Other 4 36.4
Children in the program assessed
All children in the program 9 81.8
Some of the children 2 18.2
Administer the entire assessment
Administer the entire assessment 5 45.5
Focus on subscales 2 18.2
Specific items from the assessment 1 9.1
Other 3 27.3
How long to complete per child
Less than 15 minutes 1 9.1
16–30 minutes 4 36.4
31–45 minutes 0 0.0
46–60 minutes 0 0.0
60+ minutes 0 0.0
Don’t know 2 18.2
Other 4 36.4
Ease of administration
Very easy 0 0.0
Easy 8 72.7
A bit difficult 1 9.1
Difficult 1 9.1
Very difficult 1 9.1
Don’t know 0 0.0
See notes at end of table.
American Institutes for Research Pre- and Post-Assessment Report—10
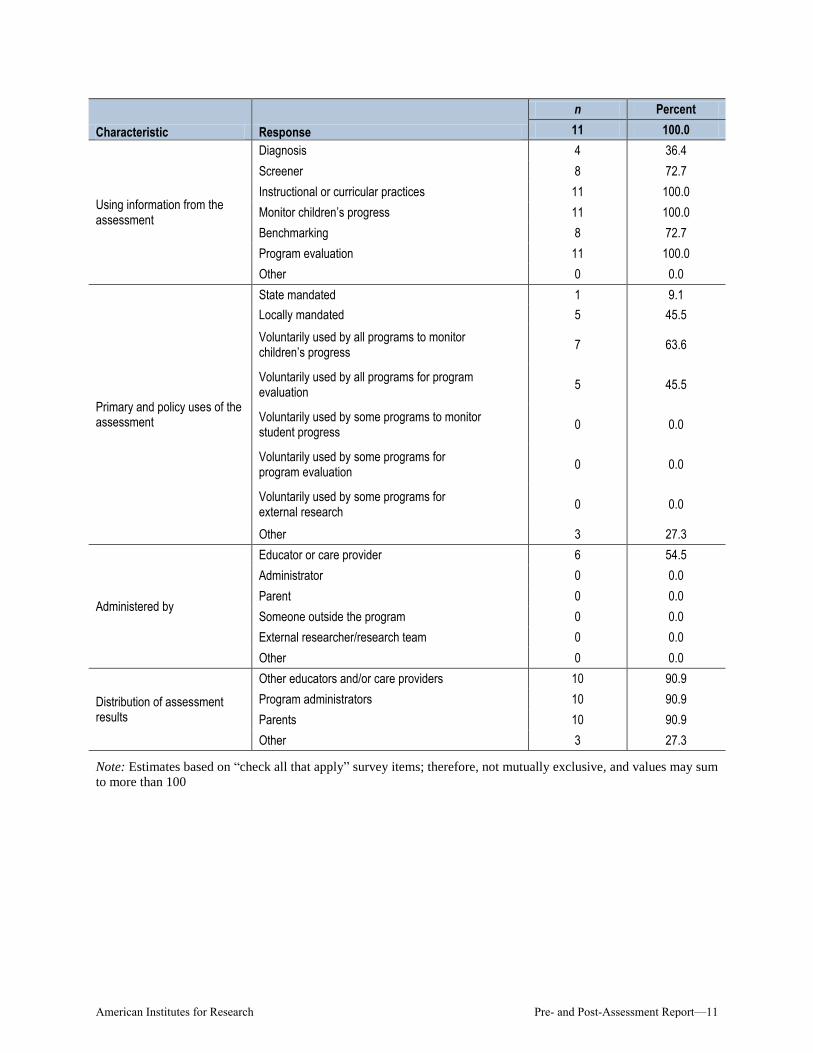
Characteristic Response
n Percent
11 100.0
Using information from the assessment
Diagnosis 4 36.4
Screener 8 72.7
Instructional or curricular practices 11 100.0
Monitor children’s progress 11 100.0
Benchmarking 8 72.7
Program evaluation 11 100.0
Other 0 0.0
Primary and policy uses of the assessment
State mandated 1 9.1
Locally mandated 5 45.5
Voluntarily used by all programs to monitor children’s progress
7 63.6
Voluntarily used by all programs for program evaluation
5 45.5
Voluntarily used by some programs to monitor student progress
0 0.0
Voluntarily used by some programs for program evaluation
0 0.0
Voluntarily used by some programs for external research
0 0.0
Other 3 27.3
Administered by
Educator or care provider 6 54.5
Administrator 0 0.0
Parent 0 0.0
Someone outside the program 0 0.0
External researcher/research team 0 0.0
Other 0 0.0
Distribution of assessment results
Other educators and/or care providers 10 90.9
Program administrators 10 90.9
Parents 10 90.9
Other 3 27.3
Note: Estimates based on “check all that apply” survey items; therefore, not mutually exclusive, and values may sum
to more than 100
American Institutes for Research Pre- and Post-Assessment Report—11

Teaching Strategies Gold (TSGOLD)
The TSGOLD has 51items that cover 38 objectives that span across several domains: social
emotional, physical, language, cognitive, literacy, mathematics, science and technology, arts, and
English language acquisition (Flanagan & Greenberg, 2013). TSGOLD is an indirect child
assessment, largely completed by the educator. TSGOLD items align to all of the ATL and
scientific inquiry standards and all of the 3-year-olds social-emotional, mathematics, and social
studies standards. TSGOLD items align to the other domains at a rate of 82 percent to 97 percent
(Flanagan & Greenberg, 2013).
Table 5 details the reported characteristics about TSGOLD. Twenty-eight organizations out of 62
reported using TSGOLD: 19 ELCs and 9 Head Start grantees. Key findings include:
All organizations that identified use of TSGOLD reported using the assessment with
3-year-olds and with 4-year-olds.
In general, TSGOLD is administered two to three times within the program year.
The majority of organizations find TSGOLD either easy or a bit difficult to use.
A high proportion of organizations that identified use of TSGOLD reported two purposes
for using the assessment: (1) to monitor children’s progress and/or (2) to inform
instructional or curricular practices.
A high proportion of organizations that identified use of TSGOLD reported that results
are shared with program administrators and/or parents.
American Institutes for Research Pre- and Post-Assessment Report—12
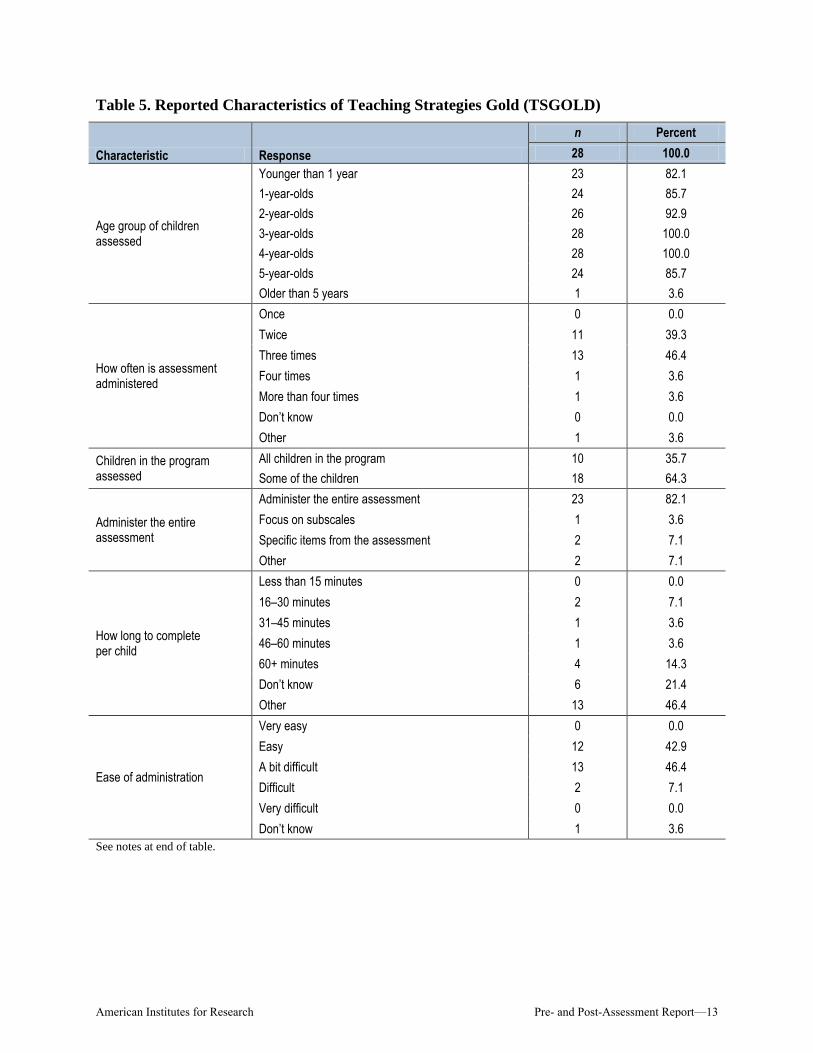
Table 5. Reported Characteristics of Teaching Strategies Gold (TSGOLD)
Characteristic Response
n Percent
28 100.0
Age group of children assessed
Younger than 1 year 23 82.1
1-year-olds 24 85.7
2-year-olds 26 92.9
3-year-olds 28 100.0
4-year-olds 28 100.0
5-year-olds 24 85.7
Older than 5 years 1 3.6
How often is assessment administered
Once 0 0.0
Twice 11 39.3
Three times 13 46.4
Four times 1 3.6
More than four times 1 3.6
Don’t know 0 0.0
Other 1 3.6
Children in the program assessed
All children in the program 10 35.7
Some of the children 18 64.3
Administer the entire assessment
Administer the entire assessment 23 82.1
Focus on subscales 1 3.6
Specific items from the assessment 2 7.1
Other 2 7.1
How long to complete per child
Less than 15 minutes 0 0.0
16–30 minutes 2 7.1
31–45 minutes 1 3.6
46–60 minutes 1 3.6
60+ minutes 4 14.3
Don’t know 6 21.4
Other 13 46.4
Ease of administration
Very easy 0 0.0
Easy 12 42.9
A bit difficult 13 46.4
Difficult 2 7.1
Very difficult 0 0.0
Don’t know 1 3.6
See notes at end of table.
American Institutes for Research Pre- and Post-Assessment Report—13

Characteristic Response
n Percent
28 100.0
Using information from the assessment
Diagnosis 7 25.0
Screener 7 25.0
Instructional or curricular practices 25 89.3
Monitor children’s progress 27 96.4
Benchmarking 19 67.9
Program evaluation 16 57.1
Other 1 3.6
Primary and policy uses of the assessment
State mandated 4 14.3
Locally mandated 3 10.7
Voluntarily used by all programs to monitor children’s progress
8 28.6
Voluntarily used by all programs for program evaluation
6 21.4
Voluntarily used by some programs to monitor student progress
15 53.6
Voluntarily used by some programs for program evaluation
3 10.7
Voluntarily used by some programs for external research
1 3.6
Other 6 21.4
Administered by
Educator or care provider 11 39.3
Administrator 0 0.0
Parent 0 0.0
Someone outside the program 0 0.0
External researcher/research team 0 0.0
Other 2 7.1
Distribution of assessment results
Other educators and/or care providers 19 67.9
Program administrators 27 96.4
Parents 23 82.1
Other 9 32.1
Note: Estimates based on “check all that apply” survey items; therefore, not mutually exclusive, and values may sum
to more than 100
American Institutes for Research Pre- and Post-Assessment Report—14
Florida Voluntary Prekindergarten Assessment (VPK)
The VPK is a direct child assessment, designed to be administered by the educator. The VPK has
61 items across four sections: print knowledge, phonological awareness, mathematics, and oral
language/vocabulary. In terms of correspondence to Florida’s standards for 4-year-olds, the VPK
covers subdomains at a rate of 23 percent for mathematics and 19 percent for language. Because
the VPK is focused on language and mathematics, it does not align to other Florida early
learning standards.
Table 6 details the reported characteristics about VPK. There were 14 organizations out of 62
that reported using VPK: 3 ELCs and 11 Head Start grantees. Key findings include:
All organizations that identified use of the VPK reported using the assessment with
4-year-olds.
Organizations that use the VPK reported administering it up to three times a year. In
general, the VPK is administered to some of the children (most likely, the 4-year-olds in
the programs), and the entire assessment is administered.
The majority of organizations reported that the VPK takes between 16 and 30 minutes.
The majority of organizations find the VPK either very easy or easy to use.
The majority of organizations use the VPK to monitor children’s progress.
All organizations that identified use of the VPK reported that the assessment is
state mandated.
American Institutes for Research Pre- and Post-Assessment Report—15

Table 6. Reported Characteristics of the Florida Voluntary Prekindergarten Assessment
(VPK)
Characteristic Response
n Percent
14 100.0
Age group of children assessed
Younger than 1 year 0 0.0
1-year-olds 0 0.0
2-year-olds 0 0.0
3-year-olds 2 14.3
4-year-olds 14 100.0
5-year-olds 6 42.9
Older than 5 years 0 0.0
How often is assessment administered
Once 0 0.0
Twice 4 28.6
Three times 9 64.3
Four times 0 0.0
More than four times 0 0.0
Don’t know 0 0.0
Other 1 7.1
Children in the program assessed
All children in the program 3 21.4
Some of the children 11 78.6
Administer the entire assessment
Administer the entire assessment 14 100.0
Focus on subscales 0 0.0
Specific items from the assessment 0 0.0
Other 0 0.0
How long to complete per child
Less than 15 minutes 2 14.3
16–30 minutes 7 50.0
31–45 minutes 1 7.1
46–60 minutes 1 7.1
60+ minutes 0 0.0
Don’t know 3 21.4
Other 0 0.0
Ease of administration
Very easy 4 28.6
Easy 4 28.6
A bit difficult 3 21.4
Difficult 1 7.1
Very difficult 0 0.0
Don’t know 2 14.3
See notes at end of table.
American Institutes for Research Pre- and Post-Assessment Report—16

Characteristic Response
n Percent
14 100.0
Using information from the assessment
Diagnosis 4 28.6
Screener 0 0.0
Instructional or curricular practices 9 64.3
Monitor children’s progress 13 92.9
Benchmarking 10 71.4
Program evaluation 9 64.3
Other 3 21.4
Primary and policy uses of the assessment
State mandated 14 100.0
Locally mandated 0 0.0
Voluntarily used by all programs to monitor children’s progress
1 7.1
Voluntarily used by all programs for program evaluation
1 7.1
Voluntarily used by some programs to monitor student progress
0 0.0
Voluntarily used by some programs for program evaluation
0 0.0
Voluntarily used by some programs for external research
0 0.0
Other 0 0.0
Administered by
Educator or care provider 10 71.4
Administrator 1 7.1
Parent 0 0.0
Someone outside the program 2 14.3
External researcher/research team 0 0.0
Other 0 0.0
Distribution of assessment results
Other educators and/or care providers 7 50.0
Program administrators 13 92.9
Parents 10 71.4
Other 3 21.4
Note: Estimates based on “check all that apply” survey items; therefore, not mutually exclusive, and values may sum
to more than 100
American Institutes for Research Pre- and Post-Assessment Report—17

Learning Accomplishment Profile, Third Edition (LAP-3)
The LAP-3 has 383 items across seven sections: gross motor, fine motor, prewriting, cognitive,
language, self-help, and personal/social domains of development (Flanagan & Greenberg, 2013).
The LAP-3 is a direct child assessment. Similar to the E-LAP, items are administered using basal
ceiling rules; therefore, not all children receive all items—they receive only those items that are
most appropriate for their ability levels. LAP-3 items align to only one ATL standard for each of
the birth to 3-year-olds and 4-year-olds standards. Other domains are covered at a rate of 33
percent to 86 percent, and no domain is fully aligned (Flanagan & Greenberg, 2013).
Table 7 details the reported characteristics about LAP-3. There were 13 organizations out of 62
that reported using LAP-3: 8 ELCs, 3 Head Start grantees, 1 RCMA, and 1 ECMHS. Key
findings include:
All organizations that identified use of LAP-3 reported using the assessment with 3-year-
olds; 92 percent reported using the assessment with 4-year-olds; and 77 percent reported
using the assessment with 5-year-olds.
In general, LAP-3 is administered to two to three times within the program year.
The majority of organizations reported the LAP-3 takes approximately an hour
to administer.
The majority of organizations find the LAP-3 easy or a bit difficult to use.
All organizations that identified use of LAP-3 reported that the assessment is used to
inform instructional or curricular practices.
The majority of organizations that identified use of LAP-3 report that the assessment is
voluntarily used by all programs to monitor children’s progress.
American Institutes for Research Pre- and Post-Assessment Report—18

Table 7. Reported Characteristics of the Learning Accomplishment Profile, Third Edition
(LAP-3)
Characteristic Response
n Percent
13 100.0
Age group of children assessed
Younger than 1 year 1 7.7
1-year-olds 1 7.7
2-year-olds 2 15.4
3-year-olds 13 100.0
4-year-olds 12 92.3
5-year-olds 10 76.9
Older than 5 years 1 7.7
How often is assessment administered
Once 1 7.7
Twice 5 38.5
Three times 4 30.8
Four times 0 0.0
More than four times 1 7.7
Don’t know 2 15.4
Other 0 0.0
Children in the program assessed
All children in the program 6 46.2
Some of the children 7 53.8
Administer the entire assessment
Administer the entire assessment 12 92.3
Focus on subscales 1 7.7
Specific items from the assessment 0 0.0
Other 0 0.0
How long to complete per child
Less than 15 minutes 0 0.0
16–30 minutes 1 7.7
31–45 minutes 2 15.4
46–60 minutes 1 7.7
60+ minutes 8 61.5
Don’t know 0 0.0
Other 1 7.7
Ease of administration
Very easy 0 0.0
Easy 7 53.8
A bit difficult 5 38.5
Difficult 1 7.7
Very difficult 0 0.0
Don’t know 0 0.0
See notes at end of table.
American Institutes for Research Pre- and Post-Assessment Report—19

Characteristic Response
n Percent
13 100
Using information from the assessment
Diagnosis 3 23.1
Screener 3 23.1
Instructional or curricular practices 13 100.0
Monitor children’s progress 11 84.6
Benchmarking 4 30.8
Program evaluation 6 46.2
Other 2 15.4
Primary and policy uses of the assessment
State mandated 1 7.7
Locally mandated 4 30.8
Voluntarily used by all programs to monitor children’s progress
8 61.5
Voluntarily used by all programs for program evaluation
3 23.1
Voluntarily used by some programs to monitor student progress
2 15.4
Voluntarily used by some programs for program evaluation
1 7.7
Voluntarily used by some programs for external research
0 0.0
Other 2 15.4
Administered by
Educator or care provider 7 53.8
Administrator 0 0.0
Parent 0 0.0
Someone outside the program 3 23.1
External researcher/research team 0 0.0
Other 2 15.4
Distribution of assessment results
Other educators and/or care providers 9 69.2
Program administrators 12 92.3
Parents 13 100.0
Other 6 46.2
Note: Estimates based on “check all that apply” survey items; therefore, not mutually exclusive, and values may sum
to more than 100
American Institutes for Research Pre- and Post-Assessment Report—20

Early Learning Accomplishment Profile (E-LAP)
The E-LAP has 141 items and focuses on gross motor, fine motor, cognition, language, self-help,
and social emotional. The E-LAP is a direct child assessment. Items are administered using basal
ceiling rules; therefore, not all children receive all items—they receive only those items that are
most appropriate for their ability levels. The E-LAP focuses on young children, birth through age 3;
and, as such, items cover the birth-through-3 standards at a rate of 53 to 92 percent (Flanagan &
Greenberg, 2013).
Table 8 details the reported characteristics about E-LAP. There were 8 organizations out of 62
that reported using E-LAP: 5 ELCs, 2 Head Start grantees, and the RCMA. Key findings include:
The majority of organizations (88 percent) reported using the E-LAP with children
younger than 2 years old.
In general, E-LAP is administered once or twice within the program year.
In general, the E-LAP is administered to some of the children in a program, and the entire
assessment is administered.
The E-LAP is reported to take between 31 and 60 minutes.
The majority of organizations that report use of the E-LAP find it easy to use.
All organizations that identified use of the E-LAP report that the assessment informs
instructional or curricular practices.
All organizations that identified use of the E-LAP report that the results are shared
with parents.
American Institutes for Research Pre- and Post-Assessment Report—21

Table 8. Reported Characteristics of the Early Learning Accomplishment Profile (E-LAP)
Characteristic Response
n Percent
8 100.0
Age group of children assessed
Younger than 1 year 7 87.5
1-year-olds 7 87.5
2-year-olds 7 87.5
3-year-olds 0 0.0
4-year-olds 1 12.5
5-year-olds 1 12.5
Older than 5 years 0 0.0
How often is assessment administered
Once 0 0.0
Twice 3 37.5
Three times 1 12.5
Four times 1 12.5
More than four times 1 12.5
Don’t know 2 25.0
Other 0 0.0
Children in the program assessed
All children in the program 1 12.5
Some of the children 7 87.5
Administer the entire assessment
Administer the entire assessment 7 87.5
Focus on subscales 1 12.5
Specific items from the assessment 0 0.0
Other 0 0.0
How long to complete per child
Less than 15 minutes 0 0.0
16–30 minutes 0 0.0
31–45 minutes 2 25.0
46–60 minutes 3 37.5
60+ minutes 2 25.0
Don’t know 0 0.0
Other 1 12.5
Ease of administration
Very easy 0 0.0
Easy 5 62.5
A bit difficult 2 25.0
Difficult 1 12.5
Very difficult 0 0.0
Don’t know 0 0.0
See notes at end of table.
American Institutes for Research Pre- and Post-Assessment Report—22

Characteristic Response
n Percent
8 100.0
Using information from the assessment
Diagnosis 3 37.5
Screener 2 25.0
Instructional or curricular practices 8 100.0
Monitor children’s progress 7 87.5
Benchmarking 1 12.5
Program evaluation 4 50.0
Other 0 0.0
Primary and policy uses of the assessment
State mandated 1 12.5
Locally mandated 1 12.5
Voluntarily used by all programs to monitor children’s progress
4 50.0
Voluntarily used by all programs for program evaluation
1 12.5
Voluntarily used by some programs to monitor student progress
2 25.0
Voluntarily used by some programs for program evaluation
1 12.5
Voluntarily used by some programs for external research
1 12.5
Other 3 37.5
Administered by
Educator or care provider 2 25.0
Administrator 1 12.5
Parent 1 12.5
Someone outside the program 2 25.0
External researcher/research team 0 0.0
Other 1 12.5
Distribution of assessment results
Other educators and/or care providers 4 50.0
Program administrators 7 87.5
Parents 8 100.0
Other 5 62.5
Note: Estimates based on “check all that apply” survey items; therefore, not mutually exclusive, and values may sum
to more than 100
American Institutes for Research Pre- and Post-Assessment Report—23

Summary
Early childhood assessments can be used for a number of purposes, from providing information
about the developmental status of children to informing educators of the progress children make
over time. Implementation of an early childhood assessment should be strongly guided by the
purpose of the assessment and the desired use of the assessment information. In this study, we
identified several assessments as being in use by Florida’s ELCs, Head Start grantees, the
RCMA, and the ECMHS; some of the assessments are strongly aligned to Florida’s early
learning standards.
Assessments currently and frequently in use, such as the Galileo, TSGOLD, E-LAP, and LAP-3,
demonstrate strong alignment across Florida’s early learning standards. Florida’s VPK
assessment focuses on language and mathematics, and, as such, this assessment aligns with
Florida’s language and mathematics early learning standards.
In addition to assessing children as part of their experiences leading up to kindergarten, during
the kindergarten year, Florida fields the FLKRS and the SESAT. The FLKRS includes items that
align to Florida’s early learning standards, including the following domains: approaches to
learning, physical development, social emotional, language and literacy, mathematical thinking,
scientific inquiry, social studies, and the arts. The SESAT, Word Recognition section aligns to
Florida’s early learning standards for vocabulary in the language and literacy domain. Of the
preschool assessments reported as currently in use by Florida’s ELCs, Head Start grantees, the
RCMA, and the ECMHS, the majority offer content alignment with the SESAT, Word
Recognition section; however three assessments demonstrate high concordance with the FLKRS:
Galileo, TSGOLD, and COR.
Ongoing assessments provide information about children’s growth and progress over time.
Information from the assessments support educators in planning and tailoring opportunities for
learning and support understanding of progress children make across a program year. The
content of ongoing assessments should, therefore, reflect the multiple domains of the developing
young child (NRC, 2008b). Florida’s early learning standards reflect such multiple domains,
including children’s physical development; approaches to learning; social and emotional
development; language, communication, and emergent literacy; and cognitive development and
general knowledge (including mathematics, science, social studies, and the arts).
The goal of developing or selecting the most appropriate measure for statewide use is
complicated and must be made using the most extensive and reliable information. Ideally, the
appropriate assessment captures information regarding the full variation of children’s knowledge
and skills; includes items of varying difficulty and complexity; and, when used over time, detects
acquisition of knowledge and skills. In selecting an ongoing assessment measure, the assessment
also should demonstrate strong psychometric properties with high content, construct, and
criterion validity, helping to ensure that the assessment is providing information about the child’s
developing knowledge and skills in a valid and reliable manner.
American Institutes for Research Pre- and Post-Assessment Report—24

References
Council of Chief State School Officers. (2010). State early childhood standards and
assessments: Five years of development (Report of 2008 Survey by the Early Childhood
State Collaborative on Assessment and Student Standards). Washington, DC: Author.
Daily, S., Burkhauser, M., & Halle, T. (2010). A review of school readiness practices in the
states: Early learning guidelines and assessments. Child Trends: Early Childhood
Highlights, 1(3), 1–12. Retrieved from http://www.childtrends.org/Files/Child_Trends-
2010_06_18_ECH_SchoolReadiness.pdf
Flanagan, K. & Greenberg, A. (2013). Early care and education pre- and post-assessment study:
Summary of initial findings report. Washington, DC: American Institutes for Research.
Graue, E. (2006). The answer is readiness—Now what is the question? Early Childhood
Education and Development, 17(1), 43–56.
Howard, E., & Wiley, M. (2007). State standards and accountability in Illinois, Michigan, and
Wisconsin. Children and Social Policy, 1, 1.
Kagan, S. L., Moore, E., & Bredekamp, S. (1995). Reconsidering children’s early development
and learning: Toward common views and vocabulary. Washington, DC: National
Education Goals Panel.
Kagan, S. L. (1990). Readiness 2000: Rethinking rhetoric and responsibility. Phi Delta Kappan,
72, 272–279.
Lewit, E. M., & Baker, L. S. (1995). School readiness. The Future of Children, 5(2), 128–39.
Meisels, S. J. (1999). Assessing readiness. In R. C. Pianta & M. M. Cox (Eds.), The transition to
kindergarten (pp. 39–66). Baltimore: Paul H. Brookes.
Meisels, S. J. (2007). Accountability in early childhood: No easy answers. In R. C. Pianta, M. J.
Cox, & K. L. Snow (Eds.), School readiness and the transition to kindergarten in the era
of accountability (pp. 31–47). Baltimore: Paul H. Brookes.
National Research Council. (2008a). Judging the quality and utility of assessments. In C. Snow
& V. Hemel (Eds.), Early childhood assessment: Why, what and how (pp. 181–231).
Washington, DC: National Academies Press.
National Research Council. (2008b). Early childhood Assessment: Why, what, and how.
Committee on Developmental Outcomes and Assessments for Young Children, C.E.
Snow & S.B. Van Hemel, Editors. Board on Children, Youth, and Families, Board on
Testing and Assessment, Division of Behavioral and Social Sciences and Education.
Washington, DC: The National Academies Press.
American Institutes for Research Pre- and Post-Assessment Report—25

Scott-Little, C., Lesko, J., Martella, J., & Milburn, P. (2007). Early learning standards: Results
from a national survey to document trends in state-level policies and practices. Early
Childhood Research Quarterly, 21(2), 1–22.
Shepard, L., Kagan, S. L., & Wurtz, C. (1998). Principles and recommendations for early
childhood assessments. Goal 1 Early Childhood Assessments Resource Group.
Washington, DC: National Education Goals Panel.
American Institutes for Research Pre- and Post-Assessment Report—26