early economic return on higher education investment
TRANSCRIPT

KY Council on Postsecondary Education 1
Early Economic Return on Higher Education InvestmentEvidence from the Kentucky High School Class of 2011
2021
KY Council on Postsecondary Education2
About the Council on Postsecondary Education
The Council on Postsecondary Education is Kentucky’s higher education coordinating agency committed to strengthening our workforce, economy and quality of life. We do this by guiding the continuous improvement and efficient operation of a high-quality, diverse, and accessible system of postsecondary education.
Key responsibilities include:
• developing and implementing a strategic agenda for postsecondary education that includes measures of progress.
• producing and submitting a biennial budget request for adequate public funding of postsecondary education.
• determining tuition rates and admission criteria at public postsecondary institutions.• collecting and distributing data about postsecondary education performance.• ensuring the coordination and connectivity of technology among public institutions.• licensing non-public postsecondary institutions to operate in the Commonwealth.

KY Council on Postsecondary Education 3
FROM THE PRESIDENT............................................................................................................................................ 4
EXECUTIVE SUMMARY............................................................................................................................................ 5
COHORT PROFILE.................................................................................................................................................... 6
COST OF COLLEGE
Figure 1. Median COA, Grants/Scholarships & Net Cost .......................................................................................... 9 Figure 2. Median COA, Grants/Scholarships & Net Cost by Income.......................................................................... 10Figure 3. Median COA, Grants/Scholarships & Net Cost by Discipline and Credential ............................................. 11
BORROWER PROFILE............................................................................................................................................. 12
STUDENT LOAN DEBT
Figure 4. Median Loan Amount by Income and Credential Level............................................................................... 13Figure 5. Median Loan Amount by Discipline and Credential Level........................................................................... 14Figure 6. Maximum Monthly Student Loan Payment by Credential Level................................................................. 15Figure 7. Maximum Monthly Student Loan Payment by Discipline and Credential Level.......................................... 16
EARNINGS
Figure 8. Median Earnings from 2011-19 by Credential Level............................................................................. 17Figure 9. Median Earnings from 2011-19 for Bachelor’s Degree Graduates............................................................ 18Figure 10. Median Entry-Level Earnings by Income and Credential Level............................................................... 19Figure 11. Median Entry-Level Earnings by Discipline and Credential Level............................................................ 20
DEBT-TO-INCOME RATIO
Figure 12. Median Debt-to-Income Ratio by Credential Level................................................................................... 21Figure 13. Median Debt-to-Income Ratio by Income Status...................................................................................... 22Figure 14. Median Debt-to-Income Ratio by Discipline at the Bachelor’s Degree Level........................................... 23
ECONOMIC MOBILITY
Figure 15. Percent of the Cohort at Each Income Percentile by Credential Level in 2019........................................ 24Figure 16. Percent of Cohort Above the 50th Income Percentile in 2019, by Income and Credential Level............. 25
TECHNICAL NOTES................................................................................................................................................. 26
TABLE OF CONTENTS
KY Council on Postsecondary Education4
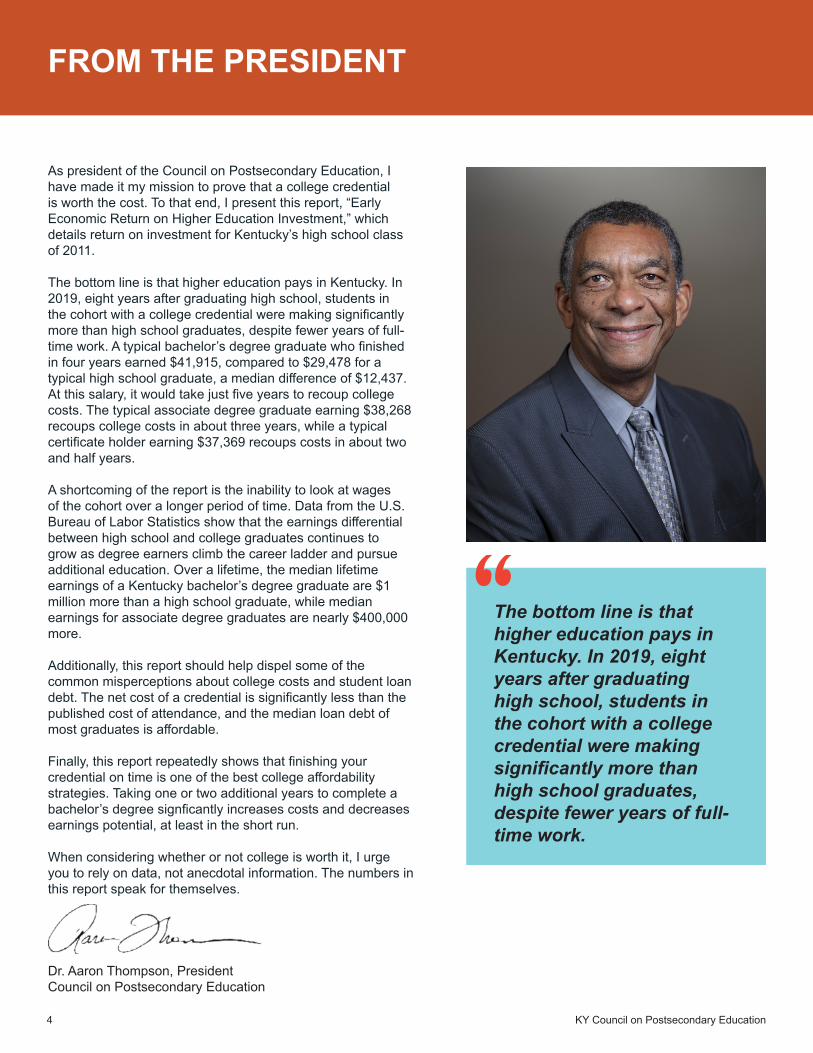
As president of the Council on Postsecondary Education, I have made it my mission to prove that a college credential is worth the cost. To that end, I present this report, “Early Economic Return on Higher Education Investment,” which details return on investment for Kentucky’s high school class of 2011.
The bottom line is that higher education pays in Kentucky. In 2019, eight years after graduating high school, students in the cohort with a college credential were making significantly more than high school graduates, despite fewer years of full-time work. A typical bachelor’s degree graduate who finished in four years earned $41,915, compared to $29,478 for a typical high school graduate, a median difference of $12,437. At this salary, it would take just five years to recoup college costs. The typical associate degree graduate earning $38,268 recoups college costs in about three years, while a typical certificate holder earning $37,369 recoups costs in about two and half years.
A shortcoming of the report is the inability to look at wages of the cohort over a longer period of time. Data from the U.S. Bureau of Labor Statistics show that the earnings differential between high school and college graduates continues to grow as degree earners climb the career ladder and pursue additional education. Over a lifetime, the median lifetime earnings of a Kentucky bachelor’s degree graduate are $1 million more than a high school graduate, while median earnings for associate degree graduates are nearly $400,000 more.
Additionally, this report should help dispel some of the common misperceptions about college costs and student loan debt. The net cost of a credential is significantly less than the published cost of attendance, and the median loan debt of most graduates is affordable.
Finally, this report repeatedly shows that finishing your credential on time is one of the best college affordability strategies. Taking one or two additional years to complete a bachelor’s degree signficantly increases costs and decreases earnings potential, at least in the short run.
When considering whether or not college is worth it, I urge you to rely on data, not anecdotal information. The numbers in this report speak for themselves.
FROM THE PRESIDENT
Dr. Aaron Thompson, PresidentCouncil on Postsecondary Education
The bottom line is that higher education pays in Kentucky. In 2019, eight years after graduating high school, students in the cohort with a college credential were making significantly more than high school graduates, despite fewer years of full-time work.

KY Council on Postsecondary Education 5
EXECUTIVE SUMMARY
While 73.6% of students in the cohort enrolled in college either in-state or out-of-state by 2019, only 36.2% had completed a postsecondary credential.
A college’s published cost of attendance includes both direct costs like tuition and fees as well as indirect costs like room and board. Due to financial aid, students paid a fraction of the total cost of attendance.The median net cost was $21,063 for a certificate/diploma, $25,778 for an associate degree and $59,800 for a bachelor’s degree completed in four years. Taking longer to complete raised net cost considerably.
The amount of grants and scholarships awarded to a typical student covered 28% of the total cost of attendance of a certificate/diploma, 30% of an associate degree, and 34% of a four-year bachelor’s degree. This percentage fell to 21% for a five-year bachelor’s degree and 19% for a six-year degree.
Typical borrowers had a total loan balance of $8,595 for a certificate/diploma, $8,309 for an associate degree, $25,421 for a four-year bachelor’s degree, $32,058 for a five-year bachelor’s degree, and $33,688 for a six-year bachelor’s degree. The corresponding monthly loan
After eight years of being in the workforce, high school graduates earned a median annual salary of $29,478. By comparison, in 2019, certificate/diploma holders earned $37,369, associate degree holders earned $38,268, and on-time bachelor’s degree holders earned $41,915 with fewer years of full-time work experience.
This report tracks 43,655 Kentucky students from their high school graduation in 2011 to 2019, the most recent year of data available. Key findings include:
payments were around $90 for a certificate/diploma and associate degree, $267 for a four-year bachelor’s degree, $337 for a five-year bachelor’s degree, and $352 for a six-year bachelor’s degree.
Debt-to-income ratio is a methodology used to determine if loan debt is reasonably affordable. To calculate this ratio, a student’s total loan debt is divided by annual entry-level earnings. Amounts less than one indicate a reasonable level of debt, while amounts exceeding one suggest a risk of default, at least initially. The median debt-to-income ratio was 0.43 for a certificate/diploma graduate, 0.33 for an associate graduate, 0.90 for a four-year bachelor’s graduate, 1.15 for a five-year bachelor’s graduate, and 1.28 for a six-year bachelor’s graduate.
About a third (36.2%) of the high school class of 2011 completed a college credential by 2019.
The median out-of-pocket cost for a public postsecondary credential was much lower than the published cost of attendance.
Financial aid covered 28% to 34% of total cost of attendance for on-time graduates.
Just over half (52.9%) of college goers in the cohort borrowed student loans to finance their education.
In 2019, college graduates in the cohort earned substantially more than high school graduates at all credential levels.
For students graduating on time, median loan debts were reasonable.
Nearly 44% of four-year bachelor’s degree graduates were in the 75th percentile of Kentucky earners in 2019, compared to only 21.4% of high school graduates.
Overall, economic standing improved with each successive level of education. Just as college graduates in the cohort were more likely to be earning at the highest income percentiles, they were much less likely to be making below $20,000 a year (below the 25th percentile).
KY Council on Postsecondary Education6
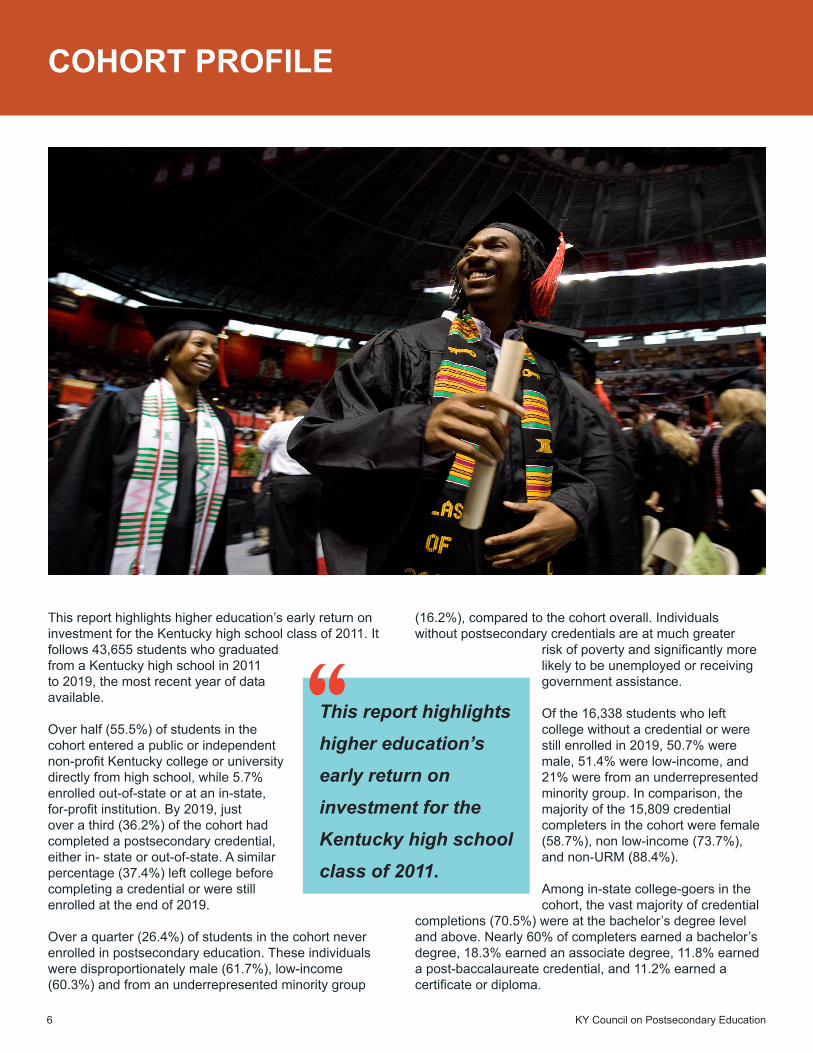
This report highlights higher education’s early return on investment for the Kentucky high school class of 2011. It follows 43,655 students who graduated from a Kentucky high school in 2011 to 2019, the most recent year of data available.
Over half (55.5%) of students in the cohort entered a public or independent non-profit Kentucky college or university directly from high school, while 5.7% enrolled out-of-state or at an in-state, for-profit institution. By 2019, just over a third (36.2%) of the cohort had completed a postsecondary credential, either in- state or out-of-state. A similar percentage (37.4%) left college before completing a credential or were still enrolled at the end of 2019.
Over a quarter (26.4%) of students in the cohort never enrolled in postsecondary education. These individuals were disproportionately male (61.7%), low-income (60.3%) and from an underrepresented minority group
(16.2%), compared to the cohort overall. Individuals without postsecondary credentials are at much greater
risk of poverty and significantly more likely to be unemployed or receiving government assistance.
Of the 16,338 students who left college without a credential or were still enrolled in 2019, 50.7% were male, 51.4% were low-income, and 21% were from an underrepresented minority group. In comparison, the majority of the 15,809 credential completers in the cohort were female (58.7%), non low-income (73.7%), and non-URM (88.4%).
Among in-state college-goers in the cohort, the vast majority of credential
completions (70.5%) were at the bachelor’s degree level and above. Nearly 60% of completers earned a bachelor’s degree, 18.3% earned an associate degree, 11.8% earned a post-baccalaureate credential, and 11.2% earned a certificate or diploma.
This report highlights higher education’s early return on investment for the Kentucky high school class of 2011.
COHORT PROFILE

KY Council on Postsecondary Education 7
KENTUCKY'S HIGH SCHOOL GRADUATING CLASS OF 2011
CLASS SIZE:
18.8English: 18.1Math: 18.5Reading: 19.1Science: 19.0
ATTENDED COLLEGE DIRECTLY FROM HIGH SCHOOL (IN-STATE & OUT-OF-STATE, NON-PROFIT & FOR-PROFIT)
(60.9%)
43,655
AVERAGE H.S. GPA:
2.84
AVERAGE ACT:
26,570
ATTENDED KY PUBLIC OR INDEPENDENT COLLEGE:
24,249(55.5%)
26.4%
37.4% 36.2%
No College Some College College Credential
Education Level in Academic Year 2018-19
COMPLETED A CREDENTIAL:
15,809(36.2%)
80.6%
9.6%5.6%
4.2%
Race/Ethnicity
White Black Latinx Other
46%
54%
Locale
Rural Urban
50.2%49.8%
Gender
Male Female
44.7%
55.3%
Income
Low-Income Non Low-Income
Source: Kentucky Longitudinal Data System
KY Council on Postsecondary Education8
KENTUCKY'S HIGH SCHOOL GRADUATING CLASS OF 2011
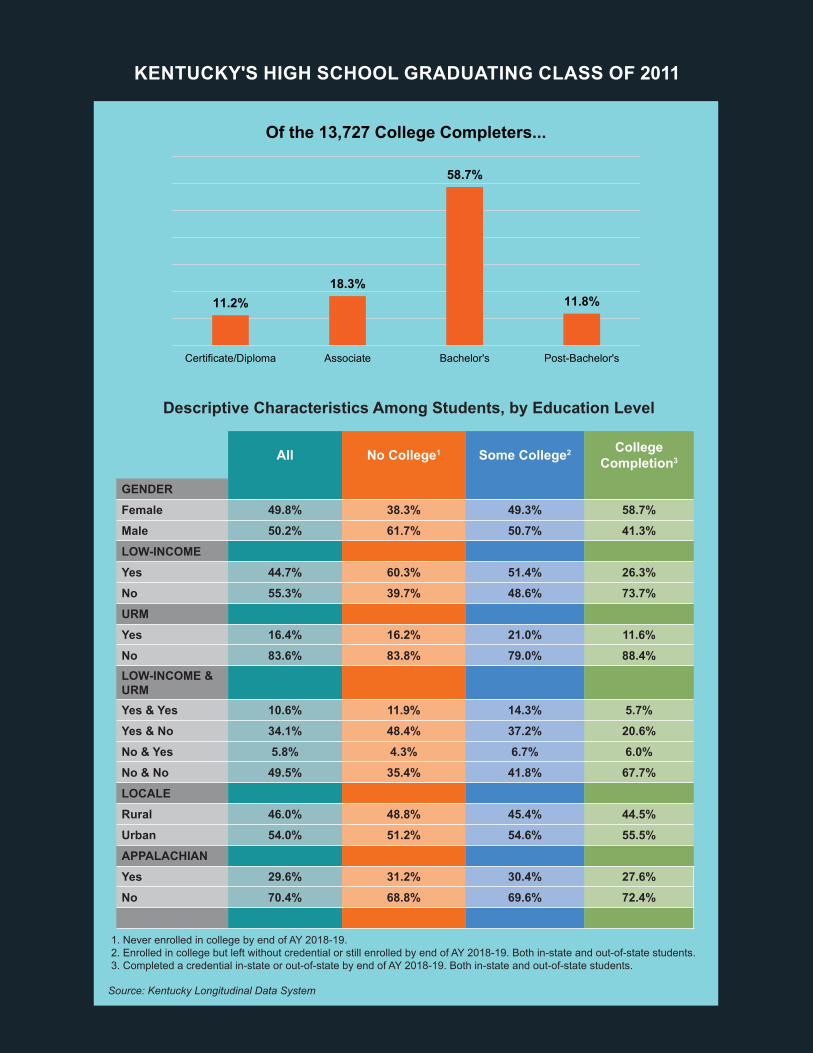
All No College1 Some College2 College Completion3
GENDERFemale 49.8% 38.3% 49.3% 58.7%Male 50.2% 61.7% 50.7% 41.3%LOW-INCOMEYes 44.7% 60.3% 51.4% 26.3%No 55.3% 39.7% 48.6% 73.7%URMYes 16.4% 16.2% 21.0% 11.6%No 83.6% 83.8% 79.0% 88.4%LOW-INCOME & URMYes & Yes 10.6% 11.9% 14.3% 5.7%Yes & No 34.1% 48.4% 37.2% 20.6%No & Yes 5.8% 4.3% 6.7% 6.0%No & No 49.5% 35.4% 41.8% 67.7%LOCALERural 46.0% 48.8% 45.4% 44.5%Urban 54.0% 51.2% 54.6% 55.5%APPALACHIANYes 29.6% 31.2% 30.4% 27.6%No 70.4% 68.8% 69.6% 72.4%
Descriptive Characteristics Among Students, by Education Level
1. Never enrolled in college by end of AY 2018-19.2. Enrolled in college but left without credential or still enrolled by end of AY 2018-19. Both in-state and out-of-state students.3. Completed a credential in-state or out-of-state by end of AY 2018-19. Both in-state and out-of-state students.
Source: Kentucky Longitudinal Data System
11.2%18.3%
58.7%
11.8%
Certificate/Diploma Associate Bachelor's Post-Bachelor's
Of the 13,727 College Completers...

KY Council on Postsecondary Education 9
COST OF COLLEGE
Credential Level Years to Degree
Median Cost of Attendance
Median Grants & Scholarships
Median Net Cost
Median % Funded by Aid
Certificate/Diploma 3 $28,200 $6,564 $21,063 28%
Associate 3 $40,077 $11,407 $25,778 30%
Bachelor's 4 $90,641 $30,871 $59,800 34%
Bachelor’s 5 $110,000 $24,385 $85,218 21%
Bachelor’s 6 $130,000 $23,471 $100,000 19%
TOTAL (2011-2019)
Direct costs of college, including published tuition, mandatory fees and textbook costs, as well as indirect costs (e.g., housing, food, transportation). Also known as sticker price.
Includes federal, state and campus-funded scholarships and grants. Scholarships are generally awarded for academic merit, while grants are based on financial need. Unlike loans, scholarships and grants don't need to be paid back.
What students actually pay for college. Also known as out-of-pocket cost.
COST OF ATTENDANCE GRANTS & SCHOLARSHIPS NET COST
Source: Kentucky Longitudinal Data System, amounts in 2019 inflation-adjusted dollars.
The typical out-of-pocket cost of a public postsecondary credential was significantly lower than the published cost of attendance (including both direct and indirect costs). Financial aid covered from 19% to 34% of the total cost of attendance, depending on the credential earned.
Total cost of attendance is the estimated cost of attending a particular college or university, also called the sticker price. It includes both direct costs, like published tuition, mandatory fees and cost of books, as well as indirect costs, like housing, food and transportation. The amounts in Figure 1 represent the median cost of credentials earned from Kentucky public postsecondary institutions for students in the high school class of 2011.
Net cost, or out-of-pocket cost, is the amount that students actually pay for college, once federal, state and campus-funded scholarships and grants are taken into account. Since grants and scholarships do not need to be paid back, net cost includes amounts paid up-front and/or borrowed by the student.
Figure 1 illustrates the importance of time-to-degree in determining a student’s total cost. A typical student who finished a bachelor’s degree in four years paid just under $60,000 for the degree, significantly less than the total cost of attendance due to the $30,871 of financial aid awarded. As time to complete increased, the amount of aid did not, which reduced its buying power. Adding one additional year to a bachelor’s degree raised the median net cost to $85,218; completing in six years raised it to $100,000, an increase of about 67%.
Figure 1. Median Cost of Attendance, Grants/Scholarships & Net Cost
KY Council on Postsecondary Education10
Credential Level
Years to
Degree
Median Cost of Attendance
Median Grants & Scholarships Median Net Cost Median %
Funded by Aid
Low-Income
Not Low-Income
Low-Income
Non Low-
Income
Low-Income
Non Low-
Income
Low-Income
Non Low-
IncomeCertificate/ Diploma 3 $28,030 $28,200 $9,895 $2,005 $15,919 $26,890 41% 8%
Associate 3 $40,077 $40,077 $23,213 $5,914 $17,358 $30,646 58% 16%
Bachelor's 4 $85,730 $91,374 $47,251 $26,496 $36,728 $64,190 54% 29%
Bachelor’s 5 $110,000 $110,000 $43,863 $17,076 $60,964 $91,095 41% 15%
Bachelor’s 6 $130,000 $130,000 $44,214 $14,740 $79,531 $110,000 36% 11%
TOTAL (2011-2019)
Direct costs of college, including published tuition, mandatory fees and textbook costs, as well as indirect costs (e.g., housing, food, transportation). Also known as sticker price.
Includes federal, state and campus-funded scholarships and grants. Scholarships are generally awarded for academic merit, while grants are based on financial need. Unlike loans, scholarships and grants don't need to be paid back.
What students actually pay for college. Also known as out-of-pocket cost.
COST OF ATTENDANCE GRANTS & SCHOLARSHIPS NET COST
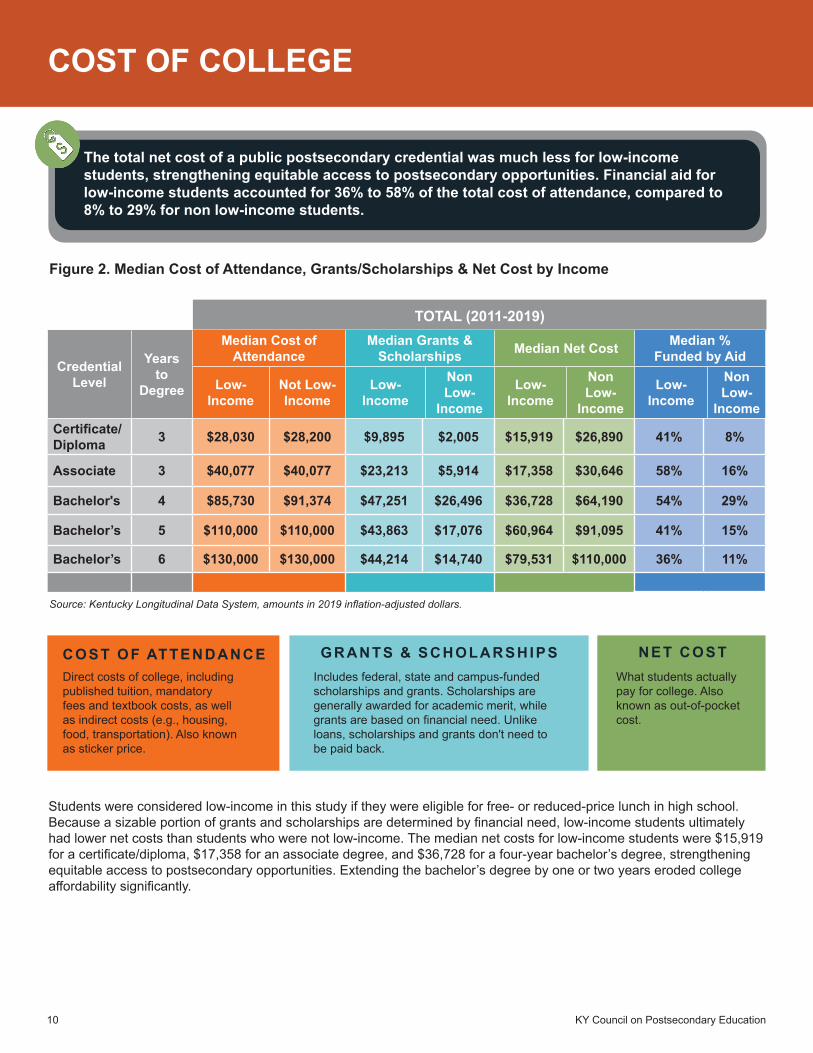
The total net cost of a public postsecondary credential was much less for low-income students, strengthening equitable access to postsecondary opportunities. Financial aid for low-income students accounted for 36% to 58% of the total cost of attendance, compared to 8% to 29% for non low-income students.
Figure 2. Median Cost of Attendance, Grants/Scholarships & Net Cost by Income
Students were considered low-income in this study if they were eligible for free- or reduced-price lunch in high school. Because a sizable portion of grants and scholarships are determined by financial need, low-income students ultimately had lower net costs than students who were not low-income. The median net costs for low-income students were $15,919 for a certificate/diploma, $17,358 for an associate degree, and $36,728 for a four-year bachelor’s degree, strengthening equitable access to postsecondary opportunities. Extending the bachelor’s degree by one or two years eroded college affordability significantly.
COST OF COLLEGE
Source: Kentucky Longitudinal Data System, amounts in 2019 inflation-adjusted dollars.
KY Council on Postsecondary Education 11
Discipline Median Cost of Attendance
Median Grants & Scholarships
Median Net Cost
Median % Funded by Aid
Business $24,911 $9,938 $10,911 27%Health $28,200 $6,215 $20,446 25%Trades $28,819 $7,030 $21,114 32%
Certificate/Diploma
Arts/Humanities $39,429 $11,563 $25,746 31%Business $40,931 $14,562 $28,370 36%Health $40,192 $22,126 $19,199 51%Trades $37,073 $4,622 $26,493 13%
Associate
Arts/Humanities $91,417 $36,508 $54,449 43%Business $93,063 $27,079 $64,629 30%Education $90,767 $26,037 $62,534 29%Health $84,952 $29,805 $57,019 35%Social Sciences $89,753 $34,426 $58,884 38%STEM $90,767 $33,687 $57,230 37%Trades $83,505 $29,734 $55,114 34%
Four-Year Bachelor’s
Arts/Humanities $110,000 $25,065 $83,070 23%Business $110,000 $18,714 $88,190 18%Education $110,000 $20,598 $83,720 20%Health $110,000 $29,178 $77,021 27%Social Sciences $110,000 $29,169 $81,359 26%STEM $120,000 $25,236 $89,964 22%Trades $43,083 $18,475 $84,804 17%
Five-Year Bachelor’s
Business $130,000 $22,630 $100,000 17%Health $130,000 $20,038 $110,000 15%Social Sciences $130,000 $26,580 $110,000 20%STEM $140,000 $20,427 $110,000 15%Trades $120,000 $28,875 $94,117 24%
Six-Year Bachelor’s
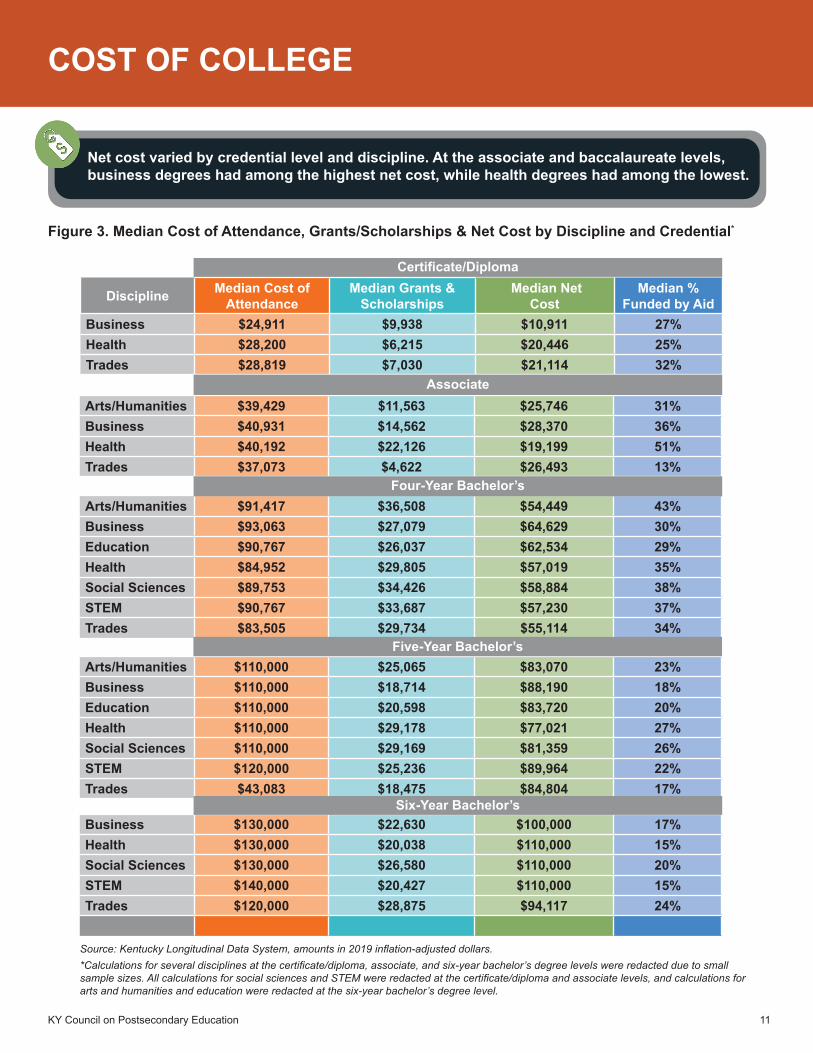
Net cost varied by credential level and discipline. At the associate and baccalaureate levels, business degrees had among the highest net cost, while health degrees had among the lowest.
Figure 3. Median Cost of Attendance, Grants/Scholarships & Net Cost by Discipline and Credential*
*Calculations for several disciplines at the certificate/diploma, associate, and six-year bachelor’s degree levels were redacted due to small sample sizes. All calculations for social sciences and STEM were redacted at the certificate/diploma and associate levels, and calculations for arts and humanities and education were redacted at the six-year bachelor’s degree level.
COST OF COLLEGE
Source: Kentucky Longitudinal Data System, amounts in 2019 inflation-adjusted dollars.
KY Council on Postsecondary Education12
Non-Borrowers Borrowers
EDUCATION LEVELCertificate/Diploma 50.7% 49.3%Associate 42.6% 57.4%Bachelor’s 40.4% 59.6%Post-Bachelor’s 53.6% 46.4%
52.9%47.1%
Borrowers Non-Borrowers
48.8%51.2%
Male Female
13.1%
86.9%
URM Not URM
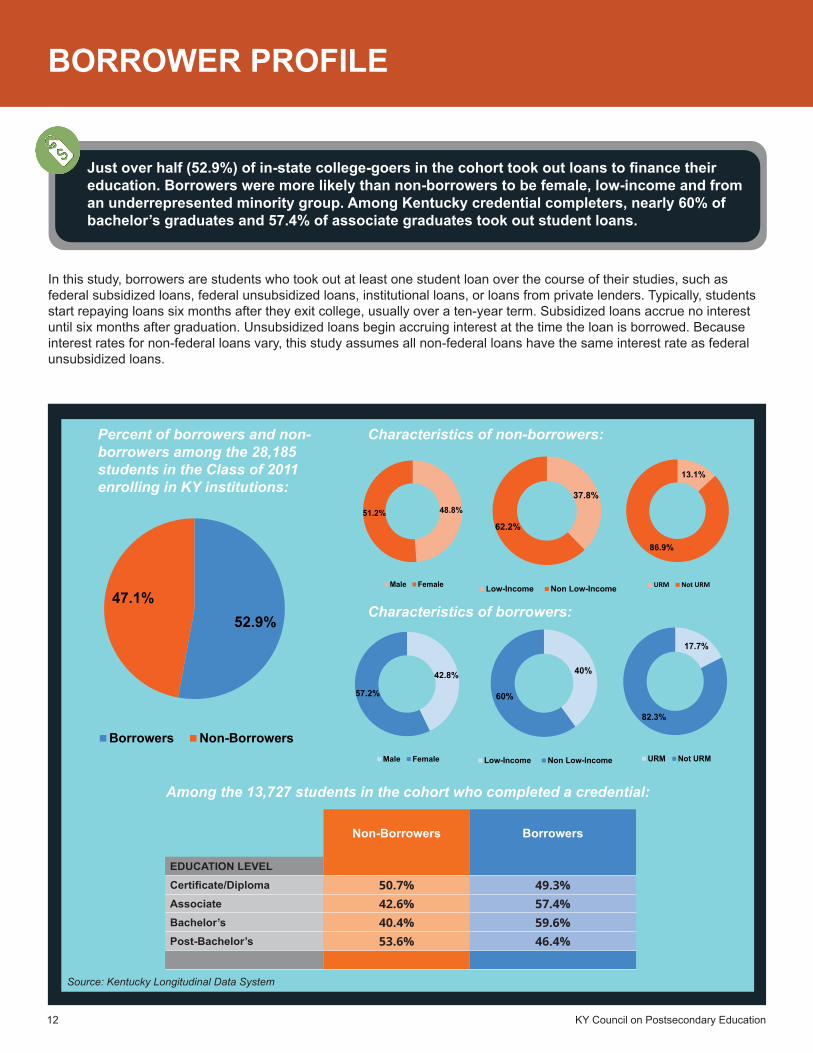
Percent of borrowers and non-borrowers among the 28,185 students in the Class of 2011 enrolling in KY institutions:
Characteristics of non-borrowers:
Characteristics of borrowers:
Among the 13,727 students in the cohort who completed a credential:
Just over half (52.9%) of in-state college-goers in the cohort took out loans to finance their education. Borrowers were more likely than non-borrowers to be female, low-income and from an underrepresented minority group. Among Kentucky credential completers, nearly 60% of bachelor’s graduates and 57.4% of associate graduates took out student loans.
In this study, borrowers are students who took out at least one student loan over the course of their studies, such as federal subsidized loans, federal unsubsidized loans, institutional loans, or loans from private lenders. Typically, students start repaying loans six months after they exit college, usually over a ten-year term. Subsidized loans accrue no interest until six months after graduation. Unsubsidized loans begin accruing interest at the time the loan is borrowed. Because interest rates for non-federal loans vary, this study assumes all non-federal loans have the same interest rate as federal unsubsidized loans.
BORROWER PROFILE
37.8%
62.2%
Low-Income Non Low-Income
42.8%
57.2%
Male Female
40%
60%
Low-Income Non Low-Income
17.7%
82.3%
URM Not URM
Source: Kentucky Longitudinal Data System

KY Council on Postsecondary Education 13
Median Loan Amount (All Borrowers)
Median Loan Amount (Low-Income Borrowers)
Median Loan Amount (Non Low-Income
Borrowers)
EDUCATION LEVEL
Certificate/Diploma $8,595 $8,595 $7,634
3-Year Associate $8,309 $4,358 $9,575
4-Year Bachelor’s $25,421 $25,345 $25,492
5-Year Bachelor’s $32,058 $30,850 $32,896
6-Year Bachelor’s $33,688 $31,604 $34,189
TOTAL (2011-2019)
A typical student borrowed from $8,309 (for an associate degree) to $33,688 (for a six-year bachelor’s degree) for their credential. Median loan amounts were similar for low-income and non low-income students, except at the associate level.
Figure 4 provides median loan balances by credential level. This amount includes an estimate of loan interest accrued (see Technical Notes, page 27).
At the baccalaureate level, students had comparable levels of debt, regardless of income. However, low-income associate degree earners had a median loan amount of $4,358, about half as much as non low-income associate degree earners. Non low-income certificate/diploma holders had a lower median loan amount than low-income certificate/diploma holders ($7,634 versus $8,595).
Although not reflected in this table, half of students in the cohort who left college without a credential had student loan balances at the time of exit. These are the students most at risk of loan default, since they are less likely to earn a salary enabling them to comfortably manage monthly payments.
Figure 4. Median Loan Amount by Income and Credential Level
STUDENT LOAN DEBT
Source: Kentucky Longitudinal Data System, amounts in 2019 inflation-adjusted dollars.

KY Council on Postsecondary Education14
A typical four-year bachelor’s degree recipient borrowed from $24,327 to $27,657 in student loans, regardless of academic discipline. Among these borrowers, health majors had higher loan balances but also had higher entry-level salaries. Taking one or two additional years to complete a bachelor’s degree raised loan balances substantially.
Figure 5. Median Loan Amount by Discipline and Credential Level*
The typical amounts of accumulated loan debt across all disciplines for four-year bachelor’s degree recipients were similar, ranging from $24,327 to $27,657. Among four-year bachelor’s degree recipients, health majors borrowed the most ($27,657). However, health care jobs at the baccalaureate level offered among the highest entry-level earnings, as seen on page 20. There were greater variations in loan amounts across all disciplines at the five-year bachelor’s degree level. Taking one or two additional years to complete a bachelor’s degree raised loan balances substantially.
*Calculations for business, health, social sciences, and STEM at the certificate/diploma level, associate degree level, and 6-year bachelor’s degree level were redacted due to small sample sizes
STUDENT LOAN DEBT
$8,842
$4,647
$8,914
$26,776
$24,327
$24,605
$27,657
$25,307
$24,458
$25,022
$32,214
$31,264
$33,937
$30,962
$35,812
$29,432
$28,981
$32,508
$38,895
$50,308
Arts/Hum.
Business
Education
Health
Soc. Sci.
STEM
Trades
6-Yr. Bachelor's 5-Yr. Bachelor's 4-Yr. Bachelor's Associate Certificate/Diploma
Source: Kentucky Longitudinal Data System, amounts in 2019 inflation-adjusted dollars.
KY Council on Postsecondary Education 15
Figure 6. Maximum Monthly Student Loan Payment by Credential Level
STUDENT LOAN DEBT
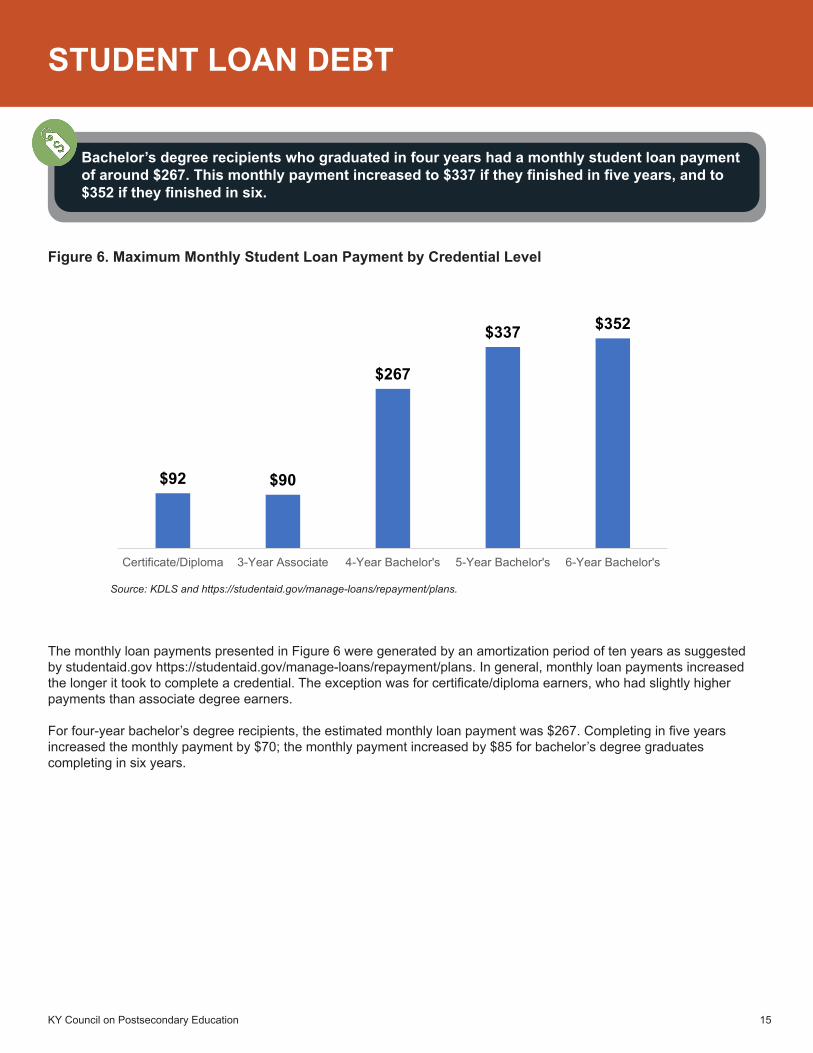
Bachelor’s degree recipients who graduated in four years had a monthly student loan payment of around $267. This monthly payment increased to $337 if they finished in five years, and to $352 if they finished in six.
$92 $90
$267
$337 $352
Certificate/Diploma 3-Year Associate 4-Year Bachelor's 5-Year Bachelor's 6-Year Bachelor's
Source: KDLS and https://studentaid.gov/manage-loans/repayment/plans.
The monthly loan payments presented in Figure 6 were generated by an amortization period of ten years as suggested by studentaid.gov https://studentaid.gov/manage-loans/repayment/plans. In general, monthly loan payments increased the longer it took to complete a credential. The exception was for certificate/diploma earners, who had slightly higher payments than associate degree earners.
For four-year bachelor’s degree recipients, the estimated monthly loan payment was $267. Completing in five years increased the monthly payment by $70; the monthly payment increased by $85 for bachelor’s degree graduates completing in six years.
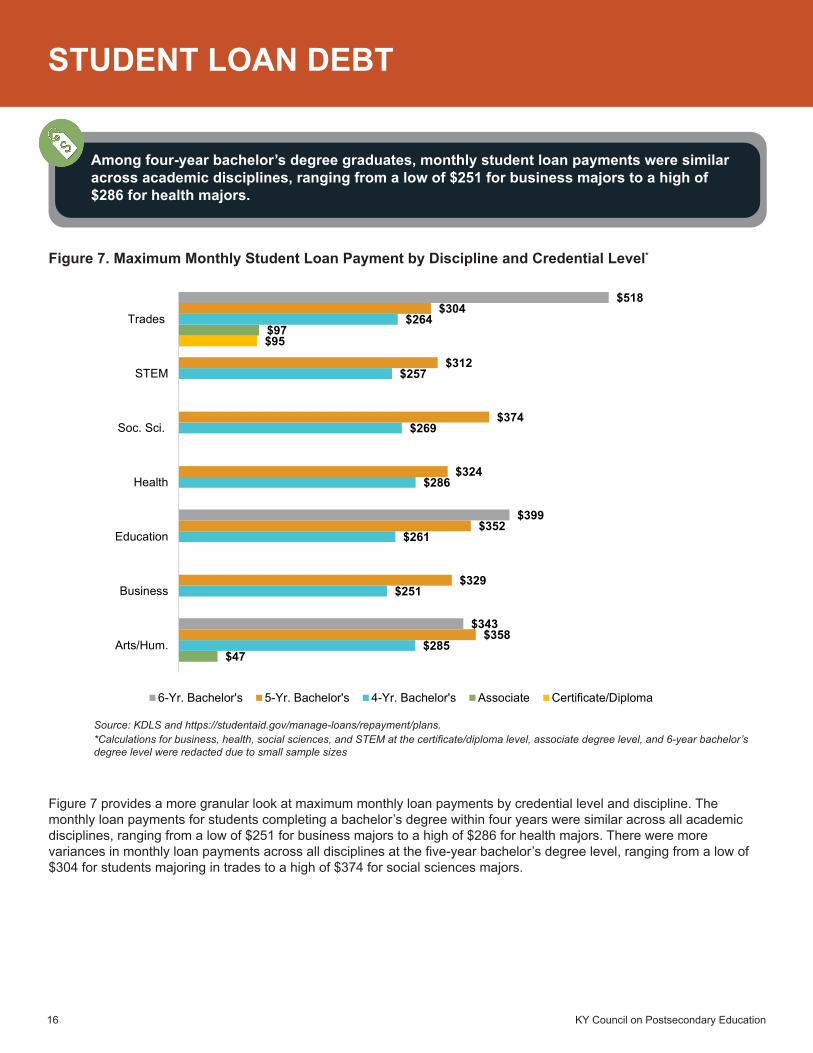
KY Council on Postsecondary Education16
STUDENT LOAN DEBT
Figure 7 provides a more granular look at maximum monthly loan payments by credential level and discipline. The monthly loan payments for students completing a bachelor’s degree within four years were similar across all academic disciplines, ranging from a low of $251 for business majors to a high of $286 for health majors. There were more variances in monthly loan payments across all disciplines at the five-year bachelor’s degree level, ranging from a low of $304 for students majoring in trades to a high of $374 for social sciences majors.
Figure 7. Maximum Monthly Student Loan Payment by Discipline and Credential Level*
Source: KDLS and https://studentaid.gov/manage-loans/repayment/plans.*Calculations for business, health, social sciences, and STEM at the certificate/diploma level, associate degree level, and 6-year bachelor’s degree level were redacted due to small sample sizes
Among four-year bachelor’s degree graduates, monthly student loan payments were similar across academic disciplines, ranging from a low of $251 for business majors to a high of $286 for health majors.
$95
$47
$97
$285
$251
$261
$286
$269
$257
$264
$358
$329
$352
$324
$374
$312
$304
$343
$399
$518
Arts/Hum.
Business
Education
Health
Soc. Sci.
STEM
Trades
6-Yr. Bachelor's 5-Yr. Bachelor's 4-Yr. Bachelor's Associate Certificate/Diploma
KY Council on Postsecondary Education 17
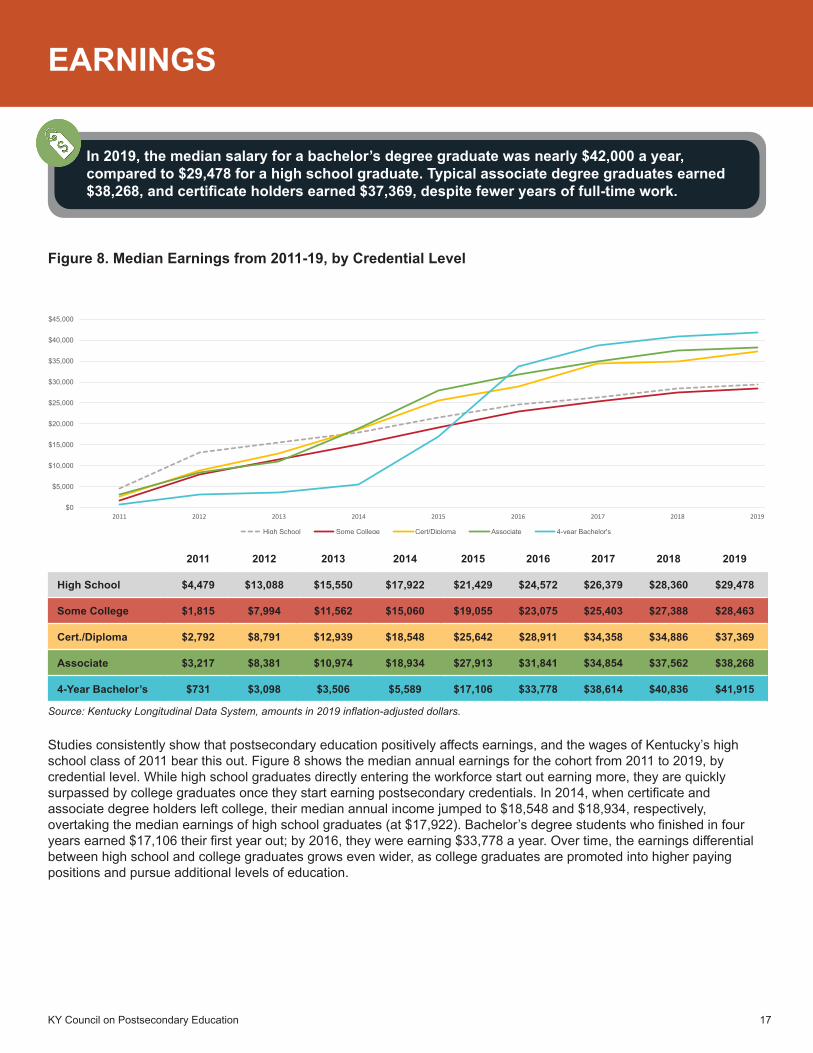
EARNINGS
In 2019, the median salary for a bachelor’s degree graduate was nearly $42,000 a year, compared to $29,478 for a high school graduate. Typical associate degree graduates earned $38,268, and certificate holders earned $37,369, despite fewer years of full-time work.
Figure 8. Median Earnings from 2011-19, by Credential Level
2011 2012 2013 2014 2015 2016 2017 2018 2019
High School $4,479 $13,088 $15,550 $17,922 $21,429 $24,572 $26,379 $28,360 $29,478
Some College $1,815 $7,994 $11,562 $15,060 $19,055 $23,075 $25,403 $27,388 $28,463
Cert./Diploma $2,792 $8,791 $12,939 $18,548 $25,642 $28,911 $34,358 $34,886 $37,369
Associate $3,217 $8,381 $10,974 $18,934 $27,913 $31,841 $34,854 $37,562 $38,268
4-Year Bachelor’s $731 $3,098 $3,506 $5,589 $17,106 $33,778 $38,614 $40,836 $41,915
$0
$5,000
$10,000
$15,000
$20,000
$25,000
$30,000
$35,000
$40,000
$45,000
2011 2012 2013 2014 2015 2016 2017 2018 2019
High School Some College Cert/Diploma Associate 4-year Bachelor's
Studies consistently show that postsecondary education positively affects earnings, and the wages of Kentucky’s high school class of 2011 bear this out. Figure 8 shows the median annual earnings for the cohort from 2011 to 2019, by credential level. While high school graduates directly entering the workforce start out earning more, they are quickly surpassed by college graduates once they start earning postsecondary credentials. In 2014, when certificate and associate degree holders left college, their median annual income jumped to $18,548 and $18,934, respectively, overtaking the median earnings of high school graduates (at $17,922). Bachelor’s degree students who finished in four years earned $17,106 their first year out; by 2016, they were earning $33,778 a year. Over time, the earnings differential between high school and college graduates grows even wider, as college graduates are promoted into higher paying positions and pursue additional levels of education.
Source: Kentucky Longitudinal Data System, amounts in 2019 inflation-adjusted dollars.
KY Council on Postsecondary Education18
EARNINGS
$0
$5,000
$10,000
$15,000
$20,000
$25,000
$30,000
$35,000
$40,000
$45,000
2011 2012 2013 2014 2015 2016 2017 2018 2019
High School 4-year Bachelor's 5-year Bachelor's 6-year Bachelor's
2011 2012 2013 2014 2015 2016 2017 2018 2019
High School $4,479 $13,088 $15,550 $17,922 $21,429 $24,572 $26,379 $28,360 $29,478
4-Year Bachelor’s $731 $3,098 $3,506 $5,589 $17,106 $33,778 $38,614 $40,836 $41,915
5-Year Bachelor’s $993 $3,200 $4,615 $5,573 $7,900 $21,979 $35,363 $39,219 $40,591
6-Year Bachelor’s $968 $3,665 $5,487 $6,338 $8,269 $10,577 $23,134 $33,045 $36,344
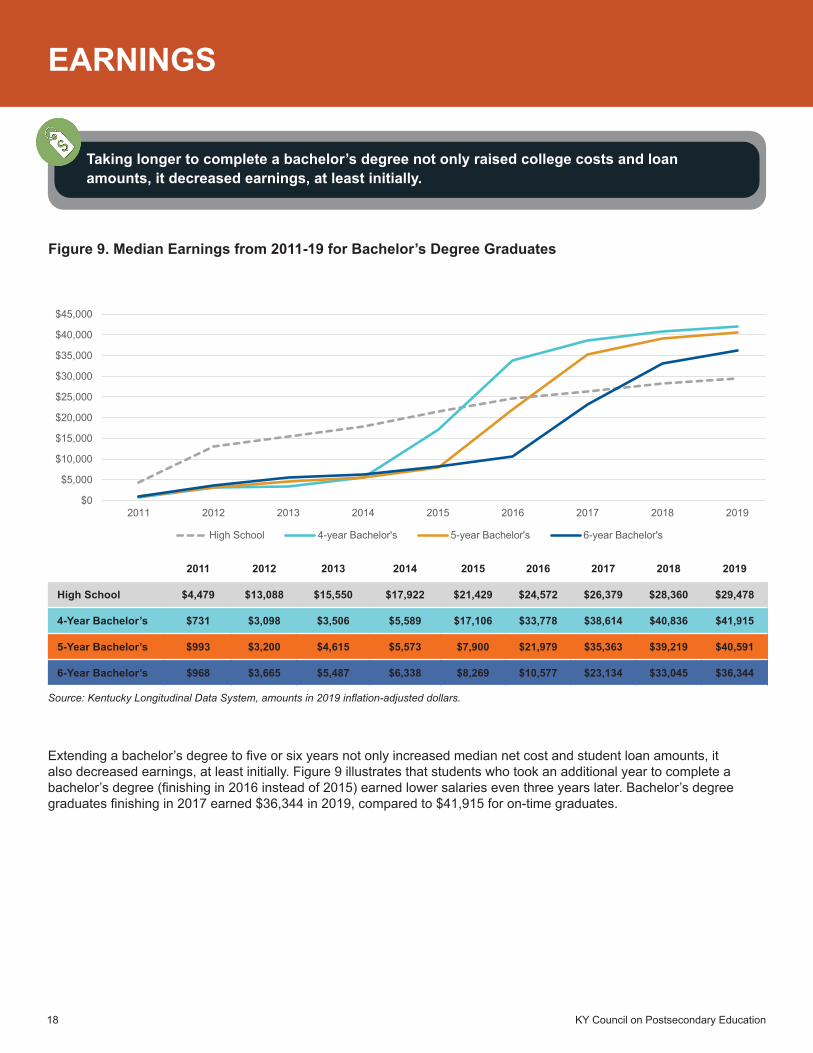
Taking longer to complete a bachelor’s degree not only raised college costs and loan amounts, it decreased earnings, at least initially.
Figure 9. Median Earnings from 2011-19 for Bachelor’s Degree Graduates
Extending a bachelor’s degree to five or six years not only increased median net cost and student loan amounts, it also decreased earnings, at least initially. Figure 9 illustrates that students who took an additional year to complete a bachelor’s degree (finishing in 2016 instead of 2015) earned lower salaries even three years later. Bachelor’s degree graduates finishing in 2017 earned $36,344 in 2019, compared to $41,915 for on-time graduates.
Source: Kentucky Longitudinal Data System, amounts in 2019 inflation-adjusted dollars.
KY Council on Postsecondary Education 19
EARNINGS
Entry-Level Median Earnings for the
Cohort
Entry-Level Median Earnings for Female
Students
Entry-Level Median Earnings for Male
Students
EDUCATION LEVEL
High School $12,036 $10,236 $13,305
Some College $13,299 $12,407 $14,533
Certificate/Diploma $17,690 $14,109 $20,189
3-Year Associate $22,631 $17,507 $25,096
4-Year Bachelor’s $27,926 $26,876 $30,346
5-Year Bachelor’s $27,983 $25,960 $30,185
6-Year Bachelor’s $25,982 $26,227 $25,757
TOTAL (2011-2019)
Figure 10. Median Entry-Level Earnings by Gender and Credential Level
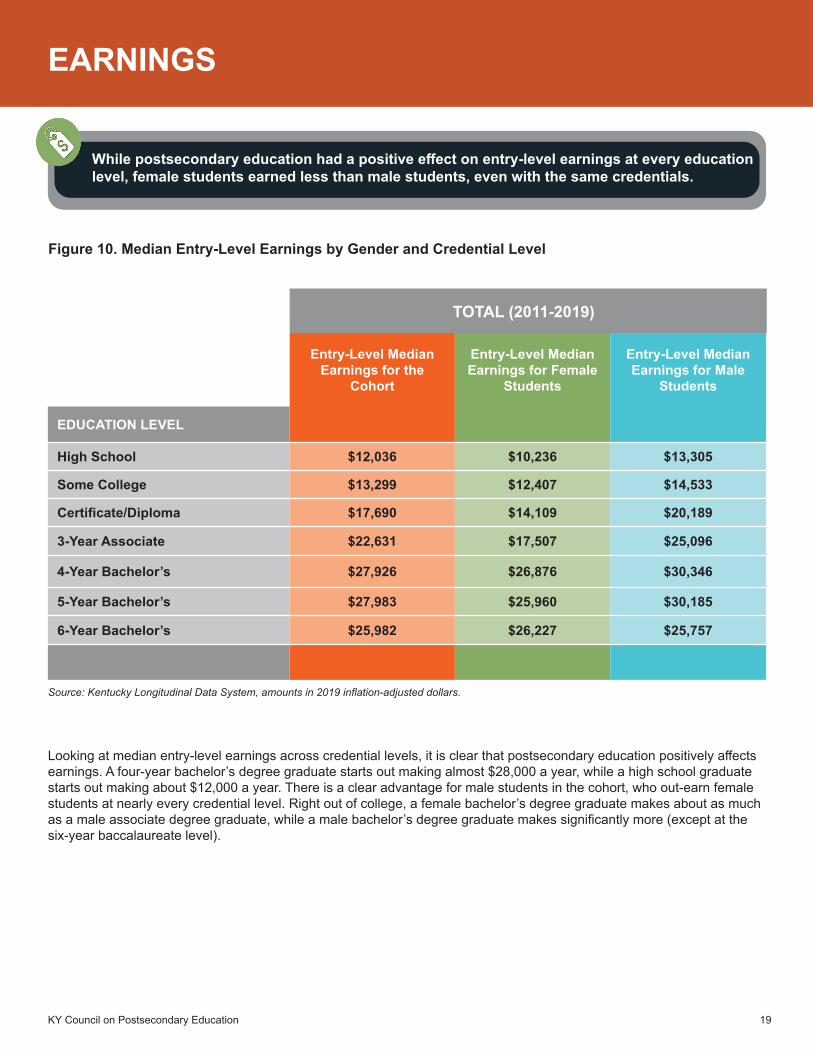
Looking at median entry-level earnings across credential levels, it is clear that postsecondary education positively affects earnings. A four-year bachelor’s degree graduate starts out making almost $28,000 a year, while a high school graduate starts out making about $12,000 a year. There is a clear advantage for male students in the cohort, who out-earn female students at nearly every credential level. Right out of college, a female bachelor’s degree graduate makes about as much as a male associate degree graduate, while a male bachelor’s degree graduate makes significantly more (except at the six-year baccalaureate level).
While postsecondary education had a positive effect on entry-level earnings at every education level, female students earned less than male students, even with the same credentials.
Source: Kentucky Longitudinal Data System, amounts in 2019 inflation-adjusted dollars.

KY Council on Postsecondary Education20
EARNINGS
Health and STEM majors typically had the highest entry-level earnings at the baccalaureate level, while arts/humanities majors typically had the lowest. However, studies show arts/humanities majors tend to narrow or close wage gaps over time.
Figure 11. Median Entry-Level Earnings by Discipline and Credential Level*
*Calculations for arts/humanities, business, education, health, social sciences, and STEM at the certificate/diploma level; business, education, health, social sciences and STEM at the associate degree level, and business, health, social sciences and STEM at the 6-year bachelor’s degree level were redacted due to small sample sizes.
Figure 11 presents median entry-level earnings in 2019 by academic discpline. Among four-year bachelor’s degree earners, health majors had the highest median earnings ($47,312) followed by STEM majors ($37,265). Arts and humanities majors had the lowest salaries initially ($17,141), but research by the American Academy of Arts and Sciences, the Association of American Colleges and Universities, and the Gallup-Purdue Index shows that humanities majors catch up over time, and more effectively close the pay gap between younger and older workers.
$19,855
$17,569
$30,354
$17,141
$28,488
$29,702
$47,312
$25,197
$37,265
$26,139
$17,833
$27,388
$24,146
$47,035
$23,168
$38,976
$29,113
$19,800
$28,948
$25,569
Arts/Hum.
Business
Education
Health
Soc. Sci.
STEM
Trades
6-Yr. Bachelor's 5-Yr. Bachelor's 4-Yr. Bachelor's Associate Certificate/Diploma
Source: Kentucky Longitudinal Data System, amounts in 2019 inflation-adjusted dollars.

KY Council on Postsecondary Education 21
DEBT-TO-INCOME RATIO
A debt-to-income ratio of less than one indicates that student loan debt is affordable. According to this methodology, students in the cohort who graduated on time had reasonable levels of student debt, while bachelor’s degree students taking five or six years to complete were at greater risk of loan default early in their careers.
Figure 12. Median Debt-to-Income Ratio by Credential Level
0.430.33
0.90
1.151.28
Cert/Diploma 3-Year Associate 4-Year Bachelor's 5-Year Bachelor's 6-Year Bachelor's
Higher education policy experts have long debated what constitutes a reasonable and affordable level of student loan debt. Debt-to-income ratio, which is total loan debt divided by the borrower’s entry-level salary, is a simple but effective way to assess a borrower’s abilty to repay student loans. If the debt-to-income ratio is less than one, borrowers should be able to repay their student loan in ten years or less. Ideally, debt-to-income ratios decrease over time, as individuals earn higher salaries and loan balances diminish, which makes loans more affordable.
Figure 12 presents the median debt-to-income ratio by credential level. Certificate/diploma, associate and four-year bachelor’s degree completers had debt-to-income ratios of less than one, which indicates a manageable level of student loan debt. On the other hand, the debt-to-income ratio for bachelor’s degree graduates completing in five or six years exceeded one, placing them at greater risk of loan default early in their careers.
Total Loan DebtAffordable: Annual Entry-Level Earnings
< 1
Source: Kentucky Longitudinal Data System, amounts in 2019 inflation-adjusted dollars.

KY Council on Postsecondary Education22
DEBT-TO-INCOME RATIO
Figure 13. Median Debt-to-Income Ratio by Income Status
0.45
0.16
0.76
0.99
1.47
0.43
0.51
0.91
1.23
1.24
Certificate/Diploma
3-Year Associate
4-Year Bachelor's
5-Year Bachelor's
6-Year Bachelor's
Low-Income Non-Low-Income
Low-income borrowers had lower debt-to-income ratios than non low-income borrowers, except at the certificate/diploma and six-year baccalaureate level.
Figure 13 presents the median debt-to-income ratio by credential level for low-income and non low-income undergraduate students. Interestingly, at the four-year bachelor’s degree level, low-income and non low-income students had comparable levels of student debt (around $25,000), but substantially different debt-to-income ratios (0.76 for low-income students compared to 0.91 for non low-income students). According to this methodology, debt levels are less manageable for five- and six-year bachelor’s degree earners, regardless of income status.
Total Loan DebtAffordable: Annual Entry-Level Earnings
< 1
Source: Kentucky Longitudinal Data System, amounts in 2019 inflation-adjusted dollars.
KY Council on Postsecondary Education 23
DEBT-TO-INCOME RATIO
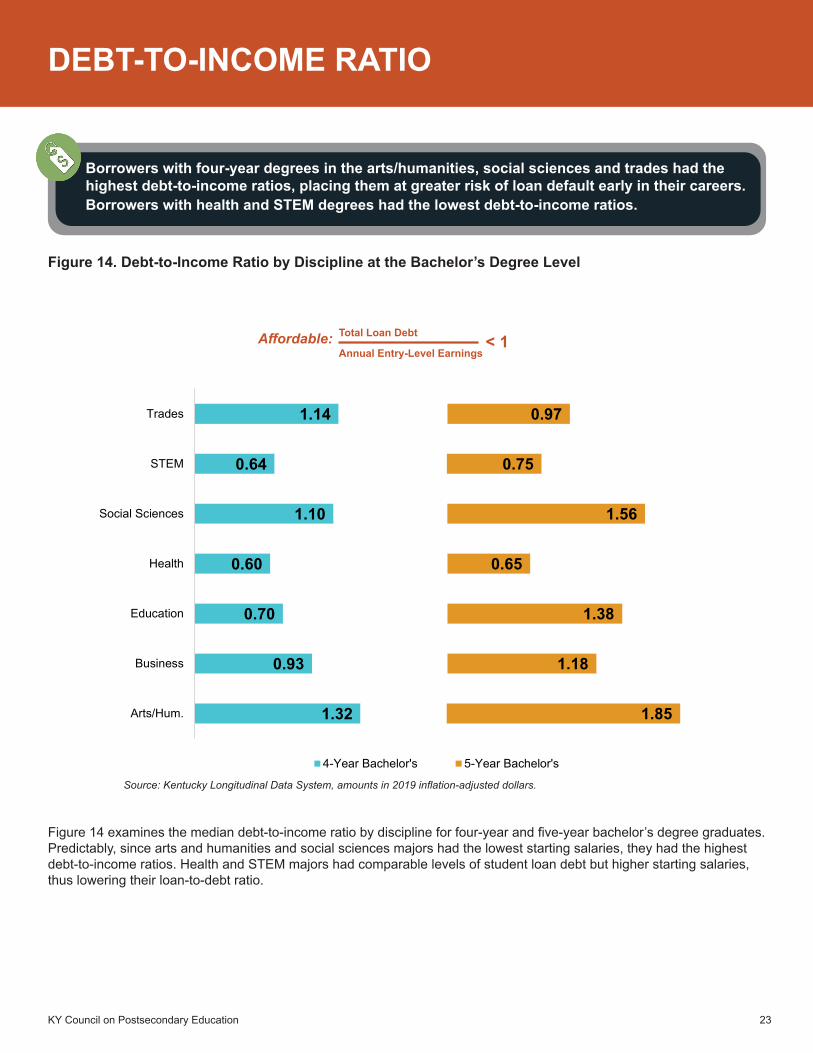
Figure 14. Debt-to-Income Ratio by Discipline at the Bachelor’s Degree Level
Borrowers with four-year degrees in the arts/humanities, social sciences and trades had the highest debt-to-income ratios, placing them at greater risk of loan default early in their careers. Borrowers with health and STEM degrees had the lowest debt-to-income ratios.
1.32
0.93
0.70
0.60
1.10
0.64
1.14
1.85
1.18
1.38
0.65
1.56
0.75
0.97
Arts/Hum.
Business
Education
Health
Social Sciences
STEM
Trades
4-Year Bachelor's 5-Year Bachelor's
Figure 14 examines the median debt-to-income ratio by discipline for four-year and five-year bachelor’s degree graduates. Predictably, since arts and humanities and social sciences majors had the lowest starting salaries, they had the highest debt-to-income ratios. Health and STEM majors had comparable levels of student loan debt but higher starting salaries, thus lowering their loan-to-debt ratio.
Total Loan DebtAffordable: Annual Entry-Level Earnings
< 1
Source: Kentucky Longitudinal Data System, amounts in 2019 inflation-adjusted dollars.
KY Council on Postsecondary Education24
ECONOMIC MOBILITY
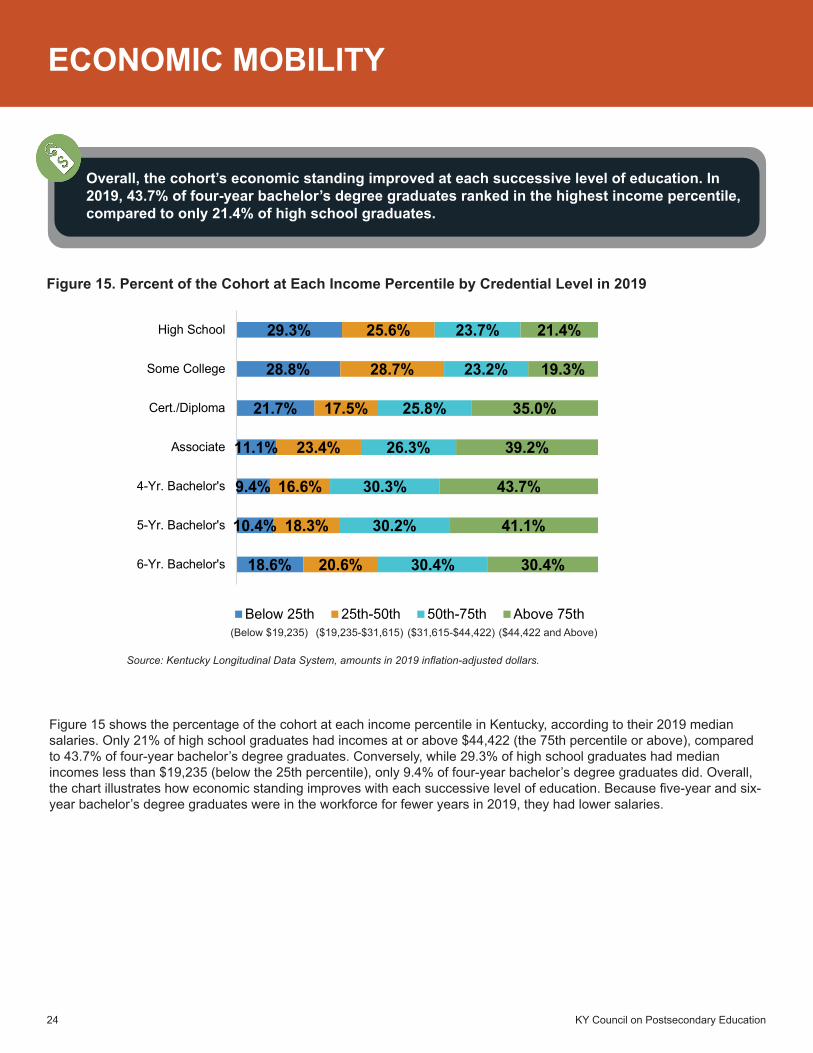
Figure 15. Percent of the Cohort at Each Income Percentile by Credential Level in 2019
Overall, the cohort’s economic standing improved at each successive level of education. In 2019, 43.7% of four-year bachelor’s degree graduates ranked in the highest income percentile, compared to only 21.4% of high school graduates.
(Below $19,235) ($19,235-$31,615) ($31,615-$44,422) ($44,422 and Above)
Figure 15 shows the percentage of the cohort at each income percentile in Kentucky, according to their 2019 median salaries. Only 21% of high school graduates had incomes at or above $44,422 (the 75th percentile or above), compared to 43.7% of four-year bachelor’s degree graduates. Conversely, while 29.3% of high school graduates had median incomes less than $19,235 (below the 25th percentile), only 9.4% of four-year bachelor’s degree graduates did. Overall, the chart illustrates how economic standing improves with each successive level of education. Because five-year and six-year bachelor’s degree graduates were in the workforce for fewer years in 2019, they had lower salaries.
18.6%
10.4%
9.4%
11.1%
21.7%
28.8%
29.3%
20.6%
18.3%
16.6%
23.4%
17.5%
28.7%
25.6%
30.4%
30.2%
30.3%
26.3%
25.8%
23.2%
23.7%
30.4%
41.1%
43.7%
39.2%
35.0%
19.3%
21.4%
6-Yr. Bachelor's
5-Yr. Bachelor's
4-Yr. Bachelor's
Associate
Cert./Diploma
Some College
High School
Below 25th 25th-50th 50th-75th Above 75th
Source: Kentucky Longitudinal Data System, amounts in 2019 inflation-adjusted dollars.

KY Council on Postsecondary Education 25
The majority of college graduates in the cohort were in the 50th income percentile or above by 2019. Students from higher income families fared better economically, even at the same education level.
Figure 16. Percent of Cohort Above the 50th Income Percentile in 2019, by Income and Credential Level
ECONOMIC MOBILITY
Students in the cohort were categorized as low-income based on eligibility for federal free- or reduced-price lunch in high school, a function of their parents’ or guardians’ income level. In 2019, these same low-income students were independent adults earning a living for themselves and/or their families. Figure 16 shows what percentage of credential earners in the cohort made median annual salaries of $31,615 or above (placing them in the 50th percentile of Kentucky salaries), based on 2019 earnings. Over half of low-income students with a certificate/diploma (53.5%) were at the 50th income percentile or above in 2019. This percentage rose to 55% for associate earners, 68.4% for four-year bachelor’s degree earners, and 72.2% for five-year bachelor’s degree earners. However, family economic background as well as education level played a role in future earnings. Students in the cohort who were not low-income were much more likely than low-income students to achieve the 50th income percentile at the same education level.
Source: Kentucky Longitudinal Data System, amounts in 2019 inflation-adjusted dollars.
50.0%
72.2%
68.4%
55.0%
53.5%
36.0%
41.6%
64.2%
71.1%
75.2%
71.1%
68.6%
48.5%
49.7%
6-Year Bachelor's
5-Year Bachelor's
4-Year Bachelor's
Associate
Cert/Diploma
Some College
High School
Low-Income Non Low-Income
KY Council on Postsecondary Education26
TECHNICAL NOTES
The research report was produced by the Council on Postsecondary Education (CPE) and the Kentucky Center for Statistics (KYSTATS) using data from the Kentucky Longitudinal Data System (KLDS). Data sources used in this report include: the Council on Postsecondary Education (CPE), the Kentucky Department of Education (KDE), the Kentucky Longitudinal Data System (KLDS), the Department of Workforce Investment (DWI), Unemployment Insurance (UI), and the National Student Clearinghouse (NSC).
Cohort Profile, College-Going Rates & College Completion Rates
Dataset: The dataset used for the cohort profile includes all students who graduated from a Kentucky high school in 2011.
Low-income: This study characterizes students as low-income or non low-income, based on whether they were eligible for free- or reduced-price lunch in high school.
Underrepresented Minority (URM): This study defines URM as: (a) Hispanic or Latinx, (b) American Indian or Alaska Native, (c) Black or African American, (d) Native Hawaiian or Other Pacific Islander, or (e) Two or more Races.
Non-URM: This study defines non-URM as (a) White, non-Hispanic, (b) Asian, non-Hispanic, or (c) Unknown race, non-Hispanic, or (d) Other race, non-Hispanic.
College completion: Students who completed a postsecondary credential in-state or out-of-state.
Credential Level: The highest level of education completed by the end of the 2018-19 academic year, which includes
No college - High school graduates who did not enroll in college.
Some college - Students who enrolled in college but left without a credential or were still enrolled.
Certificate/diploma - Students who completed a postsecondary certificate or diploma from a Kentucky public or non-profit private college or university.
Associate degree - Students who completed an associate degree from a Kentucky public or non-profit private college or university.
Bachelor’s degree - Students who completed a bachelor’s degree from a Kentucky public or non-profit private college or university.
Post-bachelor’s degree - Students who completed a post-baccalaureate degree or certificate from a Kentucky
Cost of Attendance, Grants & Scholarships & Net Cost
Dataset: The dataset used in this section of the study includes students from the cohort who enrolled in a Kentucky public postsecondary institution and earned a credential within 1.5 times of the expected time with no private or NSC enrollment by 2019 and no postsecondary enrollment after highest degree completion. Highest credentials at the post-baccalaureate level were also excluded.
Cost of attendance: The total cost of attendance (direct and indirect costs) for each student as reported by each institution’s financial aid office for the duration of the student’s enrollment.
Grants and scholarships: The total amount of grants and scholarships received by each student as reported by each institution’s financial aid office for the duration of the student’s enrollment.
Net cost: Net cost was calculated for each student using the total cost of attendance minus the total amount of grants and scholarships.
KY Council on Postsecondary Education 27
Credential Level: The highest level of education completed by the end of the 2018-19 academic year, which includes
Some College - Students in the cohort who enrolled in a Kentucky public postsecondary institution in the 2011-12 academic year and never earned a postsecondary certificate or diploma during or prior to the 2016-2017 academic year with no postsecondary enrollment in the subsequent years.
Certificate/diploma - Students in the cohort who enrolled in a Kentucky public postsecondary institution in the 2011-12 academic year and earned a postsecondary certificate or diploma during or prior to spring 2014.
Associate degree - Students in the cohort who enrolled in a Kentucky public postsecondary institution in the 2011-12 academic year and earned an associate degree during or prior to spring 2014.
Four-year bachelor’s degree - Students in the cohort who enrolled in a Kentucky public postsecondary institution in 2011-12 and earned a bachelor’s degree during or prior to spring 2015.
Five-year bachelor’s degree - Students in the cohort who enrolled in a Kentucky public postsecondary institution in 2011-12 and earned a bachelor’s degree during the 2015-16 academic year.
Six-year bachelor’s degree: Students in the cohort who enrolled in a Kentucky public postsecondary institution in 2011-12 and earned a bachelor’s degree during the 2016-17 academic year.
Disciplines: The study categorized students into seven disciplines based on their two-digit CIP codes, including arts and humanities, business, education, health, social sciences, STEM, and trades.
Other notes:
-Missing values for cost of attendance for each student were imputed using the average cost of attendance within the same each institution and academic year.
-Cost of attendance, grants and scholarships, and net cost were all adjusted for inflation using 2019 dollars.
Loan Borrower’s Profile, Total Loan, and Monthly Loan Payment
Dataset: The students in this dataset had the same restrictions as those in the Cost of Attendance, Grants & Scholarships & Net Cost section. Additionally, in each academic year, the student was either (a) enrolled in a KY public postsecondary institution, or (b) received non-zero wages covered by unemployment insurance. During the 2019 calendar year, these students must also have received non-zero wages covered by unemployment insurance.
Loan borrower: A student at a public institution who was disbursed at least one undergraduate loan from any source (i.e., federal subsidized and unsubsidized, institutional, private, commercial, or other).
Non-borrower: A student at a public institution who was not disbursed at least one undergraduate loan from any source (i.e., federal subsidized and unsubsidized, institutional, private, commercial, or other).
Total loan debt: Total loan debt included both subsidized and unsubsidized federal, institutional, and other loans. Subsidized loans accrue no interest until six months after the last enrollment in postsecondary education, and unsubsidized loans begin accruing interest at the time of the loan. The study assumed that non-federal loans had the same interest rates as federal unsubsidized loans. Total loan debt was the balance of all loans and interest accrued six months after postsecondary exit. Adjusted for inflation to 2019.
Monthly loan payment: Monthly loan repayments were calculated with an amortization period of ten years as suggested by studentaid.gov https://studentaid.gov/manage-loans/repayment/plans. The monthly loan payment for each person was the smaller of 10% of 2019 wages and the amortized amount to account for the Revised Pay as You Earn Repayment Plan.
TECHNICAL NOTES
KY Council on Postsecondary Education28
TECHNICAL NOTES
Debt-to-Income Analysis
Debt-to-income ratio: The debt-to-income ratio is the ratio of total loan debt to a borrower’s salary. The annual salary used in this study was entry-level earnings, which is the sum of earnings in the four quarters following postsecondary exit.
Economic Mobility
Students’ income status in this study was based on whether they were eligible for free- or reduced-price lunch in high school, a function of their parents’ or guardians’ income. Students who were eligible to receive free- or reduced-price lunch were considered low-income, and students who were not eligible to receive free- or reduced-price lunch were considered non low-income.
Students’ earnings refers to their 2019 annual earnings. Four percentiles were examined:
-Below 25th (less than $19,235) -Between 25th and 50th ($19,235 to $31,615) -Between 50th and 75th ($31,615 to $44,422) -Above 75th (greater than or equal to $44,422)
KY Council on Postsecondary Education 29
CPE gratefully acknowledges the Kentucky Center for Statistics for its contributions to this report. Special thanks go to Dr. Jessica Cunningham, Executive Director; Dr. Beth Kelly, Research Analyst;
and Barrett Ross, Lead Research Analyst.
Contributors from CPE’s staff include:
Dr. Grace Dai, Lead Author and ResearcherMelissa Young, Editor and Graphic DesignerTravis Muncie, Data and Analytics Support
KY Council on Postsecondary Education30
100 Airport RoadFrankfort, KY 40601Ph: (502) 573-1555
cpe.ky.gov
Printed with state funds. Some photography provided by Kentucky colleges and universities.
September 2021
The Council does not discriminate on the basis of race, color, national origin, sex, religion, age, or disability in employment or the provision of services, and provides, upon request, reasonable accommodation, including auxiliary aids and services
necessary to afford individuals with disabilities an equal opportunity to participate in all programs and activities.